
Submitted:
13 May 2025
Posted:
14 May 2025
You are already at the latest version
Abstract
Road networks play a crucial role in accessing, sourcing, and evacuating populations during extreme natural events. These issues are especially critical in rural settings, where redundancy of networks is uncommon and where the population may present significant social disparities.
Traditional risk management systems have studied the risk of the road network from a physical perspective, where the probability of damage is estimated in terms of its fragility (vulnerability) and exposure given certain hazard intensity measures. However, the specialized literature increasingly suggests the development of more comprehensive risk management systems, where not only physical aspects associated with infrastructure are considered but also the social and economic characteristics of the beneficiary population.
This study proposes a Vulnerability Access Index for road network decision-making that integrates social vulnerability of rural communities exposed to extreme natural events and their accessibility to nearby critical infrastructure.
The proposed methodology considers three stages: Stage 1, Social Vulnerability Index based on socioeconomic variables, to which a principal component analysis is applied to identify the most determining dimensions of social vulnerability; Stage 2, Importance Index to evaluate access to critical infrastructure, and; Stage 3, Vulnerability Access Index, which is obtained as a combination of the indices estimated in the previous stages.
A case study is presented in a highly exposed region to volcanic hazards in Chile. The proposed index identified links of the road network that require special attention as they provide access to highly vulnerable population and present critical access issues.
Keywords:
social vulnerability
; critical infrastructure
; road network
; accessibility
; natural hazard
1. Introduction
The road network plays a crucial role in connecting communities with basic services such as education and health, especially in rural areas, where network redundancy is rare and accessibility for the population may have significant limitations (Ayyub et al., 2007; Chamorro, 2012). The road network is key to the development of social and economic systems and the continuity of the logistics chain.
The road network is a complex, large-scale, and spatially distributed system, which makes it especially vulnerable to disasters (Ghavami, 2019). Traditional risk management systems (RMS) have studied the risk of the road network from a physical perspective, where the probability of damage is estimated in terms of the vulnerability of the road assets. These tasks typically include hazard simulation, road asset fragility models, risk modeling, mitigation assessment, and recovery cost calculation (Free, 2006; Ranke, 2016).
However, the specialized literature increasingly suggests the development of more comprehensive risk management systems, where not only physical aspects associated with infrastructure are considered but also the social and economic characteristics of the beneficiary population. Cutter et al. (2013) suggest the need to consider social aspects to better study the feasibility of strategies to reduce this risk and its consequences.
Chamorro and Tighe (2019) propose including the social dimension beyond economic aspects by integrating the Rural Access Index (The World Bank, 2006) in an unpaved road network management system. In addition, Chamorro et al. (2020) suggest a conceptual framework for road network risk management that considers a sustainable approach that integrates hazard simulation and probabilistic models that assess the physical vulnerability of road assets as well as the social vulnerability of the population, both the users and non-users of the road network. This approach opens the way to the integration of variables other than the classic techno-economic aspects of road infrastructure management. In the context of natural hazards, this need becomes even more important.
The transportation network plays an important role in the management of natural events (Jenelius, 2009; Kermanshah & Derrible, 2016). In turn, road networks enable access to emergency services in critical infrastructures such as hospitals during and after extreme natural events and facilitate the provision of equipment and humanitarian goods to affected areas (Berkoune et al., 2012; Muriel-Villegas et al., 2016).
The identification of the most important roads, such as those that can cause loss of connectivity to critical infrastructures (CI), is a key factor in the evaluation of accessibility (Jenelius, 2010; Ghavami, 2019). Roads providing access to CI have significant indirect exposure to denial of access and services because of their potential to facilitate rural emergency travel (D'Andrea et al., 2005).
Despite the connection between the road network and the rest of the critical infrastructure, there is no indicator that allows evaluating the role of road networks in providing access for rural populations to the CI of the territory.
This study proposes a method to develop an index to evaluate access to a critical infrastructure: the Vulnerability Access Index (VAI). This index considers the existing road network and integrates both the social vulnerability of rural communities exposed to extreme natural events and their accessibility to nearby critical infrastructure.
The methodology developed allows prioritizing roads according to their relevance to the territory in terms of the vulnerability of the rural population and access to other critical infrastructures. This presents a break from the traditional practice, whose prioritization is based on the traffic volume of the individual road.
This document first reviews potential available social vulnerability indicators and methods that capture the relevance of the location of critical infrastructure. Subsequently, the developed methodology is presented, which consists of three stages. Stage 1, construction of a Social Vulnerability Index (SVI); Stage 2, development of an Importance Index (Iimp) to evaluate access to critical infrastructure; and Stage 3, calculation of the Vulnerability Access Index (VAI), which is obtained as a combination of the indices estimated in the previous stages.
In addition, a case study is applied. To illustrate the usefulness of the proposed index, the proposed Vulnerability Access Index was calculated and integrated into a road risk management system for the Araucanía Region, Chile—an area highly exposed to volcanic hazards. The results show that the proposed index and its combination with traditional road risk management were able to identify those arcs of the road network that allow access to territories that present accessibility or extreme social vulnerability and therefore require special attention.
2. The Road Network as a Connector for Rural Population
Rinaldi et al. (2001) define critical infrastructure (CI) as a network of artificial systems and processes that operate in a collaborative way to produce and distribute essential goods and services. Some examples of critical infrastructures are the sanitary system, the drinking water supply network, and the electricity network.
The road network is critical infrastructure that connects many different components of a territory, such as the rural population that inhabits it and other ICs. In the context of the RMS, the social dimension of the role of the road network in the territory has been considered along with technical and economic aspects. In addition, a review of the state of the art of social vulnerability as a proxy for the social dimension has been performed to consider the rural population.
Because the road network serves as a link between the rural population and the necessary services provided by the CIs, various methods have been reviewed to assess access to different CIs.
2.1. Social Dimension and the Role of Road Networks
The social dimension assessment is a tool considered in a sustainable approach. The quantification of social vulnerability is crucial for planning mitigation measures to address natural hazards and to better understand risks (Tate, 2012; Solangaarachchi et al., 2012). The impact of disasters on a physical territory may seem unrelated to social conditions, but that is not the case with disaster impacts—which vary based on the level of development and the vulnerability of the local population (Loyola Hummell et al., 2016). Koks et al. (2015) propose social vulnerability as a key element for effective, equitable, and acceptable development of risk management strategies.
Social vulnerability has different meanings depending on its application. The literature presents several definitions; however, there is no consensus. The United Nations Office for Disaster Risk Reduction (UNDRR, 2022) associates social vulnerability with the conditions determined by physical, social, economic, and environmental factors or processes that increase the susceptibility of an individual, a community, assets, or systems to the impacts of hazards. Various research states the following: Social vulnerability is the probability that an individual or group will be exposed to an adverse effect caused by a natural hazard (Cutter, 1996); alternatively, social vulnerability is the susceptibility of the human society to the impacts of natural hazards and disasters (Smit and Wandel, 2006). However, the definitions agree on approaching vulnerability as a function of the susceptibility of loss and the capacity for recovery, or resilience (European Commission, 2011). Resilience is the ability of the society to withstand and recover from the impact of a natural event (Wisner et al., 1994). This concept is fundamental to identifying the relationship between the vulnerability of the population and that of the infrastructure serving them.
There is no common method to assess social vulnerability. Kappes et al. (2012) set out three approaches to assess vulnerability: damage matrices, vulnerability functions, and vulnerability indexes. The third is widely used in the field of social science and is currently the most used to measure social characteristics through vulnerability (Kappes et al., 2012; Tapsell et al., 2010). One of these is the SoVI® index developed by Cutter et al. (2003) in the United States, and it has been applied in countries such as Brazil (Loyola Hummell et al., 2016), Portugal (Guillard-Gonçalves et al., 2015), and China (Chen et al., 2013). Other indexes have been developed based on the massive databases that enable formulating social variables (Frigerio et al., 2016; Siagian et al., 2014; Wood et al., 2010; Burton, 2010).
Consensus exists regarding the dimensions to be considered, for example, the lack of access to information, knowledge, or technological sources; limited access to political powers or their representations; social capital, including social networks and connections; beliefs and traditions; housing and its age; disabled or dependent persons; and the type and quality of the infrastructure (Cutter, 2001a; Tierney et al., 2001; Wisner et al., 1994). However, disagreements emerge regarding which variables should be used to measure and, in the end, define the index. In general, these indexes are defined based on the available data and information. Even though indicators such as SoVI® have been applied to various societies, their heterogeneity makes it necessary to calibrate the indicator locally.
2.2. Access of the Rural Population to Critical Infrastructures
The critical infrastructure concept captures special attention at the global level, and many nations or international organizations have developed their own definitions. For example, the group of countries forming the Critical Five (Australia, Canada, New Zealand, the United Kingdom, and the United States) defines their critical infrastructure as systems, assets, facilities, and networks that provide essential services and are necessary for the national security, economic security, prosperity, and the health and safety of their respective nations (Critical Five, 2014). Meanwhile, the Chilean Chamber of Construction (CChC, 2016) classifies national critical infrastructure into three major groups: basal infrastructure (water resources, power, and telecommunications), logistical support infrastructure (interurban roads, airports, ports, and railroads), and infrastructure for social use (urban roads, public spaces, educational, hospital, and prison infrastructure). This is evidence of the variability that the definition of CIs can have depending on the territory.
The services provided by the CIs are key to the daily life of the population, and these services become even more important in an emergency—such as the occurrence of an extreme natural event. According to the U.S. Federal Emergency Management Agency (FEMA), access in a natural hazard to certain critical infrastructure, such as emergency operations centers and supply distribution centers, is a priority action (Yücel et al., 2018). Upon the occurrence of an event, the evacuation of people or access by emergency services to the affected area are crucial to ensure an optimal disaster response. Thus, road infrastructure and its condition are key aspects of the accessibility to such services in the context of natural hazards (D'Andrea et al., 2005).
Thus, road links that provide access to critical infrastructure—especially those associated with emergency services such as hospitals or police stations—play an important role in the response to extreme natural events (Novak & Sullivan, 2014). Ghavami (2019) introduces the concept of "strategic road" as "the road that provides an adequate emergency response in a disaster situation and also its failure has high negative impacts” (p. 2). Some authors consider the criticality of the link as an indicator of the performance of the road link (Latora & Marchiori, 2004; Sullivan et al., 2010; Murray & Grubesic, 2007; Taylor & D'Este, 2007), indicating that if the road is both weak and important, the road component is especially critical (Ghavami, 2019).
Assessing the accessibility of the population to critical systems, the following literature presents criteria that delimit a walkable area of influence, which varies in the case of urban or rural areas. In the first case, the Rural Access Index (RAI) developed by the World Bank (2006) predominates and establishes a total of 2 km as the maximum walkable distance in a rural environment. For contrast, in an urban context, Yang and Diez-Roux (2012) propose a walkable travelled distance up to 400 m (0.25 miles) as usual travel distance in the United States. The reason for considering a shorter distance in urban areas may be the high density of existing services in cities compared to rural areas.
The variables and indices presented below are associated with both rural and urban areas. Likewise, not all the studies mentioned are linked to natural hazard contexts. However, they show variables and methods of considering the access of CI that are relevant for the developed methodology. In the current state of the art, some of the variables for assessing the accessibility to different infrastructures are based on the following parameters:
- Index of Rural Access evaluates access to health services in rural areas and comprises three main indicators: spatial accessibility, health needs, and mobility. Regarding accessibility, this index groups populations and healthcare services within floating catchment areas. It measures the distance to services as well as the number of services and size of the population at each location (Australia; McGrail & Humphreys, 2009).
- Total number of opportunities (places for dining, entertainment, shopping, or personal errands) available to an individual within their activity space—in this case, the measure of accessibility. A potential activity space (PAS) is defined based on the longest distance covered within the trips made in a day by a certain individual, having these as origin or destination their own home. The results show that social variables such as being young, coming from a small household, having a driver's license, having a stable job, living in an urban environment, and being willing to travel long distances increase the number of opportunities available (US; Casas, 2007).
- Density of Critical Infrastructure. This composite index considers the density of infrastructure in the Rhine Valley through the IDI (Infrastructure Density Index). The IDI is the simple sum of two groups of infrastructures with weights equal to 1 in both cases. It contains ranges of values from 0 to 1 and is displayed in defined intervals. Thus, it uses critical infrastructure based on its density per county as the main indicator (Germany; Fekete, 2009).
- Travel time in normal operation vs. travel time in a natural event situation: Evaluation of comparative accessibility between normal operation and when the flood event is occurring. Access to the healthcare facilities within the English county of Norfolk from the centroids of the territorial units of analysis is evaluated. This analysis is performed in both normal and event situations. It allows the creation of an area around the hospitals that identifies the territory that has access to them in a maximum of 30 minutes for both operating conditions (United Kingdom; Garbut et al., 2015).
3. Methodology Proposed for Assessing Social Vulnerability and Access to Critical Infrastructure
According to the literature review, the SoVI® (Cutter, 2003) is the most widely accepted social vulnerability index that has been applied to different countries, emphasizing that its application requires a previous calibration and adaptation to the new territory.
Many variables are used to measure access to critical infrastructure; however, the use of spatial variables measured and represented through GIS predominates. Therefore, the use of the punctual location of the ICs and the spatial georeferencing of the road network as a basis for the analyses is repeated.
With awareness of the advances and limitations of the state of the art of both social vulnerability and indicators of access to critical infrastructures, a methodology has been developed that integrates both the social vulnerability of rural communities exposed to extreme natural events and their accessibility to nearby critical infrastructures. This method calculates the vulnerability access index (VAI) to a critical infrastructure.
The proposed methodology considers three stages: Stage 1, construction of a Social Vulnerability Index (SVI) based on socioeconomic variables, to which a principal component analysis is applied to identify the most determining dimensions of social vulnerability; Stage 2, development of an Importance Index (Iimp) to evaluate access to critical infrastructure, which is obtained based on the length of the roads, the traffic, and the number of roads that serve various goods; and Stage 3, calculation of the Vulnerability Access Index (VAI), which is obtained as a combination of the indices estimated in the previous stages.
3.1. Conceptual Framework
The methodology that allows integrating both the evaluation of social vulnerability and the study of critical infrastructure dependency is detailed in the following sections (Figure 1).
Stage 1 is directly related to the construction of the Social Vulnerability Index (SVI). In this stage, activities and methods are used to gather the necessary information to obtain the variables that will shape the index. Once the variables have been obtained and standardized, a principal component analysis is used to determine the components that will compose the index.
Stage 2 refers to the design and construction of the critical infrastructure access index, i.e., the Importance Index (Iimp). This index is associated with the arcs of the road network. This stage consists of modeling the CI network, including obtaining data on the location of all the CIs, defining the arcs of the network and their attributes, and evaluating the area of influence around each CI. These activities are conducted in GIS software for their analysis.
In Stage 3, both indexes (SVI and Iimp) converge to form the Vulnerability Access Index (VAI). This index associates each arc of the road network with an attribute associated with both the vulnerability of the population and the accessibility to the near CIs.
Finally, an example of VAI integration with risk management systems (RMS) of road networks is presented. This index can be integrated in these systems, enabling the incorporation of socio-economic variables and the presence of other infrastructures beyond the classical techno-economic analysis.
3.2. Social Vulnerability
The main objective of Stage 1 is to perform the necessary steps to calculate a Social Vulnerability Index (SVI) adapted for decision making on spatially distributed infrastructure, such as road networks. The present index is based on the SoVI® (Social Vulnerability Index; Cutter, 2003). SVI’s variables are defined with a factor analysis that reduces the number of variables from the input data according to the characteristics of the study area.
The variables needed for evaluating vulnerability were defined after the review of the literature and available databases. In addition, the Chilean rural population inhabits very large, low-density territories. Moreover, in general, agricultural activities or activities related to the environment and its natural resources predominate. This information helps determine the social variables that define the rural Chilean society to develop an index that clarifies the conjunction of these variables.
In relation to socio-economic variables, it should be mentioned that an indicator associated with the critical infrastructure in the studied territory was incorporated into the principal component analysis (PCA). In particular, the variable of critical infrastructure density within each unit of analysis was designed considering the following: interurban highway system, healthcare facilities, educational infrastructure, power sector, water system, and citizen security services. This modification was made based on the revised literature and the mentioned infrastructure density variables. This new variable presents a slight modification from traditional SoVI®.
Once the data for each unit of analysis were collected, the values were normalized through percentages, which were then standardized using the Z-score typification that obtained variables with a median of 0 and a standard deviation of 1.
Next, a PCA was performed, and the components were selected through a “Varimax” rotation under Kaiser’s criteria. Subsequently, the components were named based on the variables that concentrated the highest weight and prioritized with a level of significance higher than 0.5.
Finally, to generate the final score of each unit of analysis, an additive model was programmed with the scores and cardinality of each component. In this way, a new variable called SVI (Social Vulnerability Index) is created, which reflects the final vulnerability values.
3.3. Critical Infrastructure Access
Stage 2 refers to the design and construction of the index of access to critical infrastructure: the Importance Index (Iimp). The methodology used to assess the dependence of society on the critical infrastructure focuses on its accessibility. The selected critical infrastructure systems are healthcare facilities, educational infrastructure, power systems, rural drinking water system, citizen security, and emergency services. In this case, the interurban highway network is the main infrastructure of the analysis as the network connects the various services offered by the selected critical infrastructures for this methodology.
Once the analysis of infrastructures and the highway network arcs were defined, an area of influence of 2 km was determined around them, based on the Rural Access Index (RAI; The World Bank, 2006). This area of influence is established to identify all roads giving access to that infrastructure; therefore, special attention should be given to the maintenance of their operational level and serviceability.
Following the identification of the arcs, both the average annual daily traffic (AADT; veh/h) and length were collected. These two variables, transit and length, were chosen because they include the hierarchy of the arc that provides access. Thus, Equation 1 was applied to calculate the Importance Index (Iimp), based on the traffic, the access redundancy to each specific infrastructure, and the length of each alternative access arc. In Equation 1, i is the analyzed arc, j is the critical infrastructure accessed by arc i, and m is the total of infrastructures to which arc I accesses. The Tj subindex refers to the total number of arcs that provide access to infrastructure j, L is the length of the arc (in km), and AADT is the average annual daily traffic of the arc i.
To obtain dimensionless values, a normalized weighted sum was decided. In turn, by weighing the traffic by the arc length and dividing by the total number of arcs that give access to the same infrastructure, it is also possible to highlight rural links that connect wide areas with mostly low network density. This measurement is important in addition to the road segments giving access to more urbanized and dense areas in rural road networks.
3.4. Vulnerability Access Index
After both indexes are developed, the information should be usefully represented in the territory—specifically in the studied highway network—so that it is easier for the agents in charge of managing those assets to make decisions. In this case, the territorial unit will depend on the scale at which the Social Vulnerability Index (SVI) was developed. However, when developing the Importance Index of the arcs, the highway network is divided into two groups: the arcs giving access to some type of critical infrastructure and the arcs that do not, which will not be associated with an Iimp value.
Thus, the interurban road network is divided into the studied territorial units so that the arcs, or parts of the arcs, that are located in that unit will have an associated SVI value as an attribute of that unit of analysis. In this case, the main attribute of the arcs without associated Iimp value will be the SVI of their unit of analysis. However, in the arcs having an associated Iimp value, their final attribute will be the Vulnerability Access Index (VAI) presented in Equation 2.
Where SVI is the Social Vulnerability Index, Iimp is the Importance Index, and the subscripts are the same as those described for Equation 1.
4. Case Study: Villarrica Volcano, Chile
To evaluate social vulnerability and critical infrastructure accessibility of a rural area exposed to natural hazards, the following case study was applied. Chile was the country chosen for conducting the case study in which the presented methodology was applied. The work was performed specifically in the area surrounding the Villarrica volcano. This area was selected for the characteristics of the population, geography, and the environment dominated by volcanic hazards. It is a mountainous region close to the border with Argentina, with a strong presence of lakes and volcanoes. This location and topography make the existence of a dense and redundant network more difficult and therefore the mobility and accessibility of the population is more urgent for planning and policy.
This case study comprises the municipalities of Villarrica, Pucón, Curarrehue, and Panguipulli (see Figure 2). The first three municipalities belong to the region of La Araucanía and the fourth to Los Ríos. This region has a predominant and growing tourist activity because of the landscape of lakes, volcanoes, and Araucanian forests. The environment enables the practice of trekking and winter sports, which are mainly concentrated in the areas of Villarrica and Pucón. However, in Panguipulli and Curarrehue, the predominant activity is related to the primary sector, with agricultural and forestry activities. This population and area, in addition to the low density of the road network and the proximity to the border and Andean Mountains, produce a certain level of isolation. It should also be highlighted that, because Villarrica is the Araucania region, there is a strong presence of indigenous native people—primarily Mapuche.
Volcanic scenarios presented by the National Hydraulic Institute (INH, 2013) for the Villarrica volcano were considered. In that study, three scenarios were modeled based on criteria such as eruptive dynamism, the volcanic processes developed in each type of eruption, the interaction between volcanic products and the glacier, and the size of the glacier and its melting rate. The scenarios modeled correspond to Hawaiian-Strombolian, sub-Plinian, and Plinian eruptions. These three scenarios, in turn, consider both winter and summer conditions.
4.1. Estimation of Social Vulnerability
The national census, performed by the Chilean National Statistics Institute (INE), and the CASEN survey, performed by the Social Observatory of the Ministry of Social Development, were used to collect the data of the social dimension. In particular, the databases of the 2017 Census (Instituto Nacional de Estadística, 2017) and the 2017 CASEN Survey (Observatorio social, Ministerio de Desarrollo Social y Familia, 2017) were used. The applied scale is the political-administrative census division corresponding to the zone for urban territory and the locality for rural land.
The results of the methodology applied to the case study are presented below. The variables used to form the SVI are shown in Table 1. Various representative dimensions of social vulnerability have been considered according to the literature and the databases available in Chile: gender, age, migration, education, ethnicity, socioeconomic status, employment-occupation, quality of built environment, and critical infrastructure density. From these dimensions, 18 variables have been defined.
Following the application of data standardization and subsequent PCA, these variables explain 73.8% of the variance, with seven main components of social vulnerability in that territory. These components, together with their predominant variable, are the following:
- Socio-Economic Status (average income, 0.955)
- Dependent Population (dependency ratio, 0.829)
- Women and Children (women and young children, 0.855)
- Education and Unemployment (population with primary education, 0.882)
- Occupation (secondary sector, -0.811)
- Household and Housing Quality (non-recoverable housing unit, 0.801)
- Access to Critical Infrastructure (CI density, 0.870)
It should be noted that the SVI, as well as the Iimp and VAI indexes, are represented in five categories: very low, low, medium, high, and very high. For the classification and representation of the different categories, all the indexes are standardized and represented according to their standard deviations.
Figure 3 shows the representation of SVI in the municipalities of Villarrica, Pucón, Panguipulli, and Curarrehue. The application of the case study shows a prevalence of medium-high social vulnerability areas and stresses the municipality of Curarrehue, where none of their territories reaches a low or very low vulnerability. This vulnerability scale is consistent to a sparse and scattered population that is mainly rural and with a level of isolation superior to the rest of its neighboring territories. This isolation is accentuated by being in a mountainous area, very close to the border with Argentina and therefore to the Andes. However, low or very low vulnerabilities have a greater presence in the two most developed municipalities, Pucón and Villarrica. Both places have a strong tourist presence and, in recent years, have attracted people with greater economic capacity to travel to this area of great tranquility and intriguing landscapes.
4.2. Estimation of Critical Infrastructure Access
Regarding the critical infrastructure stage, as shown in Figure 1, the main inputs are layers of georeferenced information of the critical infrastructure and of the national road network. These inputs are obtained from the IDE Chile portal web (Geospatial Data Infrastructure), which presents different types of territorial information at the national level. This website shows the information in an online viewer and enables downloading the files for use in GIS software. In addition to the road network and its attributes, relevant information was downloaded for the health system, educational infrastructure, power sector, rural drinking water system, citizen security, and emergency services.
Once critical infrastructures in the studied area are identified, the area of influence of 2 km around each CI is created. These buffers identify the relevant accessibility arcs. As shown in Figure 2, the most vulnerable areas are concentrated in the most isolated areas located in Curarrehue and in the most rural areas of Curarrehue and Panguipulli.
According to the accessibility analysis of critical infrastructures in the municipalities of Curarrehue and Pucón, the road network obtains the following importance index levels for the arcs (Figure 4). In this image, the reddish color highlights the arcs giving access to various infrastructures in isolated areas, as in the northeast area of the Curarrehue municipality. However, the orange color highlights other arcs in areas with higher road density. These arcs give access to an area with a high density of critical infrastructure, which also presents a higher AADT in relation to the other roads that also permit access to the urban focus of these infrastructures.
4.3. Estimation of Vulnerability Access Index
The integration of both dimensions is possible once the individual indexes are obtained. The integration of both indexes, SVI and Iimp, into a single index, VAI, represents all the information in a compact and intuitive way. VAI is associated with the different arcs of the road network to facilitate decision making.
Figure 5 is a map showing the resulting Vulnerability Access Index and the changes generated when both dimensions are combined. Here, it is possible to observe the increase of the vulnerability level of the arcs located in the most vulnerable territories. The east area of Curarrehue is highlighted because it concentrates both the most vulnerable areas, socially speaking, and the most important arcs in terms of the accessibility to critical infrastructures; these roads are the only ones providing access to that region’s infrastructure, which explains the high VAI increase in that region—accounting for a total of 954 points in the most vulnerable segment.
Furthermore, because the city center and surroundings of Pucón (concentration area of critical infrastructure, of roads and other modalities) present low social vulnerability and have a denser highway network compared with the studied subnetwork, different arcs are detected when the VAI is composed—which decreases one step in the categorization presented above.
Regarding the road arc network, Figure 5 shows the predominance of less impacted arcs but with a very high dispersion range in relation to higher values because of the juxtaposition of high-vulnerability territory and arcs with important accessibility. It is important to highlight that the arcs that finally emerge for their criticality are those present in more isolated areas and with low density in the road network, such as the Reigolil route that connects Curarrehue from south to north. In this situation, contrary to isolation, the arcs that traverse urban centers with great coverage of critical infrastructure emerge.
4.4. Integration into a Risk Management System: Physical Risk Assessment
This section demonstrates the integration of the social dimension in the management of road networks exposed to natural hazards. As an example, VAI is crossed with the physical risk of the road network. Physical risk is considered in terms of travel time, according to Allen et al. (2022). Thus, the average increase in travel time is considered a weighting of the VAI for the road links that are affected by a volcanic hazard, as shown in Equation 3. Each travel time increase is evaluated per link and compares the situation with the event with respect to normal operation.
Where i refer to the road arc analyzed and wi is the weight associated with physical risk in terms of its average increase in travel time because of volcanic scenarios.
Travel time delay evaluation is based on stochastic modeling of different consequences resulting from volcanic scenarios, infrastructure fragility, and traffic assignment models. The process begins with the hazard characterization, which considers different volcanic eruptions detailed in Chamorro et al. (2020). Furthermore, damages are computed using fragility curves developed by Dagá et al. (2018), which estimate the probability of failure for bridges exposed to lahar flows. To sample damage states for each volcanic eruption, 1,000 realizations were computed. In each realization, a random number seed is generated between 0 and 1 using a uniform distribution for each asset. A bridge fails if the random number is larger than the probability of collapse given by the fragility curve in each realization. Finally, to estimate travel times for each damage realization, the well-known user equilibrium principle—first proposed by Beckman et al. (1956)—and the BPR transportation functions are used (HCM, 2016). The origin-destination and traffic data were obtained from the National Traffic Survey of the Chilean Ministry of Public Works (MOP). The algorithm followed to reach flow equilibrium is based on the Incremental Assignment Algorithm (ITA) (Martin & Manheum, 1965). This methodology has been applied in extreme conditions resulting from natural event disruptions (Kiremidjian et al., 2007; Fan et al., 2010; Jayaram & Baker, 2010; Chamorro et al., 2020; Allen et al., 2022).
Figure 6 highlights a small area within the application area where the integration of the VAI with the physical risk weight has been performed. This small area considers the road network that connects the cities of Villarrica and Pucón. This road network is directly exposed to lahar flows from the Villarrica volcano (see Figure 6b). Figure 6b shows the road network, where each of its links has been represented with a different thickness. A greater thickness indicates a greater physical risk (in terms of increased travel time) and therefore a higher weight. These arcs correspond to the eastern zone of the network—the one directly affected by the lahars. The links located in this zone, which also have a bridge, are those with the highest weights for this application case. Finally, it should be noted that the laharic flows shown in the figure correspond to the INH study (2013).
4.5. Discussion of Results
4.5.1. Social Vulnerability and Critical Infrastructure Access
In analyzing the results for each SVI interval and Table 2, the territorial units with medium social vulnerability predominate, which—together with the other medium, low, and high values—capture more than 90% of the cases.
Table 2 also shows a summary of the road network’s importance index intervals. Because the index has a great dispersion, the extreme categories do not account for even 5% of the total. The category associated with the links with very low and low importance regarding their accessibility to CI has a value of zero because the calculation process estimates only the network links with some kind of infrastructure nearby (within a radius of 2 km); the remainder are excluded from the analysis.
4.5.2. Importance of Critical Infrastructure and Vulnerability Access Index
By analyzing the indicators directly associated with the road network, it can be observed that medium-category cases predominate (see Figure 4 and Figure 5). This result is mainly because of the distribution of the values of both indexes. In the case of the Iimp, most of the links of lower category (medium, in this case) are those that are not located within the area of influence of any CI. Figure 7 shows the distribution of the different categories for Iimp and VAI.
In the case of Iimp, only links in the three most critical categories are found: medium, high, and very high. The most critical links are concentrated in the urban areas around the two main cities of Villarrica and Pucón. This is because urban areas concentrate most of the critical infrastructure; despite having less social vulnerability, urban areas are hotspots of critical services. In addition, more isolated areas emerge in terms of road density, such as the areas located to the east of the municipalities of Curarrehue and Panguipulli.
VAI, however, has a broader spectrum in terms of the categories represented. In this case, social vulnerability plays a determining role. Thus, because the urban areas mentioned above have lower SVI categories, the critical links in access to CI in these areas have lower VAI values (between low and very low). The VAI mainly highlights the more rural areas, whose social vulnerability is greater and, in turn, have lower road network density and therefore less access to nearby CIs.
4.5.3. Integration to Physical Risk Assessment
Regarding the effect of the hazard and the physical risk of the network on the VAI, Figure 8 shows a comparison of both cases for the road network that connects the cities of Villarrica and Pucón, in the area closest to the Villarrica volcano.
Figure 8b shows that, when weighting the VAI, the links mainly affected by lahars increase their criticality—going from a medium to a high category.
Thus, considering the physical risk associated with a natural hazard obtains a more sustainable VAI that considers both the social and physical dimension, providing an integrated approach of the territory exposed to the hazard.
5. Conclusions and Recommendations
This paper presents a method to create an index associated with the road network that considers social vulnerability and access to critical infrastructure. This index, called VAI, provides a multidimensional and sustainable approach when integrated into road network risk management systems.
An evaluation of social vulnerability has been performed through the development of the Social Vulnerability Index (SVI), based on the structure of the index built by Susan Cutter (2003). Through an exhaustive bibliographical review and the identification of available databases, it has been possible to determine the socio-economic variables that define rural Chilean society in the case study area, which are representative nationally. The inclusion of infrastructure density as a variable within the SVI allows consideration of the built territory by including several critical infrastructures in the analysis. This allows an engineering perspective to be integrated into the traditional socio-economic approach of the variables.
Next, the importance index (Iimp) associated with the links of the road network has been calculated. This index evaluates the accessibility to various infrastructures, where the road network is the connecting cornerstone. It considers variables such as the length of links, their AADT, and the number of accesses to each of the analyzed infrastructures. In this way, a categorization of the links can be achieved based on their level of importance in terms of accessibility to critical facilities.
Finally, these two indexes are compiled into a single index called the Vulnerability Access Index (VAI). This index jointly values the road network in terms of its importance (Iimp) and the social vulnerability (SVI) of the population living in the territory through which the road network under study runs. This information has been reflected in a case study developed in the surroundings of the Villarrica volcano.
In this way, the developed methodology evaluates social vulnerability and thus identifies territories whose state of vulnerability to accessing their own resources and infrastructure makes them the focus of attention in favor of better public policies. Regarding the methodology developed to analyze the location of critical infrastructure in the territory and its accessibility, this method has been able to identify links of the road network that allow access to territories that have accessibility extremes and therefore require special attention. This method also identifies areas where the density of road infrastructure that gives access to critical assets is minimal and practically without redundancy. Thus, even before a failure of links of these characteristics, the population of this sector is isolated with respect to its critical services. However, the methodology also highlights the links that run through areas of high critical infrastructure density. In this case, these are links of great value because, given a failure and despite having greater redundancy, failure would leave much critical infrastructure unattended.
Applying the developed methodology allows prioritizing differently from the traditional practice, which is based on the traffic volume of the individual road. Instead, this methodology prioritizes roads according to their relevance to the territory, considering the rural population and access to other critical infrastructure.
This methodology is presented as a road network management tool. It could be easily incorporated into the decision-making process as a weighting, as shown in the application case. This index enables consideration of critical criteria associated with the population and the territory beyond the road infrastructure itself.
Acknowledgments
The authors wish to thank the National Research and Development Agency (ANID), which has financed the FONDEF Project ID14I20309, “Research and Development of Models to Quantify and Mitigate the Risk of Natural Hazards in the National Road Network.” Likewise, they express their gratitude to the institutions that participated and contributed to this research project, especially the Research Center for Integrated Disaster Risk Management (CIGIDEN), ANID/FONDAP/ 1523A0009; the Chilean Ministry of Public Works (MOP); the National Office for Emergency of the Ministry of Interior and Public Security (ONEMI) and the Chilean Association of Franchisees of Public Infrastructure Works (COPSA). In addition, thanks to the research project “Managing and Financing Risk for Resilient Rural Road Networks: Standards recommendations under a multi-hazard approach,” funded by the Coalition for Disaster Resilient Infrastructure.
References
- Allen, E., Chamorro, A., Poulos, A., Castro, S., de la Llera, J. C. & Echaveguren, T. (2022). Sensitivity analysis and uncertainty quantification of a seismic risk model for road networks. Computer-Aided Civil and Infrastructure Engineering, 37(4):516–530. [CrossRef]
- Ayyub B.M., McGill W.L. & Kaminskiy M. (2007). Critical Asset and Portfolio Risk Analysis: An all-hazards framework. Risk Analysis, 27(4):789–801. [CrossRef]
- Beckmann, M., McGuire, C, & Winsten, C. (1956). Studies in the economics of transportation. Yale University Press.
- Berkoune, D, Renaud, J., Rekik, M. & Ruiz, A. (2012). Transportation in disaster response operations, Socio-Economic Planning Sciences, 46 (2012) 23–32. [CrossRef]
- Burton, C.G. (2010). Social Vulnerability and Hurricane Impact Modeling. Nat Hazards Rev 11(2):58–68. [CrossRef]
- Casas, I. (2007) Social Exclusion and the Disabled: An Accessibility Approach. The Professional Geographer, 59(4), 463-477. [CrossRef]
- Cámara Chilena de la Construcción, CChC (2016). Infraestructura Crítica para el desarrollo 2016-2025. Recuperado de: https://www.cchc.cl/uploads/archivos/archivos/Infraestructura-Critica-para-el-Desarrollo_2016-2025.pdf.
- Chamorro, M.A. (2012). Development of a Sustainable Management System for Rural Road Networks in Developing Countries (Doctoral Thesis). University of Waterloo, Ontario, Canada.
- Chamorro, A. & Tighe, S. (2019). Development and Application of a Sustainable Management System for Unpaved Rural Road Networks. Transportation Research Record. [CrossRef]
- Chamorro, A., Echaveguren, T., Allen, E., Contreras, M., Dagá, J., de Solminihac, H. & Lara, L.E. (2020). Sustainable Risk Management of Rural Road Networks Exposed to Natural Hazards: Application to Volcanic Lahars in Chile. Sustainability 2020, 12, 6774.
- Chen, W., Cutter, S.L., Emrich, C.T. & Shi, P. (2013). Measuring social vulnerability to natural hazards in the Yangtze River Delta Region, China. International Journal of Disaster Risk Science, 4(4), 169–181. [CrossRef]
- Critical Five (2014). Forging a Common Understanding for Critical Infrastructure. Retrieved from: https://www.dhs.gov/sites/default/files/publications/critical-five-shared-narrative-critical-infrastructure-2014-508.pdf.
- Cutter, S.L. (1996). Vulnerability to Environmental Hazards. Prog Hum Geogr 20(4):529–539.
- Cutter, S.L. (2001a). American Hazardscapes: The Regionalization of Hazards and Disasters. Washington, D.C.: Joseph Henry Press. [CrossRef]
- Cutter, S.L., Boruff, B.J., & Shirley, W.L. (2003). Social Vulnerability to Environmental Hazards. Social Science Quarterly, 84(2), 242–261. [CrossRef]
- Cutter, S.L., Emrich, C.T., Morath, D.P. & Dunning, C.M. (2013). Integrating Social Vulnerability into Federal Flood Risk Management Planning, Journal of Flood Risk Management, 6, 332–344. [CrossRef]
- Dagá, J., Chamorro, A., De Solminihac, H. & Echaveguren, T. (2018) Development of fragility curves for road bridges exposed to volcanic lahars. Hazards Earth Syst. Sci., 2018, 18, 2111–2125. [CrossRef]
- D’Andrea, A., Cafiso, S. & Condorell, A. (2005). Methodological Considerations for the Evaluation of Seismic Risk on the Road Network. Pure and Applied Geophysics 162(4):767-782. [CrossRef]
- Fan, Y., Liu, C., Lee, R., & Kiremidjian, A. S. (2010). Highway network retrofit under seismic hazard. Journal of Infrastructure Systems, 16(3), 181–187.
- Fekete, A. (2009) Assessment of social vulnerability for river floods in Germany (Doctoral Thesis). Universitäts und Landesbibliothek Bonn, Germany.
- Free, M., Anderson, S., Milloy, C., & Mian, J. (2006). Geohazards risk management for infrastructure projects. Proceedings of the ICE – Civil Engineering, 159 (6), 28 – 34. [CrossRef]
- Frigerio, I., Ventura, S., Strigaro, D., Mattavelli, M., De Amicis, M., Mugnano, S. & Boffi, M. (2016). A GIS-based approach to identify the spatial variability of social vulnerability to seismic hazard in Italy. Applied Geography, 74(2016), 12–22. [CrossRef]
- Garbutt, K., Ellul, C., & Fujiyama, T. (2015). Mapping social vulnerability to flood hazard in Norfolk, England. Environmental Hazards, 14(2), 156–186. [CrossRef]
- Ghavami, S. M. (2019). Multi-criteria spatial decision support system for identifying strategic roads in disaster situations. International Journal of Critical Infrastructure Protection 24:23-36. [CrossRef]
- Guillard-Gonçalves, C., Cutter, S.L., Emrich, C.T., & Zêzere, J.L. (2015). Application of Social Vulnerability Index (SoVI) and delineation of natural risk zones in Greater Lisbon, Portugal. Journal of Risk Research, 18 (5), 651-674. [CrossRef]
- HCM. (2016). Highway capacity manual (6th ed.). Washington, DC: Transportation Research Board.
- Instituto Nacional de Estadística (2017). Censo 2017. Recuperado de http://www.censo2017.cl/microdatos/.
- Instituto Nacional de Hidráulica de Chile, INH (2013). Construcción Mitigación Riesgos Volcánicos y Geológicos Asociados, Comunas de Villarrica, Pucón y Curarrehue, Región de la Araucanía.
- Jenelius, E. (2009). Network structure and travel patterns: explaining the geographical disparities of road network vulnerability. Journal of Transport Geography 17, (3), 234-244. [CrossRef]
- Jenelius E. (2010). Redundancy importance: Links as rerouting alternatives during road network interruptions. Procedia Engineering, 3:129–137. [CrossRef]
- Jayaram, N. & Baker, J.W. (2010). Efficient sampling and data reduction techniques for probabilistic seismic lifeline risk assessment. Earthquake Engineering & Structural Dynamics, 39(10), 1109–1131. [CrossRef]
- Kappes, M.S., Papathoma-Köhle, M. & Keiler, M. (2012). Assessing physical vulnerability for multi-hazards using an indicator-based methodology. Applied Geography, 32(2), 577–590. [CrossRef]
- Kermanshah, S. & Derrible, A. (2016). Geographical and multi-criteria vulnerability assessment of transportation networks against extreme earthquakes. Reliability Engineering & System Safety, 153, 39–49. [CrossRef]
- Kiremidjian, A. S., Moore, J., Fan, Y. Y., Yazlali, O., Basoz, N., & Williams, M. (2007). Seismic risk assessment of transportation network systems. Journal of Earthquake Engineering, 11(3), 371–382. [CrossRef]
- Koks, E. E., Jongman, B., Husby, T. G., & Botzen, W. J. W. (2015). Combining hazard, exposure and social vulnerability to provide lessons for flood risk management. Environmental Science & Policy, 47, 42-52. [CrossRef]
- Latora, V. & Marchiori, M. (2004). How the science of complex networks can help developing strategies against terrorism, Chaos, solitons & fractals, 20, 69–75. [CrossRef]
- Loyola Hummell, B.M. de, Cutter, S.L., & Emrich, C.T. (2016). Social Vulnerability to Natural Hazards in Brazil. International Journal of Disaster Risk Science, 7(2), 111–122. [CrossRef]
- Martin, B., & Manheum, M. (1965). A research program for comparison of traffic assignment techniques. In Travel patterns (pp 69–84). Highway Research Record, (Issue Number: 88).Highway Research Board.
- Mcgrail, M.R., & Humphreys, J.S. (2009). The index of rural access : an innovative integrated approach for measuring primary care access. BMC Health Services Research 2009, 9:124. [CrossRef]
- Muriel-Villegas, J.E., Alvarez-Uribe, K.C., Patiño-Rodríguez, C.E. & Villegas, J.G. (2016). Analysis of transportation networks subject to natural hazards–Insights from a Colombian case, Reliability Engineering & System Safety, 152, 151–165. [CrossRef]
- Murray, A.T. & Grubesic, T. (2007). Critical Infrastructure. Springer. [CrossRef]
- Novak, D.C. & Sullivan, J.L. (2014). A link-focused methodology for evaluating accessibility to emergency services, Decision Support Systems, 57 309–319. [CrossRef]
- Observatorio social, Ministerio de Desarrollo Social y Familia, 2017. Encuesta CASEN 2017. Recuperado de http://observatorio.ministeriodesarrollosocial.gob.cl/casen-multidimensional/casen/basedatos.php.
- Ranke, U. (2016). Natural disaster risk management: Geosciences and social responsibility. Switzerland: Springer International. [CrossRef]
- Rinaldi, S.M., Peerenboom, J.P. & Kelly, T.K., (2001). Identifying, understanding, and analyzing critical infrastructure interdependencies. IEEE Control. Syst. 21 (6), 11–25. [CrossRef]
- Siagian, T.H., Purhadi, P., Suhartono, S., & Ritonga, H. (2014). Social vulnerability to natural hazards in Indonesia: Driving factors and policy implications. Natural Hazards, 70(2), 1603– 1617. [CrossRef]
- Smit, B. & Wandel, J. (2006). Adaptation, adaptive capacity and vulnerability. Global Environmental Change, 16(3), 282–292. [CrossRef]
- Solangaarachchi, D., Griffin, A.L., & Doherty, M.D. (2012). Social vulnerability in the context of bushfire risk at the urban-bush interface in Sydney: a case study of the Blue Mountains and Ku-ring-gai local council areas. Natural Hazards (2012) 64, 1873-1898. [CrossRef]
- Sullivan, J., Novak, D., Aultman-Hall, L., & Scott, D. (2010). Identifying critical road segments and measuring system-wide robustness in transportation networks with isolating links: A link-based capacity-reduction approach. Transportation Research Part A: Policy and Practice. 44. 323-336. [CrossRef]
- Tate, E. (2012). Social vulnerability indices: A comparative assessment using uncertainty and sensitivity analysis. Natural Hazards, 63(2), 325–347. [CrossRef]
- Tapsell, S., McCarthy, S., Faulkner, H. & Alexander, M. (2010). Social Vulnerability and Natural Hazards. CapHaz-Net WP4 Report, Flood Hazard Research Centre – FHRC, Middlesex University, London. Available in: http://caphaz-net.org/outcomes-results/CapHazNet_WP4_Social-Vulnerability.pdf).
- Taylor, M.A. & D’Este, G.M. (2007). Transport Network Vulnerability: A Method for Diagnosis of Critical Locations in Transport Infrastructure Systems, Springer. [CrossRef]
- The World Bank (2006). Rural Access Index: A Key Development Indicator. Transport paper series. Retrieved from: https://openknowledge.worldbank.org/handle/10986/17414 License: CC BY 3.0 IGO.
- Tierney, K. J., Lindell, M.K., & Perry, R.W. (2001). Facing the Unexpected: Disaster Preparedness and Response in the United States. Washington, D.C.: Joseph Henry Press. [CrossRef]
- UNDRR, United Nations Office for Disaster Risk Reduction (2022). Global Assessment Report on Disaster Risk Reduction 2022: Our World at Risk: Transforming Governance for a Resilient Future. Geneva. https://www.undrr.org/media/79595/download.
- Wisner, B., Blaikie P., Cannon, T. & Davis, I. (1994). At Risk: natural hazards people’s vulnerability and disasters (Second edition, 2003). [CrossRef]
- Wood, N.J., Burton, C.G., & Cutter, S.L. (2010). Community variations in social vulnerability to Cascadia-related tsunamis in the US Pacific Northwest. Natural Hazards 52(2):369–389. [CrossRef]
- Yang, Y. & Diez-Roux, A., (2012). Walking Distance by Trip Purpose and Population Subgroups. American Journal of Preventive Medicine, 43(1), 11–19. [CrossRef]
- Yücel, E., Salman, F.S. & Arsik, I. (2018). Improving post-disaster road network accessibility by strengthening links against failures, European Journal of Operational Research, 269, 406–422. [CrossRef]
Figure 1.
Conceptual framework of the proposed methodology.
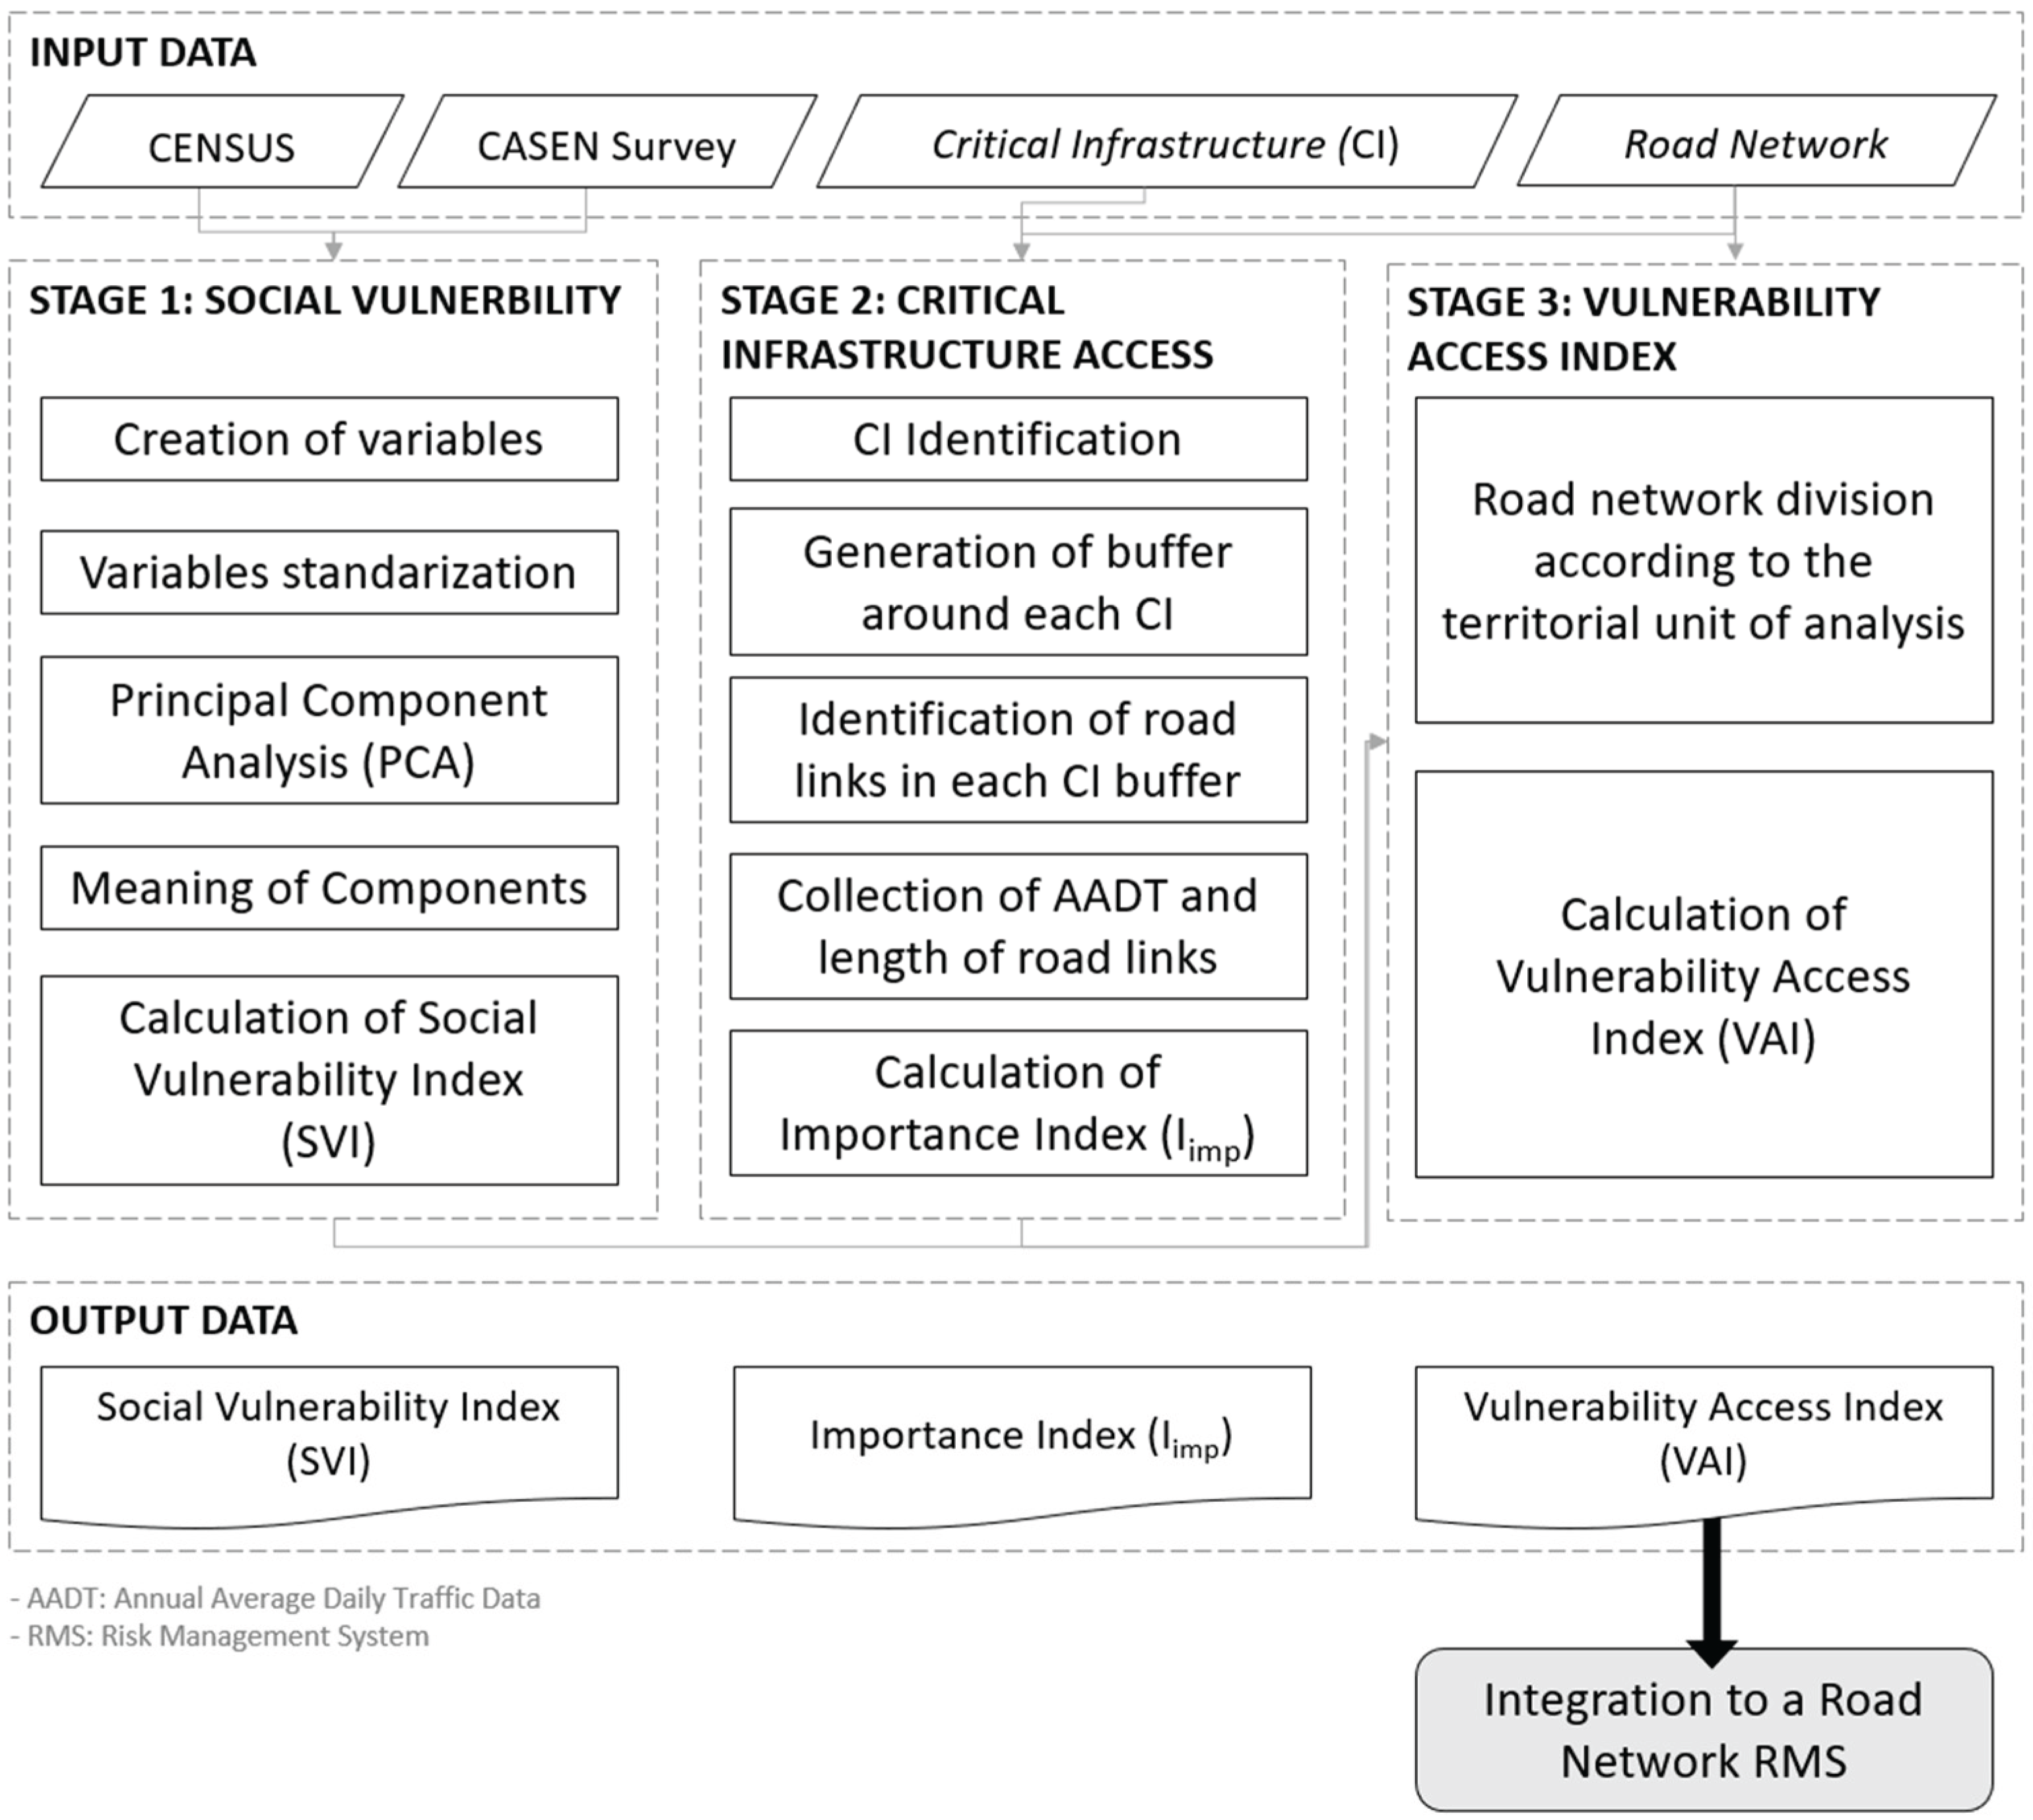
Figure 2.
Map of the territory included in the case study.
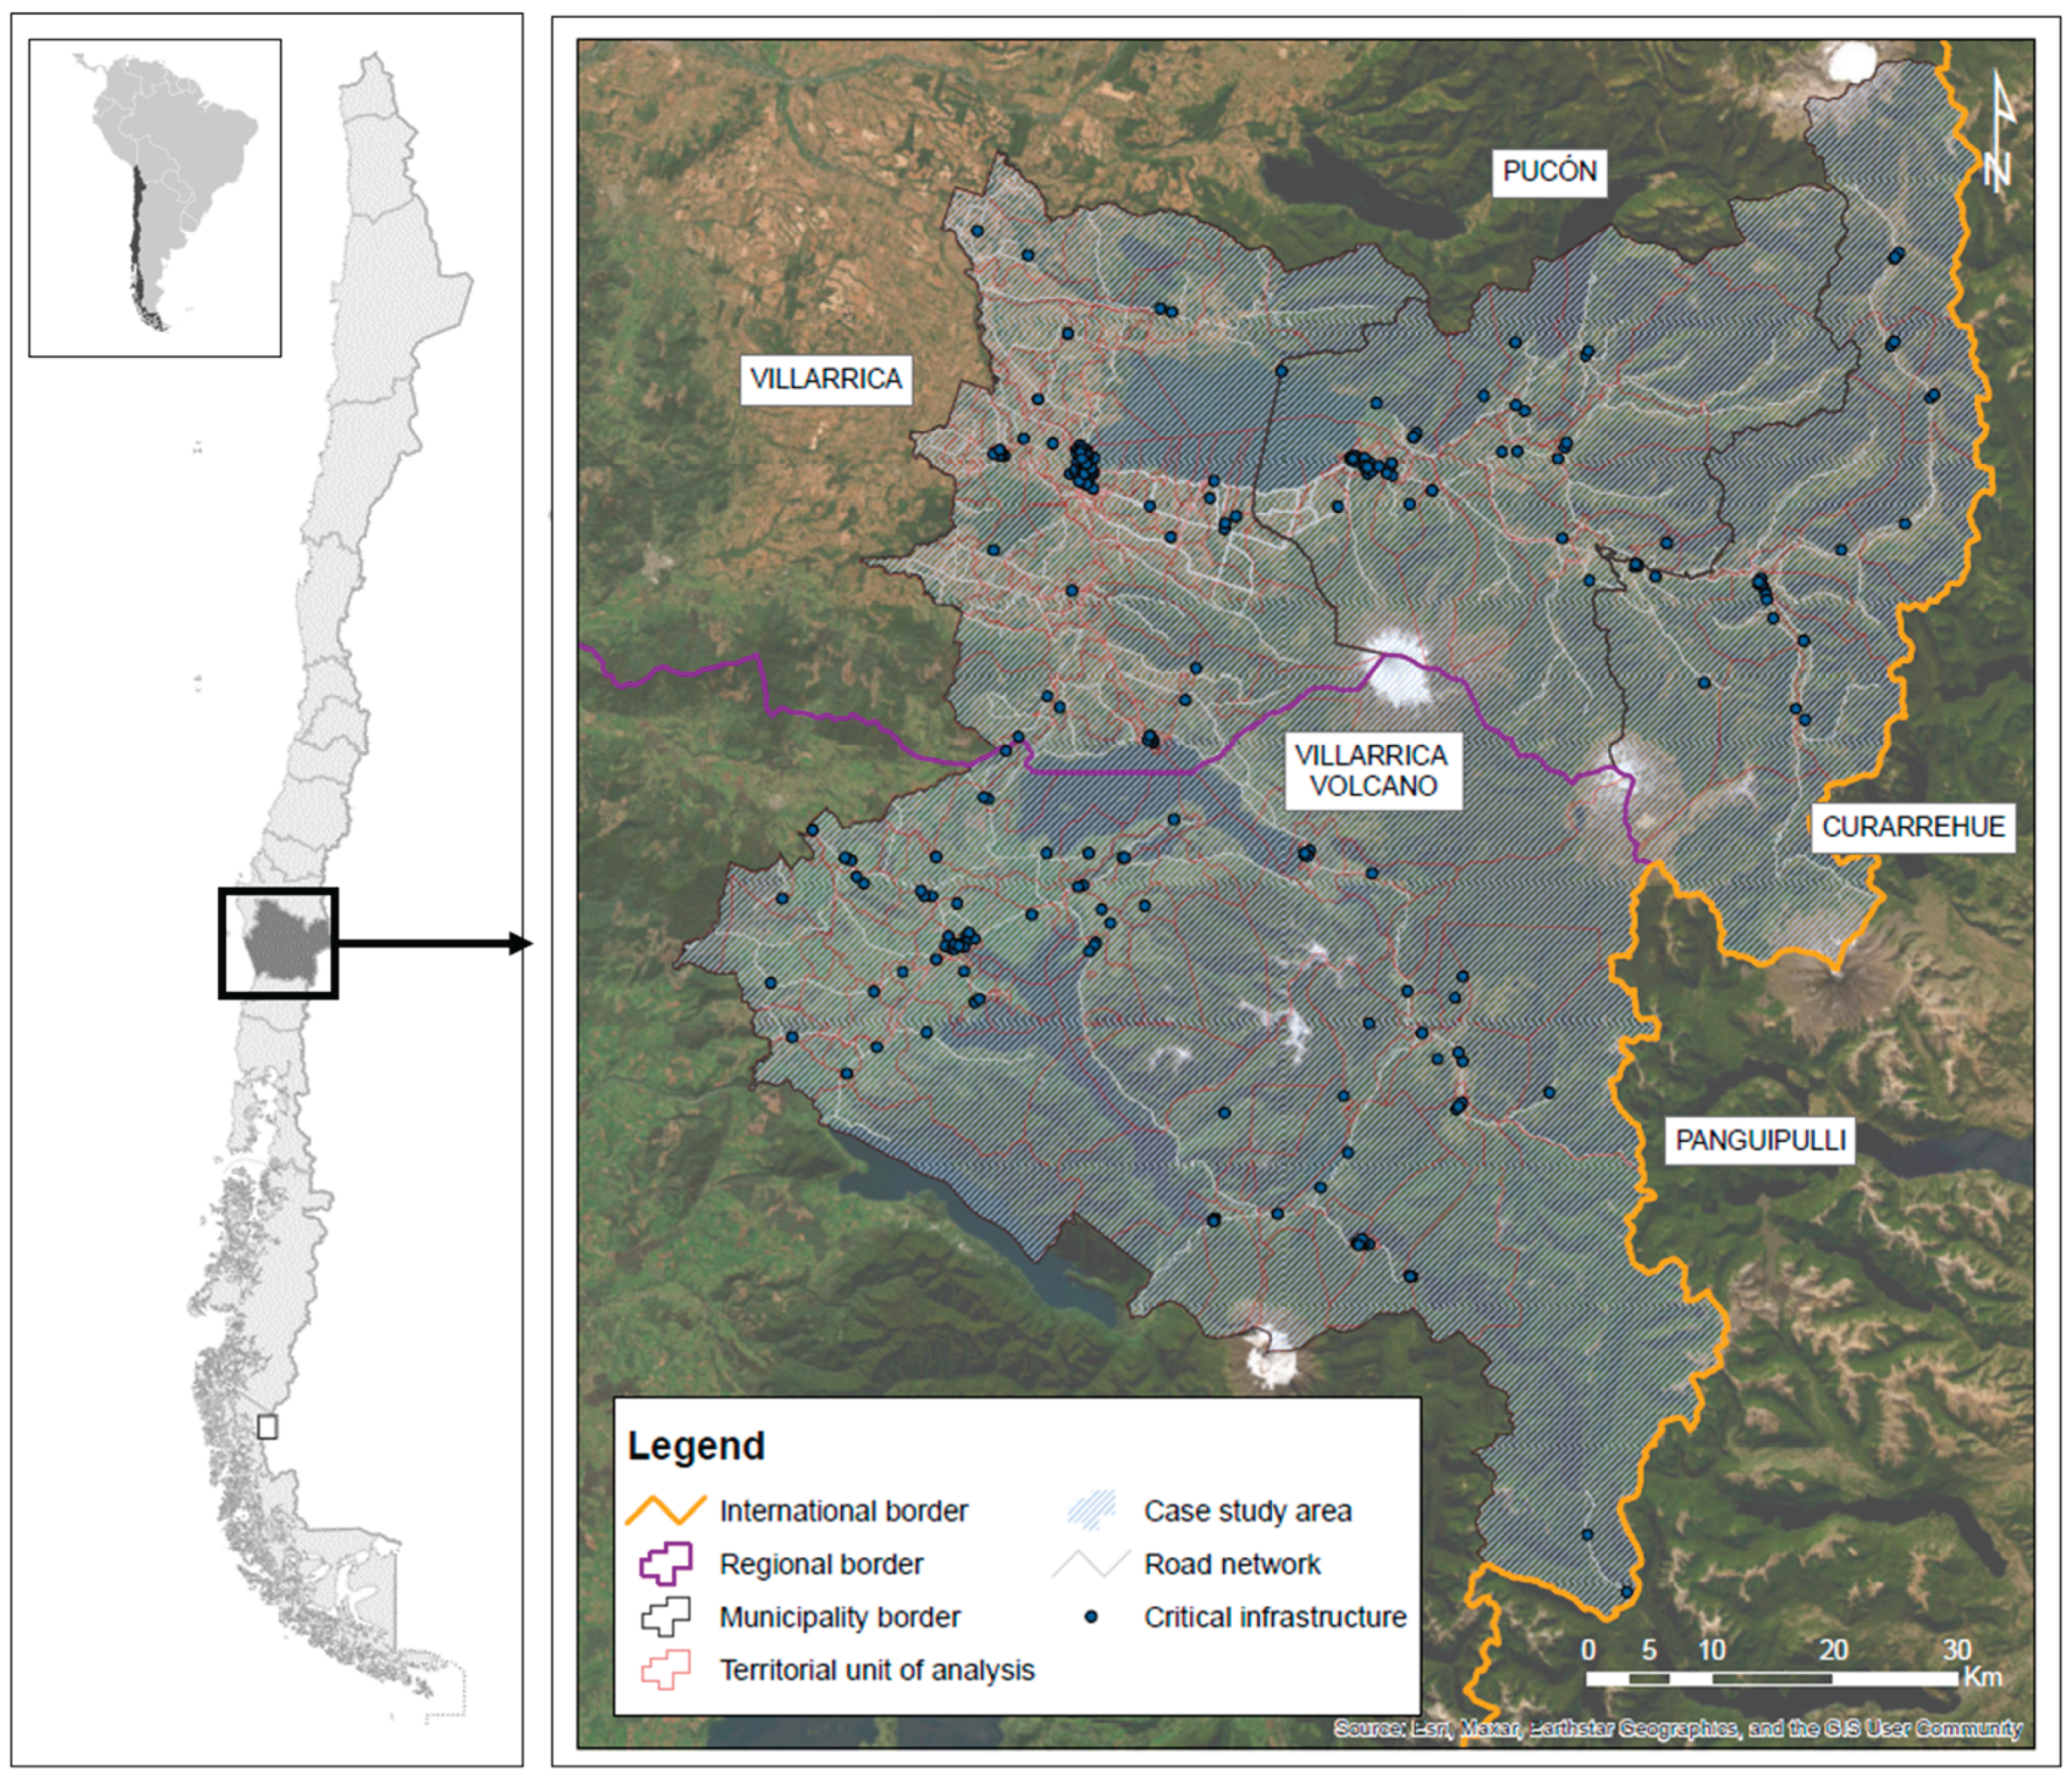
Figure 3.
Geographical representation of the Social Vulnerability Index for the case study.
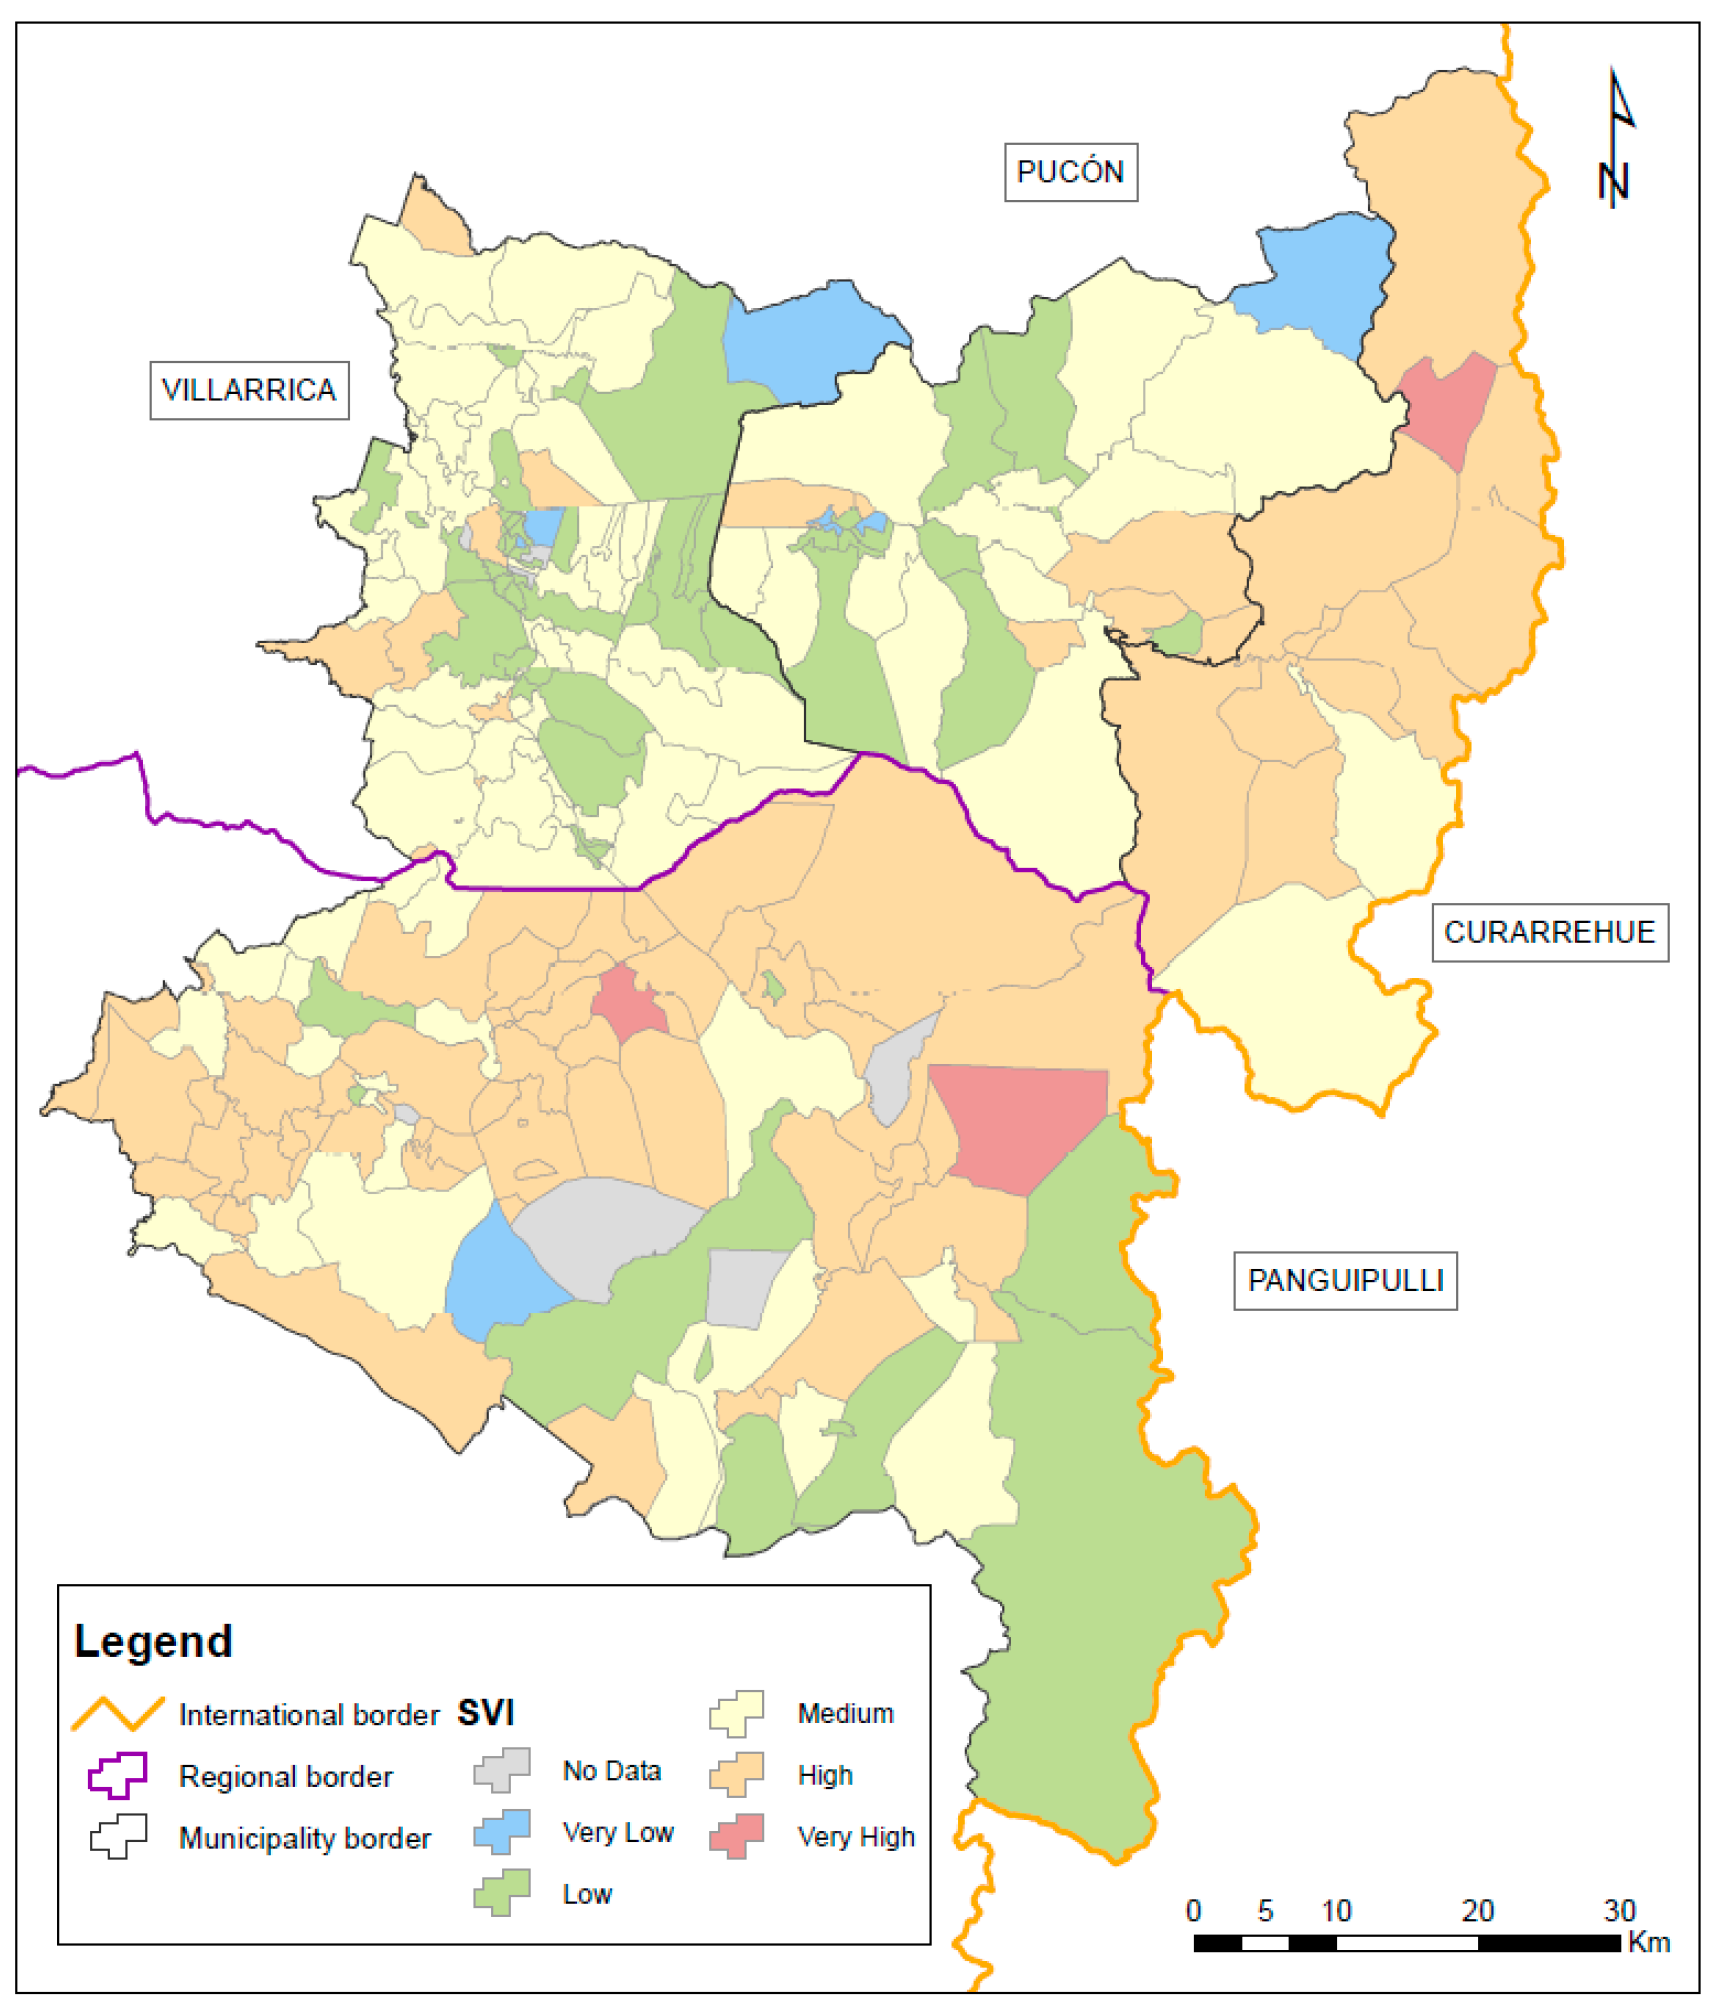
Figure 4.
Road network Importance Index (Iimp) of case study.
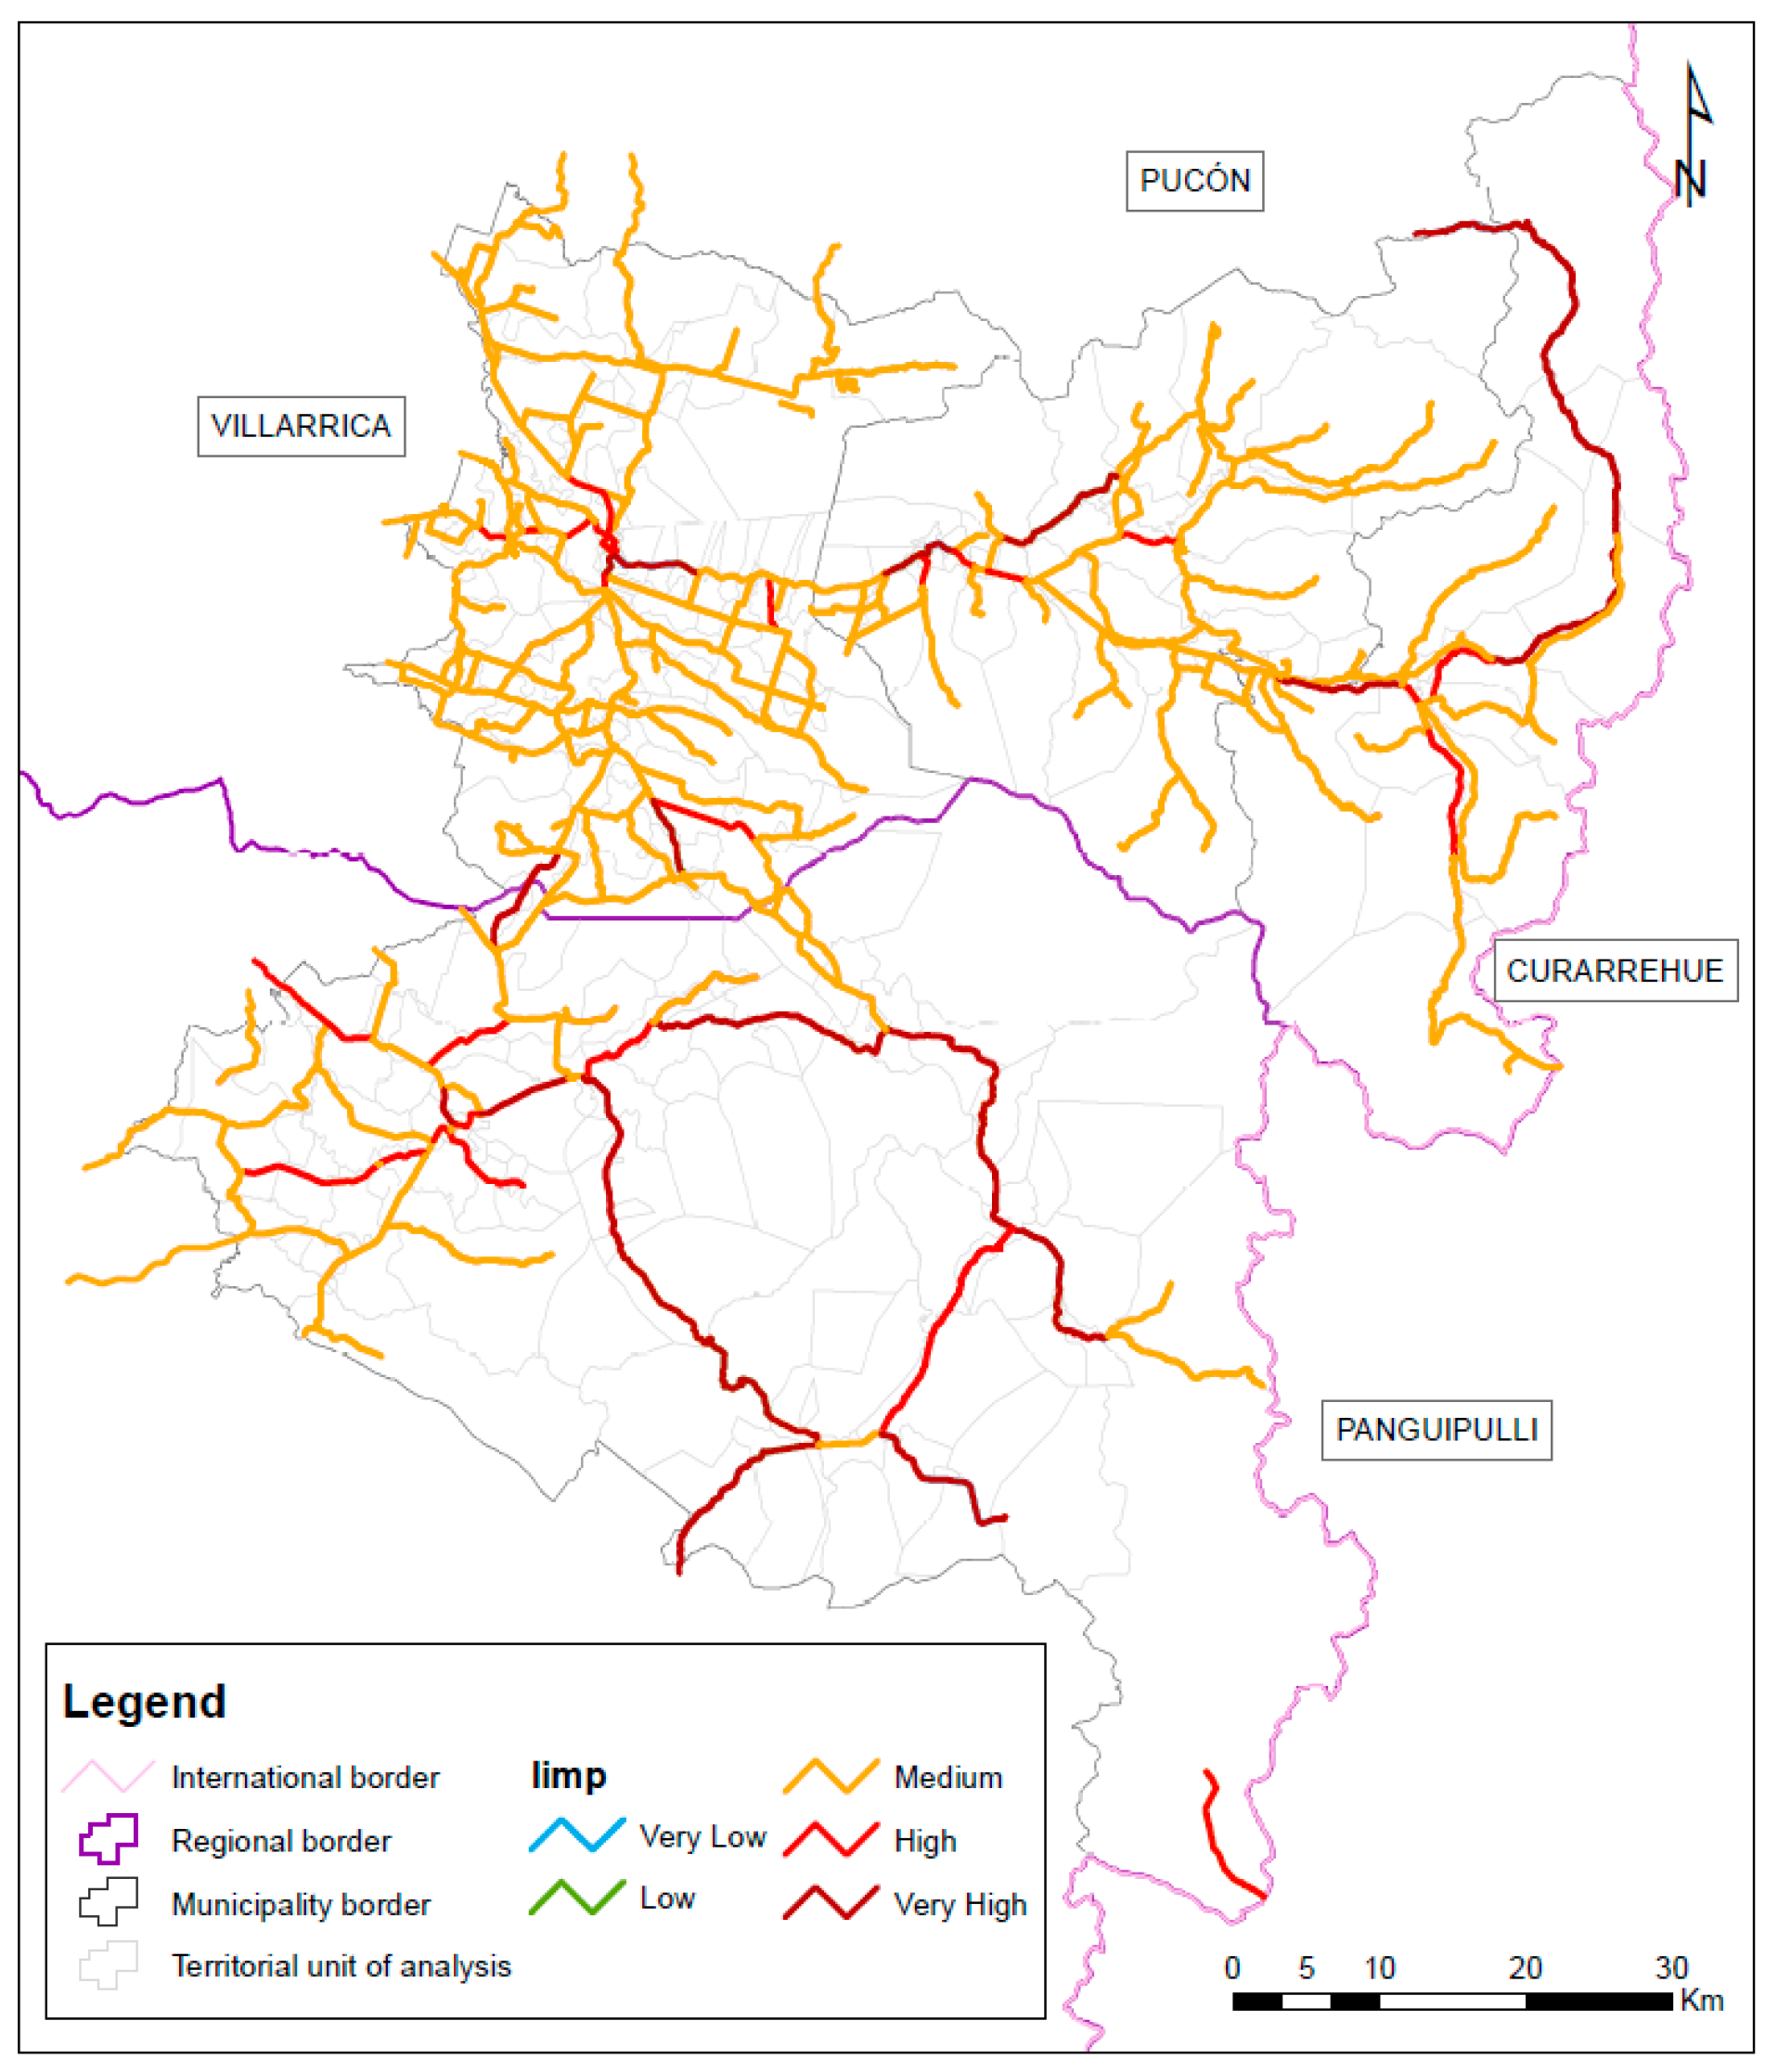
Figure 5.
Vulnerability Access Index.
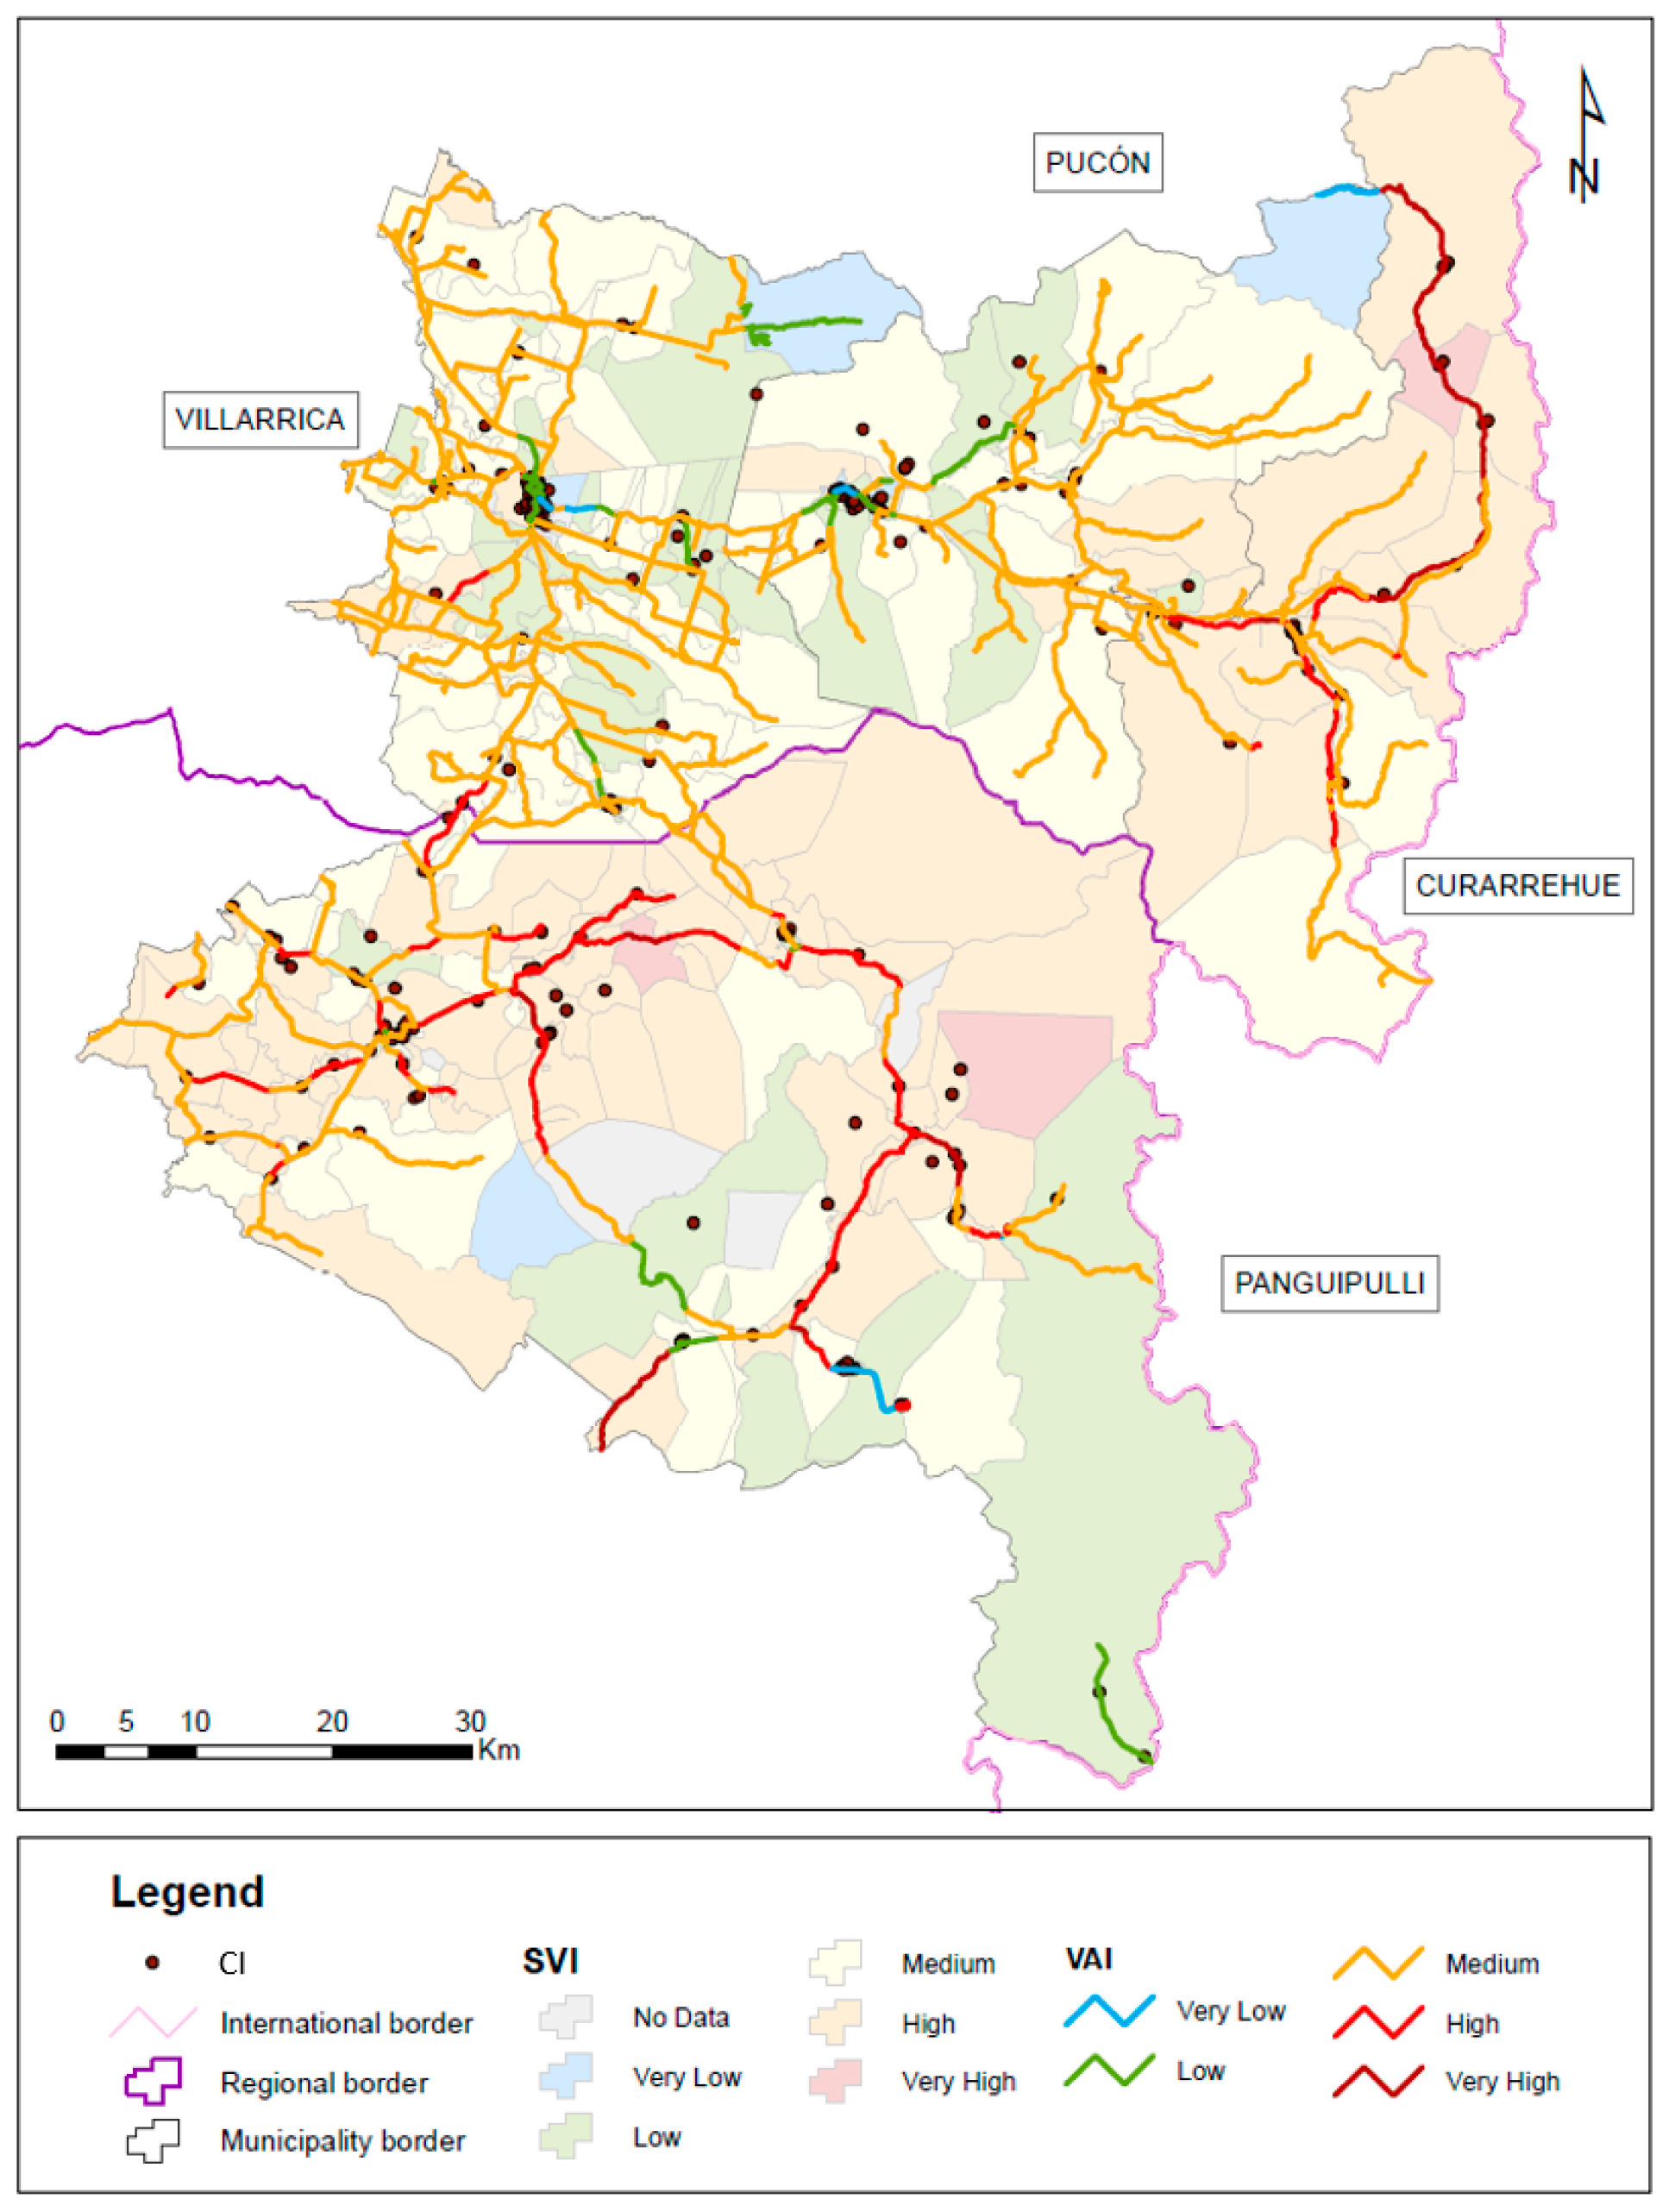
Figure 6.
Study area with zoom to the road network between the cities of Villarrica and Pucón affected by the lahars of the Villarrica volcano.
Figure 6.
Study area with zoom to the road network between the cities of Villarrica and Pucón affected by the lahars of the Villarrica volcano.
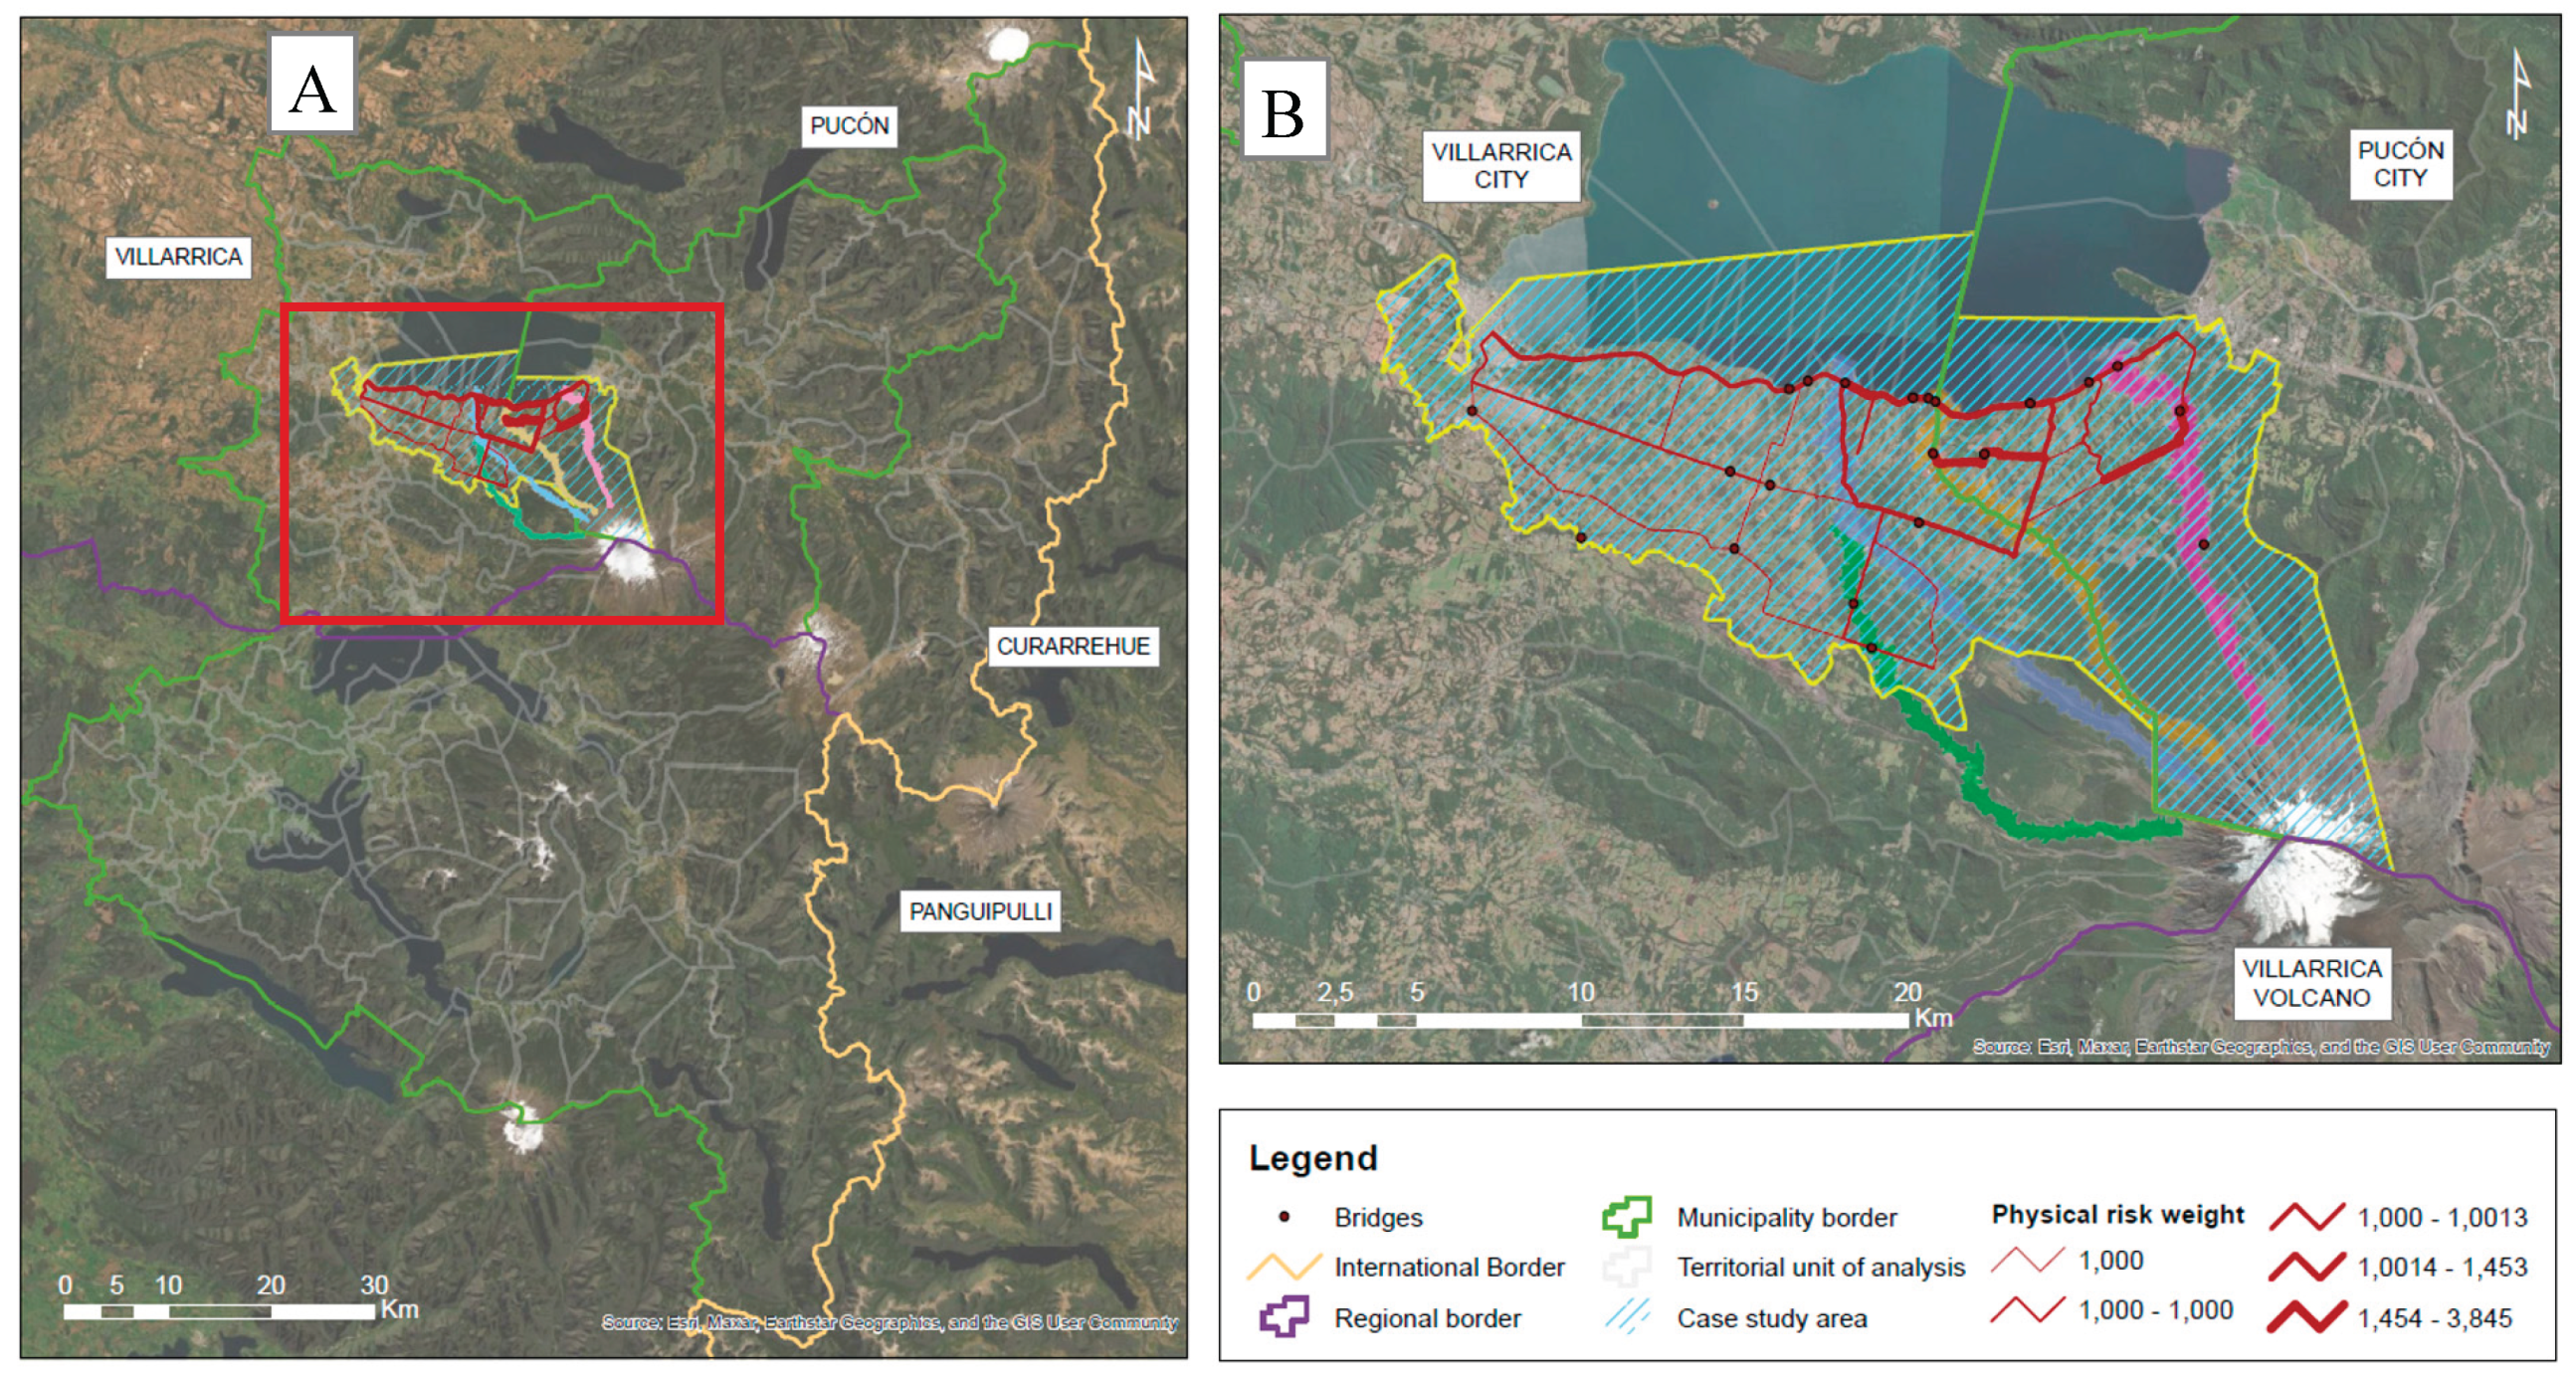
Figure 7.
Distribution of road link categories for Iimp and VAI, in percentages.
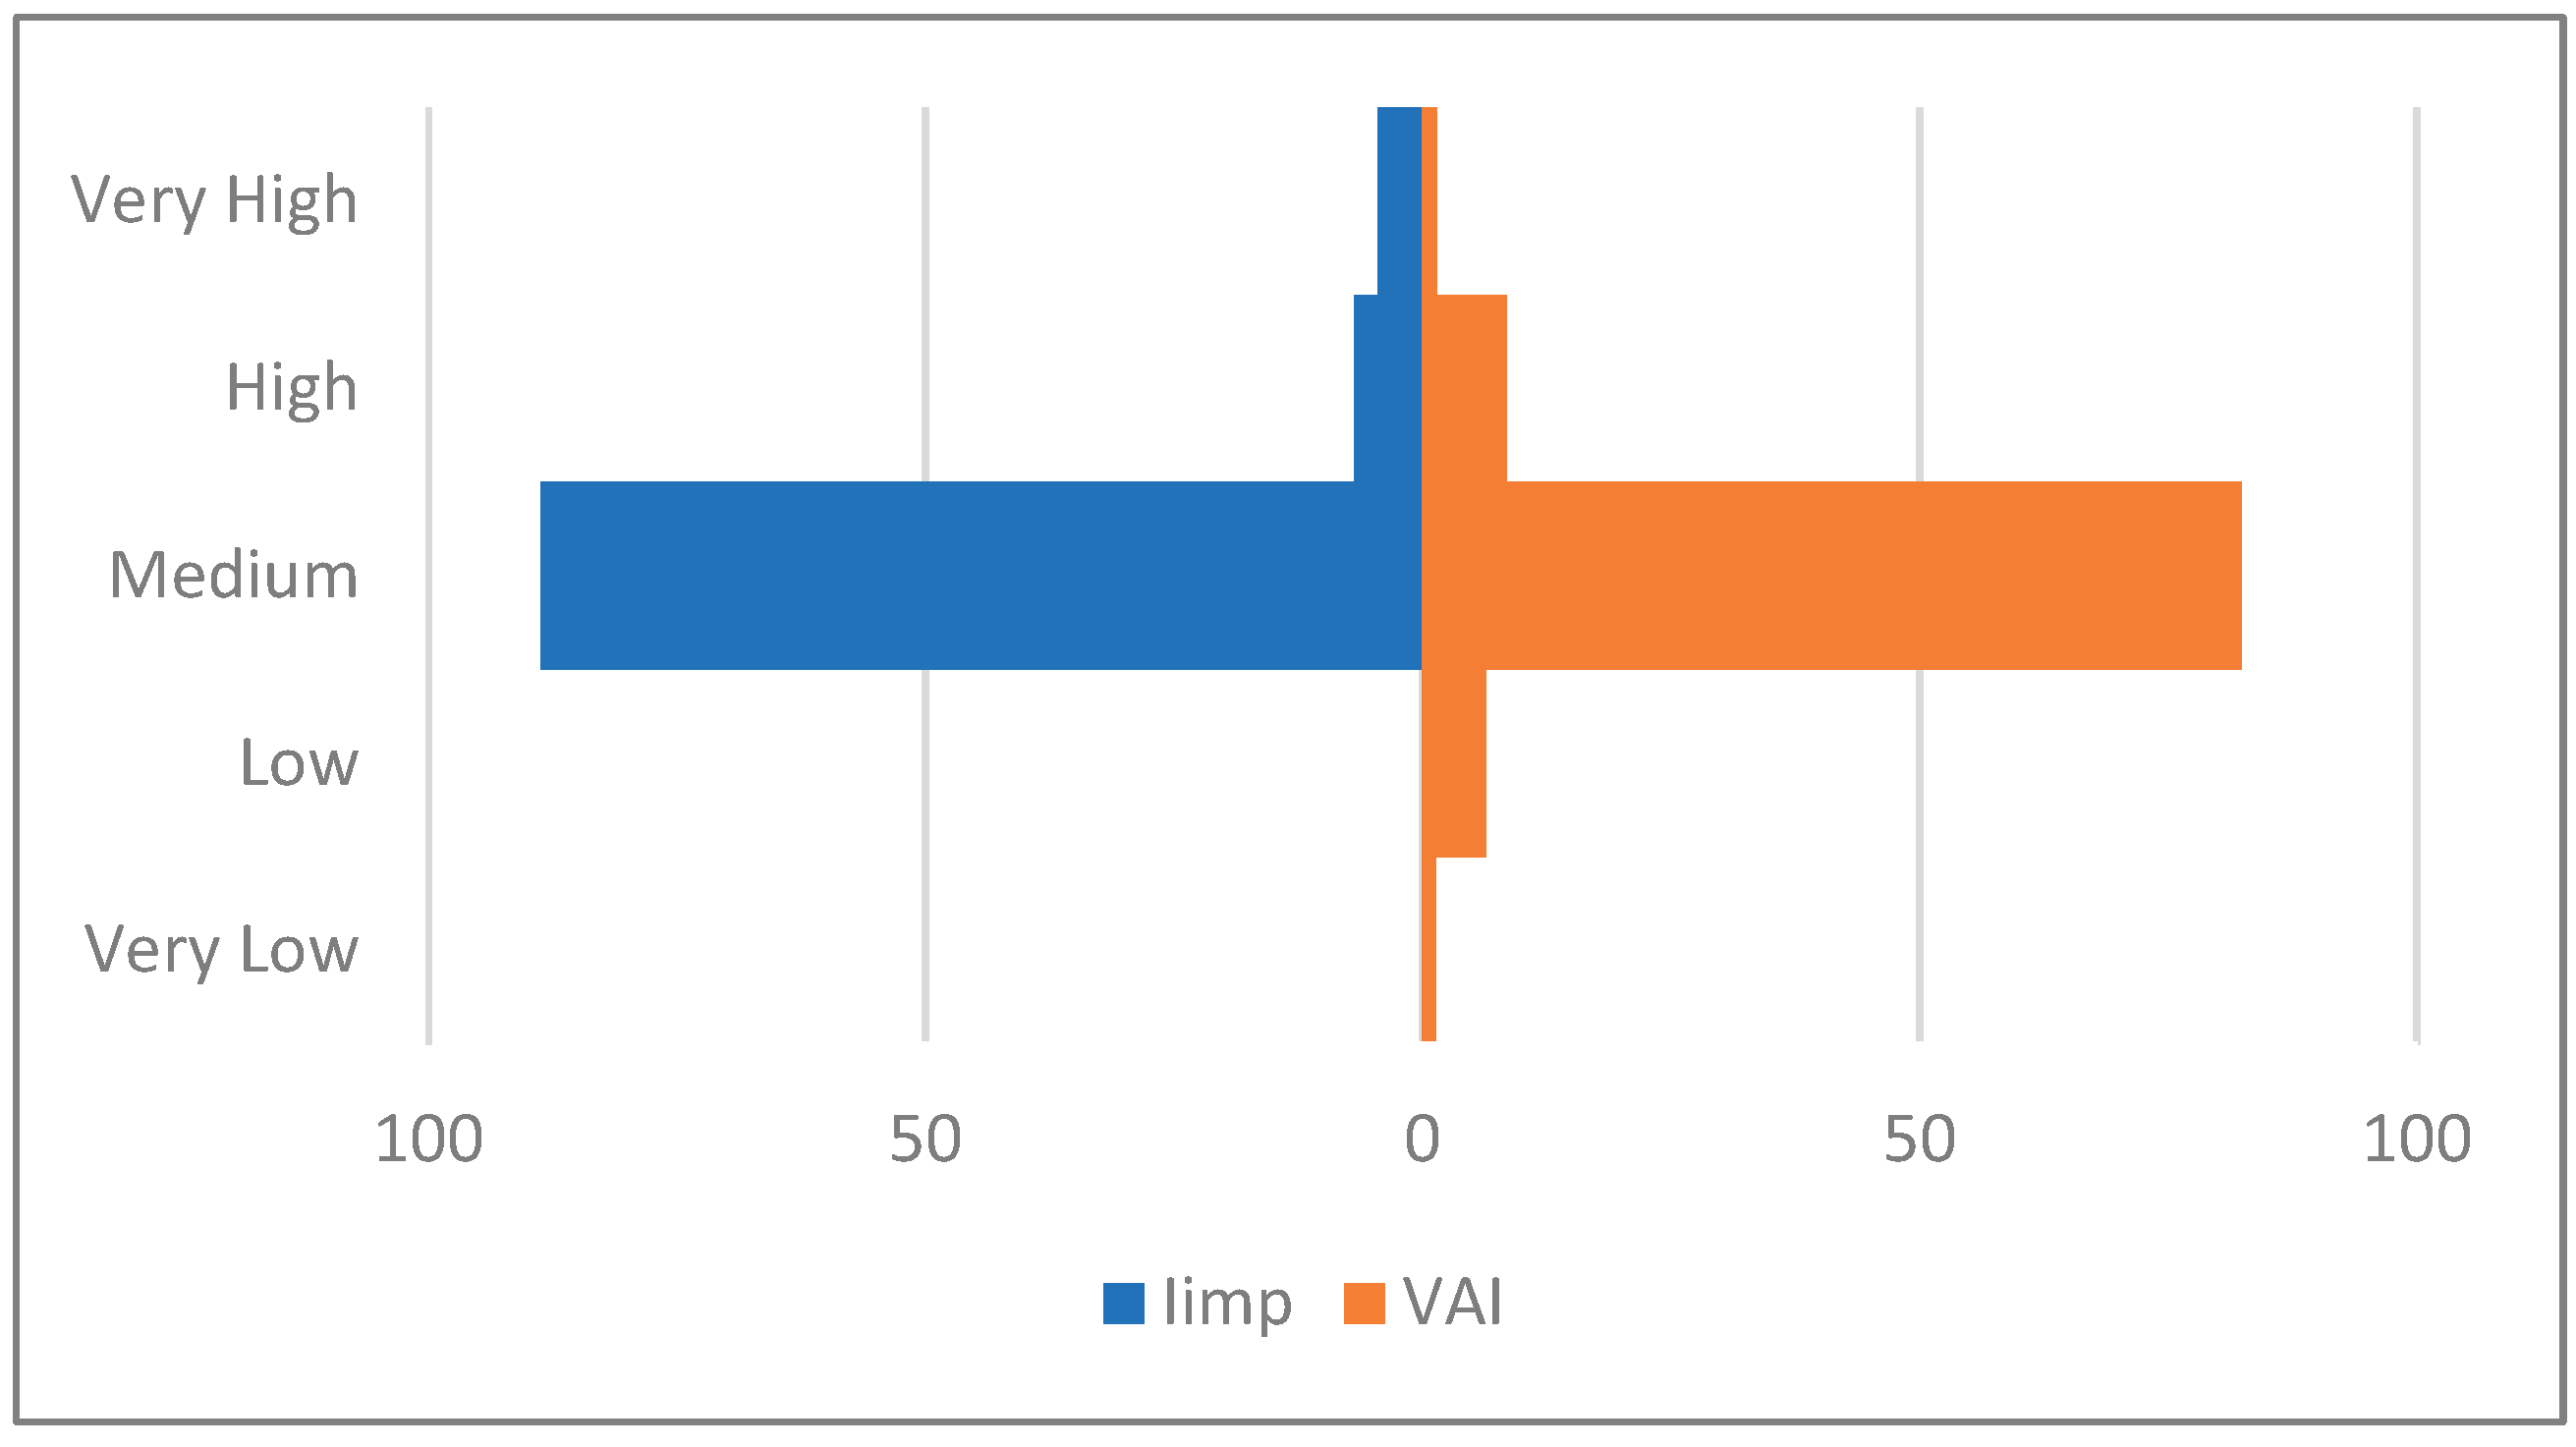
Figure 8.
Vulnerability Access Index: a) unweighted; b) weighted. In both figures, the green, blue, yellow, and magenta lines represent de lahar flows simulated.
Figure 8.
Vulnerability Access Index: a) unweighted; b) weighted. In both figures, the green, blue, yellow, and magenta lines represent de lahar flows simulated.
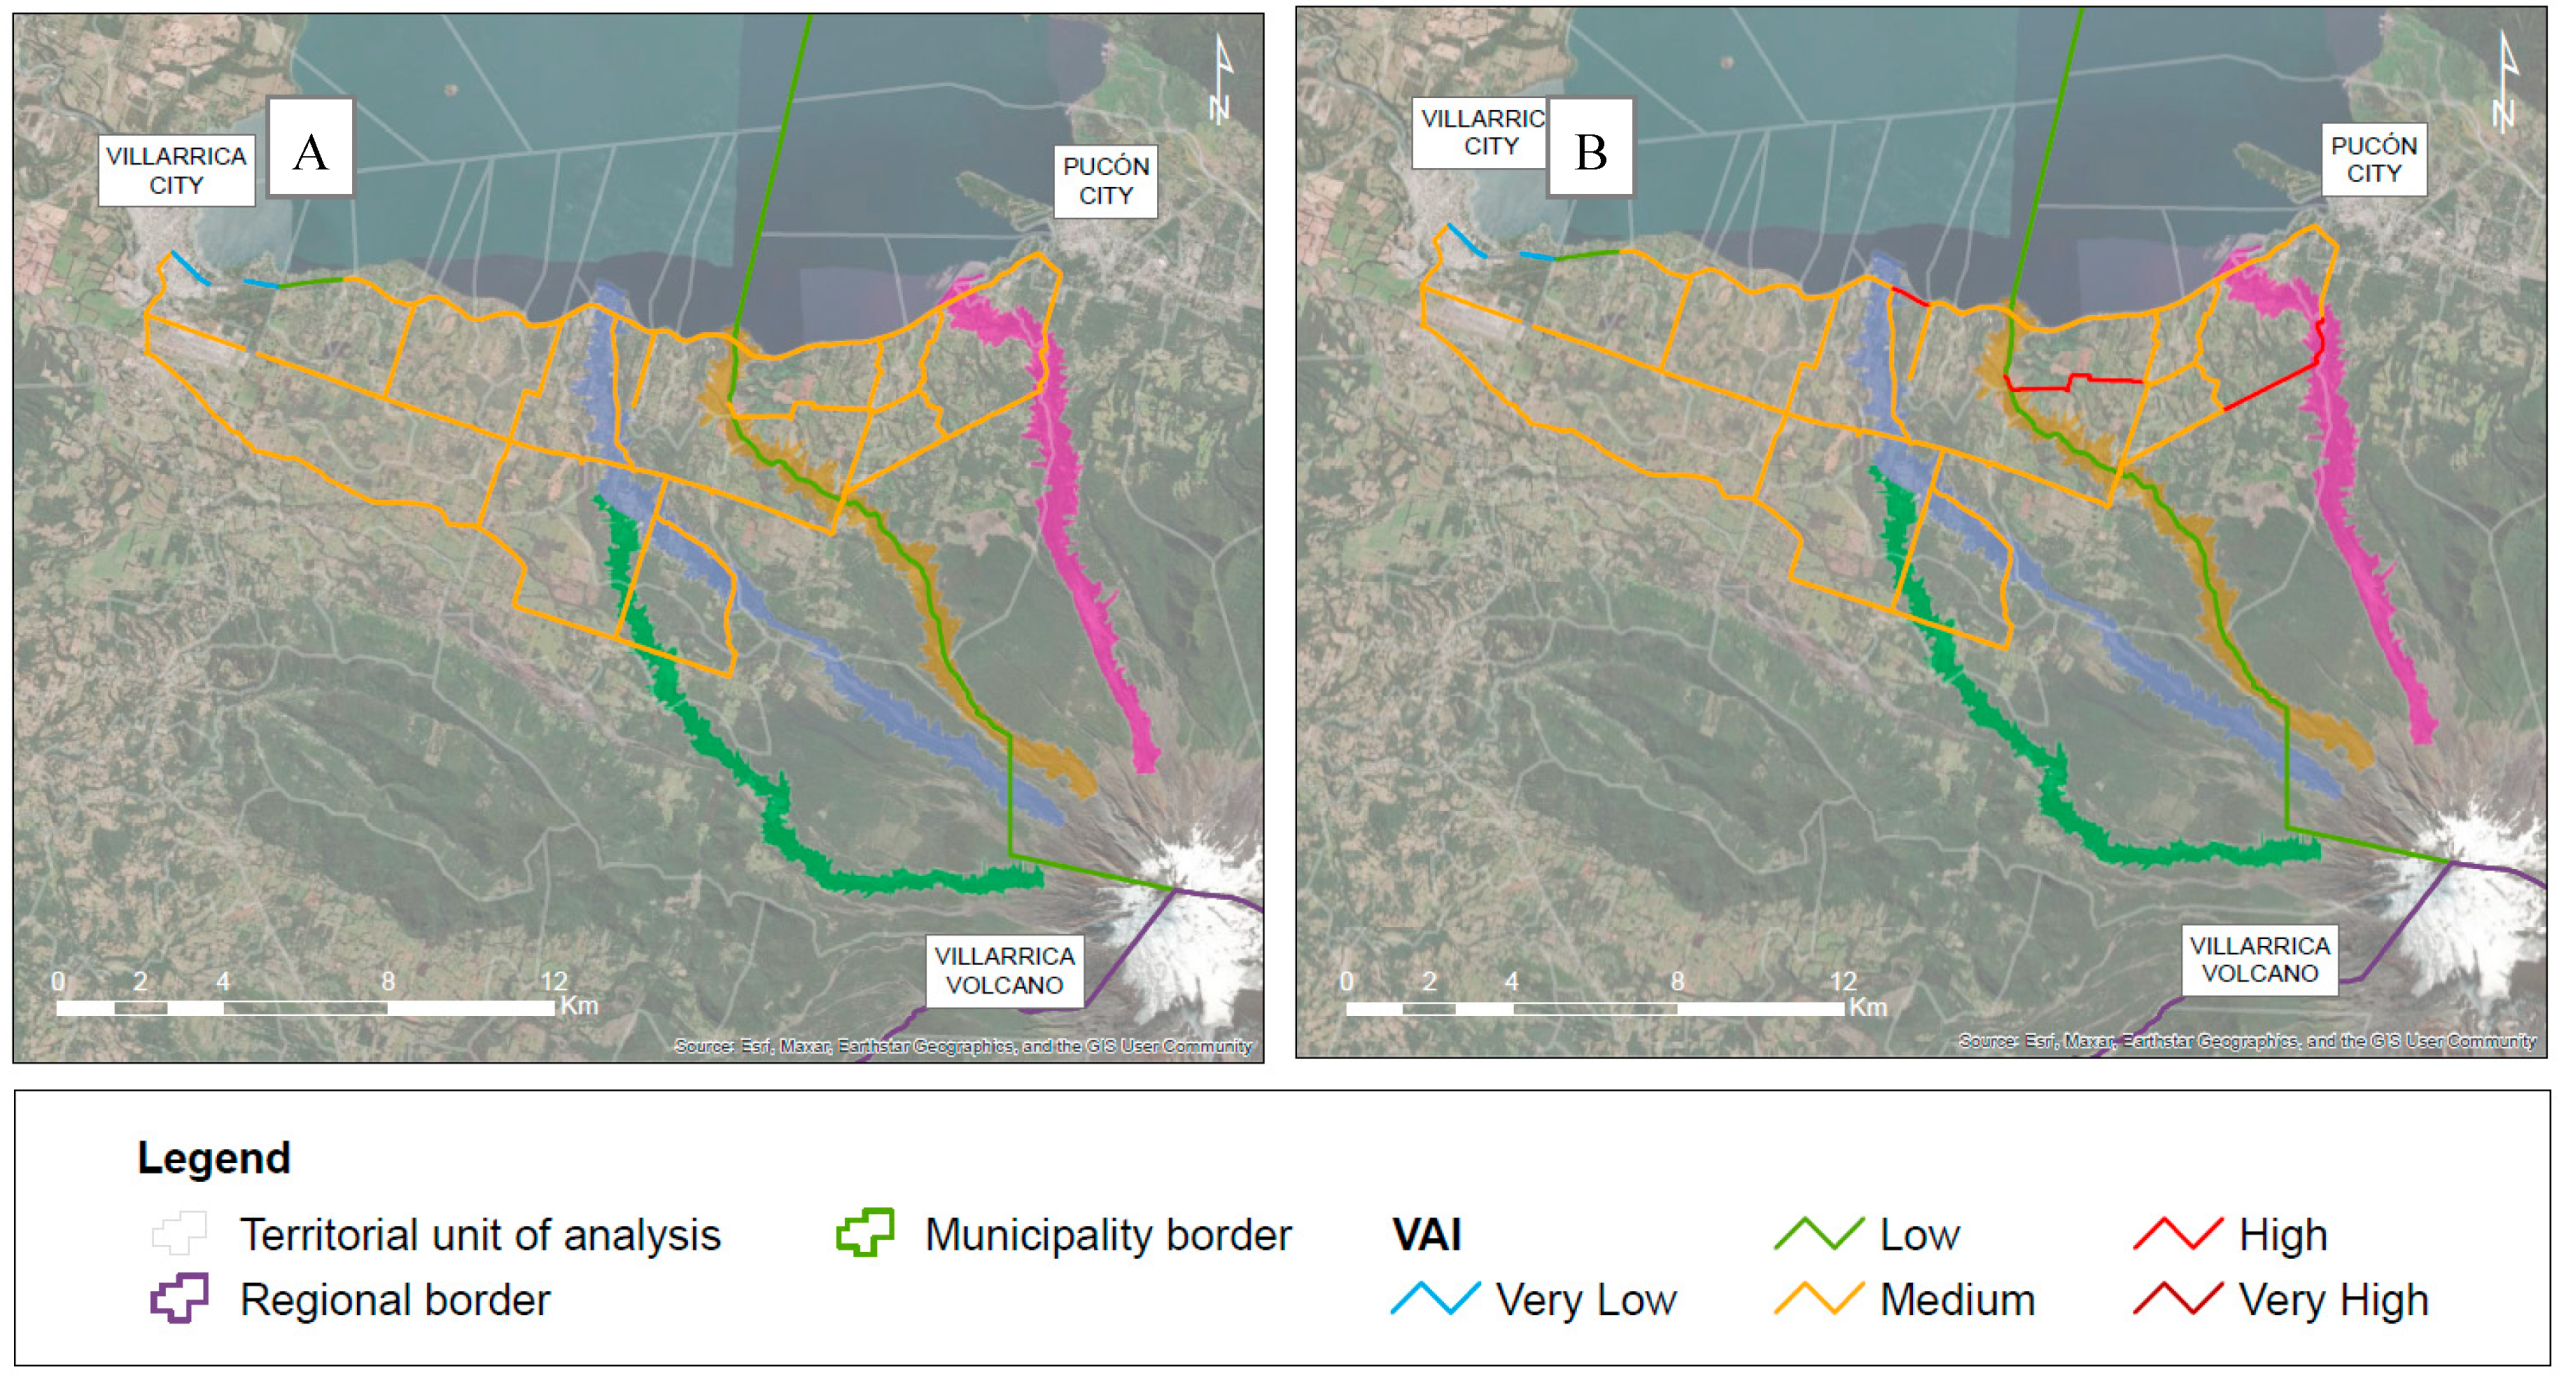

Table 1.
Variables of social vulnerability assessment: Case study.
| DIMENSION | VARIABLE |
| GENDER | % Women |
| AGE | % Population <=15 years |
| % Population >= 65 years | |
| MIGRATION | % Non-resident population in this municipality |
| EDUCATION | % Population w/o studies |
| % Population with primary education | |
| ETHNICITY | % Native Population |
| SOCIO-ECONOMIC STATUS | % Population in situation of multidimensional poverty |
| % Households with no support and social participation | |
| Total average income per capita of household | |
| EMPLOYMENT-OCCUPATION | Dependency Ratio |
| % Population Primary Sector | |
| % Population Secondary Sector | |
| % Non-active Population | |
| QUALITY OF BUILT ENVIRONMENT | % Non-recoverable Housing |
| % Housing w/o direct access to water* (w/o connection to public network or well) | |
| % Housing with medium or critical overcrowding | |
| CRITICAL INFRASTRUCTURE | Density of critical infrastructure and road network |
Table 2.
Summary of results by SVI categories in the case study.
| CATEGORY | VERY LOW | LOW | MEDIUM | HIGH | VERY HIGH | TOTAL | |
| SVI | N° of cases | 8 | 52 | 74 | 70 | 3 | 207 |
| % | 3.9% | 25.1% | 35.7% | 33.8% | 1.4% | 100% | |
| Iimp | N° of cases | 0 | 0 | 338 | 26 | 17 | 381 |
| % | 0.0% | 0.0% | 88.7% | 6.8% | 4.5% | 100% |
Disclaimer/Publisher’s Note: The statements, opinions and data contained in all publications are solely those of the individual author(s) and contributor(s) and not of MDPI and/or the editor(s). MDPI and/or the editor(s) disclaim responsibility for any injury to people or property resulting from any ideas, methods, instructions or products referred to in the content. |
© 2025 by the authors. Licensee MDPI, Basel, Switzerland. This article is an open access article distributed under the terms and conditions of the Creative Commons Attribution (CC BY) license (http://creativecommons.org/licenses/by/4.0/).
Copyright: This open access article is published under a Creative Commons CC BY 4.0 license, which permit the free download, distribution, and reuse, provided that the author and preprint are cited in any reuse.


