
Submitted:
03 May 2025
Posted:
06 May 2025
You are already at the latest version
Abstract
This study presents a method to rank transportation assets like roadways and bridges based on their criticality to the transportation system by systematically gathering stakeholder input on criticality criteria weights. Six criteria were used to estimate asset criticality. Then, the criteria are combined via stakeholder input using a weighted ranking scheme called the Analytical Hierarchy Process (AHP). The AHP produces an average ranking based on the priorities of varied experts (i.e., Analysts, Engineers, Planners, etc.) using a pairwise rating system implemented as an online survey. Thirty complete surveys were collected (13.2% response rate) with resulting ranks from highest to lowest priority as: Annual Average Daily Traffic (AADT), redundancy, freight output, roadway classification, Social Vulnerability (SoVI), and tourism. The stability of the criteria ranking to sample size was established with 15 samples. Using this approach, a state-wide vulnerability and/or resiliency assessment can consider multiple stakeholders’ perspectives within a single, consistent criticality metric.
Keywords:
asset criticality
; Analytical Hierarchy Process
; transportation resilience
; multi criteria analysis
1. Introduction
Research on the resiliency, connectivity, criticality, vulnerability, and disruption of transportation networks has notably increased over the years [1,2], partly as a result of an increased frequency of significant natural and human-made disasters. Examples in the US include rockslides on Interstate 40 (I-40) from 2009-2010 with clean-up cost of $2-10 million, Hurricane Katrina in 2008 costing $170 billion in economic damages, and Superstorm Sandy (2012) causing nearly $70 billion in damages. Mobility, safety, and the economy are all impacted by these long and short-term disruptions to the transportation system. The transportation system is crucial to the functioning of other key US infrastructure sectors such as emergency services, food and agriculture, healthcare, public health, and manufacturing.
Resiliency, as defined by the National Academy of Sciences, is “the ability to prepare and plan for, absorb, recover from, and more successfully adapt to adverse events.” Transportation network resilience refers to the capability of networks to continue operating during disruptions and recover to normalcy from such disruptions [3]. The initial stage in resiliency assessment is determining asset criticality. A network component's (links) criticality is determined by both its likelihood of malfunctioning and the impact of that malfunction on the system. The severity of the system's damage when a component is lost increases with the component's criticality [4]. Criticality, therefore, is the measure of an infrastructure asset's importance to the system's resilience, defined by the cost to users, owners, and society resulting from a loss in functionality [5,6]. Designing reliable and resilient systems requires the identification of critical components of transportation systems [5]. The analysis of the performance of the transportation network under possible disruptions heavily relies on the identification of critical links, assisting practitioners and policy makers in mitigating impacts, prioritizing projects, and enhancing system resiliency [6]. This makes this topic an area of interest to federal, state, local, and private transportation authorities.
Numerous studies have explored and implemented different multi-criteria criticality assessment methods. For example, the Connecticut DOT resiliency pilot study quantified criticality using metrics such as Average Daily Traffic (ADT), accident count, and flood zone, with subjective stakeholder input. The study ranked structures as low, moderate, or critical based on their combined values of each factor [9]. Similarly, the Colorado DOT I-70 resiliency study employed an equal weighting approach to rank assets based on six quantitative criticality metrics, which included Annual Average Daily Traffic (AADT), roadway classification, freight, tourism, social vulnerability, and redundancy [5]. The equal-weighted approach assumes that each criterion receives equal consideration and weight in assessing link criticality. However, this approach may not always reflect a stakeholder group’s varied and, sometimes, competing priorities. An unequal weighting approach, on the other hand, assigns different weights to each criterion such that the weight follows from the individual and collective priorities of the stakeholder group.
For the criticality assessment proposed in this paper, we adopt a multi-criteria criticality estimation using an unequal weighting approach. Specifically, we reference the six criticality assessment metrics outlined in the CDOT I-70 resiliency study [5] to estimate the criticality of a statewide highway transportation system. We expand the CDOT approach by introducing an Analytical Hierarchy Process (AHP) to estimate a combined criticality metric based on a weighted average of the six criteria with weights informed by stakeholders. It is important to note that although we adopt CDOT's six-criticality metrics, the AHP method exemplified in this paper can be applied to any criteria set, thus we present a flexible approach suitable for various contexts.
AHP is a multi-criteria decision-making approach in which factors (criterion) are arranged in a hierarchical (ranked) structure. AHP is popular because of its ability to reflect people’s thinking and judgments by simplifying complex decisions into pairwise comparisons [10]. The aim of this paper is (1) to develop a data-driven and repeatable framework for measuring the criticality of statewide transportation system assets based on a set of criticality criteria and stakeholder input and (2) determine unequal weights and ranking of each criticality assessment metric for the set of six criteria explored in this paper using the AHP.
2. Literature Review
2.1. Criticality Metrics
Measures of reliability, vulnerability, robustness, resilience, importance, and criticality have been proposed to assess the impact of a transportation asset to system performance [8]. In particular, criticality has seen increasing popularity in research and practice [5,7,11,12,13,14,15,16,17,18,19,20,21,22,23,24]. The more critical the asset, the more severe the impact to the system when that asset is non-operational [14].
Criticality metrics can be classified into topological or performance based methods. Topological methods consider graph theory-based characteristics like connectivity, accessibility, maximal flow, etc. which require less data and are computationally more efficient than performance-based measures. Performance-based methods investigate variations in traffic flow (travel time, volume) caused by changes in supply and demand but can be computationally expensive for large networks due to the iterative nature of calculations [7]. Examples of topological measures include Betweenness-Centrality (BC) [7], the Link Criticality Index (LCI) [11], the Travel-Time Weighted Betweenness-Centrality (TTWBC) [7], Practice-Friendly Link Criticality Index (PFLCI) [11], and the Efficiency Index (EI) [12]. A common performance-based method for determining link criticality is to run a network scan. This can be done using the Network Robustness Index (NRI), a traffic assignment-based approach that calculates criticality based on changes in total travel time of the network before and after link failures [1]. With NRI there is a risk of creating disconnected networks when omitting links, making it impossible to estimate the system-wide impact of link failure on travel time. To address this, the Important Score (IS) was established [3,4,5].
However, methods that rely solely on vehicle- or network-based metrics like those discussed in the paragraph above may fail to capture broader impacts of disruptions [21]. To address this, multi-criteria metrics are introduced [21]. One example application used three factors to prioritize links and allocate resources for retrofitting, maintenance, and security purposes [18]. The first factor uses the link volume, the second uses the spatial location of important facilities served by the links, and the third uses the number of origin-destination pairs served by a link based on network characteristics [21]. Another flexible and robust multi-criteria approach consisted of sixteen critical metrics such as food, medicine, mobility, goods and material access, fuel and energy access, and emergency response [25].
As a starting point for this paper, we adopt the Colorado DOT (CDOT) multi-criteria analysis for criticality assessment [5]. Six criteria were used to estimate link criticality: AADT, roadway classification, freight, tourism, social vulnerability via the Social Vulnerability Index (SoVI), and redundancy (Table 1) [5]. These criteria reflect environmental, social, and economic impacts, capture impacts across multiple modes (vehicle and truck/freight), economic sectors (freight, tourism), and population sectors (vulnerable groups) [26].
The criteria are described as follows and represent a mix of roadway link level and county level estimates. AADT is a basic measurement that indicates the average traffic volume for a location along a roadway throughout the year. It is a crucial parameter for transportation planning and funding allocation [28]. Roadway classification defines a roadway segment's role in serving traffic flow through the network. Each functional class is based on the type of service the road provides to the motoring public with a range of allowable lane widths, shoulder widths, curve radii, etc. [27]. Freight value is expressed as the total value of imports and exports by county estimated by such means as the national freight travel demand model called the Freight Analysis Framework Version 4 (FAF4) or other statewide freight-based travel demand models or surveys. Tourism represents the total expenditure on tourism in the county for a given year. SoVI is a computed, comparative index comprised of 29 socio-demographic variables among eight categories and represents a region’s level of social vulnerability [29]. The eight categories grouped in the model include wealth, race (black) and social status, age, ethnicity and lack of health insurance, special needs populations, service sector employment, race (Native American), and gender (female). A score greater than 1.5 standard deviations above the mean (positive) indicates high social vulnerability, while a score below 1.5 standard deviations of the mean (negative) indicates low vulnerability. The redundancy metric captures the system-wide increase in travel time resulting from a complete link closure. Links that increase system-wide travel time when closed are more critical than links that cause only a minimal change. This is considered a measure of redundancy based on the availability of alternate routes of similar distance and travel time. However, a link with a few or longer alternate routes would have a higher impact on the overall system travel time. CDOT's redundancy metric was suitable for corridor-level analysis, so a new metric was developed for this study to fit state-wide analysis. The redundancy metric used is an example of a performance-based metric described above, specifically a modified NRI [27].
As noted, measures of AADT, Roadway Classification, and redundancy can be attributed to a link, as these are link-level measures. On the other hand, freight value, tourism, and SoVI are applied as county-level metrics. To bring all measures to a common spatial dimension, namely link level measures, all roadway links in a county are assigned the same value corresponding to the county in which they are located. While county aggregation was used in this paper, any sub-region geography could be used.
The multi-criteria for the CDOT approach are combined via equal weighting, e.g., unweighted average. In some contexts, certain criteria may be more important such as when viewed by professionally diverse stakeholder groups. Thus, an unequal weighting approach can be introduced.
2.2. Analytical Hierarchy Process
AHP is one of the more powerful and commonly used types of multiple-criteria decision analysis (MCDA) in which conflicting and complex factors are placed in a hierarchical (ranked) structure [30]. In the context of this paper, it is used as an unequal weighting approach to compute the criticality of a link by estimating differing weights to each criterion such that the weights reflect the priorities of the decision-makers and stakeholders. The different weights indicate the relative importance of each criterion [31]. Through pairwise comparisons, the AHP generates a reciprocal decision matrix by allowing the evaluator to compare only two criteria at a time. Compared to weighting by ranking (ranking the criteria directly by relative importance), which loses explanatory power as the number of criteria increases, the AHP method provides a consistent and effective approach for prioritizing and ranking criteria. The final output of AHP is a prioritized ranking and set of weights that shows the relative importance of each alternative.
Several example applications of AHP in transportation engineering are discussed in this section to give a basis for its selected use in this paper. The AHP was employed as a decision-support model for contractor selection [32]. This study utilized the AHP model to discover the best contractor based on factors beyond just the lowest bid. In a comparative study, the AHP was used for the selection of an appropriate intersection design among five design alternatives: a roundabout, signalization without left turn bay, signalization with left turn bay, and a grade-separated alternative [33]. Eight traffic engineers ranked the five types based on five design criteria: traffic safety, construction cost, average delay, CO emissions, and fuel consumption. [34] used AHP to analyze solid waste disposal's environmental impacts and identify the best management option. The study assessed stakeholders' opinions and judgments, including residents and institutional workers, to determine the most suitable waste disposal option.
3. Methodology
The main objective of this study is to develop criteria weights for transportation asset criticality metrics based on unequal weights using AHP. To apply an AHP model, the following steps were followed:
- Define the hierarchical structure consisting of the goal and criteria,
- Collect the input data by pairwise comparisons of criteria through survey,
- Calculate consistency ratios from the individuals’ set of judgments and individual priorities for each set of pairwise comparison, and
- Compute the overall criteria weights by aggregation of individual priorities (AIP).
3.1. Hierarchical Framework and Definitions
The hierarchy captures the relationship between the overall goal and criteria. The final hierarchy developed for this work defines the goal as “measuring the criticality of highway system assets” and each of the measurements, e.g., AADT, roadway classification, etc., as the criteria (Figure 1).
3.2. Input Data Collection via Online Survey
An online survey to gather criteria weights was implemented using a commercial online survey platform. This method was preferred over other traditional methods like paper, telephone, and mail surveys as it provides a user-friendly interface to visually adjust and complete the pairwise comparisons, provides real-time access to results, thereby reducing costs, and, lastly, allows for a broad sample as participation is not limited by costs of mailing as is the case with paper based surveys or researcher time commitments and bias as is the case with interviews [35].
3.3. Survey Sample Size
Two factors determine the sample size for the survey: consistency of judgements and their validity in practice [36]. The number of experts (sample size) varies by application: eight traffic engineers participated in a study to select an intersection design type [33]; 48 experts from academic institutions, city agencies, and mobility service providers completed the weighting process of different criteria and indicators for social sustainability assessment of mobility services [37]; 191 healthcare professionals responded to an investigation of risk factors for preventing falls [38]. To evaluate the criticality of highway transportation assets using multiple criteria, a diverse group of experts with specific knowledge in transportation is needed and served as the sample frame [39].
Convenience (non-probability) sampling was used to gather a total of 227 experts in the US via email solicitation through professional organization listservs, committee membership rosters, online professional networking (e.g., LinkedIn), and public agency directories. The sample was categorized into three demographics based on profession, practice area, and agency. Profession refers to the respondent's role in their organization (i.e., analysts, engineers, planners, consultants, inspectors, managers, office specialists, project coordinators, supervisors, surveyors, and researchers) while practice area identifies their area of expertise (i.e., asset management, construction, emergency and response, maintenance, operations, planning, engineering, system information and research, policy, and survey) and agency indicates their place of employment (i.e., state and federal Departments of Transportation (DOTs), state, local and regional governmental transportation agencies, private engineering consulting firms, and academic institutions).
3.4. Survey Questionnaire
The survey questions asked participants to compare the relative importance of the six criteria with respect to the overall goal and report their judgments as pairwise comparisons using a numerical scale called the Fundamental Scale for Paired Comparisons [30] (Table 2). With six criteria to compare, the respondent must make 15 comparisons (15 questions).
The questions are presented in our online survey platform using a sliding bar scale, with the criteria labeled on the rightmost and leftmost edges of the bar and centered at zero with values in between (Figure 2). The survey instructions define each criterion and provide a simple example using pairwise comparisons of oranges, grapes, and mangoes accompanied by descriptions of comparison consistency and logic.
3.5. Consistency Ratio Calculations
Pairwise comparisons can result in inconsistent rankings of criteria [40]. For example, they may report that AADT is more important than tourism, tourism is more important than freight value, but that freight value is more important than AADT (AADT should be more important than freight value in this example). Thus, the Consistency Ratio (CR) is used to estimate the consistencies of each individual set of judgments to rule out inconsistent logic [41]:
where:
- CI is the Consistency Index calculated as .
- is the largest principal eigenvalue of a positive reciprocal pairwise comparison matrix of size (number of criteria).
3.6. Criteria Weights
Three approaches can be used to aggregate judgements: (1) synthesizing each of the individual’s hierarchies and aggregating the resulting priorities, referred to as Aggregating Individual Priorities (AIP); (2) aggregating the individual judgements for each set of pairwise comparisons into an “aggregate hierarchy”, referred to as Aggregating Individual Judgements (AIJ) and (3) aggregating the individual’s derived priorities in each node in the hierarchy. Although AHP can handle the third method, it is less relevant and is not commonly used. Thus, the AIP and AIJ methods are used in this study. AIP is used when individuals are acting in their own right, with different value systems, and the concern is about the resulting alternative priorities [44]. Using the AIP approach, we can analyze how respondents ranked each criterion, illuminating varied rankings, expertise, and priorities. Ultimately, this approach allows for the computation of overall criteria weights. If a respondent prioritizes a particular criterion over others, this can significantly impact the final and overall weights after aggregation. AIP is calculated to obtain the final priority vector either with the arithmetic mean, a = [] or geometric mean, g = [] as follows [45]:
Where:
- is the arithmetic mean of the j-th criterion
- is the geometric mean of the j-th criterion
- is the normalized vector of individual priorities of the i-th expert and j-th
- criterion
- n is the number of expert individuals
- m is the number of criteria
The second method, known as AIJ, involves synthesizing the resulting reciprocal matrix from the individual pairwise comparisons into a single judgment matrix using the geometric mean. AIJ is used when individuals share common goals and value systems usually within the same group and pool their judgments in such a way that the group becomes a new ‘individual’ behaving as one [44]. This approach highlights the different rankings and priorities by each stakeholder group. In this case, the AIJ generates distinct criterion rankings and weights for each stakeholder and practice area group. AIJ using the geometric mean is calculated as follows [46,47]:
Where:
- is a set of normalized eigenvector components.
- is a set of eigenvector components.
4. Results
4.1. Response Rates by Sector
The survey was administered between July and November 2022 resulting in 30 responses out of 227 distributed surveys, yielding a response rate of 13.2%. On average, respondents completed the survey in 13 minutes (standard deviation of 8.7 minutes).
Distributions of respondents by profession (Figure 3a), practice area (Figure 3b) and agency (Figure 3c) show that engineers (43%), experts from the planning practice area (46%) and from the private industry (41%) constitute the majority. Response rates by profession and practice area are unavailable due to the way the sample frame was constructed, e.g., profession and practice area were not known from the contact lists used.
Most respondents contacted were from private industry (40%) (Figure 4). Response rates by organization were 8.7% for academic organizations, 13.6% for private engineering consulting firms, 13.2% for state, local, and regional transportation agencies, and 12.7% for DOTs.
4.2. Consistency Ratios of Responses
The average CR of responses was 0.33 with a standard deviation of 0.068. 21 of the 30 responses had a CR less than 0.20 and thus included in the overall computation of criteria weights.
Respondents self-reporting a profession as ‘managers’ were the least consistent with an average CR of 0.131, while respondents identifying as ‘planners’ were the most consistent with an average CR of 0.024. Respondents self-reporting as ‘engineers’, analysts’, and ‘consultants’ had average ratios of 0.128, 0.112 and 0.089, respectively. Those reporting as ‘researchers’ had an average CR of 0.062.
Respondents self-reporting a practice area of ‘operations’ were the least consistent with an average ratio of 0.2, while those in the practice area of ‘emergency and event response’ were the most consistent with an average CR of 0.064. Those in the 'planning’ and ‘engineering’ practice areas had average CRs of 0.121 and 0.107, respectively. Those reporting in the practice area of ‘system information and research’ had an average CR of 0.09. Differences can be attributed in part to sample size by practice area.
Comparing across self-reported agency, respondents from ‘state and federal DOTs’ reported the most inconsistent responses with an average CR of 0.145 while respondents from ‘private engineering consulting firms’ reported the most consistent responses with an average CR of 0.103.
4.3. Overall Criteria Weights
From the 21 responses that met the consistency ratio threshold, priority weights for each criterion were determined using the AIP (Figure 5). AADT ranked first, followed by redundancy, freight value, roadway classification, SoVI, and tourism, in respective order. AADT and redundancy have a combined weight of 0.475, approximately half of the overall weight and slightly more than the other four criteria combined.
4.3. Criteria Weights by Stakeholder Group
Next, we examine the overall rankings via the AIJ aggregation by stakeholder group (Figure 6 and Figure 7). These are summarized as follows:
- AADT ranked first by state and federal DOTs, private engineering consulting firms, and state, local and regional governmental transportation agencies groups while placing fifth in the academic group. AADT ranked first by the respondents from engineering, second by planning and system information and research (SIR) groups, third by operations, and fifth by emergency and event response (EER).
- Redundancy was ranked second by state and federal DOTs, private engineering consulting firms and state, local and regional governmental transportation agencies groups while placing third in the academic group. Redundancy ranked first by the planning with operations and engineering groups ranking it second. It was ranked third and fourth by EER and SIR respectively.
- Freight value had a varied ranking, ranking second by the academic group, third amongst state and federal DOTs and private engineering consulting firms while ranking fourth by state, local and regional governmental transportation agencies group. Experts in the SIR sector ranked freight first, second by EER, third by both planning and engineering, and fourth by the operations practice area.
- Roadway classification ranked third by state, local and regional government transportation agencies group while it ranked fourth by the other stakeholder groups. Roadway classification was the highest-ranked criterion by respondents working in the field of operations with a value of 0.387. It, however, ranked third by SIR, fourth by planning and EER, and finally fifth by engineering.
- SoVI ranked first by respondents from academia with a very high criteria weight of 0.475, placing fourth, fifth, and sixth by the state and federal DOTs, private engineering consulting firms and state, local and regional governmental transportation agencies respondents respectively. SoVI ranked first by the respondent from EER with a very high criteria weight of 0.496. It, however, fell to fourth place ranking by the engineering field and fifth across the remaining practice areas.
- Tourism ranked sixth across the state and federal DOTs and private engineering consulting firms groups but was ranked fourth and fifth by the experts from the academia and state, local and regional governmental transportation agencies respectively. Tourism was unanimously ranked sixth by all the practice area groups which is consistent with the overall criteria ranking.
Rankings by both state and federal DOTs and private engineering consulting firm groups were consistent with the overall criteria ranking using the AIP approach with minimal differing weights (e.g., 0.198 vs 0.196 vs 0.183 for the weight assigned to freight).
4.4. Criteria Hierarchy Effects on Ranking
Resulting weights and rankings are subject to the number of criteria and the assumed hierarchy of the criteria. To demonstrate the effect of less criteria and correlation among criteria in the ranking and weights, postprocessing was conducted such that each criterion is removed one at a time and the criteria weights are recalculated to evaluate their impact on the overall results. The analysis shows that revised criteria ranking is consistent with the original, except for the removal of freight. There was a change in ranking due to the exclusion of freight, with redundancy moving to first rank (was originally second rank) and AADT ranking second (was first). Roadway classification, SoVI, and tourism held their original positions.
4.5. Sample Size Effects on Ranking
The rankings of the criteria were also assessed under varying sample sizes, which were increased from three to 21 through random selection. The rankings of the criteria varied as the sample size increased from three to 12, but they remained consistent with the original rankings after using 15 samples in the final computation (Figure 8). This supports the use of a relatively small (less than 30 sample) to determine consistent rankings.
4.6. Application
The following is an example of how the weights can be applied to estimate the criticality of a link in a transportation network using the state of Arkansas as a case study. Following from [5], each criticality metric is divided into levels adjusted to the application context of Arkansas (Table 2). Each criterion is assigned to a numerical criticality score (1 to 5) that is then averaged using AHP weights derived from an Arkansas sub-sample of the AHP survey to estimate a link's overall criticality. The numerical criticality score ranges are based on distribution of the data and are specific to the state of Arkansas traffic volumes, freight tonnages, tourism, and socio-demographic characteristics.
For example, consider the following levels of the criteria that are estimated for a single link:
- AADT is 500 vehicles per day and assigned Level 1.
- Redundancy is estimated to be 1600 vehicle hours and assigned Level 3.
- Freight value is $1000M and assigned Level 2.
- Roadway class is a minor arterial and assigned Level 2.
- SoVI is estimated to be 1.55 and assigned Level 4.
- Tourism value is $2M and assigned Level 1.
The unequally weighted average is calculated as follows:
Where;
- is the combined criticality score for each link i
- is the weight assigned to each criterion, n, e.g., AHP deduced weights
- is the score of the criterion, n, for each link i
- is the number of criteria, e.g., N=6.
The weighted average is calculated as:
Criticality = (0.244×1) + (0.231×3) + (0.198×2) + (0.13×2) + (0.114×4) + (0.082×1) = 2.13
The example link with a criticality score of 2.13 is considered more critical than a link with a score of 1.50, but less critical than a link with a score of 3.00.
The methodology was used to assess criticality metrics of Arkansas' state roadway network using both equal (e.g., weights of 1/6 applied to all criteria) and unequal weighting approaches (e.g., using AHP derived weights). Overall, under the equal weighting approach, 19% of roadways were deemed highly critical (criticality > 2.8 based on natural breaks), whereas only 9% were rated highly critical using AHP weights. Under the equal weighting approach, 25% and 56% of roadways were considered to have moderate and low criticality, respectively, compared to 19% and 72% with the AHP weights. Ten roadway segments were identified as the most critical using AHP weighting with criticality scores above 4.2. A main shift occurs when criteria are subject to county level aggregation. For example, tourism data is measured by county, resulting in all roadway segments in a county having the same tourism score. Thus, reducing the weight of tourism criteria lowers the criticality of all roadway segments in that county.
5. Discussion
The AHP derived weights are sensitive to decreases in sample size, make-up of the respondent’s professions, practice areas, and organizations, and the aggregation approach, e.g., AIJ or AIP. Although a response rate of 13.2% was achieved in this study, a non-probability sampling approach was used. Thus, it is not possible to weigh the sample across all respondent demographics to derive population-level estimates. With a sample of 21 responses, it is not advisable to draw strong conclusions about the priorities of minority respondent groups. For example, one response was gathered from EER. However, because the AHP is a subjective method rather than a statistical technique, a smaller sample size is acceptable for implementing the AHP model as long as the responses reflect the logical and analytical opinions of experts from various stakeholders [36,39].
The AIP and AIJ methods are employed when decision makers are assumed to have equal importance. From the AIP of the individual responses, prioritization of a criterion by an individual respondent significantly impacts the final weights. When stakeholder rankings were the same, the AIJ method showed slight weight differences when compared to AIP. Overall, utilizing the AIJ over the AIP aggregation approach demonstrates the sensitivity of the weights to the interpretation of the group's (practice area or agency) decision making process. The AIJ approach is more suitable when the group shares a common goal, while the AIP approach is used when individuals act according to their own priorities.
Consistency is an important requirement of the AHP method [39]. The acceptable CR values for different matrices sizes (e.g., number of criteria) are: 0.05 for a 3 by 3 matrix (three choices), 0.08 for a 4 by 4 matrix and, 0.2 for larger matrices [39,41]. In this study, 21 responses met the recommended consistency ratio threshold (CR < 0.20). The differences in consistency, in part, can be attributed to the different sample sizes across the various stakeholder groups. A least consistent individual respondent with a high CR value has a significant effect on the average CR of the specific stakeholder group. The area of expertise required to make the pairwise comparisons must be known to engage respondents who have both knowledge and practical experience with the subject matter to ensure consistent responses [36].
No correlation was found between the CR and the amount of time spent taking the survey. Out of the 21 respondents who achieved an acceptable CR, 14 were able to complete the pairwise comparisons in 20 minutes or less, while the remaining seven required more than 20 minutes. Five out of the nine respondents who exhibited inconsistent judgments completed the survey in less than 20 minutes, whereas the remaining four required more time to complete the survey.
6. Conclusions
This paper presents an application of Analytical Hierarchy Process (AHP) for ranking and weighting of criteria to measure the criticality of roadway segments across a statewide network. The AHP method uniquely allows for the aggregation of diverse stakeholder rankings of multiple criteria using a pairwise rating system. We carried out the AHP process using an online survey resulting in 30 complete responses (13.2% response rate). Respondents represented public transportation agencies, private consulting firms, academic intuitions across the US. After applying a threshold for consistency in individual responses, we used an aggregate weighting approach called the AIP to estimate criteria weights of the 21 remaining responses.
The key finding from the criteria ranking is that AADT is consistently ranked most important among the six criteria (weight of 0.244). Redundancy was the second ranked criteria (0.231). Combined, AADT and redundancy account for 0.475 of the total weight, representing almost half the weight of the other four criteria combined. The experts surveyed agreed that tourism is the least important of the six-criticality metrics (0.082). These rankings were consistent when any criteria except freight were removed from the choice set. Alternate hierarchical structures or sets of criteria may be considered in future work. Additionally, the number of responses was evaluated regarding the stability of the rankings. With 15 responses, the ranking of criteria reached consistency. This is a key finding since the literature does not provide a sample size recommendations AHP applications.
Individual responses reveal sensitivity of the AHP model to stakeholder roles and traits. For example, there were few academic respondents, one happening to be the sole response associated with the field of emergency response. SoVI was ranked by this respondent as the most vital criterion. Future research will need to solicit more respondents across diverse stakeholder groups, considering their knowledge level and practical experience.
Other metrics considered important for measuring the criticality of a statewide highway transportation assets were asked of the participants. Respondents proposed metrics such as safety, volume/capacity, supply chain vulnerability, and the inclusion of other types of transportation facilities such as seaports, airports, and so on. These metrics can be incorporated into future criticality and resiliency assessments using this framework.
Author Contributions
Study conception and design: S.H., S.K.M. and K.A.N.; Data collection: K.A.N.; Formal analysis; K.A.N. and S.H.; Results interpretation; K.A.N. and S.H.; Draft manuscript preparation; K.A.N., S.H. and S.K.M; Supervision: S.H. and S.K.M.; Funding acquisition; S.H. and S.K.M. All authors have read and agreed to the published version of the manuscript.
Funding
This research was funded by the Arkansas Department of Transportation (ARDOT), grant number TRC 2003.
Institutional Review Board Statement
The study was conducted in accordance with the Institutional Review Board (or Ethics Committee) of the University of Arkansas (protocol code 2206406049 and date of approval 07/01/2022).
Informed Consent Statement
Informed consent was obtained from all subjects involved in the study.
Data Availability Statement
The data presented in this study are not available due to privacy or ethical restrictions.
Acknowledgments
The Arkansas Department of Transportation (ARDOT) sponsored the project that led to this paper.
Conflicts of Interest
The authors declare no conflicts of interest. The funders had no role in the design of the study; in the collection, analyses, or interpretation of data; in the writing of the manuscript; or in the decision to publish the results.
References
- Sullivan, J.L.; Novak, D.C.; Aultman-Hall, L.; Scott, D.M. Identifying Critical Road Segments and Measuring System-Wide Robustness in Transportation Networks with Isolating Links: A Link-Based Capacity-Reduction Approach. Transportation Research Part A: Policy and Practice 2010, 44, 323–336. [Google Scholar] [CrossRef]
- García-Palomares, J.C.; Gutiérrez, J.; Martín, J.C.; Moya-Gómez, B. An Analysis of the Spanish High Capacity Road Network Criticality. Transportation 2018, 45, 1139–1159. [Google Scholar] [CrossRef]
- Pant, S.B. Transportation Network Resiliency: A Study of Self-Annealing. 2012. [Google Scholar]
- Jenelius, E.; Petersen, T.; Mattsson, L.-G. Importance and Exposure in Road Network Vulnerability Analysis. Transportation Research Part A: Policy and Practice 2006, 40, 537–560. [Google Scholar] [CrossRef]
- Flannery, A. I-70 Corridor Risk & Resilience Pilot. 105.
- Board, T.R. National Academies of Sciences, Engineering; Medicine Investing in Transportation Resilience: A Framework for Informed Choices; The National Academies Press: Washington, DC, 2021. [Google Scholar]
- Almotahari, A.; Yazici, M.A. A Link Criticality Index Embedded in the Convex Combinations Solution of User Equilibrium Traffic Assignment. Transportation Research Part A: Policy and Practice 2019, 126, 67–82. [Google Scholar] [CrossRef]
- Almotahari, A.; Yazici, A. Impact of Topology and Congestion on Link Criticality Rankings in Transportation Networks. Transportation Research Part D: Transport and Environment 2020, 87, 102529. [Google Scholar] [CrossRef]
- FHWA Climate Resilience Pilot Program: Connecticut Department of Transportation. 2016.
- Smith, J.T.; Tighe, S.L. Analytic Hierarchy Process as a Tool for Infrastructure Management. Transportation Research Record 1974, 8. [Google Scholar] [CrossRef]
- Almotahari, A.; Yazici, A. Practice Friendly Metric for Identification of Critical Links in Road Networks. Transportation Research Record 2020, 2674, 219–229. [Google Scholar] [CrossRef]
- Nagurney, A.; Qiang, Q. A Transportation Network Efficiency Measure That Captures Flows, Behavior, and Costs With Applications to Network Component Importance Identification and Vulnerability. SSRN Journal 2007. [Google Scholar] [CrossRef]
- Gauthier, P.; Furno, A.; El Faouzi, N.-E. Road Network Resilience: How to Identify Critical Links Subject to Day-to-Day Disruptions. Transportation Research Record 2018, 2672, 54–65. [Google Scholar] [CrossRef]
- Jenelius, E.; Petersen, T.; Mattsson, L.-G. Importance and Exposure in Road Network Vulnerability Analysis. Transportation Research Part A: Policy and Practice 2006, 40, 537–560. [Google Scholar] [CrossRef]
- Madar-Vani, G.; Maoh, H.; Anderson, W. Modeling the Criticality of a Regional Trucking Network at the Industry Level: Evidence from the Province of Ontario, Canada. Research in Transportation Business & Management 2022, 43, 100732. [Google Scholar] [CrossRef]
- Jafino, B.A. An Equity-Based Transport Network Criticality Analysis. Transportation Research Part A: Policy and Practice 2021, 144, 204–221. [Google Scholar] [CrossRef]
- Sullivan, J.L.; Novak, D.C.; Aultman-Hall, L.; Scott, D.M. Identifying Critical Road Segments and Measuring System-Wide Robustness in Transportation Networks with Isolating Links: A Link-Based Capacity-Reduction Approach. Transportation Research Part A: Policy and Practice 2010, 44, 323–336. [Google Scholar] [CrossRef]
- Wang, D.Z.W.; Liu, H.; Szeto, W.Y.; Chow, A.H.F. Identification of Critical Combination of Vulnerable Links in Transportation Networks – a Global Optimisation Approach. Transportmetrica A: Transport Science 2016, 12, 346–365. [Google Scholar] [CrossRef]
- Li, F.; Jia, H.; Luo, Q.; Li, Y.; Yang, L. Identification of Critical Links in a Large-Scale Road Network Considering the Traffic Flow Betweenness Index. PLoS ONE 2020, 15, e0227474. [Google Scholar] [CrossRef]
- ICF International Criticality Guidance - Tools - Resilience - Sustainability - Environment - FHWA. Available online: https://www.fhwa.dot.gov/environment/sustainability/resilience/tools/criticality_guidance/index.cfm (accessed on 15 December 2022).
- Kumar, A.; Haque, K.; Mishra, S.; Golias, M.M. Multi-Criteria Based Approach to Identify Critical Links in a Transportation Network. Case Studies on Transport Policy 2019, 7, 519–530. [Google Scholar] [CrossRef]
- Ukkusuri, S.V.; Yushimito, W.F. A Methodology to Assess the Criticality of Highway Transportation Networks. J Transp Secur 2009, 2, 29–46. [Google Scholar] [CrossRef]
- Li, J.; Ozbay, K. Evaluation of Link Criticality for Day-to-Day Degradable Transportation Networks. Transportation Research Record 2012, 2284, 117–124. [Google Scholar] [CrossRef]
- Scott, D.M.; Novak, D.C.; Aultman-Hall, L.; Guo, F. Network Robustness Index: A New Method for Identifying Critical Links and Evaluating the Performance of Transportation Networks. Journal of Transport Geography 2006, 14, 215–227. [Google Scholar] [CrossRef]
- Freckleton, D.; Heaslip, K.; Louisell, W.; Collura, J. Evaluation of Resiliency of Transportation Networks after Disasters. Transportation Research Record 2012, 2284, 109–116. [Google Scholar] [CrossRef]
- Krimmer, M. I-70 Corridor Risk & Resilience Pilot. 105.
- Hernandez, S.; Mitra, S. TRC2003 Data-Driven Methods to Assess Transportation System Resilience in Arkansas. 2020; p. 144. [Google Scholar]
- United States. Federal Highway Administration. Office of Highway Policy Information Traffic Data Computation Method: Pocket Guide. 2018. [Google Scholar]
- Cutter, S.L.; Boruff, B.J.; Shirley, W.L. Social Vulnerability to Environmental Hazards*. Social Science Quarterly 2003, 84, 242–261. [Google Scholar] [CrossRef]
- Saaty, R.W. The Analytic Hierarchy Process—What It Is and How It Is Used. Mathematical Modelling 1987, 9, 161–176. [Google Scholar] [CrossRef]
- Zahedi, F. The Analytic Hierarchy Process—A Survey of the Method and Its Applications. Interfaces 1986, 16, 96–108. [Google Scholar] [CrossRef]
- Balubaid, M.; Alamoudi, R. Application of the Analytical Hierarchy Process (AHP) to Multi-Criteria Analysis for Contractor Selection. AJIBM 2015, 05, 581–589. [Google Scholar] [CrossRef]
- Using Decision Support Systems for Transportation Planning Efficiency; Ocalir-Akunal, E.V., Ed.; Advances in Civil and Industrial Engineering; IGI Global, 2016; ISBN 978-1-4666-8648-9. [Google Scholar]
- Abba, A.H.; Noor, Z.Z.; Yusuf, R.O.; Din, M.F.M.D.; Hassan, M.A.A. Assessing Environmental Impacts of Municipal Solid Waste of Johor by Analytical Hierarchy Process. Resources, Conservation and Recycling 2013, 73, 188–196. [Google Scholar] [CrossRef]
- Barone, S.; Errore, A.; Lombardo, A. Prioritisation of Alternatives with Analytical Hierarchy Process plus Response Latency and Web Surveys. Available online: https://www.tandfonline.com/doi/epdf/10.1080/14783363.2014.904565?needAccess=true&role=button (accessed on 3 February 2023).
- Saaty, T.L.; Özdemir, M.S. How Many Judges Should There Be in a Group ? Ann. Data. Sci. 2014, 1, 359–368. [Google Scholar] [CrossRef]
- Gompf, K.; Traverso, M.; Hetterich, J. Using Analytical Hierarchy Process (AHP) to Introduce Weights to Social Life Cycle Assessment of Mobility Services. Sustainability 2021, 13, 1258. [Google Scholar] [CrossRef]
- Pecchia, L.; Bath, P.A.; Pendleton, N.; Bracale, M. Analytic Hierarchy Process (AHP) for Examining Healthcare Professionals’ Assessments of Risk Factors: The Relative Importance of Risk Factors for Falls in Community-Dwelling Older People. Methods Inf Med 2011, 50, 435–444. [Google Scholar] [CrossRef]
- Wong, J.K.W.; Li, H. Application of the Analytic Hierarchy Process (AHP) in Multi-Criteria Analysis of the Selection of Intelligent Building Systems. Building and Environment 2008, 43, 108–125. [Google Scholar] [CrossRef]
- Banai, R. Public Transportation Decision-Making: A Case Analysis of the Memphis Light Rail Corridor and Route Selection with Analytic Hierarchy Process. JPT 2006, 9, 1–24. [Google Scholar] [CrossRef]
- Wedley, W.C. Consistency Prediction for Incomplete AHP Matrices. Mathematical and Computer Modelling 1993, 17, 151–161. [Google Scholar] [CrossRef]
- Donegan, H.A.; Dodd, F.J. A Note on Saaty’s Random Indexes. Mathematical and Computer Modelling 1991, 15, 135–137. [Google Scholar] [CrossRef]
- Griffith, P. Ahpy: A Python Implementation of the Analytic Hierarchy Process.
- Forman, E. Aggregating Individual Judgments and Priorities with the Analytic Hierarchy Process. 1998, 4. [Google Scholar] [CrossRef]
- Carmo, D.K.; de, S.; Marins, F.A.S.; Salomon, V.A.P.; Mello, C.H.P. On the Aggregation of Individual Priorities in Incomplete Hierarchies. 23 June 2013. [Google Scholar]
- Saaty, T. The Analytic Hierarchy Process" Mcgraw-Hill. 1980. [Google Scholar]
- Aragón, T.J. Deriving Criteria Weights for Health Decision Making: A Brief Tutorial. 2017. [Google Scholar]
Figure 1.
Analytic Hierarchy of the Decision.
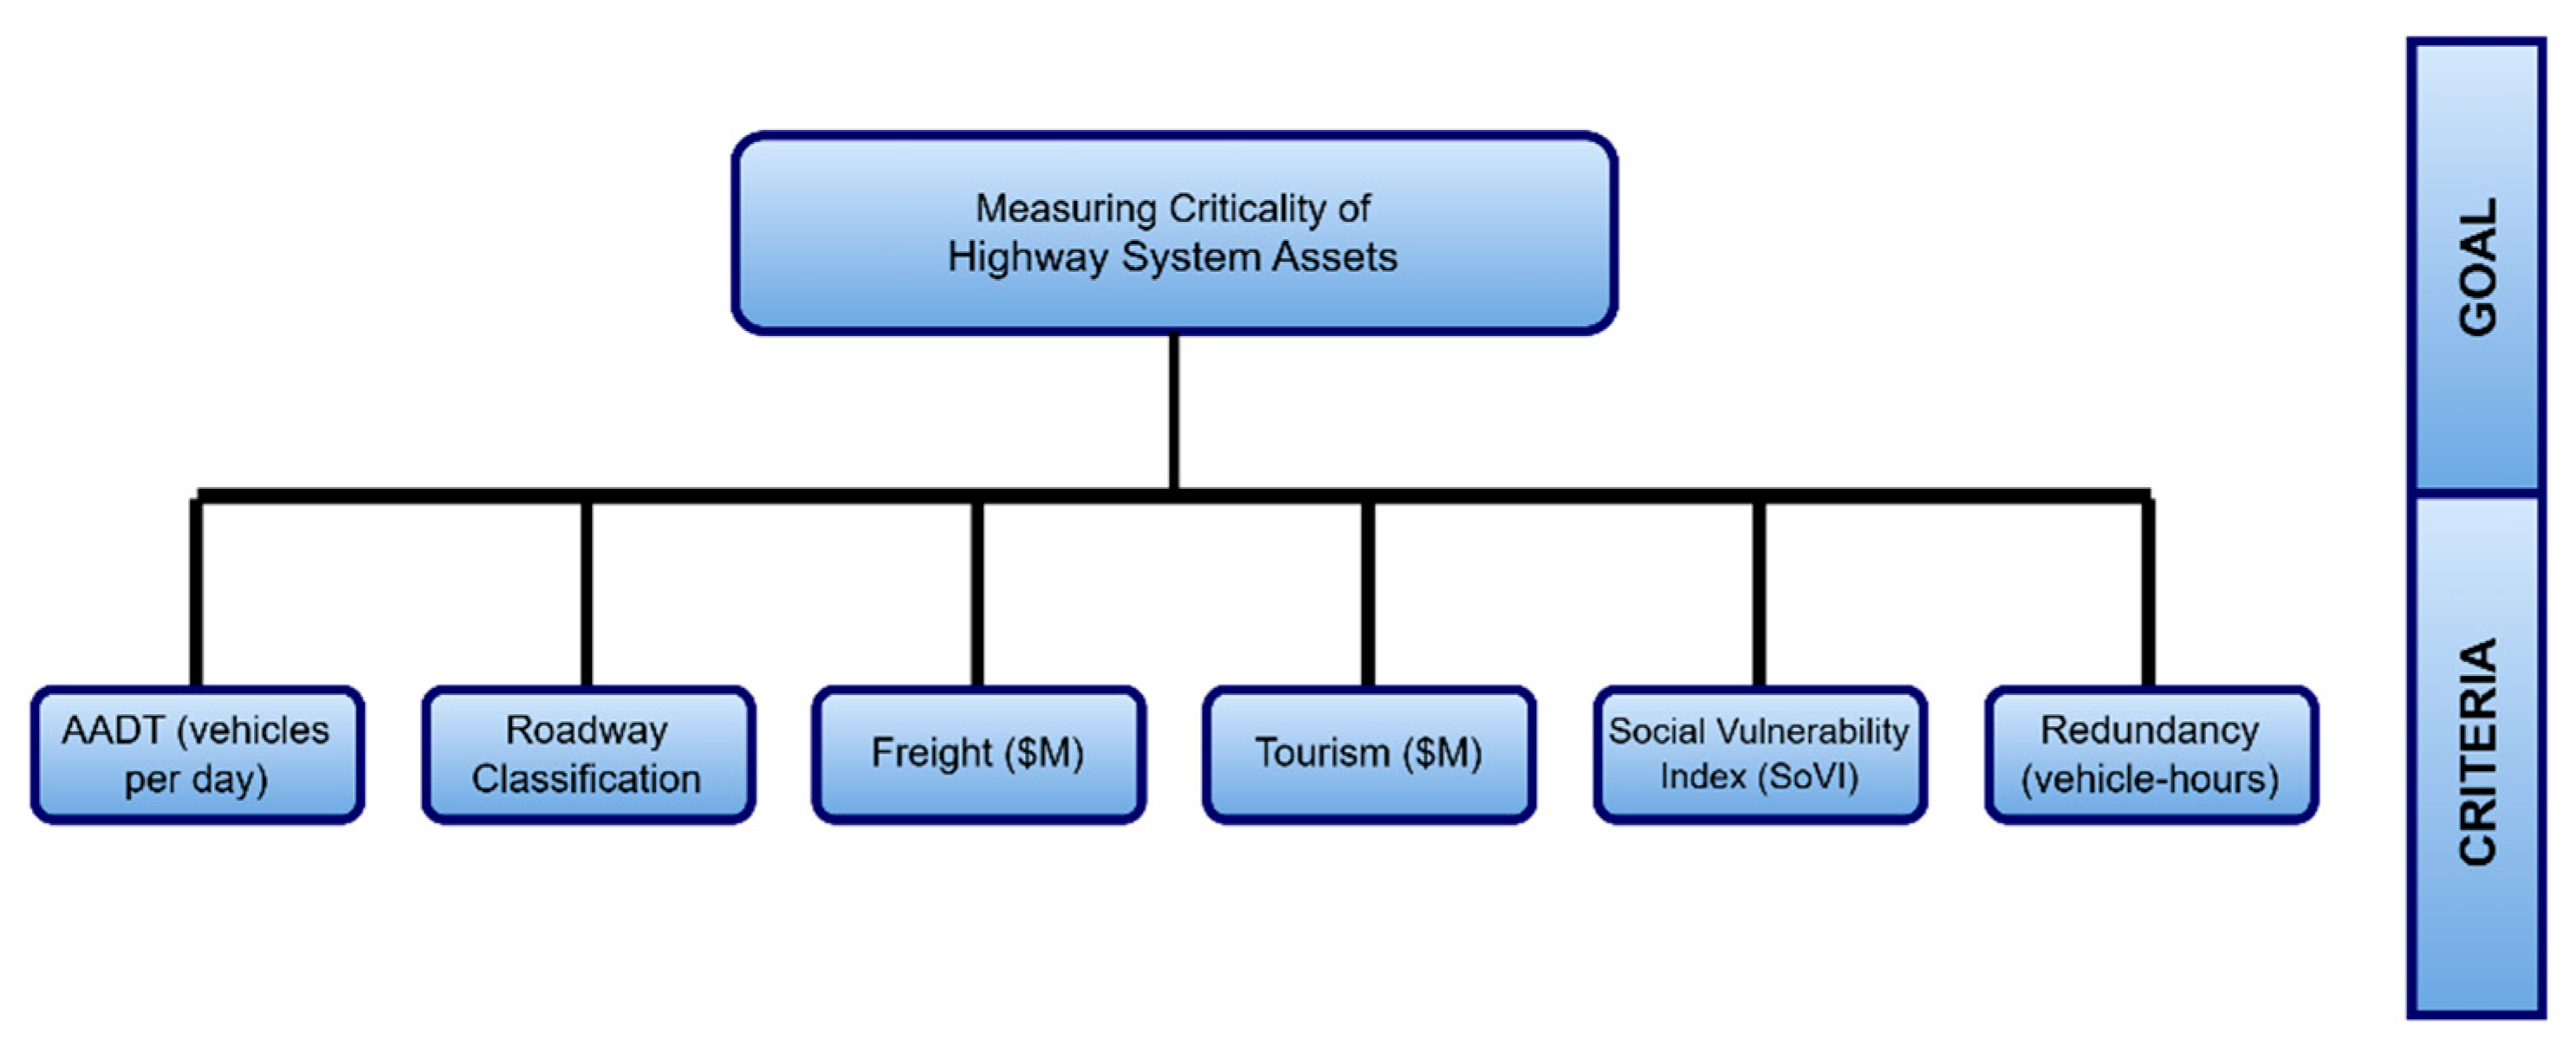
Figure 2.
Survey Questionnaire in Qualtrics Platform.
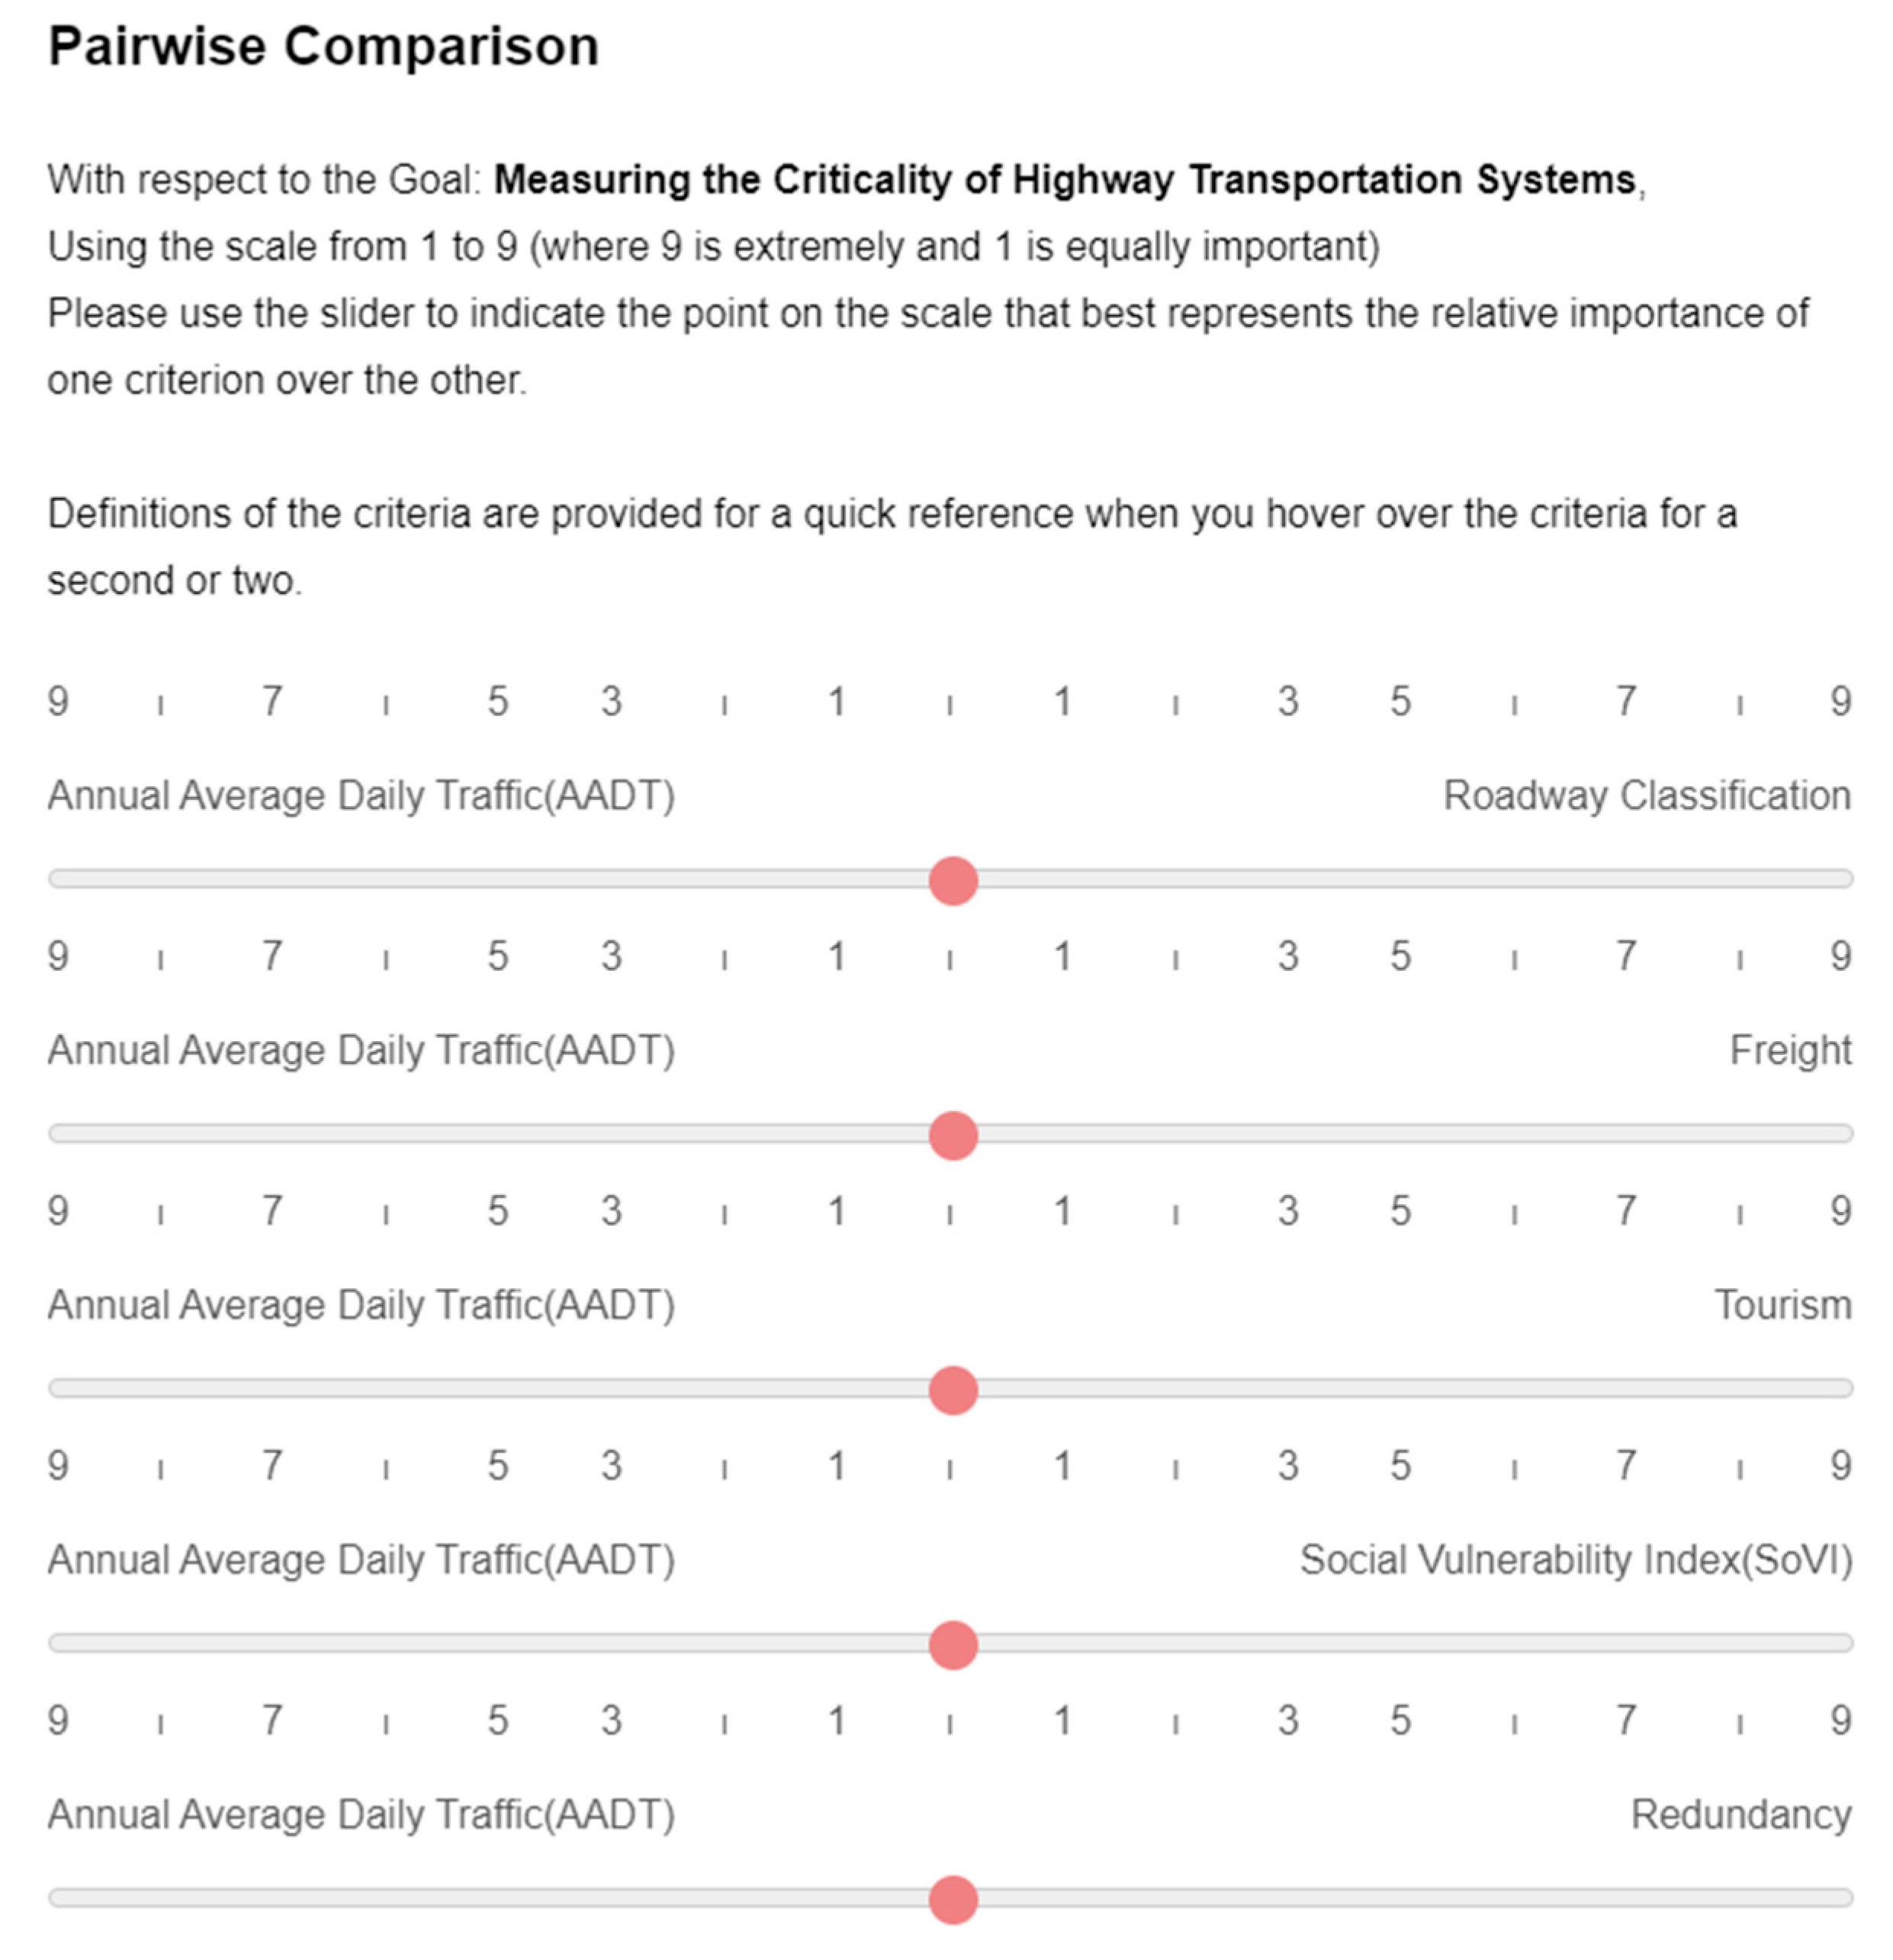
Figure 3.
Survey Respondents by Profession, Practice Area, and Agency (N = 30).
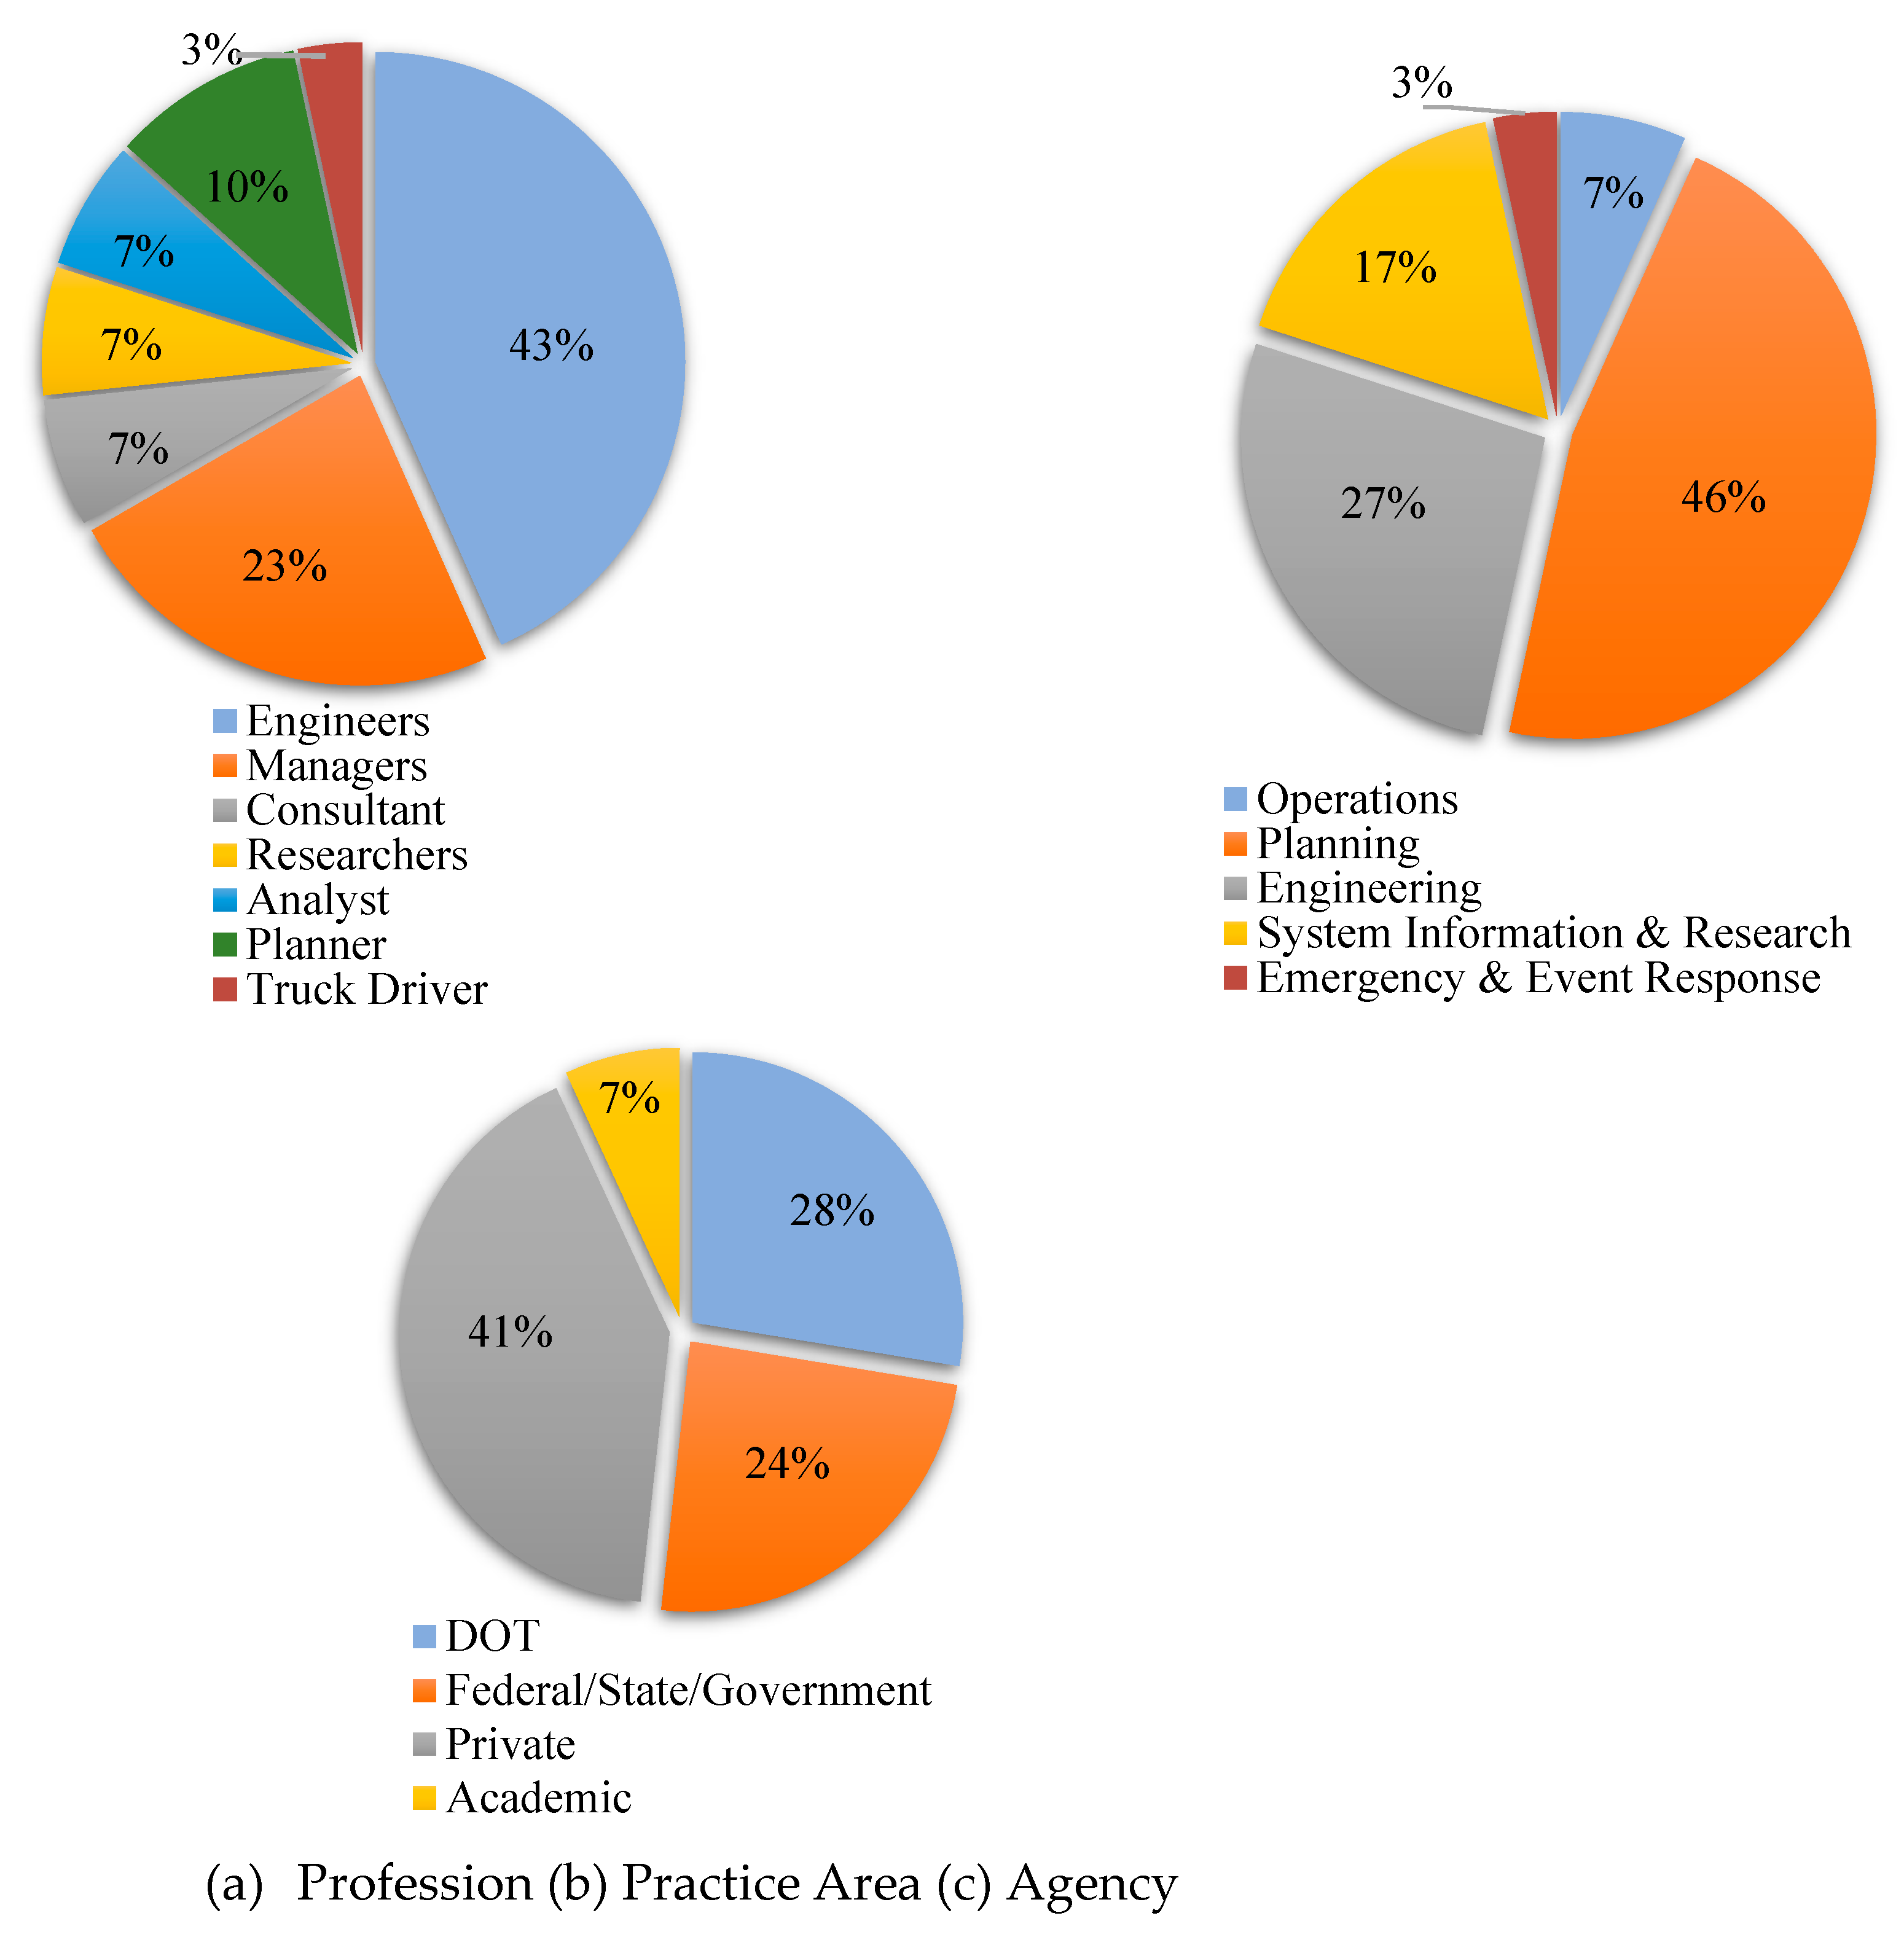
Figure 4.
Survey Sample Frame and Respondents by Agency.
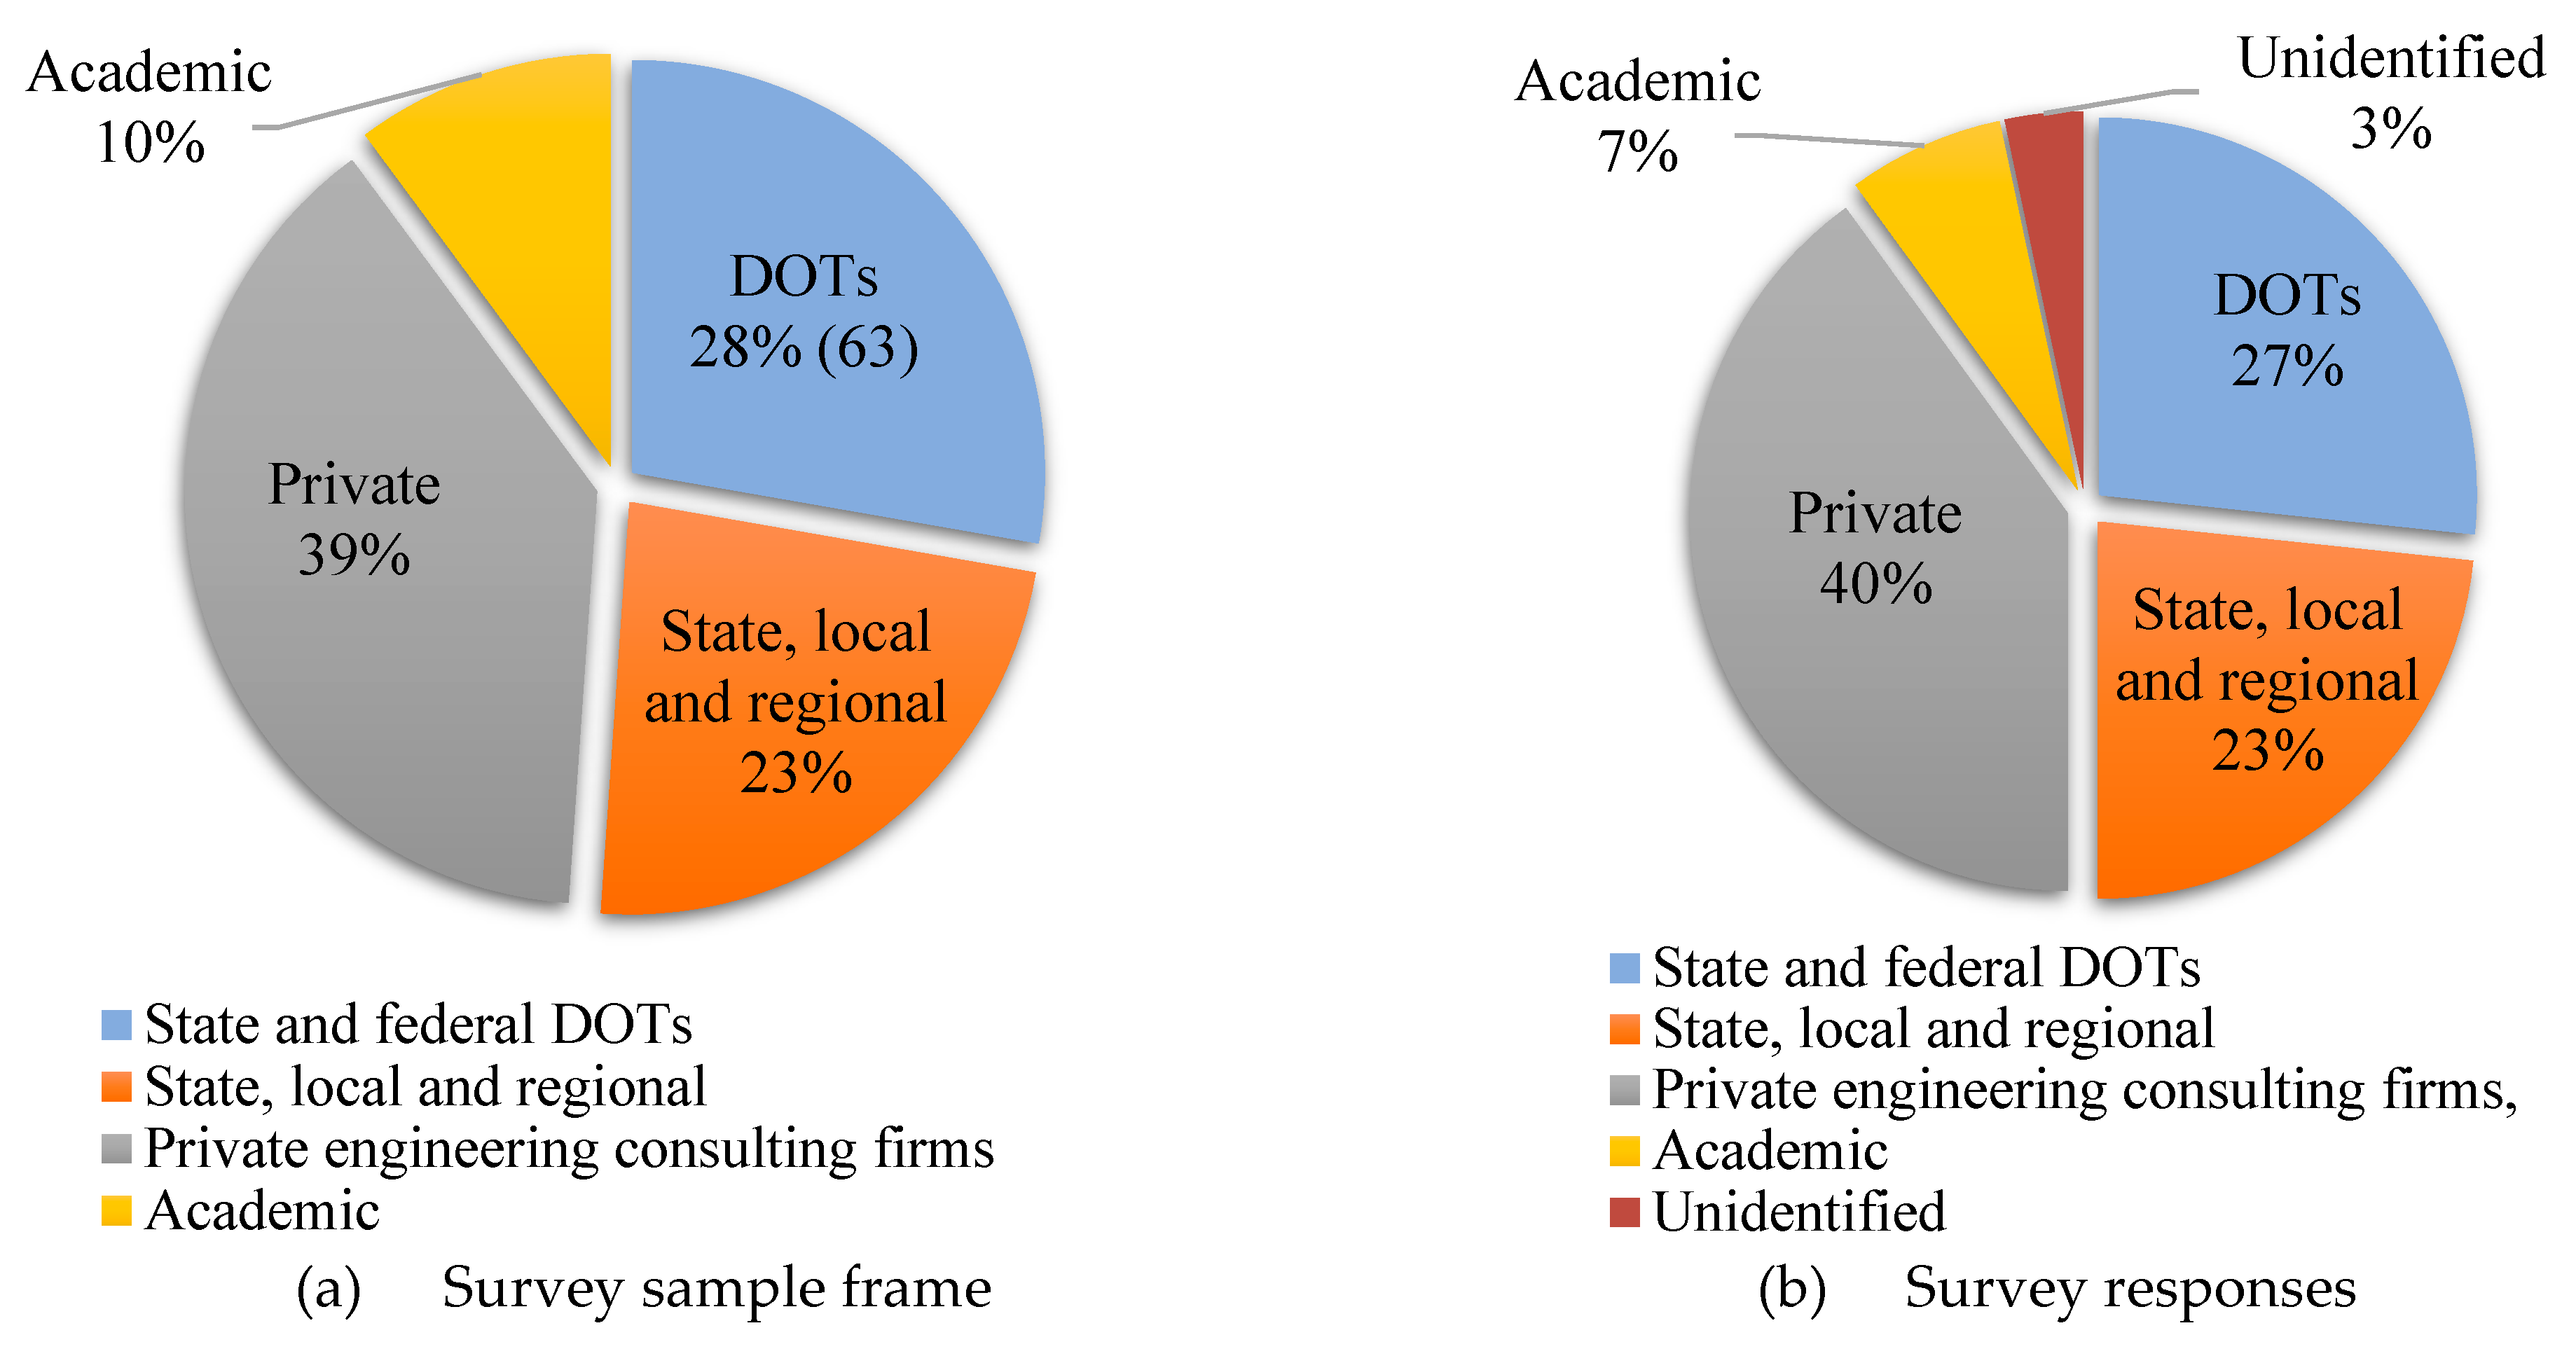
Figure 5.
Criteria and Weights Derived from an Analytical Hierarchy Process (AHP) using the Aggregation of Individual Priorities (AIP) method for All Respondents Meeting the Consistency Ratio Threshold (N=20).
Figure 5.
Criteria and Weights Derived from an Analytical Hierarchy Process (AHP) using the Aggregation of Individual Priorities (AIP) method for All Respondents Meeting the Consistency Ratio Threshold (N=20).
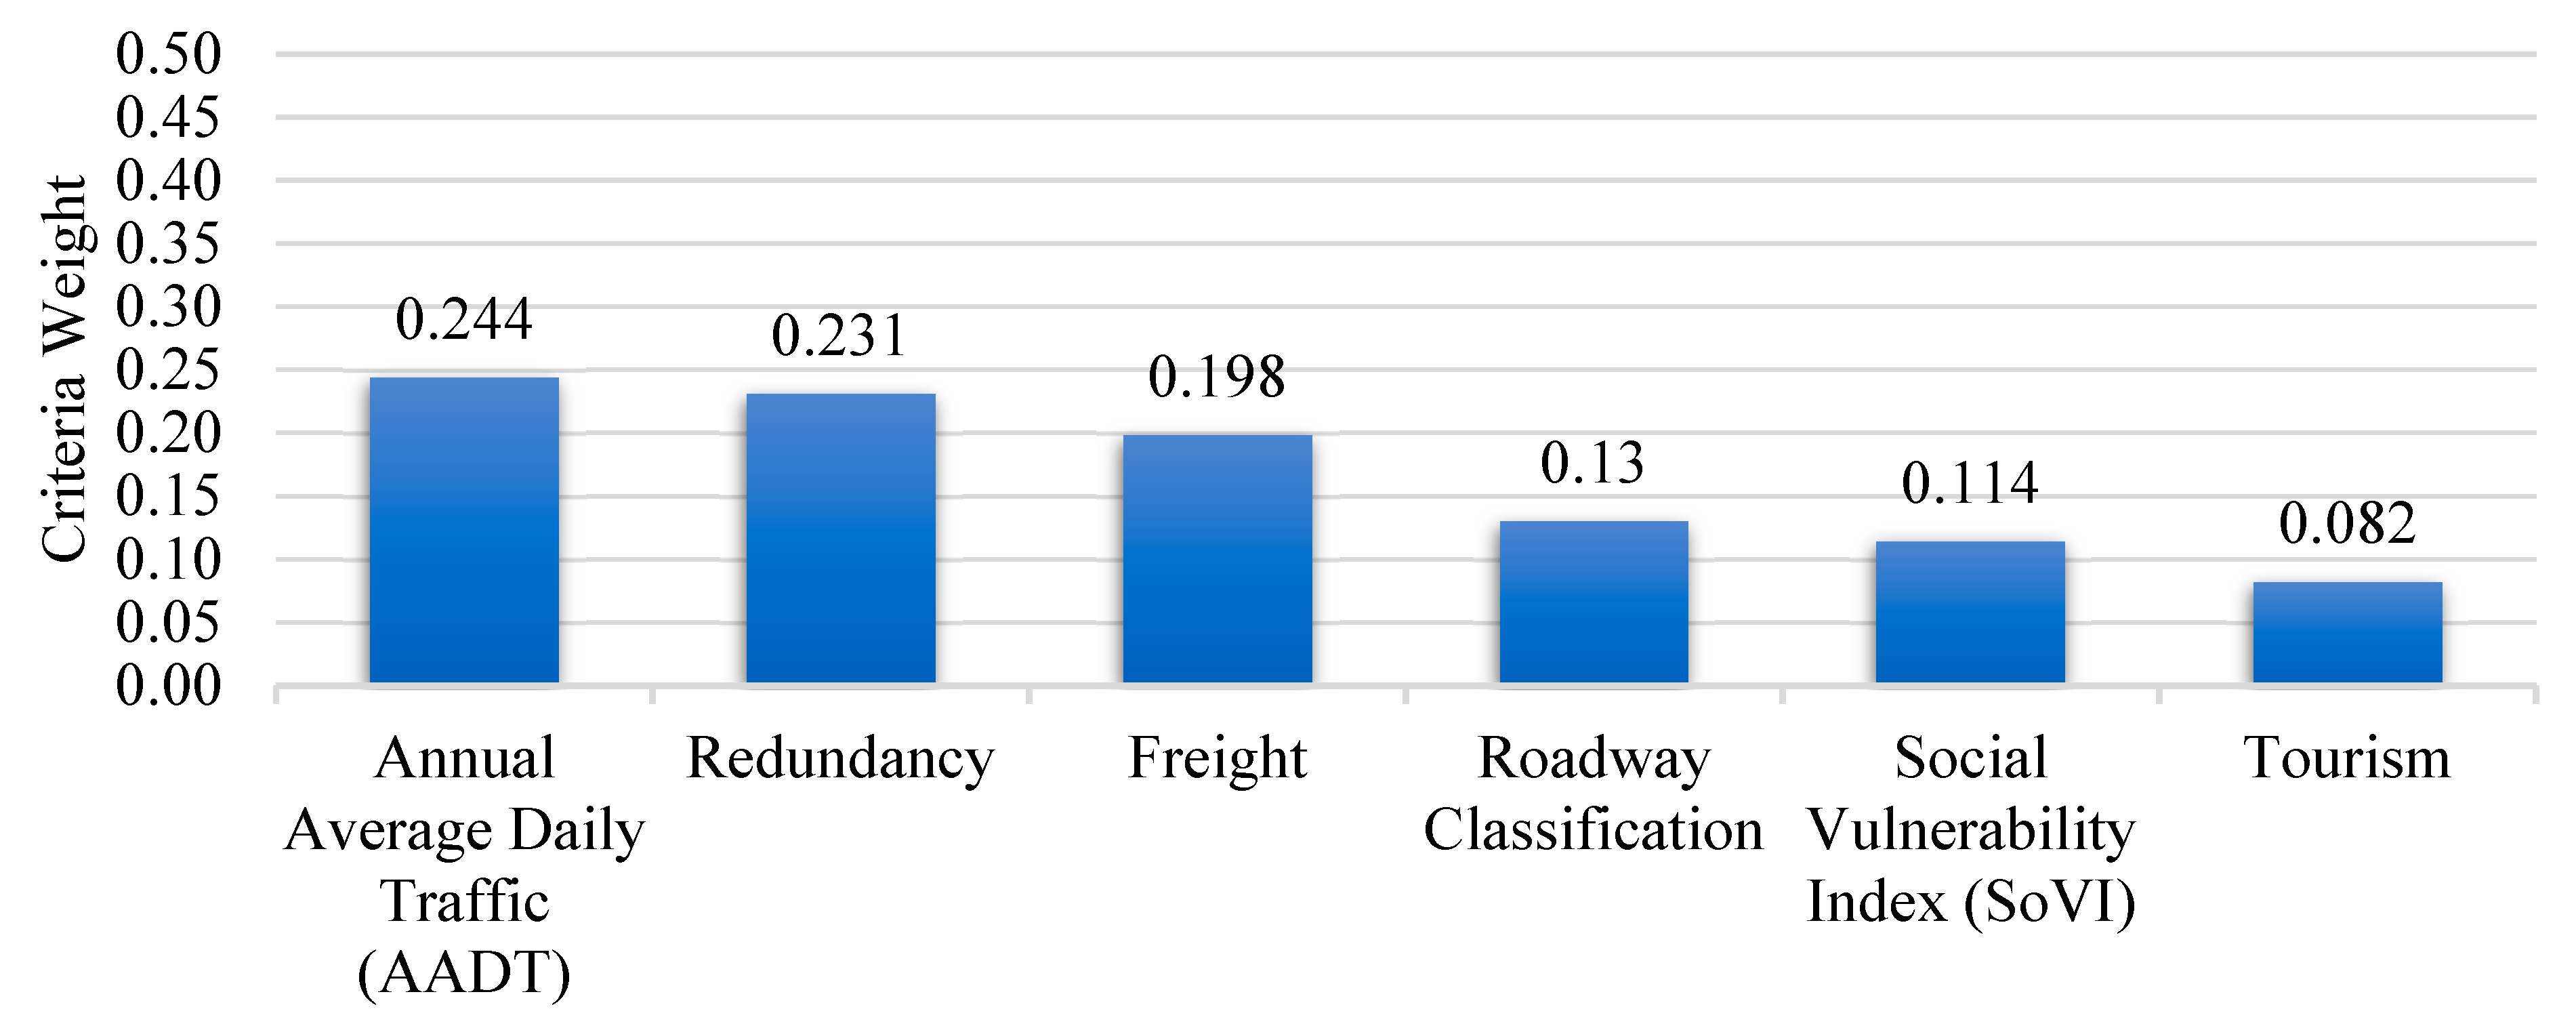
Figure 6.
Criteria Ranking and Weights by Agency of Respondents.
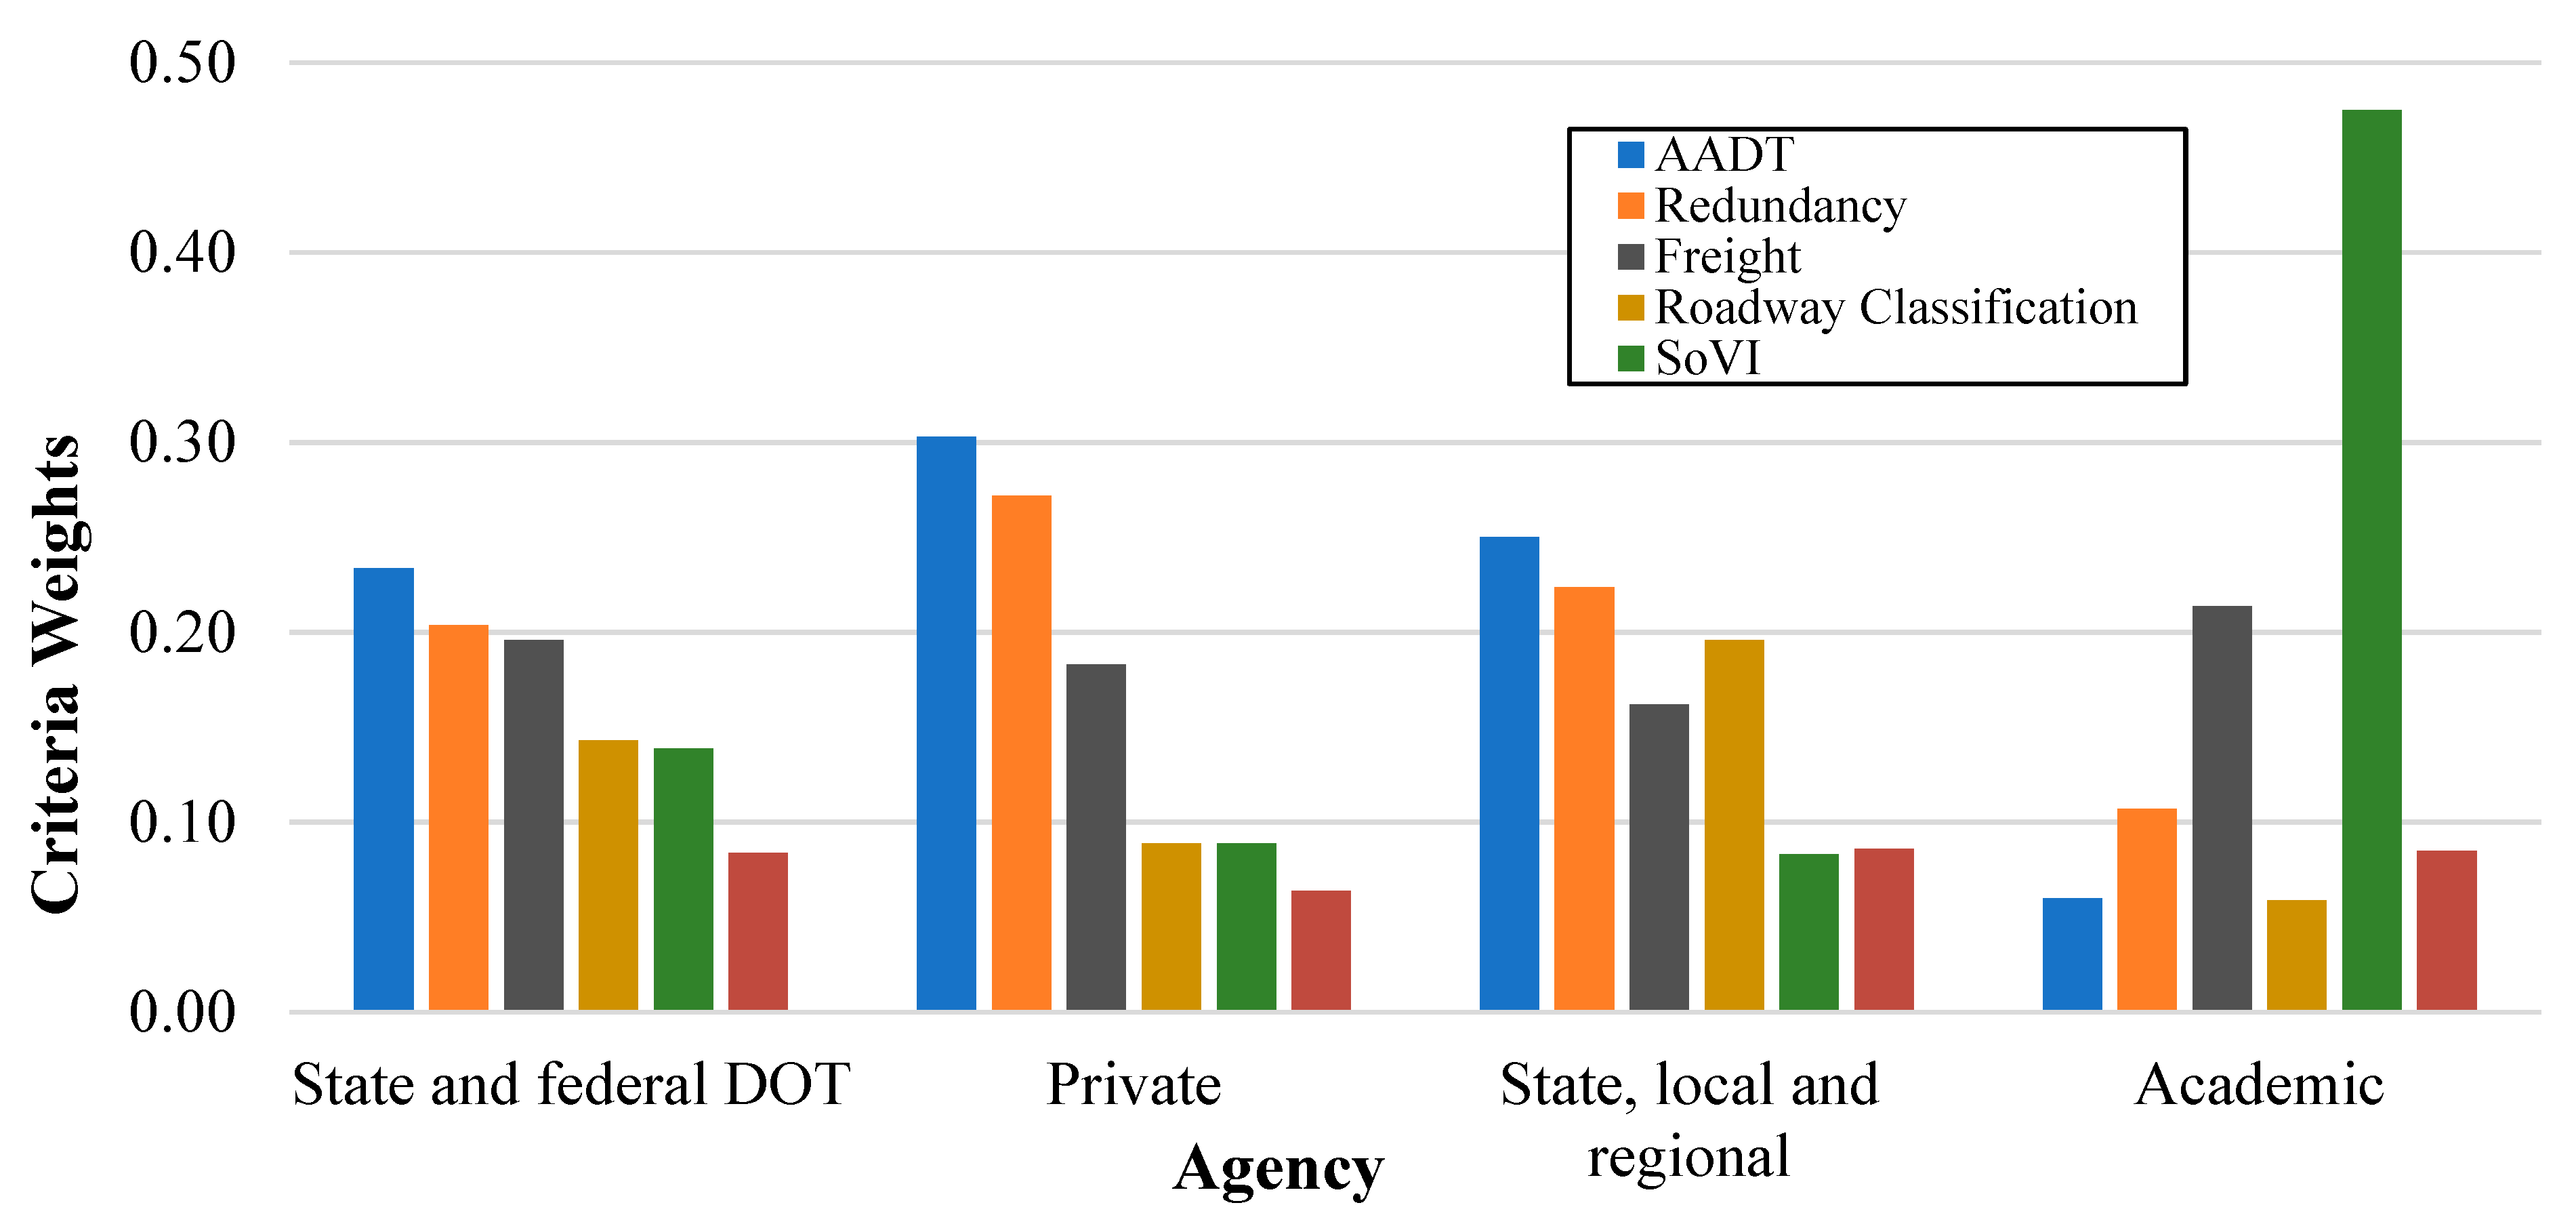
Figure 7.
Criteria Ranking and Weights of Practice Area of Respondents.
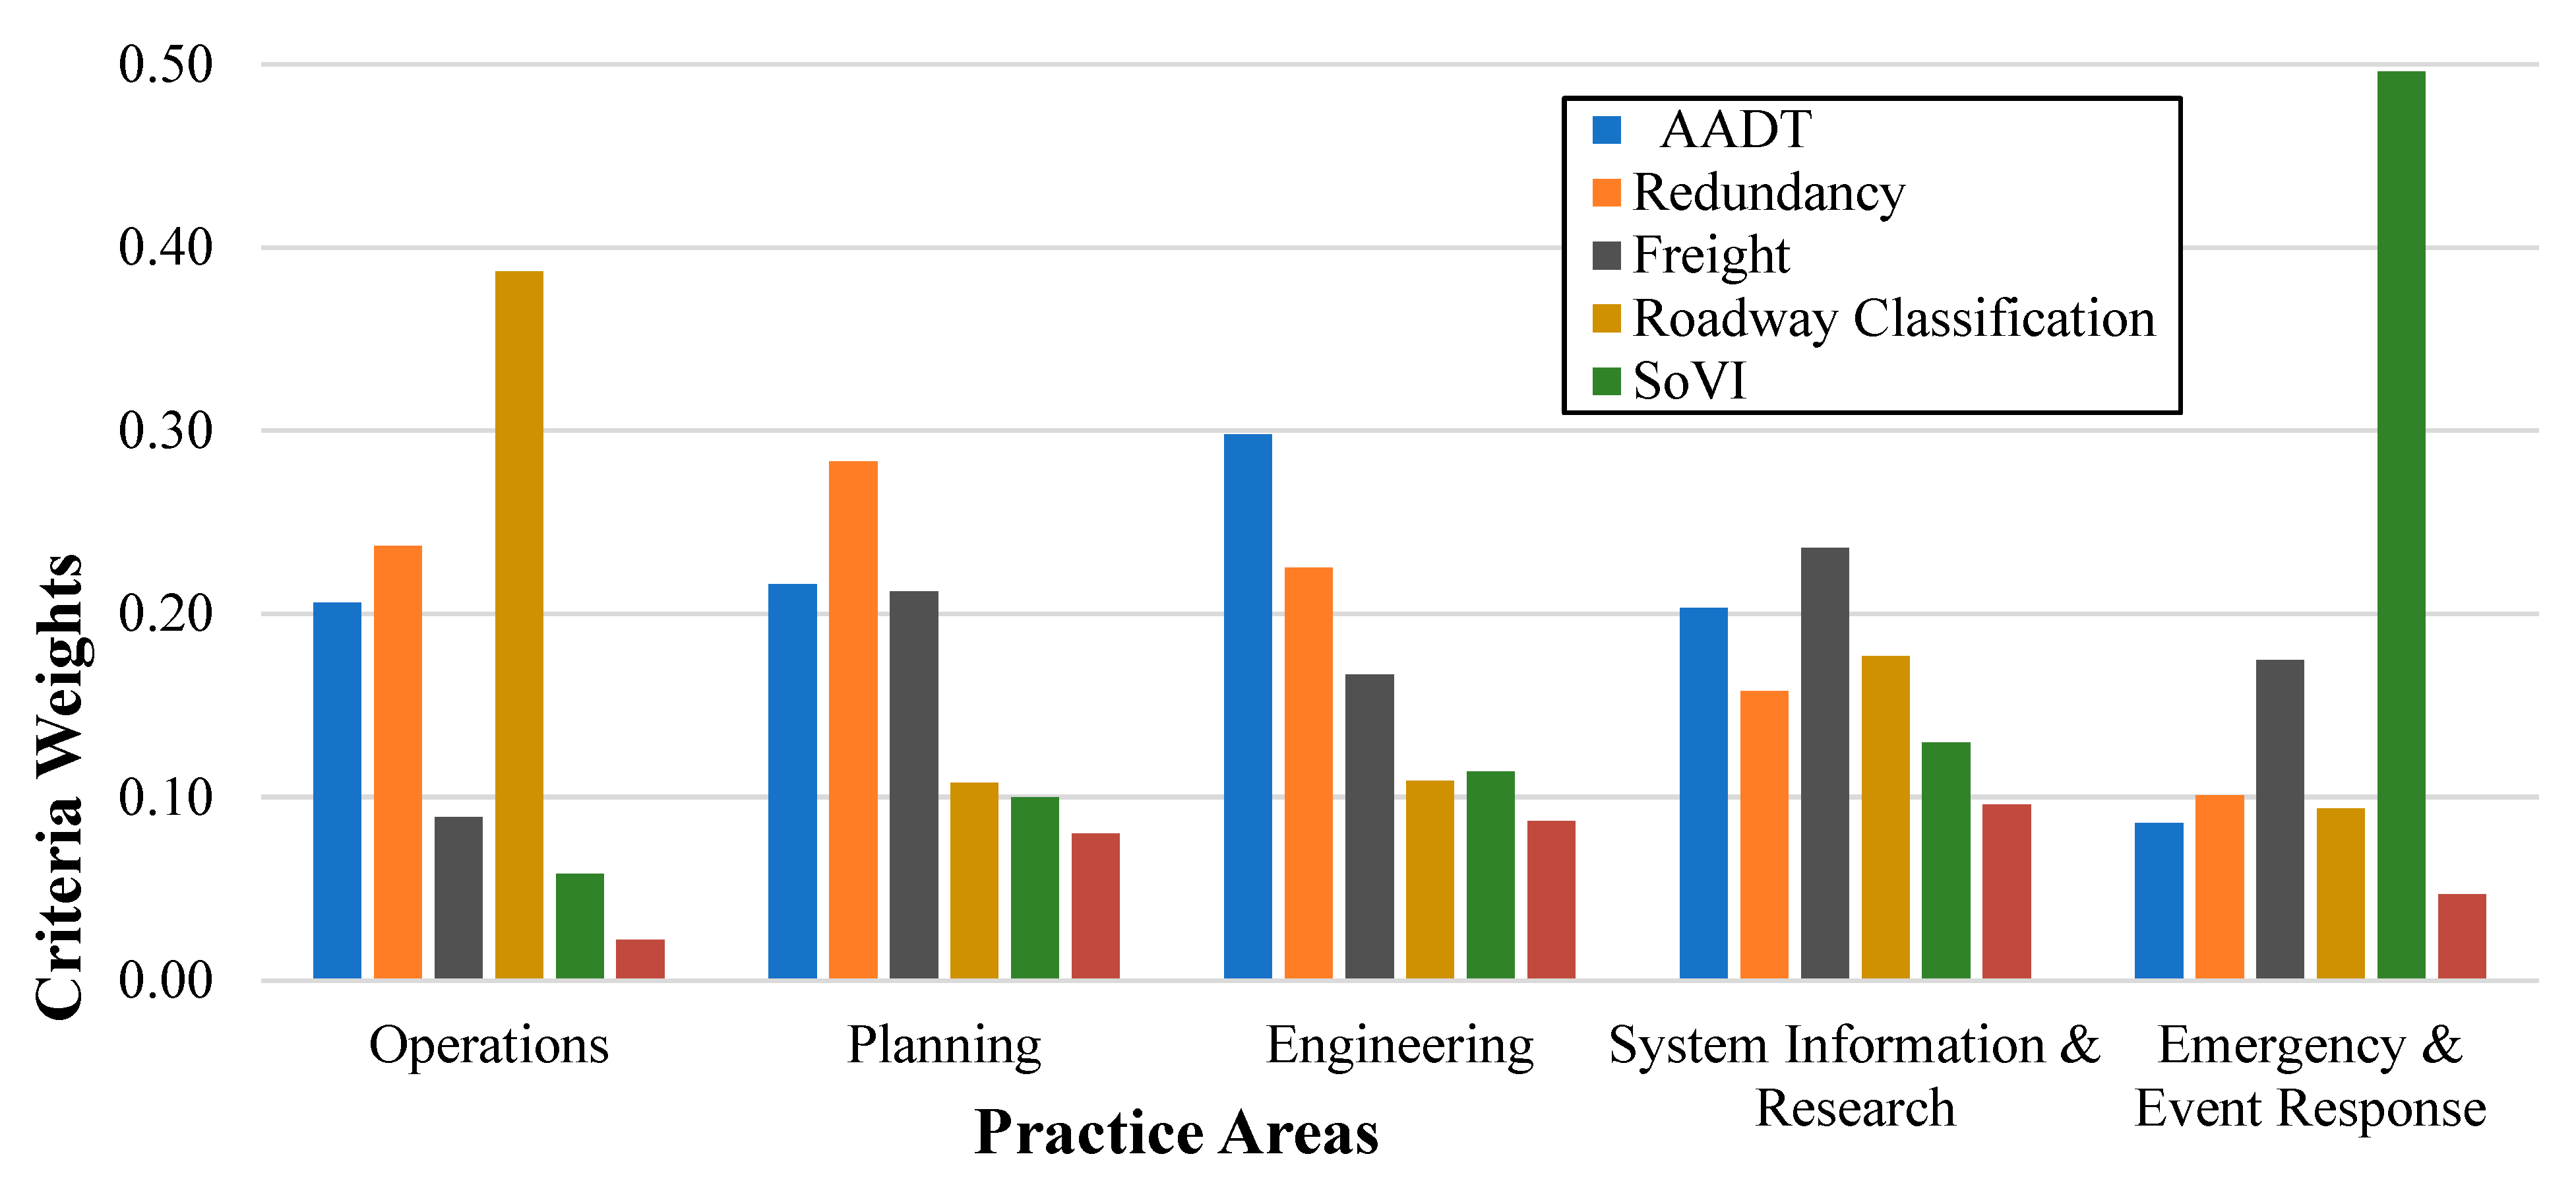
Figure 8.
Criteria Ranking and Weights of Practice Area of Respondents.
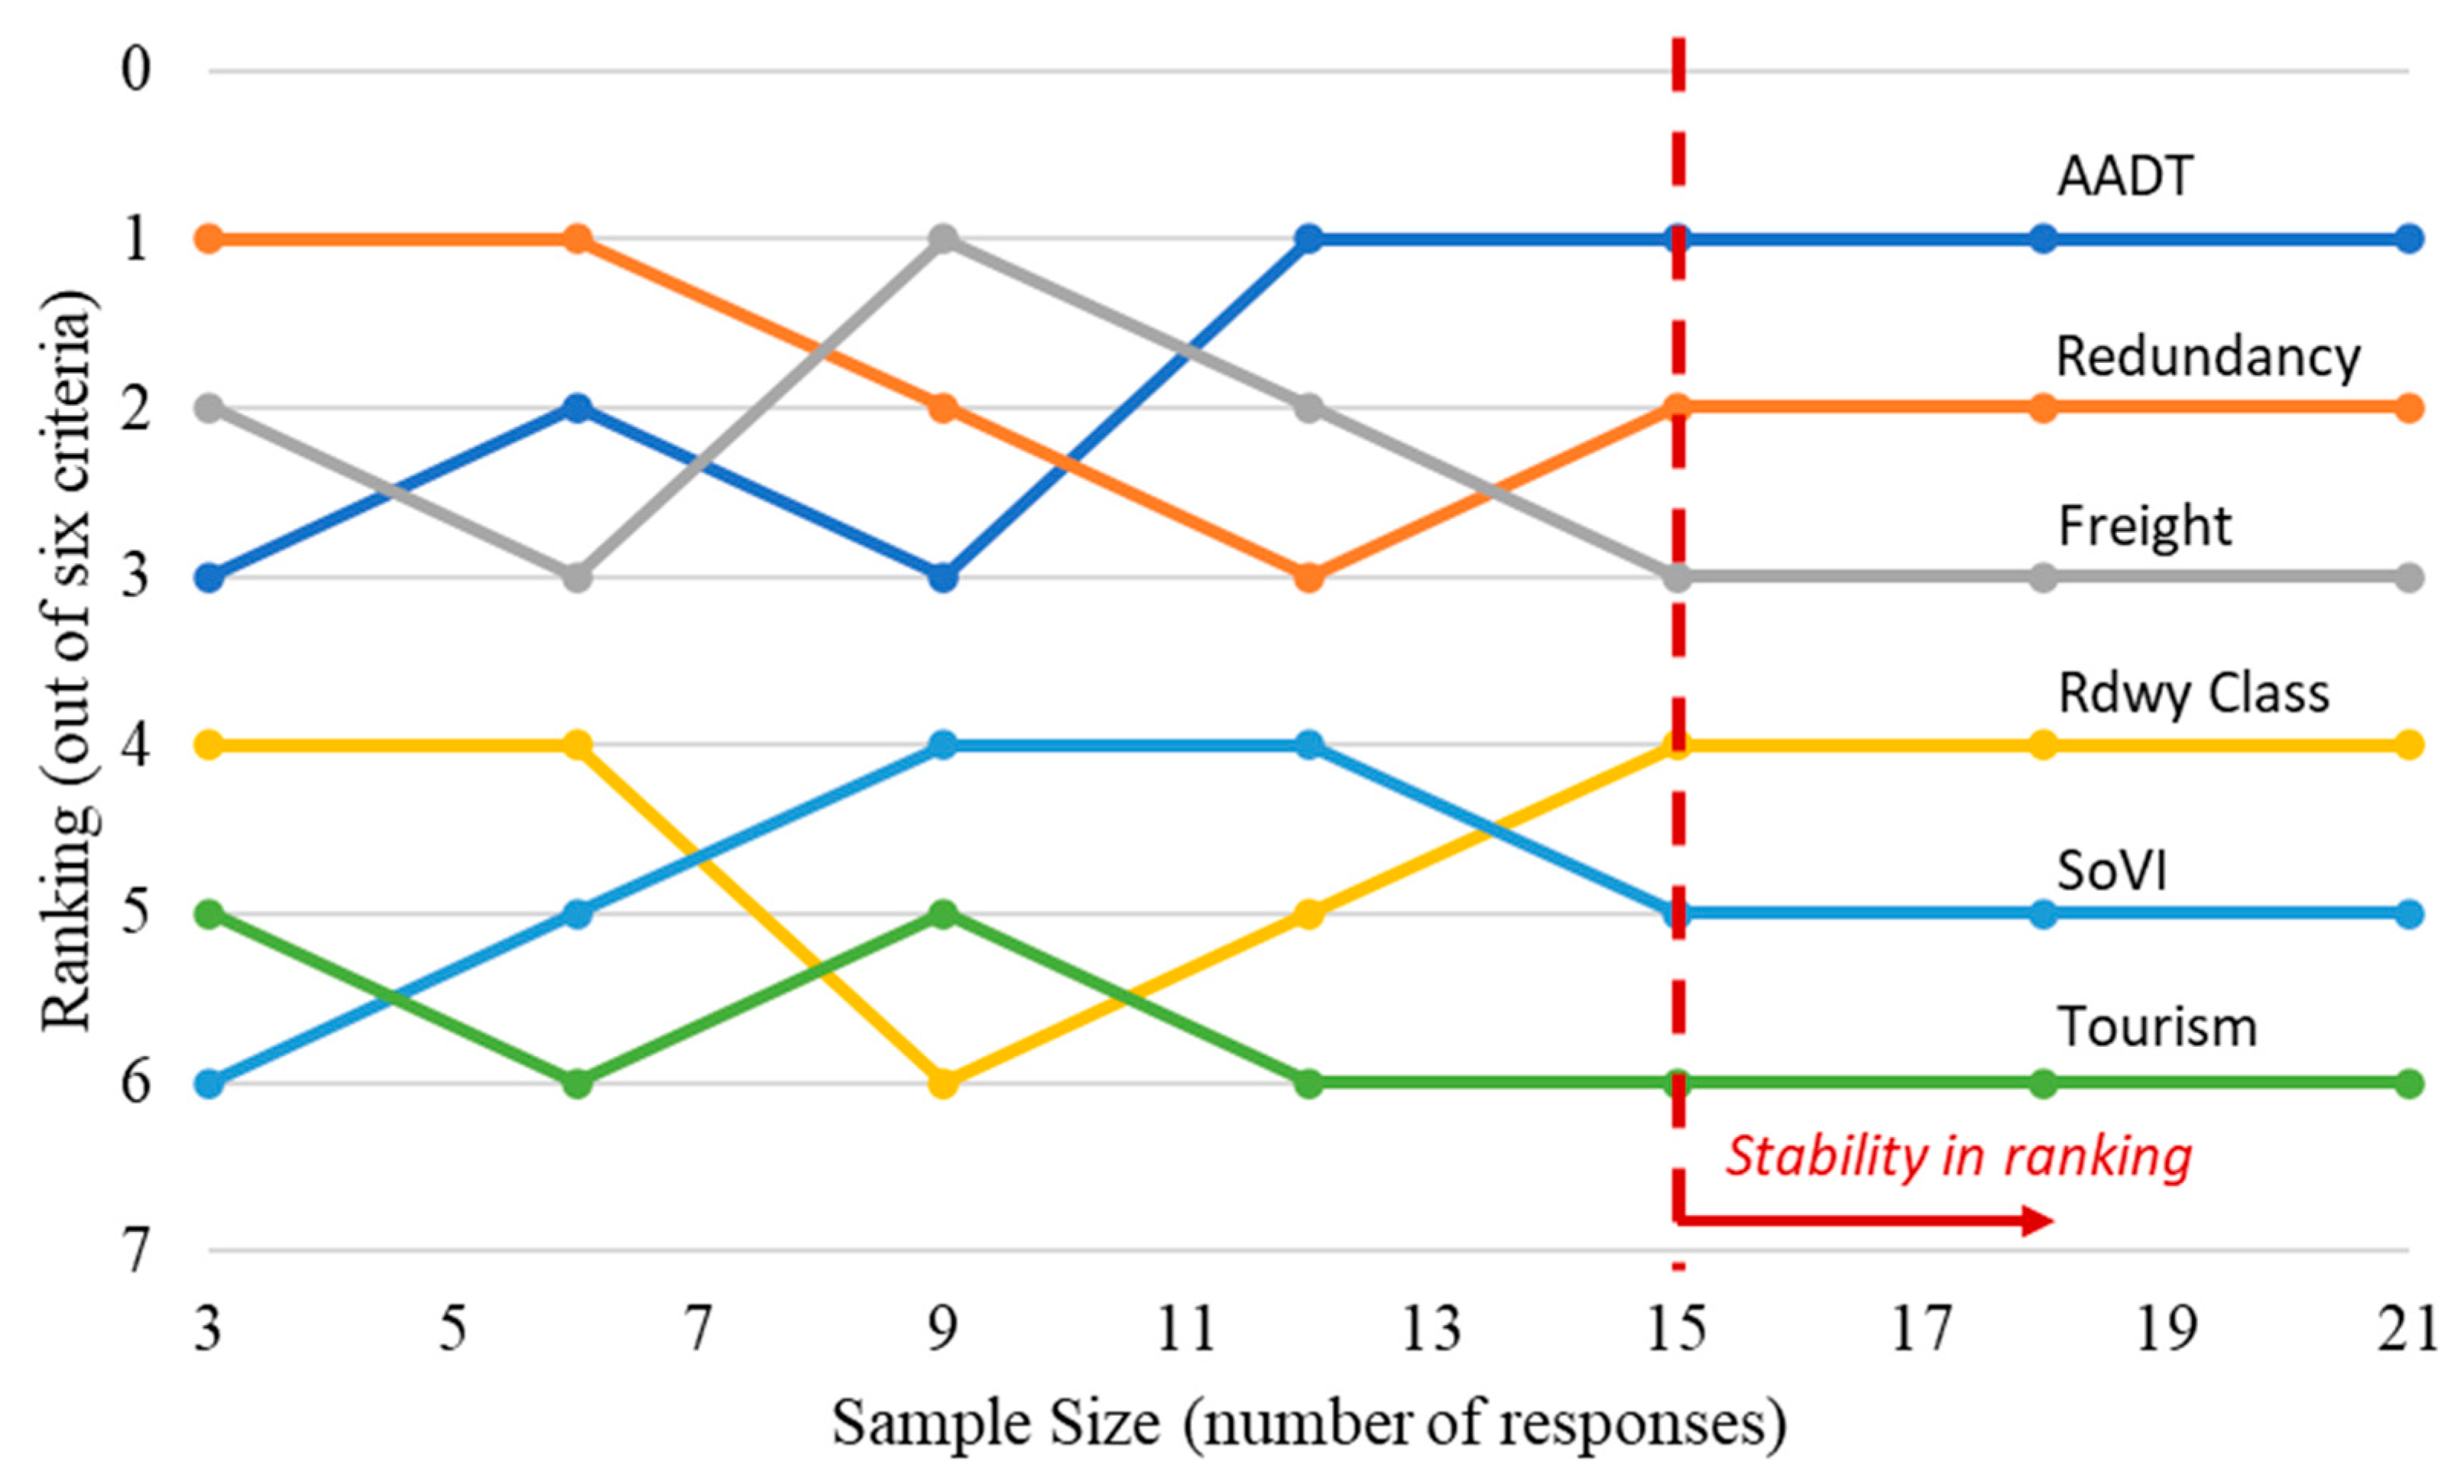

Table 1.
Criticality Measures Defined by CDOT Study.
| Criteria | Definition | Resolution |
|---|---|---|
| Annual Average Daily Traffic (AADT) |
Daily traffic volume for each roadway link. | Link |
| Roadway Classification | Functional class of roadway link: Interstate, Freeways & Expressways, Principal Arterials, Minor Arterials, and Major Collectors. |
Link |
| Freight | Freight value in Millions of US dollars by county for the year. |
County |
| Tourism | Tourism value as expressed as Total County Expenditures in Millions of US dollars by county. |
County |
| Social Vulnerability Index (SoVI) | SoVI measures the social vulnerability of US counties to environmental hazards. It is an indicator comprised of 29 socioeconomic variables that contribute to a county’s ability to prepare for, respond to, and recover from hazards | County |
| Redundancy | The amount of additional travel time added to the network when a link is non-operational. | Link |
Table 2.
Fundamental Scale for Paired Comparisons.
| Scale | Judgment of preference | Description |
|---|---|---|
| 1 | Equally important | Two factors contribute equally to the objective |
| 3 | Moderately important | Experience and judgment slightly favor one over the other |
| 5 | Strongly important | Experience and judgment strongly favor one over the other |
| 7 | Very strongly important | Experience and judgment very strongly favor one over the other, as demonstrated in practice |
| 9 | Extremely important | The evidence favoring one over the other is of the highest possible validity |
| 2,4,6,8 | Intermediate preferences between adjacent scales |
When compromise is needed |
Table 3.
Criteria Levels and Weights Derived from the Analytical Hierarchy Process (AHP) Method Applied to the State of Arkansas (Modified from [5]).
Table 3.
Criteria Levels and Weights Derived from the Analytical Hierarchy Process (AHP) Method Applied to the State of Arkansas (Modified from [5]).
| Criticality Score | ||||||
|---|---|---|---|---|---|---|
| Criteria | 1 Very Low Impact |
2 Low Impact |
3 Moderate Impact |
4 High Impact |
5 Very High Impact |
Weight |
| Annual Average Daily Traffic (AADT) |
<=720 | 721-1900 | 1901-4600 | 4601-15000 | >15000 | 0.240 |
| Redundancy | <=200 | 201-788 | 789-1870 | 1871-7500 | >12250 | 0.218 |
| Freight | <=800 | 801-2085 | 2086-3898 | 3899-12250 | >12250 | 0.186 |
| Roadway Classification | Major Collector |
Minor Arterial |
Principal Arterial |
Freeway Arterial |
Interstate | 0.144 |
| Social Vulnerability Index (SoVI) | -4.49-2.93 | -2.92-1.24 | -1.23-0.67 | -0.68-2.51 | 2.52-5.40 | 0.134 |
| Tourism | <=85 | 86-270 | 271-567 | 568-928 | >928 | 0.078 |
Disclaimer/Publisher’s Note: The statements, opinions and data contained in all publications are solely those of the individual author(s) and contributor(s) and not of MDPI and/or the editor(s). MDPI and/or the editor(s) disclaim responsibility for any injury to people or property resulting from any ideas, methods, instructions or products referred to in the content. |
© 2025 by the authors. Licensee MDPI, Basel, Switzerland. This article is an open access article distributed under the terms and conditions of the Creative Commons Attribution (CC BY) license (http://creativecommons.org/licenses/by/4.0/).
Copyright: This open access article is published under a Creative Commons CC BY 4.0 license, which permit the free download, distribution, and reuse, provided that the author and preprint are cited in any reuse.


