
Submitted:
12 May 2025
Posted:
13 May 2025
You are already at the latest version
Abstract
The seasonal variations, spatial distribution, and health risk assessment of 13 volatile organic compounds (VOCs), particularly benzene, toluene, ethyl benzene, and xylene (BTEX), in the ambient air of Dilovası, a Turkish city with unplanned urbanization and its share of environmental issues, were presented in this study. At 22 locations in Dilovası, air samples were collected separately for the summer and winter using passive tube sampling, and concentrations were measured using thermal desorption GC-MS. Pollution maps were created using the Golden Software Surfer Program and QGIS Desktop 3.42.0 Software. A health risk evaluation was conducted using the US Environmental Protection Agency's (USEPA) approach. The study's findings demonstrated that the atmospheric VOC concentrations at the sampling locations varied significantly by season and location. According to the Carcinogenic Risk Assessment, residents in this area may be more susceptible to cancer if they are exposed to benzene, ethylbenzene, and naphthalene over an extended period. It was determined by the Non-Carcigonenic Risk (HQ) evaluation that, while there was no significant risk for health effects at 21 measurement points, there was a substantial risk for non-cancer health effects at 1 measurement point. The significance of regulatory policies and pollution control technologies has once again emerged in this context.
Keywords:
Volatile organic compounds
; Passive sampling
; Spatial distribution
; Health risk assessment
; Dilovası
; Turkey
1. Introduction
As the population living in cities has increased rapidly in recent years, urban air pollution resulting from residential heating, industrial activities and vehicle traffic has become a significant problem causing deterioration of the quality of life and creating public health risks. Pollution-related problems are of interest especially in the urban areas of developing countries, as rapid urbanization, poorly managed transportation systems and irregular industrialization lead to rising levels of air pollution in populated regions and create pollution hotspot areas [1]. Therefore, many studies have been conducted to assess sources, levels, trends and health effects of the pollutants in urban areas [2,3,4].
Pollutants of concern in urban areas include traffic and industry-related volatile organic compounds (VOCs). Because these VOCs have become a global problem in the last decade due to their inhalation toxicity and secondary reaction potential. Several VOCs, particularly benzene, toluene, ethylbenzene, and xylenes (BTEX), are classified as hazardous air pollutants (HAPs) by the United States Environmental Protection Agency (US EPA) [2]. Prolonged exposure to HAPs can cause major health issues. Benzene, for example, is a hematotoxic chemical that can cause myeloid leukemia and aplastic anemia, and poses risks to the lymphatic, central nervous, and blood-forming systems. Furthermore, maternal exposure to high concentrations of benzene can cause neural tube defects in infants [5,6]. Benzene is the most toxic chemical in the BTEX family [7]. According to the International Agency for Research on Cancer (IARC), benzene is classified as Category 1 of chemicals with confirmed carcinogenic effects [6]. Toluene, ethylbenzene, and xylenes are neurotoxic chemicals that have been associated with brain diseases, eye irritation, skin inflammation, premature birth, and respiratory, liver, and kidney issues. The risk levels and types of linked disorders differ based on the specific VOCs [2]. Therefore, monitoring BTEX in the lower atmosphere has become a priority in recent years for both human and ecosystem health [1].
Several studies were done in the Dilovası area of Kocaeli in the Marmara Region to monitor pollution levels in ambient air, soil, surface and ground water, and sediments [9,10,11,12,13,14,15,16,17,18]. It serves as a negative symbol of Turkey’s urbanization history, with its uncontrolled industries and transportation network because it is an example district. It is situated on the Marmara Sea coast between the metropolitan cities of Istanbul and Kocaeli. Due to its topographic conditions, the region is lower than the surrounding areas and is bowl-shaped. This condition has a negative impact on the dilution of pollutants discharged into the atmosphere by vehicles and industrial sites. Because of this, the district is impacted by nearly every kind of environmental pollution.
This study presents the seasonal fluctuations, spatial distribution, and health risk assessment of the levels of 13 volatile organic compounds (VOCs), especially benzene, toluene, ethyl benzene and xylene (BTEX), in the ambient air of Dilovası, which which is affected by adverse environmental problems. Within the scope of the study, air samples were collected by passive tube sampling at twenty-two locations in Dilovası (Figure 1) and concentrations of the samples were determined by thermal desorption GC-MS. Golden Software Surfer Program and QGIS Desktop 3.42.0 Software were used to create distribution maps based on the determined concentrations. Health risk assessment was performed using the methodology of the United States Environmental Protection Agency (USEPA).
Monitoring VOC, particularly BTEX, has become even more crucial in the Dilovası district in the current climate due to the district’s growing population, which has grown from about 44,000 in the 2010s to 55,000 now [19]. Parallel to population growth, traffic has also intensified, and people have spent more time driving from work to household. Recently, it has been reported that cancer has become the main cause of death in the region [10]. Therefore, determining the district’s air quality parameters is extremely beneficial.
It is believed that this study, which assesses VOC, particularly BTEX profiles, in this crucial settlement area linked to high cancer incidence rates, is significant in terms of highlighting these areas and bringing attention to the environmental issues caused by unplanned urbanization. This and similar studies will make important contributions to the literature for developing effective air pollution reduction strategies in which the concentrations of pollutants and their behavior in the ambient air of urban areas are determined.
2. Materials and Methods
2.1. Sampling and Analysis
In 2022, passive sampling was carried out at 22 sampling points in Dilovası city for 14 days. Sampling was carried out in two different periods, summer and winter.
Air samplers were placed approximately 1.5 meters above the ground on a level, horizontal surface. Samples were gathered in Tenax TA sorbent-filled tubes using a personal air sampling pump (SKC Pump) at a flow rate of 80–85 mL/min over 45 min [21]. An SKC Defender 510 calibrator was used to set the pumping flow rate prior to each sampling session, and it was verified at the conclusion of the session to make sure it had not altered (Figure 2). The test tubes underwent cleaning and conditioning. Relative humidity and indoor temperature were recorded. The US EPA method TO-17 served as the basis for the study’s VOC sampling [22]. Following VOC sampling, the sorbent tubes were promptly sealed, placed in a cooler box, brought into the lab, and kept at -20 °C until analysis. Every analysis was conducted at Bolu Abant Izzet Baysal University’s Scientific Industrial and Technological Applications and Research Center (SITARC).
The samples collected were analyzed by thermal desorber (Markes-TD-100) and GC (Thermo Scientific 1300) MS (Thermo Scientific ISQ- QC) instruments by selective ion monitoring (SIM). The column utilized was a fused-silica capillary column (TG-624, ID: 0.25 mm, Length: 30 m, Film: 1.4 μm), and the carrier gas was helium. The GC temperature programming was kept at 65°C to 170°C with a steady rise of 5°C/min. After that, the temperature was raised by 10°C/min to 220°C and held isothermally at 220°C for another 5 minutes. The ion source temperature was 150 °C, the interface temperature was 230 °C, and the MS was conducted at 70 eV. The National Institute of Standards and Technology (NIST) database, which has over 62,000 patterns, was used to interpret the GC-MS mass spectrum.
2.3. Distribution Maps
The coordinates of the sampling points in the study were taken from the UTM WGS84 Zone 35N system and the points were processed on the map using the Golden Software Surfer Program. The Triangulation with Linear Interpolation gridding method was used to transform the data corresponding to each point in the data file into a grid file. Then, the map image corresponding to the study area was taken with coordinates from the QGIS Desktop 3.42.0 Software OpenStreetMap map file. Ultimately, these two files were superimposed in Surfer software to create the final distribution maps.
2.4. Health Risk Assessment
Health risk assessment is performed for cancer and non-cancer risks of the VOCs. Among the VOCs studied, benzene, ethylbenzene and napthalene are classified as carcinogenic chemicals, while all VOCs except for n-propylbenzene, sec-butylbenzene, 4-isopropyltoluene and n-butylbenzene have non-carcinogenic effects. In the study, the assessment of the cancer and non-cancer health risks was carried out by adopting the inhalation pathway methodology of United States Environmental Protection Agency (USEPA) [23]. The daily exposure (E) of an individual compound through inhalation was assessed by Eq. 1
where E is the Daily exposure (mg/kg/day) and C is pollutant concentration in air (mg/m3). Then the effective lifetime exposure (EL) was estimated from Eq. 2.
E = C x IR x ED / BW
EL = E x (D/7) x (WK/52) x YE / YL
The integrated lifetime cancer risk (ILTCR) was calculated from Eq. (3)
where, CPF is the carcinogenic potency factor or cancer slope factor. The inhalation cancer slope factor of carcinogenic compounds was taken from Risk Assessment Information System (RAIS) [24]. For the assessment, a cancer risk of >10-6 was considered as “carcinogenic effect of concern, while a value <10-6 was considered as “acceptable level” [6].
ILTCR = EL x CPF
On the other hand, risk assessment for non-carcinogenic effects was expressed by hazard quotient (HQ) defined as the ratio of yearly average concentration (CAVG) and the reference concentration (RfC) calculated according to Eq. (4).
HQ = CAVG / RfC
RfC is defined as the inhalation reference concentration of the non carcinogenic compounds, and RfCs of the compounds were obtained from the Integrated Risk Information System (IRIS) [24]. An HQ of >1 is considered “adverse non-carcinogenic effect of concern” while a value HQ < 1 is considered “acceptable level”. Summation of HQs for individual contaminants gives Hazard Index (HI) [5,25].
All the exposure parameters and CPF and RfC values used in health risk assessment are tabulated in Table 1.
3. Results and Discussion
3.1. Concentration of VOC in the Ambient Air
In the Dilovası district of Kocaeli Province, the average concentrations of VOCs during the summer and winter months were as follows: 0.43 μg/m3 benzene, 6.69 μg/m3 toluene, 4.29 μg/m3 ethylbenzene, 16 μg/m3 p-xylene, 1.32 μg/m3 o-xylene, 0.22 μg/m3 isopropylbenzene, 0.35 μg/m3 n-propylbenzene, 0.55 μg/m3 1,2,4-trimethyl benzene, 2.13 μg/m3 1,3,5-trimethyl benzene, 4.52 μg/m3 sec-butylbenzene, 3.90 μg/m3 4-isopropyltoluene, 4.02 μg/m3 n-butylbenzene, and 3.71 μg/m3 n-butylbenzene. The concentrations of benzene, toluene, ethylbenzene, and m,p-xylene were found to be higher in summer than in winter (58%, 25%, 63%, and 81%, respectively), while other pollutants were found to be higher in the winter. The results were shown graphically in Figure 2. Seasonal variation of VOC is mainly controlled by the changes of mixing height, stationary and mobile sources, transport from neighboring states, photochemical loss from solar radiation, wet deposition and conversion to secondary organic aerosol [26]. Therefore, although the findings of the study were consistent with those of some articles [27,28], they contradicted others [5,6,26,29,30].
m,p -Xylene was determined to be the most prevalent VOC among those evaluated in the research region (Figure 2). The average concentration in summer was 26.89 µg/m3, and the average concentration in winter was 5.11 µg/m3. The combustion process of engines and traffic is the main cause of the preponderance of xylene, as the majority of cars are powered by gasoline or diesel. There were 34.1% diesel automobiles, 31.9% LPG cars, 30.2% gasoline-powered cars, 2.4% hybrid cars, and 1.1% electric cars among the vehicles registered for use in Turkey in 2024. The percentage of cars with unknown fuel type was 0.2%. Heavy commercial vehicles are fueled by diesel and liquefied natural gas (LNG) [31]. Diesel internal combustion engine emissions, evaporative emissions of gasoline, natural gas combustion, and vehicle exhaust are the largest contributors to ambient levels of VOCs [32]. According to the study by Srivastava et al., xylene is the primary species that differs between the exhaust of gasoline and diesel vehicles, with diesel exhaust being the primary source of xylene [33]. Dilovası, which was chosen as the study area, is one of the important industrial areas of Kocaeli. It is located at a strategic point in the transition to Istanbul. It is on the E-5 and Northern Marmara Motorway route. Its status as a port city, also makes it frequent route for huge commercial vehicles. The daytime population increases with the crowd created by thousands of employees coming to work in the industrial establishments in the district. Therefore, there is always heavy traffic in the district. This naturally makes xylene dominant.
While the average concentration of benzene, toluene, ethyl benzene and xylene total (ΣBTEX) in the region was determined as 41,793 µg/m3 in summer, its average concentration in winter was determined as 15,655 µg/m3 (Figure 2). It is thought that the high ΣBTEX concentration in summer may be due to the low decomposition rate. Additionally, traffic fluctuates based on the season. Summertime traffic in the city was heavier than wintertime traffic [34]. Another factor that could contribute to a drop in BTEX concentration is the usual winter weather. According to Mullaugh et al. (2015), precipitation quickly spreads atmospheric BTEX to various environmental media like soil, plants, and roadbeds [35]. Wintertime’s slower rate of dissipation could be the cause of the greater amounts of VOCs other than BTEX that are observed during this season.
The study’s results were compared to those of other studies that were carried out in the same district in the past, by Ergenekon et al. (2009), Pekey and Yılmaz (2011) and Pekey et al. (2015), as well as with measurement results requested by an official letter from the Marmara Clean Air Center Directorate [15,18,36]. The results are shown in Figure 3. The ΣBTEX concentration, which was found average 28.724 µg/m3 in this study, was between 9.311 to 96.820 µg/m3 in prior years. When analyzed in terms of pollutant type dominance, Pekey and Yılmaz (2011) stated that xylene was a dominant pollutant in 2011, which aligns with the findings of this study [15]. According to research by Ergenekon et al. (2009), and Pekey et al. (2015), the concentration of toluene was found to be higher than that of other VOCs, indicating a particular level of VOC pollution [18,36]. It is an expected result that variations in concentration will occur based on the pollutant type and the year. The differences can be partly explained by differences in sampling strategy (sampling frequency, sampling period, and sampler type), but also by traffic, stationary emission sources, and meteorological conditions.
When the seasonal changes in BTEX concentrations were examined per station (Figure 4), it was observed that the seasonal changes of all compounds were not uniform. Out of 22 sampling points, higher concentrations of benzene were found at two (6 and 19) , higher concentrations of toluene at ten (2, 6, 9, 10, 11, 14, 15, 16, 17, and 19) , higher concentrations of ethyl benzene at six (6, 9, 14, 16, 17, 19) , and higher concentrations of xylene at six (6, 9, 14, 16, 17, 19) during the winter. The highest level of annual average ΣBTEX was measured at the 20th sampling point (165.07 µg/m3) where industry and traffic coexist.
Ratios between species were analyzed to compare BTEX emission sources, and Table 2 shows the findings. To differentiate solvent-related effects from vehicle-related effects, the toluene/benzene (T/B) ratio is used as a predictor. For example, a higher abundance of toluene is generally due to solvent usage and evaporation, while benzene indicates more fuel combustion [37]. A T/B ratio ranging from 1.5 to 4.3 indicates fuel combustion, while ratios outside this range are classified as other sources [27]. In particular, a T/B ratio exceeding 10 is considered a strong indicator of solvent effects [38]. The variations in T/B ratios were displayed in Table 1. While the highest T/B ratio was observed at the 5th sampling point with a value of 94.929 µg/m3, the lowest T/B ratio was observed at the 8th sampling point with a value of 1.522 µg/m3. T/B ratios between 1.5 and 4.3 were 23%, and those above 10 were 46%. The results demonstrated that industries dominated the district despite the substantial impact of traffic. The area is home to numerous ports, organized industrial zones, chemical, petroleum, rubber, iron and steel, and LPG storage tanks. It is situated in our nation’s main axis of industrial development. It is evident that VOC concentrations are impacted by emissions from large, medium, and small industrial operations.
The xylene to ethylbenzene ratio (X/E) is another useful diagnostic index to estimate VOC sources. The ratio of the two compounds is frequently employed as an indicator of the photochemical reaction because the rate at which OH radicals react with m/p/o-xylene is substantially faster than that of ethylbenzene in the atmosphere. The value of X/E<3 indicates a higher potential for m/p/o-xylene and OH radical reactions, a shorter VOC residence time in ambient air, and the presence of an aging air mass [38]. All X/E ratios that were determined within the scope of the study (Table 2) were found to be greater than 3, indicating the presence of fresh air pollution in the district.
Benzene-toluene (B/T) and xylene-benzene (X/B) ratios are also commonly used for preliminary assessment of the age of air masses and determination of VOC sources, based on photochemical reactivity estimates. It has been suggested that B/T ratio <0.4 and X/B ratio >1.1 indicate a young air parcel (local sources), while B/T≥0.4 and X/B≤1.1 indicate an old air parcel [38]. As seen in Table 1, 96% of the calculated B/T ratios were <0.4 and X/B ratios were >1.1, indicating that most of the air parcels in the district are clean air masses. Therefore, industrial activities and transportation, including local vehicle exhausts, were considered as one of the dominant VOC sources in the sampling area.
3.2. Spatial Analysis of BTEX and Naphthalene
Distribution maps were created for pollutants whose concentrations were determined at 22 measurement points and the distribution maps of ΣBTEX for the summer and winter seasons were given in Figure 5. Examining Figure 5, it was evident that the highly inhabited area where housing, industry, and traffic were linked has a higher concentration distribution. In terms of ΣBTEX concentrations, the region where the 2nd measurement point, 5th measurement point and 20th measurement point are located is particularly noteworthy. In summer, the concentration reached 326 µg/m3 in this region and 130 µg/m3 in winter. This area is an area of heavy traffic, high-density buildings and small industrial areas. The results can be attributed to these sources.
Individual BTEX compound distribution maps were made for the area with a higher pollution density than other areas; these maps are shown in Figure 6. Upon examining the maps, it was discovered that 2nd measurement point had the highest concentration of benzene during the summer, with 3.70 µg/m3, 5th measurement point had the highest concentration of toluene, with 64.56 µg/m3, and 20th measurement point had the highest concentrations of ethyl benzene and total xylene, at 57.42 µg/m3 and 243.76 µg/m3, respectively. In winter, benzene was again found to be higher at 2nd measurement point with 2.22 µg/m3 compared to the other measurement points. Concentrations of toluene and ethyl benzene were found to be higher at 2nd measurement point with concentrations of 58.67 µg/m3 and 22.84 µg/m3, unlike summer measurements. Total Xylene was found to be higher at the 6th measurement point with a concentration of 61.86 µg/m3 compared to other points. The results showed that, among the 20 measurement points, 4 measurement points in particular stood out with high individual BTEX concentrations due to processes such as vehicle traffic, solvent use, painting processes and thinner use.
According to the National Air Quality Assessment and Management Regulation, the annual average benzene concentration in ambient air should not exceed 5 μg/m3 [39]. The average benzene concentrations at the measurement stations were 0.60 µg/m3 for the summer and 0.25 µg/m3 for the winter. Since the average value was 0.43 µg/m3, no limit value exceedance was discovered when the measurement results were examined in this regard.
Among the VOCs measured in the study area, distribution maps for Naphthalene were created in addition to BTEX and the maps obtained were given in Figure 7. When the maps are analyzed, it was seen that 1st measurement point had the highest concentration of naphthalene in the summer (12.16 µg/m3), while 2nd measurement point had the highest concentration in the winter (137.33 µg/m3). This seasonal variation in concentration is thought-provoking. Open air sources of naphthalene mostly come from fugitive emissions and motor vehicle exhaust. Naphthalene is released into the atmosphere by evaporation, photolysis, adsorption, biodegradation, and land and water spills that occur during the storage, transportation, and disposal of coal tar and fuel oil [40]. As a result, the measurements of naphthalene conducted during this study point to fugitive emissions.
3.3. Health Risk Assessment of VOCs
Health risk assessment for cancer and non-cancer risks of VOCs was carried out seasonally separately, health risk exposure distribution maps for benzene, ethylbenzene and naphthalene compounds classified as carcinogenic chemicals among the examined VOCs and non-carcinogenic effects of all VOCs except n-propylbenzene, sec-butylbenzene, 4-isopropyltoluene and n-butylbenzene were given in Figure 8. The Carcinogenic Risk (ILTCR) at 22 measurement stations was found to be between 6.7E-07 and 8.3E-05 during the summer and between 1.8E-07 and 9.4E-04 during the winter. Especially in the summer season, 19 out of 22 measurement points were above the Carcinogenic Risk (ILTCR) limit value of 1E-06. The same was not true for the winter season. 9 out of the 22 measurement locations showed values over the limit value. However, in the winter period, 2nd measurement point attracted attention with its ILTCR value of 9.4E-04. The findings indicate that residents of this area may be more susceptible to cancer if they are exposed to benzene, ethylbenzene, and naphthalene over an extended period of time. When the calculated Non-Carcigonenic Risk (HQ) values were examined, it was seen that the HQs were between 0.008 and 0.848 in the summer season. In the winter season, it was seen that it was between 0.003 and 0.132 at all measurement points except the 2nd measurement point. Since it is less than 1, it was founded that there is no significant risk of non-cancer health impacts at the other measurement points except for one measurement point in the study area. The HQ value at the 2nd measurement site was determined to be 9.338. This indicates that there is a considerable risk of non-cancer health effects in this area.
5. Conclusions
This study, which was carried out in one of Turkey’s most crucial regions, once again produced significant information regarding the region’s pollution The study’s findings demonstrated that the atmospheric VOC concentrations at the sampling locations varied significantly by season and location. In comparison to other measurement station, higher concentrations were detected at stations 2, 5, 6, and 20 for the BTEX measurement and at station 2 for the naphthalene measurement. Upon closer inspection, it was found that these locations were surrounded by industrial activity and considerable traffic. Particularly, there are industrial facilities that produce a lot of pollution, like those that melt metal and scrap, make paint and thinner, work in the chemical and cosmetic industries, or recycle plastic. In addition, because of its closeness to ports, traffic on the E-5 and TEM highways is heavy. Long-term exposure to benzene, ethylbenzene, and naphthalene may raise the risk of cancer development for residents of this area, according to the findings of the Carcinogenic Risk Assessment. The Non-Carcigonenic Risk (HQ) evaluation found that while there was no significant risk for health effects at 21 measurement points, there was a significant risk for non-cancer health effects at 1 measurement point (2nd measurement point).
The study has once again demonstrated how crucial it is to implement better regulations and pollution control systems. Because Dilovası’s urban settlement grew haphazardly rather than according to the plan, industry, traffic, and settlements have entwined and adversely impacted one another. Thorough research is important in this city and other comparable ones that have emerged as a prime example of utterly inadequate design. It is suggested that environmentally polluting industries be developed, traffic be controlled, industry-intertwined settlements be replanned, environmental and life quality be improved, and an urban structure be established that guarantees the continuation of a healthy social life.
Limitations of the study: The current study is limited to only summer-winter seasonal measurements. Day/night variation and source distribution were out of scope. However, the current analysis of VOC samples in the highly polluted city of Dilovası showed that traffic and industrial emissions were dominant. Despite the limitations, the findings from this study demonstrated the urgent need for regulatory actions. To lessen the Dilovası population’s exposure to these dangerous pollutants, policymakers should more effectively develop and implement policies. To lower the health risks associated with BTEX exposure, particularly for people residing close to the identified hotspots, better regulations and pollution control technologies are advised.
Author Contributions
AK: Methodology, Data Editing, Health Risk Assessment, Writing-review&editing. EA: Data Editing, Programming using Quantum GIS. ŞÇD: Investigation, Data Editing, Writing-original draft, Writing-review&editing. GÖ: Investigation, Sampling. Analysis.
Funding
The project was funded by Kocaeli University (Project No: FDK-2020-2178).
Institutional Review Board Statement
Not applicable.
Informed Consent Statement
Not applicable.
Data availability: All data used in the creation of tables and figures are available from the corresponding author upon request.
Conflicts of Interest
The authors declare no conflicts of interest.
Abbreviations
The following abbreviations are used in this manuscript:
| BTEX | Benzene, Toluene, Ethyl Benzene, And Xylene; |
| CPF | The Carcinogenic Potency Factor Or Cancer Slope Factor; |
| HAPs | Hazardous Air Pollutants; |
| HI | Hazard Index; |
| HQ | Hazard Quotient; |
| IARC | the International Agency for Research on Cancer; |
| ILTCR | Integrated Life Time Cancer Risk; |
| LNG | Liquefied Natural Gas; |
| NIST | The National Institute of Standards and Technology; |
| RAIS | Risk Assessment Information System; |
| RfC | Reference Concentration; |
| SITARC | Scientific Industrial and Technological Applications and Research Center; |
| US EPA | U.S. Environmental Protection Agency; |
| VOCs | Volatile Organic Compounds; |
References
- Moolla, R.; Curtis, C. J.; Knight, J. Assessment of occupational exposure to BTEX compounds at a bus diesel-refueling bay: A case study in Johannesburg, South Africa. Science of the Total Environment. 2015, 537, 51–57. [Google Scholar] [CrossRef] [PubMed]
- Kim, S. J.; Lee, S. J.; Hong, Y.; Choi, S. D. Investigation of priority anthropogenic VOCs in the large industrial city of Ulsan, South Korea, focusing on their levels, risks, and secondary formation potential. Atmospheric Environment. 2025, 343, 120982. [Google Scholar] [CrossRef]
- Guo, Y.; Liu, R.; Li, M.; Li, J.; Wang, X.; Xue, L.; Hou, K. Pollution investigation of wintertime VOCs in the coastal atmosphere of the Yellow Sea: Insights from on-line photoionization-induced CI-TOFMS. Science of the Total Environment. 2024, 957, 177568. [Google Scholar] [CrossRef] [PubMed]
- Shrestha, S.; Yoon, S.; Erickson, M. H.; Guo, F.; Mehra, M.; Bui, A. A. T.; Schulze, B. C.; Kotsakis, A.; Daube, C.; Herndon, S. C.; Yacovitch, T. I.; Alvarez, S.; Flynn, J. H.; Griffin, R. J.; Cobb, G. P.; Usenko, S.; Sheesley, R. J. Traffic, transport, and vegetation drive VOC concentrations in a major urban area in Texas. Science of the Total Environment. 2022, 838, 155861. [Google Scholar] [CrossRef]
- Kumari, S.; Baghel, N.; Lakhani, A.; Kumari, K. M. BTEX and formaldehyde levels at a suburban site of Agra: Temporal variation, ozone formation potential and health risk assessment. Urban Climate. 2021, 40, 100997. [Google Scholar] [CrossRef]
- Masih, A.; Lall, A. S.; Taneja, A.; Singhvi, R. Inhalation exposure and related health risks of BTEX in ambient air at different microenvironments of a terai zone in north India. Atmospheric Environment. 2016, 147, 55–66. [Google Scholar] [CrossRef]
- Hazrati, S.; Rostami, R.; Farjaminezhad, M.; Fazlzadeh, M. Preliminary assessment of BTEX concentrations in indoor air of residential buildings and atmospheric ambient air in Ardabil, Iran. Atmospheric Environment. 2016, 132, 91–97. [Google Scholar] [CrossRef]
- Beba, H.; Öztürk, Z. Investigation of models predicting NOx level in the sample region and the use of intelligent transportation system. Environmental Challenges. 2024, 16, 100990. [Google Scholar] [CrossRef]
- Yurdakul, S.; Çelik, I.; Çelen, M.; Öztürk, F.; Cetin, B. Levels, temporal/spatial variations and sources of PAHs and PCBs in soil of a highly industrialized area. Atmospheric Pollution Research. 2019, 10(4), 1227–1238. [Google Scholar] [CrossRef]
- Cetin, B.; Yurdakul, S.; Odabasi, M. Spatio-temporal variations of atmospheric and soil polybrominated diphenyl ethers (PBDEs) in highly industrialized region of Dilovasi. Science of the Total Environment. 2019, 646, 1164–1171. [Google Scholar] [CrossRef]
- Cetin, B.; Yurdakul, S.; Gungormus, E.; Ozturk, F.; Sofuoglu, S. C. Source apportionment and carcinogenic risk assessment of passive air sampler-derived PAHs and PCBs in a heavily industrialized region. Science of the Total Environment. 2018, 633, 30–41. [Google Scholar] [CrossRef] [PubMed]
- Yolcubal, I.; Gündüz, Ö. C.; Sönmez, F. Assessment of impact of environmental pollution on groundwater and surface water qualities in a heavily industrialized district of Kocaeli (Dilovası), Turkey. Environmental Earth Sciences. 2016, 75(2), 1–23. [Google Scholar] [CrossRef]
- Öztürk, N.; Ergenekon, P.; Seçkin, G. Ö.; Bayir, S. Spatial distribution and temporal trends of VOCs in a highly industrialized town in Turkey. Bulletin of Environmental Contamination and Toxicology. 2015, 94(5), 653–660. [Google Scholar] [CrossRef]
- Bingöl, D.; Ay, Ü.; Karayünlü Bozbaş, S.; Uzgören, N. Chemometric evaluation of the heavy metals distribution in waters from the Dilovasi region in Kocaeli, Turkey. Marine Pollution Bulletin 2013, 68, 134–139. [Google Scholar] [CrossRef] [PubMed]
- Pekey, B.; Yilmaz, H. The use of passive sampling to monitor spatial trends of volatile organic compounds (VOCs) at an industrial city of Turkey. Microchemical Journal. 2011, 97(2), 213–219. [Google Scholar] [CrossRef]
- Özbay, B.; Keskin, G. A.; Doǧruparmak, Ş. Ç.; Ayberk, S. Multivariate methods for ground-level ozone modeling. Atmospheric Research 2011, 102, 57–65. [Google Scholar] [CrossRef]
- Yaylali-Abanuz, G. Heavy metal contamination of surface soil around Gebze industrial area, Turkey. Microchemical Journal. 2011, 99(1), 82–92. [Google Scholar] [CrossRef]
- Ergenekon, P.; Öztürk, N. K.; Tavşan, S. Environmental air levels of volatile organic compounds by thermal desorption-gas chromatography in an industrial region envıronmental aır levels of volatıle organıc compounds by thermal desorp-tıon-gas chromatography ın an ındustrıal regıon. Fresenius Environmental Bulletin. 2009, 18, 1999–2003. Available online: https://www.researchgate.net/publication/289221960.
- Population, Dilovası Population, Retrieved March 31, 2025. https://www.nufusu.com/ilce/dilovasi_kocaeli-nufusu.
- Google Earth, Retrieved January 15, 2024. https://earth.google.com/.
- Lakestani, S. Volatile organic compounds and cancer risk assessment in an intensive care unit. International Journal of Biometeorology. 2024, 68, 1731–1739. [Google Scholar] [CrossRef]
- Compendium Method TO-17, Determination of Volatile Organic Compounds in Ambient Air Using Active Sampling Onto Sorbent Tubes, U.S. Environmental Protection Agency, EPA. Retrieved February 20, 2025. https://www.epa.gov/sites/default/files/2019-11/documents/to-17r.pdf.
- Integrated Risk Information System (IRIS), IRIS Agenda, U.S. Environmental Protection Agency, EPA. Washington, DC. Retrieved February 20, 2025. https://www.epa.gov/iris/iris-agenda.
- Risk Assessment Information System [RAIS], Toxicity Profile, 2010. Retrieved February 20. https://rais.ornl.gov/tools/tox_profiles.html.
- Tunsaringkarn, T.; Siriwong, W.; Rungsiyothin, A.; Nopparatbundit, S. Occupational exposure of gasoline station workers to BTEX compounds in Bangkok, Thailand. International Journal of Occupational and Environmental Medicine The College of Public Health Sciences, Chulalongkorn University, Bangkok 10330, Thailand. tkalayan@chula.ac.th. 2012, 3, 117–125. [Google Scholar]
- Mandal, T. K.; Yadav, P.; Kumar, M.; Lal, S.; Soni, K.; Yadav, L.; Saharan, U. S.; Sharma, S. K. Characteristics of volatile organic compounds (VOCs) at an urban site of Delhi, India: Diurnal and seasonal variation, sources apportionment. Urban Climate. 2023, 49, 101545. [Google Scholar] [CrossRef]
- Hosseini, S. A.; Abtahi, M.; Dobaradaran, S.; Hassankhani, H.; Koolivand, A.; Saeedi, R. Assessment of health risk and burden of disease induced by exposure to benzene, toluene, ethylbenzene, and xylene in the outdoor air in Tehran, Iran. Environmental Science and Pollution Research. 2023, 30(30), 75989–76001. [Google Scholar] [CrossRef]
- Khoshakhlagh, A.S.; Yazdanirad, S.; Mousavi, M.; Gruszecka-Kosowska, A.; Shahriyari, M.; Rajabi-Vardanjani, H. Summer and winter variations of BTEX concentrations in an oil refinery complex and health risk assessment based on Monte-Carlo simulations. Scientific Reports 2023, 12, 10670. [Google Scholar] [CrossRef]
- Raysoni, A. U.; Pinakana, S. D.; Luna, A.; Mendez, E.; Ibarra-Mejia, G. Characterization of BTEX species at Texas Commission on Environmental Quality (TCEQ) Continuous Ambient Monitoring Station (CAMS) sites in Houston, Texas, USA during 2018. Sustainable Chemistry for the Environment. 2025, 9, 100227. [Google Scholar] [CrossRef]
- Bauri, N.; Bauri, P.; Kumar, K.; Jain, V.K. Evaluation of seasonal variations in abundance of BTXE hydrocarbons and their ozone forming potential in ambient urban atmosphere of Dehradun (India). Air Quality, Atmosphere and Health 2016, 9, 95–106. [Google Scholar] [CrossRef]
- Distribution of Registered Cars According to Fuel Type, Turkish Statistical Institute. Retrieved February 20, 2025. https://data.tuik.gov.tr/Bulten/Index?p=Motorlu-Kara-Tasitlari-Nisan-2024-53456#:~:text=Nisan%20ay%C4%B1%20sonu%20itibar%C4%B1yla%20trafi%C4%9Fe%20kay%C4%B1tl%C4%B1%2015%20milyon%20562%20bin,%250%2C2.
- Singh, R.; Gaur, M.; Shukla, A. Seasonal and Spatial Variation of BTEX in Ambient Air of Delhi. Journal of Environmental Protection. 2016, 7, 670–688. [Google Scholar] [CrossRef]
- Srivastavaa, A.; Josepha, A.E.; Devottab, S. Volatile organic compounds in ambient air of Mumbai—India. Atmospheric Environment 2006, 40, 892–903. [Google Scholar] [CrossRef]
- Traffic Flow Characteristics and Traffic Parameters of State Roads, Ministry of Transport, General Directorate of Highways, 2009. Retrieved March 10, 2025 https://www.kgm.gov.tr/SiteCollectionDocuments/KGMdocuments/Yayinlar/YayinPdf/Devlet%20Yollar%C4%B1%20Trafik%20Ak%C4%B1m%C4%B1%20%C3%96zellikleri%20ve%20Trafik%20Parametreleri.pdf.
- Mullaugh, K.M.; Hamilton, J.M.; Avery, G.B.; Felix, J.D.; Mead, R.N.; Willey, J.D.; Kieber, R.J. Temporal and spatial variability of trace volatile organic compounds in rainwater. Chemosphere. 2015, 134, 203–209. [Google Scholar] [CrossRef]
- Pekey, H.; Pekey, B.; Arslanbas, D.; Bozkurt, Z.; Dogan, G.; Tuncel, G. Source identification of volatile organic compounds and particulate matters in an urban and industrial areas of Turkey. Ekoloji. 2015, 24(94), 1–9. [Google Scholar] [CrossRef]
- Ghosh, B.; De, M.; Rout, T. K.; Padhy, P. K. Study on spatiotemporal distribution and health risk assessment of BTEX in urban ambient air of Kolkata and Howrah, West Bengal, India: Evaluation of carcinogenic, non-carcinogenic and additional leukaemia cases. Atmospheric Pollution Research 2023, 14. [Google Scholar] [CrossRef]
- Le, T. H.; Lin, C.; Nguyen, D. H.; Cheruiyot, N. K.; Yuan, C. S.; Hung, C. H. Volatile organic compounds in ambient air of a major Asian port: spatiotemporal variation and source apportionment. Environmental Science and Pollution Research. 2023, 30, 28718–28729. [Google Scholar] [CrossRef] [PubMed]
- Legislation information system of the Republic of Turkey, National Air Quality Assessment and Management Regulation, Date 09/09/13 and Number 31677. Retrieved April 20, 2025. https://www.mevzuat.gov.tr/mevzuat?MevzuatNo=12188&MevzuatTur=7&MevzuatTertip=5.
- Buckpitt, A.; Kephalopoulos, S.; Koistinen, K.; Kotzias, D.; Morawska, L.; Sagunski, H. Naphthalene. In: WHO Guidelines for Indoor Air Quality: Selected Pollutants. Geneva: World Health Organization. 2010. https://www.ncbi.nlm.nih.gov/books/NBK138704/.
Figure 1.
Study area [20].
Figure 1.
Study area [20].
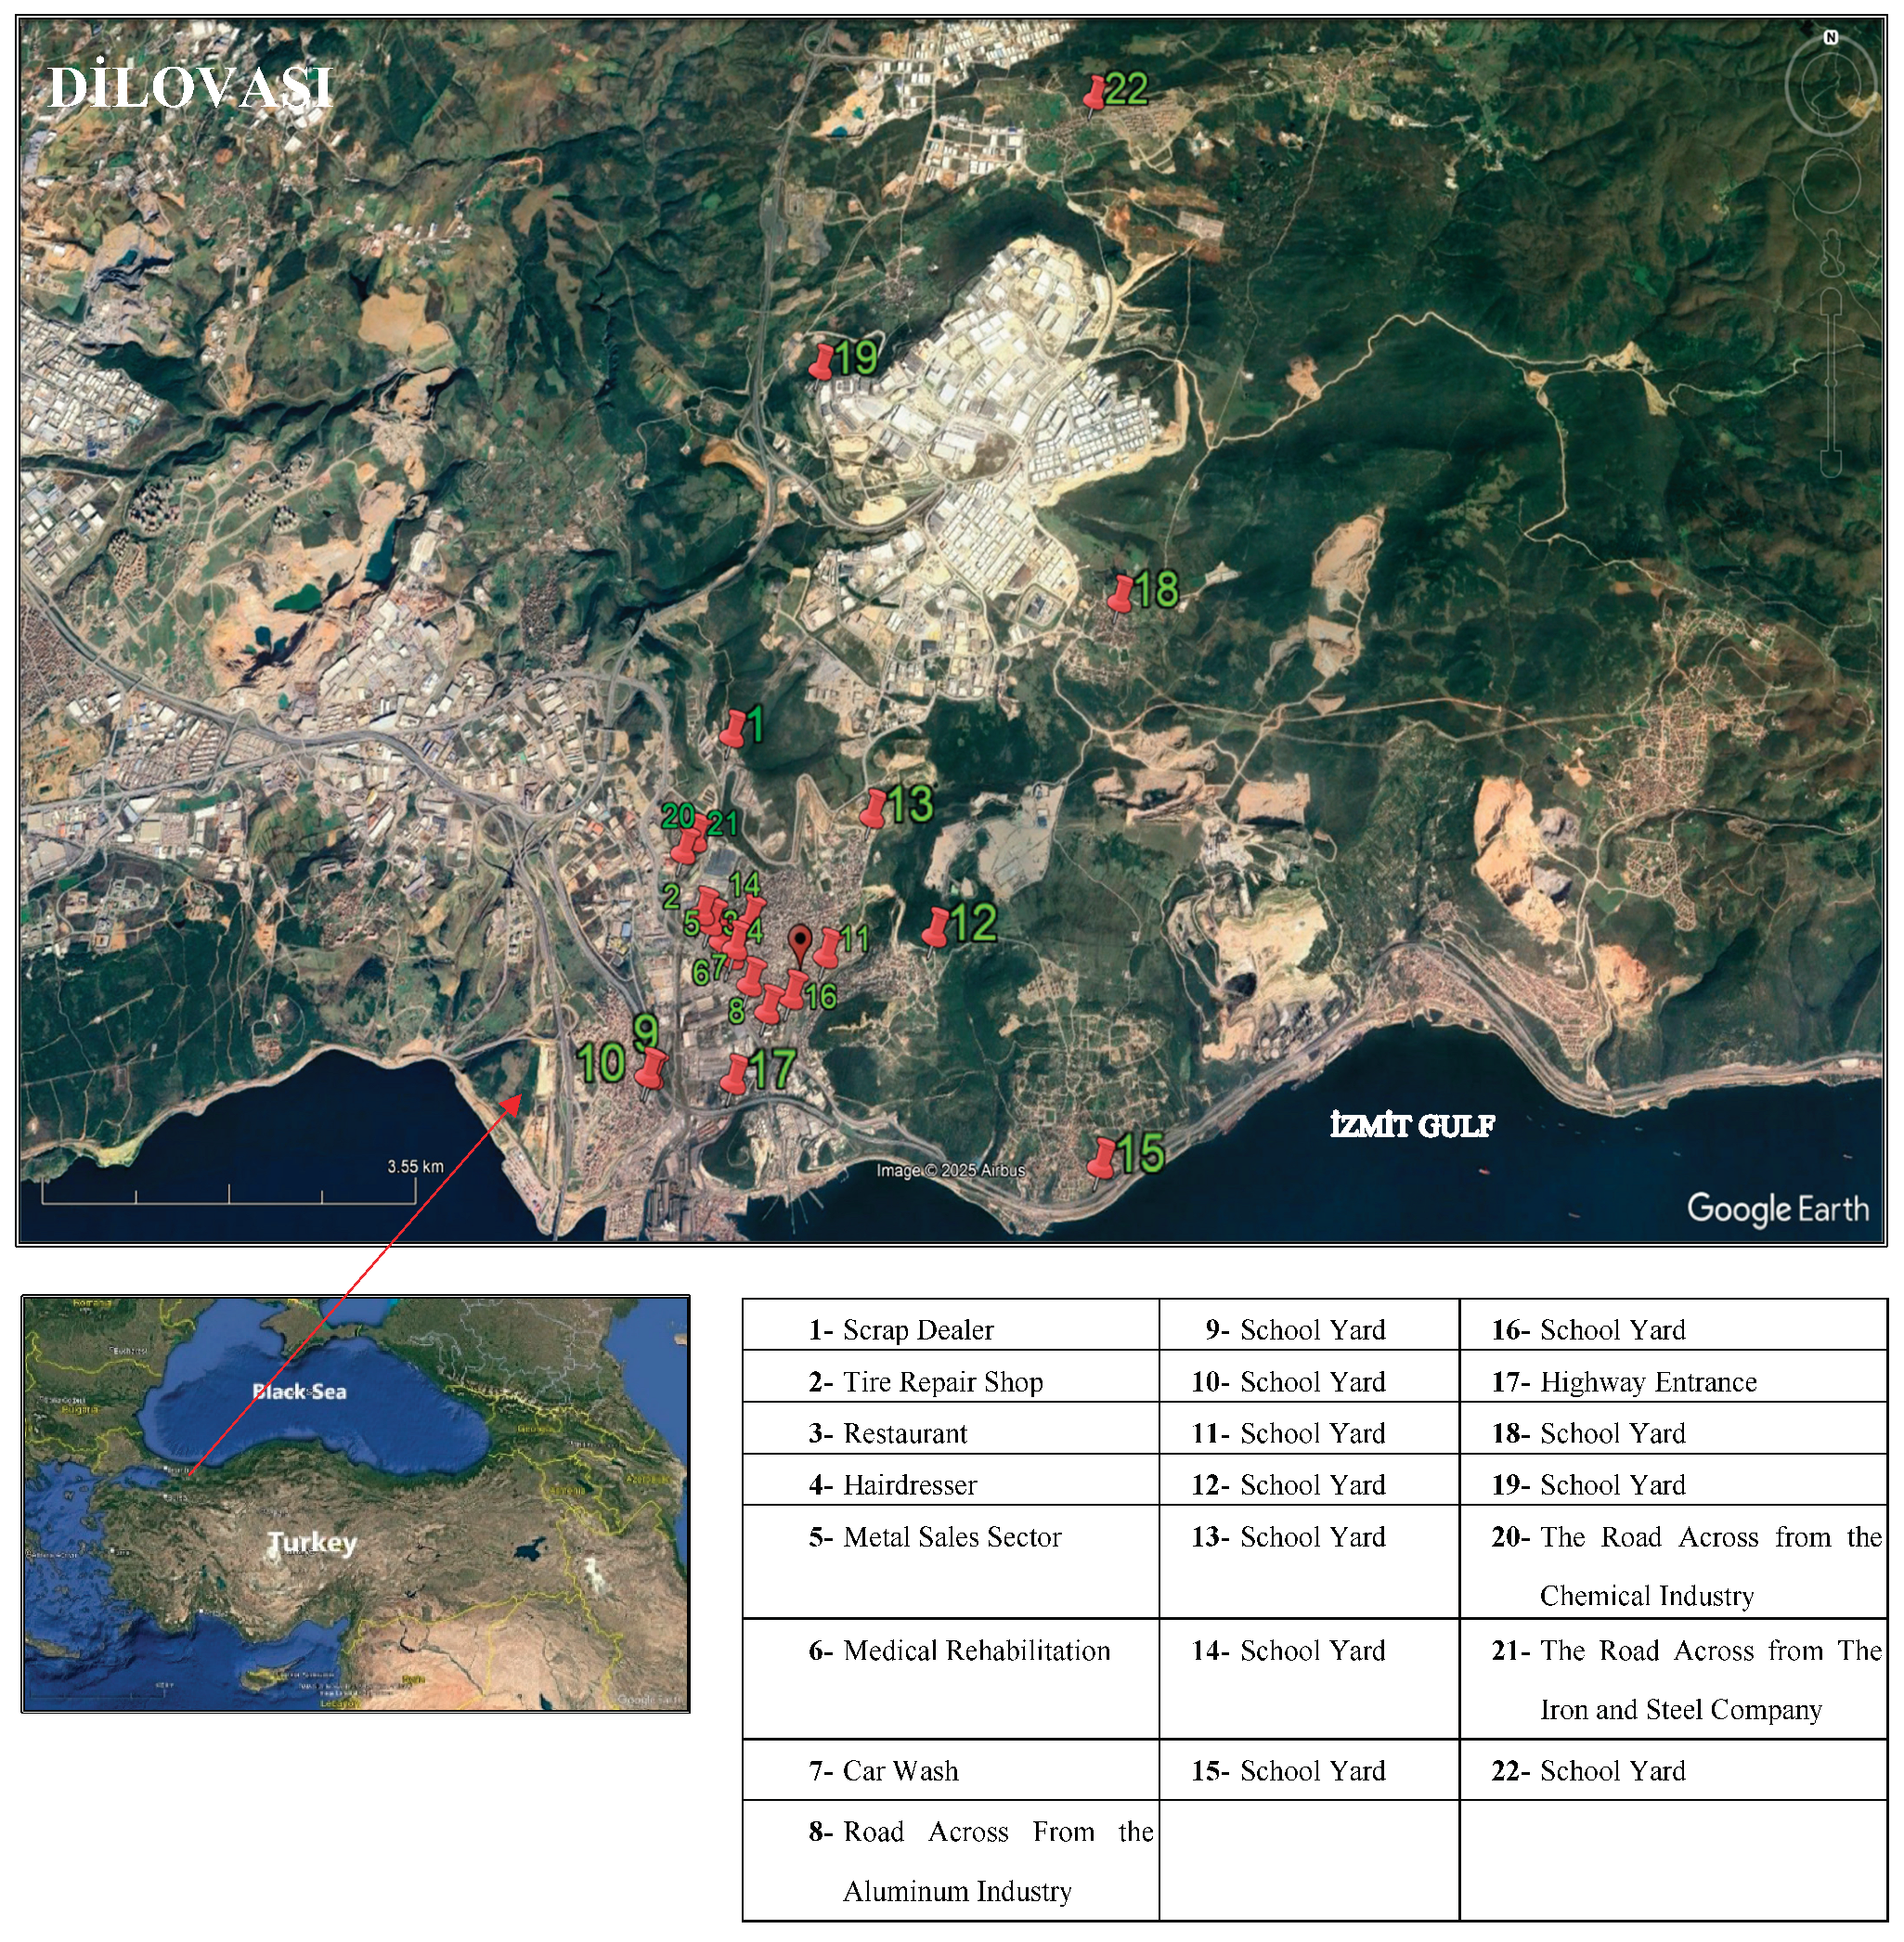
Figure 2.
The mean concentrations of VOCs.
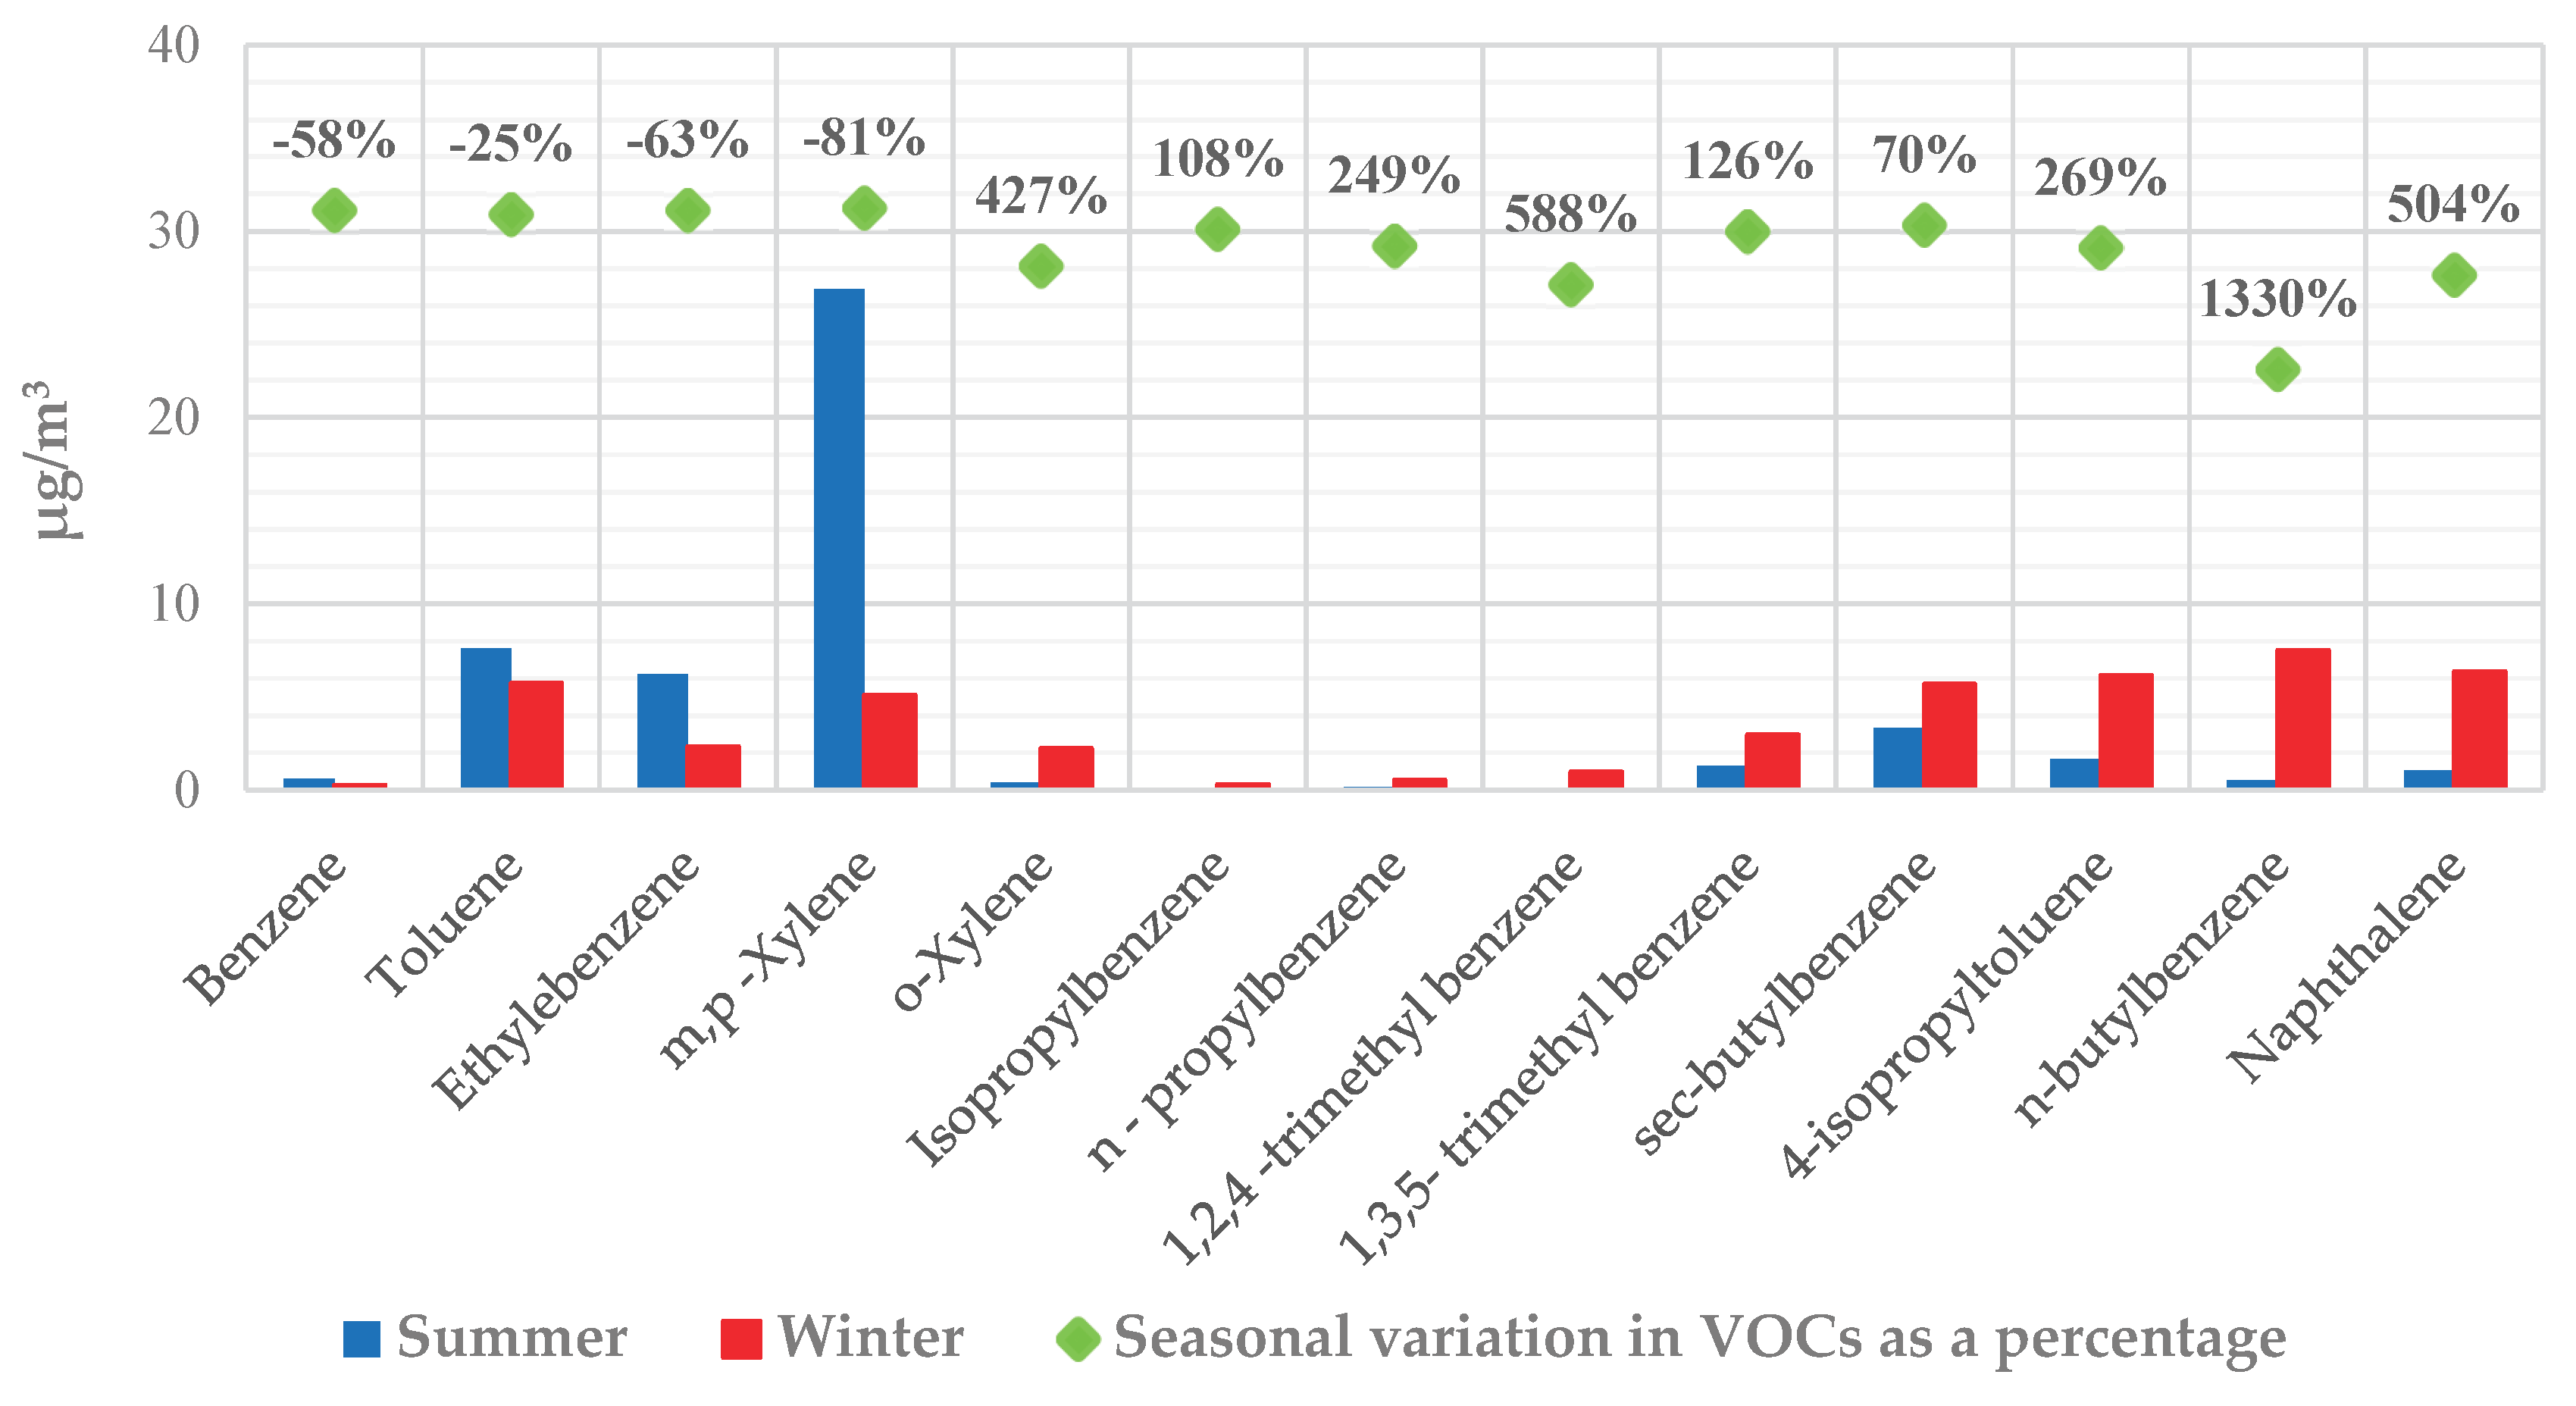
Figure 3.
According to this study and studies conducted in previous years, VOC concentrations in the district.
Figure 3.
According to this study and studies conducted in previous years, VOC concentrations in the district.
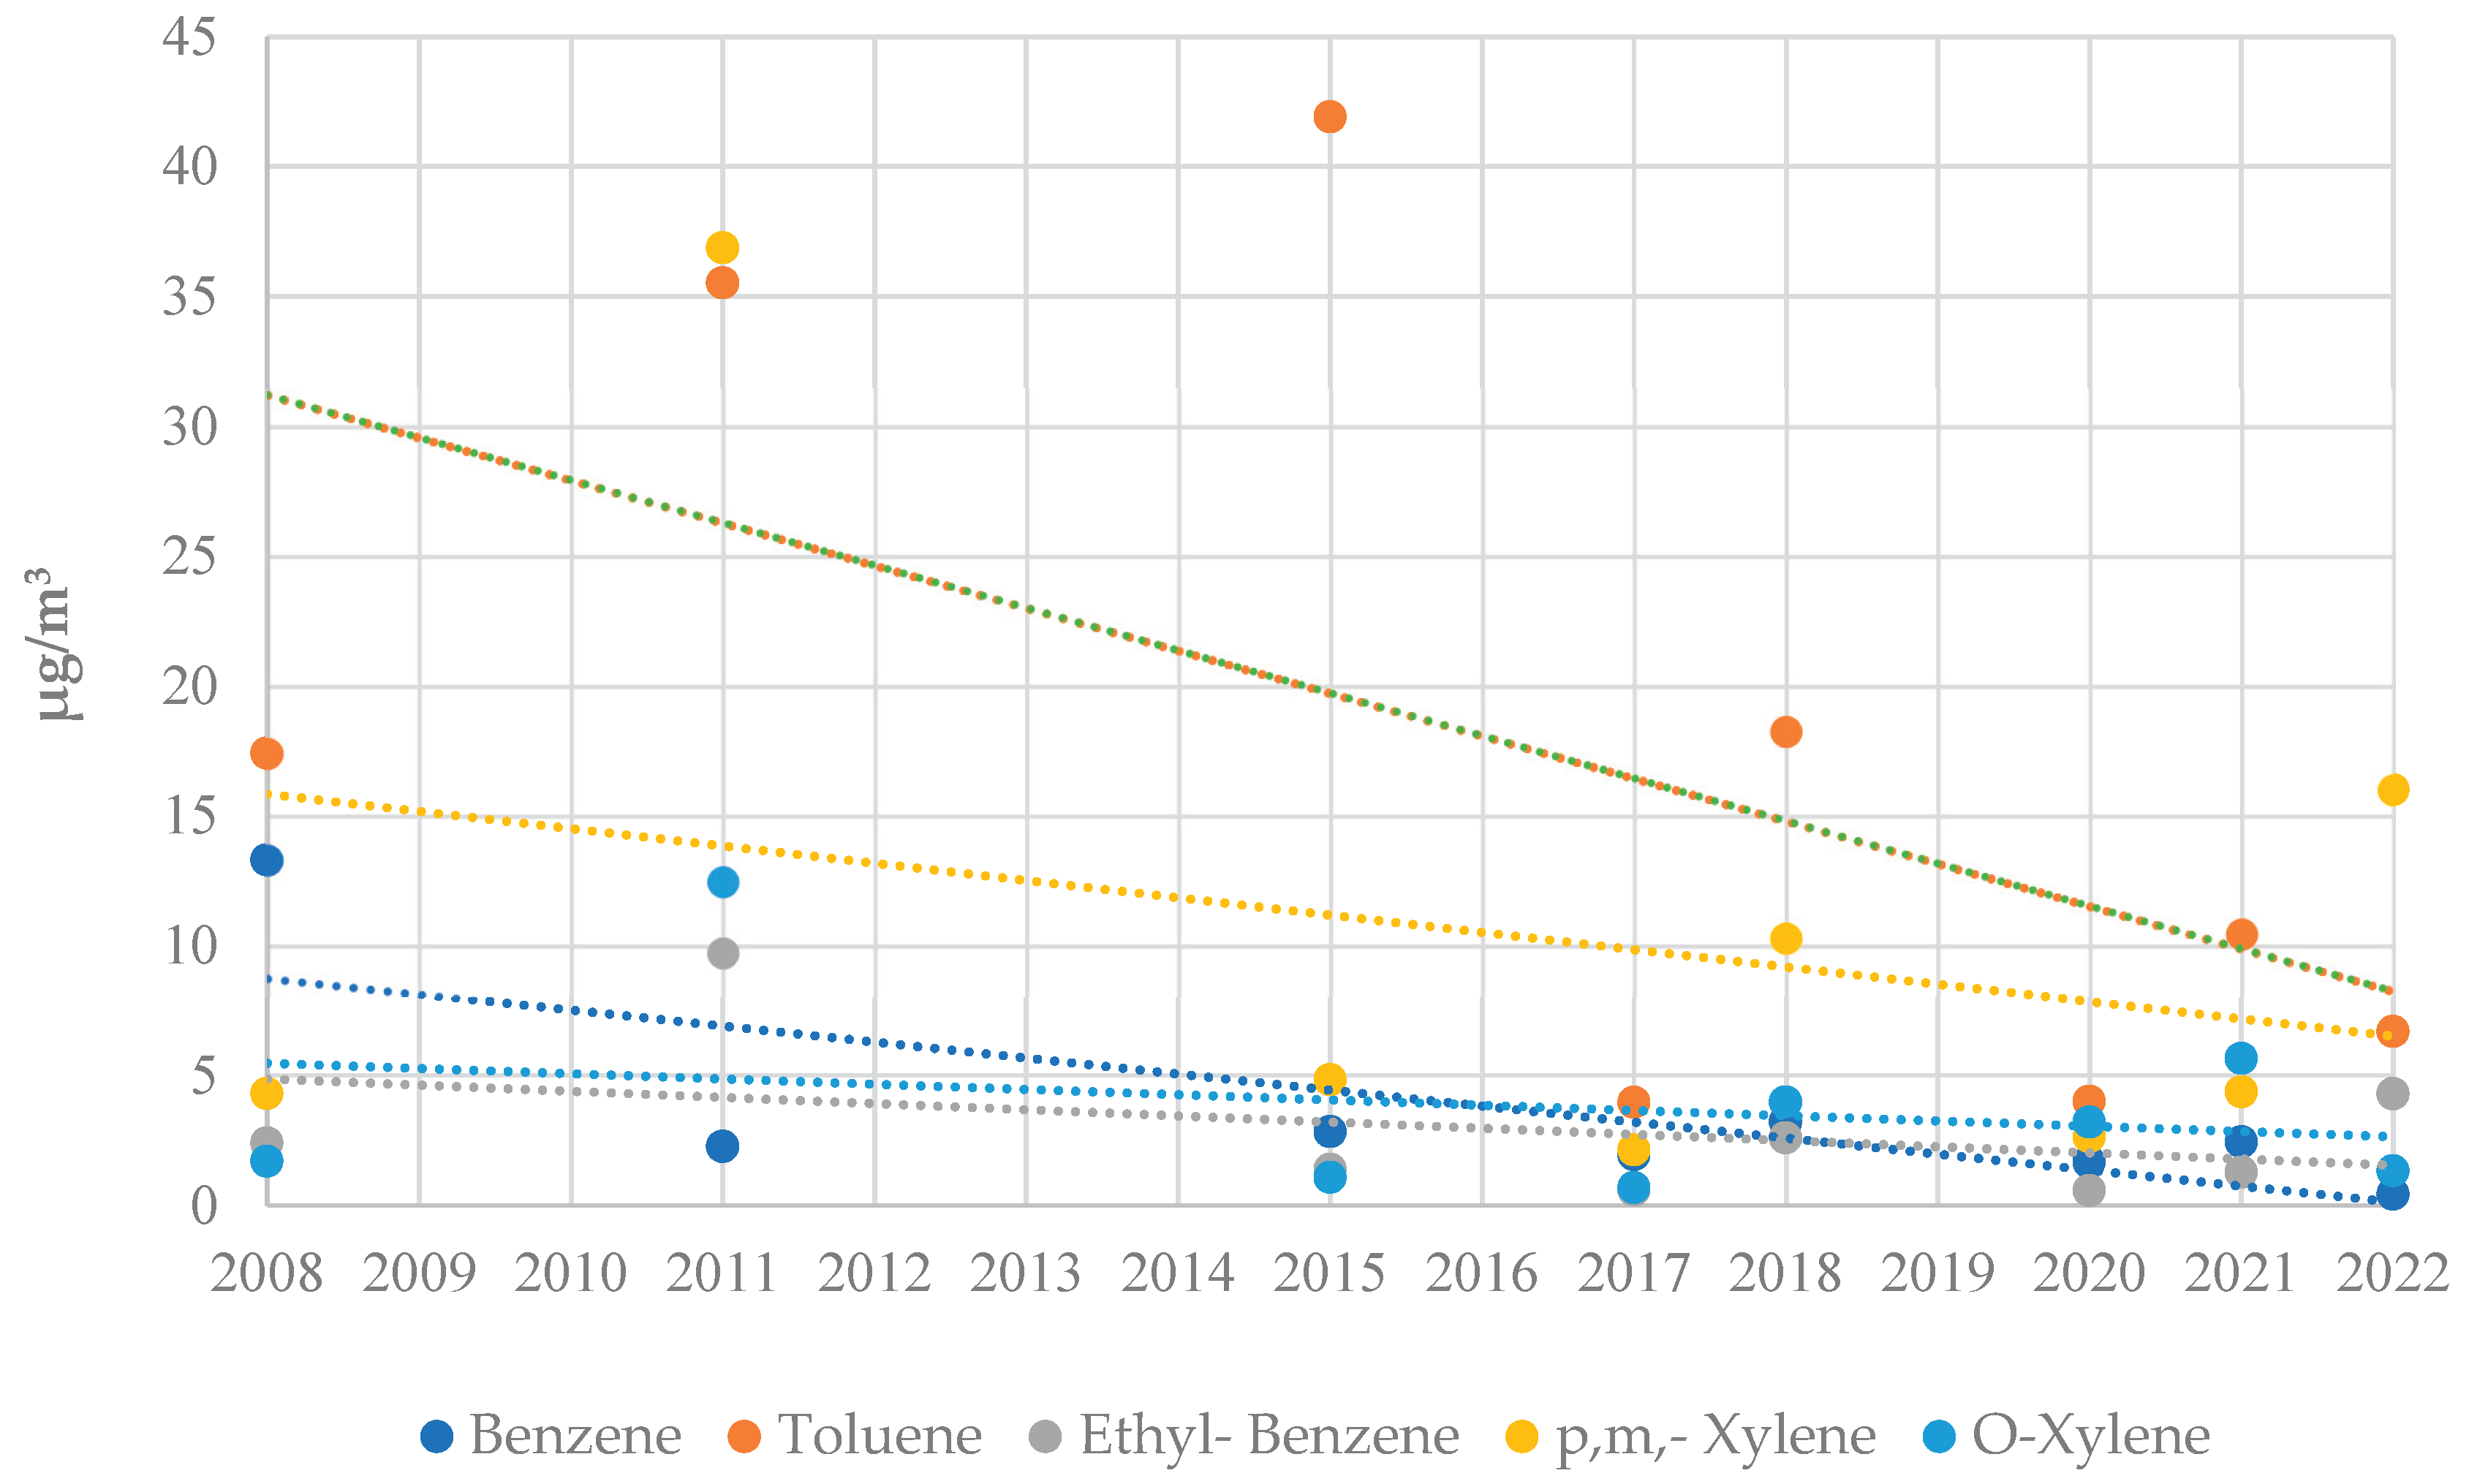
Figure 4.
Concentrations of BTEX at the 22 sampling locations.
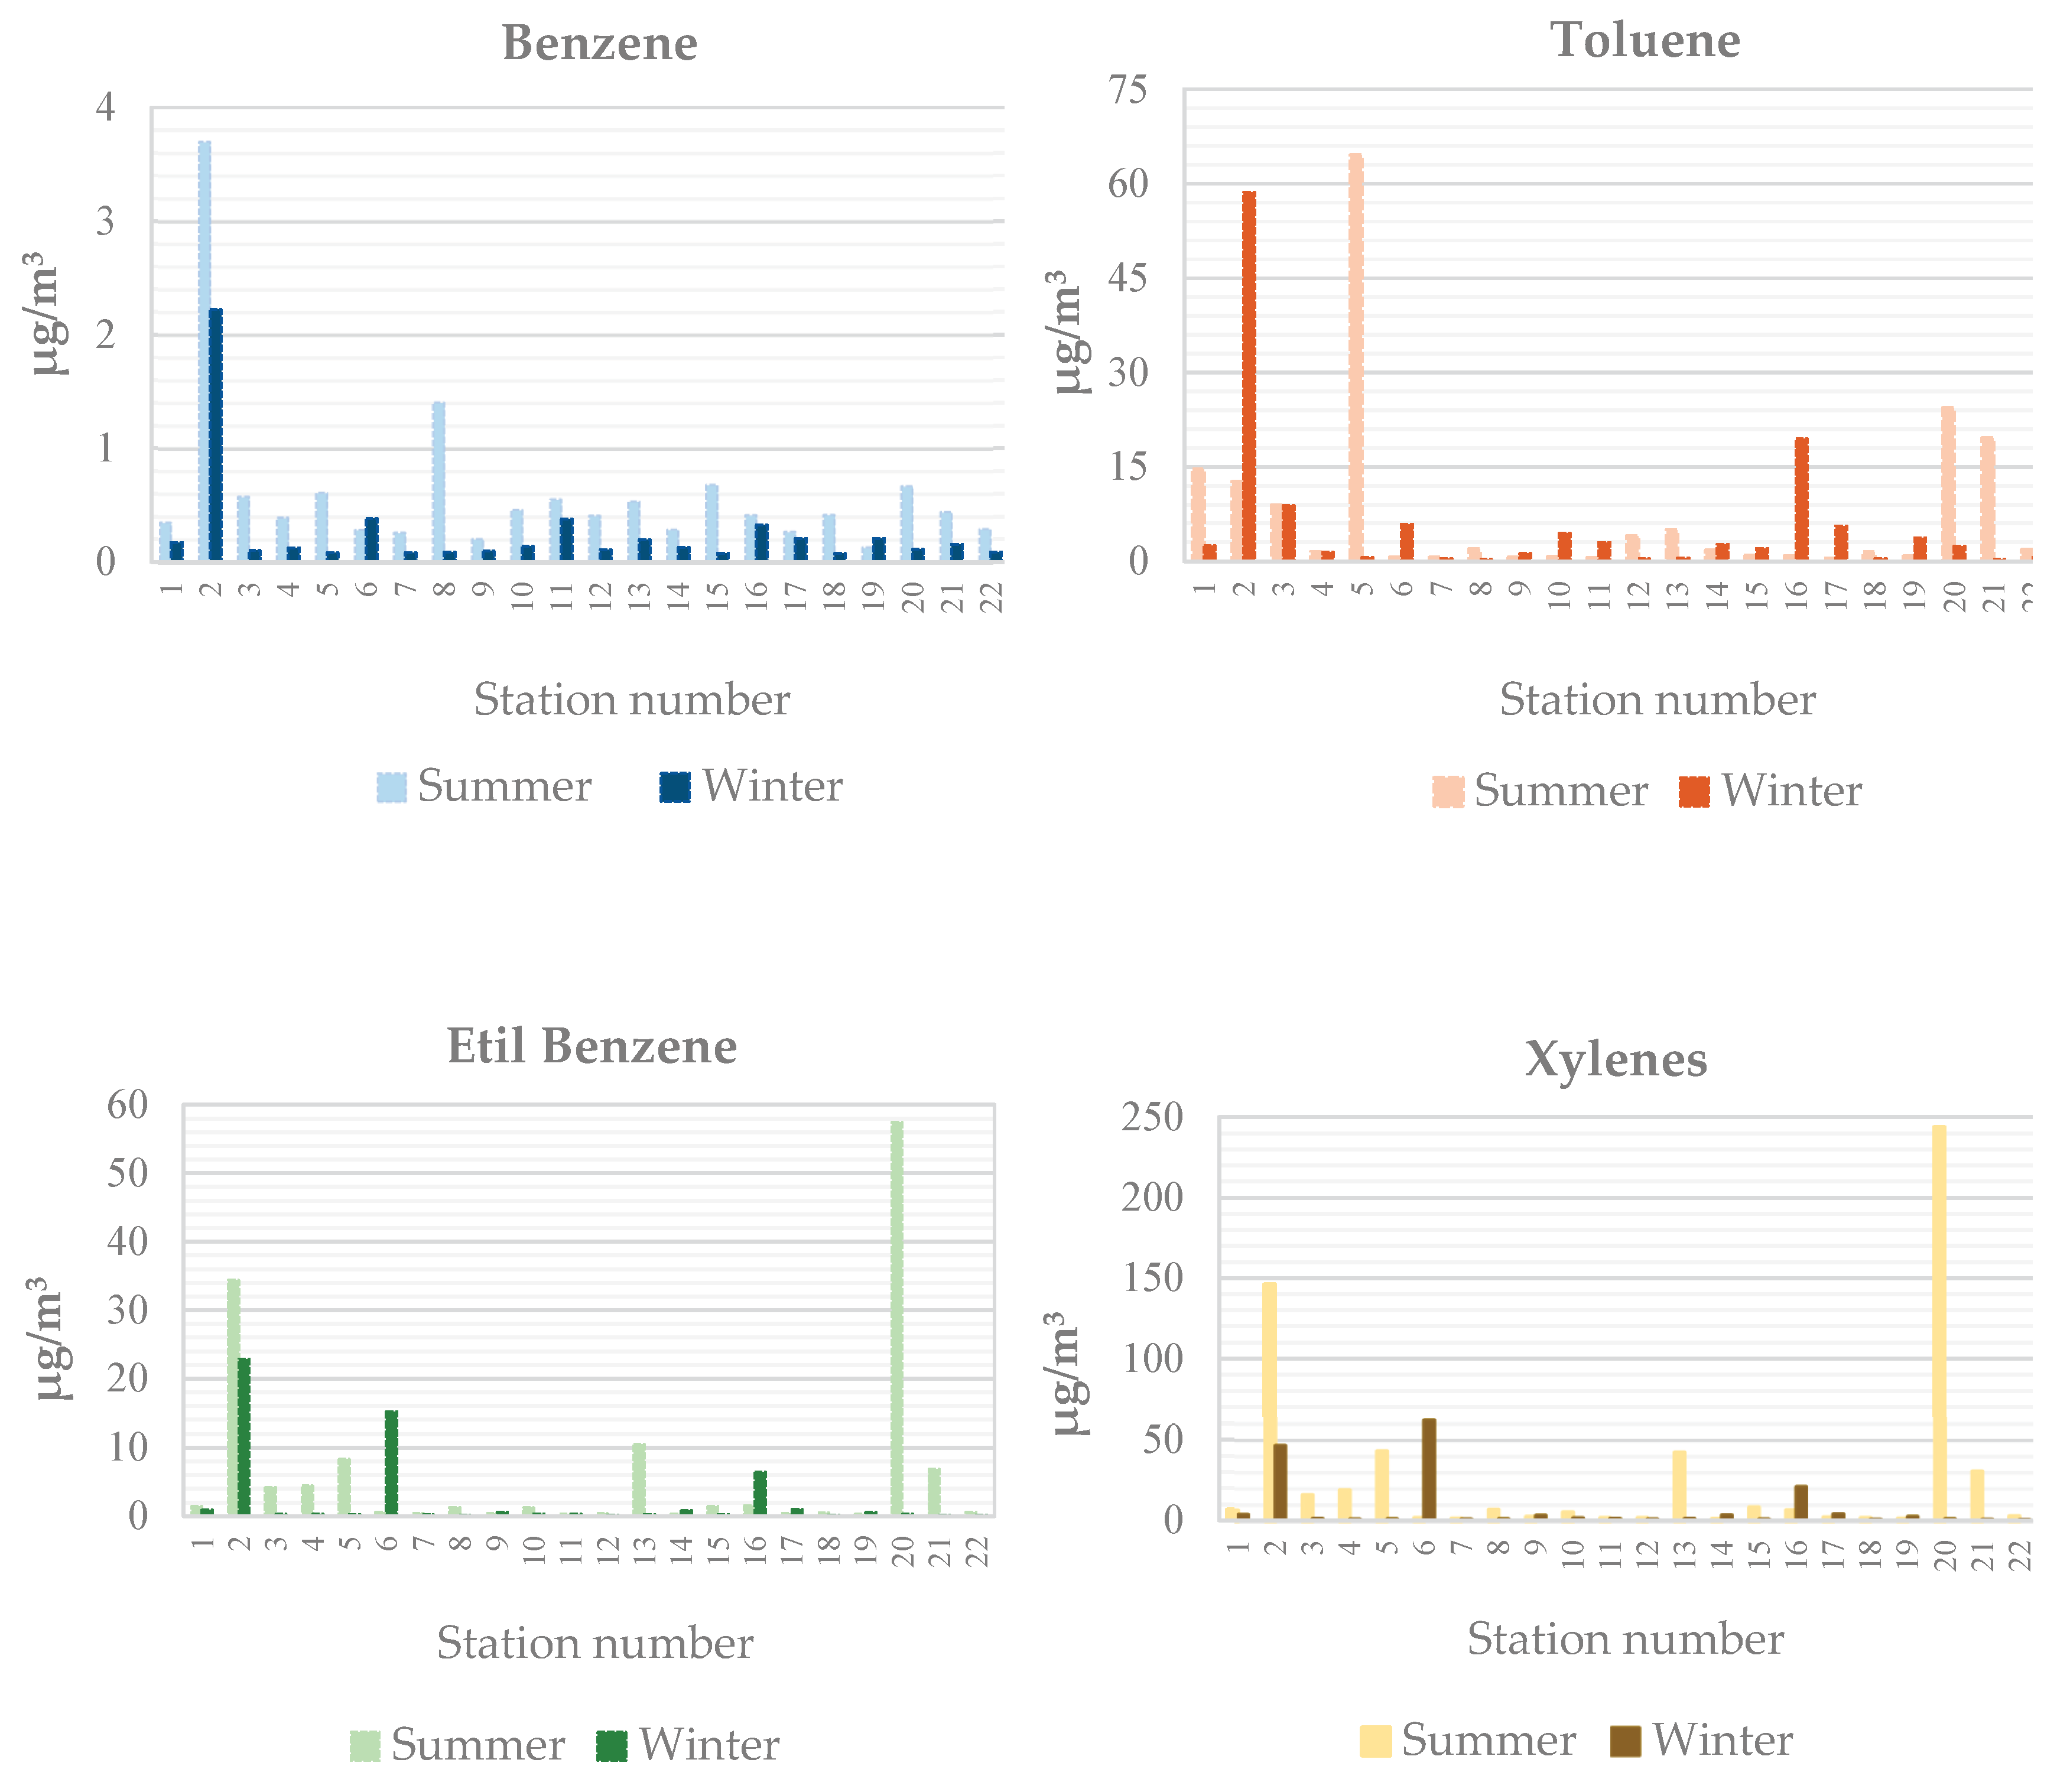
Figure 5.
Spatial distribution of concentration of ΣBTEX (µg/m3).
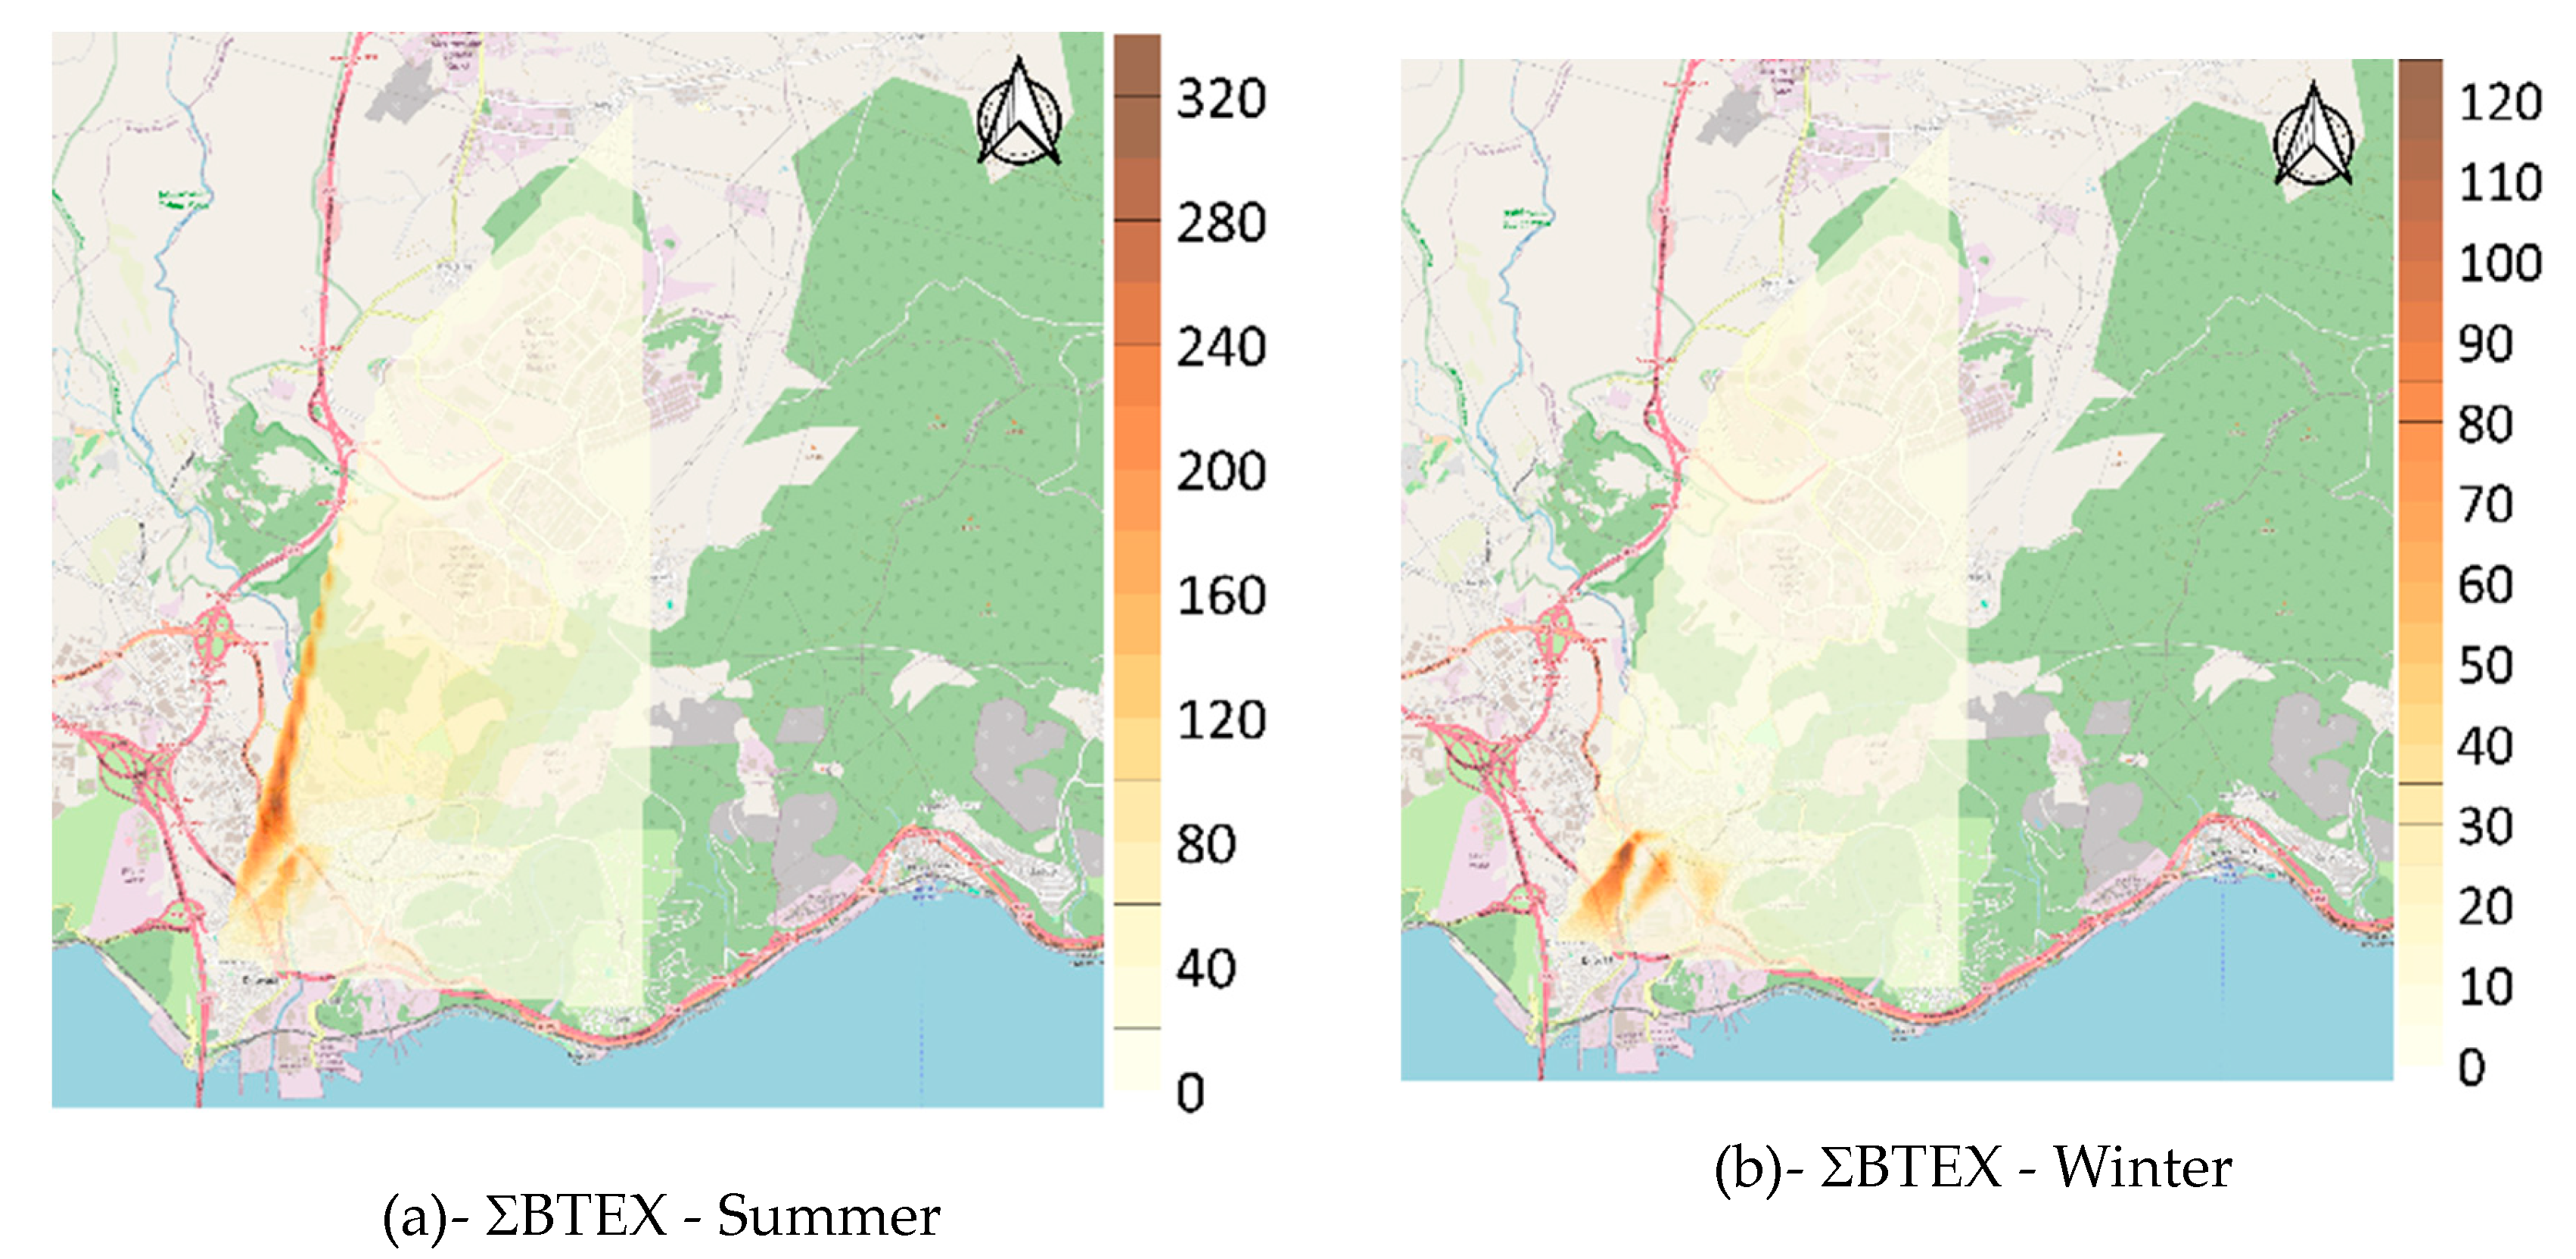
Figure 6.
Spatial distribution of concentration of BTEX (µg/m3).
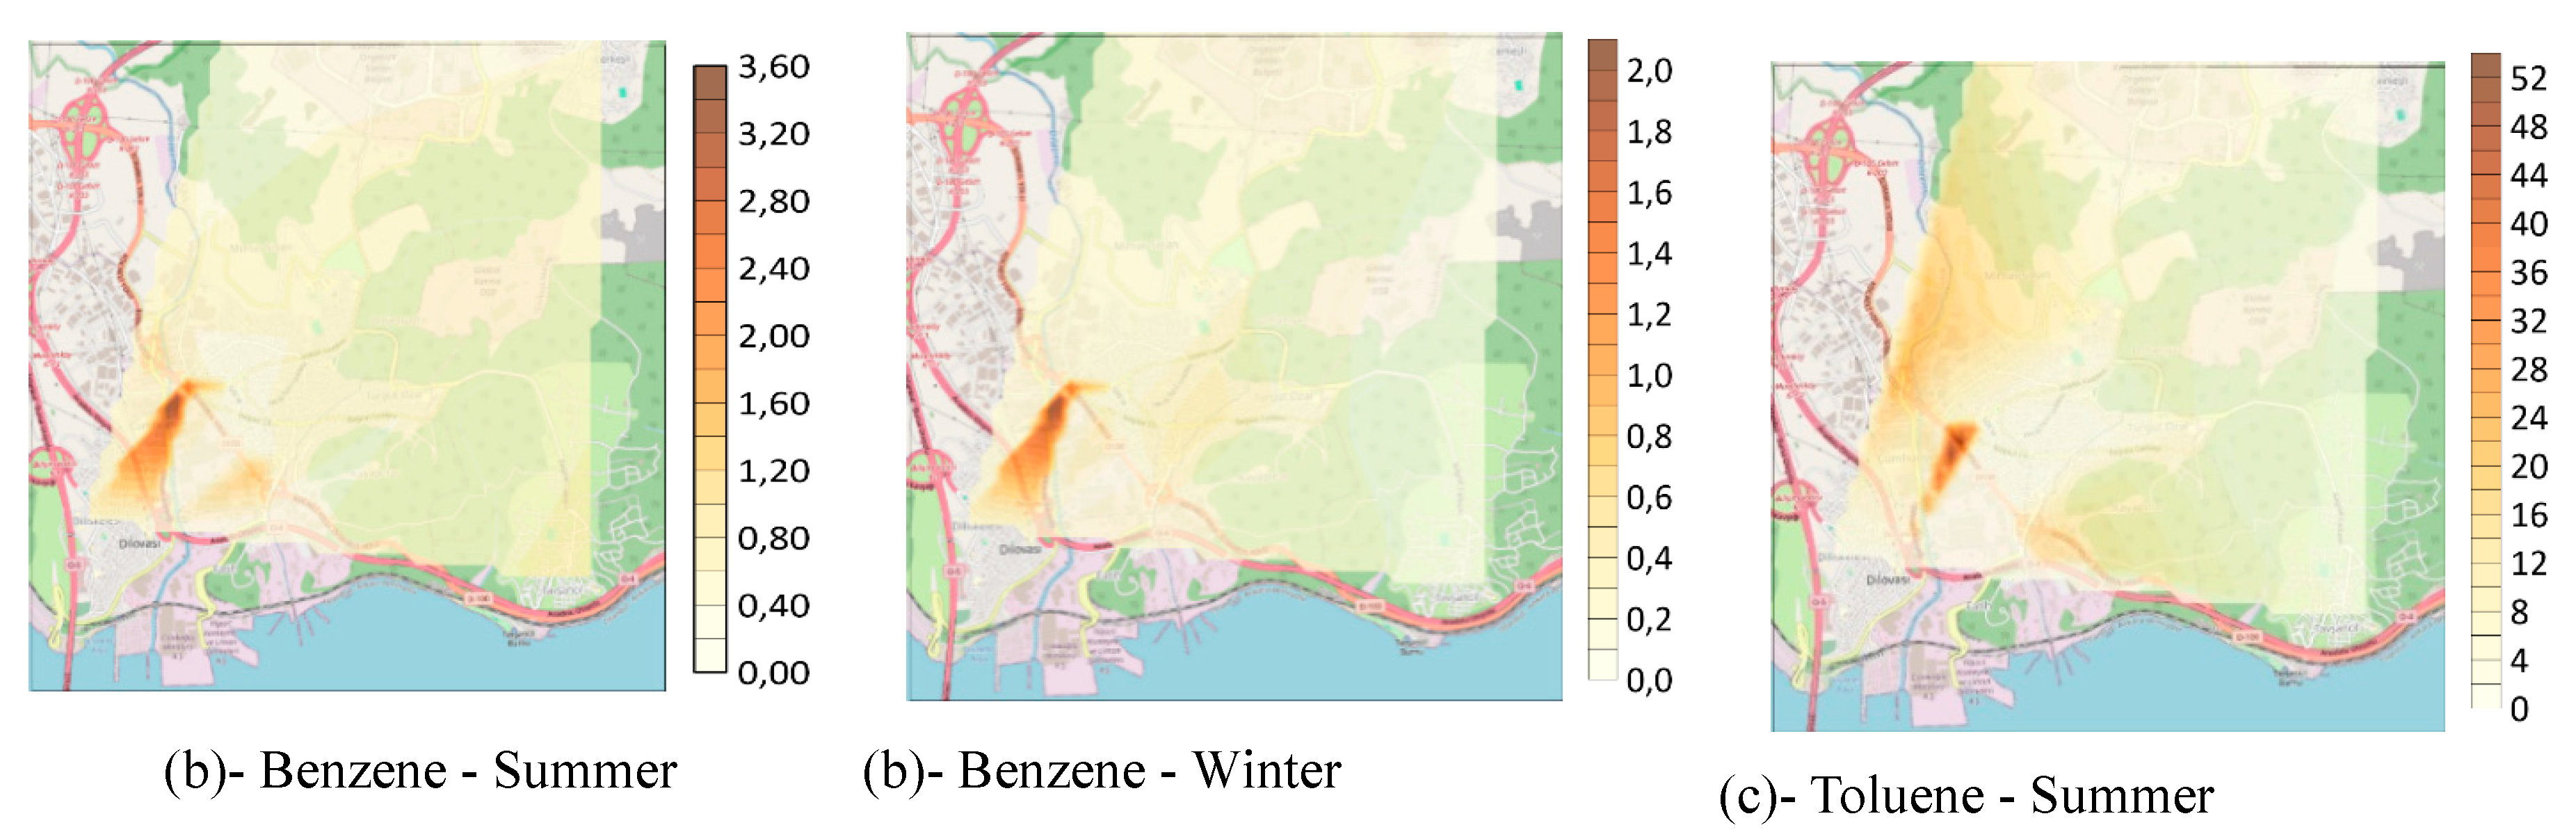
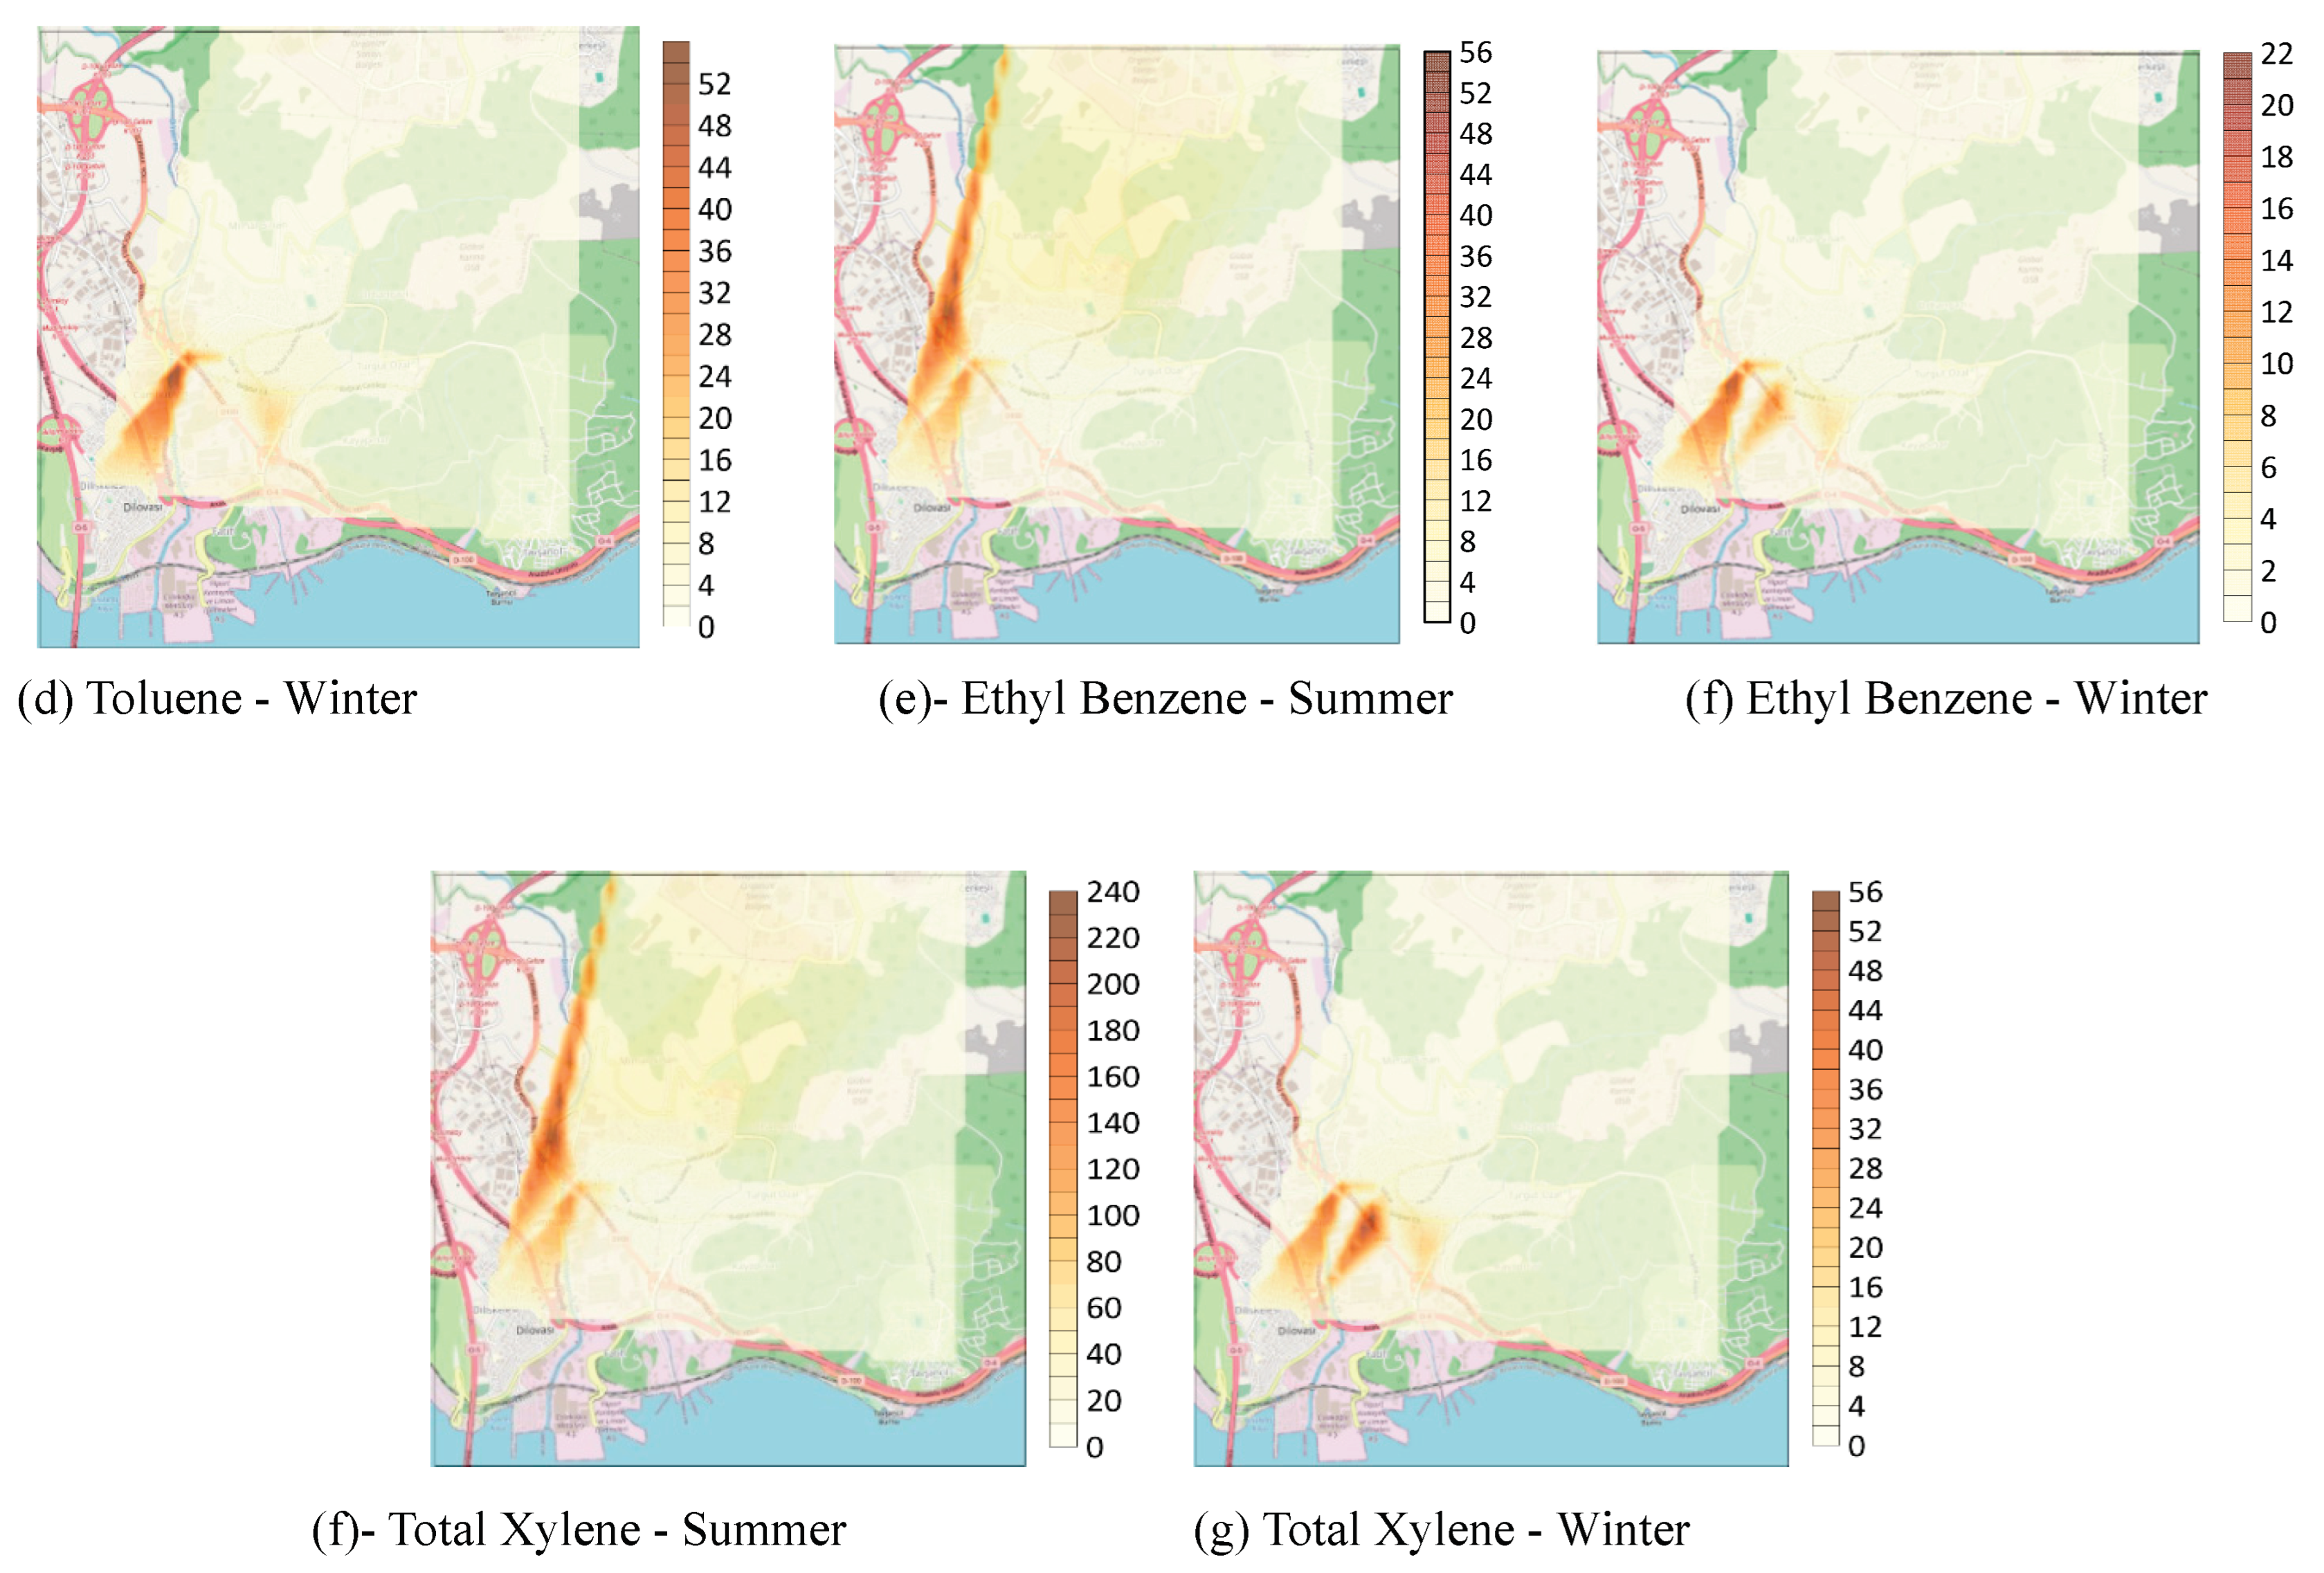
Figure 7.
Spatial distribution of concentration of Naphthalene (µg/m3).
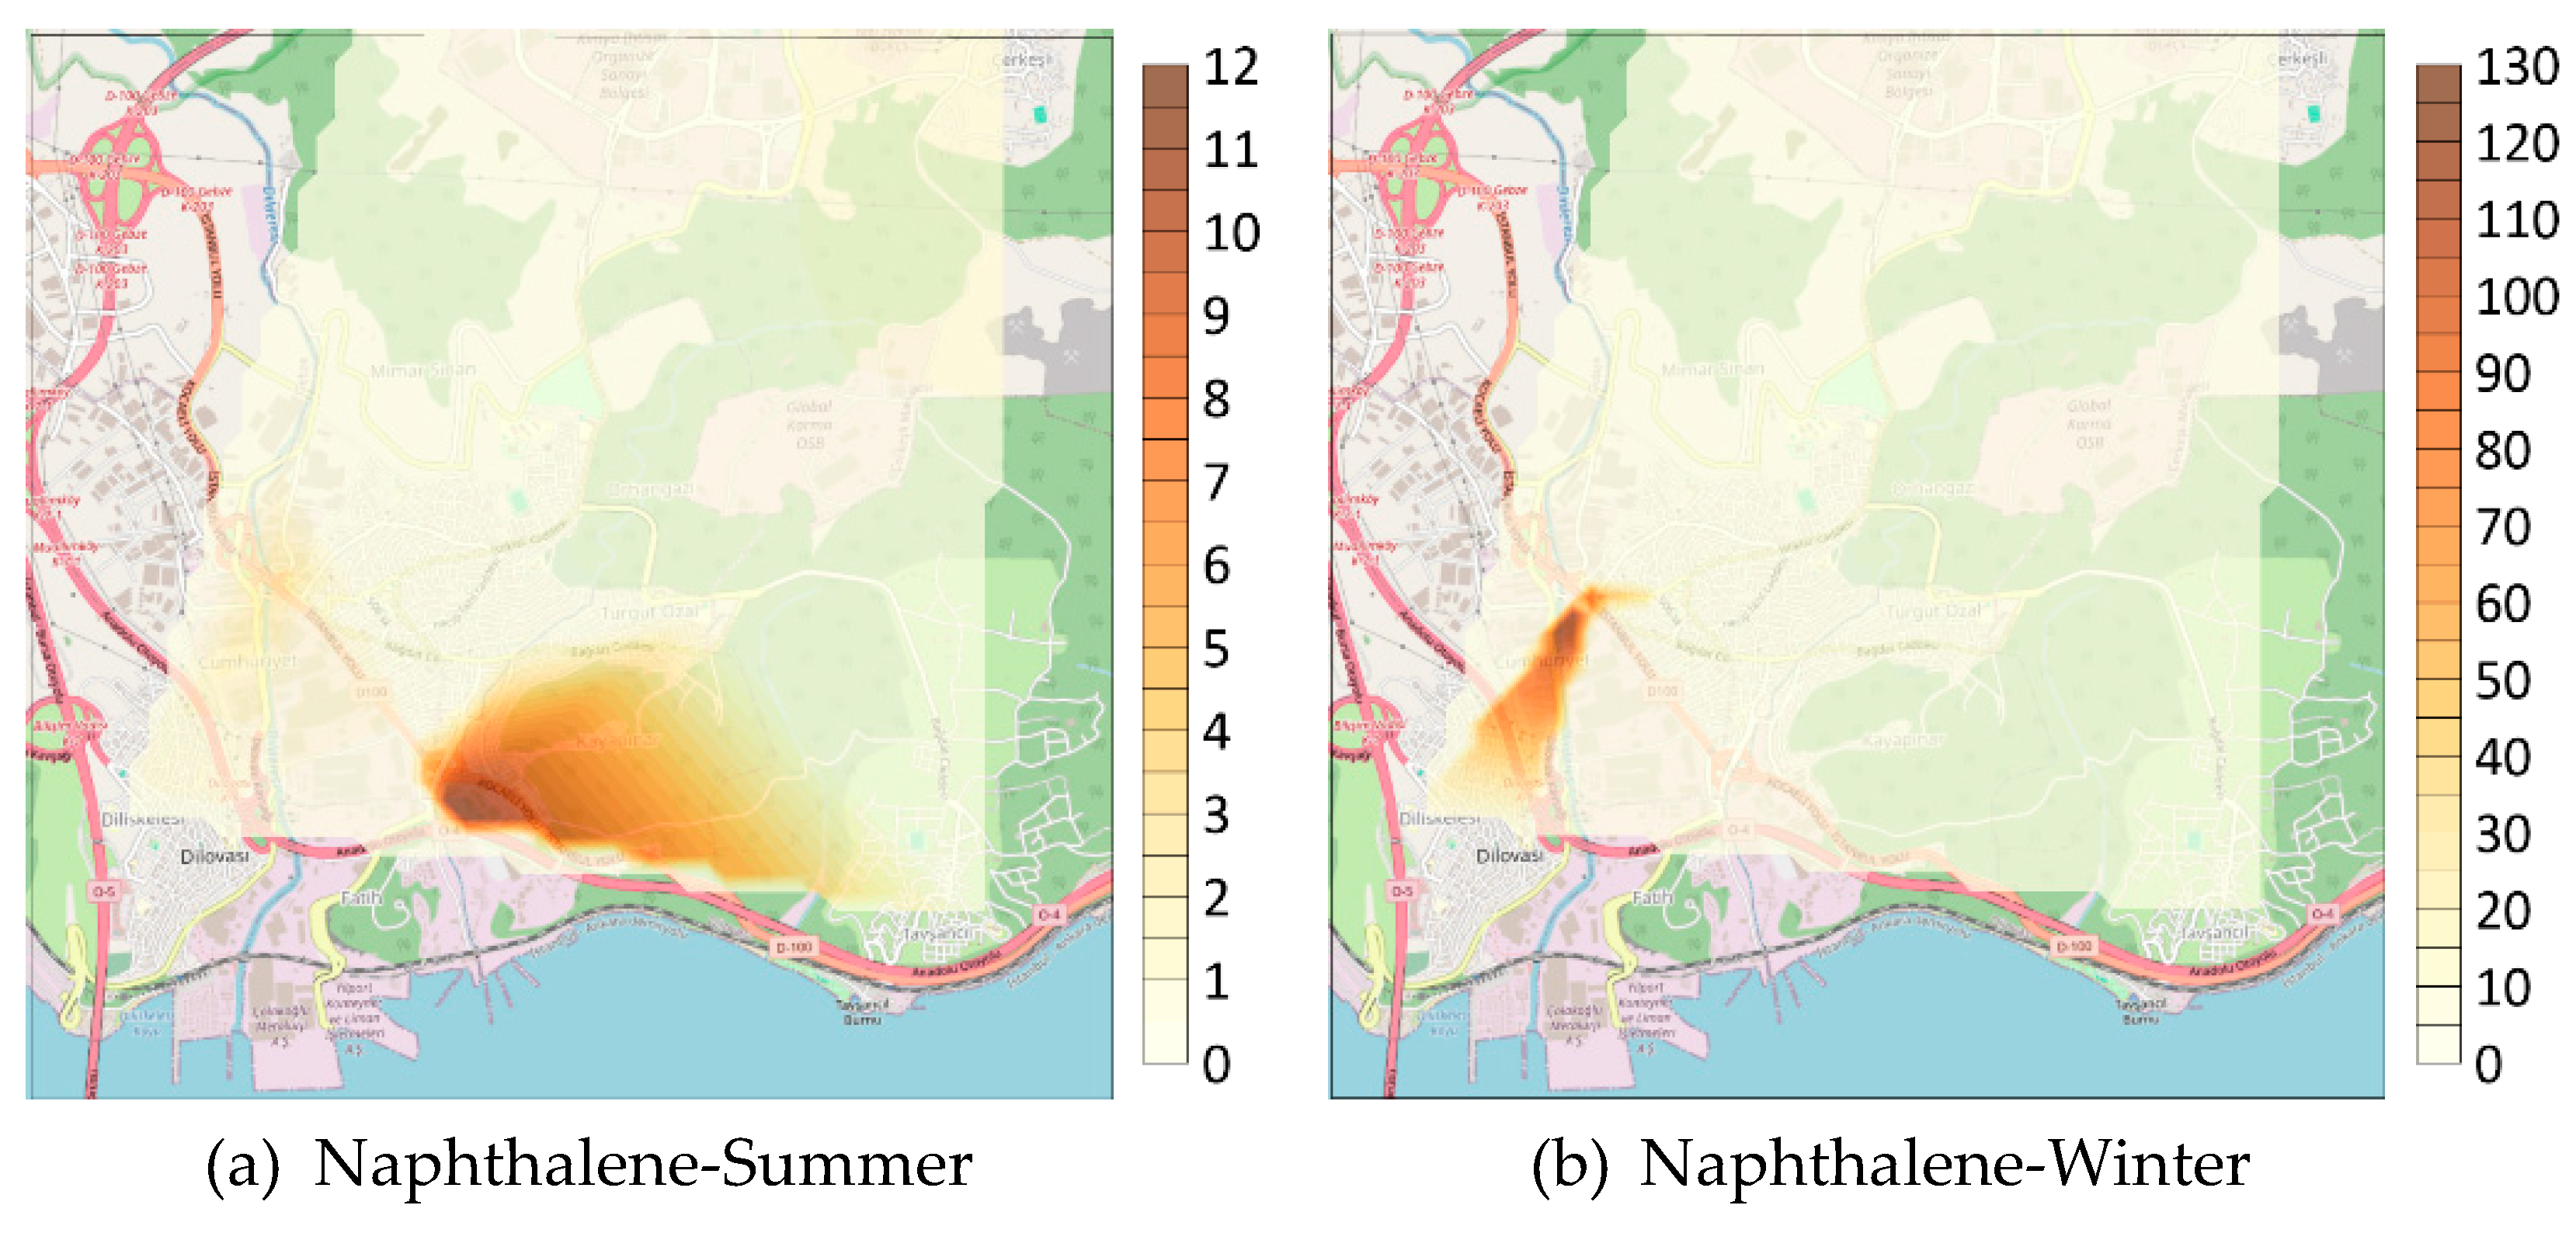
Figure 8.
Carcinogenic and non-carcinogenic health risk assessment.
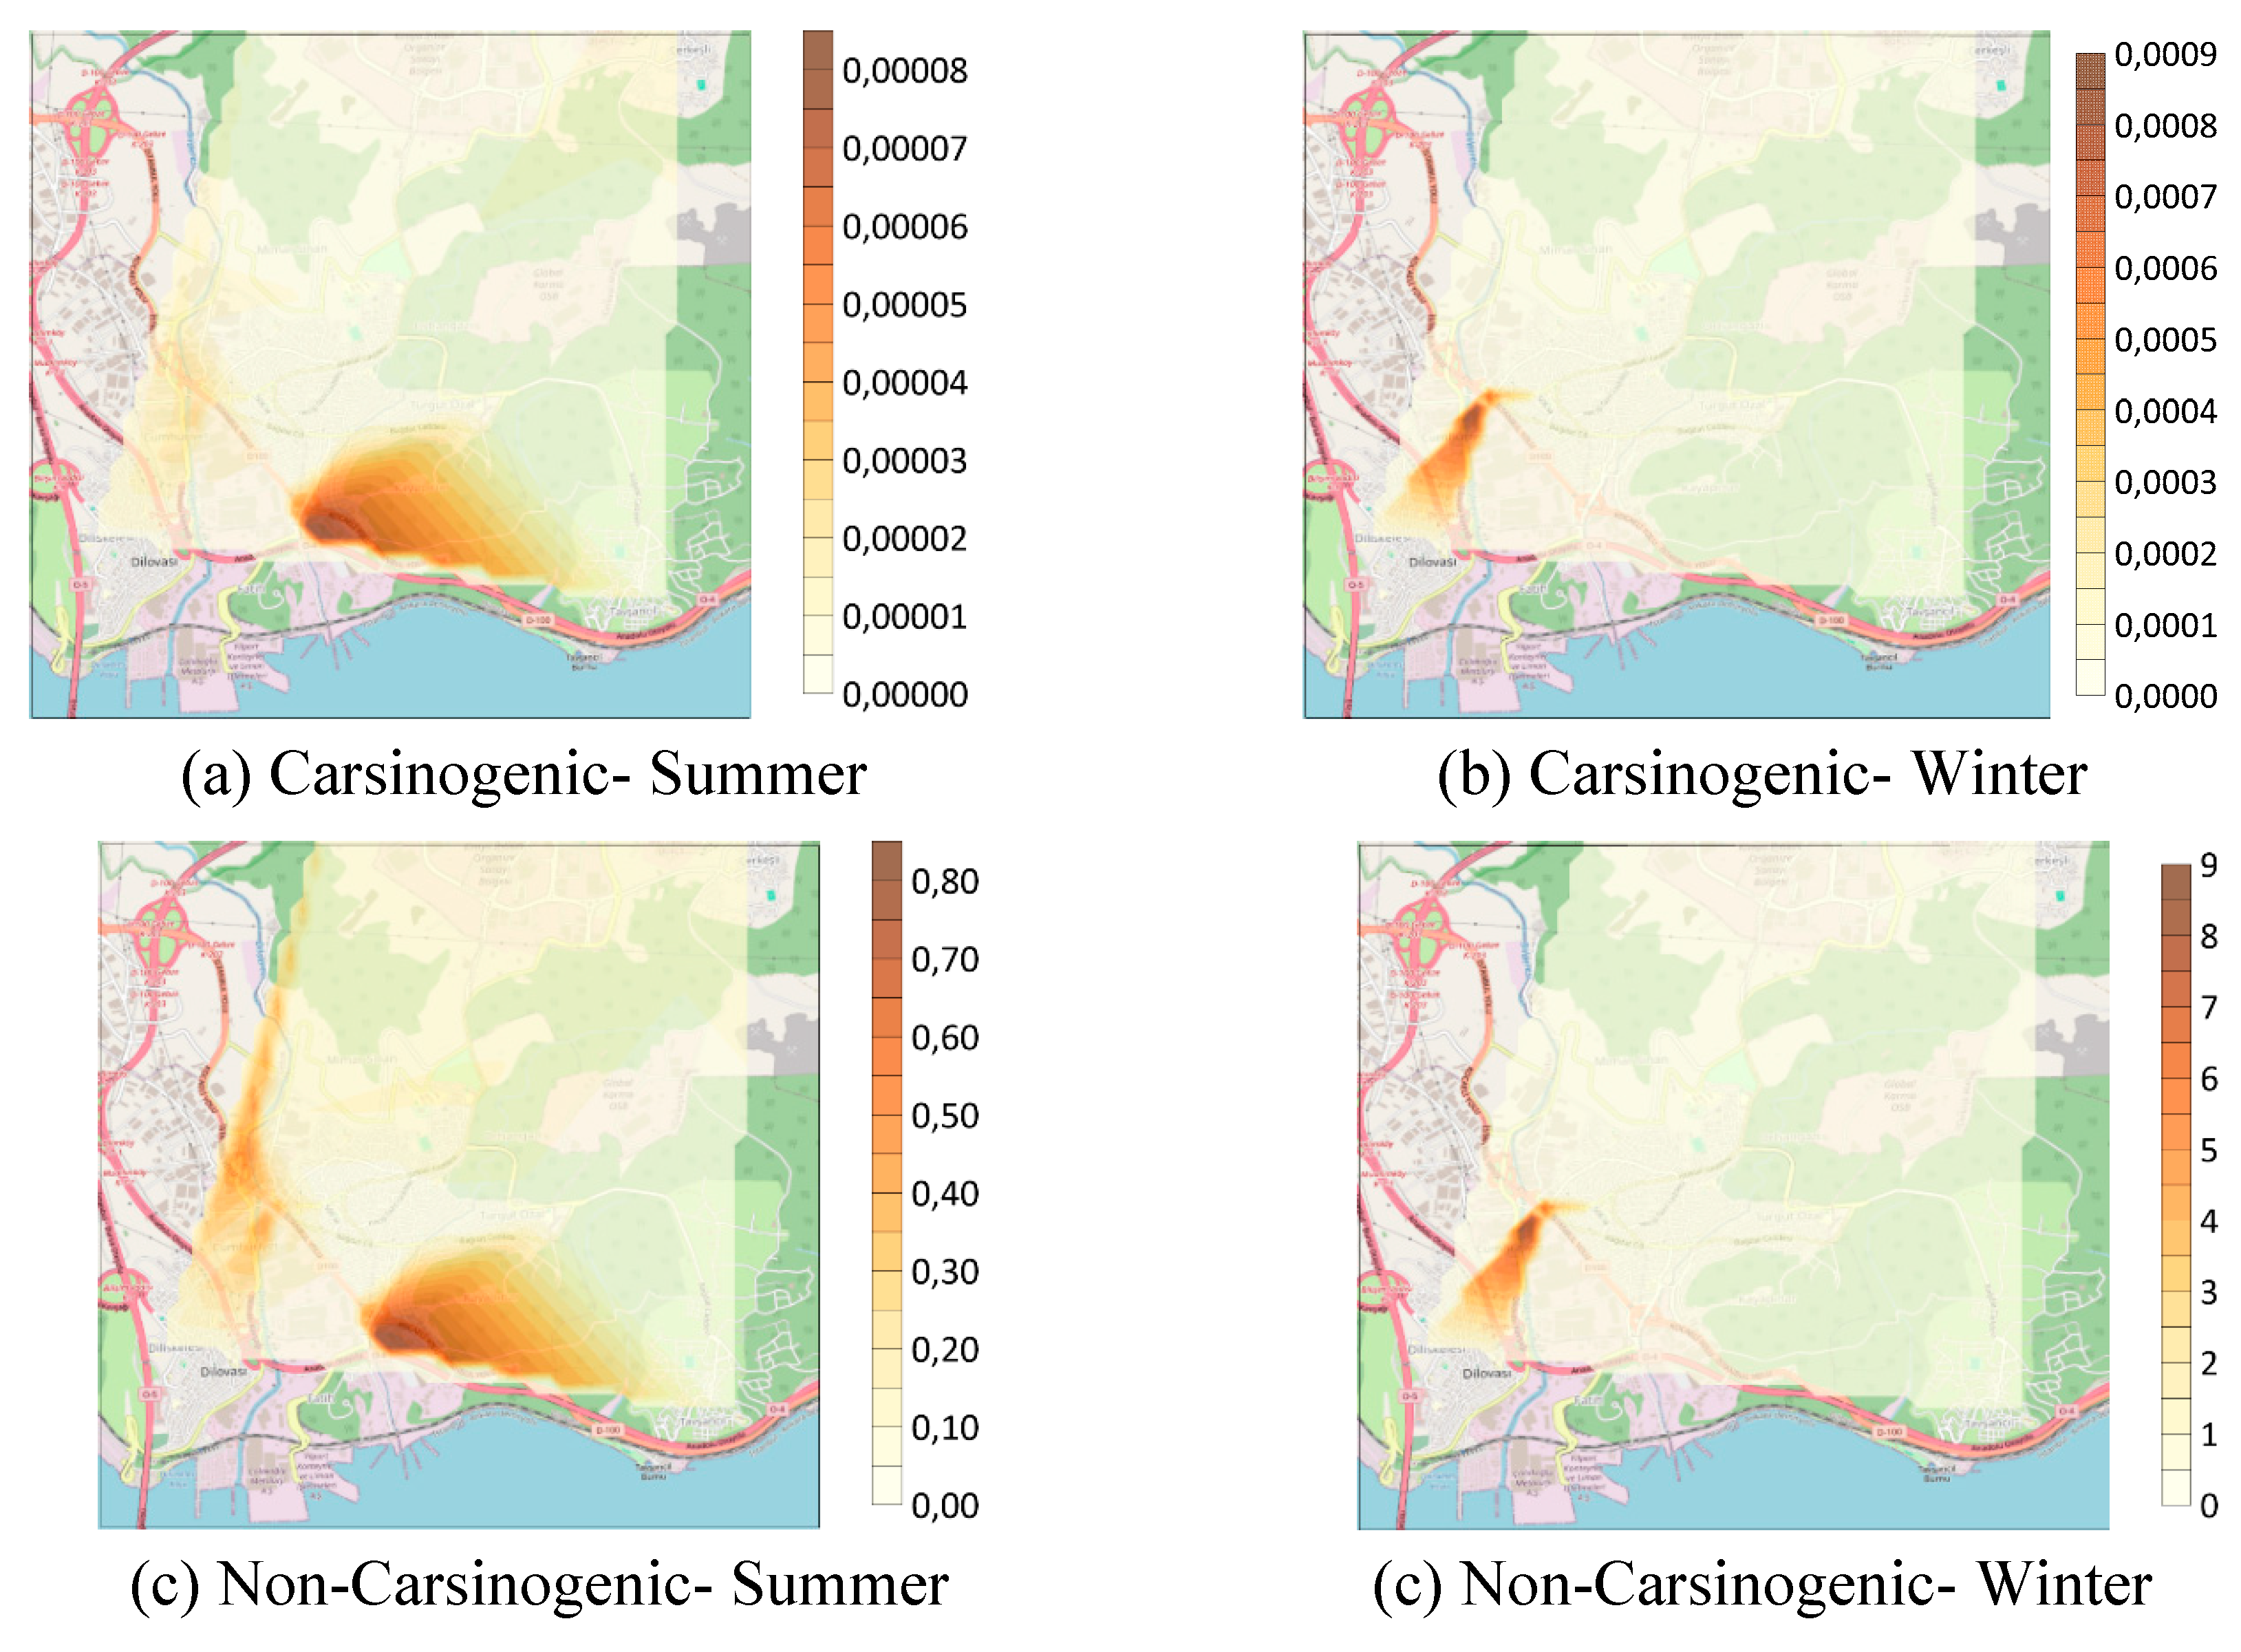

Table 1.
CPF and RfC Values for VOCs and Exposure Paremeters [24].
Table 1.
CPF and RfC Values for VOCs and Exposure Paremeters [24].
| Compound | CPF (1/(mg.kg.day)) | RfC (mg/m3) |
|---|---|---|
| Benzene | 2.73 x 10⁻² | 0.03 |
| Toluen | NA | 5 |
| Etylbenzene | 3.85 x 10⁻³ | 1 |
| m,p-xylene | NA | 0.1 |
| o-xylene | NA | 0.1 |
| Isopropylbenzene | NA | 0.4 |
| n-propylbenzene | NA | NA |
| 1,2,4-trimetylbenzene | NA | 0.2 |
| 1,3,5-trimetylbenzene | NA | 0.2 |
| Sec-butylbenzene | NA | NA |
| 4-isopropyltoluen | NA | NA |
| n-butylbenzene | NA | NA |
| Napthalene | 1.19 x 10⁻¹ | 0.003 |
| Exposure Parameters | ||
| IR (inhalation rate for adults) | 0.83 m3/h | |
| ED (exposure duration for adults) | 24 h/day | |
| BW (body weigh for adult) | 70 kg | |
| D (days per week exposure) | 7 days | |
| WK (weeks of exposure) | 52 weeks | |
| YE (years of exposure for adults) | 15 years | |
| YL (years in lifetime for adults) | 75 years | |
Table 2.
BTEX concentration ratios at different sampling locations.
| Station Number | Average | |||
|---|---|---|---|---|
| T/B | X/E | B/T | X/B | |
| 1 | 33,152 | 4,619 | 0,030 | 20,475 |
| 2 | 12,038 | 3,368 | 0,083 | 32,534 |
| 3 | 26,309 | 3,962 | 0,038 | 26,118 |
| 4 | 5,684 | 4,299 | 0,176 | 39,514 |
| 5 | 94,929 | 5,226 | 0,011 | 65,164 |
| 6 | 9,821 | 4,053 | 0,102 | 96,166 |
| 7 | 3,140 | 4,401 | 0,319 | 8,193 |
| 8 | 1,522 | 5,827 | 0,657 | 5,633 |
| 9 | 6,129 | 5,749 | 0,163 | 20,228 |
| 10 | 8,703 | 4,515 | 0,115 | 12,116 |
| 11 | 3,808 | 5,453 | 0,263 | 3,853 |
| 12 | 8,698 | 5,296 | 0,115 | 6,020 |
| 13 | 7,559 | 4,115 | 0,132 | 60,626 |
| 14 | 10,836 | 4,777 | 0,092 | 12,601 |
| 15 | 3,958 | 5,752 | 0,253 | 12,805 |
| 16 | 27,598 | 3,495 | 0,036 | 38,036 |
| 17 | 12,804 | 4,663 | 0,078 | 13,801 |
| 18 | 3,804 | 4,770 | 0,263 | 6,183 |
| 19 | 13,543 | 5,250 | 0,074 | 13,034 |
| 20 | 34,367 | 4,247 | 0,029 | 314,851 |
| 21 | 33,684 | 4,549 | 0,030 | 53,525 |
| 22 | 7,538 | 5,318 | 0,133 | 10,290 |
The values indicated in bold are the max and min values.
Disclaimer/Publisher’s Note: The statements, opinions and data contained in all publications are solely those of the individual author(s) and contributor(s) and not of MDPI and/or the editor(s). MDPI and/or the editor(s) disclaim responsibility for any injury to people or property resulting from any ideas, methods, instructions or products referred to in the content. |
© 2025 by the authors. Licensee MDPI, Basel, Switzerland. This article is an open access article distributed under the terms and conditions of the Creative Commons Attribution (CC BY) license (http://creativecommons.org/licenses/by/4.0/).
Copyright: This open access article is published under a Creative Commons CC BY 4.0 license, which permit the free download, distribution, and reuse, provided that the author and preprint are cited in any reuse.


