Submitted:
07 May 2025
Posted:
08 May 2025
You are already at the latest version
Abstract
Air pollution (NO2, SO2, PM2.5) emissions by pollutant source (point, line, surface) and substance (NOx, SOx, PM2.5, NH3, VOC) for data on emissions and emissions from small businesses in Korea. , O3, NH3), we would like to analyze the contribution of the impact on the surrounding area. Development of algorithm technology optimized for decision-making based on evaluation of environmental pollutants. Methods: Establishment of emission source inventory through air pollution emission survey, and subsequent emission source measurement data through emission status survey and establishment of VOC and PM profile using EPA and Speciate, etc., application of questionnaire and comparative analysis (measurement analysis) according to the emission characteristics of the business site. result). As a result of building an inventory of air pollutant emission sources centered on 190 workplaces, the characteristics of emission sources through the final 104 workplaces were confirmed, and the results of the air pollutant emission status showed the national air pollutant emissions by substance (CO, NOx, SOx, TSP, PM10, PM2.5, VOC, NH3) were confirmed. This is data applied to the results of VOC and PM profile construction using EPA and Speciate5.1, and consistent characteristics of pollution concentration were confirmed around five business sites and four representative spaces in the surrounding area. It is recommended that the questionnaire be used as basic data to identify the concentration level of pollutants (chemical species) by emission source according to the source profile of domestic environmental pollutants.
Keywords:
Air pollution
; Emission sources
; Factory
; Speciate5.1
; Chemical species
1. Introduction
To enhance national competitiveness, South Korea has established major industrial complexes in regions such as Yeocheon, Gwangyang, and Ulsan since the 1970s, guided by policies prioritizing rapid economic development and industrialization [1,2,3,4]. These industrial hubs, which concentrate petrochemical, steel manufacturing, and heavy industry facilities, have played a pivotal role in national economic growth; however, they have also emerged as major sources of atmospheric emissions. Individual facilities within these complexes typically operate large-scale combustion systems, engage in high-temperature processing, and handle volatile raw materials, leading to continuous and fugitive emissions of air pollutants, including sulfur oxides (SOₓ), nitrogen oxides (NOₓ), volatile organic compounds (VOCs), particulate matter (PM), and heavy metals [5,6,7]. Residents in adjacent communities are therefore increasingly exposed to environmental risks such as air and soil contamination, malodors, and toxic substances. The environmental burden posed by these emission sources raises considerable concerns regarding potential health impacts on local populations [8,9,10,11]. Given the scale, complexity, and spatial concentration of emissions from these facilities, it is crucial to develop methodologies that integrate high-resolution environmental monitoring data and emission inventories to support evidence-based regulation and sustainable policy-making for industrial source management [12,13].
In South Korea, it is difficult to access detailed data on emissions and emission characteristics from small-scale workplaces. Nevertheless, considering the potential impact of such emissions on national air quality, it is critical to analyze the contribution of emissions—categorized by source type (point, line, area) and substance (NOₓ, SOₓ, PM₂.₅, NH₃, VOCs)—to atmospheric pollutants (NO₂, SO₂, PM₂.₅, O₃, NH₃) in surrounding areas. National-level analyses show that NO₂ concentrations are primarily influenced by NOₓ emissions from area sources; SO₂ concentrations by SOₓ emissions from area sources; PM₂.₅ concentrations by NH₃ emissions from area sources; and O₃ concentrations by NOₓ emissions from point sources. Based on these findings, analyzing local government-level contributions by emission type and pollutant substance is deemed essential for deriving effective reduction policies [14,15].
Contribution patterns differ across municipalities due to varying emission characteristics. Overall, primary pollutants such as NO₂ and SO₂ are mainly influenced by direct emissions of NOₓ and SOₓ, respectively, while secondary pollutants such as PM₂.₅ and O₃ show stronger influence in areas adjacent to emission sources. Furthermore, based on the contribution analysis, conversion rates (per ton of emitted NOₓ or SOₓ) into concentrations of NO₂, SO₂, PM₂.₅, and O₃ were estimated for each municipality and emission type [16,17].
In major industrial complexes, chemical substances are released into the environment during processes involving chemical storage, transport, product manufacturing, and pollution prevention systems. As the environmental and health risks associated with these chemicals become increasingly evident, public concern has intensified. To systematically manage these substances and protect public health and the environment, the Ministry of Environment has implemented the Pollutant Release and Transfer Registers (PRTR) program since 1996. The Pollutant Release and Transfer Register (PRTR) program mandates that industrial facilities systematically report the quantities of designated chemical substances released into the atmosphere, discharged into water bodies or soil, or transferred off-site for waste and wastewater treatment [18]. This reporting framework enhances the transparency of pollutant management practices and facilitates comprehensive environmental assessments by providing spatially and temporally resolved emission data. Emission sources at industrial facilities typically include point sources such as exhaust stacks and vents, as well as fugitive emissions from equipment leaks, storage tanks, and loading operations. The nature and intensity of emissions depend on the type of industry, operational processes, and control measures in place, with chemical manufacturing and oil refining sectors being key contributors to air and water pollution.
A detailed assessment of pollutant sources within major emission categories—namely, manufacturing combustion, industrial processes, energy production and storage, waste treatment, agriculture, and miscellaneous sources—has validated the effectiveness of the emission source classification methodology [19,20,21,22]. The classification encompasses a broad spectrum of industrial activities, including asphalt concrete production, mining, food and beverage processing, textile manufacturing, the production of fur and suede garments, leather goods, bags, footwear, pulp and paper products, as well as publishing. Additional categories include chemical and compound manufacturing, rubber and plastic products, non-metallic mineral production, fabricated metal products, medical and optical instruments, and household waste processing [23,24,25,26].
Emission characteristics at the facility level vary depending on operational processes, raw material composition, and control technologies in place. For instance, combustion-based processes (e.g., boilers, kilns, and furnaces) are dominant sources of CO, NOₓ, and PM, whereas chemical manufacturing and surface-coating operations emit substantial quantities of VOCs and hazardous air pollutants (HAPs). Fugitive emissions frequently occur from storage tanks, transfer systems, and valves, particularly in petrochemical and solvent-handling industries. Additionally, intermittent but high-intensity releases can result from equipment maintenance, cleaning, and upset conditions. These emission profiles necessitate continuous monitoring strategies and facility-specific emission inventories to improve regulatory accuracy and pollutant mitigation [27,28].
Regionally, Gyeongsangbuk-do exhibits notably higher atmospheric concentrations of carbon monoxide (CO), volatile organic compounds (VOCs), and ammonia (NH₃) compared to both the metropolitan area and national averages, reflecting the spatial distribution and density of point sources in the province [29,30]. VOCs, in particular, display substantial variability in chemical composition and emission magnitude. These compounds are released from both major stationary sources—such as paint, plastic, and petrochemical plants—and small-scale, area-based sources including gas stations, dry cleaners, and photo processing facilities [31,32,33]. The diversity and ubiquity of VOC sources underscore the importance of source-specific monitoring and emission profiling in atmospheric pollution management.
Volatile organic compounds (VOCs), which are emitted from both anthropogenic sources and present in outdoor environments, play a critical role in atmospheric chemistry. Due to their high reactivity, VOCs contribute to photochemical reactions in the troposphere, leading to the formation of ground-level ozone and secondary organic aerosols (SOAs), which exacerbate climate change and degrade air quality. Additionally, several VOC species are known to be toxic, mutagenic, or carcinogenic, thereby posing serious risks to human health [34]. Accordingly, scientific and regulatory interest in VOCs has been steadily increasing. Advances in analytical techniques have facilitated the partial quantification and qualitative identification of trace organic compounds in complex environmental matrices, enabling more accurate assessments of exposure and environmental impact [35]. As such, continuous environmental monitoring of VOCs is essential for both pollution control and health risk assessment.
At the facility level, VOC emissions are strongly influenced by the types of raw materials used, production processes, and the implementation of emission control technologies. In particular, industries such as petrochemical manufacturing, painting and surface coating, resin synthesis, and solvent-based cleaning processes are characterized by high-intensity VOC emissions. Emission pathways include point sources such as stacks and vents, as well as fugitive sources including valves, flanges, storage tanks, and loading operations. These emissions can occur continuously during normal operation or intermittently during equipment maintenance, shutdowns, and accidental releases. The complexity of these emission profiles necessitates process-specific monitoring approaches and targeted regulatory interventions to reduce ambient VOC concentrations and their associated health risks.
In South Korea, the increasing prevalence of respiratory allergies has been linked to rising concentrations of airborne allergens and ambient air pollutants, including VOCs and fine particulate matter [36,37,38]. This trend not only implies substantial public health implications but also highlights the need for integrated monitoring and management strategies to mitigate social and economic burdens.
To improve pollutant tracking and regulatory transparency, the Pollutant Release and Transfer Register (PRTR) system was introduced in South Korea in 2000. Initially focused on two industrial sectors—petroleum refining and chemical manufacturing—and 80 substances, the system was significantly expanded by 2015 (with results published in 2017). It now includes approximately 3,600 facilities across 39 industrial categories classified under the Korean Standard Industrial Classification (KSIC), and monitors 415 substances, including hazardous chemicals, carcinogens, and heavy metals [39,40,41]. By requiring facilities to report annual emissions by substance and process, the PRTR provides a robust framework for characterizing emission source profiles and assessing the effectiveness of pollution control efforts. Comparable PRTR systems have been implemented in the United States (TRI), Japan, Australia, Canada, and EU member states, promoting public access to emissions data and fostering community-driven pollution reduction initiatives [42].
In Korea, the National Institute of Environmental Research (NIER) provides annual and monthly gridded total emissions data for pollutants such as NOₓ, VOCs, and PM via the Clean Air Policy Support System (CAPSS), following the European EMEP inventory format [43]. However, when modeling ozone and PM₂.₅ concentrations, the country currently relies on chemical speciation and temporal allocation profiles for VOCs and PM₂.₅ based on the U.S. EPA’s Source Classification Code (SCC) values [44]. As these factors vary significantly depending on national emission characteristics and inventory structure, it is necessary to develop and apply regionally appropriate profiles and methodologies, particularly for photochemical and receptor modeling, air quality assessments, source contribution estimations, and policy development [45].
2. Method
2.1. Air Pollutant Emissions Inventory Assessment
To assess emissions of air pollutants from small-scale industrial facilities located in environmentally vulnerable areas, it is essential to first construct a detailed emissions inventory. This process should be followed by a review of multiple open-access datasets related to emissions in vulnerable regions. Subsequently, a chemical profile of VOCs and particulate matter (PM) should be developed using domestic source measurement data, complemented by the United States Environmental Protection Agency (US EPA) SPECIATE database (https://www.epa.gov/air-emissions-modeling/speciate) [46]. This approach allows for the refinement of emission source apportionment, facilitating more accurate assessments of air quality and its impact on both human health and the environment.
2.1.1. Establishment of an Emissions Inventory for Vulnerable Areas
Based on recent data, South Korea’s Clean Air Policy Support System (CAPSS) provides air pollutant emissions estimates at various levels of classification (major, intermediate, and detailed categories). CAPSS data, although region- and pollutant-specific, are widely used by researchers due to their accessibility and up-to-date emission estimates. In this study, emission sources within Seocheon-gun were analyzed, and an emissions inventory was constructed for environmentally vulnerable zones in small-scale industrial areas. Source identification was conducted in conjunction with CAPSS source classifications to develop a spatially resolved emissions inventory.
2.1.2. Investigation of Emissions Status in Vulnerable Areas
For spatial and temporal allocation of emissions using CAPSS data, standard operating procedures (SOPs) were referenced, incorporating emission source characteristics. Spatial allocation for point sources was performed using addresses from the Stack Emission Management System (SEMS), which were assigned to corresponding townships. For area sources, regional fuel consumption statistics—such as petroleum and city gas supplies—were used at the municipal (si/gun/gu) level. Since coal statistics are only available at the provincial (do) level, household data and regional indicators were utilized to allocate emissions to smaller administrative units (eup/myeon/dong). Through these efforts, a preliminary emissions inventory was constructed for Seocheon and surrounding areas, and emissions from environmentally vulnerable zones were assessed using spatial and temporal indicators derived from CAPSS [47].
2.1.3. Development of VOC and PM Chemical Profiles Using Domestic Data and the US EPA SPECIATE Database
According to the 2005 and 2011 National-Scale Air Toxics Assessment (NATA), carcinogenic risk factors and their contributing emission sources are defined based on pollutant concentration thresholds and potential human exposure. These assessments distinguish between carcinogenic and non-carcinogenic substances at both national and regional scales. In the South Coast Air Quality Management District's (SCAQMD) MATES III and MATES IV studies, the estimation of carcinogenic risk was carried out by integrating gridded pollutant concentration data with toxicity-weighted risk factors. This methodology enabled a spatially resolved assessment of cancer risks, providing a detailed understanding of the exposure patterns and associated health impacts across different regions. By combining ambient air quality measurements with chemical-specific toxicity values, the studies offer valuable insights into the potential health risks posed by air pollution in the district. Diesel PM showed the highest contribution to carcinogenic risk, followed by other high-impact substances. Based on these findings, chemical profiles for VOCs and PM were reviewed using the US EPA SPECIATE database, which provides detailed chemical speciation by emission source categories (Figure 1). This chemical characterization forms the basis for accurate emissions modeling and risk assessment in the study region.
2.2. Survey Application Based on Emission Characteristics of Small-Scale Industrial Complexes
To estimate emissions from small-scale industrial facilities—particularly businesses classified as Type 4 and Type 5—on-site surveys were conducted to collect licensing information and direct observations. Using these data, emission estimates for these smaller facilities were derived, particularly focusing on sources not reflected in the Ministry of Environment’s CAPSS inventory. It is essential to identify and quantify these overlooked emissions to ensure a more comprehensive understanding of total air pollutant outputs.
Following the selection of target facilities for investigation—based on permit records and collaboration with local governments—a field survey was conducted. This included verification of operational status (e.g., active, closed), consideration of facility-specific characteristics, and estimation of emissions using industry-specific emission factors. The findings allowed for a comprehensive evaluation of the emission characteristics of air pollution sources in small-scale facilities (Figure 2).
Key items targeted during the field investigation included:
(1) basic facility information,
(2) operational status (including operation hours),
(3) raw material consumption, and
(4) air pollutant emission status (e.g., results of self-monitoring reports).
These data were used to validate and refine emission estimates for Type 4 and 5 facilities and can contribute to improving the accuracy and completeness of the national emissions inventory.
2.3. Measurement and Analytical Evaluation by Facility in Small-Scale Industrial Complexes
To identify the causal relationship between specific pollutants and emission sources in small-scale industrial areas, a technical framework for sampling and analytical procedures was developed. This approach aimed to characterize emission profiles and establish source-specific pollutant signatures. In this study, heavy metals (64 species) were analyzed by collecting particulate matter (PM₁₀ and PM₂.₅) following the Korean Air Pollutants Testing Standard Method (KMS-4200).
Sampling was conducted using volumetric control methods with flow rates of 1050 LPM and 16.67 LPM for total suspended particulate collection. Volume timers were used to regulate particulate-phase sampling, with real-time volumetric calibration supported by the KMF-20 flow controller. Pump drivers were employed to ensure constant flow, and continuous sampling was conducted over a one-month period.
Particulate-bound heavy metals were analyzed according to the national air quality test method ES 01115.1, and the potential for further analysis of particle-bound polycyclic aromatic hydrocarbons (PAHs) was considered. Quartz fiber filters (8″ × 10″, QMA filter, Whatman Inc., UK) mounted on high-volume air samplers were used for 24-hour collection periods, repeated over five consecutive days. This setup was determined to be effective for comprehensive characterization of airborne metal pollutants.
In addition to particulate matter, gaseous pollutants such as NO₂ and SO₂ were also targeted for analysis. While detailed chemical characteristics of these compounds require further examination, their concentrations were measured using continuous real-time monitoring instruments compliant with standard methods ES 01601.1 (ultraviolet fluorescence) and ES 01603.5 (differential optical absorption spectroscopy).
For volatile organic compounds (VOCs), personal and environmental exposure levels were assessed using passive air samplers (SKC 575-001, SKC, USA) over a continuous 5-day period, aligned with the sampling schedule for heavy metals. VOC samples were transported under refrigeration to preserve sample integrity and analyzed using gas chromatography-mass spectrometry (GC-MS, model QP2020, Shimadzu, Japan). This method provides high sensitivity and precision in the identification and quantification of volatile organic compounds, ensuring reliable detection of trace-level pollutants in complex environmental matrices. These measurements were used to evaluate the chemical signatures of emission sources and to investigate the causal linkages between specific VOCs and industrial activities.
To investigate the characteristics of emission sources at industrial facilities, a field survey was conducted at ten major workplaces, selected in cooperation with the South Korean Ministry of Environment. These facilities were primarily involved in the handling, storage, and transportation of volatile organic compounds (VOCs), particularly substances such as benzene, toluene, and xylene—commonly identified hazardous VOC species in petrochemical and solvent-intensive operations. In order to minimize disruption to business operations, measurements were scheduled in coordination with facility managers and were limited to predesignated timeframes.
The assessment targeted a range of emission processes, including manufacturing, marine and land-based transport, and shipping operations associated with oil refining. In particular, point sources such as exhaust stacks, as well as fugitive emissions from storage tanks, loading arms, valves, and piping systems, were identified as significant contributors to VOC release. For example, in the petrochemical sector, emissions frequently arise from distillation columns and heat exchangers, whereas in the coating and printing industries, solvent evaporation during drying and curing stages represents a dominant source. In terminal and shipping facilities, loading and unloading operations—especially those involving volatile liquids—exhibit episodic yet high-intensity emissions due to displacement of vapors and tank breathing losses.
Measurements were conducted both within the boundaries of industrial complexes and along peripheral zones, such as roadside areas and facility fences, where ambient accumulation of pollutants is often influenced by wind direction, barrier structures, and operational cycles. To evaluate residential exposure levels, additional monitoring was performed at village halls in Dokgot-ri, Hwagok-ri, and Daejuk-ri, all situated near the industrial clusters.
Ambient air samples were collected in accordance with the national Air Pollution Process Testing Standard (ES 01804.2a) using solid adsorption techniques to ensure the reliable capture and subsequent analysis of VOCs [50]. A total of approximately 100 samples were obtained from the ten industrial workplaces, with an additional 40 samples collected from surrounding residential areas. This dual-scope sampling approach enabled comparative analysis across microenvironments and facilitated the identification of high-risk emission zones based on facility type, operation, and spatial proximity to local populations.
3. Results
3.1. Establishment of an Emission Source Inventory Centered on Industrial Facilities in Environmentally Vulnerable Areas
This study presents the results as of June 2022, based on data provided with the cooperation of Seocheon County, Chungcheongnam-do. Among a total of 190 facilities, an initial survey was conducted to verify their classifications, and approximately 120 facility names were categorized according to the Korean Standard Industrial Classification (KSIC) system.
In the target region, Seocheon County, the food manufacturing sector accounted for the largest proportion of facilities. Of the 190 facilities surveyed, 104 (54.7%) belonged to the KSIC subcategory of food product manufacturing. Within this category, the processing and preservation of aquatic animals was the most prevalent, with 63 facilities identified.
A detailed classification of the business types in Seocheon County by middle, small, and detailed KSIC subcategories is provided in Figure 3. Additionally, data from the Pollutant Release and Transfer Register (PRTR) system indicated that only seven facilities in Seocheon County had reported information on chemical emissions and transfers.
When comparing the PRTR data with the broader facility data obtained through local government cooperation, a significant discrepancy was observed: while Seocheon County hosts 190 businesses, only 7 are represented in the PRTR system. This highlights the potential underreporting or lack of inclusion of smaller facilities in national emission databases, underscoring the need for expanded and localized inventory development in environmentally vulnerable regions.
3.2. Results of the Emission Status Survey of Air Pollutants in Environmentally Vulnerable Areas
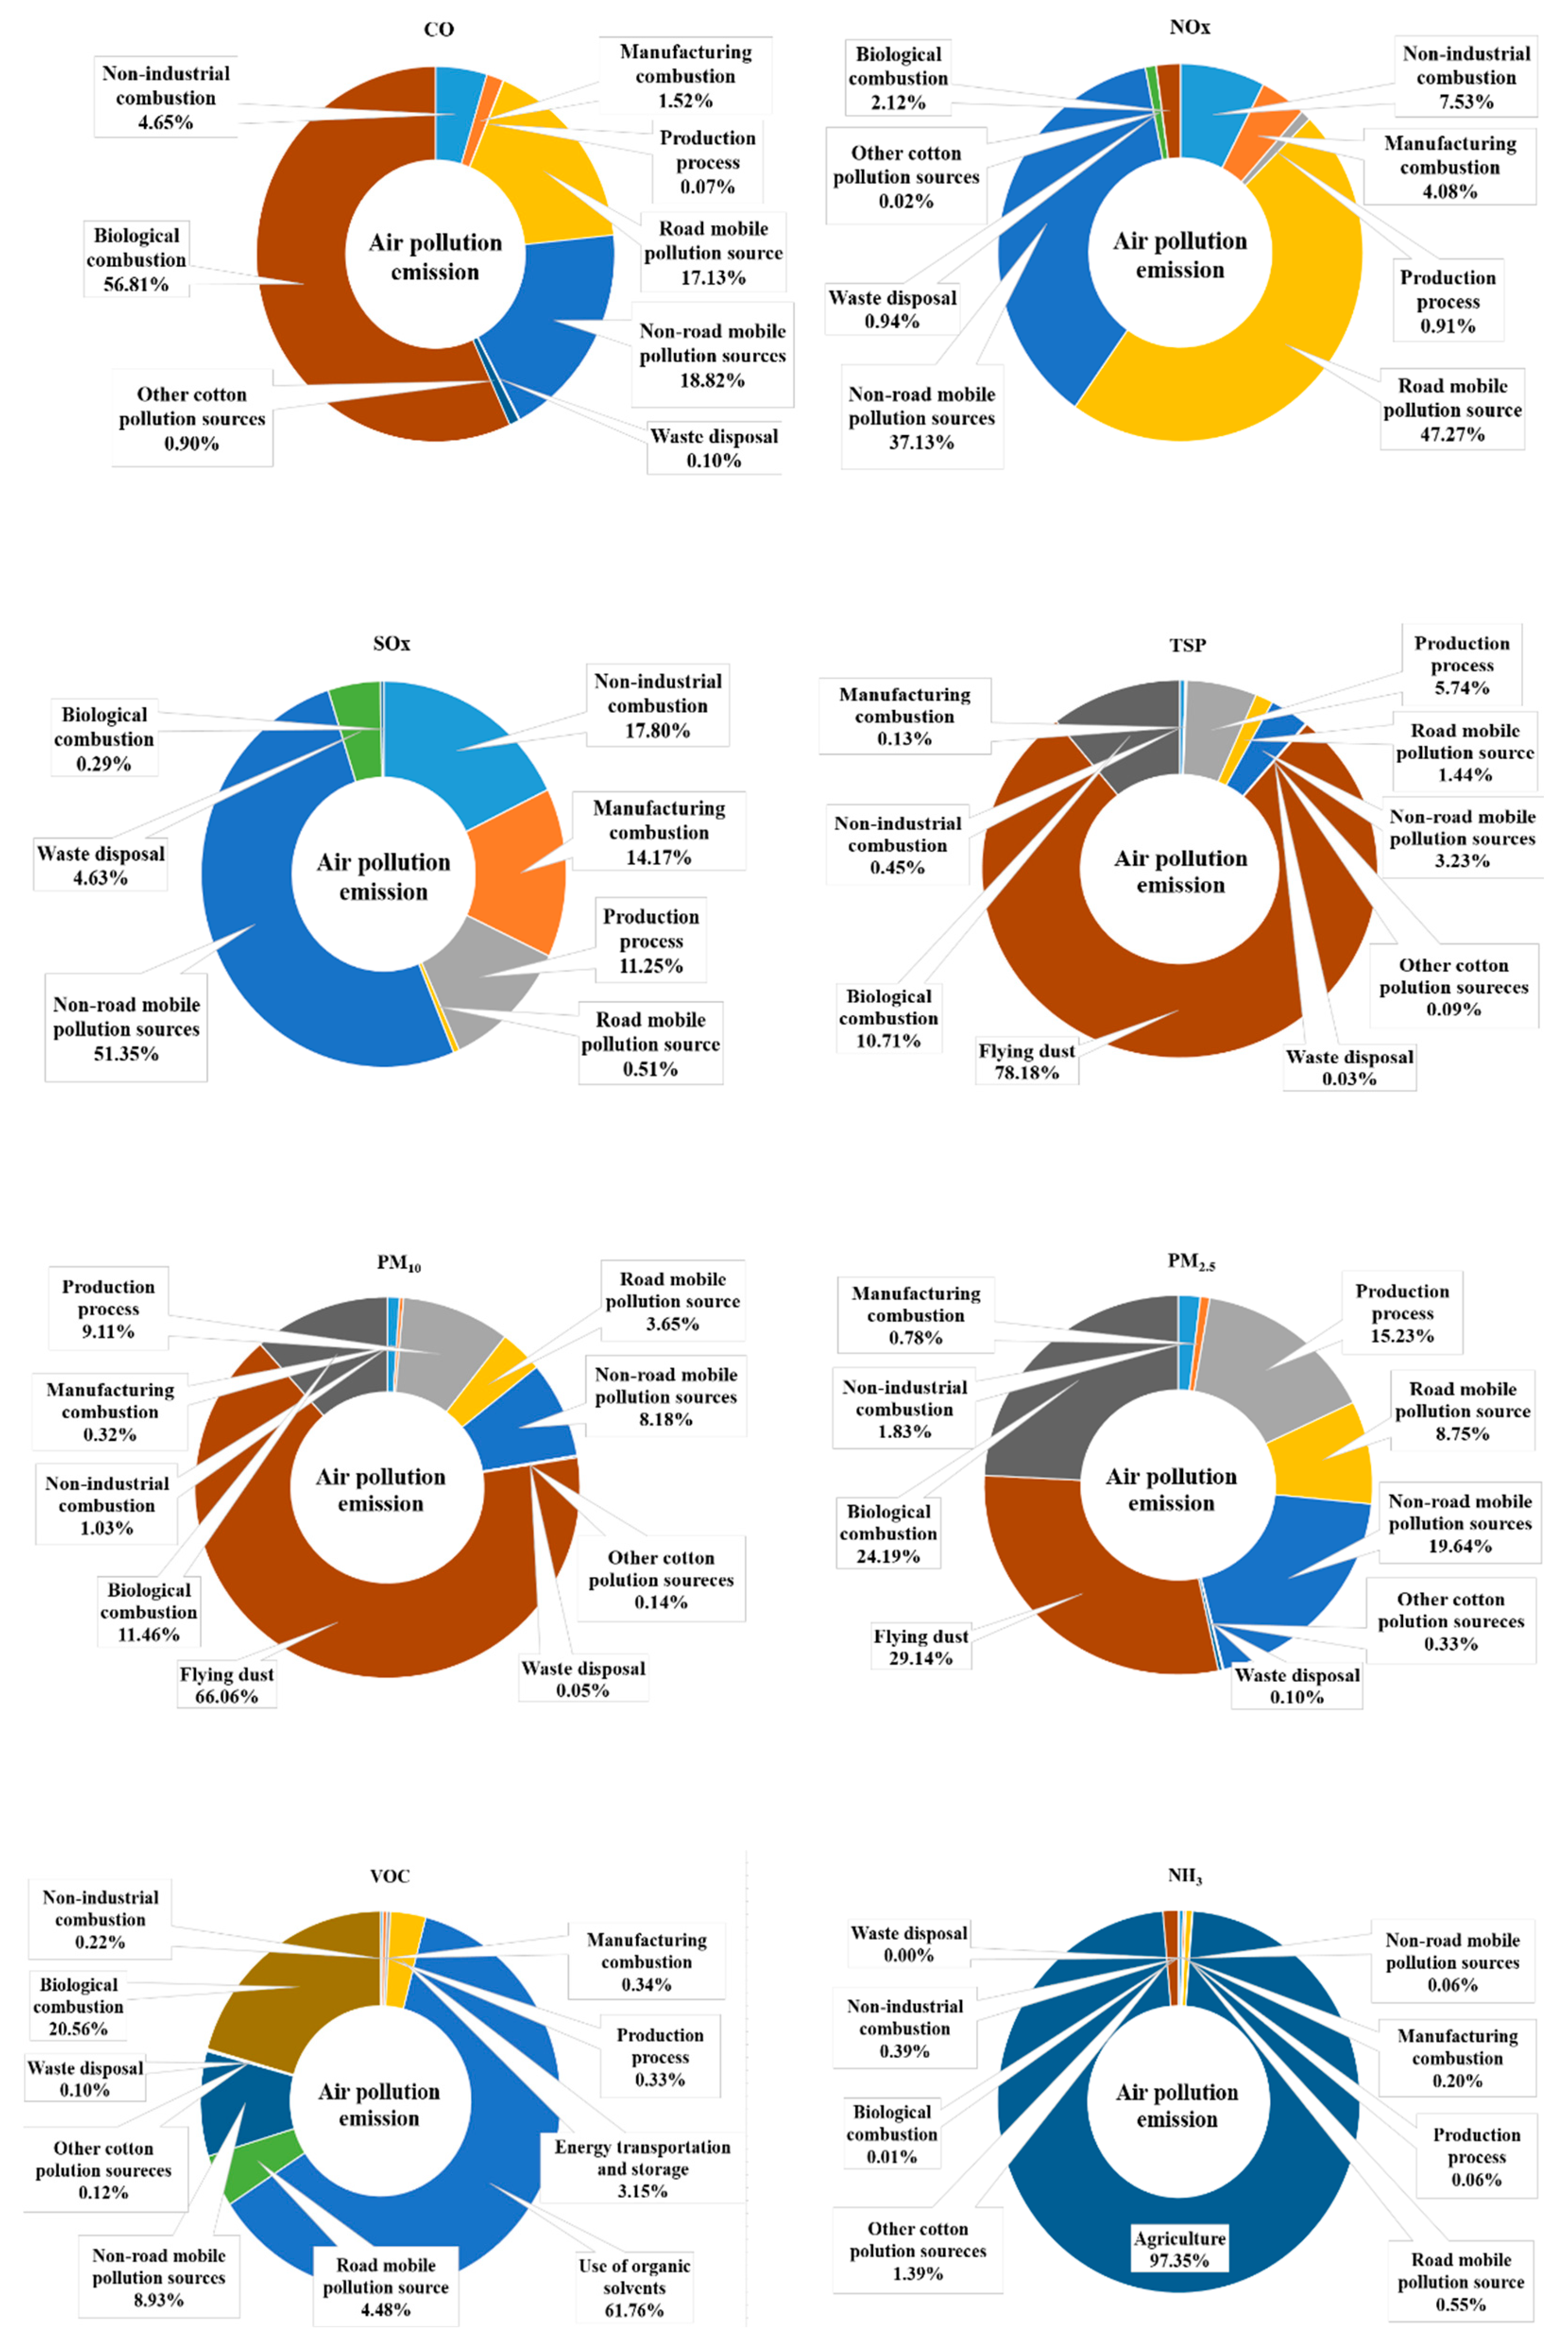
During the initial phase of the study, data were collected using the Clean Air Policy Support System (CAPSS), a national Air Pollutants Emission Inventory platform. This system provides systematically organized baseline data on air pollutant emissions, enabling informed air quality policy development and supporting the evaluation and implementation of regulatory measures. The CAPSS platform facilitates comprehensive data management, ensuring consistency and accuracy in emissions reporting. Based on the most recent data available at the time, the national emissions for Seocheon County, Chungcheongnam-do in 2019 were as follows: CO – 1,728.80 ton/yr, NOx – 1,645.40 ton/yr, SOx – 126.24 ton/yr, TSP – 1,177.78 ton/yr, PM₁₀ – 465.30 ton/yr, PM₂.₅ – 178.41 ton/yr, VOCs – 1,104.29 ton/yr, and NH₃ – 950.39 ton/yr.
Figure 3 illustrates the relative contribution of each emission sector for individual air pollutants. Consistent with previous studies [48], CO emissions were found to be primarily from biomass burning. NOx emissions were dominated by on-road mobile sources, while SOx emissions were primarily from non-road mobile sources. VOC emissions were largely attributed to solvent use, and NH₃ emissions were predominantly from the agricultural sector. For TSP, PM₁₀, and PM₂.₅, fugitive dust was the leading source; excluding fugitive dust, biomass burning emerged as the major contributor for particulate matter emissions.
Figure 4.
Air pollutant emissions in Seocheon-gun, Chungcheongnam-do as of 2019 (Unit: ton/yr).
In the food manufacturing sector, specifically within the subcategory of "Other Processed Fruits and Vegetables," three substances were reported, with acetic acid accounting for 100.00% of the emissions. In the "Other Food Manufacturing" subcategory, emissions of nine substances were identified, with the major contributors being methyl alcohol (62.52%), followed by ammonia (13.40%), hydrogen peroxide (9.93%), hydrogen chloride (8.75%), nitric acid (5.35%), sodium hydroxide (0.04%), and sulfuric acid (0.03%).
Lastly, in the "Seasoning and Food Additive Manufacturing" sector, twelve substances were reported. Ammonia was the most significant (75.97%), followed by hydrogen chloride (15.02%), vinyl acetate (4.06%), ethyl acetate (4.06%), and methanol (0.84%). Four substances—chloroacetic acid (0.03%), hydrogen peroxide (0.01%), and two others—were either not emitted or present at negligible levels (Table 1, Figure 5).
3.3. VOC and PM Profile Development Using EPA Speciate 5.1
Speciate, developed by the United States Environmental Protection Agency (EPA), is a repository of speciated emission profiles by source category (https://www.epa.gov/air-emissions-modeling/speciate). It provides detailed compositional information on organic gases, particulate matter (PM), and other pollutants emitted from various sources [49]. The emission profiles from the SPECIATE database serve several critical functions in environmental modeling and pollutant assessment.
These include: (1) generating source-specific emission inventories for regional haze, particulate matter (PM), greenhouse gases (GHGs), and photochemical air quality models; (2) incorporating particulate matter species into the National Emissions Inventory (NEI); (3) facilitating black carbon assessments and the development of carbonaceous particulate matter inventories; (4) estimating emissions of toxic pollutants from primary PM and organic gas sources; (5) providing input data for chemical mass balance (CMB) models; and (6) enabling the validation of profiles derived from ambient air measurements using multivariate receptor models. These emission profiles are essential for advancing the accuracy of air quality predictions and improving our understanding of source-receptor relationships.
To develop Speciate version 5.1, EPA added 16 organic gas profiles, 18 PM profiles, and 58 mercury and other miscellaneous profiles to the existing Speciate 5.0 database. As a result, the Speciate 5.1 database now includes a total of 6,746 emission profiles (Figure 6).
The United States Environmental Protection Agency (EPA) has continuously carried out the measurement and revision of emission factors, with results being systematically compiled and published through a centralized database known as WebFIRE [50]. The WebFIRE database contains emission factors for pollutants such as CO, CO₂, NH₃, NOₓ, SO₂, VOCs, PM₁₀ (filterable), PM₁₀ (primary), PM₂.₅ (filterable), PM₂.₅ (primary), PM (condensable), PM (filterable), and PM (primary), categorized according to Source Classification Codes (SCCs).
The process of estimating source-specific chemical species mass fractions (wt%) and pollutant emissions using WebFIRE and Speciate involves the following six steps: Source Identification and Characterization: Determine the emission source and its operational characteristics—for instance, in the case of boilers, this includes the combustion method, purpose, fuel type, and control devices. SCC Selection: Choose the appropriate SCC from the WebFIRE database corresponding to the identified emission source. Emission Factor Confirmation: Retrieve the relevant air pollutant emission factors associated with the selected SCC from WebFIRE. Profile Selection: Select an appropriate chemical profile from the Speciate database that corresponds to the same source characteristics as the SCC. Mass Fraction Identification: Identify the mass fractions of particulate and gaseous chemical species from the selected profile. Emission Estimation: Calculate the emission amounts of each particulate and gaseous species using the mass fractions and emission factors obtained in the previous steps.
3.4. Analysis Results of Industrial Facilities and Surrounding Areas in Small-Scale Industrial Complexes
Fenceline monitoring was conducted for selected industrial sites, including Daejin Remicon Co., Ltd., Hansol Paper, Seojin Beauty Co., Ltd., and Hangju Co., Ltd. Concurrently, receptor monitoring was carried out in cooperation with nearby public institutions—such as the fire station, fishery cooperative, community service center, and Seocheon County Office—as well as at a senior welfare center, which was identified as a location with frequent complaints from local residents. Measurements were taken across all four seasons to assess consistency in pollutant concentration trends over time.
By grouping the target areas and comparing average concentrations obtained from both fenceline and receptor monitoring, it was found that, excluding Ni (nickel), Cu (copper), Cd (cadmium), Sn (tin), and Pb (lead), the fenceline locations generally exhibited higher concentration contributions, accounting for 60–80% or more of the total average contributions (100%) across all sites (Figure 7).
As a result, the substances previously identified in receptor areas have continued to match with the recent questionnaire results, indicating that these findings can serve as valuable variables for future assessments. Upon examining the characteristics of the industrial sites, it was confirmed that concentrations were generally higher at the industrial facilities (e.g., remicon, Seojin Beauty, Hansol Paper, and fisheries sectors) compared to nearby residential and administrative areas such as the county office, community center, senior welfare center, fire station, and fishery cooperative.
Overall, consistent concentration levels of heavy metals were observed across all four seasons, particularly in the vicinity of the industrial facilities and their surrounding areas. This seasonal stability supports the reliability of the concentration patterns. Consequently, emission source tracking (based on modeling and surveys of Class 4 and 5 facilities) shows strong agreement and provides a promising indicator for reliable source identification (Figure 8).
4. Discussion
As of June 2022, a survey of 190 facilities in Seocheon County, Chungcheongnam-do revealed that over half (54.7%) belonged to the food manufacturing sector, with aquatic animal processing being the most common. About 120 facility names were classified using the Korean Standard Industrial Classification (KSIC). However, only 7 facilities were registered in the national PRTR system, indicating a significant gap and possible underreporting [51,52]. This emphasizes the need for more localized and comprehensive emission inventories in environmentally vulnerable areas [53].
Using 2019 data from the Clean Air Policy Support System (CAPSS), Seocheon County’s major air pollutant emissions were quantified, with CO, NOx, VOCs, and NH₃ as key pollutants. CO mainly originated from biomass burning, NOx from on-road mobile sources, SOx from non-road sources, VOCs from solvent use, and NH₃ from agriculture. Fugitive dust was the dominant source of particulate matter (TSP, PM₁₀, PM₂.₅) [54,55,56].
In the food manufacturing sector, emission profiles varied by subcategory: Other Processed Fruits and Vegetables: 100% of emissions were acetic acid. Other Food Manufacturing: Methyl alcohol (62.52%) was dominant. Seasoning and Food Additive Manufacturing: Ammonia (75.97%) was the highest contributor.
The U.S. EPA’s Speciate database provides detailed emission profiles—including organic gases, PM, and other pollutants—by source category to support air quality modeling and inventory development. Version 5.1 includes 6,746 profiles, enhanced with new organic gas, PM, and mercury profiles. Emission factors are separately managed in the WebFIRE database, categorized by Source Classification Codes (SCCs) and covering pollutants like CO, NOₓ, VOCs, PM, and more.
A standardized six-step method integrates WebFIRE and Speciate to estimate emissions by identifying sources, selecting SCCs, confirming emission factors, choosing matching chemical profiles, identifying species mass fractions, and calculating final emissions.
Seasonal fenceline and receptor monitoring around key industrial sites in Seocheon County revealed consistently higher concentrations of pollutants near industrial facilities—such as Daejin Remicon, Hansol Paper, Seojin Beauty, and Hangju—compared to nearby public and residential areas. Fenceline sites contributed 60–80% or more of total average concentrations (excluding Ni, Cu, Cd, Sn, and Pb). Pollutant patterns remained stable across all seasons, aligning with resident complaints and survey data. These findings validate the reliability of emission source tracking for Class 4 and 5 facilities and provide strong indicators for future pollution source identification.
This study is expected to contribute significantly as a basis for decision-making support in environmental management policies, aiming to minimize adverse impacts based on the causal analysis of survey responses and measurement results. The technology developed in this project focuses on enhancing the possibility of minimizing damage through decision-making optimization based on environmental pollutant evaluations. The goal is to develop risk assessment tools based on exposure to outdoor environmental hazards and the types of emission sources and chemicals involved, as well as to measure the risks posed to vulnerable groups.
To validate and implement the developed sensor technologies, the correlation between environmental factors should be compared using national measurement networks and integrated with refined spatial techniques to establish source profiles. The provision of sufficient infrastructure for such an initiative is essential, ensuring a clear pathway to future improvements. South Korea possesses the optimized conditions necessary for conducting this research and developing a foundational methodology that can position the country as a leader in this field. The development of a questionnaire tailored to small-scale businesses during the project has the potential to lay the groundwork for presenting pioneering technologies.
Furthermore, this research aims to establish continuous measurement standards through exposure prediction and monitor optimization, focusing on small-scale business regions and high-risk areas. The project will emphasize the importance of utilizing the foundational data from this study to enhance future environmental monitoring strategies and optimization techniques.
5. Conclusions
The main characteristics of emission sources identified in this study confirm that chemical substances emitted from industrial complexes and facilities have significant impacts on both the environment and human health. In particular, key emission sources include air pollutants, heavy metals, and organic compounds, with these pollutants varying depending on the industrial activity. For example, specific chemicals are predominantly emitted from industries such as paper manufacturing, ready-mixed concrete (remicon) production, and beauty product manufacturing. These activities were found to be direct contributors to emissions. As a result, the health impacts of these emissions on surrounding communities were observed, with chemical substances released into the environment negatively affecting the health of local residents. The health effects are diverse, including air pollution, heavy metals, and particulate matter (PM). Long-term exposure to these pollutants can lead to serious health issues such as respiratory diseases and cardiovascular problems. Furthermore, the environmental monitoring methods employed in this study, which involved measuring air quality and pollutant concentrations around industrial sites, were instrumental in identifying the characteristics of the emissions. Through seasonal and long-term monitoring, changes in pollutant concentrations and patterns were analyzed, providing scientific evidence of the emission sources and their impact. Based on these findings, the study’s results are expected to serve as valuable data for decision-making in policy development. Most importantly, this research is anticipated to contribute to the development of environmental management and health protection policies, providing crucial foundational data for future efforts in pollution control and public health safeguarding. The outcomes of this research are expected to be highly valuable, with progress made in the development of an environmental emission source investigation and chemical substance prediction models based on both domestic and international data, as well as expert opinions and evaluations. This includes the establishment of correlations through measurement devices, the development of a module for harmful environmental factors in living environments, exposure algorithms for harmful environmental factors, and the creation of source profiles based on indicators and spatialization techniques using measurement devices. These advancements are expected to provide significant utility. Considering the practical aspects of emission sources, the integration of existing data (such as the Clean Air Policy Support System, CAPSS, and the US EPA Speciate database) allows for the calculation of emission inventories and quantities. For small-scale facilities (class 4 and 5), where existing data is often insufficient, survey-based emission inventories and emission quantity estimations can be used to perform a detailed analysis of potential emission sources in both the facilities and surrounding areas. This approach will provide foundational data for source identification and contribute to the investigation of causal relationships through health risk assessments considering air dispersion patterns. Ultimately, this research is expected to contribute significantly to environmental pollution source tracking, offering high potential value in terms of health risk assessments and aiding the identification and analysis of pollution sources.
Funding
The Mental Health Technology Project of the Korea Environmental Industry & Technology Institute(KEITI), with funding from the Ministry of Environment (Grant No. 2021003320007).
Institutional Review Board Statement
Not applicable.
Informed Consent Statement
Not applicable.
Data Availability Statement
The dataset analyzed during the current study are available from the corresponding author on reasonable request.
Acknowledgments
This work was supported by Korea Environment Industry & Technology Institute(KEITI) through Core Technology Development Project for Environmental Diseases Prevention and Management Program, funded by Korea Ministry of Environment(MOE) (2021003320007).
Conflicts of Interest
The authors declare no conflicts of interest regarding the publication of this article.
References
- Rondinelli, D.A.; Vastag, G. Assessing South Korea’s Globalization Strategy and the International Competitiveness of the Seoul Metropolitan Area. Compet. Change 1997, 2, 299–329. [Google Scholar] [CrossRef]
- Bae, S.H.; Choi, J.H.; Kim, G.B.; Song, S.H.; Ha, M.A.; Kwon, H.J. Evaluation of the exposure to environmental pollutants emanating from national industrial complexes. Environ. Health Toxicol. 2018, 33, e2018007. [Google Scholar] [CrossRef] [PubMed]
- Sung, J.H.; Oh, I.B.; Kim, A.R.; Lee, J.H.; Sim, C.S.; Yoo, C.I.; Park, S.J.; Kim, G.B.; Kim, Y.H. Environmental and body concentrations of heavy metals at sites near and distant from industrial complexes in Ulsan, Korea. J. Korean Med. Sci. 2018, 33, e33. [Google Scholar] [CrossRef]
- Lee, J.T.; Shin, D.C.; Chung, Y. Air pollution and daily mortality in Seoul and Ulsan, Korea. Environ. Health Perspect. 1999, 107, 149–154. [Google Scholar] [CrossRef] [PubMed]
- Alyasi, H.S.; Isaifan, R. A review on pollution emissions and impact from waste treatment and disposal facilities. J. Environ. Toxicol. Stud. 2018, 2, 1–9. [Google Scholar] [CrossRef]
- Mohammed, A.S.; Kapri, A.; Goel, R. Heavy metal pollution: Source, impact, and remedies. In Biomanagement of Metal-Contaminated Soils; Springer, Dordrecht, The Netherlands, 2011; pp. 1–28. [CrossRef]
- Chukwuemekaa, I.S.; Njoku, V.O.; Arinze, C.; Chizoruo, I.F.; Blessing, E.N. A review: Effects of air, water and land dumpsite on human health and analytical methods for determination of pollutants. Anal. Methods Environ. Chem. J. 2021, 4, 80–106. [Google Scholar] [CrossRef]
- Harrison, R.M.; Yin, J. Particulate matter in the atmosphere: Which particle properties are important for its effects on health? Sci. Total Environ. 2000, 249, 85–101. [Google Scholar] [CrossRef]
- Hsu, C.Y.; Chiang, H.C.; Chen, M.J.; Chuang, C.Y.; Tsen, C.M.; Fang, G.C.; Tsai, Y.I.; Chen, N.T.; Lin, T.Y.; Lin, S.L.; et al. Ambient PM2.5 in the residential area near industrial complexes: Spatiotemporal variation, source apportionment, and health impact. Sci. Total Environ. 2017, 590, 204–214. [Google Scholar] [CrossRef]
- Neuparth, T.; Moreira, S.M.; Santos, M.M.; Reis-Henriques, M.A. Review of oil and HNS accidental spills in Europe: Identifying major environmental monitoring gaps and drawing priorities. Mar. Pollut. Bull. 2012, 64, 1085–1095. [Google Scholar] [CrossRef]
- Gray, W.B.; Shimshack, J.P. The effectiveness of environmental monitoring and enforcement: A review of the empirical evidence. Rev. Environ. Econ. Policy 2011, 5, 3–24. [Google Scholar] [CrossRef]
- Lee, K.H.; Moon, C.S.; Woo, K.S.; Kang, T.S.; Chung, E.K.; Son, B.S. Simultaneous exposure to heavy metals among residents in the industrial complex: Korean national cohort study. Int. J. Environ. Res. Public Health 2015, 12, 5905–5917. [Google Scholar] [CrossRef]
- Kim, S.Y.; Park, E.J.; Song, S.H.; Lee, C.W.; Kwon, J.T.; Park, E.Y.; Kim, B.M. Toluene concentrations in the blood and risk of thyroid cancer among residents living near national industrial complexes in South Korea: A population-based cohort study. Environ. Int. 2021, 146, 106304. [Google Scholar] [CrossRef]
- PARK, J.H.; RHEW, D.H.; Park, J.H.; Ryu, D.H. Necessity of Strengthening Small-Scale Wastewater Discharge Facilities Management. Journal of Korean Society on Water Environment. 2018, 34, 226–233. [Google Scholar] [CrossRef]
- PARK, S.H.; KIM, S.C.; KIM, D.S. A Study on the Characteristics of Local Air Pollutants According to the Analysis of Gunsan Air Pollutnats Network Data (2017-2019). Journal of Korean Society for Atmospheric Environment. 2022, 38.3, 421–436. [Google Scholar] [CrossRef]
- Thunis, P.; Degraeuwe, B.; Pisoni, E.; Ferrari, F.; Clappier, A. THUNIS, Philippe, et al. On the design and assessment of regional air quality plans: The SHERPA approach. Journal of Environmental Management. 2016, 183, 952–958. [Google Scholar] [CrossRef]
- Lee, D.J.; Yun, J.H.; Yoo, B.T. A Study on the Improvement of Emergency Block and Diffusion Prevention System for Hazardous Chemicals Leakage. Journal of the Korean Institute of Gas. 2018, 22.5, 89–99. [Google Scholar] [CrossRef]
- Kim, S.j.; Lim, Y.R.; Bae, H.J. A study on the spatiotemporal characteristics of a hazard-based index using the pollutant release and transfer register data. 2021. Journal Environ Health Sci. 2021, 47.2, 144–154. [Google Scholar]
- Guttikunda, S.K.; Goel, R.; Pant, P. Nature of air pollution, emission sources, and management in the Indian cities. Atmos. Environ. 2014, 95, 501–510. [Google Scholar] [CrossRef]
- Chithra, V.S.; Nagendra, S.M.S. Chemical and morphological characteristics of indoor and outdoor particulate matter in an urban environment. Atmos. Environ. 2013, 77, 579–587. [Google Scholar] [CrossRef]
- Dholakia, H.H.; Purohit, P.; Rao, S.; Garg, A. Impact of current policies on future air quality and health outcomes in Delhi, India. Atmos. Environ. 2013, 75, 241–248. [Google Scholar] [CrossRef]
- Kim, K.H.; Lee, J.H.; Jang, M.S. Metals in airborne particulate matter from the first and second industrial complex area of Taejon city, Korea. Environ. Pollut. 2002, 118, 41–51. [Google Scholar] [CrossRef]
- Choi, G.H.; Kang, C.H.; Lee, J.H.; Kim, J.Y.; Youn, Y.H.; Lee, S. R The chemical composition of fine and coarse particles in relation with the Asian Dust events. Atmos. Environ. 2003, 37, 753–765. [Google Scholar] [CrossRef]
- Ho, K.F.; Lee, S.C.; Chan, C.K.; Yu, J.C.; Chow, J.C.; Yao, X.H. Ambient PM2.5 in the residential area near industrial complexes: Spatiotemporal variation, source apportionment, and health impact. Atmos. Environ. 2003, 37, 31–39. [Google Scholar] [CrossRef]
- Kim, N.S.; Lee, B.K. National estimates of blood lead, cadmium, and mercury levels in the Korean general adult population. Epidemiology 2011, 22, S247. [Google Scholar] [CrossRef]
- Guohao, L.; Wei, W.; Shao, X.; Nie, L.; Wang, H.; Yan, X.; Zhang, R. A comprehensive classification method for VOC emission sources to tackle air pollution based on VOC species reactivity and emission amounts. J. Environ. Sci. 2018, 67, 78–88. [Google Scholar] [CrossRef]
- Watson, J.G.; Chow, J.C.; Fujita, E.M. Review of volatile organic compound source apportionment by chemical mass balance. Atmos. Environ. 2001, 35, 1567–1584. [Google Scholar] [CrossRef]
- Wei, W.; Cheng, S.; Li, G.; Wang, G.; Wang, H. Characteristics of volatile organic compounds (VOCs) emitted from a petroleum refinery in Beijing, China. Atmos. Environ. 2014, 89, 358–366. [Google Scholar] [CrossRef]
- Hsu, C.Y.; Chiang, H.C.; Shie, R.H.; Ku, C.H.; Lin, T.Y.; Chen, M.J.; Chen, N.T.; Chen, Y.C. Ambient VOCs in residential areas near a large-scale petrochemical complex: Spatiotemporal variation, source apportionment and health risk. Environ. Pollut. 2018, 240, 95–104. [Google Scholar] [CrossRef]
- Hwang, I.J.; Lee, T.J.; Kim, T.O.; Bae, G.N. Characteristics of air pollutant emissions and distribution for particulate matter concentration of air pollution networks in Gyeongsangbuk-do. J. Korean Soc. Atmospheric Environ. 2021, 37, 536–551. [Google Scholar] [CrossRef]
- Hwang, I.J.; Kim, T.O. Chemical characteristics of ambient PM2. 5 at industrial complex in Gyeongbuk area. J. Korean Soc. Atmospheric Environ. 2019, 35, 336–345. [Google Scholar] [CrossRef]
- Civan, M.Y.; Elbir, T.; Seyfioglu, R.; Kuntasal, Ö.O.; Bayram, A.; Doğan, G.; Yurdakul, S.; Andiç, Ö.; Müezzinoğlu, A.; Sofuoglu, S.C.; Pekey, H.; Pekey, B.; et al. Spatial and temporal variations in atmospheric VOCs, NO2, SO2, and O3 concentrations at a heavily industrialized region in Western Turkey, and assessment of the carcinogenic risk levels of benzene. Atmos. Environ. 2015, 103, 102–113. [Google Scholar] [CrossRef]
- Cai, C.; Geng, F.; Tie, X.; Yu, Q.; An, J. Characteristics and source apportionment of VOCs measured in Shanghai, China. Atmos. Environ. 2010, 44, 5005–5014. [Google Scholar] [CrossRef]
- Geng, F.; Tie, X.; Xu, J.; Zhou, G.; Peng, L.; Gao, W.; Tang, X.; Zhao, C. Characterizations of ozone, NOx, and VOCs measured in Shanghai, China. Atmos. Environ. 2008, 42, 6873–6883. [Google Scholar] [CrossRef]
- Guo, H.; Wang, T.; Simpson, I.J.; Blake, D.R.; Yu, X.M.; Kwok, Y.H.; Li, Y.S. Source contributions to ambient VOCs and CO at a rural site in eastern China. Atmos. Environ. 2004, 38, 4551–4560. [Google Scholar] [CrossRef]
- Wen, M.; Deng, W.; Huang, J.; Zhang, S.; Lin, Q.; Wang, C.; Ma, S.; Wang, W.; Zhang, X.; Li, G.; et al. Atmospheric VOCs in an industrial coking facility and the surrounding area: Characteristics, spatial distribution and source apportionment. J. Environ. Sci. 2024, 138, 660–670. [Google Scholar] [CrossRef] [PubMed]
- Kim, M.H.; Kim, S.M. Estimation of air pollutant emissions by tractor utilization in Korea. Agriculture 2023, 13, 1811. [Google Scholar] [CrossRef]
- To, T.; Zhu, J.; Larsen, K.; Simatovic, J.; Feldman, L.; Ryckman, K.; Gershon, A.; Lougheed, M.D.; Licskai, C.; Chen, H.; et al. Progression from asthma to chronic obstructive pulmonary disease. Is air pollution a risk factor? Am. J. Respir. Crit. Care Med. 2016, 194, 429–438. [Google Scholar] [CrossRef]
- Suthar, G.; Singhal, R.P.; Khandelwal, S.; Kaul, N.; Parmar, V.; Singh, A.P. Annual and seasonal assessment of spatiotemporal variation in PM2. 5 and gaseous air pollutants in Bengaluru, India. Environment, Development and Sustainability. 2024, 26.8, 20629-20652. [CrossRef]
- Kim, S.j.; Lim, Y.R.; Bae, H.J. Hyun-Joo. A study on the spatiotemporal characteristics of a hazard-based index using the pollutant release and transfer register data. J Environ Health Sci. 2021, 47.2, 144-154. [CrossRef]
- Im, J.Y.; Jeon, D.Y.; Kim, B.K.; Ryu, J.S.; Yoon, D.S.; Lee, C.S. A study on the emission characteristics of odorous substances in Korea. J Environ Health Sci. 2019, 45.5, 465–473. [Google Scholar] [CrossRef]
- Im, J.Y.; Kim, H.J.; Kim, M.S.; Lee, J.H.; Lee, S.M.; Lee, C.S. A Study on the Variation of Hazardous Pollutant Emissions in Korea from 2006 to 2015. Journal of Environmental Health Sciences. 2018, 44.1, 15–23. [Google Scholar] [CrossRef]
- MOON, Y.S. Estimation of Chemical Speciation and Temporal Allocation Factor of VOC and PM2. 5 for the Weather-Air Quality Modeling in the Seoul Metropolitan Area. Journal of the Korean earth science society. 2015, 36.1, 36-50. [CrossRef]
- Tesche, T.W.; Morris, R.; Tonnesen, G.; McNally, D.; Boylan, J.; Brewer, P. CMAQ/CAMx annual 2002 performance evaluation over the eastern US. Atmospheric Environment. 2006, 40.26, 4906–4919. [Google Scholar] [CrossRef]
- Moon, Y.S.; Lim, Y.K.; Hong, S.W. Chang, E.M. Verification and Estimation of the Contributed Concentration of CH 4 Emissions Using the WRF-CMAQ Model in Korea. Journal of the Korean earth science society. 2013, 34.3, 209-223. [CrossRef]
- U.S Environmental Protection Agency. 2020. SPECIATE 5.1 and 5.0 Addendum and Final Report. https://www.epa.gov/air-emissions-modeling/speciate-51-and-50-addendum-and-final-report.
- Lim, J.H.; Kwak, K.K.; Kim, J.; Jang, Y. Analysis of annual emission trends of air pollutants by region. Journal of Korean Society for Atmospheric Environment. 2018, 34.1, 76–86. [Google Scholar] [CrossRef]
- Kim, J.S.; Choi, Y.J.; Lee, K.B.; Kim, S.D. Relation with activity of road mobile source and roadside nitrogen oxide concentration. Journal of Korean Society for Atmospheric Environment. 2016, 32.1, 9–20. [Google Scholar] [CrossRef]
- U.S Environmental Protection Agency. 2023, Emission Modeling Tools. Available:https://www.epa.gov/air-emissions-modeling/speciate.
- U.S Environmental Protection Agency. 2023, Electronic-reporting-air-emissions. Available: https://cfpub.epa.gov/webfire/.
- SÖRME, L.; PALM, V.; FINNVEDEN, G. Using E-PRTR data on point source emissions to air and water—First steps towards a national chemical footprint. Environmental Impact Assessment Review. 2016, 56, 102–112. [Google Scholar] [CrossRef]
- KONDO, M.; LIMJIRAKAN, S. Perceptions of Private Sector towards the Pollutant Release and Transfer Register: A Case Study on Petrochemical Industry in the Map Ta Phut Industrial Estate, Rayong, Thailand. EnvironmentAsia. 2013, 6.1, 1–5. [Google Scholar] [CrossRef]
- Edwards, S.J.; Walker, T.R. An overview of Canada’s National Pollutant Release Inventory program as a pollution control policy tool. Journal of Environmental Planning and Management. 2020, 63.6, 1097–1113. [Google Scholar] [CrossRef]
- Kim, J.; Jang, Y.K. Uncertainty Assessment for CAPSS Emission Inventory by DARS. Journal of Korean Society for Atmospheric Environment. 2014, 30.1, 26–36. [Google Scholar] [CrossRef]
- Kim, O.G.; Bae, M.A.; Kim, S.T. Evaluation on Provincial NOX and SO2 Emissions in CAPSS 2016 Based on Photochemical Model Simulation. Journal of Korean Society for Atmospheric Environment. 2020, 36.1, 64–83. [Google Scholar] [CrossRef]
- Yeo, S.Y.; Lee, H.K.; Choi, S.W.; Seol, S.H.; Jin, H.A.; Yoo, C.; Kim, J.H.; Kim, J.S. Analysis of the National Air Pollutant Emission Inventory (CAPSS 2015) and the Major Cause of Change in Republic of Korea. Asian Journal of Atmospheric Environment. 2019, 13.3, 212–231. [Google Scholar] [CrossRef]
Figure 1.
Research purpose, the process of collecting basic data to track emission sources in vulnerable areas.
Figure 1.
Research purpose, the process of collecting basic data to track emission sources in vulnerable areas.
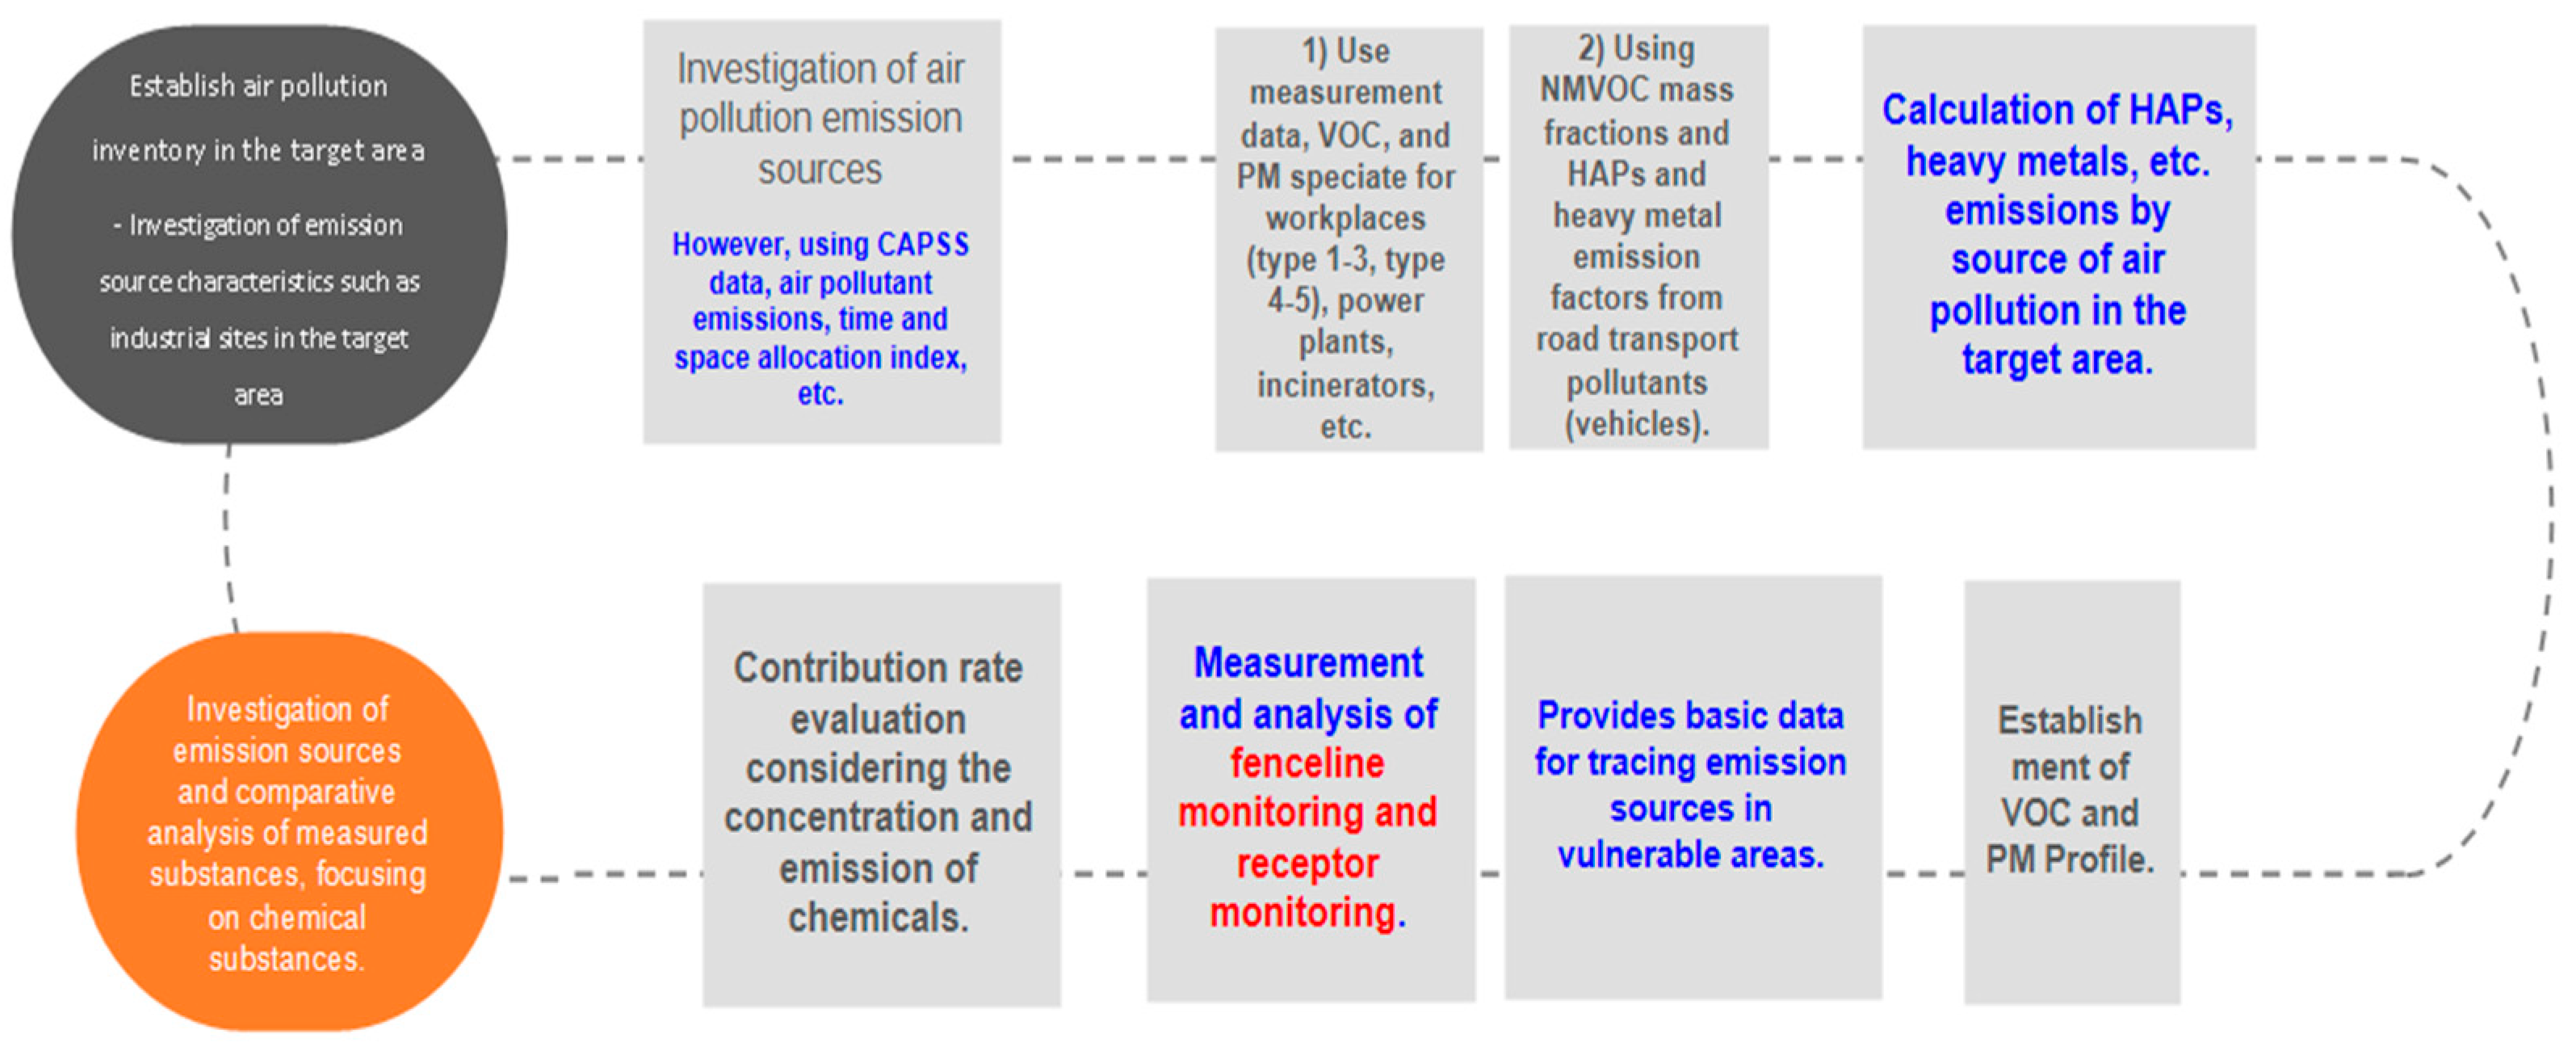
Figure 2.
On-site inspection checklist for air emission facilities.
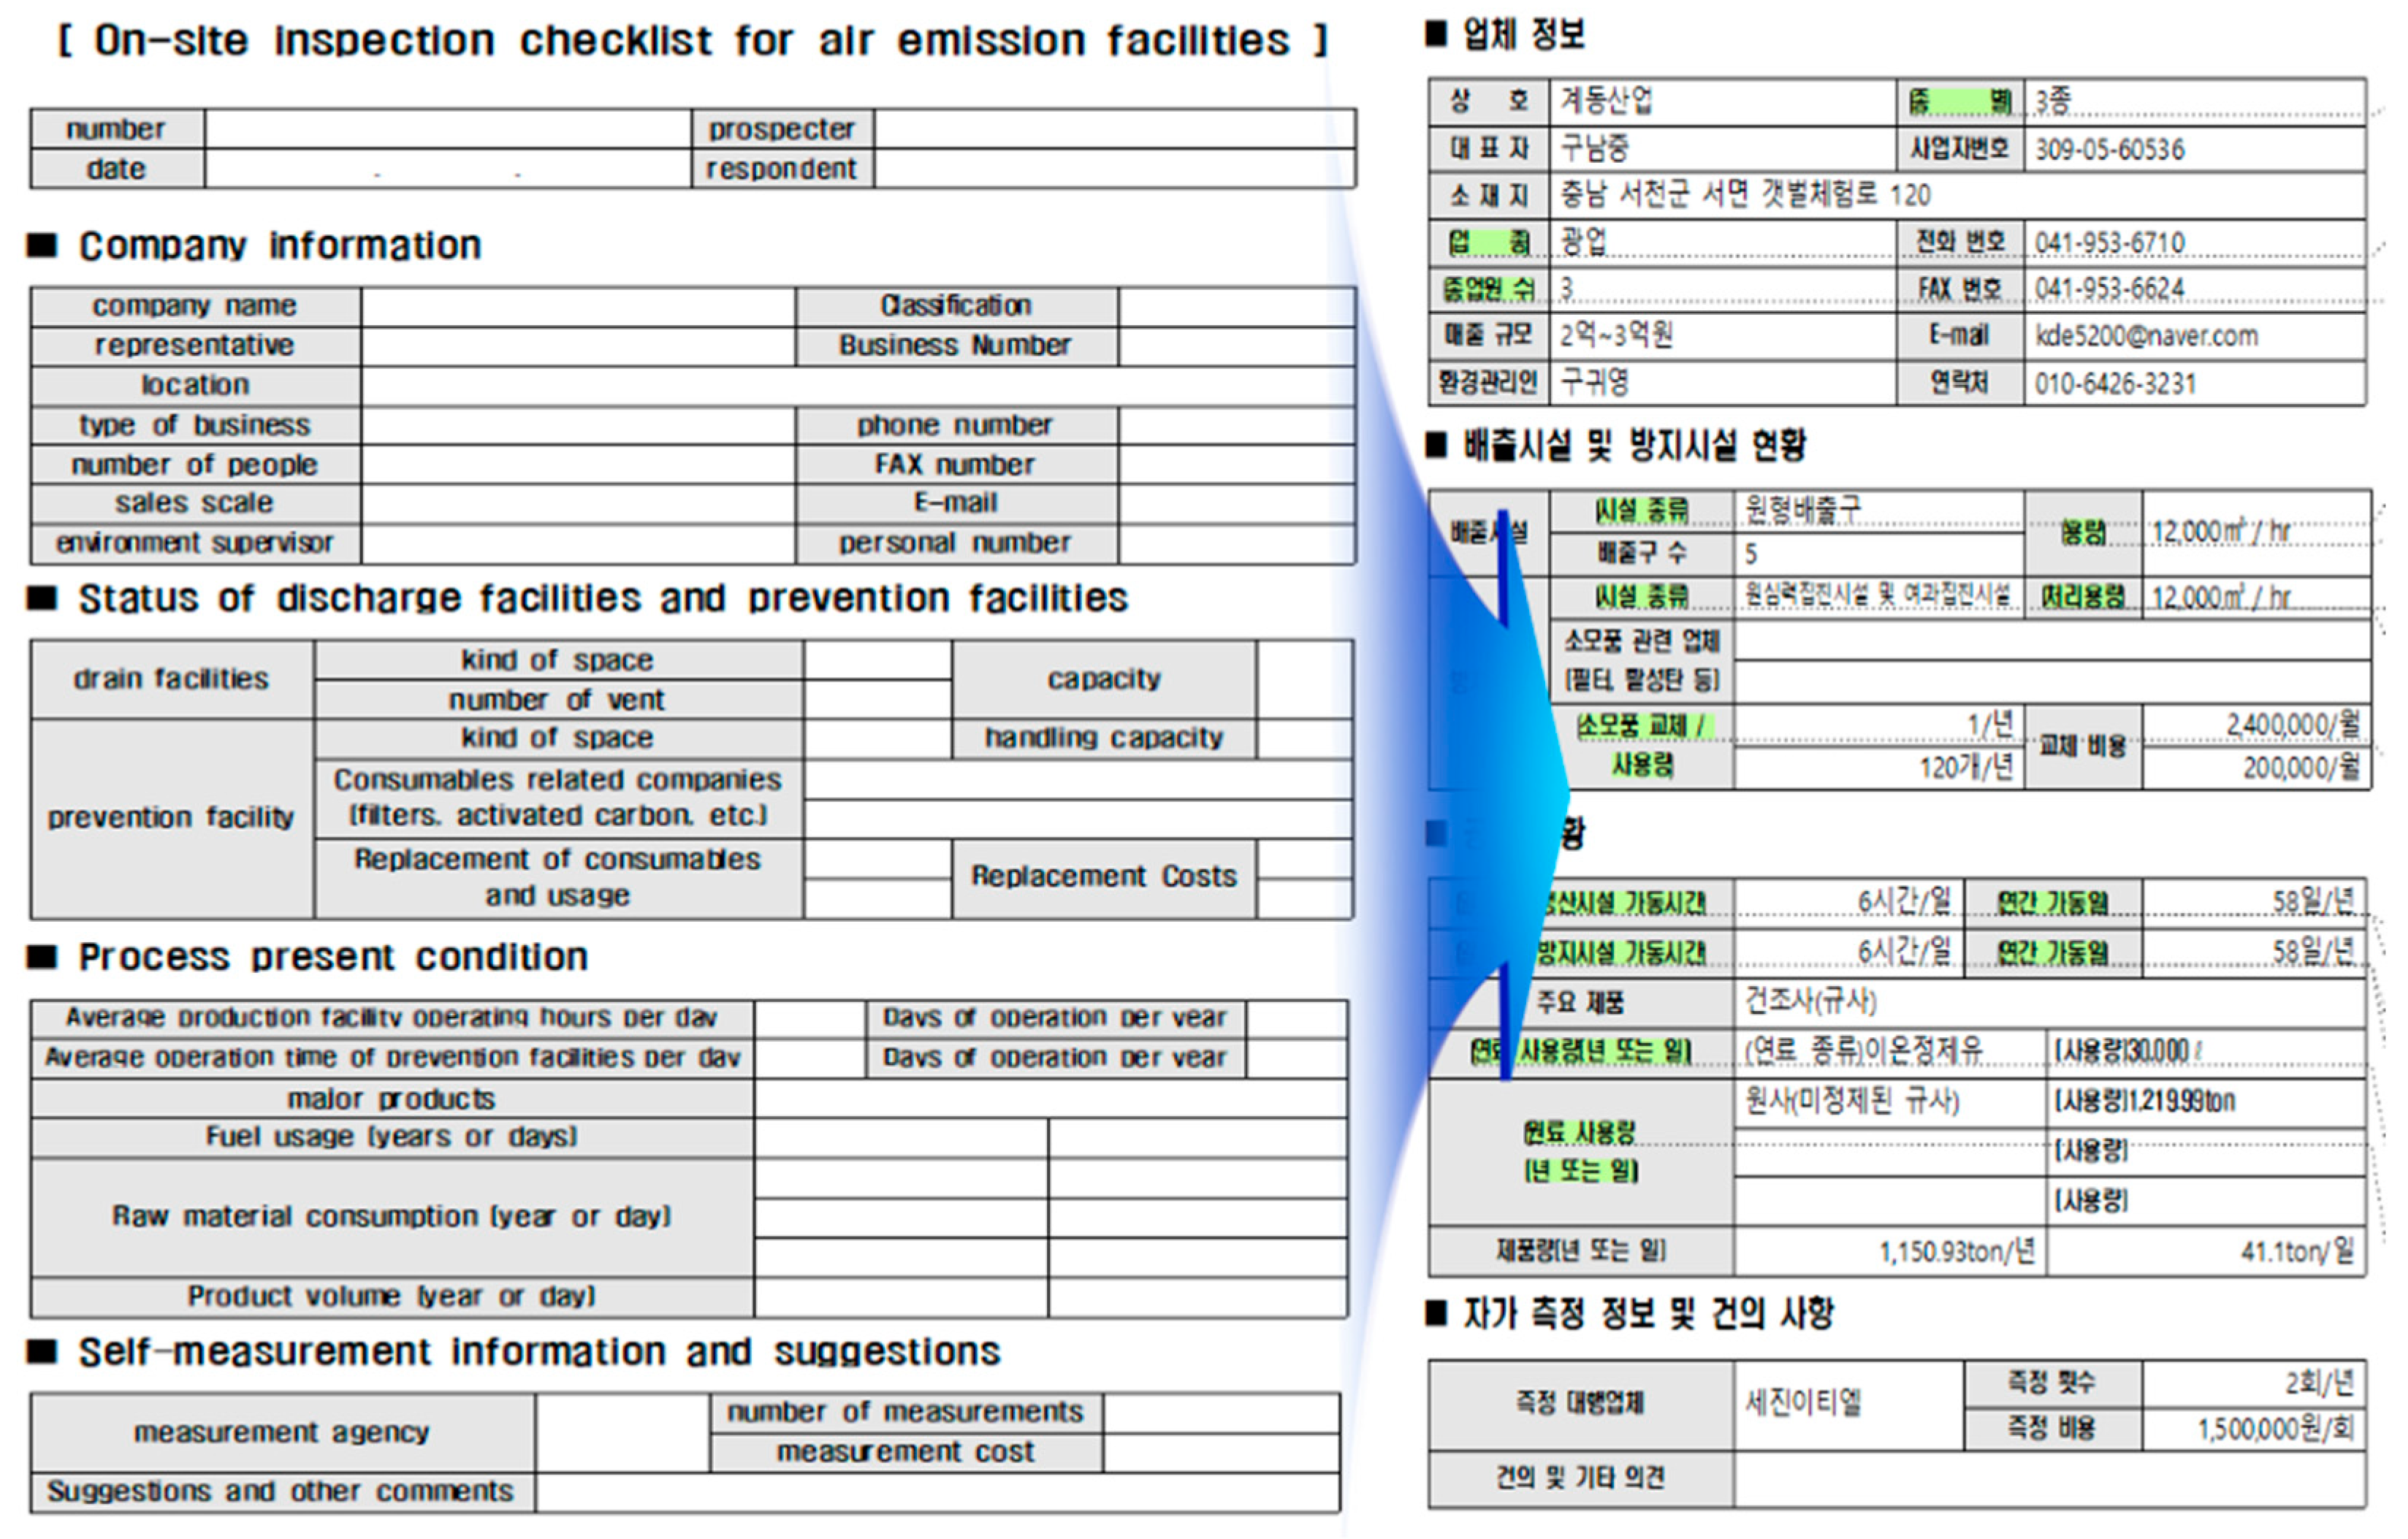
Figure 3.
Standard industrial classification in Seocheon-gun, Chungcheongnam-do, number of companies by middle classification.
Figure 3.
Standard industrial classification in Seocheon-gun, Chungcheongnam-do, number of companies by middle classification.
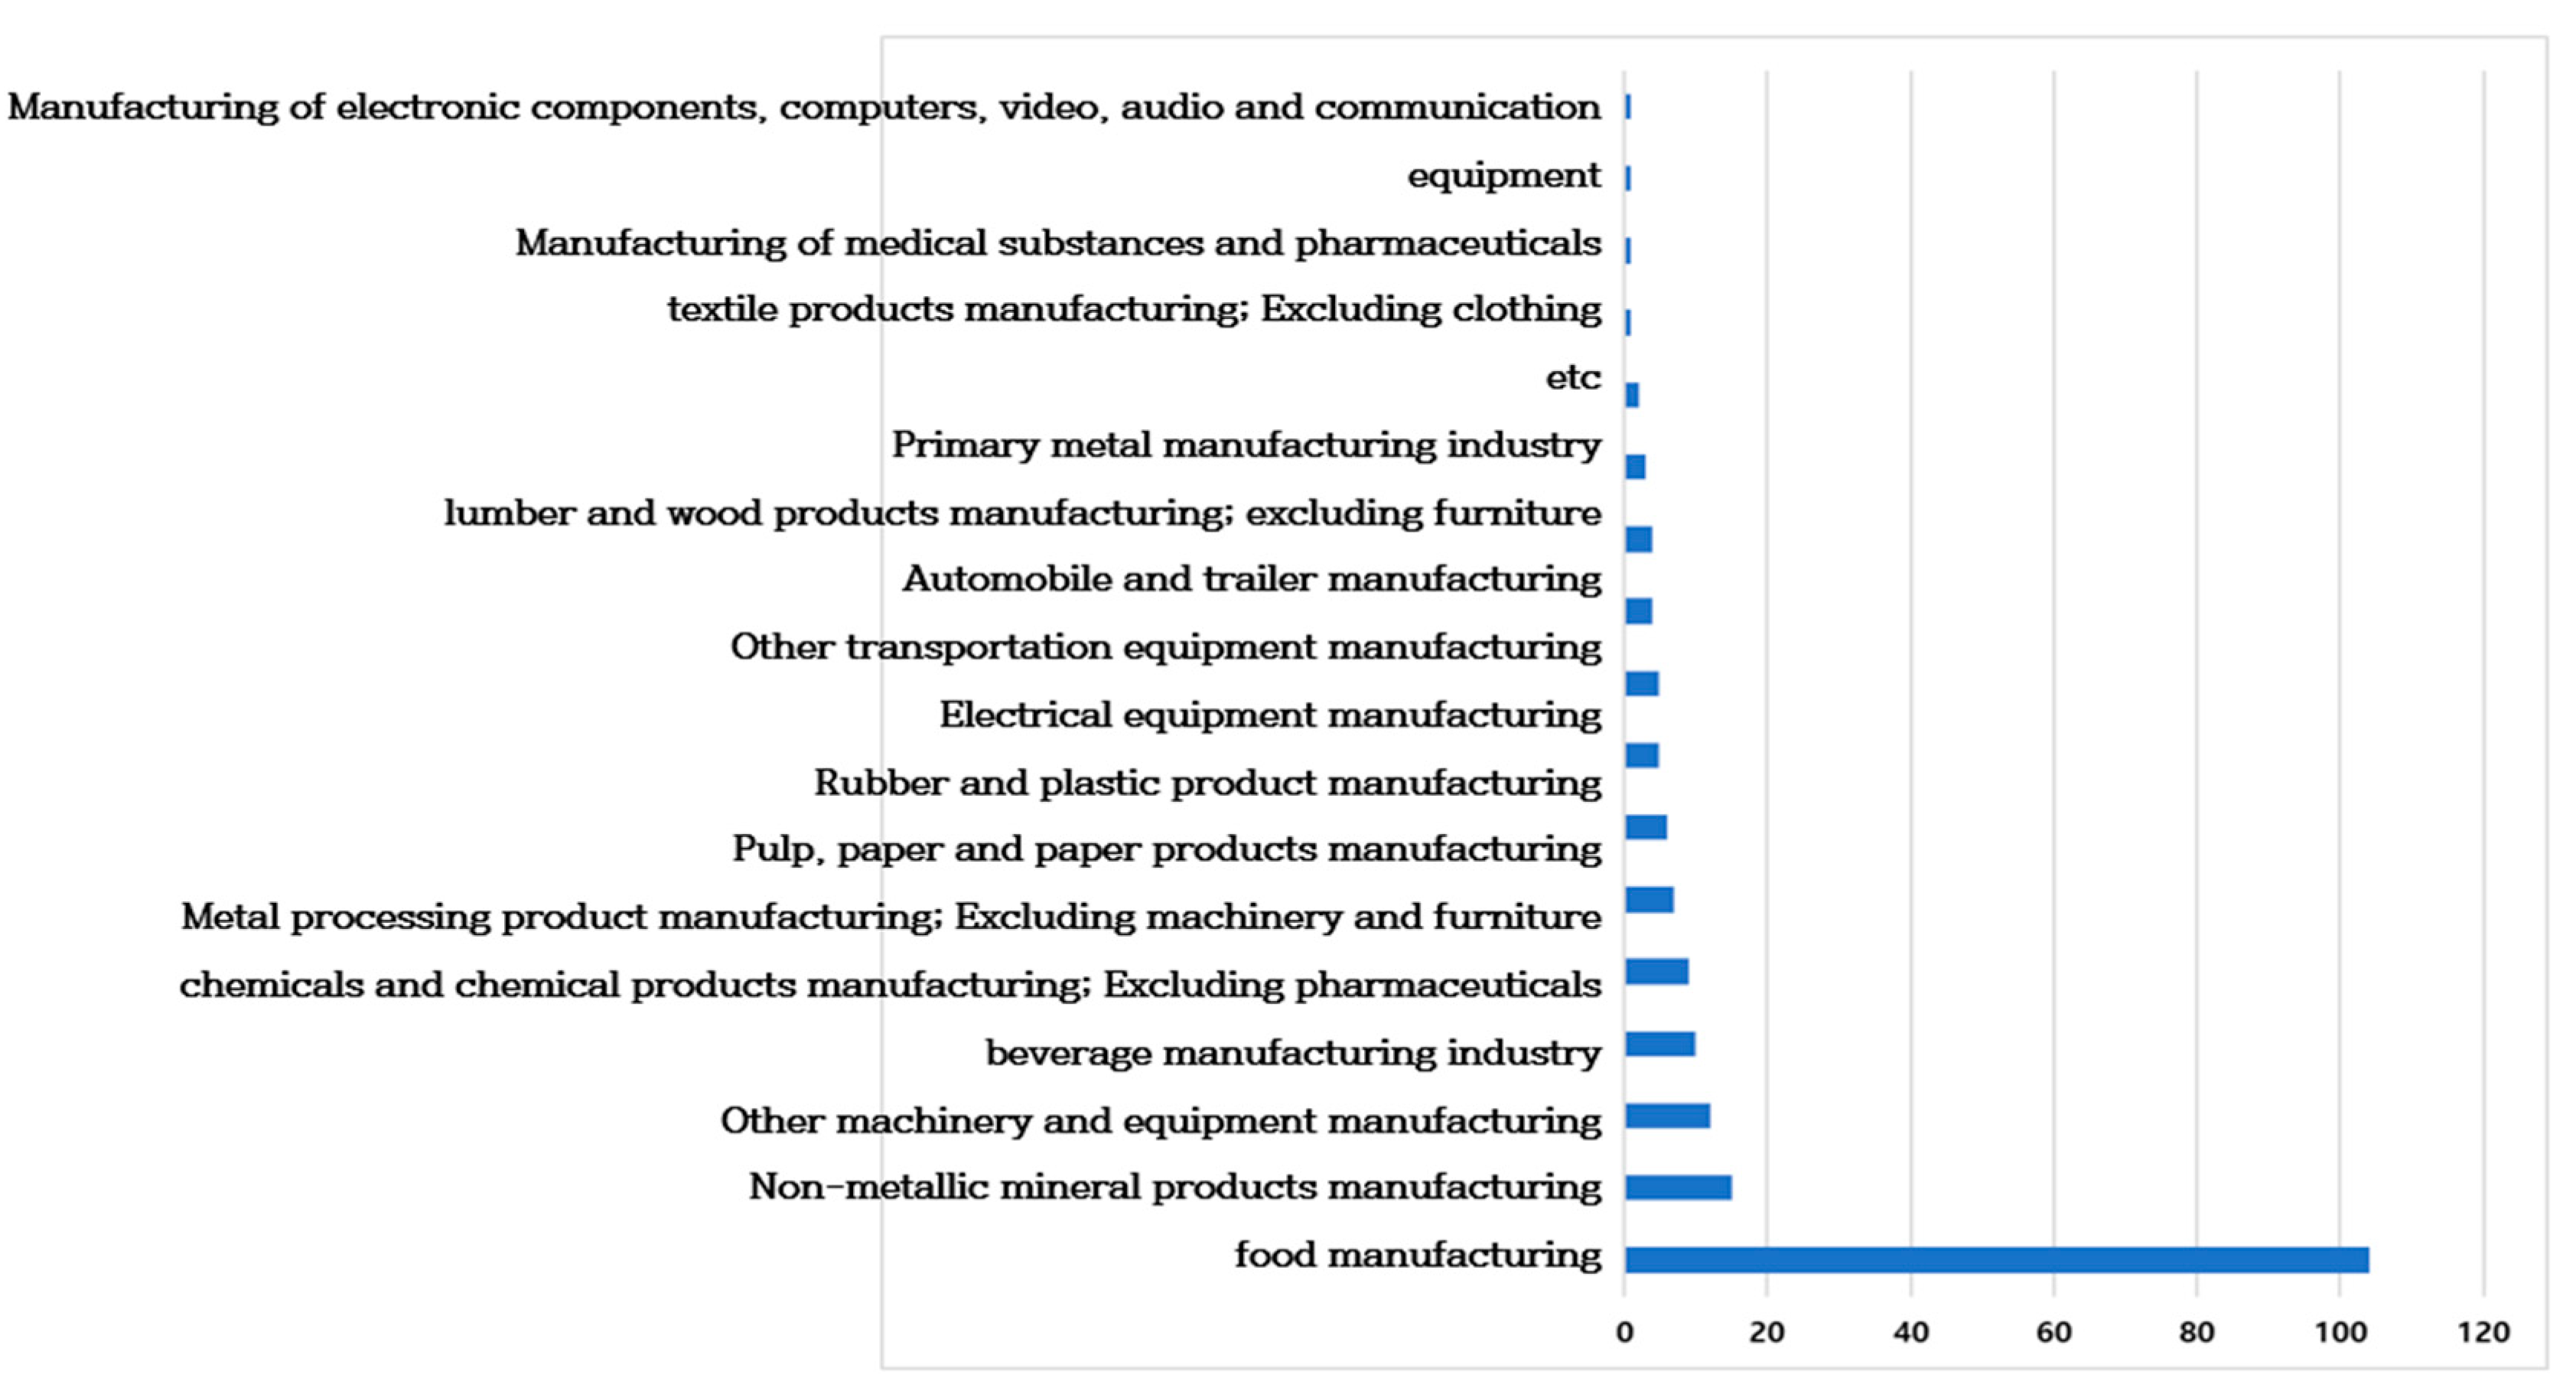
Figure 5.
Emission ratios by three types of manufacturing industries according to the Korea Standard Industry Code (KSIC).
Figure 5.
Emission ratios by three types of manufacturing industries according to the Korea Standard Industry Code (KSIC).
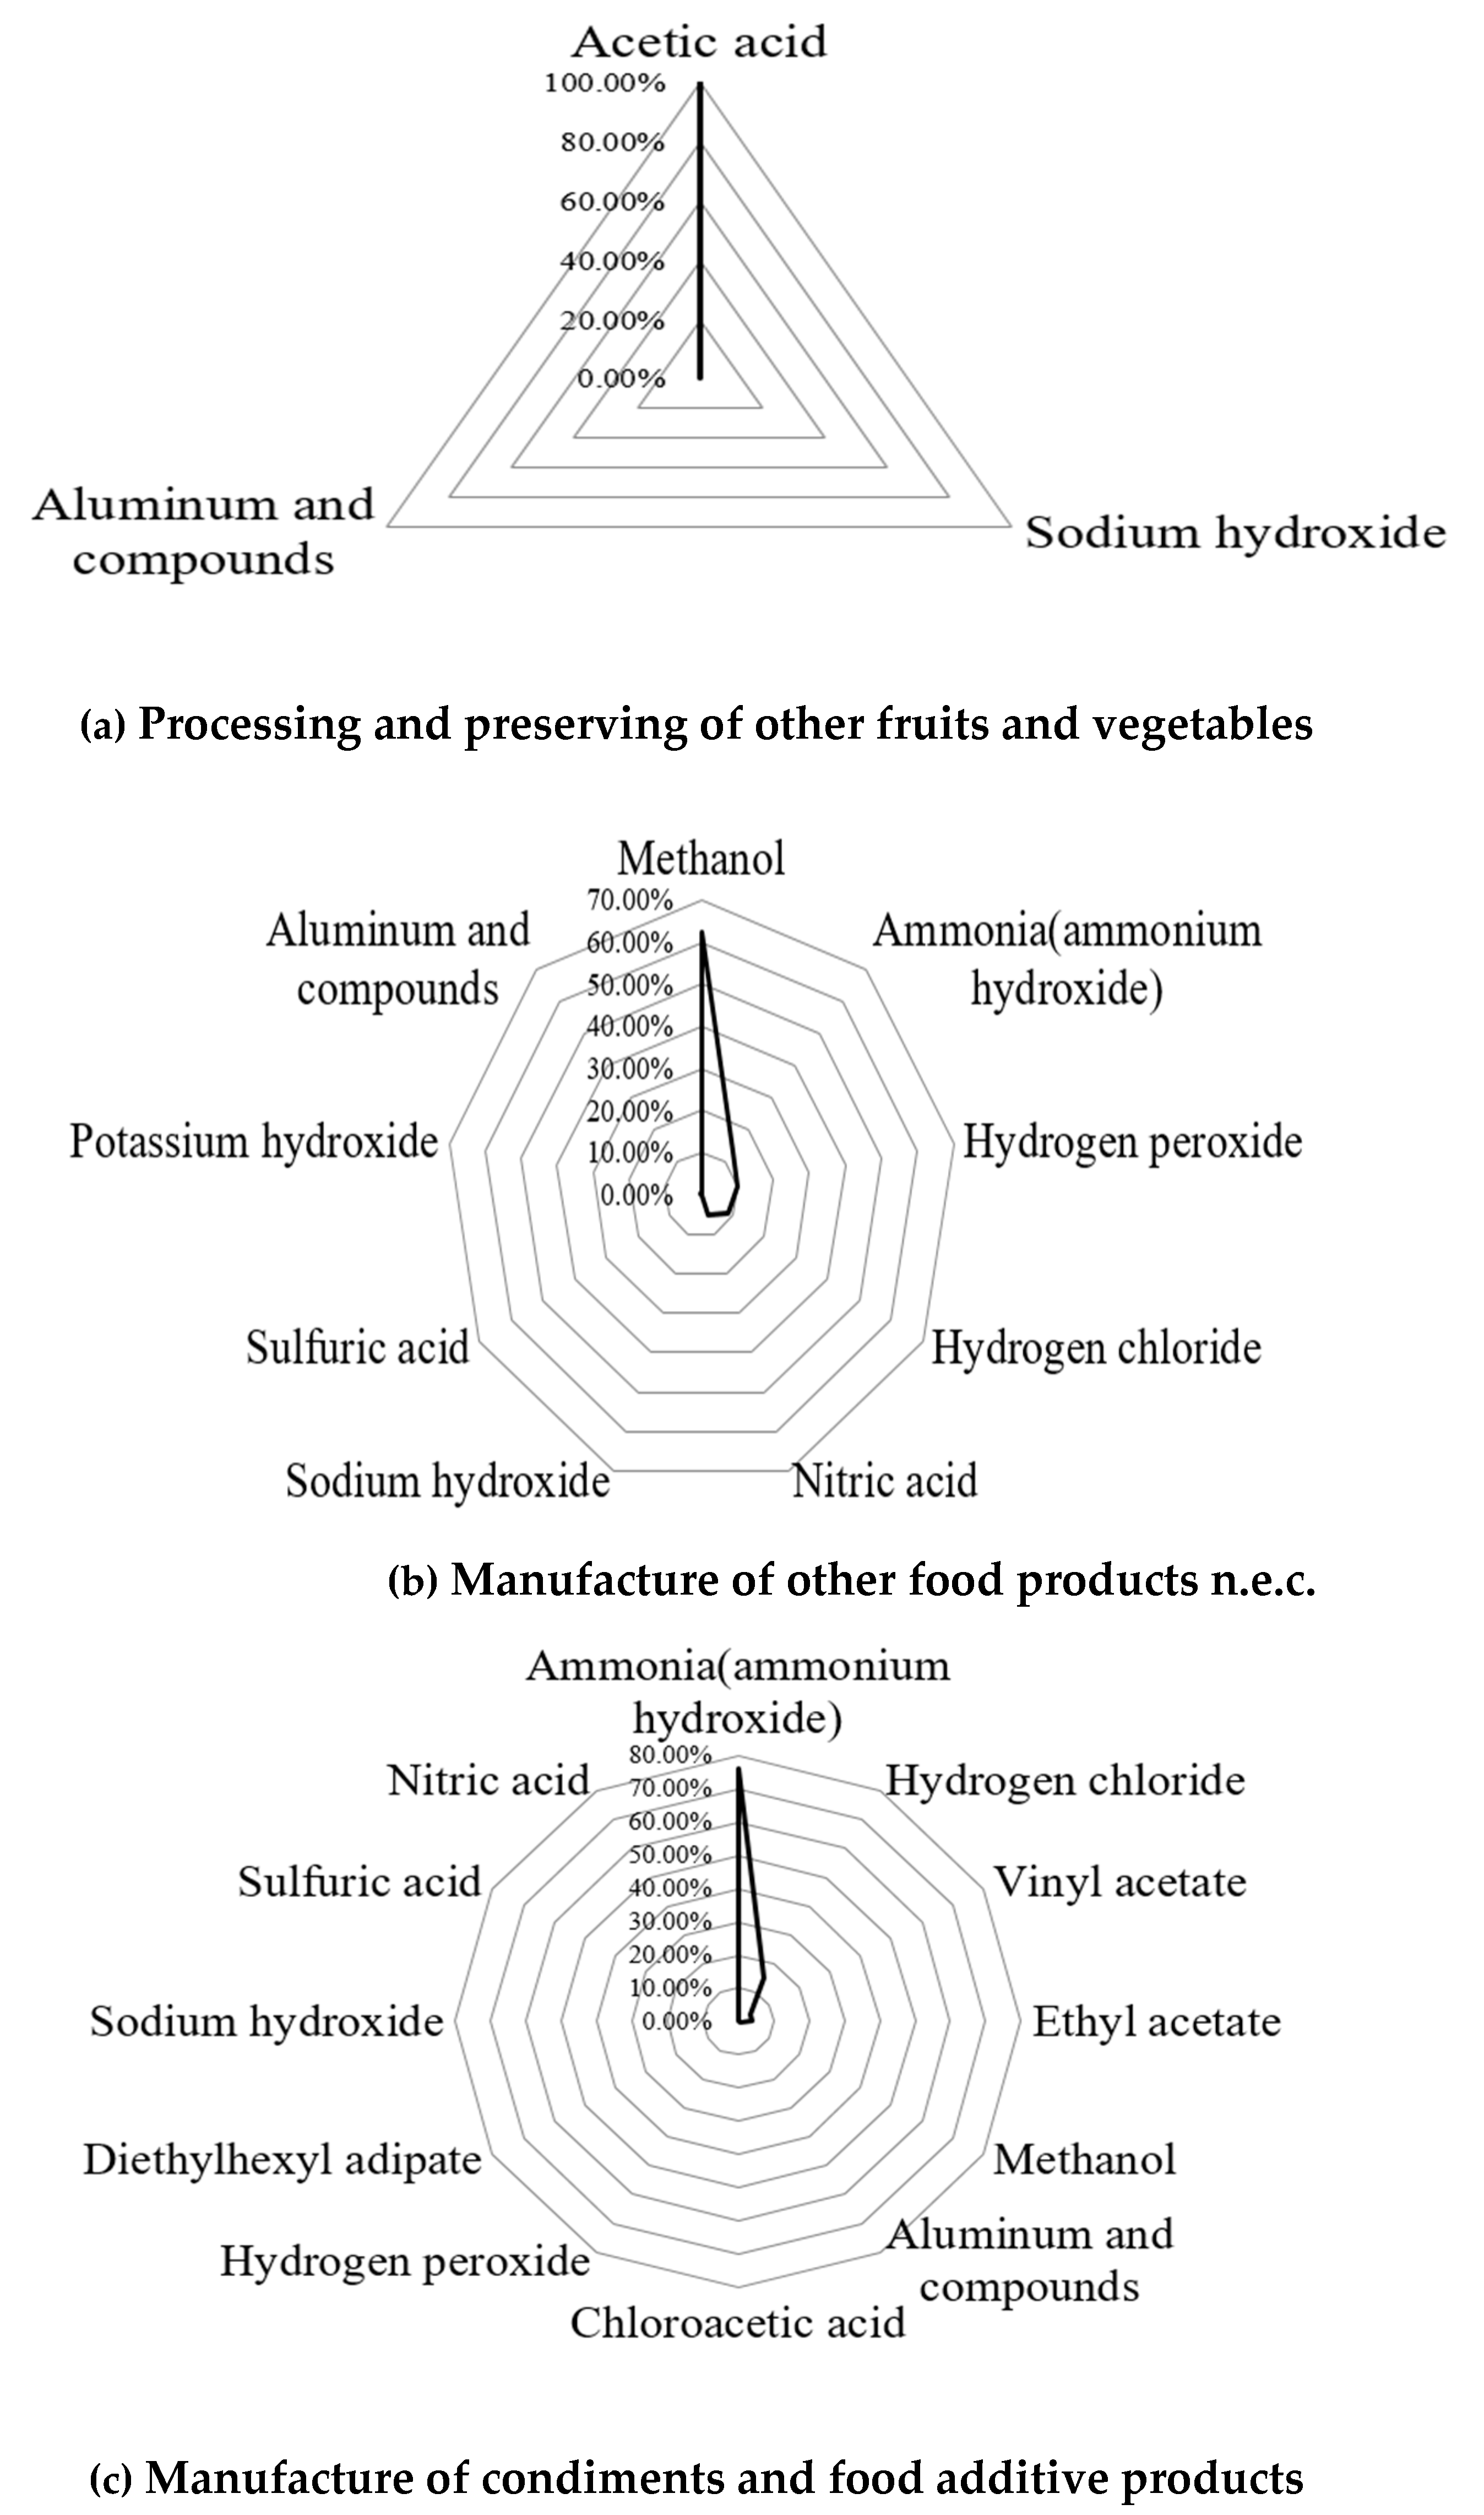
Figure 6.
SPECIATE Version 5.1 Database Development Documentation, U.S EPA, 2020.
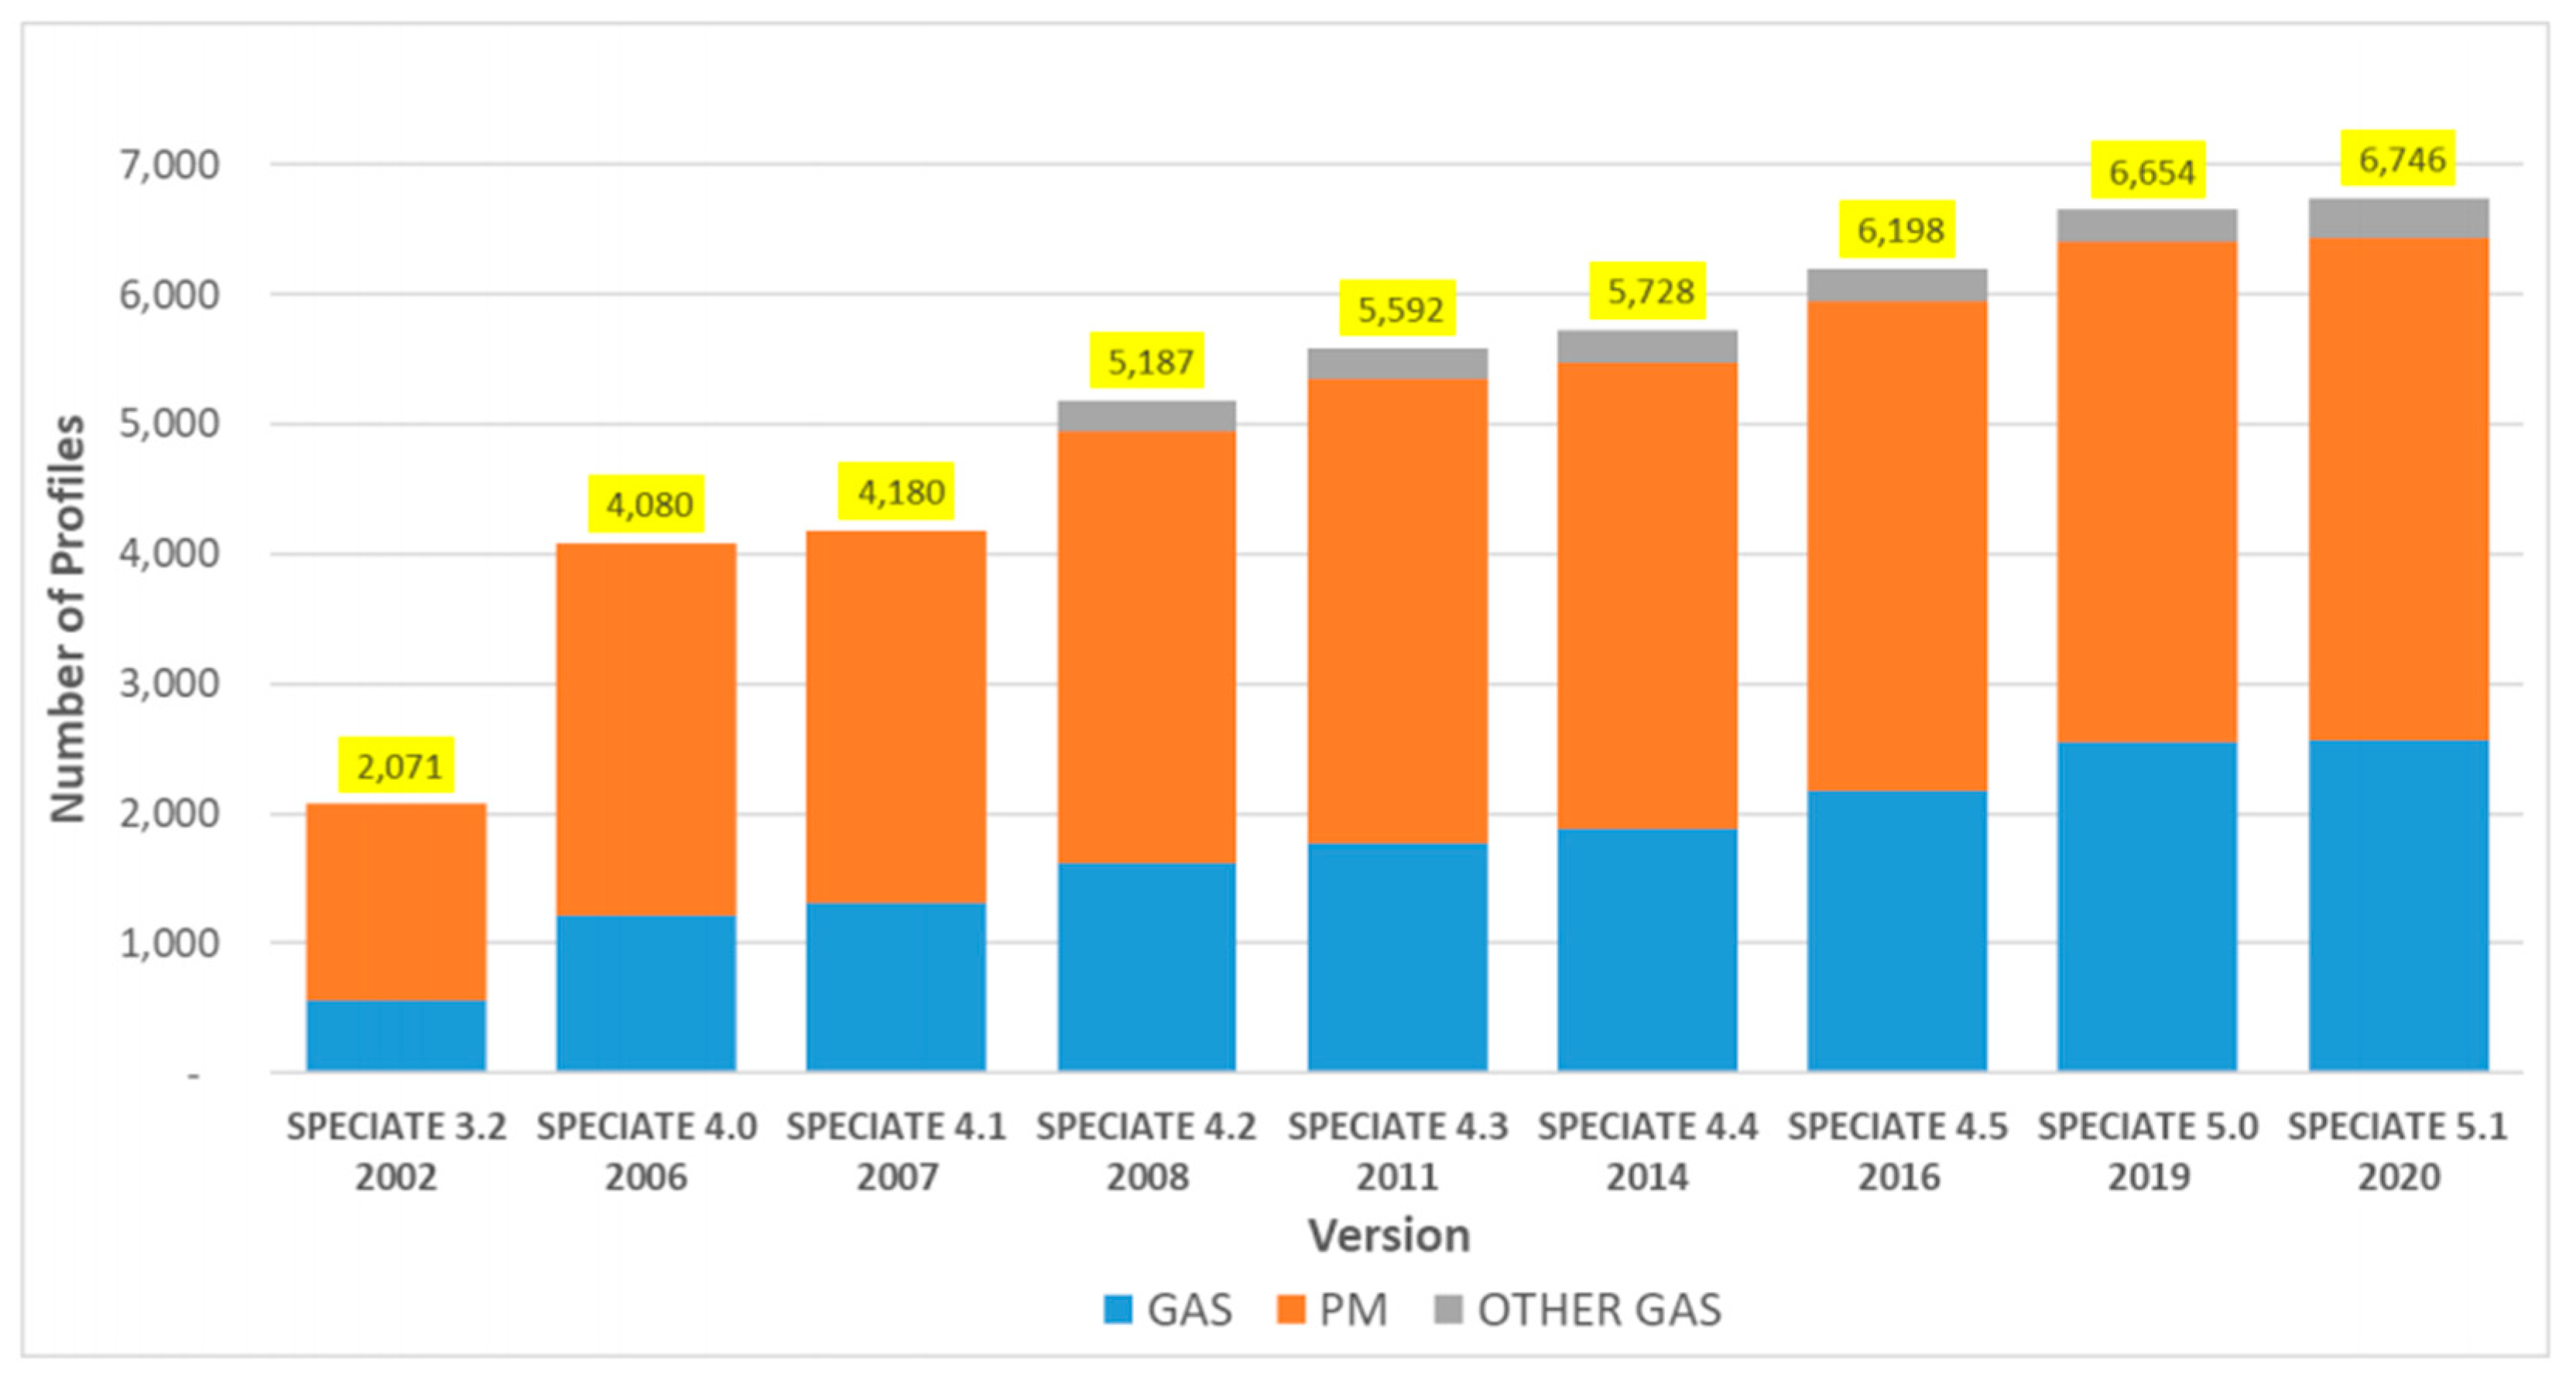
Figure 7.
Atmospheric measurement results focusing on fenceline monitoring and receptor monitoring.
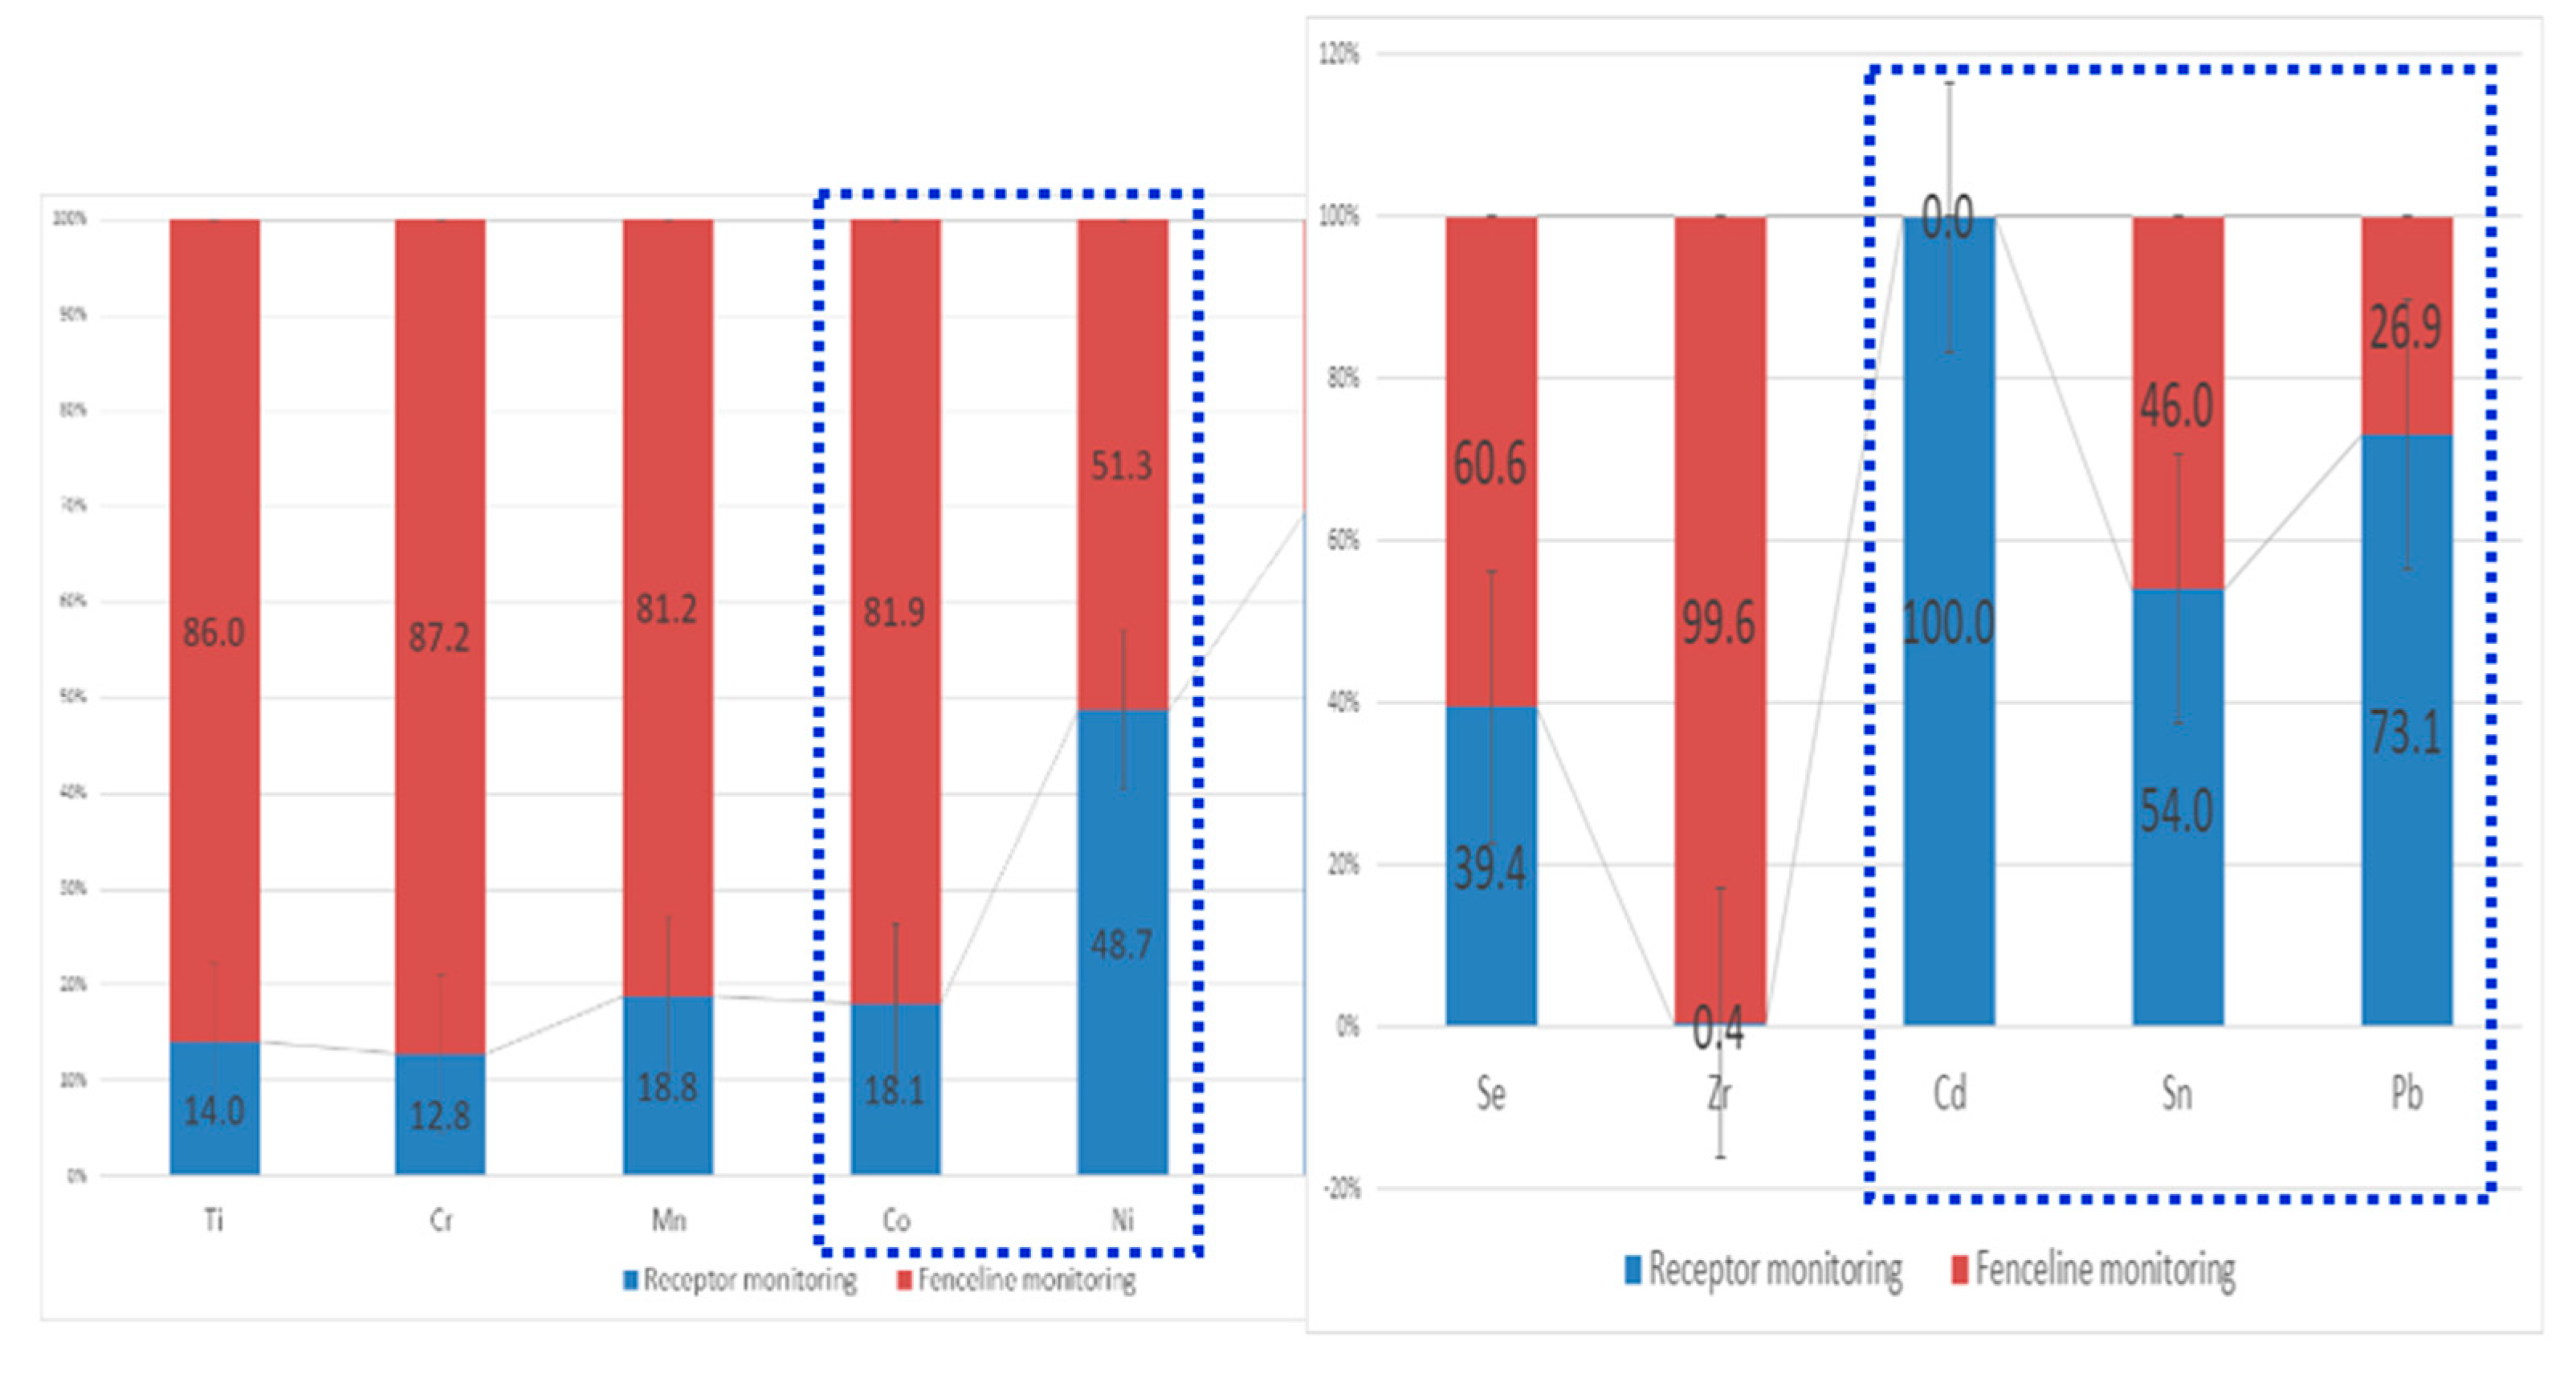
Figure 8.
Characteristic results of concentration of heavy metals for each substance.
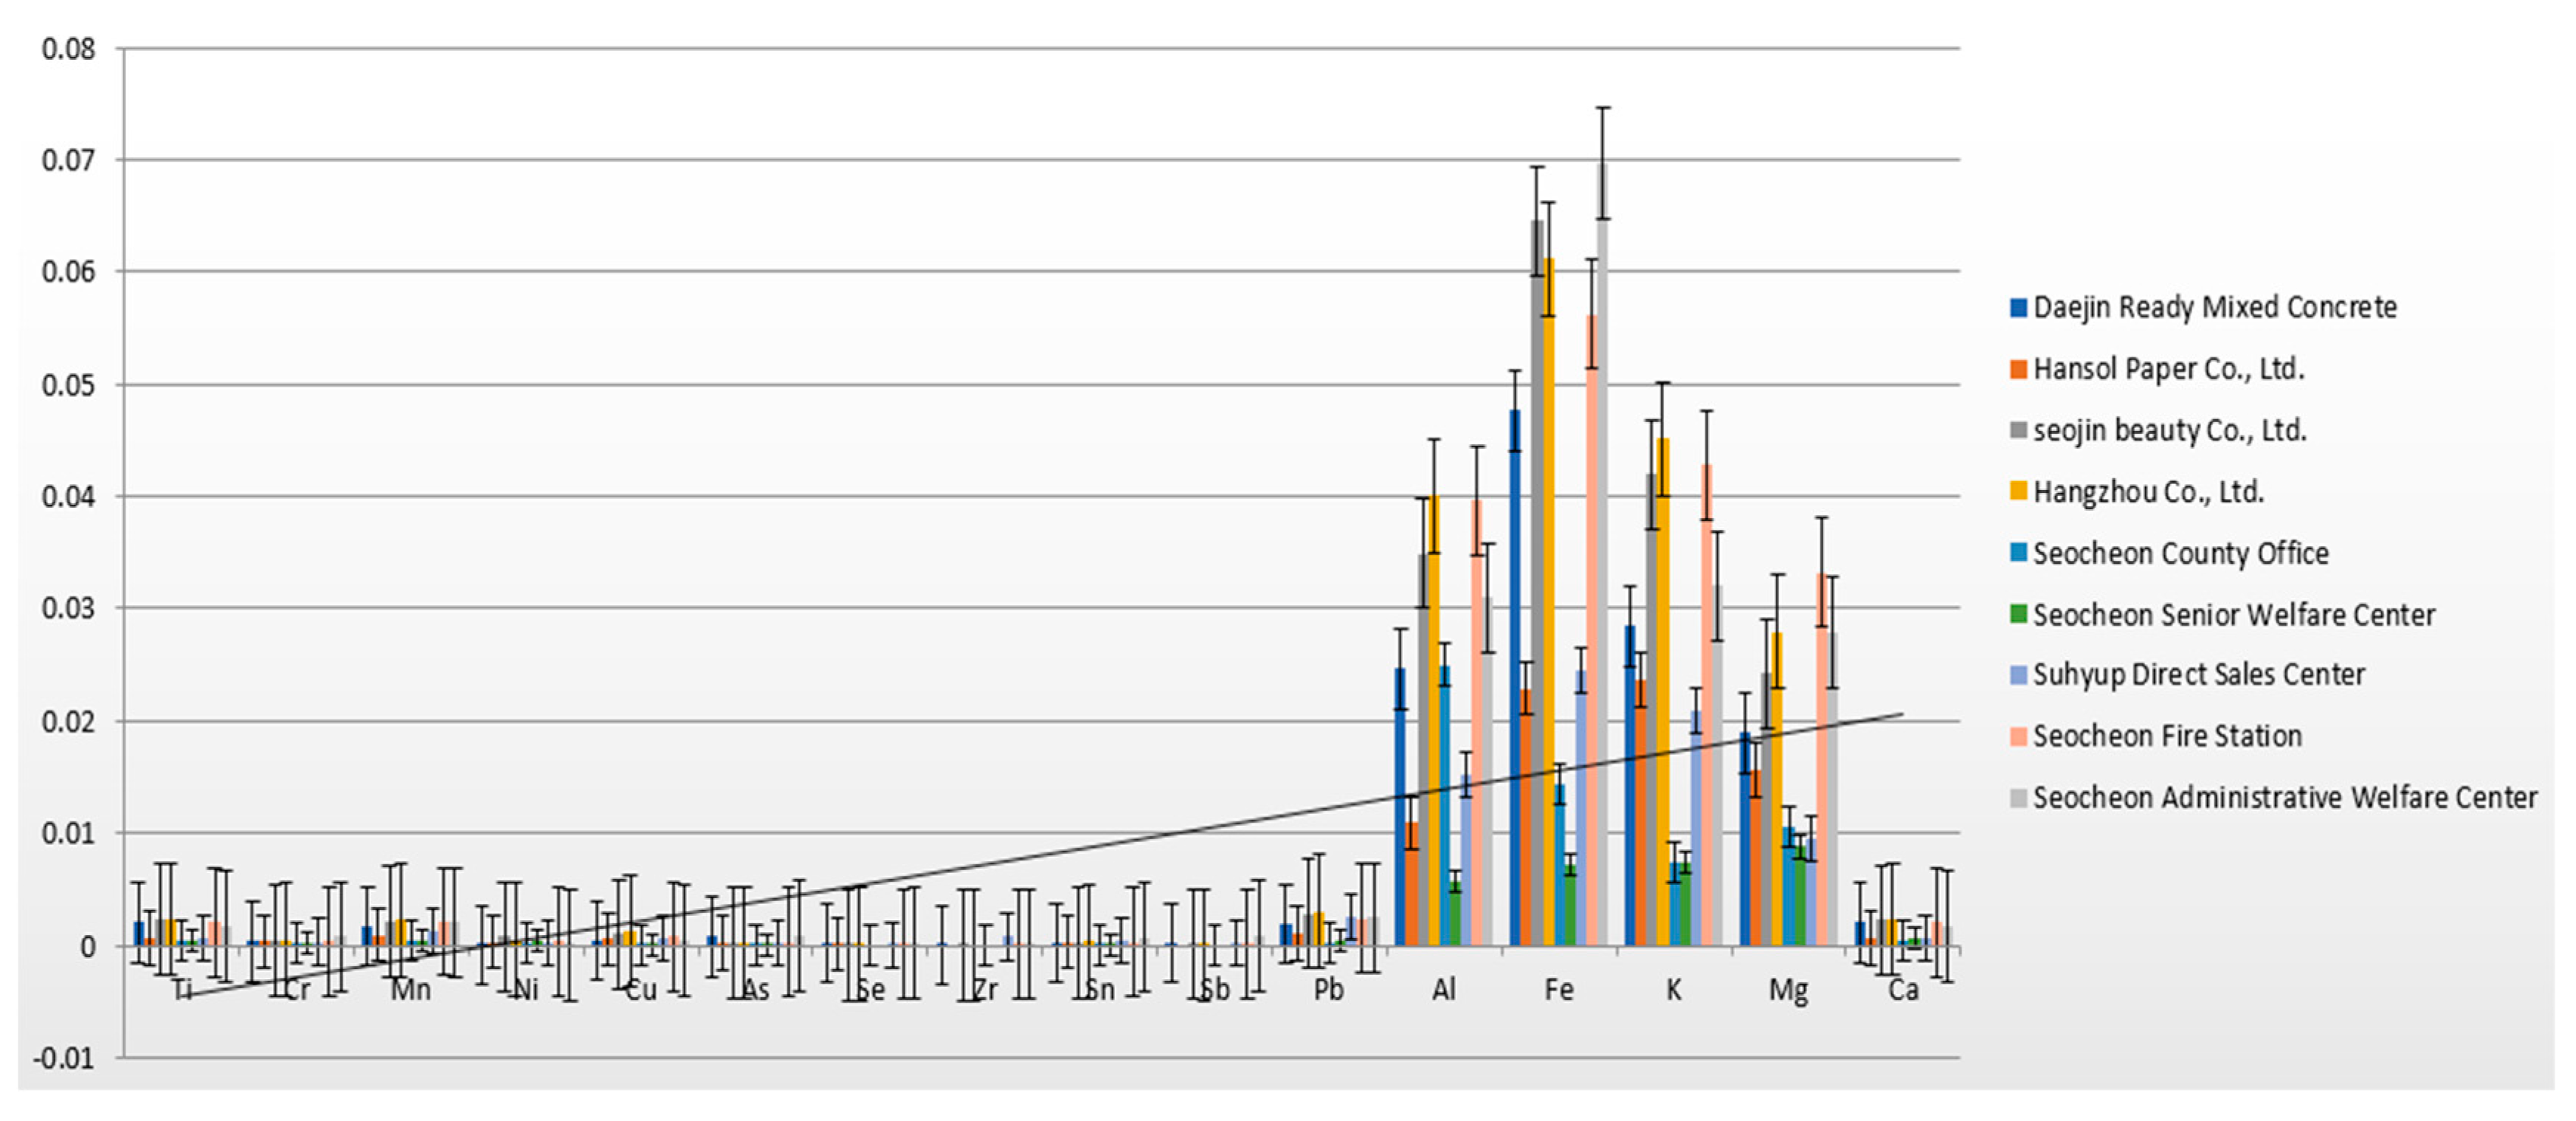

Table 1.
Emission ratios by three types of manufacturing industries according to the Korea Standard Industry Code (KSIC).
Table 1.
Emission ratios by three types of manufacturing industries according to the Korea Standard Industry Code (KSIC).
| Korean standard Industrial Classification | Chemical | Emission rate by chemical substance |
| Processing and preserving of other fruits and vegetables | Acetic acid | 100.00% |
| Sodium hydroxide | 0.00% | |
| Aluminum and compounds | 0.00% | |
| Manufacture of other food products n.e.c. | Methanol | 62.52% |
| Ammonia(ammonium hydroxide) | 13.40% | |
| Hydrogen peroxide | 9.93% | |
| Hydrogen chloride | 8.75% | |
| Nitric acid | 5.35% | |
| Sodium hydroxide | 0.04% | |
| Sulfuric acid | 0.03% | |
| Potassium hydroxide | 0.00% | |
| Aluminum and compounds | 0.00% | |
| Manufacture of condiments and food additive products | Ammonia(ammonium hydroxide) | 75.97% |
| Hydrogen chloride | 15.02% | |
| Vinyl acetate | 4.06% | |
| Ethyl acetate | 4.06% | |
| Methanol | 0.84% | |
| Chloroacetic acid | 0.03% | |
| Hydrogen peroxide | 0.01% | |
| Aluminum and compounds | 0.00% | |
| Diethylhexyl adipate | 0.00% | |
| Sodium hydroxide | 0.00% | |
| Sulfuric acid | 0.00% | |
| Nitric acid | 0.00% |
Disclaimer/Publisher’s Note: The statements, opinions and data contained in all publications are solely those of the individual author(s) and contributor(s) and not of MDPI and/or the editor(s). MDPI and/or the editor(s) disclaim responsibility for any injury to people or property resulting from any ideas, methods, instructions or products referred to in the content. |
© 2025 by the authors. Licensee MDPI, Basel, Switzerland. This article is an open access article distributed under the terms and conditions of the Creative Commons Attribution (CC BY) license (http://creativecommons.org/licenses/by/4.0/).
Copyright: This open access article is published under a Creative Commons CC BY 4.0 license, which permit the free download, distribution, and reuse, provided that the author and preprint are cited in any reuse.


