1. Introduction
To preserve national competitiveness, Korea has built industrial complexes in Yeocheon, Gwangyang, and Ulsan since the 1970s, operating under the tenets of economic development and guaranteeing industrialization grounds [
1,
2,
3,
4]. Although the development of these industrial complexes has been essential for the country’s economic expansion, the neighborhood is experiencing air and soil pollution, unpleasant odors, and heavy metal emissions because of them [
5,
6,
7]. The potential harm that environmental pollution can cause to local population is worrisome. In our country, the problem of environmental pollution is becoming a conflict [
8,
9,
10,
11].
The results of a detailed examination of the sources of pollutants within the primary categories of emission sources, manufacturing combustion, manufacturing processes, energy transportation and storage, waste treatment, agriculture, and other pollutants, confirmed the classification technique for the emission sources [
12,
13,
14]. Production of asphalt concrete; mining; food and beverage manufacturing; textile manufacturing (apart from sewing and clothing); manufacturing of fur and swede clothing and products; manufacturing of leather, bags, shoes, pulp, paper, and paper product; publishing, printing, and recording media reproduction; compound and chemical product manufacturing; manufacturing of rubber and plastic products; manufacturing of non-metallic mineral products; manufacturing of assembled metal products (apart from machinery and furniture); manufacturing of medical, precision, and optical equipment and watches; manufacturing of automobiles and trailers; and manufacturing of household waste are the various categories of emission element classification [
15,
16,
17,
18,
19,
20]. This classification was derived from the results of commercial, residential, and industrial wastewater treatments to validate a preliminary investigation [
21,
22].
Gyeongsangbuk-do’s CO (Carbon Monoxide), VOC (Volatile Organic Compounds), and NH3 (Ammonia) levels have been verified to be higher than those in the metropolitan area and typically higher when compared to the entire region because of the distribution of sources of emission of air pollution facilities [
23,
24]. The examination of emissions according to sector and city yielded the following results:
There are very high numbers of types of volatile organic compounds. Both large and relatively low quantities of these compounds are created in common locations, such as automobiles; petrol stations; laundromats; and photo development businesses; as well as in facilities, such as paint and petrochemical industries. Unlike other common air pollutants, such as dust and sulfur dioxide, volatile organic compounds are continuously discharged into the atmosphere and originate from a variety of sources [
25,
26,
27].
Nonetheless, because volatile organic compounds are found in both discharges of pollutants to the atmosphere and outdoor environments, they contribute to photochemical reactions on the Earth’s surface, exacerbate global warming, destroy the ozone layer in the stratosphere, and pose health risks due to toxicity and carcinogenicity, and interest in them is steadily increasing [
28]. Techniques for partial quantification and qualitative identification of individual compounds have developed rapidly because of the capacity to gather and analyze trace amounts of organic substances prevalent in the environment [
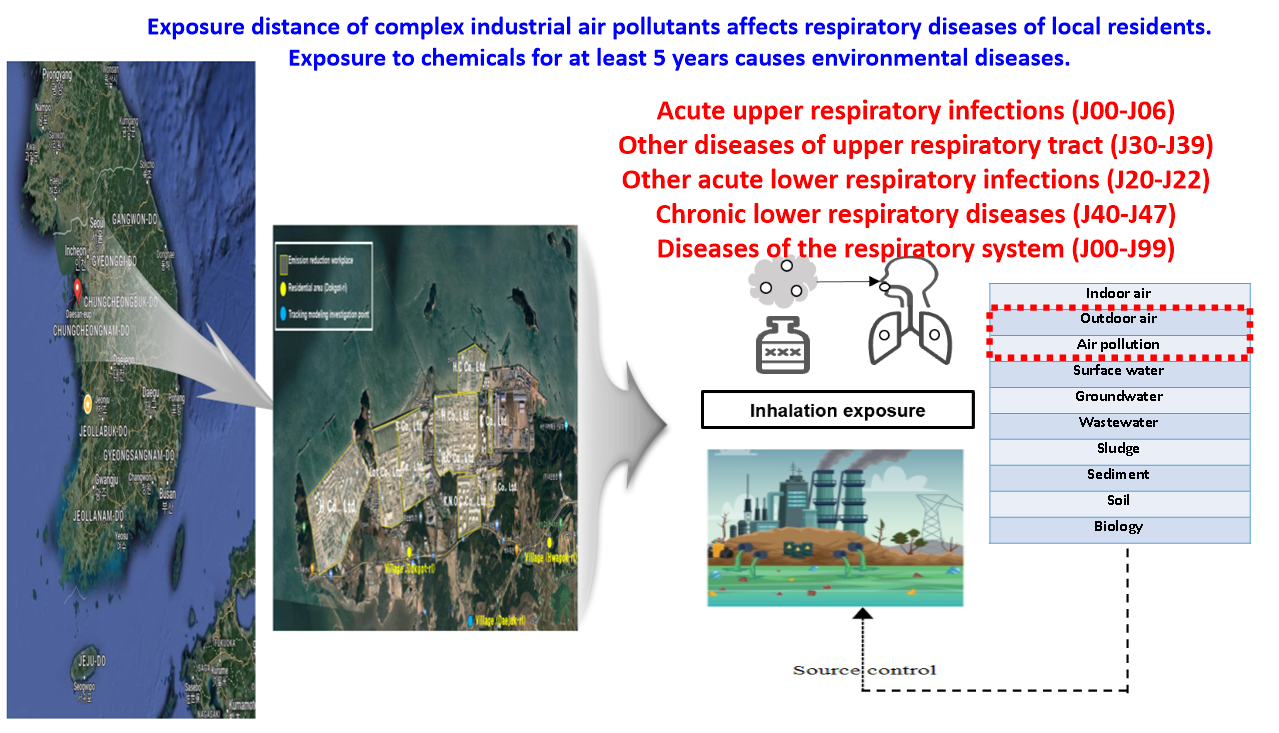
29]. Therefore, the environmental monitoring of these compounds is extremely important. Respiratory allergies are becoming more prevalent in Korea because of changes in air allergens and rising air pollution [
30,
31]. This has significant ramifications for future management and research, in addition to social and financial costs.
Symptoms related to the respiratory system coughing, throat and nose discomfort, and breathing difficulties are the most common signs of air pollution. The symptoms of patients with chronic lung disease or asthma may worsen [
32,
33]. Epidemiological studies indicate an increase in hospitalizations for heart and respiratory conditions as well as a higher risk of death in patients with lung and heart conditions [
34,
35]. According to research, air pollutants are the reason for increase in lung cancer cases; however, since carcinogens, such as benzene and PAHs (Polycyclic Aromatic Hydrocarbons) are present in the air, it is difficult to completely rule out the idea that air pollutants are connected to the development of cancer [
36,
37].
According to the World Health Organization, environmental factors are responsible for 25–33% of the diseases in industrialized countries [
38,
39]. Children and vulnerable populations are disproportionately affected. Furthermore, a greater understanding of the importance of environmental preservation over economic growth has resulted in prioritizing the environment over economic progress [
40]. The need for a receptor-cendischarges of pollutants to the atmospheretered indoor environment policy to improve public health has arisen from the shortcomings of current media-centered environmental management, which is unable to meet public health expectations and adapt to the emergence of new environment-related diseases [
41,
42]. Since most modern individuals spend over 90% of theirdischarges of pollutants to the atmosphere time indoors, the signifidischarges of pollutants to the atmospherecance of home and indoor air quality is paramount [
43]. As such, it is crucial to control dangerous air pollutants in areas that are susceptible [
44]. Pollutants in the air can affect exposure and health. The harmful effects of air pollution on human health must be transformed into a broad category of environmental pollutants [
45,
46].
2. Method
2.1. Study Area
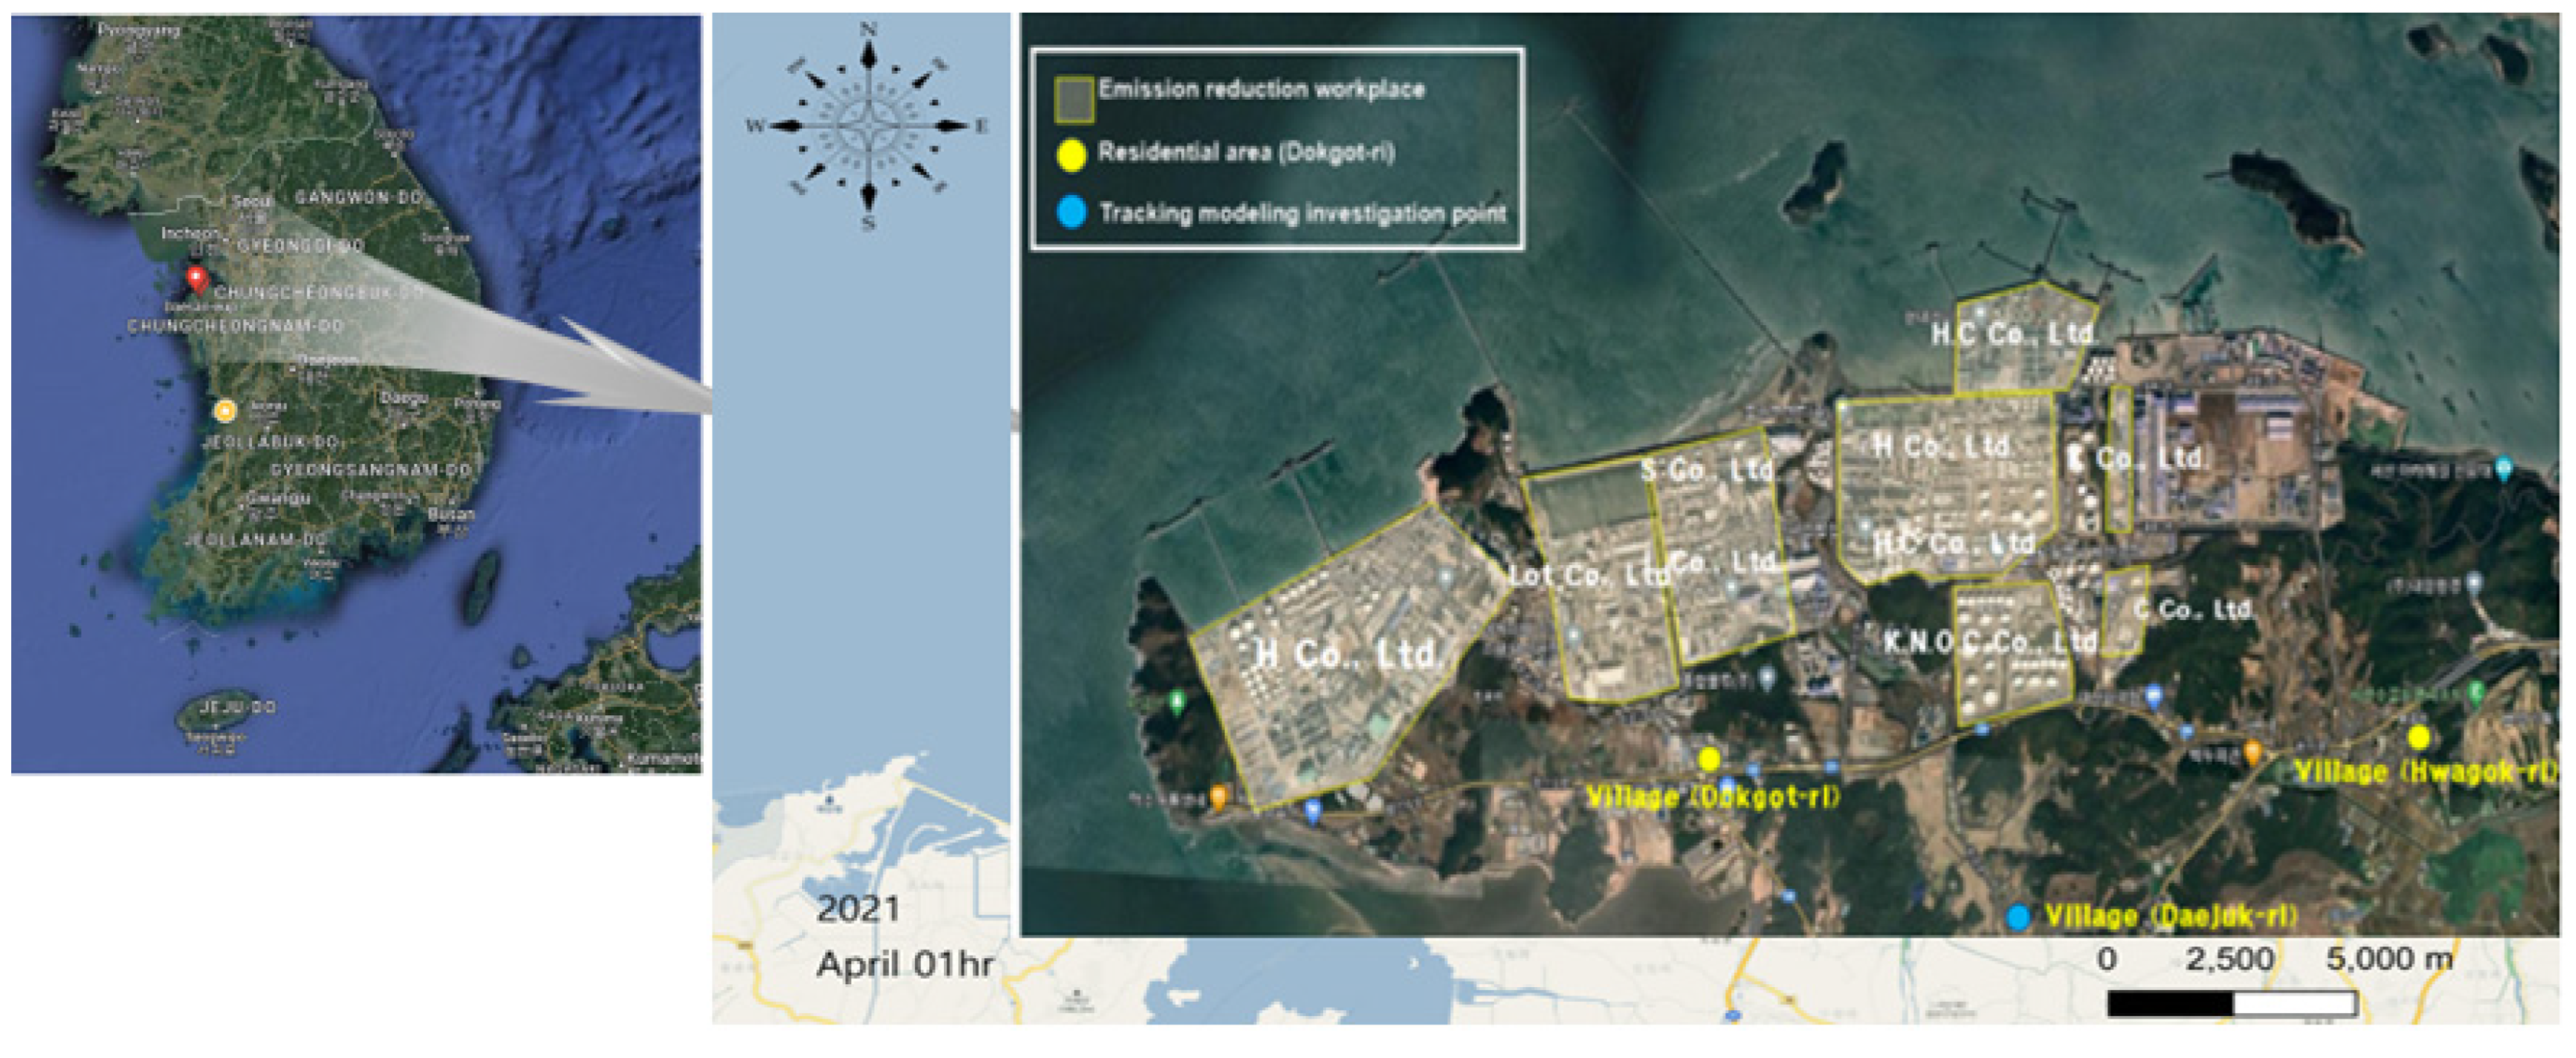
According to the geographical characteristics of this project, the characteristics are as follows, such as conducting measurement and analysis with the cooperation of 10 business sites as shown in
Figure 1. In Daejuk-ri, Daesan-eup, Seosan-si, and Chungcheongnam-do, industrial complexes are set to develop over an area of 9,120,000 ㎡. Hyundai Oilbank, LG Chemical, Lotte Chemical, Hanwha Total, KCC, Korea National Oil Corporation, and over 60 small and medium-sized businesses are located in Daesan, one of the country’s three main petrochemical complexes. Development management is required because more industrial complexes will be added in the future, endangering the health of the community and for preventing accidents. Previous health examinations in the Daesan Industrial Complex region revealed a high incidence of cancer and asthma. Among them, respiratory symptoms, such as cough, dyspnea, wheezing, and asthma were significantly prevalent. Ongoing follow-up observations are required to establish a causal link according to the features of environmental stigma in this area.
2.2. Air Pollution Monitoring
Using ten sizable workplaces as measuring points, the state of handling, storage, and shipping facilities were examined. Ten workplaces carried out the survey with the cooperation of the Ministry of Environment. In order to ensure the business operations of the companies, the survey was conducted only during certain dates and times designated for facilities handling benzene among the emission sources. The status of the emission sources, including marine and land facilities, was determined. These sources include manufacturing, transportation, and shipping operations, which release volatile organic compounds during the process in oil refining. The survey was conducted in the vicinity of the place of employment, with particular attention to roadside and workplace fences. In addition, measurements and analyses were conducted in the village halls of Dokgot-ri, Hwagok-ri, and Daejuk-ri in residential areas. To identify hazardous volatile organic chemicals in ambient air, samples were collected in accordance with the Air Pollution Process Testing Standard (ES 01804.2a) and subjected to solid adsorption [
47].
2.3. Sample Analysis Method
2.3.1. Sample Collection
According to the Air Pollution Process Testing Standard (ES 01804.2a), the solid adsorption method was used for testing hazardous volatile organic compounds (VOCs) in the ambient air by collecting samples. The sampling procedure was to check the suction pump flow rate, install the anemometer and suction pump, connect the adsorption tube, and collect samples at 0.1 to 0.5 liters per minute within 10 minutes. The wind direction, wind speed, and temperature were recorded, and the samples were stored in a refrigerated state and then transported to an analytical institution for analysis. The adsorption tube was installed on the personal pump, and samples were collected from a height of 1.2 m, and the wind direction and wind speed were measured while the samples were collected. This was conducted by taking into account the actual conditions of the affected residents and the geographical characteristics of the area and environment with a high prevalence of chronic diseases.
2.3.2. Sample Analysis
Eighteen volatile organic compounds were purchased from Sigma-Aldrich (St. Louis, MO, USA), Kemidas (Gunpo, Gyeonggi, KOR), Burdick & Jackson (Muskegon, MI, USA), J. T. Baker (Center Valley, PA, USA), and Junsei Chemical (Chuo-ku, Tokyo, Japan) and were used as standard materials. A standard stock solution (10,000 mg/L in dimethylformamide) corresponding to 250 mg of each analyte in a 25 mL volumetric flask was prepared; dimethylformamide was filled upto the mark, the stopper was closed, and the flask was shaken for mixing. The sample pretreatment method involves transfer of all the adsorbent in the adsorption tube to a 2 mL vial, followed by quick addition of 0.5 mL of carbon disulfide and 25 μL of mixed internal standard solution (1.0 mg/L in dimethylformamide); thereafter the he stopper is closed, sealed, and left at room temperature (Captured under the same conditions in the morning when activity is possible) for 30 min before injecting into the GC (Gas Chromatograph) inlet and analyzing using a gas chromatograph mass spectrometer (mass spectrometer) and a gas chromatograph tandem mass spectrometer. The GC-MS conditions corresponded to the experimental conditions for 15 VOCs, except vinyl chloride and 1,3-butadiene. For the simultaneous analysis of volatile organic compounds, a GC (7890A Series GC, Agilent Technologies, Palo Alto, CA, USA) was used. An MS of 5975C was used for the measurements. The conditions for the GC-MS instrumental analysis are listed in
Table 1 [
48].
2.4. Establishment of Standardization Technique for Monitoring Emission Concentration
Daesan-eup and Seosan-si are national industrial complexes in Korea surrounded by sea and require environmental pollution management. Based on ten important business sites within the industrial complex, measurement sites were selected, and the characteristics of residential areas and schools in areas 5 km away from the emission sources were confirmed. Benzene is produced from production facilities, storage tanks, and wastewater treatment facilities; hence, it is difficult to predict and measure it, and in order to identify the pollutant, monitoring was conducted 24 h a day for 2 weeks per season. We applied meteorological conditions to monitor benzene levels along the fence line of a workplace, and utilized an atmospheric diffusion model for evaluating the characteristics of pollutants flowing from the workplace into the home, and used hourly wind direction and speed data. Information on the major wind characteristic indicators, such as the overall 3-year and seasonal prevalent wind and average wind speed, is presented in
Figure 2.
Northwesterly winds occur mainly throughout the year in the Daesan area (near the industrial complex). The most frequent wind direction was northwest (NW), accounting for 17.4% of the total wind direction frequency. The northwesterly wind reflects the influence of the sea breeze and can be interpreted as a wind field characteristic combined with the seasonal wind. In the case of wind speed, 29.2% of the winds appeared in the 0.5–2 m/s range, showing the maximum frequency, and the average wind speed was found to be 3.02 m/s. The frequency of stagnant air (< 1 m/s), which is an important wind indicator related to the dispersion, was 0.5%. In other words, 29.8% of the area near Daesan had weak wind speeds of less than 2 m/s.
2.5. Statistical Analysis
SAS Enterprise Guide (SAS Institute Inc., Cary, NC, USA) is an integrated software suite used for advanced analytics, business intelligence, data management, and predictive analytics using statistical methods. The SAS software can be used through a graphical interface and the SAS programming language or Base SAS. The Health Insurance Corporation analyzed the data using this program (SAS Enterprise Guide). This allows access to data in virtually any format, including Microsoft Excel tables and database files. Based on a cohort investigation of the occurrence of chronic diseases, continuous observation was possible in the survey and control areas, and the period of residence was analyzed based on the accumulated data. Among these, a retrospective cohort study was conducted using respiratory diseases as environmental diseases. The target areas were analyzed by grouping them into exposure and control areas. In order to calculate the applied results, a Cox proportional hazard model was used as a statistical analysis method, and the hazard ratio of living in the survey area compared to that living in the control area was calculated using cohorts of 23 chronic diseases. The analysis was conducted considering the characteristics of the exposure area and control area of the Chi-square test. A statistical method was applied to the data of the corporation, where the observation points were available, and a customized database was used, making it possible to model the risk of chronic disease and cancer. Adjusted models, such as the crude model, age, sex, and income were analyzed, and cases with a low incidence of chronic diseases were excluded from the analysis. Finally, regarding the period of residence of the participants, the analysis considered those who had lived in the area for less than 10 years as dropouts.
2.6. Moving Window PMF (Positive Matrix Factorization)
Window PMF (Positive Matrix Factorization) is a method of moving existing PMF input data by specific cycle units, configuring multiple datasets, and performing PMF modeling for each input dataset [
49,
50,
51,
52]. In this study, measurements and analyses were conducted every 2 weeks from November 18, 2022, to February 2023, and the data were moved once a month. When the PMF model is applied using the input data organized in this manner, multiple contributions of pollutants corresponding to a specific day are derived, which provides the advantage of being able to calculate the standard deviation of the model results. In addition, because modeling is performed by moving every day, it is possible to identify additional pollutants on a specific day. The PMF model is simply expressed as the following determinant.
- X: n×m matrix (n: number of samples, m: number of chemical species analyzed).
- G: n×p matrix (n: number of samples, p: number of pollutants) which represents the emission amount for a specific pollutant source, i.e., the contribution of the pollutant source to the receptor.
- F: p×m matrix (p: number of pollutants, m: number of chemical species analyzed) which contains information on the emission source, and is often called a pollutant source classification table (Source Profile).
- E: Residual matrix which can be expressed as the following equation.
The PMF model is designed so that the G (contribution) value and the F (pollutant source classification table) value have positive values, and the model solution is obtained under the condition of minimizing Q(E) regarding the G and F values.
Here, μij represents the uncertainty of Xij.
3. Results
3.1. Measurement Results Using Air Diffusion Model in the Workplace and Surrounding Areas
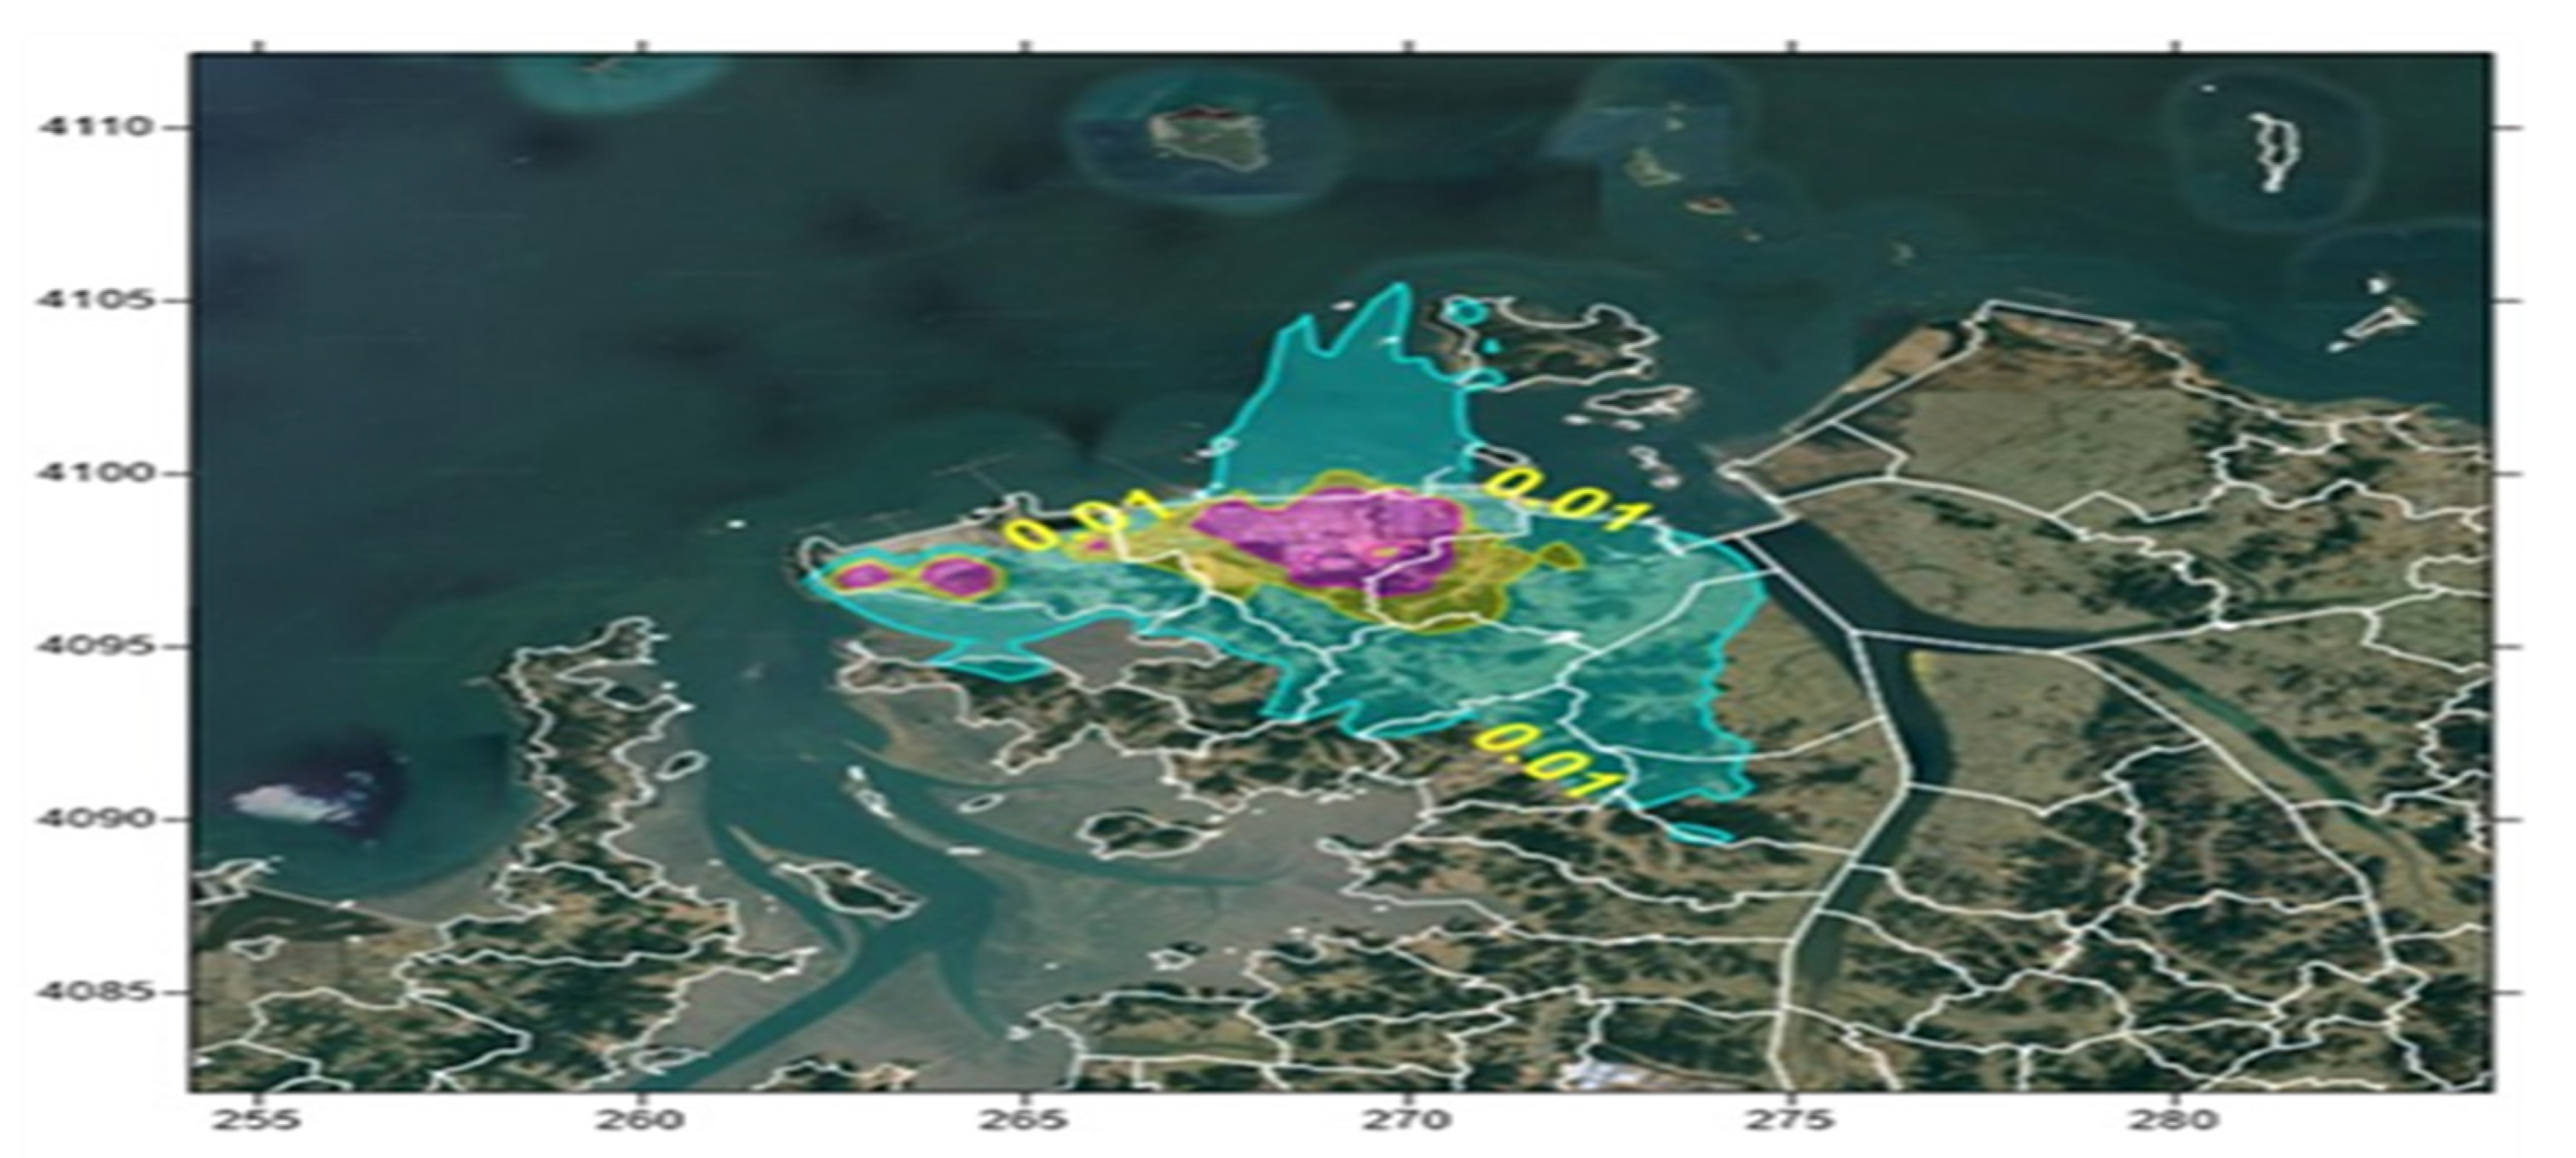
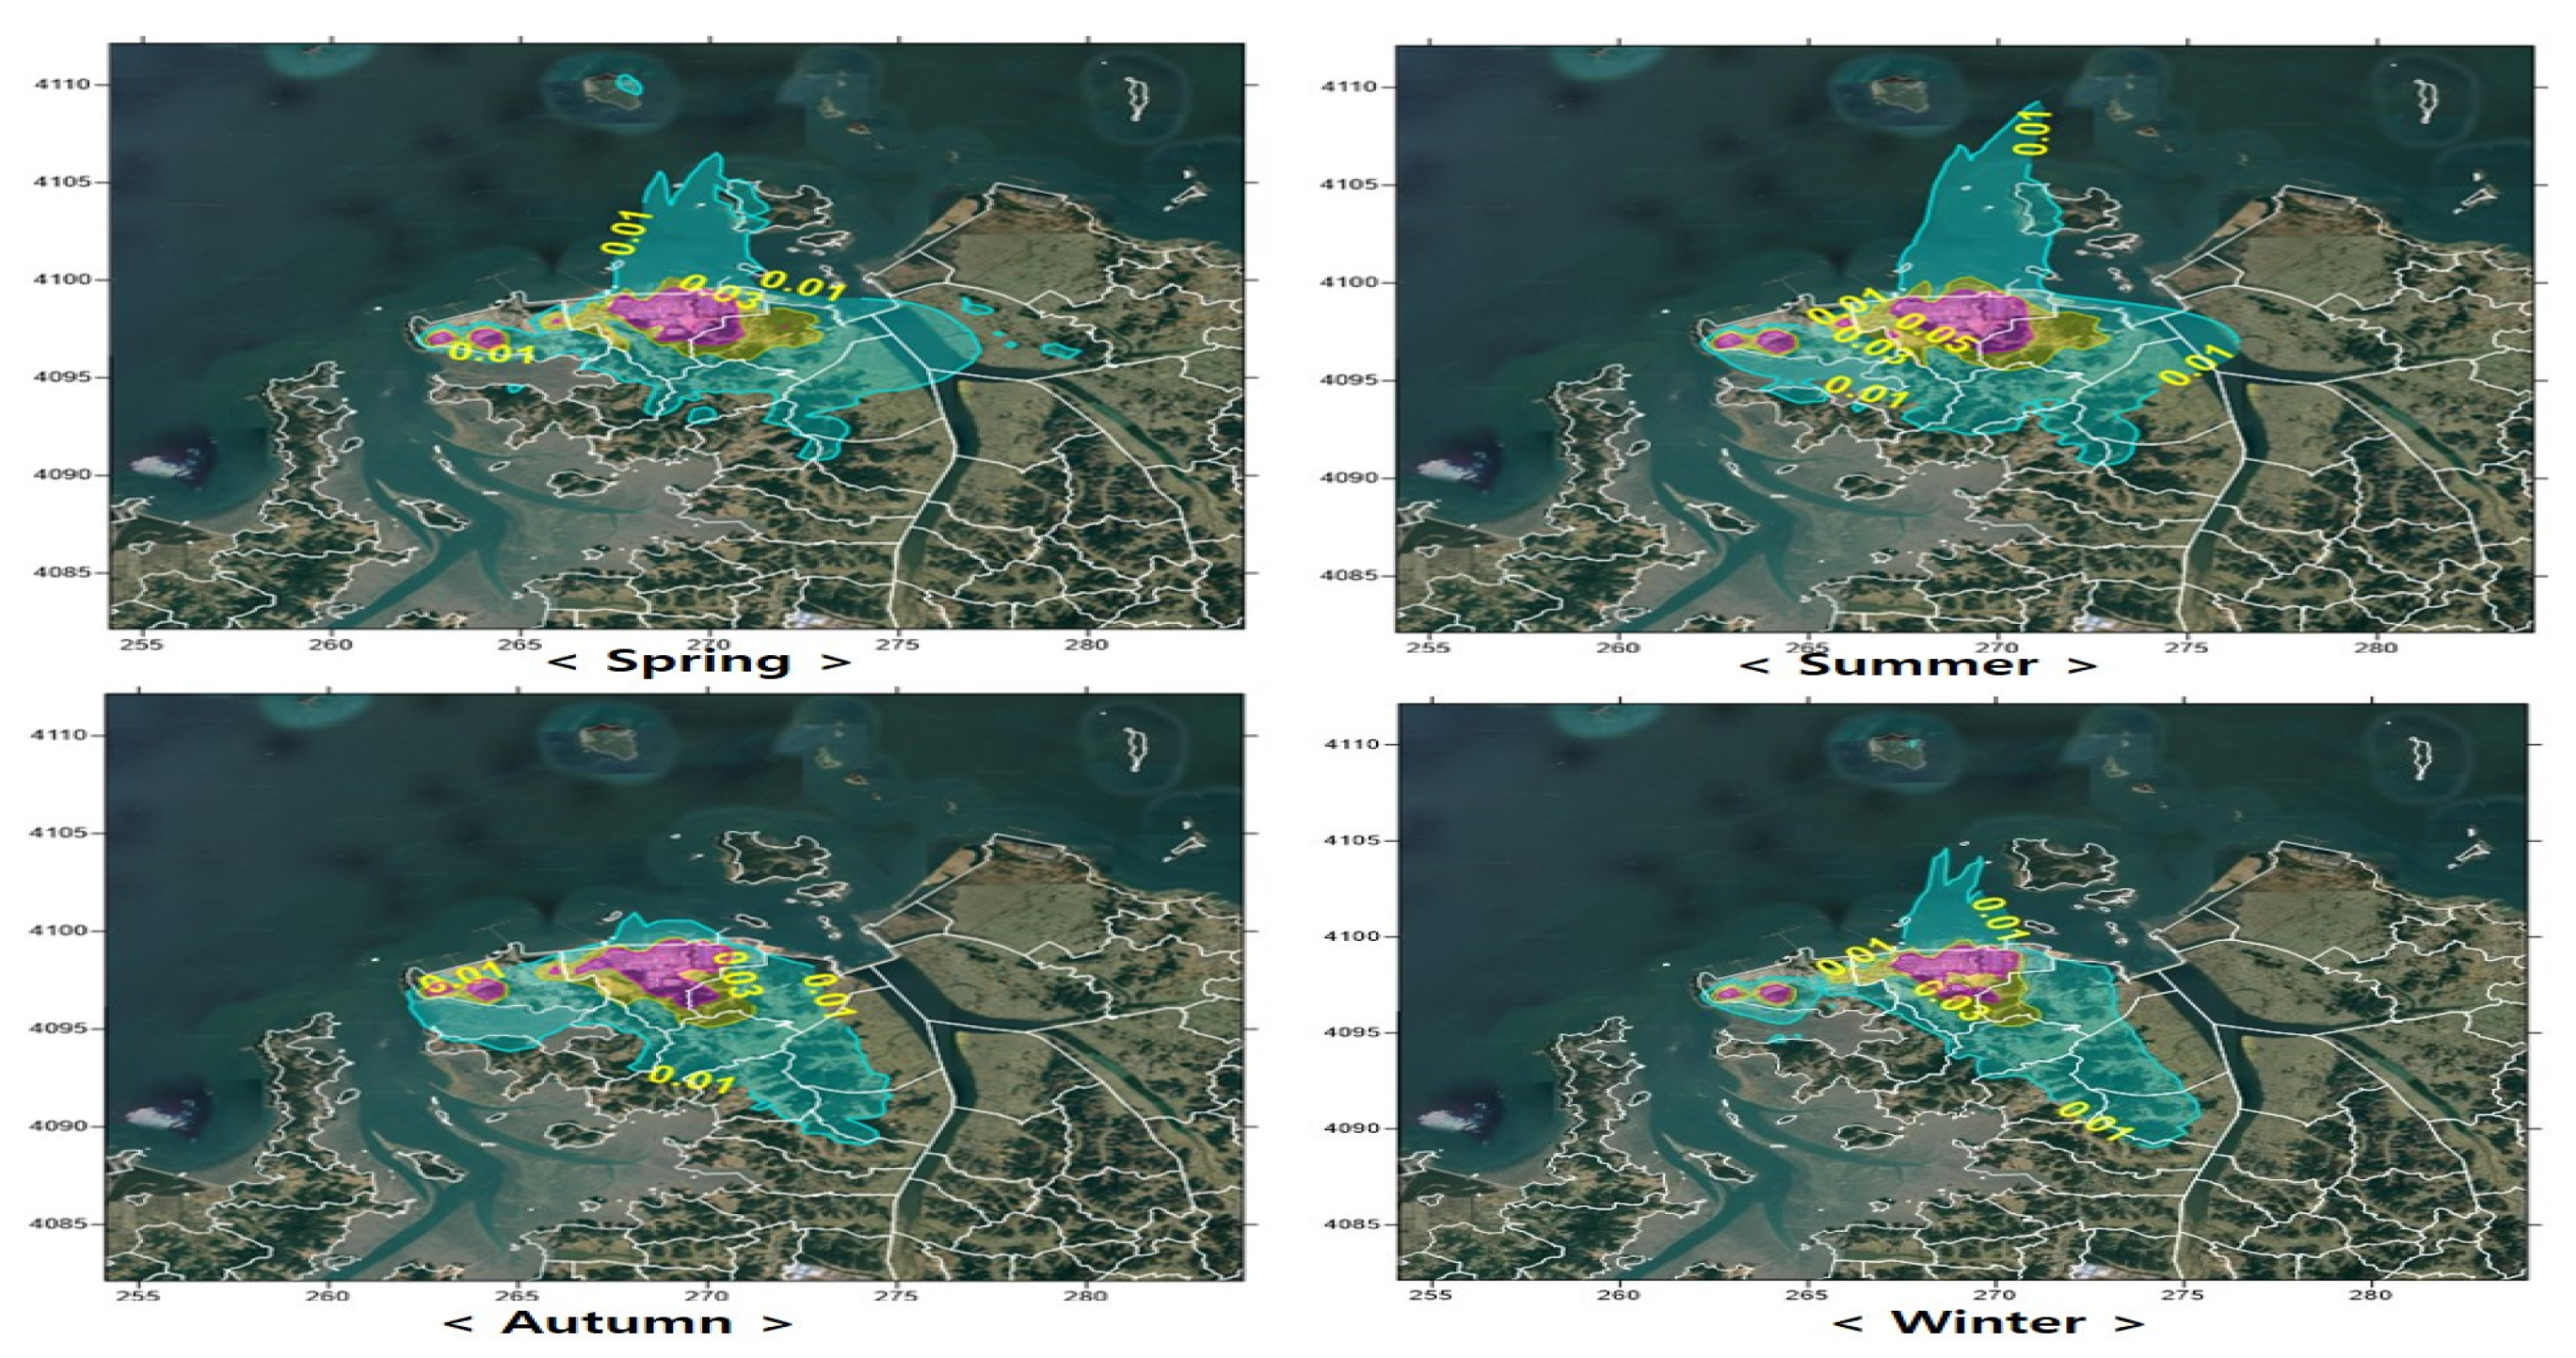
The total amount of air emissions as per the Pollutant Release and Transfer Registers, managed by the government, was applied to the Clean Air Policy Support System data (Air Pollutants Emission Inventory, emission input data of the modeling prediction method) based on the distribution of pollutants and the characteristics of the emission sources. The results of estimating benzene emissions in the Daesan area are presented. The spatial distributions of the benzene point and surface sources were confirmed, based on the characteristics of the study. In case of benzene point sources, the emission points were confirmed to be concentrated to the east of the business site, and the grid surface sources were evenly distributed within the Daesan area. In spring and summer, the main wind direction was southwesterly, with considerable easterly and southerly winds. Thus, the pollutants diffused towards the southwest and west, and, unlike in other seasons, it also spread northward. In autumn, the concentration spread to the southeast and west, which are the windward sides owing to the influence of northwest and east winds. In winter, compared with other seasons, the northwest winds were stronger, and the pollutants were found to spread to the southeast, which is on the windward side (
Figure 3). Daesang Industrial Complex is a unique case in Korea as a single business site for petroleum manufacturing, which is different from other business complexes. It will be utilized as a good result as an example of creating a management system through the health status of local residents.
3.2. Characteristics of the Surrounding Area of the Business as a Result of High Atmospheric Model Concentration
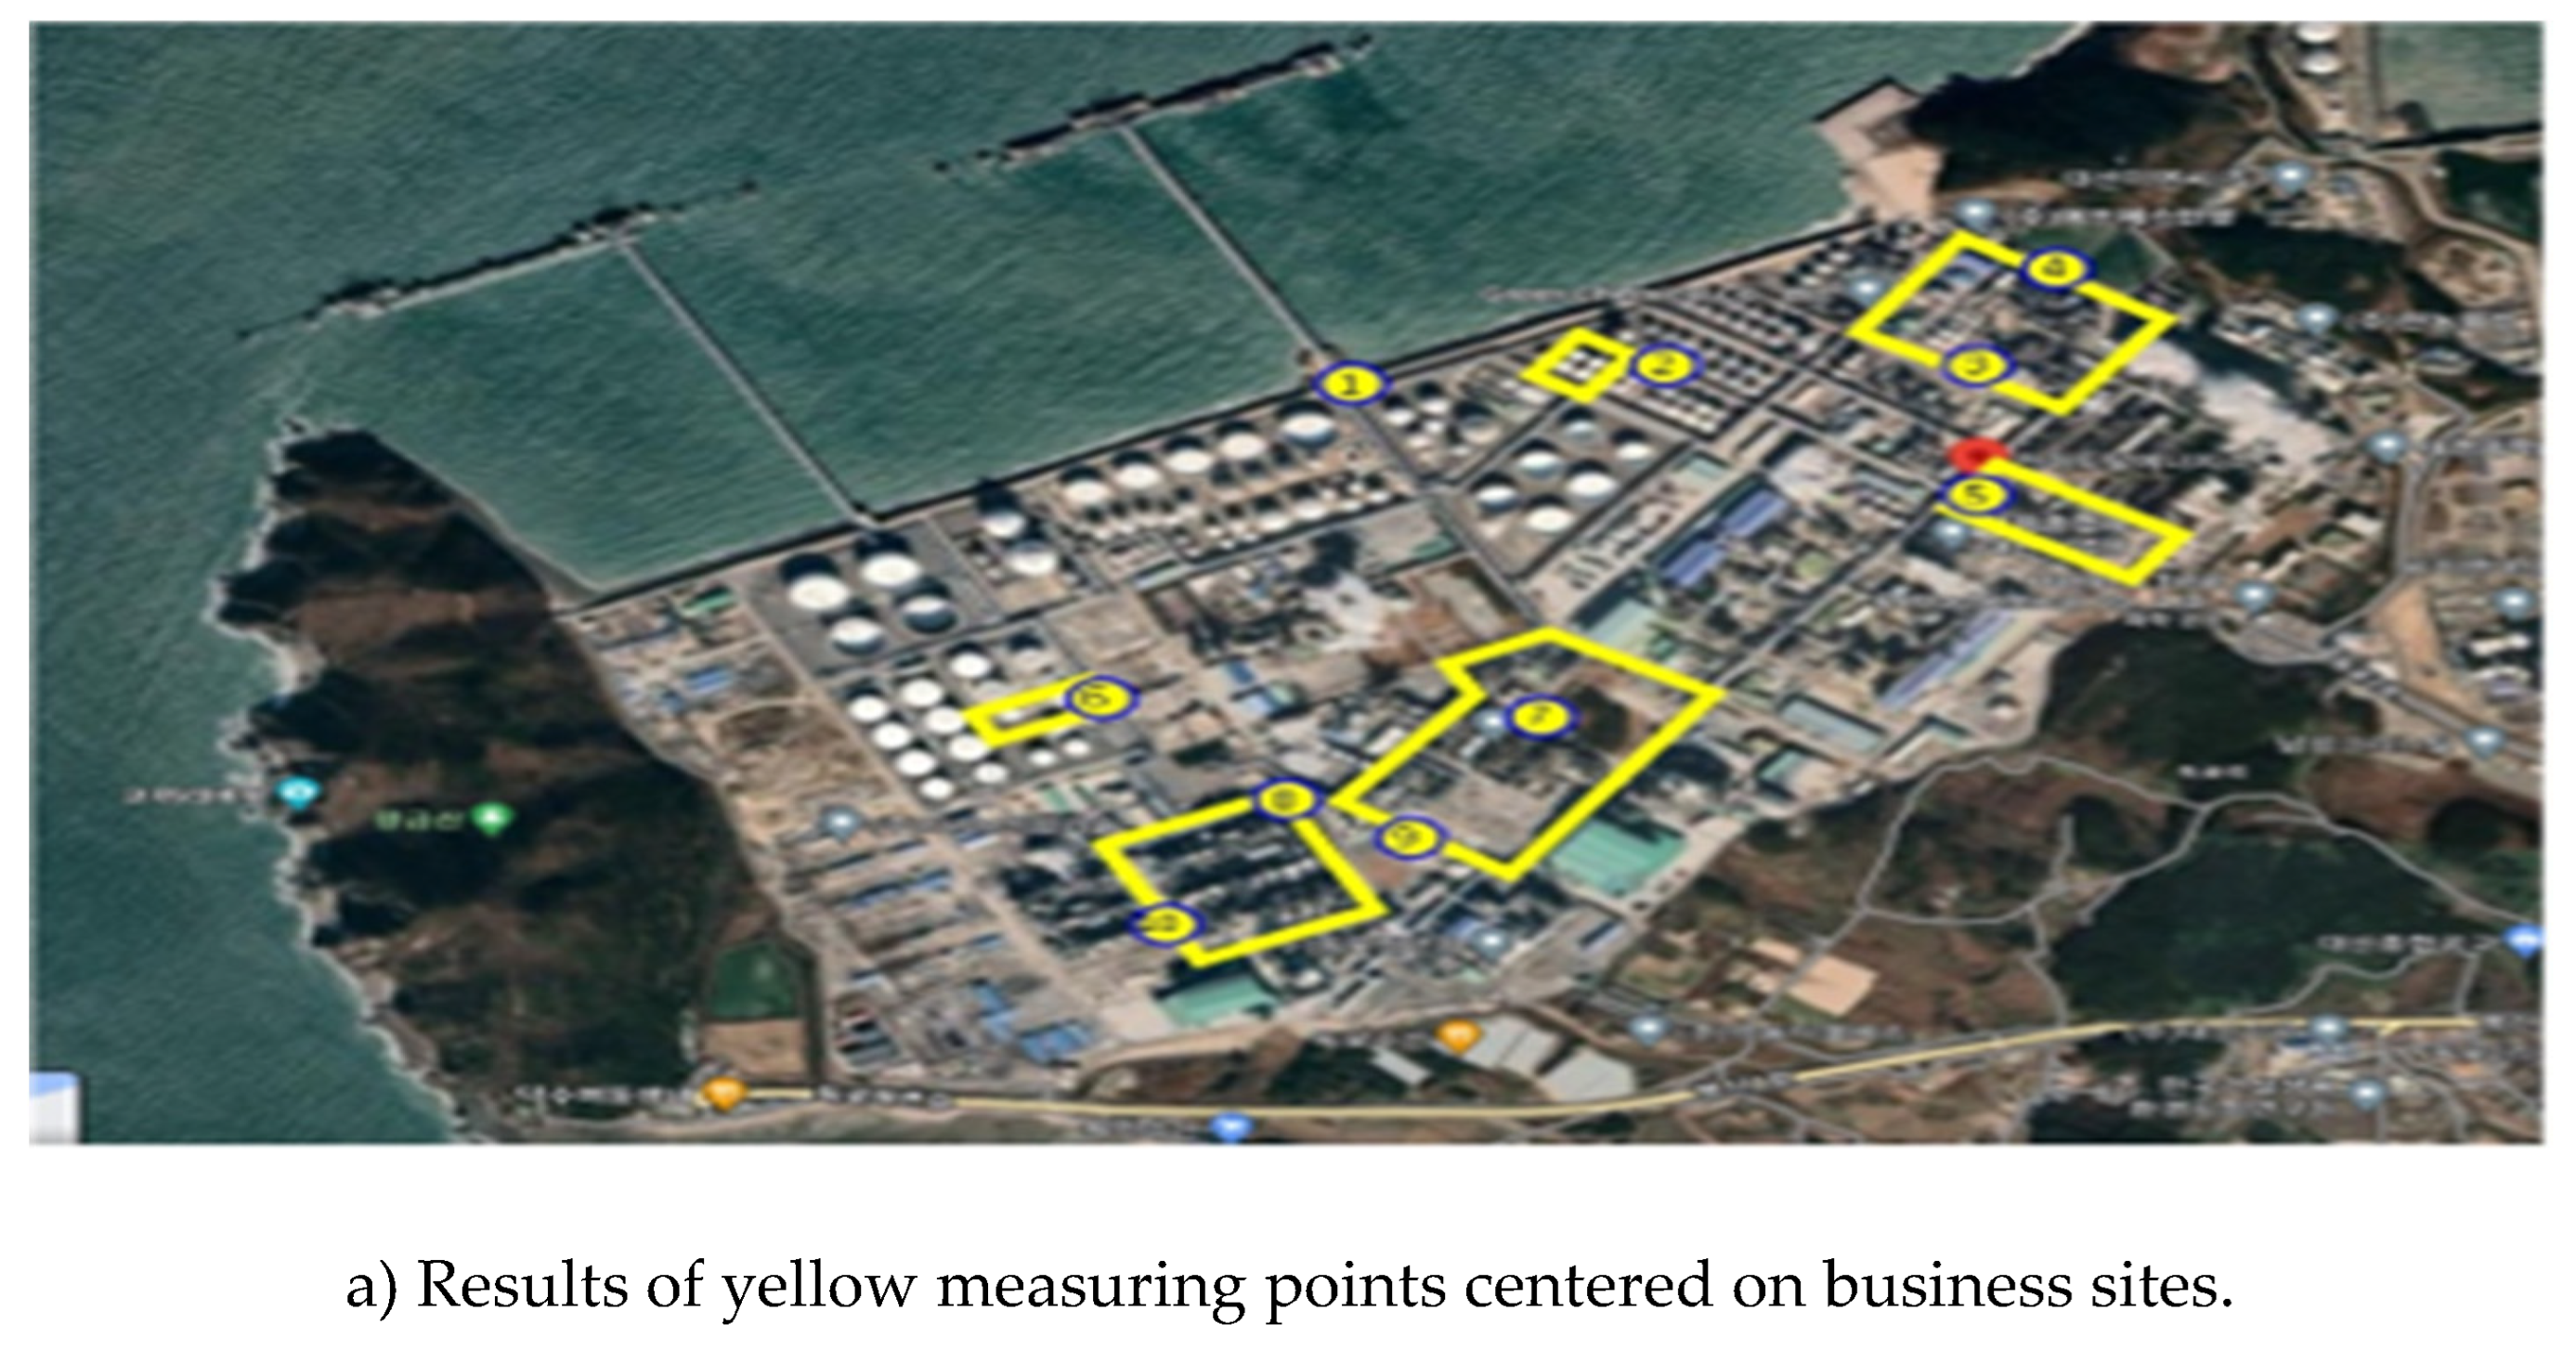
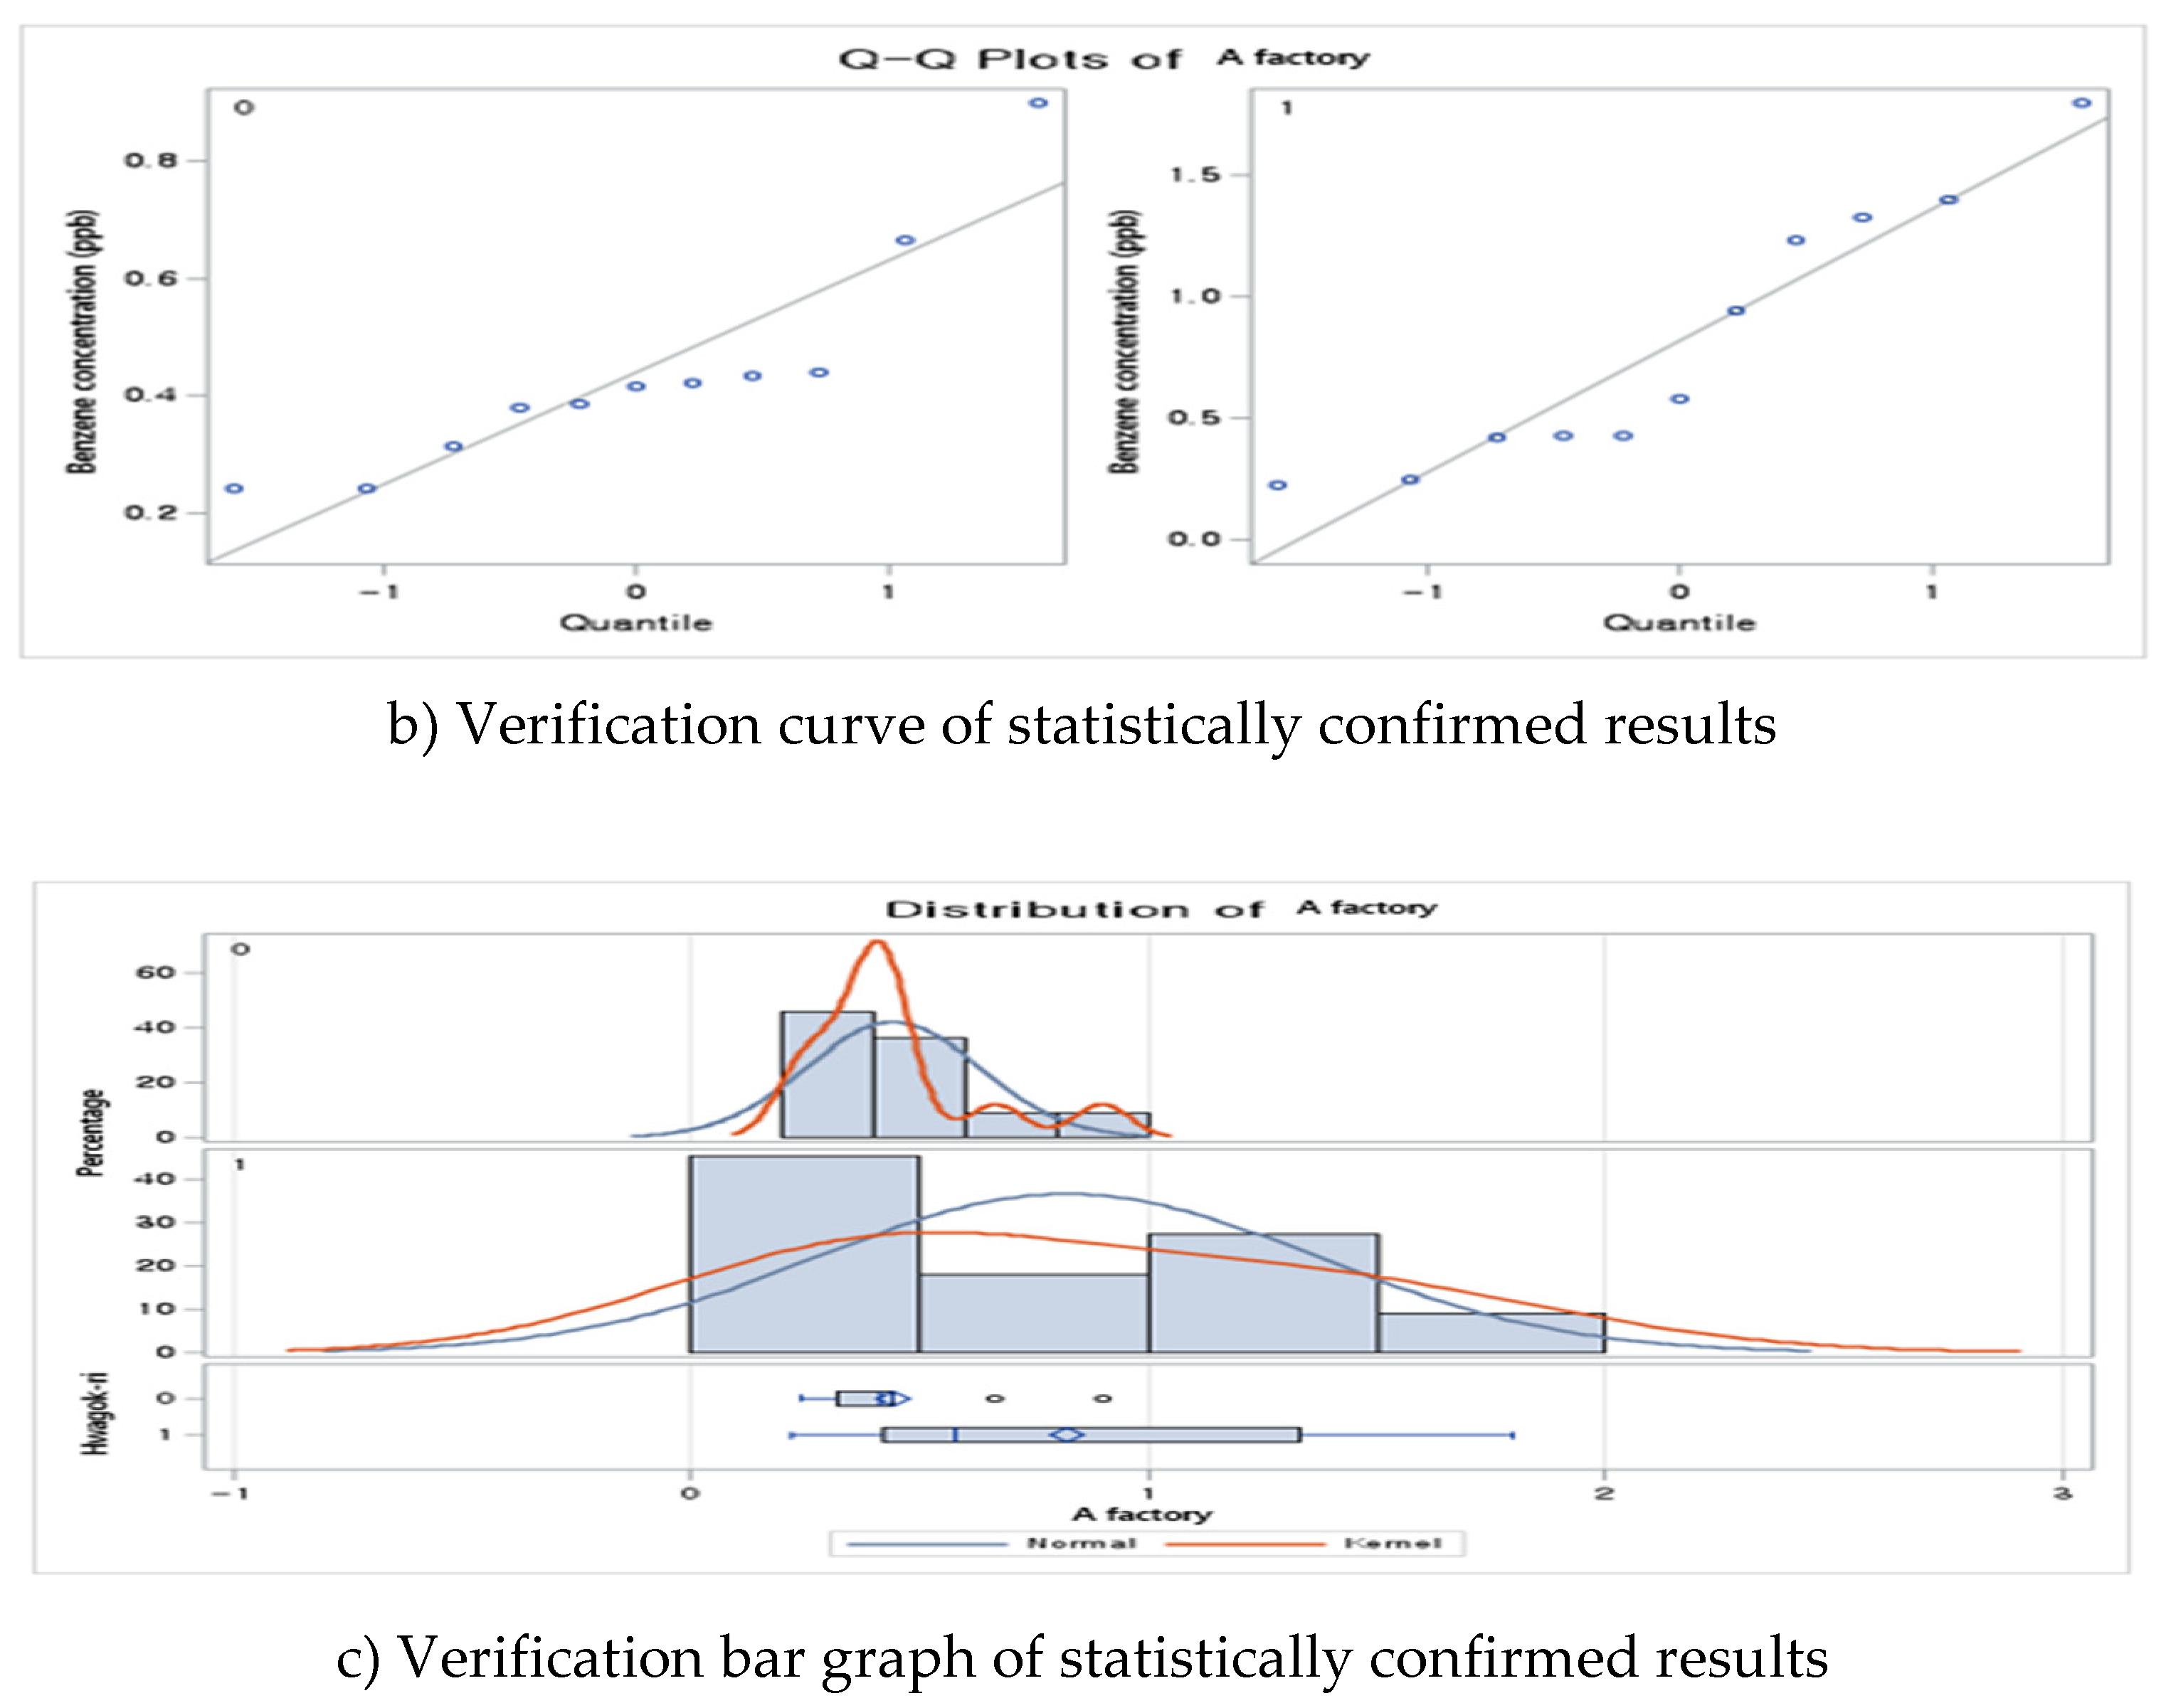
We checked the national measurement network data centered on benzene, which is directly related to the concentration of recent health damage to residents due to exposure to air pollution in the workplace and surrounding areas in
Figure 3. Accordingly, we checked the results of the relationship between the concentration of pollutants in the industrial site and distance of the location from source for local residents, focusing on the results that clearly showed a causal relationship between benzene and respiratory diseases. Statistically significant results were obtained on comparing the results of the measurement of the area surrounding the workplace A (red left point) with a high epidemiological correlation to Hwagok-ri and the village hall with workplaces with high concentrations of benzene (Average High [11 cases] 0.82±0.46 ppb, Average Low [11 cases] 0.44±0.31 ppb; p > 0.0403;
Figure 4 and
Table 2).
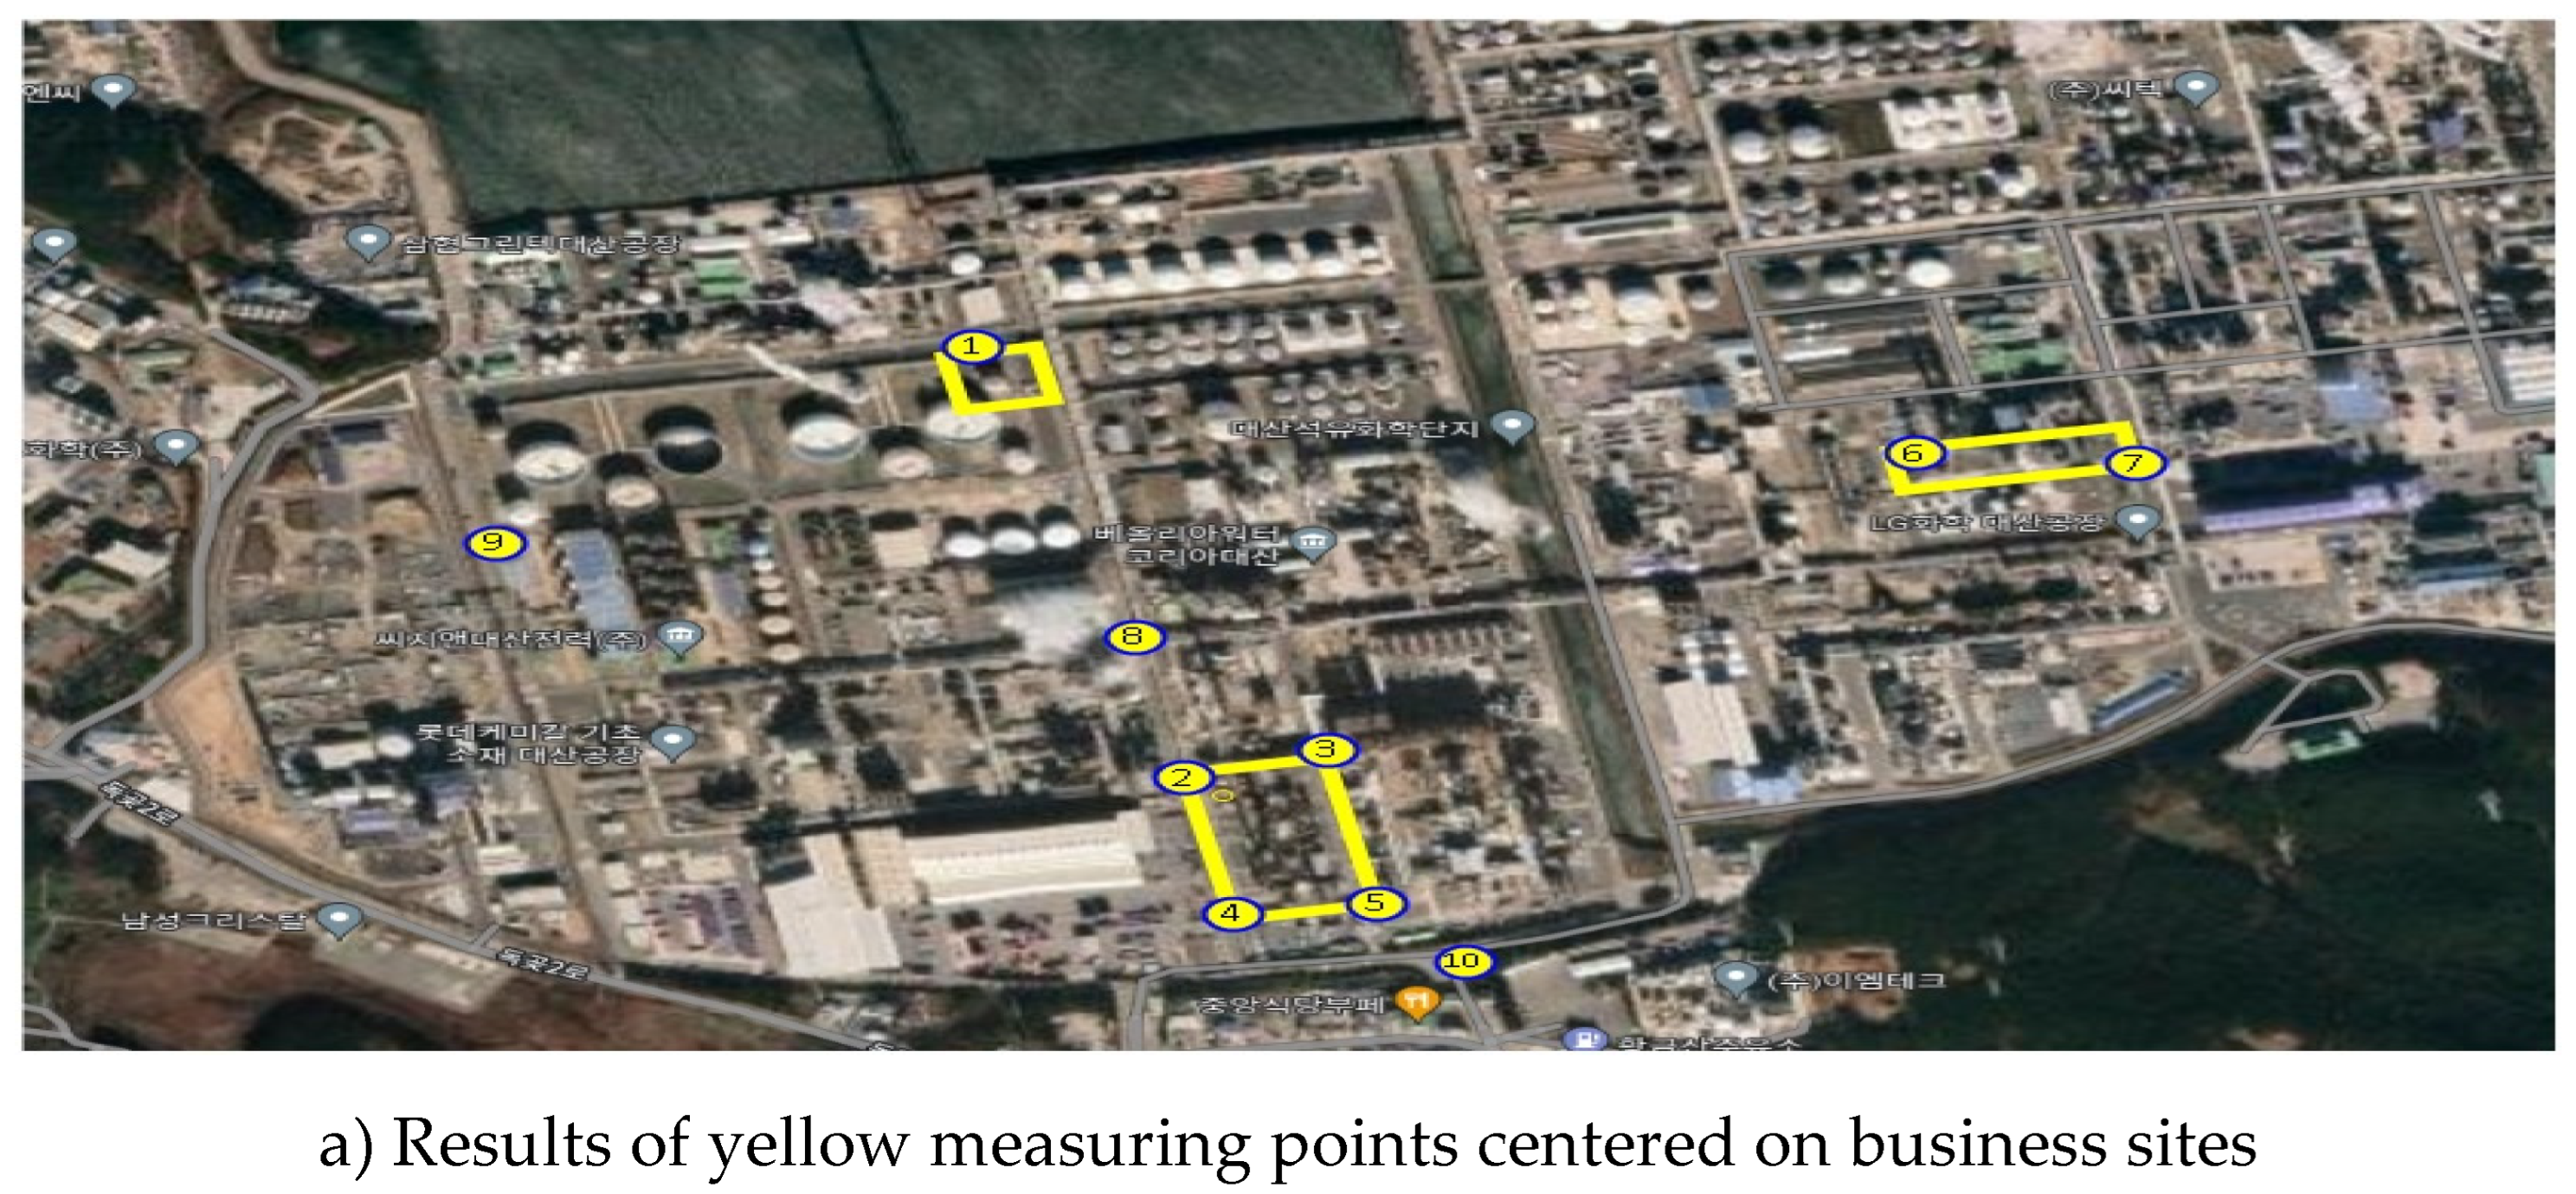
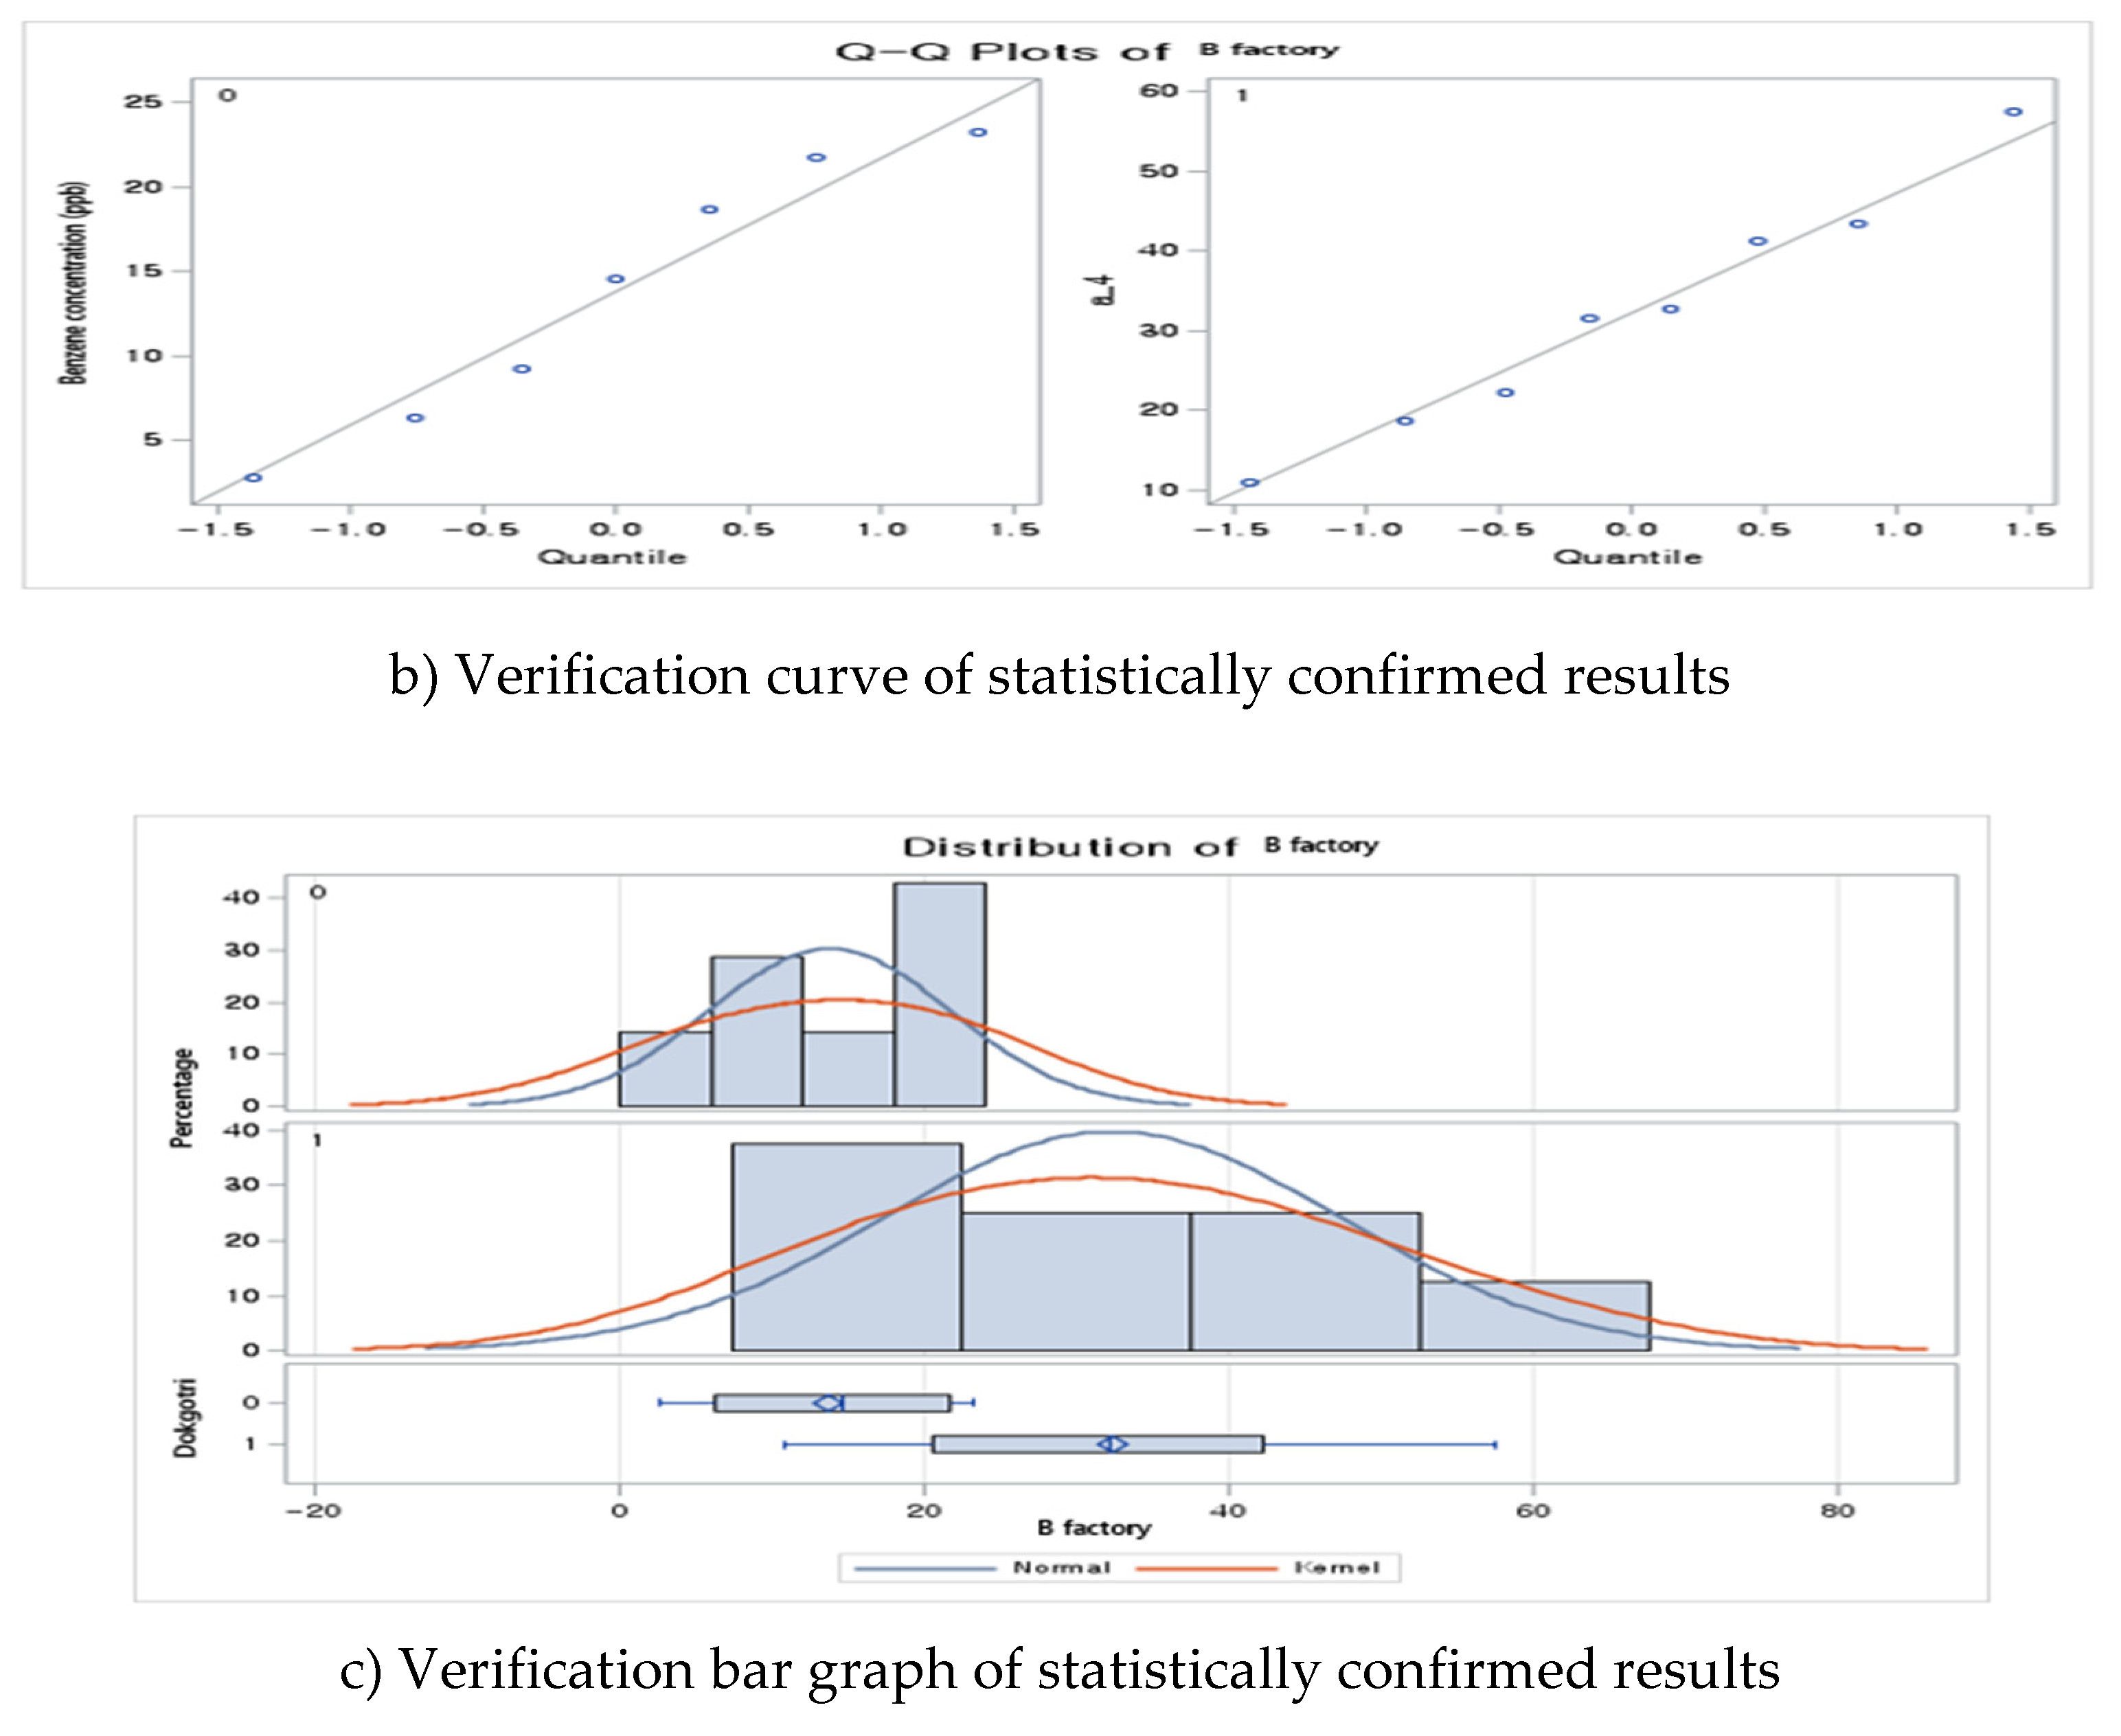
It was confirmed that Workplace B, an industrial site on the right side of
Figure 3, was an area with high concentration of industrial waste, which could result in significant damage to residents. When compared to the measurement results around Workplace B in Dokgot-ri and the village hall (Average High [8 cases] 32.29±19.73, Average Low [7 cases] 13.79±6.47), a statistically significant result was confirmed (P > 0.0115;
Figure 5 and
Table 3).
3.3. Results of Cohort Analysis of Health Insurance Data from Industrial Complexes (Dokgotri and Hwagok-ri)
The total number of participants in the Daesang Industrial Complex was 33,070, including 21,636 in the control area (> 10 km from the factory; 54.88% men and 45.12% women), 7,222 in the medium-exposure area (within 5 km from the factory; 53.78% men and 56.51% women), and 4,212 in the high-exposure area (within 2 km from the factory; 46.22% men and 43.49% women). The average age was 30.00±19.85 years in the control area, which was significantly higher than 29.22±20.10 years in the medium exposure area and 32.13±21.07 years in the high exposure area (P > 0.01826). In terms of age distribution in the control area, the 20–39 years age group was the largest (37.68%), followed by those under 20 years (32.07%), 40–64 years (23.78%), and ≥65 years (6.48%). In the medium-exposure area, <20 years of age group was the largest (35.67 %), followed by 20-39 years (33.48 %), 40-64 years (24.73 %), and ≥ 65 years (6.12%). In the high-exposure area, 20-39 years age group was the largest (1,512;35.90%), followed by < 20 years group (28.87%), 40-64 years group at 25.97, and ≥ 65 years group(9.26%). According to the contrast and high exposure, the age distribution was significantly higher in the 20–39 years age group (P > 0.00001). Household income was highest in the 3rd and 2nd quartiles in the contrast area (28.53%), and lowest in the 4th (24.16%) and 1st (21.39%) quartiles. The middle exposure area was also confirmed to have the highest in the 4th quartile (56.61%), followed by 3rd (17.83%), 2nd (13.94%), and 1st (11.62) quartiles. In the high-exposure area the highest income was observed in the 3rd quartile (27.84%), followed by the 4th (26.98%), 2nd (24.92%), and 1st quartile (20.26%), showing a significantly higher distribution of high-income quartiles in the high-exposure area (P > 0.00001;
Table 4).
Subjects in the exposed area were identified as having general health problems. The results of follow up of local resident with respiratory disease among the 23 participants with chronic diseases are shown in
Table 4. Among participants with chronic disease, who lived in industrial complex areas for more than 5 years, with respiratory diseases, the incidence of acute upper respiratory infections (J00-J06) was significantly higher in the medium-exposure area (84.16%) than that in the control area (82.71% (P < 0.0001). This analysis was conducted based on the diagnosis made at the hospital visit. Other diseases of the upper respiratory tract (J30-J39) were significantly higher in the high-exposure area (37.20%) than that in the control area (36.46% (P < 0.0001). The incidence characteristics of other acute lower respiratory infections (J20-J22), chronic lower respiratory diseases (J40-J47), and asthma (J45) were confirmed to have opposite causal relationships between the exposure and control areas (
Table 5).
Table 5.
Correlation results between control and exposure areas of industrial complexes according to respiratory diseases (Unit, No. [%]).
Table 5.
Correlation results between control and exposure areas of industrial complexes according to respiratory diseases (Unit, No. [%]).
| |
Control area |
Exposed area |
*p-value |
| Low |
Medium |
High |
| Acute upper respiratory infections (J00-J06) |
13,796 |
4,318 |
2,842 |
|
| Number of subjects (persons, %) |
No |
2,386(17.29) |
684(15.84) |
564(19.85) |
p<0.0001 |
| Result of occurrence |
Yes |
11,410(82.71) |
3,634(84.16) |
564(19.85) |
| Other diseases of upper respiratory tract (J30-J39) |
20,488 |
6,734 |
4,032 |
|
| Number of subjects (persons, %) |
No |
13,018(63.54) |
4,132(61.36) |
2,532(62.80) |
0.0056 |
| Result of occurrence |
Yes |
7,470(36.46) |
2,602(38.64) |
1,500(37.20) |
| Other acute lower respiratory infections (J20-J22) |
15,280 |
4,628 |
3,132 |
|
| Number of subjects (persons, %) |
No |
3,140(20.55) |
980(21.18) |
704(22.48) |
0.0489 |
| Result of occurrence |
Yes |
12,140(79.45) |
3,648(78.82) |
2,428(77.52) |
| Chronic lower respiratory diseases (J40-J47) |
20,860 |
6,900 |
4,062 |
|
| Number of subjects (persons, %) |
No |
12,624(60.52) |
4,350(63.04) |
2,618(64.45) |
p<0.0001 |
| Result of occurrence |
Yes |
8,236(39.48) |
2,550(36.96) |
1,444(35.55) |
| Asthma (J45) |
20,772 |
6,894 |
4,036 |
|
| Number of subjects (persons, %) |
No |
16,930(81.50) |
5,660(82.10) |
3,292(81.57) |
0.5363 |
| Result of occurrence |
Yes |
3,842(18.50) |
1,234(17.90) |
744(18.43) |
Table 6.
Correlation between control and exposed areas in industrial complexes (Unit, No. [%]) for other respiratory diseases.
Table 6.
Correlation between control and exposed areas in industrial complexes (Unit, No. [%]) for other respiratory diseases.
| |
Control area |
Exposed area |
*p-value |
| Low |
Medium |
High |
| Chronic rhinitis (J31) |
18,602 |
5,974 |
3,666 |
|
| Number of subjects (persons, %) |
No |
5,694(30.61) |
1,702(28.49) |
1,106(30.17) |
0.00798 |
| Result of occurrence |
Yes |
12,908(69.39) |
4,272(71.51) |
2,560(69.83) |
| Diseases of the respiratory system (J00-J99) |
10,290 |
3,024 |
2,138 |
|
| Number of subjects (persons, %) |
No |
644(6.26) |
154(5.09) |
168(7.86) |
0.00028 |
| Result of occurrence |
Yes |
9,646(93.74) |
2,870(94.91) |
1,970(92.14) |
| Cough (R05) |
21,538 |
7,194 |
4,196 |
|
| Number of subjects (persons, %) |
No |
20,126(93.44) |
6,740(93.69) |
3,954(94.23) |
0.1518 |
| Result of occurrence |
Yes |
1,412(6.56) |
454(6.31) |
242(5.77) |
3.4. Results of Workplace Emissions Correlation and Contribution Priorities
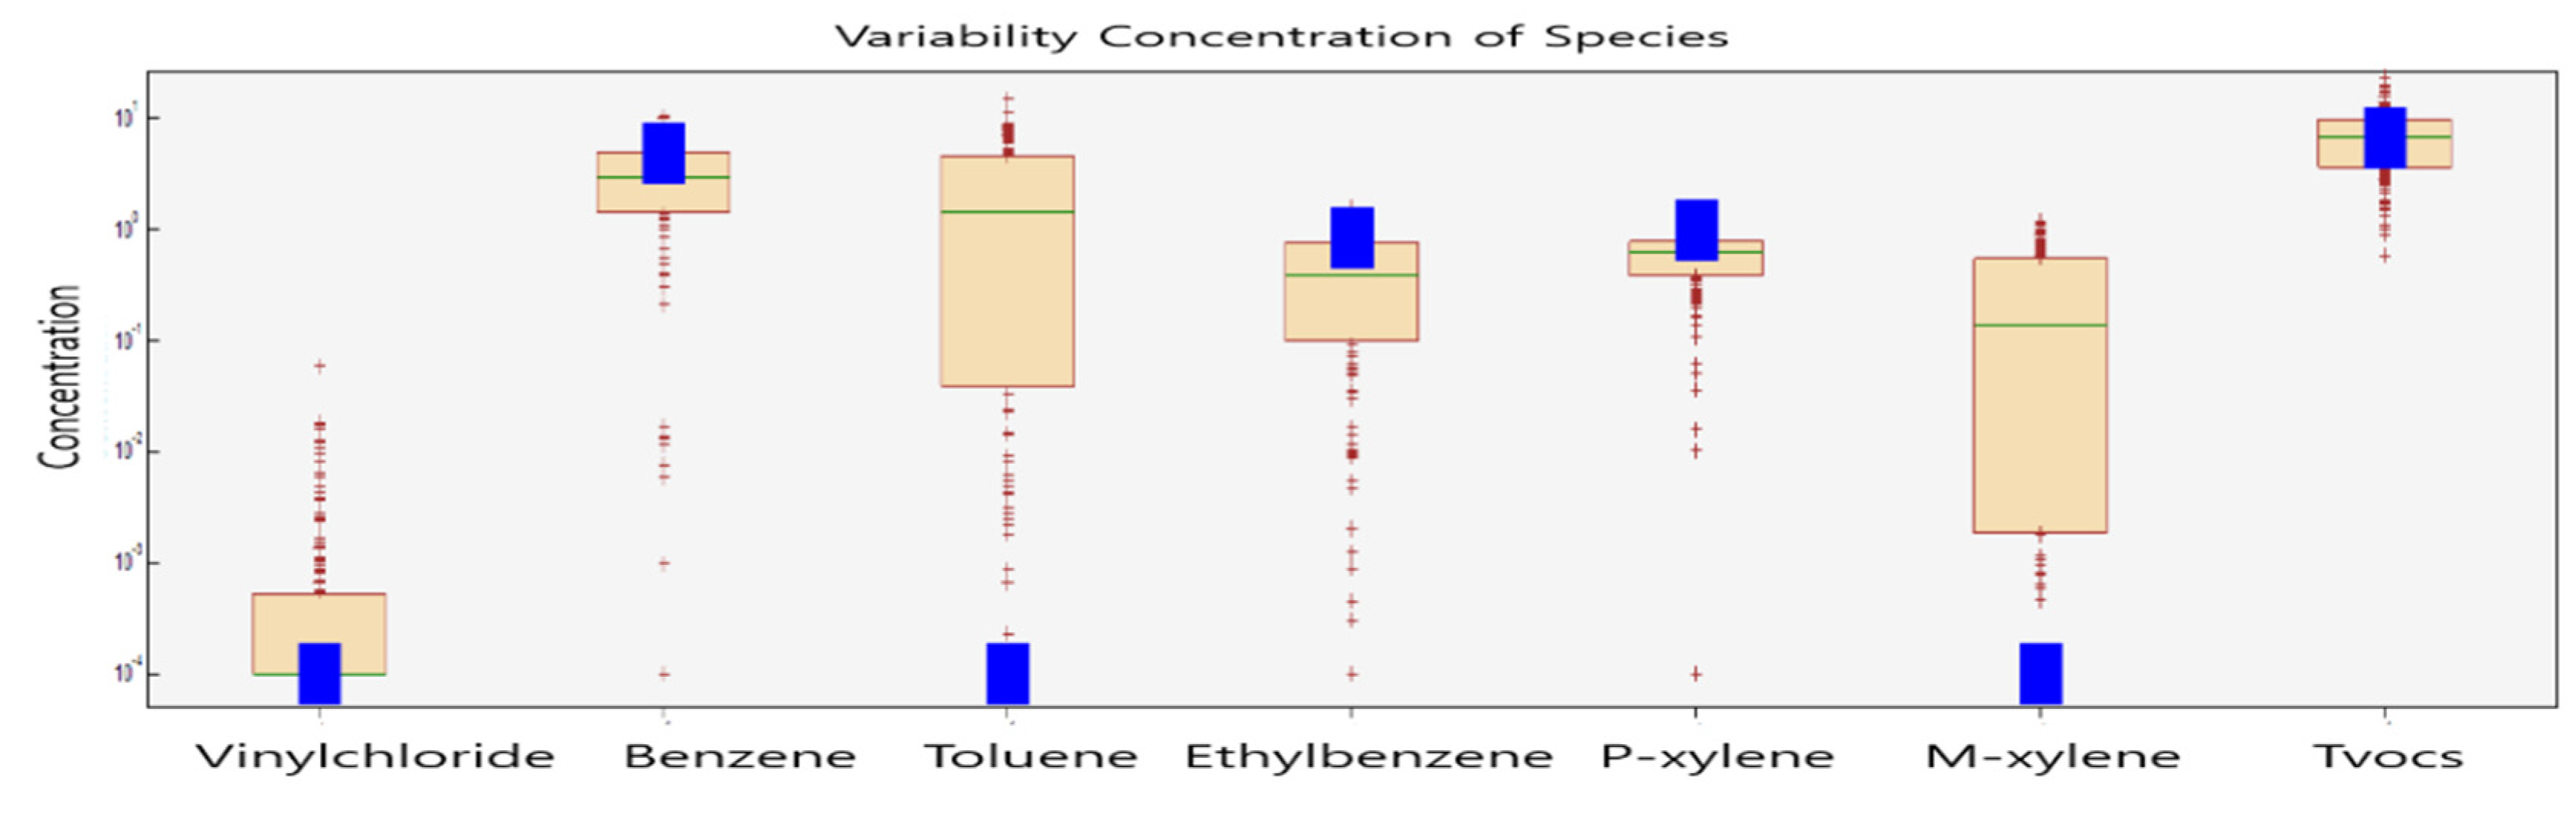
By analyzing the results of the concentration of pollutant by component centered on volatile organic chemicals in the village and workplace, the contribution of exposure was determined to confirm the correlation between the causality of the respiratory disease in the factory and village, as follows. This confirmed the contribution of benzene among other volatile organic chemicals, and it was confirmed that it had the second highest impact overall; moreover, it is believed to be a factor in the deterioration of health due to long-term exposure to concentration in the future.
When the results were confirmed as a whole, in addition to affecting the results at low concentrations, long-term exposure according to the characteristics of high concentrations could cause respiratory diseases in results that considered only the characteristics of benzene, excluding other individual variables. The results of the measurement of volatile organic chemicals according to the correlation between villages and factories were used to identify the contribution rate of benzene by source, considering the variability in the ratio and concentration of chemicals in the workplace. The results of factory A were the same as those of factory B, but the contribution rate was confirmed in the order of tvocs (50.0%) > benzene (36.4%) > p-xylene (7.4%) > ethylbenzene (6.3%), according to the results of the main variables as per concentration and ratio, and the rest were confirmed as vinyl chloride, toluene, and m-xylene at 0% (
Figure 6,
Table 7).
4. Discussion
Daesang and Seosan-si are special national industrial complexes in Korea with surrounding sea and are places where environmental pollution management is necessary. Using ten sizable workplaces as measuring points, the states of handling, storage, and shipping facilities were examined. These sources include manufacturing, transportation, and shipping operations, which release volatile organic compounds during the processing in oil refineries. Among the emission sources of business sites, benzene is produced from production facilities, storage tanks, and wastewater treatment facilities, so it is difficult to predict and measure, and in order to identify the pollutant substances, monitoring was conducted for 24 h a day for 2 weeks per season. Northwesterly winds are mainly prevalent throughout the year in the Daesan area (near the industrial complex). Based on a cohort investigation of the occurrence of chronic diseases, continuous observation was possible in the survey and control areas, and the period of residence was analyzed based on the accumulated data. A retrospective cohort study was conducted using respiratory diseases as environmental diseases. In order to calculate the applied results, a Cox proportional hazard model was used as a statistical analysis method, and the hazard ratio of living in the survey area compared to that living in the control area was calculated using cohorts of 23 chronic diseases. The spatial distributions of the benzene point and surface sources were confirmed based on the characteristics of the study. This confirmed that the concentration of benzene components gradually decreases as the area is exposed to diffusion, but it has an effect due to diffusion such as high distribution of the same components.. In spring and summer, the main wind direction was southwesterly, with considerable easterly and southerly winds. Similarly, the diffusion of pollutants proceeded in the southwest and west, and, unlike in other seasons, it spread northward as well. In autumn, the characteristics of the concentration spreading to the southeast and west, which are the windward sides, were confirmed owing to the influence of northwest and east winds. In winter, compared with other seasons, the northwest winds prevailed at a high speed, and the pollutants were found to spread to the southeast, which is the windward side. Accordingly, we checked the results through the harmful relationship between distance and concentration in the industrial site and local residents, focusing on the results that clearly showed a causal relationship between benzene and respiratory diseases. When comparing the results of the measurement surrounding the workplace A with a high epidemiological correlation to Hwagok-ri and the village hall through workplaces with high concentrations of benzene (Average High [11 cases] 0.82±0.46 ppb, average low [11 cases] 0.44±0.31 ppb), we confirmed statistically significant results. When compared to the measurement results around Workplace B in Dokgot-ri and the village hall (Average High [8 cases] 32.29±19.73, average low [7 cases] 13.79±6.47), a statistically significant result was confirmed. This confirmed that the same components were consistently emitted as a result of the small-area impact on the concentration of the workplace. The total number of participants in the Daesang industrial complex was 33,070, including 21,636 in the control area (> 10 km from the factory), 7,222 in the medium-exposure area (within 5 km from the factory), and 4,212 in the high-exposure area (within 2 km from the factory). In terms of sex, 54.88% were men and 45.12% women in the control area, 53.78% were men and 56.51% women in the medium-exposure area, and 46.22% were men and 43.49% women in the high-exposure area. The average age was 30.00±19.85 years in the control area, which was significantly higher than 29.22±20.10 years in the medium exposure area and 32.13±21.07 years in the high exposure area. Household income was highest in the 3rd and 2nd quartiles in the contrast area (28.53%), and the lowest in the 4th (24.16%) and 1st quartiles (21.39%). The high-exposure area was the highest in the 3rd quartile (27.84%), followed by the 4th quartile (26.98%), 2nd quartile (24.92%), and 1st quartile (20.26%), indicating a significantly higher distribution of high-income quartiles in the high-exposure area. In the case of respiratory diseases among chronic diseases of the participants lived in industrial complex areas for more than 5 years, the incidence of acute upper respiratory infections (J00-J06) was significantly higher in the medium-exposure area (84.16 %) than in the control area (82.71 %). Other diseases of the upper respiratory tract (J30-J39) were significantly more common in the high-exposure area (37.20 %) than in the control area (36.46 %). Among the major respiratory factors, the incidence of chronic rhinitis (J31) was 69.39% in the control area, 71.51% in the intermediate-exposure area, and 69.83% in the high-exposure area, and was significantly higher in the exposed area. The incidence of respiratory system disease (J00-J99) was 93.74% in the control area and 94.91% in the intermediate-exposure area, which was significantly higher. The results of factory A were the same as those of factory B, but the contribution rate was confirmed in the order of tvocs (50.0%) > benzene (36.4%) > p-xylene (7.4%) > ethylbenzene (6.3%), according to the results of the main variables according to the concentration and ratio, and the rest were confirmed as vinyl chloride, toluene, and m-xylene at 0%. This is the result of a comprehensive survey conducted with the consent of all local residents as a result of special hospital treatment in our country. It was confirmed that the characteristics of chronic diseases caused by exposure to benzene affect the distance around the workplace.
The emission reduction plan for the development of Korea’s national industrial complexes is theoretically calculated emission; as such it is used in guideline as causal health indicator and is converted to the concentration in the surrounding area. In Korea, it is used as a good indicator for tracking the emission source and the causality of health. Therefore, this study’s offers the following recommendations for implementation. First, considering that there are emissions but information on the standard emission concentration (workplace and surrounding area) is insufficient in Korea, there are limitations in establishing various systems. Second, as there are no regulations for monitoring emission reduction effects and such supplementation will be necessary in the future. Finally, the Ministry of Environment should open the data so that various reviews can be prepared, and the results of the monitoring report and emission reduction efforts submitted by the workplace can be reviewed and improved.
5. Conclusions
The spatial distributions of the benzene point and surface sources were confirmed based on the characteristics of the study. In spring and summer, the main wind direction was southwesterly, with considerable easternly and southernly winds. It was confirmed that areas affected by the wind have a higher incidence of chronic diseases. When comparing the results of the measurement surrounding the workplace A with a high epidemiological correlation to Hwagok-ri and the village hall through workplaces with high concentrations of benzene (Average High [11 cases] 0.82±0.46 ppb, Average Low [11 cases] 0.44±0.31 ppb), we confirmed statistically significant results. When compared to the measurement results around Workplace B in Dokgot-ri and the village hall (Average High [8 cases] 32.29±19.73, Average Low [7 cases] 13.79±6.47), a statistically significant result was confirmed. In the case of respiratory diseases among chronic diseases in the participants who lived in industrial complex areas for more than 5 years, the incidence of acute upper respiratory infections (J00-J06) was significantly higher in the medium-exposure area (84.16 %) than in the control area (82.71 %). Other diseases of the upper respiratory tract (J30-J39) were significantly higher in the high-exposure area (37.20%) than in the control area (36.46% (p<0.0001). The incidence characteristics of other acute lower respiratory infections (J20-J22), chronic lower respiratory diseases (J40-J47), and asthma (J45) were confirmed to have opposite causal relationships between the exposure and control areas. The results of factory A were the same as those of factory B, but the contribution rate was confirmed in the order of tvocs (50.0%) > benzene (36.4%) > p-xylene (7.4%) > ethylbenzene (6.3%), according to the results of the main variables by concentration and ratio, and the rest were confirmed as vinyl chloride, toluene, and M-xylene at 0%. This is the result of a comprehensive survey conducted with the consent of all local residents as a result of special hospital treatment in our country. It was confirmed that the characteristics of chronic diseases caused by exposure to benzene affect the distance around the workplace.
Author Contributions
Conceptualization, Ho-Hyun Kim; Methodology, Ho-Hyun Kim; Software, Ho-Hyun Kim. KilYong Choi.; Validation, Ho-Hyun Kim. KilYong Choi; Formal analysis, Ho-Hyun Kim. KilYong Choi; Investigation, Ho-Hyun Kim. KilYong Choi; Resources, Ho-Hyun Kim.; Data curation, Ho-Hyun Kim; Writing-original draft preparation, Ho-Hyun Kim. KilYong Choi; Writing-Review and Editing, Ho-Hyun Kim; Visualization, Ho-Hyun Kim; Supervision, Ho-Hyun Kim.
Funding
This research was supported by Seokyeong University in 2023.
Institutional Review Board Statement
Not applicable.
Informed Consent Statement
Not applicable.
Data Availability Statement
The dataset analyzed during the current study are available from the corresponding author on reasonable request.
Conflicts of Interest
The authors declare no conflicts of interest regarding the publication of this article.
References
- Rondinelli, D.A.; Vastag, G. Assessing South Korea’s Globalization Strategy and the International Competitiveness of the Seoul Metropolitan Area. Competition & Change, 1997, 2.3: 299-329. [CrossRef]
- Bae, S.H.; Choi, J.H.; Kim, G.B.; Song, S.H.; Ha, M.A.; Kwon H.J. Evaluation of the exposure to environmental pollutants emanating from national industrial complexes. Environmental health and toxicology, 2018, 33.2. [CrossRef]
- Sung, J.H.; Oh, I.B.; Kim, A.R.; Lee, J.H.; Sim, C.S.; Yoo, C.I.; Park, S.J.; Kim, G.B.; Kim, Y.H. Environmental and body concentrations of heavy metals at sites near and distant from industrial complexes in Ulsan, Korea. Journal of Korean Medical Science, 2018, 33.5. [CrossRef]
- Lee, J.T.; Shin, D.C.; Chung, Y. Air pollution and daily mortality in Seoul and Ulsan, Korea. Environmental Health Perspectives, 1999, 107.2: 149-154. [CrossRef]
- Alyasi, H.S.; Isaifan, R. A review on pollution emissions and impact from waste treatment and disposal facilities. Journal of Environmental and Toxicological Studies, 2018, 2.1: 1-9. [CrossRef]
- MOHAMMED, A.S.; KAPRI, A.; GOEL, R. Heavy metal pollution: source, impact, and remedies. Biomanagement of metal-contaminated soils, 2011, :1-28. [CrossRef]
- Chukwuemekaa, I.S.; Njoku, V.O.; Arinze, C.; Chizoruo, I.F.; Blessing, E.N. A review: effects of air, water and land dumpsite on human health and analytical methods for determination of pollutants. Analytical Methods in Environmental Chemistry Journal, 2021, 4: 80-106. [CrossRef]
- Harrison, R.M.; Yin, J. Particulate matter in the atmosphere: which particle properties are important for its effects on health? Science of the total environment, 2000, 249.1-3: 85-101. [CrossRef]
- Hsu, C.Y.; Chiang, H.C.; Chen, M.J.; Chuang, C.Y.; Tsen, C.M.; Fang, G.C.; Tsai, Y.I.; Chen, N.T.; Lin, T.Y.; Lin, S.L.; Chen, Y.C. Ambient PM2. 5 in the residential area near industrial complexes: spatiotemporal variation, source apportionment, and health impact. Science of the Total Environment, 2017, 590: 204-214. [CrossRef]
- Neuparth, T.; Moreira, S.M.; Santos, M.M.; Reis-Henriques M.A. Review of oil and HNS accidental spills in Europe: identifying major environmental monitoring gaps and drawing priorities. Marine Pollution Bulletin, 2012, 64.6: 1085-1095. [CrossRef]
- Gray, W.B.; Shimshack, J.P. The effectiveness of environmental monitoring and enforcement: a review of the empirical evidence. Review of Environmental Economics and Policy, 2011. [CrossRef]
- Guttikunda, S.K.; Goel, R.; Pant, P. Nature of air pollution, emission sources, and management in the Indian cities. Atmospheric environment, 2014, 95: 501-510. [CrossRef]
- Chithra, V.S.; Nagendra, S.M.S. Chemical and morphological characteristics of indoor and outdoor particulate matter in an urban environment. Atmospheric Environment, 2013, 77: 579-587. [CrossRef]
- Dholakia, H.H.; Purohit, P.; Rao, S.; Garg, A. Impact of current policies on future air quality and health outcomes in Delhi, India. Atmospheric environment, 2013, 75: 241-248. [CrossRef]
- Kim, K.H.; Lee, J.H.; Jang, M.S. Metals in airborne particulate matter from the first and second industrial complex area of Taejon city, Korea. Environmental Pollution, 2002, 118.1: 41-51. [CrossRef]
- Choi, G.H.; Kang, C.H.; Lee, J.H.; Kim, J.Y.; Youn, Y.H.; Lee, S.R The chemical composition of fine and coarse particles in relation with the Asian Dust events. Atmospheric Environment, 2003, 37.6: 753-765. [CrossRef]
- Ho, K.F.; Lee, S.C.; Chan, C.K.; Yu, J.C.; Chow, J.C.; Yao, X.H. Characterization of chemical species in PM2. 5 and PM10 aerosols in Hong Kong. Atmospheric Environment, 2003, 37.1: 31-39. [CrossRef]
- Kim, N.S.; Lee, B.K. National estimates of blood lead, cadmium, and mercury levels in the Korean general adult population. Epidemiology, 2011, 22.1: S247. http://www.springerlink.com/content/27475543822t7177/. [CrossRef]
- Guohao, L.; Wei, W.; Shao, X.; Nie, L.; Wang, H.; Yan, X.; Zhang, R. A comprehensive classification method for VOC emission sources to tackle air pollution based on VOC species reactivity and emission amounts. Journal of Environmental Sciences, 2018, 67: 78-88. [CrossRef]
- Watson, J.G.; Chow, J.C.; Fujita, E.M. Review of volatile organic compound source apportionment by chemical mass balance. Atmospheric Environment, 2001, 35.9: 1567-1584. [CrossRef]
- Wei, W.; Cheng, S.; Li, G.; Wang, G.; Wang, H. Characteristics of volatile organic compounds (VOCs) emitted from a petroleum refinery in Beijing, China. Atmospheric Environment, 2014, 89: 358-366. [CrossRef]
- Hsu, C.Y.; Chiang, H.C.; Shie, R.H.; Ku, C.H.; Lin, T.Y.; Chen, M.J.; Chen, N.T.; Chen, Y.C. Ambient VOCs in residential areas near a large-scale petrochemical complex: spatiotemporal variation, source apportionment and health risk. Environmental pollution, 2018, 240: 95-104. [CrossRef]
- Hwang, I.J.; Lee, T.J.; Kim, T.O.; Bae, G.N. Characteristics of air pollutant emissions and distribution for particulate matter concentration of air pollution networks in Gyeongsangbuk-do. 2021, 37.3: 536-551. https://scholarworks.bwise.kr/kumoh/handle/2020.sw.kumoh/20303.
- Hwang, I.J.; Kim, T.O. Chemical characteristics of ambient PM2. 5 at industrial complex in Gyeongbuk area. 2019, 35.3: 336-345. https://scholarworks.bwise.kr/kumoh/handle/2020.sw.kumoh/17772.
- Civan, M.Y.; Elbir, T.; Seyfioglu, R.; Kuntasal, Ö.O.; Bayram, A.; Doğan, G.; Yurdakul, S.; Andiç, Ö.; Müezzinoğlu, A.; Sofuoglu, S.C.; Pekey, H.; Pekey, B.; Bozlaker, A.; Odabasi, M.; Tuncel, G. Spatial and temporal variations in atmospheric VOCs, NO2, SO2, and O3 concentrations at a heavily industrialized region in Western Turkey, and assessment of the carcinogenic risk levels of benzene. Atmospheric Environment, 2015, 103:102-113. [CrossRef]
- Cai, C.; Geng, F.; Tie, X.; Yu, Q.; An, J. Characteristics and source apportionment of VOCs measured in Shanghai, China. Atmospheric Environment, 2010, 44.38: 5005-5014. [CrossRef]
- Geng, F.; Tie, X.; Xu, J.; Zhou, G.; Peng, L.; Gao, W.; Tang, X.; Zhao, C. Characterizations of ozone, NOx, and VOCs measured in Shanghai, China. Atmospheric Environment, 2008, 42.29: 6873-6883. [CrossRef]
- Guo, H.; Wang, T.; Simpson, I.J.; Blake, D.R.; Yu, X.M.; Kwok, Y.H.; Li, Y.S. Source contributions to ambient VOCs and CO at a rural site in eastern China. Atmospheric environment, 2004, 38.27: 4551-4560. [CrossRef]
- Wen, M.; Deng, W.; Huang, J.; Zhang, S.; Lin, Q.; Wang, C.; Ma, S.; Wang, W.; Zhang, X.; Li, G.; An, T. Atmospheric VOCs in an industrial coking facility and the surrounding area: Characteristics, spatial distribution and source apportionment. Journal of Environmental Sciences, 2024, 138: 660-670. [CrossRef]
- Cai, C.; Geng, F.; Tie, X.; Yu, Q.; An, J. Characteristics and source apportionment of VOCs measured in Shanghai, China. Atmospheric Environment, 2010, 44.38: 5005-5014. [CrossRef]
- Kim, M.H.; Kim, S.M. Estimation of air pollutant emissions by tractor utilization in Korea. Agriculture, 2023, 13.9: 1811. [CrossRef]
- To, T.; Zhu, J.; Larsen, K.; Simatovic, J.; Feldman, L.; Ryckman, K.; Gershon, A.; Lougheed, M.D.; Licskai, C.; Chen, H.; Villeneuve, P.J.; Crighton, E.; Su, Y.; Sadatsafavi, M.; Williams, D.; Carlsten, C. Progression from asthma to chronic obstructive pulmonary disease. Is air pollution a risk factor? American journal of respiratory and critical care medicine, 2016, 194.4: 429-438. [CrossRef]
- Fisher, J.E.; Loft, S.; Ulrik, C.S.; Raaschou-Nielsen, O.; Hertel, O.; Tjønneland, A.; Overvad, K.; Nieuwenhuijsen, M.J.; Andersen, Z.J. Physical activity, air pollution, and the risk of asthma and chronic obstructive pulmonary disease. American journal of respiratory and critical care medicine, 2016, 194.7: 855-865. [CrossRef]
- Lin, Y.C.; Zhang, Y.L.; Song, W.; Yang, X.; Fan, M.Y. Specific sources of health risks caused by size-resolved PM-bound metals in a typical coal-burning city of northern China during the winter haze event. Science of the Total Environment, 2020, 734: 138651. [CrossRef]
- Oge, M.; Ozkan, D.; Celik, M.B.; Gok, M.S.; Karaoglanli, A.C. An overview of utilization of blast furnace and steelmaking slag in various applications. Materials Today: Proceedings, 2019, 11: 516-525. [CrossRef]
- Fang, G.C.; Lin, S.J.; Chang, S.Y.; Chou, C.C.K. Effect of typhoon on atmospheric particulates in autumn in central Taiwan. Atmospheric Environment, 2009, 43.38: 6039-6048. [CrossRef]
- Hsu, C.Y.; Chiang, H.C.; Lin, S.L.; Chen, M.J.; Lin, T.Y.; Chen, Y.C. Elemental characterization and source apportionment of PM10 and PM2. 5 in the western coastal area of central Taiwan. Science of the Total Environment, 2016, 541: 1139-1150. [CrossRef]
- Braubach, M.; Jacobs, D.E.; Ormamdy, D. Environmental burden of disease associated with inadequate housing: a method guide to the quantification of health effects of selected housing risks in the WHO European Region. World Health Organization. Regional Office for Europe, 2011. https://iris.who.int/handle/10665/108587.
- Raw, M.; Anderson, P.; Batra, A.; Dubois, G.; Harrington, P.; Hirsch, A.; Houezec, J.L.; McNeill, A.; Milner, D.; Poetschke, L.; Zatonski, W. WHO Europe evidence based recommendations on the treatment of tobacco dependence. Tobacco control, 2002, 11.1: 44. www.tobaccocontrol.com. [CrossRef]
- Zhong, M.; Wang, T.; Zhao, W.; Huang, J.; Wang, B.; Blaney, L.; Bu, Q.; Yu, G. Emerging organic contaminants in Chinese surface water: identification of priority pollutants. Engineering, 2022, 11: 111-125. [CrossRef]
- Eom, S.Y.; Choi, J.H.; Bae, S.H.; Lim, J.A.; Kim, G.B.; Yu, S.D.; Kim, Y.H.; Lim, H.S.; Son, B.S.; Paek, D.Y.; Kim, Y.D.; Kim, H.; Ha, M.A.; Kwon, H.J. Health effects of environmental pollution in population living near industrial complex areas in Korea. Environmental health and toxicology, 2018, 33.1: e2018004. [CrossRef]
- Bae, S.H.; Kim, H.C.; Ye, B.j.; Choi, W.J.; Hong, Y.S.; Ha, M.A. Causal inference in environmental epidemiology. Environmental Health and Toxicology, 2017, 32: e2017015. [CrossRef]
- Kelly, F.J.; Fussell, J.C. Improving indoor air quality, health and performance within environments where people live, travel, learn and work. Atmospheric Environment, 2019, 200: 90-109. [CrossRef]
- Hooper, L.G.; Kaufman, J.D. Ambient air pollution and clinical implications for susceptible populations. Annals of the American Thoracic Society, 2018, 15: S64-S68. [CrossRef]
- O’Neill, M.S.; Breton, C.V.; Devlin, R.B.; Utell, M.J. Air pollution and health: emerging information on susceptible populations. Air Quality, Atmosphere & Health, 2012, 5: 189-201. [CrossRef]
- Bravo, M.A.; Son, J.; Freitas, C.U.; Gouveia, N.; Bell, M.L. Air pollution and mortality in São Paulo, Brazil: Effects of multiple pollutants and analysis of susceptible populations. Journal of exposure science & environmental epidemiology, 2016, 26.2: 150-161. [CrossRef]
- Lee, H.j.; Park, S.U.; Mayer, H.l. Statistical characteristics of air quality index DAQx*-specific air pollutants differentiated by types of air quality monitoring stations: a case study of Seoul, Republic of Korea. Sustainability, 2023, 15.11: 8599. [CrossRef]
- Hussam, A.; Alauddin, M.; Khan, A.H.; Chowdhury, D.; Bibi, H.; Bhattacharjee, M.; Sultana, S. Solid phase microextraction: measurement of volatile organic compounds (VOCs) in Dhaka city air pollution. Journal of Environmental Science and Health, Part A, 2002, 37.7: 1223-1239. [CrossRef]
- Brown, S.G., Eberly, S., Paatero, P., Norris, G.A. Methods for estimating uncertainty in PMF solutions: examples with ambient air and water quality data and guidance on reporting PMF results, Science of The Total Environment, 2015, 518: 626-635. [CrossRef]
- Baek, S.O.; Choi, J.S.; Hwang, S.M. A quantitative estimation of source contributions to the concentrations of atmospheric suspended particulate matter in urban, suburban, and industrial areas of Korea. Environment International, 1997, 23.2: 205-213. [CrossRef]
- Saraga, D.E.; Maggos, T.E.; Sfetsos, A.; Tolis, E.I.; Andronopoulos, S.; Bartzis, J.G.; Vasilakos, C. PAHs sources contribution to the air quality of an office environment: experimental results and receptor model (PMF) application. Air Quality, Atmosphere & Health, 2010, 3: 225-234. [CrossRef]
- Su, Y.C.; Chen, W.H.; Fan, C.L.; Tong, Y.H.; Weng, T.H.; Chen, S.P.; Kuo, C.P.; Wang, J.L.; Chang, J.S. Source apportionment of volatile organic compounds (VOCs) by positive matrix factorization (PMF) supported by model simulation and source markers using petrochemical emissions as a showcase. Environmental Pollution, 2019, 254: 112848. [CrossRef]
|
Disclaimer/Publisher’s Note: The statements, opinions and data contained in all publications are solely those of the individual author(s) and contributor(s) and not of MDPI and/or the editor(s). MDPI and/or the editor(s) disclaim responsibility for any injury to people or property resulting from any ideas, methods, instructions or products referred to in the content. |
© 2024 by the authors. Licensee MDPI, Basel, Switzerland. This article is an open access article distributed under the terms and conditions of the Creative Commons Attribution (CC BY) license (http://creativecommons.org/licenses/by/4.0/).