
Submitted:
10 May 2025
Posted:
12 May 2025
You are already at the latest version
Abstract
Background/Objectives: Children with congenital adrenal hyperplasia (CAH) face significant risks of impaired growth and metabolic disturbances despite standard glucocorticoid therapy. This cross-sectional study aimed to evaluate growth outcomes, nutritional status, and associated factors among children with CAH treated in a Viet-namese tertiary pediatric center. Methods: We assessed 201 children aged 1.1–16.5 years in a tertiary pediatric center in Vietnam for anthropometric parameters, biochemical markers (calcium, phosphate, 25-hydroxyvitamin D), and clinical features. Growth status was evaluated using WHO standards, and bone age was assessed radiographically. Statistical analyses explored associations between growth outcomes and clinical, bio-chemical, and treatment-related factors. Results: Stunting was present in 16.4% of chil-dren, while 53.3% were overweight or obese. Bone age advancement occurred in 51.7% of cases. Vitamin D insufficiency or deficiency was detected in 85.6%, and hypocalcemia in 95% of patients. Overweight/obesity, vitamin D deficiency, and bone age advancement were associated with older age, prolonged corticosteroid therapy, higher androgen levels, and clinical features of treatment imbalance (e.g., Cushingoid appearance, hyperpig-mentation). Female sex was significantly associated with higher rates of stunting. Con-clusions: Growth impairment, nutritional deficiencies, and skeletal maturation dis-turbances are prevalent among children with CAH in Vietnam. Early identification of risk factors and tailored management strategies addressing both endocrine and nutritional health are crucial for optimizing long-term outcomes.
Keywords:
congenital adrenal hyperplasia
; CAH
; growth
; bone age
; obesity
; vitamin D deficiency
; calcium deficiency
; Vietnamese children
; glucocorticoid treatment
1. Introduction
Congenital adrenal hyperplasia (CAH) represents a group of autosomal recessive disorders characterized by enzymatic deficiencies in adrenal steroid biosynthesis [1]. Among these, 21-hydroxylase deficiency, caused by mutations in the CYP21A2 gene, is the most prevalent, accounting for over 90% of cases globally [2]. This enzymatic defect disrupts cortisol and aldosterone production, leading to compensatory adrenocorticotropic hormone (ACTH) stimulation and excessive adrenal androgen secretion. As a result, affected children may exhibit clinical signs ranging from ambiguous genitalia at birth to early-onset puberty and metabolic disturbances [1].
The global incidence of CAH is estimated to range between 1 in 14,000 and 1 in 18,000 live births [3]. However, recent meta-analyses suggest that incidence rates may be increasing in certain populations, with reports as high as 1 in 9,498 births [4,5]. Notably, incidence varies by geographic region and ethnic group, with higher rates observed in the Eastern Mediterranean and Southeast Asian populations [5].
The clinical presentation of CAH in infancy and childhood varies by the severity of the enzyme defect [6]. Classic CAH, particularly the salt-wasting form, often manifests during the neonatal period with vomiting, dehydration, hypotension, and hypoglycemia—hallmarks of adrenal insufficiency. Girls with classic 21-hydroxylase deficiency present with ambiguous genitalia, whereas affected boys exhibit subtle signs such as hyperpigmentation and penile enlargement. Without adequate treatment, prolonged androgen exposure leads to rapid growth, early pubic hair, advanced bone age, and may trigger centrally mediated precocious puberty [2].
Beyond the endocrine abnormalities, CAH is increasingly recognized for its impact on somatic growth and nutritional health. A 2010 meta-analysis found that adult patients with CAH had a mean height approximately 10 cm below population norms, with a standard deviation score of −1.4 [7]. A 2018 study on children with congenital adrenal hyperplasia reported that 17.6% of patients were obese and 25.7% exhibited short stature [8]. Obesity is another common finding in pediatric CAH. Approximately one-third of children are overweight or obese, with prevalence increasing markedly by age four [9,10,11].
Micronutrient deficiencies—especially vitamin D—have emerged as prevalent issues in CAH. A 2012 study of 244 patients revealed that 61% had suboptimal vitamin D levels, potentially due to the effects of prolonged corticosteroid therapy [9].
These outcomes are driven by both the disease pathology and its treatment. Excess adrenal androgens can prematurely advance skeletal maturation, compromising final height despite transient increases in growth velocity during early childhood. Studies have shown that affected children, especially those with the classic form, are prone to short stature, obesity, and altered body composition [12,13,14].
Simultaneously, long-term glucocorticoid therapy—a mainstay in CAH management —can suppress growth hormone action and inhibit linear growth. Underdosing can lead to poor metabolic control, while overdosing increases the risk of growth failure, obesity, and long-term cardiometabolic complications, which become more pronounced in children undergoing treatment for more than five years [11,15,16,17,18]. Furthermore, corticosteroids are known to impair vitamin D metabolism by increasing 24-hydroxylase activity, which accelerates the degradation of 25(OH)D [19].
While international studies have highlighted the long-term health risks in CAH, research in some regions remains limited. In Vietnam, for example, few studies have comprehensively evaluated physical development and nutritional status in children with CAH. A study by Nguyen et al. found that early diagnosis and effective treatment adherence were critical to optimizing physical development in CAH children [20]. To our knowledge, this is the first study in Vietnam to simultaneously evaluate both growth development and nutritional status in children with CAH. Therefore, gaps remain regarding the long-term implications of glucocorticoid therapy on bone health, nutritional status, and growth outcomes, particularly in resource-limited settings.
This study aims to investigate the growth outcomes, nutritional indicators, and associated factors among 201 Vietnamese children with CAH at the Vietnam National Children’s Hospital.
2. Materials and Methods
2.1. Subjects
This cross-sectional descriptive study was conducted on children diagnosed with Congenital Adrenal Hyperplasia (CAH). Eligible participants were aged 1 to 17 years, in accordance with the WHO child age classification (WHO, 2006). All patients included had a confirmed diagnosis of CAH in accordance with the Endocrine Society Clinical Practice Guidelines (2018) [4] (see Supplementary Material 1) and had been undergoing treatment for at least 12 months.
Exclusion criteria included the presence of other chronic medical conditions or congenital malformations, such as congenital heart disease, epilepsy, or cancer.
The study was approved by the Institutional Review Board of Vietnam National Children's Hospital (protocol code 2685/BVNTW-HĐĐĐ, approved on 10 October 2024) in accordance with current legislation, the Declaration of Helsinki, and standards of good clinical practice. Informed consent was obtained from all parents or legal guardians of the children included in the study.
The study was conducted from July 2024 to April 2025 at the Center for Endocrinology, Metabolism, Genetics, and Molecular Therapy, Vietnam National Children’s Hospital.
2.2. Clinical and Biochemical Assessments
Clinical data were collected through structured interviews, clinical examinations, and retrospective medical record reviews.
In alignment with the 2018 Endocrine Society Clinical Practice Guidelines for the management of congenital adrenal hyperplasia [4], we evaluated clinically relevant variables reflecting both undertreatment and overtreatment. These included signs of inadequate androgen suppression, such as hyperpigmentation, virilization (clitoromegaly in females, penile enlargement in males, hirsutism, acne, and other manifestations of androgen excess), as well as signs of glucocorticoid excess, like Cushingoid features (weight gain, truncal obesity, moon facies, facial plethora) [21] or acanthosis nigricans. Clinical history of adrenal crises was not formally quantified due to the retrospective nature of data collection and the potential for recall bias. Precocious puberty is defined as the appearance of secondary sexual characteristics before age 8 in girls and before age 9 in boys [22]. The diagnosis was based on clinical signs such as breast development in girls or testicular volume ≥4 mL in boys, rapid height growth, and bone age advanced by more than two standard deviations [22,23,24,25,26,27]. A baseline LH >0.3 mIU/mL or stimulated peak LH >5 mIU/mL confirms CPP, while suppressed LH/FSH with elevated sex steroid levels indicates PPP [28,29,30,31,32,33]. Imaging studies (pelvic/testicular ultrasound, brain MRI) and hormone testing (estradiol, testosterone, 17-OHP) are used to confirm the diagnosis and assess underlying etiologies [30,32,34,35,36,37,38,39].
Anthropometric assessments included weight, length/height, and Body Mass Index (BMI), evaluated in accordance with the WHO Growth Standards (WHO 2006 for children under 5 years and WHO 2007 for those aged 5 years and older):
BMI: For children <5 years — severely thinness (<–3 SD), thinness (–3 to <–2 SD), normal (–2 to +2 SD), overweight (>+2 to +3 SD), obesity (>+3 SD); for children ≥5 years — severely thinness (<–3 SD), thinness (–3 to <–2 SD), normal (–2 to +1 SD), overweight (>+1 to +2 SD), obesity (>+2 SD).
Height-for-age z-score (HAZ): normal (HAZ ≥ –2 SD), stunted (HAZ < –2 SD), and severely stunted (HAZ < –3 SD).
Weight was measured using a digital scale and height or length was assessed using a stadiometer or recumbent length board depending on the child’s age and ability to stand.
Bone age was determined from standard radiographs of the left hand and wrist, performed at the Department of Diagnostic Imaging using the Carestream DRX1-System (Carestream Health, WA, USA). All images were interpreted by trained radiologists employing the Greulich and Pyle atlas. BA–CA Classification: Categorization of skeletal maturation based on the comparison between bone age (BA) and chronological age (CA), where BA > CA indicates advanced bone age, BA = CA indicates bone age matches chronological age, and BA < CA indicates delayed bone age.
Biochemical analyses included measurements of total serum calcium, ionized calcium, and serum phosphate, performed using colorimetric absorption methods on the Beckman Coulter AU5800 analyzer (Beckman Coulter, Tokyo, Japan). Serum 25-hydroxyvitamin D [25(OH)D] levels were determined by electrochemiluminescence immunoassay on the same analyzer. Serum 17-hydroxyprogesterone was quantified using a semi-automated ELISA on the Biotek system, and testosterone levels were measured via electrochemiluminescence immunoassay on the Cobas E601 analyzer (Roche Diagnostics). All laboratory analyses were conducted at the Biochemistry department. The reference ranges for each parameter were applied accordingly:
- 25-hydroxyvitamin D [25(OH)D]: deficiency: <50 nmol/L; insufficiency: 50–72.5 nmol/L [40].
- 17-hydroxyprogesterone (17-OHP) and testosterone levels were interpreted according to age- and sex-specific reference standards.
The following treatment-related variables were collected: type of glucocorticoid, current daily dose, dosing frequency, and duration of therapy. All glucocorticoid doses were standardized by converting to hydrocortisone equivalents, using the following conversion ratios: 1 mg prednisolone = 5 mg hydrocortisone, and 1 mg dexamethasone = 80 mg hydrocortisone) [19,44].
2.3. Data Analysis
All data were entered and processed using SPSS version 20.0 (IBM Corp., Armonk, NY, USA). The distribution of continuous variables was assessed using the Kolmogorov-Smirnov test, which is appropriate for sample sizes greater than 50. Continuous variables were presented as mean ± standard deviation (SD) if normally distributed, or as median (minimum-maximum) if non-normally distributed. Categorical variables were expressed as frequencies and percentages.
Comparisons between groups were conducted using the following statistical tests: Independent t-test and ANOVA for normally distributed continuous variables; Mann–Whitney U test and Kruskal–Wallis test for non-parametric variables; Chi-squared test and Fisher’s exact test for categorical variables depending on sample size. A p-value of <0.05 was considered statistically significant. Quality control measures included predefined inclusion/exclusion criteria, the use of standardized case report forms, and double data entry for validation. For variables with less than 20% missing data—including 17- hydroxyprogesterone (17OHP), ionized calcium, and the difference between bone age and chronological age (BA–CA)—missing values were imputed using the median of the respective variable. This approach was selected to preserve the distributional characteristics of non-normally distributed variables and to minimize potential bias. No variable exceeded the 20% missing data threshold that would require exclusion from analysis.
3. Results
3.1. Description of the Study Sample
A total of 201 children diagnosed with CAH were included in the study. The median age at valuation was 9.8 years, ranging from 1.1 to 16.5 years. Participants originated from 25 provinces across the Northern and Central regions of Vietnam (Figure 1). The geographic distribution analysis indicated regional variations in the number of reported CAH cases, with higher concentrations observed in certain provinces.
3.2. Growth Assessment and Nutritional Status
Anthropometric measurements revealed that the mean height standard deviation score (SDS) was −0.6 ± 1.4 and the mean body mass index (BMI) SDS was 1.2 ± 1.4. The mean difference between bone age and chronological age (BA–CA) was 1.4 ± 2.2 years, indicating a general trend toward advanced skeletal maturation. Among the 201 patients, 51.7% had advanced bone age (BA > CA), 38.3% had age-appropriate bone age (BA = CA), and 10.0% had delayed bone age (BA < CA). In terms of BMI, 1.5% were classified as thin, 45.3% had normal weight, 24.4% were overweight, and 28.9% were obese. Regarding height-for-age, 4.5% had severe stunting, 11.9% had moderate stunting, and 83.6% had normal stature. Vitamin D insufficiency or deficiency was observed in 85.6% of the sample, while 95% exhibited calcium deficiency. Among the 138 patients with available phosphate data, 19.6% were found to have phosphate deficiency (Figure 3). The baseline sociodemographic, clinical, biochemical, and anthropometric characteristics of the study population are presented in Table 1.
3.3. Sociodemographic Factors
3.3.1. Age
Age was significantly associated with several key study outcomes. Children with hypocalcemia, hypophosphatemia, vitamin D deficiency, advanced bone age (BA > CA), and higher BMI categories (overweight and obesity) were significantly older than their respective comparison groups (p < 0.001 for all). In contrast, no significant age differences were observed across height-for-age classifications (p = 0.183). The distribution of age across nutritional and biochemical outcomes is summarized in Table 2.
3.3.2. Gender Differences
Gender-specific differences were observed in growth parameters among children with CAH. Both hypocalcemia and hypophosphatemia were highly prevalent in males and females, with no statistically significant differences between sexes (p = 0.334 and p = 0.963, respectively). Similarly, vitamin D status did not differ significantly by gender (p = 0.875).
With regard to nutritional status, obesity was more frequently observed in males than in females (35.1% vs. 23.1%), though this difference was not statistically significant (p = 0.151), showing a trend toward significance (p = 0.057). In contrast, stunting was significantly more common among females, with 23.1% exhibiting moderate to severe stunting compared to 9.3% of males (p = 0.003).
Regarding bone age, delayed maturation tended to be more frequent in females (13.5% vs. 6.2%), though the difference did not reach statistical significance (p = 0.163).
3.3.3. Residential Area
No significant differences were observed in the prevalence of hypocalcemia and hypophosphatemia between urban and rural children (p = 0.343 and p = 0.358, respectively). Vitamin D deficiency was more prevalent among urban children (28.6%) compared to their rural counterparts (16.9%), although the difference was not statistically significant (p = 0.104).
Similarly, the combined prevalence of overweight and obesity was higher in urban areas (59.8% combined) than in rural areas (49.4%), but the difference did not reach statistical significance (p = 0.093). No significant differences were found between urban and rural groups in height-for-age classification (p = 0.218) or patterns of bone age advancement (p = 0.956).
3.4. Disease-Related Factors
3.4.1. Clinical Phenotype
No significant differences were observed between salt-wasting and simple virilizing forms in the prevalence of hypocalcemia (p = 0.691), vitamin D status (p = 0.337), BMI classification (p = 0.796), or height-for-age classification (p = 0.203). In contrast, hypophosphatemia was significantly more prevalent in children with the simple virilizing form compared to those with the salt-wasting form (40.7% vs. 14.4%, p = 0.002). Moreover, bone age advancement was substantially more frequent in the simple virilizing group, with 82.9% showing advanced bone age versus 43.8% in the salt-wasting group (p < 0.001).
3.4.2. Clinical Disease Control Indicators
Obesity was significantly more prevalent among children with Cushingoid features (41.2% vs. 27.7%, p = 0.001) and among those with acanthosis nigricans (80.0% vs. 24.7%, p < 0.001) compared to their respective counterparts. Children with hyperpigmentation also demonstrated higher rates of hypophosphatemia (30.0% vs. 15.3%, p = 0.048) and obesity (40.0% vs. 25.2%, p = 0.045), as well as more frequent bone age advancement (70.0% vs. 45.7%, p = 0.005).
Similarly, bone age advancement was more prevalent in children with virilization (77.4% vs. 47.1%, p = 0.004) and those with central precocious puberty (80.9% vs. 42.9%, p < 0.001). No significant differences were found in hypocalcemia, vitamin D status, height-for-age classification, or BMI classification (except for obesity) among the assessed clinical subgroups (Table 3).
3.4.3. Biochemical Markers
Median 17-hydroxyprogesterone (17-OHP) levels were higher in children with hypocalcemia (53.0 nmol/L) than in those without hypocalcemia (13.3 nmol/L), although this difference approached but did not reach statistical significance (p = 0.051). In contrast, median testosterone concentrations were significantly elevated in the hypocalcemia group ( 0.24 nmol/L) compared to the non-hypocalcemia group (0.09 nmol/L, p = 0.006).
With regard to hypophosphatemia, median 17-OHP levels were comparable between affected and unffected children (47.8 vs. 55.1 nmol/L, p = 0.641). Although children with hypophosphatemia exhibited higher median testosterone levels (0.78 vs. 0.24 nmol/L), the difference did not reach statistical significance (p = 0.065).
Testosterone levels also varied significantly by vitamin D status (p = 0.027), with lower median concentrations observed in children with normal vitamin D levels (0.09 nmol/L) compared to those with deficiency or insufficiency (both 0.24 nmol/L). In contrast, median 17-OHP levels did not differ significantly across vitamin D categories: 55.8 nmol/L in the deficient group, 52.35 nmol/L in the insufficiency group, and 31.3 nmol/L in the normal group (p = 0.317).
Regarding growth parameters, 17-OHP levels differed significantly across BMI categories (p = 0.014), with the highest median concentration observed in children with obesity (107.5 nmol/L). In contrast, testosterone levels did not significantly vary by BMI classification (p = 0.083).
In relation to height-for-age, children with severe stunting showed a trend toward lower testosterone levels (median 0.09 nmol/L) compared to those with moderate stunting or normal status (both 0.24 nmol/L), although the difference did not reach statistical significance (p = 0.053). No significant differences were observed in 17-OHP levels across height-for-age groups (p = 0.131).
Bone age advancement was significantly associated with hormonal levels. Children with advanced bone age (BA>CA) had the highest median testosterone (0.78 nmol/l, p < 0.001) and 17-OHP levels (69.6 nmol/L, p=0.005) compared to those whose BA was equal to or less than their chronological age.
3.5. Treatment-Related Factors
Children with hypocalcemia had a significantly longer duration of corticosteroid therapy compared to those without hypocalcemia (median 8.7 vs. 1.6 years, p < 0.001). Similarly, children with hypophosphatemia had a longer treatment duration than those without this condition (median 11.5 vs. 6.9 years, p = 0.010). Duration of corticosteroid therapy also varied significantly by vitamin D status (p = 0.007), with the longest median duration observed in the vitamin D deficiency group (9.7 years), followed by the insufficiency group (8.5 years) and the normal vitamin D group (5.3 years).
Regarding growth and nutritional parameters, corticosteroid treatment duration differed significantly across BMI categories (p < 0.001), with children classified obese (median 10.1 years) and overweight (median 9.1 years) receiving longer treatment than those with normal BMI (median 5.8 years) or thinness (median 2.5 years). No significant differences in treatment duration were observed across height-for-age classifications (p = 0.108). In contrast, children with advanced bone age (BA > CA) had a significantly longer treatment duration (median 10.2 years) compared to those with BA equal to or less than chronological age (5.8 and 4.6 years, respectively; p < 0.001). These associations between glucocorticoid treatment duration and growth or nutritional parameters are summarized in Table 4.
3.6. Associations between Subclinical Nutritional and Growth Outcomes
In the BA-CA classification groups, hypocalcemia was significantly more prevalent among children with advanced bone age compared to those with bone age equal to or less than chronological age (100% vs. 89.6% and 90.0%, p = 0.001). Vitamin D deficiency was also more frequent in the advanced bone age group (26.9%) than in those with bone age equal to (19.5%) or delayed relative to chronological age (20.0%). This trend was statistically significant as confirmed by linear-by-linear association (p = 0.036). Although hypophosphatemia was more common in the advanced bone age group (24.6%), the difference did not reach statistical significance.
When stratified by height-for-age categories, no significant differences were observed in the prevalence of hypocalcemia, hypophosphatemia, or vitamin D status.. However, analysis by BMI classification revealed a significantly higher prevalence of hypocalcemia among overweight and obese children compared to those with normal BMI or thinness (p = 0.011). The distribution of vitamin D status across BMI categories showed a trend toward significance (p = 0.063) and a significant linear association (p = 0.012); vitamin D deficiency was more common in overweight (29.3%) and obese children ( 30.6%) than in those with normal weight (16.5%). No significant association was found between BMI classification and hypophosphatemia (p = 0.349). Children with hypocalcemia had a significantly different distribution of vitamin D status compared to those without hypocalcemia (p = 0.027), characterized by a higher prevalence of vitamin D deficiency (24.6% vs. 0%) and a lower proportion of normal vitamin D status (13.1% vs. 40%).
4. Discussion
This study provides a detailed clinical and biochemical profile of 201 Vietnamese children with congenital adrenal hyperplasia (CAH), highlighting growth impairment, skeletal maturation disturbances, nutritional deficits, and treatment-related effects. Our findings are generally consistent with international literature while offering novel insights from a Southeast Asian context.
4.1. Growth and nutritional outcome
In our study, the mean height standard deviation score (SDS) was −0.6 ± 1.4, and 16.4% of participants were classified as stunted (11.9% moderate, 4.5% severe), with significantly higher rates among females (23.1%) than males (9.3%). This aligns with previous findings, where Muthusamy et al. reported a pooled mean height SDS of −1.03 in a meta-analysis [7], and Gidlöf et al. found a final height SDS of −0.78 in a large European registry [45]. Moreover, studies have indicated that during adrenarche and early puberty, children with CAH may initially appear taller compared to their peers due to accelerated skeletal maturation, but ultimately achieve a lower final adult height if skeletal advancement persists [46]. In our study, although early bone age advancement was common (51.7%), this did not necessarily translate into preserved final height, emphasizing the need for careful longitudinal growth monitoring.
Overweight and obesity were highly prevalent in our cohort, with 24.4% classified as overweight and 28.9% as obese, totaling 53.3%, similar to rates reported by Abdel Meguid et al., who observed a 60% prevalence among Egyptian CAH children [17]. This is notably higher than the 16.5% prevalence found by Völkl et al. in a German cohort [47], possibly reflecting differences in genetic background, treatment regimens, or lifestyle factors. Importantly, we found that obesity was more frequent in males (35.1%) than in females (23.1%), and increased significantly with age (median age of obese children: 10.5 years, p < 0.001), which supports the findings of Gidlöf et al. [45]. The pathophysiological mechanisms underlying obesity in CAH are multifactorial, including supraphysiological glucocorticoid exposure leading to central adiposity [48], altered insulin sensitivity [49], and the anabolic effects of chronic hyperandrogenism [50].
Skeletal maturation disturbances were also prominent. In our study, 51.7% of patients had advanced bone age, and this was more common in the simple virilizing form (82.9%) compared to the salt-wasting form (43.8%, p < 0.001), consistent with findings by Bomberg et al. [51]. Furthermore, we found that children with advanced bone age exhibited higher median testosterone and 17-OHP levels. This observation is supported by Finkielstain et al., who reported a significant correlation between bone age advancement and elevated androstenedione and testosterone concentrations [9]. Such findings reflect the pathophysiological mechanism of chronic ACTH stimulation leading to excess adrenal androgen production, promoting premature epiphyseal fusion and compromised linear growth potential.
Vitamin D insufficiency or deficiency and hypocalcemia were pervasive, affecting 85.6% and 95% of our patients, respectively. This mirrors the high prevalence of vitamin D insufficiency (74.9%) reported by Demirel et al. in CAH children [52], and aligns with findings by Finkielstain et al., who noted that 19% of classic CAH patients were vitamin D deficient and 42% were insufficient [9]. A Vietnamese pediatric study found that up to 90% of children were vitamin D insufficient under liberal thresholds [53], suggesting that broader environmental factors, such as reduced sun exposure and dietary insufficiencies, may also contribute. Additionally, vitamin D deficiency increased with age and BMI, being more prevalent in older children (10.3 vs. 5.6 years, p = 0.001) and those with obesity (29.3% vs. 16.5%, p = 0.012), consistent with patterns in steroid-treated pediatric populations [37].
4.2. Related factors
Prolonged corticosteroid therapy was found to have a significant impact on growth and metabolic outcomes in children with CAH. In our study, children with obesity had a longer median treatment duration (10.1 years) compared to those with normal BMI (5.8 years, p < 0.001), and children with hypocalcemia had received corticosteroids for a median of 8.7 years, compared to 1.6 years for those without (p < 0.001). Additionally, corticosteroid duration varied significantly with vitamin D status (p = 0.007), being longest in children with deficiency (9.7 years) and shortest in those with normal levels (5.3 years). These findings are consistent with previous studies. Abdel Meguid et al. reported that children who had been treated with corticosteroids for more than five years exhibited a markedly higher prevalence of overweight and obesity, reaching 60% [17]. Similarly, Finkielstain et al. observed that 35% of children with CAH were obese, with a higher proportion receiving long-acting glucocorticoid formulations compared to non-obese peers [9]. In addition to its impact on body composition, corticosteroid therapy adversely affected linear growth. Stikkelbroeck et al. demonstrated that higher cumulative glucocorticoid doses were significantly associated with reduced height-for-age z-scores (HAZ) during critical periods of growth, specifically between 6–12 months and 8–14 years of age [54]. These findings support the well-established notion that supraphysiological glucocorticoid exposure suppresses chondrocyte proliferation and disrupts the growth plate, ultimately impairing linear growth potential. Moreover, corticosteroid use was associated with disturbances in vitamin D metabolism. Demirel et al. reported that children receiving supraphysiological steroid doses (>15 mg/m²/day) exhibited lower serum 25-hydroxyvitamin D levels compared to those on physiological doses, although the difference did not reach statistical significance [52]. These findings suggest that glucocorticoid therapy may contribute to impaired vitamin D status through indirect mechanisms, thereby exacerbating the risk of bone mineral disturbances and hypocalcemia observed in CAH patients.
Higher BMI categories were significantly associated with greater vitamin D deficiency in this study. Among obese children, the deficiency rate was 29.3%, compared to 16.5% in those with normal BMI, with a significant linear trend across BMI classifications (p = 0.012). The proportion of vitamin D sufficiency was also lower in obese participants (10.3%) than in their normal-weight peers (22%), reinforcing the link between adiposity and impaired vitamin D status. These findings are consistent with those of Demirel et al., who reported that children with higher BMI tended to have lower 25-hydroxyvitamin D concentrations, although the association did not reach statistical significance [52]. This relationship is biologically plausible, given that vitamin D, as a fat-soluble vitamin, may be sequestered in adipose tissue, thereby reducing its circulating bioavailability [55]. Consequently, children with higher BMI may be at greater risk for hypovitaminosis D, compounding the nutritional and skeletal challenges already faced by CAH patients.
Among our patients, elevated 17-hydroxyprogesterone (17-OHP) and testosterone levels were significantly associated with adverse growth and skeletal outcomes. Median 17-OHP was higher in children with hypocalcemia (53.0 vs. 13.3 nmol/L, p = 0.051) and obesity (107.5 nmol/L in obese children, p = 0.014). Testosterone was significantly higher in those with hypocalcemia (p = 0.006), vitamin D deficiency (p = 0.027), and advanced bone age (p < 0.001). These findings reflect the impact of poor biochemical control on mineral metabolism, body composition, and skeletal maturation. Children with advanced bone age exhibited the highest median 17-OHP and testosterone levels, reinforcing the contribution of androgen excess to accelerated skeletal development. This is consistent with prior studies, where elevated 17-OHP concentrations (>30 nmol/L) during adrenarche were associated with lower estimated final height [46], and testosterone elevations were significantly linked to bone age advancement [9]. Although children with central precocious puberty (CPP) demonstrated higher testosterone concentrations, this was not associated with significant height impairment at the time of evaluation in our cohort.
In our cohort, several clinical features demonstrated significant associations with adverse growth and nutritional outcomes. Cushingoid appearance and acanthosis nigricans were strongly associated with higher BMI classifications, reflecting the impact of chronic glucocorticoid excess and consequent insulin resistance. Hyperpigmentation was associated with both a higher prevalence of hypophosphatemia and increased rates of overweight and obesity, suggesting that chronic ACTH elevation may exacerbate systemic metabolic disturbances. Among undertreatment indicators, virilization correlated significantly with advanced bone age classification, consistent with the effect of androgen excess on premature skeletal maturation. Although children with CPP demonstrated elevated androgen levels, no significant differences in height status were observed. These findings highlight the clinical relevance of treatment imbalance manifestations in predicting growth, skeletal, and metabolic risks in pediatric CAH.
Our findings complement earlier Vietnamese studies. Nguyen et al. [20] in a study of 124 pediatric CAH patients, found that early diagnosis, sufficient steroid dosing, and treatment adherence were key to good treatment outcomes. However, their study did not include biochemical or nutritional indicators [18].
Limitations of this study include its cross-sectional design, which precludes causal inference, and the absence of bone mineral density assessments, genotypic data, and lipid or insulin profiling. Additionally, pubertal development was not assessed using Tanner staging, limiting the ability to precisely interpret hormone levels and skeletal maturation in relation to pubertal status. Although we evaluated biochemical markers of nutritional status, dietary intake data—such as food frequency questionnaires or detailed nutrient intake records—were not collected, restricting our ability to directly correlate micronutrient deficiencies with dietary patterns. Phosphate measurements were available in a subset of patients, limiting statistical power for analyses involving phosphate deficiency. While this did not affect the main study objectives, results related to phosphate status should be interpreted with caution. Future research should incorporate standardized pubertal staging, quantitative dietary assessments, and behavioral evaluations to more comprehensively identify nutritional determinants in children with CAH and better characterize their long-term metabolic risk. Nonetheless, the study’s large sample size, integrated clinical and hormonal data, and inclusion of both urban and rural populations provide valuable insight into CAH management in resource-constrained settings.
6. Conclusions
In a Vietnamese pediatric cohort with congenital adrenal hyperplasia, we identified a high prevalence of overweight/obesity, vitamin D deficiency, hypocalcemia, and advanced bone age, despite standard treatment. Significant associations were found between adverse outcomes and clinical indicators of treatment imbalance, androgen excess, prolonged corticosteroid exposure, and residential area. These findings reflect not only disease-specific challenges but also broader nutritional and healthcare disparities within the Vietnamese context. Our results underscore the urgent need for individualized, comprehensive management strategies that address both endocrine control and nutritional status to improve long-term health outcomes in this population.
Author Contributions
Conceptualization, T.T.H.N. and C.D.V.; methodology, T.T.H.N., K.M.L., T.A.T.T. and C.D.V.; software, T.T.H.N., K.M.L. and T.D.T..; validation, T.T.H.N., K.N.N. and P.T.B.; formal analysis, T.T.H.N., K.M.L. and T.D.T.; investigation, T.T.H.N., K.M.L. and T.B.N.C.; data curation, T.T.H.N., P.T.B., T.B.N.C. and K.N.N.; writing—original draft preparation, T.T.H.N., K.M.L., and T.A.T.T.; writing—review and editing, T.T.H.N., K.M.L., T.A.T.T., K.N.N., T.B.N.C., P.T.B. and C.D.V.; visualization, T.T.H.N. and K.M.L.; supervision, C.D.V. All authors have read and agreed to the published version of the manuscript.
Funding
This research received no external funding.
Institutional Review Board Statement
The study was conducted in accordance with the Declaration of Helsinki, and approved by the Institutional Review Board National Children’s Hospital (protocol code 2685/BVNTW-HĐĐĐ, on 10 October 2024).
Informed Consent Statement
Informed consent was obtained from all subjects involved in the study.
Data Availability Statement
The original contributions presented in this study are included in the
article. Further inquiries can be directed to the corresponding authors.
Acknowledgments
The authors would like to thank the staff of the Center for Endocrinology, Metabolism, Genetics, and Molecular Therapy at Vietnam National Children’s Hospital for their support in data collection. The authors also acknowledge the families who participated in this study.
Conflicts of Interest
The authors declare no conflicts of interest.
Abbreviations
The following abbreviations are used in this manuscript:
| ACTH | Adrenocorticotropic Hormone |
| BA | Bone Age |
| BMI | Body Mass Index |
| CA | Chronological Age |
| CAH | Congenital Adrenal Hyperplasia |
| CPP | Central Precocious Puberty |
| ELISA | Enzyme-Linked Immunosorbent Assay |
| HAZ | Height-for-age |
| SD | Standard Deviation |
| SDS | Standard Deviation Score |
| SV | Simple-Virilizing |
| SW | Salt-Wasting |
| WHO | World Health Organization |
| 17OHP | 17-Hydroxyprogesterone |
| 25(OH)D | 25-Hydroxyvitamin D |
References
- Speiser, P.W.; Azziz, R.; Baskin, L.S.; Ghizzoni, L.; Hensle, T.W.; Merke, D.P.; Meyer-Bahlburg, H.F.L.; Miller, W.L.; Montori, V.M.; Oberfield, S.E.; et al. Congenital Adrenal Hyperplasia Due to Steroid 21-Hydroxylase Deficiency: An Endocrine Society Clinical Practice Guideline. J. Clin. Endocrinol. Metab. 2010, 95, 4133–4160. [Google Scholar] [CrossRef] [PubMed]
- Speiser, P.W.; White, P.C. Congenital Adrenal Hyperplasia. N. Engl. J. Med. 2003, 349, 776–788. [Google Scholar] [CrossRef] [PubMed]
- L. Gruñeiro-Papendieek; A. Chiesa; V. Mendez; L. Prieto Neonatal Screening for Congenital Adrenal Hyperplasia: Experience and Results in Argentina. J. Pediatr. Endocrinol. Metab. 2008, 21, 73–78. [Google Scholar] [CrossRef]
- Speiser, P.W.; Arlt, W.; Auchus, R.J.; Baskin, L.S.; Conway, G.S.; Merke, D.P.; Meyer-Bahlburg, H.F.L.; Miller, W.L.; Murad, M.H.; Oberfield, S.E.; et al. Congenital Adrenal Hyperplasia Due to Steroid 21-Hydroxylase Deficiency: An Endocrine Society* Clinical Practice Guideline. J. Clin. Endocrinol. Metab. 2018, 103, 4043–4088. [Google Scholar] [CrossRef]
- Navarro-Zambrana, A.N.; Sheets, L.R. Ethnic and National Differences in Congenital Adrenal Hyperplasia Incidence: A Systematic Review and Meta-Analysis. Horm. Res. Paediatr. 2023, 96, 249–258. [Google Scholar] [CrossRef]
- Sharma, L.; Momodu, I.I.; Singh, G. Congenital Adrenal Hyperplasia. In StatPearls; StatPearls Publishing: Treasure Island (FL), 2025. [Google Scholar]
- Muthusamy, K.; Elamin, M.B.; Smushkin, G.; Murad, M.H.; Lampropulos, J.F.; Elamin, K.B.; Abu Elnour, N.O.; Gallegos-Orozco, J.F.; Fatourechi, M.M.; Agrwal, N.; et al. Adult Height in Patients with Congenital Adrenal Hyperplasia: A Systematic Review and Metaanalysis. J. Clin. Endocrinol. Metab. 2010, 95, 4161–4172. [Google Scholar] [CrossRef]
- Alzanbagi, M.A.; Milyani, A.A.; Al-Agha, A.E. Growth Characteristics in Children with Congenital Adrenal Hyperplasia. Saudi Med. J. 2018, 39, 674–678. [Google Scholar] [CrossRef]
- Finkielstain, G.P.; Kim, M.S.; Sinaii, N.; Nishitani, M.; Van Ryzin, C.; Hill, S.C.; Reynolds, J.C.; Hanna, R.M.; Merke, D.P. Clinical Characteristics of a Cohort of 244 Patients with Congenital Adrenal Hyperplasia. J. Clin. Endocrinol. Metab. 2012, 97, 4429–4438. [Google Scholar] [CrossRef]
- Huang, M.; Ma, H.; Du, M.; Chen, H.; Li, Y.; Chen, Q.; Zhang, J.; Guo, S. Metabolic Status in Children with Classic Congenital Adrenal Hyperplasia Due to 21-Hydroxylase Deficiency. In Proceedings of the ESPE Abstracts; Bioscientifica, August 25 2023; Vol. 97. [Google Scholar]
- Bonfig, W.; Dalla Pozza, S.B.; Schmidt, H.; Pagel, P.; Knorr, D.; Schwarz, H.P. Hydrocortisone Dosing during Puberty in Patients with Classical Congenital Adrenal Hyperplasia: An Evidence-Based Recommendation. J. Clin. Endocrinol. Metab. 2009, 94, 3882–3888. [Google Scholar] [CrossRef]
- Merke, D.P.; Auchus, R.J. Congenital Adrenal Hyperplasia Due to 21-Hydroxylase Deficiency. N. Engl. J. Med. 2020, 383, 1248–1261. [Google Scholar] [CrossRef]
- Halper, A.; Sanchez, B.; Hodges, J.S.; Kelly, A.S.; Dengel, D.; Nathan, B.M.; Petryk, A.; Sarafoglou, K. Bone Mineral Density and Body Composition in Children with Congenital Adrenal Hyperplasia. Clin. Endocrinol. (Oxf.) 2018, 88, 813–819. [Google Scholar] [CrossRef] [PubMed]
- Nicolaides, N.C.; Charmandari, E. Chrousos Syndrome: From Molecular Pathogenesis to Therapeutic Management. Eur. J. Clin. Invest. 2015, 45, 504–514. [Google Scholar] [CrossRef] [PubMed]
- Balsamo, A.; Cicognani, A.; Baldazzi, L.; Barbaro, M.; Baronio, F.; Gennari, M.; Bal, M.; Cassio, A.; Kontaxaki, K.; Cacciari, E. CYP21 Genotype, Adult Height, and Pubertal Development in 55 Patients Treated for 21-Hydroxylase Deficiency. J. Clin. Endocrinol. Metab. 2003, 88, 5680–5688. [Google Scholar] [CrossRef] [PubMed]
- Stikkelbroeck, N.M.M.L.; Van’T Hof-Grootenboer, B.A.E.; Hermus, A.R.M.M.; Otten, B.J.; Van’T Hof, M.A. Growth Inhibition by Glucocorticoid Treatment in Salt Wasting 21-Hydroxylase Deficiency: In Early Infancy and (Pre)Puberty. J. Clin. Endocrinol. Metab. 2003, 88, 3525–3530. [Google Scholar] [CrossRef]
- Abdel Meguid, S.E.; Soliman, A.T.; De Sanctis, V.; Abougabal, A.M.S.; Ramadan, M.A.E.F.; Hassan, M.; Hamed, N.; Ahmed, S. Growth and Metabolic Syndrome (MetS) Criteria in Young Children with Classic Congenital Adrenal Hyperplasia (CAH) Treated with Corticosteroids (CS). Acta Bio-Medica Atenei Parm. 2022, 93, e2022304. [Google Scholar] [CrossRef]
- Nimkarn, S.; Lin-Su, K.; New, M.I. Steroid 21 Hydroxylase Deficiency Congenital Adrenal Hyperplasia. Pediatr. Clin. North Am. 2011, 58, 1281–1300. [Google Scholar] [CrossRef]
- Kurahashi, I.; Matsunuma, A.; Kawane, T.; Abe, M.; Horiuchi, N. Dexamethasone Enhances Vitamin D-24-Hydroxylase Expression in Osteoblastic (UMR-106) and Renal (LLC-PK1) Cells Treated with 1α,25-Dihydroxyvitamin D3. Endocrine 2002, 17, 109–118. [Google Scholar] [CrossRef]
- Nguyen, T.G.; Nguyen, P.D. Treatment Outcome and Some Affecting Factors of Congenital Adrenal Hyperplasia. J. Med. Res. 2011, 74, 102–106. [Google Scholar]
- Nieman, L.K.; Biller, B.M.K.; Findling, J.W.; Newell-Price, J.; Savage, M.O.; Stewart, P.M.; Montori, V.M. The Diagnosis of Cushing’s Syndrome: An Endocrine Society Clinical Practice Guideline. J. Clin. Endocrinol. Metab. 2008, 93, 1526–1540. [Google Scholar] [CrossRef]
- Brito, V.N.; Spinola-Castro, A.M.; Kochi, C.; Kopacek, C.; Silva, P.C.A. da; Guerra-Júnior, G. Central Precocious Puberty: Revisiting the Diagnosis and Therapeutic Management. Arch. Endocrinol. Metab. 2016, 60, 163–172. [Google Scholar] [CrossRef]
- Jørgensen, A.; Rajpert-De Meyts, E. Regulation of Meiotic Entry and Gonadal Sex Differentiation in the Human: Normal and Disrupted Signaling. Biomol. Concepts 2014, 5, 331–341. [Google Scholar] [CrossRef]
- Perluigi, M.; Di Domenico, F.; Buttterfield, D.A. Unraveling the Complexity of Neurodegeneration in Brains of Subjects with Down Syndrome: Insights from Proteomics. Proteomics Clin. Appl. 2014, 8, 73–85. [Google Scholar] [CrossRef] [PubMed]
- Avramis, V.I.; Sencer, S.; Periclou, A.P.; Sather, H.; Bostrom, B.C.; Cohen, L.J.; Ettinger, A.G.; Ettinger, L.J.; Franklin, J.; Gaynon, P.S.; et al. A Randomized Comparison of nativeEscherichia Coli Asparaginase and Polyethylene Glycol Conjugated Asparaginase for Treatment of Children with Newly Diagnosed Standard-Risk Acute Lymphoblastic Leukemia: A Children’s Cancer Group Study. Blood 2002, 99, 1986–1994. [Google Scholar] [CrossRef] [PubMed]
- Korkmaz, O.; Sari, G.; Mecidov, I.; Ozen, S.; Goksen, D.; Darcan, S. The Gonadotropin-Releasing Hormone Analogue Therapy May Not Impact Final Height in Precocious Puberty of Girls With Onset of Puberty Aged 6 - 8 Years. J. Clin. Med. Res. 2019, 11, 133–136. [Google Scholar] [CrossRef]
- Macedo, D.B.; Cukier, P.; Mendonca, B.B.; Latronico, A.C.; Brito, V.N. [Advances in the etiology, diagnosis and treatment of central precocious puberty]. Arq. Bras. Endocrinol. Metabol. 2014, 58, 108–117. [Google Scholar] [CrossRef]
- Chaudhary, S.; Walia, R.; Bhansali, A.; Dayal, D.; Sachdeva, N.; Singh, T.; Bhadada, S.K. FSH-Stimulated Inhibin B (FSH-iB): A Novel Marker for the Accurate Prediction of Pubertal Outcome in Delayed Puberty. J. Clin. Endocrinol. Metab. 2021, 106, e3495–e3505. [Google Scholar] [CrossRef]
- Soriano-Guillén, L.; Argente, J. [Central precocious puberty: epidemiology, etiology, diagnosis and treatment]. An. Pediatr. Barc. Spain 2003 2011, 74, 336.e1–336.e13. [Google Scholar] [CrossRef]
- Tomlinson, C.; Macintyre, H.; Dorrian, C.; Ahmed, S.; Wallace, A. Testosterone Measurements in Early Infancy. Arch. Dis. Child. Fetal Neonatal Ed. 2004, 89, F558–F559. [Google Scholar] [CrossRef]
- Johannsen, T.H.; Main, K.M.; Ljubicic, M.L.; Jensen, T.K.; Andersen, H.R.; Andersen, M.S.; Petersen, J.H.; Andersson, A.-M.; Juul, A. Sex Differences in Reproductive Hormones During Mini-Puberty in Infants With Normal and Disordered Sex Development. J. Clin. Endocrinol. Metab. 2018, 103, 3028–3037. [Google Scholar] [CrossRef]
- Alotaibi, M.F. Physiology of Puberty in Boys and Girls and Pathological Disorders Affecting Its Onset. J. Adolesc. 2019, 71, 63–71. [Google Scholar] [CrossRef]
- Koskenniemi, J.J.; Virtanen, H.E.; Toppari, J. Testicular Growth and Development in Puberty. Curr. Opin. Endocrinol. Diabetes Obes. 2017, 24, 215–224. [Google Scholar] [CrossRef] [PubMed]
- Sultan, C.; Gaspari, L.; Maimoun, L.; Kalfa, N.; Paris, F. Disorders of Puberty. Best Pract. Res. Clin. Obstet. Gynaecol. 2018, 48, 62–89. [Google Scholar] [CrossRef] [PubMed]
- Muerköster, A.-P.; Frederiksen, H.; Juul, A.; Andersson, A.-M.; Jensen, R.C.; Glintborg, D.; Kyhl, H.B.; Andersen, M.S.; Timmermann, C.A.G.; Jensen, T.K. Maternal Phthalate Exposure Associated with Decreased Testosterone/LH Ratio in Male Offspring during Mini-Puberty. Odense Child Cohort. Environ. Int. 2020, 144, 106025. [Google Scholar] [CrossRef] [PubMed]
- Latronico, A.C.; Brito, V.N.; Carel, J.-C. Causes, Diagnosis, and Treatment of Central Precocious Puberty. Lancet Diabetes Endocrinol. 2016, 4, 265–274. [Google Scholar] [CrossRef]
- Willemsen, R.H.; Elleri, D.; Williams, R.M.; Ong, K.K.; Dunger, D.B. Pros and Cons of GnRHa Treatment for Early Puberty in Girls. Nat. Rev. Endocrinol. 2014, 10, 352–363. [Google Scholar] [CrossRef]
- Spaziani, M.; Lecis, C.; Tarantino, C.; Sbardella, E.; Pozza, C.; Gianfrilli, D. The Role of Scrotal Ultrasonography from Infancy to Puberty. Andrology 2021, 9, 1306–1321. [Google Scholar] [CrossRef]
- Lloyd, C.; McHugh, K. The Role of Radiology in Head and Neck Tumours in Children. Cancer Imaging Off. Publ. Int. Cancer Imaging Soc. 2010, 10, 49–61. [Google Scholar] [CrossRef]
- Holick, M.F.; Binkley, N.C.; Bischoff-Ferrari, H.A.; Gordon, C.M.; Hanley, D.A.; Heaney, R.P.; Murad, M.H.; Weaver, C.M. Evaluation, Treatment, and Prevention of Vitamin D Deficiency: An Endocrine Society Clinical Practice Guideline. J. Clin. Endocrinol. Metab. 2011, 96, 1911–1930. [Google Scholar] [CrossRef]
- Zhou, P.; Markowitz, M. Hypocalcemia in Infants and Children. Pediatr. Rev. 2009, 30, 190–192. [Google Scholar] [CrossRef]
- Egi, M.; Kim, I.; Nichol, A.; Stachowski, E.; French, C.J.; Hart, G.K.; Hegarty, C.; Bailey, M.; Bellomo, R. Ionized Calcium Concentration and Outcome in Critical Illness*. Crit. Care Med. 2011, 39, 314. [Google Scholar] [CrossRef]
- Mittal, K. Phosphate. J. Pediatr. Crit. Care 2019, 6, 61. [Google Scholar] [CrossRef]
- Hindmarsh, P.C. Management of the Child with Congenital Adrenal Hyperplasia. Best Pract. Res. Clin. Endocrinol. Metab. 2009, 23, 193–208. [Google Scholar] [CrossRef] [PubMed]
- Gidlöf, S.; Hogling, D.E.; Lönnberg, H.; Ritzén, M.; Lajic, S.; Nordenström, A. Growth and Treatment in Congenital Adrenal Hyperplasia: An Observational Study from Diagnosis to Final Height. Horm. Res. Paediatr. 2023, 1–11. [Google Scholar] [CrossRef]
- Troger, T.; Sommer, G.; Lang-Muritano, M.; Konrad, D.; Kuhlmann, B.; Zumsteg, U.; Flück, C.E. Characteristics of Growth in Children With Classic Congenital Adrenal Hyperplasia Due to 21-Hydroxylase Deficiency During Adrenarche and Beyond. J. Clin. Endocrinol. Metab. 2022, 107, e487–e499. [Google Scholar] [CrossRef]
- Völkl, T.M.K.; Simm, D.; Beier, C.; Dörr, H.G. Obesity Among Children and Adolescents With Classic Congenital Adrenal Hyperplasia Due to 21-Hydroxylase Deficiency. Pediatrics 2006, 117, e98–e105. [Google Scholar] [CrossRef]
- Geer, E.B.; Islam, J.; Buettner, C. Mechanisms of Glucocorticoid-Induced Insulin Resistance. Endocrinol. Metab. Clin. North Am. 2014, 43, 75–102. [Google Scholar] [CrossRef]
- Kim, M.S.; Fraga, N.R.; Minaeian, N.; Geffner, M.E. Components of Metabolic Syndrome in Youth With Classical Congenital Adrenal Hyperplasia. Front. Endocrinol. 2022, 13. [Google Scholar] [CrossRef]
- Ben Simon, A.; Brener, A.; Segev-Becker, A.; Yackobovitch-Gavan, M.; Uretzky, A.; Schachter Davidov, A.; Alaev, A.; Oren, A.; Eyal, O.; Weintrob, N.; et al. Body Composition in Children and Adolescents with Non-Classic Congenital Adrenal Hyperplasia and the Risk for Components of Metabolic Syndrome: An Observational Study. Front. Endocrinol. 2022, 13. [Google Scholar] [CrossRef]
- Bomberg, E.M.; Addo, O.Y.; Kyllo, J.; Gonzalez-Bolanos, M.T.; Ltief, A.M.; Pittock, S.; Himes, J.H.; Miller, B.S.; Sarafoglou, K. The Relation of Peripubertal and Pubertal Growth to Final Adult Height in Children with Classic Congenital Adrenal Hyperplasia. J. Pediatr. 2015, 166, 743–750. [Google Scholar] [CrossRef]
- Demirel, F.; Kara, O.; Tepe, D.; Esen, I. Bone Mineral Density and Vitamin D Status in Children and Adolescents with Congenital Adrenal Hyperplasia. Turk. J. Med. Sci. 2014, 44, 109–114. [Google Scholar] [CrossRef]
- Laillou, A.; Wieringa, F.; Tran, T.N.; Van, P.T.; Le, B.M.; Fortin, S.; Le, T.H.; Pfanner, R.M.; Berger, J. Hypovitaminosis D and Mild Hypocalcaemia Are Highly Prevalent among Young Vietnamese Children and Women and Related to Low Dietary Intake. PLoS ONE 2013, 8, e63979. [Google Scholar] [CrossRef] [PubMed]
- Stikkelbroeck, N.M.M.L.; Van’t Hof-Grootenboer, B.A.E.; Hermus, A.R.M.M.; Otten, B.J.; Van’t Hof, M.A. Growth Inhibition by Glucocorticoid Treatment in Salt Wasting 21-Hydroxylase Deficiency: In Early Infancy and (Pre)Puberty. J. Clin. Endocrinol. Metab. 2003, 88, 3525–3530. [Google Scholar] [CrossRef] [PubMed]
- Vranić, L.; Mikolašević, I.; Milić, S. Vitamin D Deficiency: Consequence or Cause of Obesity? Medicina (Mex.) 2019, 55, 541. [Google Scholar] [CrossRef]
Figure 1.
Geographic distribution of the CAH patient population (n = 201).
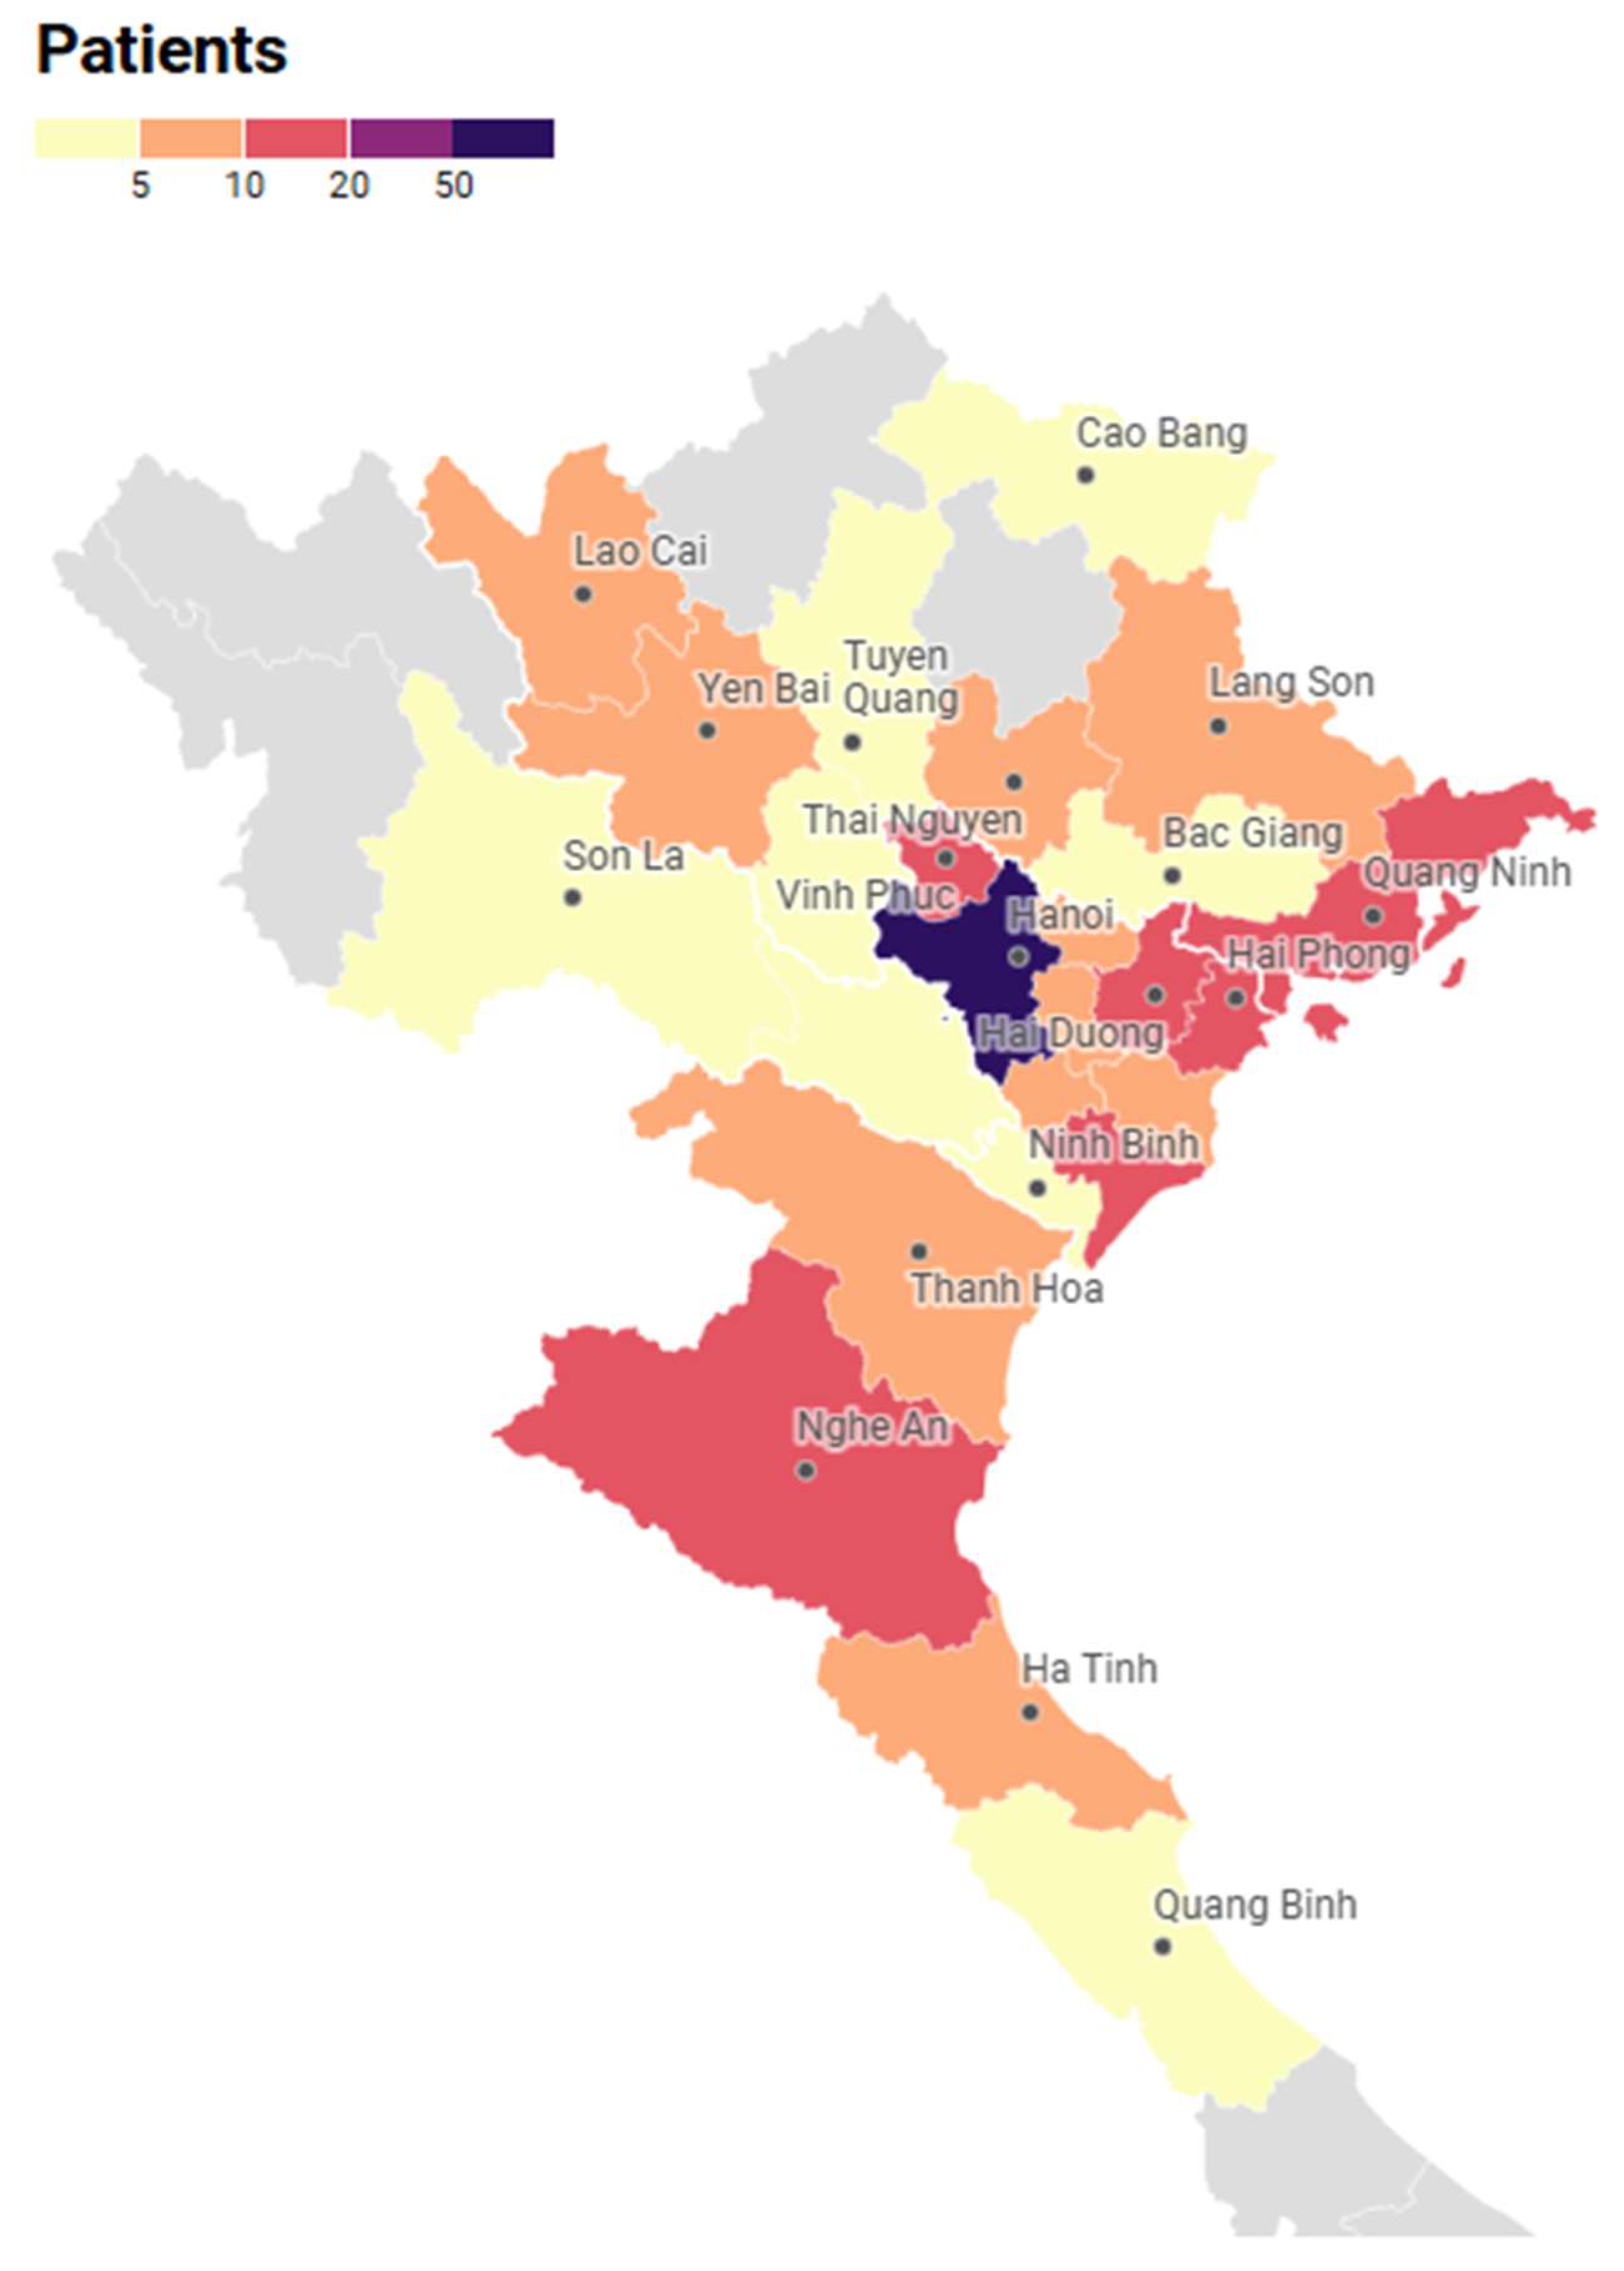
Figure 2.
Distribution of calcium, vitamin D, and phosphate status.
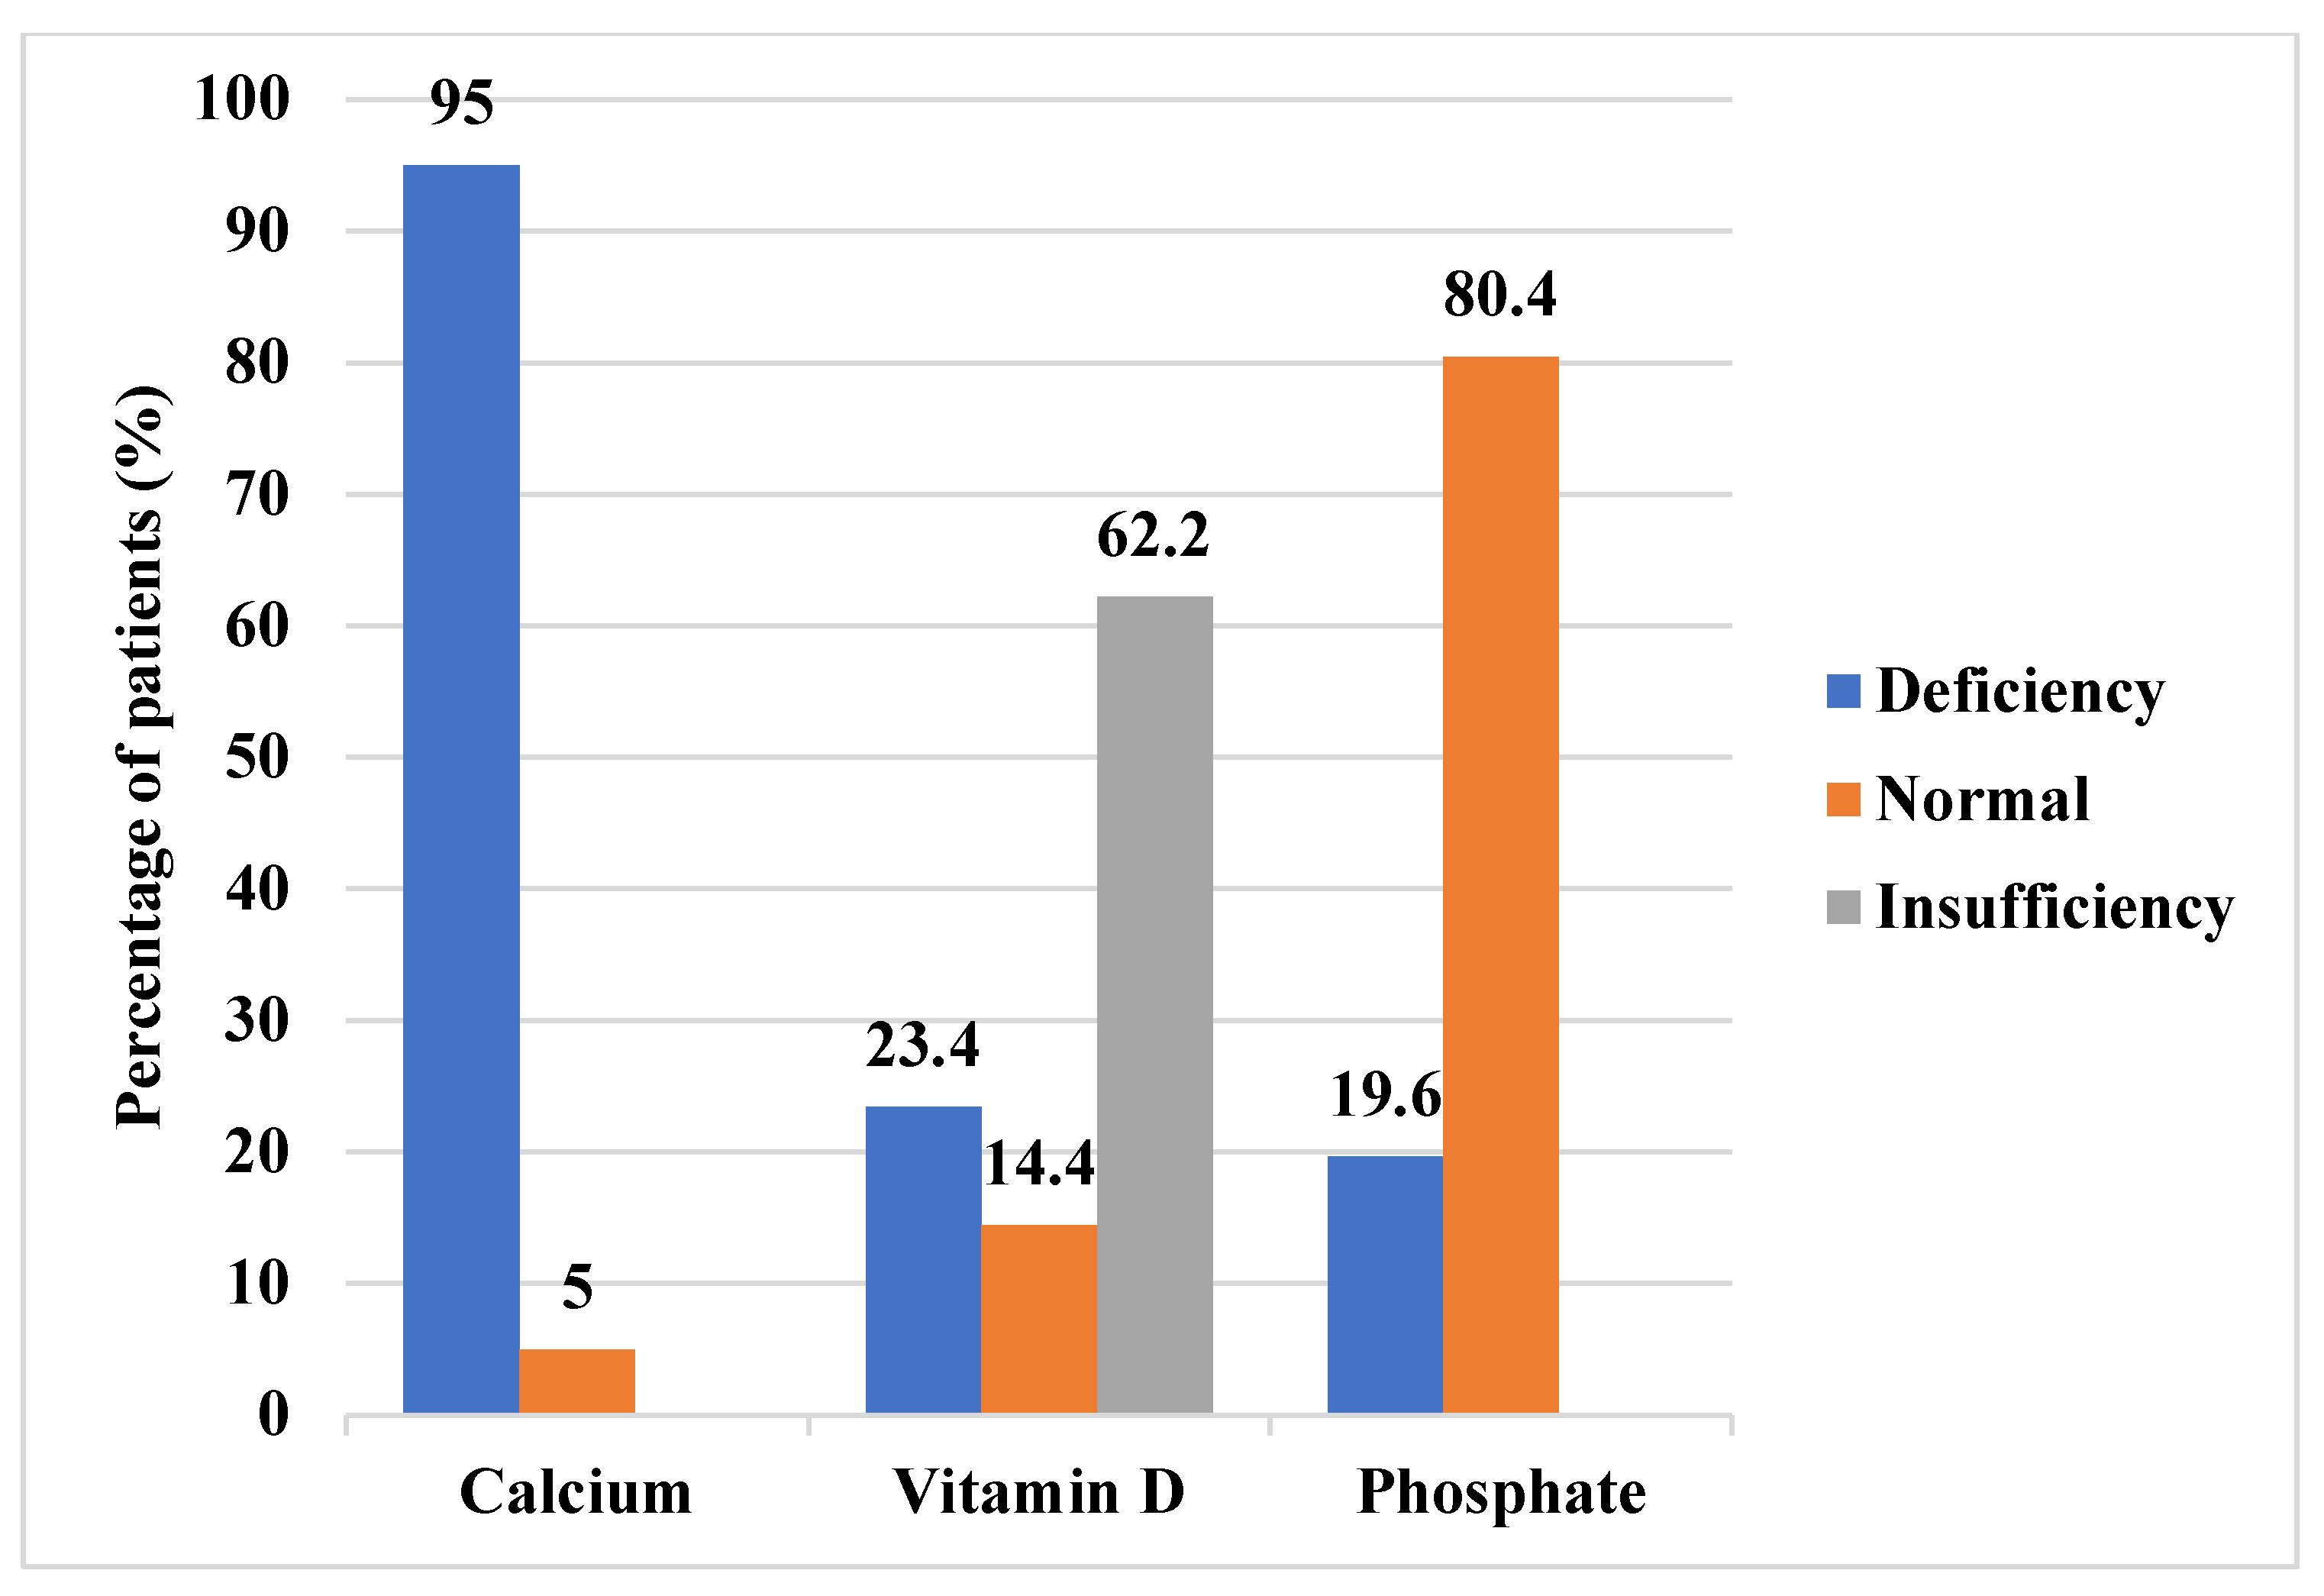

Table 1.
Clinical characteristics of pediatric patients with CAH.
| Salt-wasting | Simple-virilizing | Total | |||
| n | 160 | 41 | 201 | ||
| Female, n (%) | 50.6 (81) | 56.1 (23) | 104 (51.7) | ||
| Sociodemographic | Age (year) | 8.7 ± 4.3 | 9.8 ± 3.6 | 9.8 (1.1 – 16.5) | |
| Urban area, n (%) | 92 (57.5) | 20 (48.8) | 112 (55.7) | ||
| Clinical characteristics | Height SDS | -0.9 ± 1.3 | 0.3 ± 1.6 | -0.6 ± 1.4 | |
| Normal, n (%) | 130 (81.2) | 38 (92.7) | 168 (83.6) | ||
| Moderate stunting, n (%) | 21 (13.1) | 3 (7.3) | 24 (11.9) | ||
| Severe stunting, n (%) | 9 (5.6) | 0 (0) | 9 (4.5) | ||
| BMI SDS | 1.2 ± 1.4 | 1.3 ± 1.2 | 1.2 ± 1.4 | ||
| Thinness, n (%) | 3 (1.9) | 0 (0) | 3 (1.5) | ||
| Normal, n (%) | 71 (44.4) | 20 (48.8) | 91 (45.3) | ||
| Overweight, n (%) | 41 (25.6) | 8 (19.5) | 49 (24.4) | ||
| Obesity, n (%) | 45 (28.1) | 13 (31.7) | 58 (28.9) | ||
| Cushingoid appearance, n (%) | 13 (8.1) | 4 (9.8) | 17 (8.5) | ||
| Hyperpigmentation, n (%) | 44 (27.5) | 6 (14.6) | 50 (24.9) | ||
| Virilization, n (%) | 23 (14.4) | 8 (19.5) | 31 (15.4) | ||
| Central precocious puberty, n (%) | 27 (16.9) | 20 (48.8) | 47 (23.4) | ||
| Biochemical and radiological markers | 17OHP (nmol/L) | 52.4 (0-1182) |
57.1 (2.0-925) | 52.4 (0 – 1182) |
|
| Testosterone (nmol/L) | 0.24 (0.1-26.3) | 0.78 (0.1-29.8) | 0.24 (0.1 – 29.8) | ||
| Bone age (BA) – Chronological age (CA) (year) 1 | 1.1 ± 2.2 | 2.6 ± 2.0 | 1.4 ± 2.2 | ||
| Advanced bone age (BA > CA), n (%) | 70 (43.8) | 34 (82.9) | 104 (51.7) | ||
| Age-appropriate bone age (BA = CA), n (%) | 71 (44.4) | 6 (14.6) | 77 (38.3) | ||
| Delayed bone age (BA < CA), n (%) | 19 (11.9) | 1 (2.4) | 20 (10) | ||
| Treatment-related factors | Age at diagnosis and treatment (year) 2 | 0 (0-3) | 3 (0-9) | 0 (0 – 9) | |
| Hydrocortisone (mg/m2/day) | 16.3 ± 4.4 | 18.7 ± 3.7 | 16.8 ± 4.4 | ||
| Duration of glucocorticoid therapy (year) | 8.6 ± 4.3 | 6.7 ± 3.6 | 8.2 ± 4.2 |
1 The difference between a patient's bone age and their chronological age 2 Age at diagnosis and initiation of treatment occurred concurrently and is presented as a single variable.
Table 2.
Median Age and Statistical Comparisons Across Nutritional and Biochemical Outcomes in Children with CAH.
Table 2.
Median Age and Statistical Comparisons Across Nutritional and Biochemical Outcomes in Children with CAH.
| Independent factor | Variable Group | Subgroup | n | Median Age (years) | p-value |
| Age at evaluation | Hypocalcemia | Yes | 191 | 10.0 | <0.001* |
| No | 10 | 1.6 | |||
| Hypophosphatemia | Yes | 27 | 12.7 | <0.001* | |
| No | 111 | 7.3 | |||
| Vitamin D Status | Deficiency | 47 | 10.3 | 0.001* | |
| Insufficiency | 125 | 10.1 | |||
| Sufficiency | 29 | 5.6 | |||
| BMI Classification | Thinness | 3 | 2.5 | <0.001* | |
| Normal | 91 | 7.5 | |||
| Overweight | 49 | 10.8 | |||
| Obesity | 58 | 10.5 | |||
| Height-for-Age | Severe stunting | 9 | 4.8 | 0.183 | |
| Moderate stunting | 24 | 12.7 | |||
| Normal | 168 | 9.7 | |||
| BA–CA Classification | BA > CA | 104 | 10.9 | < 0.001* | |
| BA = CA | 77 | 5.9 | |||
| BA < CA | 20 | 4.6 |
* Variable with a significant effect.
Table 3.
P-values and Statistical Test Types for Associations Between Clinical Features and Nutritional or Growth Outcomes in Children with CAH.
Table 3.
P-values and Statistical Test Types for Associations Between Clinical Features and Nutritional or Growth Outcomes in Children with CAH.
| Cushingoid appearance |
Acanthosis nigricans |
Hyperpigmentation | Virilization | Central precocious puberty | |
| Hypocalcemia | 0.203 (FET) | 1 (FET) | 0.07 (FET) | 0.366 (FET) | 0.121 (FET) |
| Hypophosphatemia | 0.378 (Χ²) | 1 (FET) | 0.048 (Χ²) * | 0.13 (FET) | 0.095 (Χ²) |
| Vitamin D Status |
0.933 (FET) | 0.741 (FET) | 0.131 (Χ²) | 0.128 (FET) | 0.142 (Χ²) |
| BMI Classification |
0.001 (FET) * | < 0.001 (FET) * | 0.045 (FET) * | 0.779 (FET) | 0.392 (FET) |
| Height-for-age | 0.64 (FET) | 0.852 (FET) | 0.74 (FET) | 0.206 (FET) | 0.168 (FET) |
| BA-CA Classification |
0.43 (FET) | 0.205 (FET) | 0.005 (FET) * | 0.004 (FET) * | < 0.001 (FET) * |
* Variable with a significant effect. Values in the table represent p-values. Statistical tests used include Chi-square test (χ²) and Fisher’s Exact Test (FET), depending on expected cell counts.
Table 4.
Associations Between Glucocorticoid Treatment Duration and Nutritional or Growth Outcomes in Children with Congenital Adrenal Hyperplasia (CAH).
Table 4.
Associations Between Glucocorticoid Treatment Duration and Nutritional or Growth Outcomes in Children with Congenital Adrenal Hyperplasia (CAH).
| Outcome Variable | p-Value | ||
|---|---|---|---|
| Glucocorticoid treatment duration | Hypocalcemia | < 0.001* | |
| Hypophosphatemia | 0.01* | ||
| Vitamin D status 1 | 0.007* | ||
| BMI classification 2 | < 0.001* | ||
| Height-for-age classification 3 | 0.108 | ||
| BA – CA Classification 4 | < 0.001* |
* Variable with a significant effect.
Disclaimer/Publisher’s Note: The statements, opinions and data contained in all publications are solely those of the individual author(s) and contributor(s) and not of MDPI and/or the editor(s). MDPI and/or the editor(s) disclaim responsibility for any injury to people or property resulting from any ideas, methods, instructions or products referred to in the content. |
© 2025 by the authors. Licensee MDPI, Basel, Switzerland. This article is an open access article distributed under the terms and conditions of the Creative Commons Attribution (CC BY) license (http://creativecommons.org/licenses/by/4.0/).
Copyright: This open access article is published under a Creative Commons CC BY 4.0 license, which permit the free download, distribution, and reuse, provided that the author and preprint are cited in any reuse.


