
Submitted:
09 May 2025
Posted:
12 May 2025
You are already at the latest version
Abstract
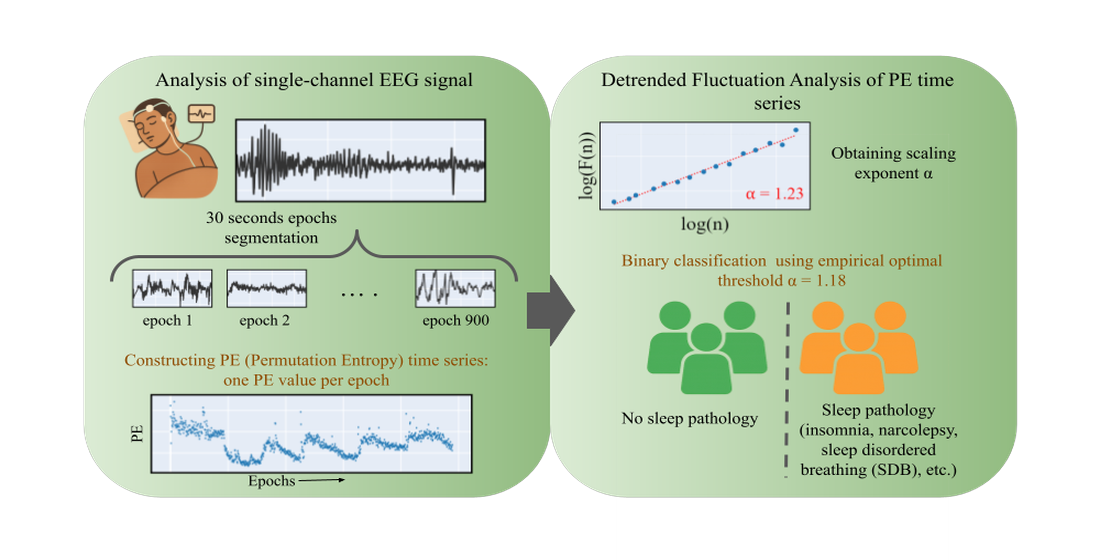
We present a novel approach for detecting generalized sleep pathologies through fractal analysis of single-channel EEG signals. We propose that the fractal scaling exponent of permutation entropy time series serves as a robust biomarker of pathological sleep patterns, capturing alterations in brain dynamics across multiple disorders. Using two public datasets (Sleep-EDF and CAP Sleep Database) comprising 200 subjects (112 healthy controls and 88 patients with various sleep pathologies), we computed the fractal scaling of the permutation entropy of these signals. Our results demonstrate significantly reduced scaling exponents in pathological sleep compared to healthy controls (mean = 1.24 vs. 1.06, p<0.001), indicating disrupted long-range temporal correlations in neural activity. The method achieved 90% classification accuracy for REM sleep behavior disorder (F1-score: 0.89) and maintained 74% accuracy when aggregating all pathologies (insomnia, narcolepsy, sleep-disordered breathing, etc.). Key advantages of this approach include compatibility with single-channel EEG (enabling potential wearable applications), independence from sleep-stage annotations, and generalizability across recording montages and sampling rates. This contribution establishes a framework for computationally efficient, non-specific sleep pathology detection that could transform screening protocols and enable earlier intervention.
Keywords:
fractal analysis
; nonlinear dynamics
; permutation entropy
; statistical complexity
; EEG biomarkers
; sleep disorder detection
1. Introduction
The sleep-wake cycle is a vital physiological process in humans, and one of the most conserved biological rhythms despite radical changes in the living conditions of our species. This cycle consists of distinct states, typically identified by their patterns and behavioral traits, including wakefulness (W), non-rapid eye movement (NREM) sleep, and rapid eye movement (REM) sleep [1]. Wakefulness and sleep are linked to different functional states of the brain, which can be observed through electroencephalographic (EEG) signals that encompass a wide range of frequencies. Alongside these electrophysiological differences, cognitive abilities undergo significant changes throughout the cycle, and sleep alterations and pathologies may significantly hamper the quality of life of subjects [2], including cognitive decline [3,4], mood disorders [5,6] or post-traumatic stress disorder [7,8]. Sleep disorders are widely prevalent, representing a significant public health concern that requires a structured and systematic healthcare approach [9]. In this sense, early and widespread sleep pathology detection with the least invasive acquisition means is paramount. The utilization of wrist-worn raw-data accelerometers is becoming increasingly prevalent in large-scale sleep research, and is anticipated to emerge as a standard scientific instrument in the foreseeable future. However, their current accuracy in discriminating between sleep stages remains suboptimal, thereby limiting their applicability in studies focused on sleep disorders. Consequently, EEG continues to offer a more favorable balance between intrusiveness and diagnostic precision.
Given the complexity of EEG signals, traditional neuroscience approaches were based in linear signal theory, segmenting signal spectra into frequency bands and analyzing their variations during different cognitive functions and sleep states [10]. Supervised analysis and interpretation of these signals along complete sleep-wake cycles is still the main diagnostic procedure for sleep disorders [11]. Given that human-assisted analysis is often slow, expensive, and susceptible to errors, there is a clear and growing need for automated methods, which are both necessary and highly advantageous. However, linear theory only captures specific features of EEG signals, and fails to fully address the intricate, non-linear and non-stationary nature of brain waves [12].
In [13] a review of the state of the art in sleep disorder detection is presented. Out of the 114 studies reviewed, 85 (74.6%) were primarily focused on the detection of sleep apnea, while 10 (8.8%) addressed insomnia, and each of the remaining sleep disorders was investigated in two to four studies. All these studies were solely focused on detecting only one specific sleep disorder with respect to control groups, oblivious to all other sleep disorders or divergent conditions. The primary information sources included several signals (polysomnographies, magnetic resonance images, electrocardiographies, oculograms, electromyograms, nasal airflow, etc.) apart from or combined with EEG. Sleep apnea and insomnia were the easiest to detect using EEG signals (respectively 97.14% accuracy in [14], and 90.90% accuracy in [15]). Accuracies for other conditions with EEG signals were not that good.
Simultaneous identification of different sleep-related pathologies has been tackled only recently. In [16] the authors propose the analysis of an EEG microstructure scoring technique named cyclic alternating pattern (CAP). They employed ensemble learning methods over wavelet-based Hjorth and entropy features extracted from monopolar C4-A1 and bipolar F4-C4 EEG channels. The model was trained with signals of healthy subjects as well as patients suffering from six different sleep disorders, provided in the CAP sleep database [17], achieving accuracies of 83% for normal subjects, and ranging from 72% to 84% for other sleep disorders.
In contrast, the field of non-linear dynamics, combined with machine learning techniques, has developed tools and models that provide insightful perspectives in complex systems and their emergent interactions [18]. For understanding and adequately assessing sleep disorders, robust methods are essential for distinguishing sleep stages within the sleep-wake cycle, examining the microstructure of sleep waves [19]. Sleep stages range from light sleep (N1, N2) to deep sleep (N3) and REM sleep, and an evaluation of their duration as well as the transitions between them is paramount in the precise detection of sleep disorders, more accurate diagnoses and targeted therapeutic interventions [20].
Permutation Entropy (PE) is a proven and valuable tool for analyzing EEG signals (even single-channel EEG) and understanding the complexities of brain activity during different sleep stages [21,22,23]. PE is a measure of time-series complexity that quantifies the unpredictability of a signal by analyzing the distribution of ordinal patterns (OPs) within the signal, which represent the relationships between neighboring values. In general, wakefulness and REM state are characterized by higher PE values, indicating greater complexity in brain signals, while deeper sleep states show lower complexity [23,24]. Other symbolic methods, including Lempel-Ziv complexity and permutation Lempel-Ziv complexity, are also used to characterize brain activity during sleep by converting the original time series into a symbol series and then analyzing the complexity of this series [25].
Detrended fluctuation analysis (DFA) is also a widespread analysis method for the quantification of fractal scaling (FS) properties in non-stationary signals and time series [26], and EEG signals in particular [27,28]. In [29], the FS of different sleep stages is evaluated in the different spectral bands corresponding to specific brain waves (alpha, beta, delta and theta), with the aim to train a machine learning classifier able to automate the sleep staging process. In [30] the FS of EEG signals of the different sleep stages of sleep apnea subjects were analyzed in relation to the corresponding ones in control subjects, showing only very slight differences. Additionally, [31] developed a machine learning classifier to identify sleep apnea by analyzing the FS across various sleep stages in both apnea patients and control subjects. Their approach achieved a high level of classification accuracy, demonstrating the potential of computational methods in sleep disorder diagnostics.
In this paper we aim to develop an automated sleep disorder detection method, from single-channel EEG signals. Our purpose is to develop the simplest, most widely applicable method that can detect a divergent sleep condition notwithstanding the acquisition conditions (v.g., EEG channel, sampling frequency, filtering). The underlying analysis takes advantage of the mentioned properties of sleep stage signals in terms of entropy, assessing the overall FS exponent of the PE along the complete sleep cycle. The developed model demonstrated superior classification performance as compared to existing state-of-the-art studies in combined sleep disorders. The method is characterized by its simplicity and computational efficiency, making it a viable candidate for deployment in clinical applications.
2. Materials and Methods
2.1. Datasets
We used two publicly available datasets from PhysioNet: the Sleep-EDF Database Expanded [32] and the CAP Sleep Database [17]. Both datasets include expert annotations of sleep stages for each 30-second epoch, although these annotations were not used in our analysis. Epochs in which the EEG signal remained constant over time, indicating a failure in brain activity recording, were excluded from the analysis. This artifact affected 11 subjects and led to the removal of 63 epochs in total, representing approximately of the entire dataset.
The Sleep-EDF Database Expanded contains whole-night polysomnographic recordings from two studies: the Sleep Cassette Study and the Sleep Telemetry Study. This recordings include EOG, chin EMG and EEG recordings from Fpz-Cz and Pz-Oz, sampled at 100 Hz. The Sleep Cassette Study examined age-related effects on sleep in healthy subjects (ages 25-101) without sleep-related medication. Each participant underwent two consecutive night recordings. For this study, we analyzed all available subjects from the first night of sleep, totaling 77 participants. The Sleep Telemetry Study investigated the effects of temazepam in 22 healthy subjects with mild sleep-onset difficulties. For this study, we used de Fpz-Cz EEG channel from one night to each subject who did not receive medication.
The CAP Sleep Database includes 108 polysomnographic recordings, including 16 from healthy subjects and 92 from individuals with sleep disorders. The subjects with sleep pathologies include 40 diagnosed with nocturnal frontal lobe epilepsy (NFLE), 22 with REM sleep behavior disorder (RBD), 10 with periodic leg movements (PLM), 9 with insomnia (INS), 5 with narcolepsy (NARCO), 4 with sleep-disordered breathing (SDB), and 2 with bruxism (BRUX). For this study, we selected 13 healthy controls and 88 subjects with a sleep pathology, excluding bruxism due to the small number of affected subjects. EEG recordings for subjects with sleep pathologies were sampled at either 512 Hz or 256 Hz, with a 30 Hz low-pass filter, except for some NFLE subjects, whose recordings were filtered with cutoff frequencies of 128 Hz and 256 Hz. In contrast, for healthy controls, the sampling rates varied between 512, 200, and 100 Hz. Due to differences in the available channels across subjects, we selected the channles present in the majority of cases. Specifically, C4-A1 and F4-C4 were used whenever available. Table 1 summarizes the respective database and channels chosen for the study in each condition.
2.2. Detrended Fluctuation Analysis
Detrended fluctuation analysis (DFA) was introduced by Peng et al. [33] to analyze the long-range temporal correlations of signals. The method can be described as follows. For a time series of length N with almost nowhere, the profile is defined as where is the mean of X, and . The profile is then divided into non-overlapping segments of equal length s beginning from the first element and proceeding forward. A similar segmentation procedure is applied in reverse, starting from the last element and proceeding backwards. Consequently, a total of segments are obtained. For each segment , the local trend is estimated by performing a least-square fit to the elements within the segment, and the corresponding variance is computed. The fitting procedure may involve polynomials of various orders, including linear, quadratic, or cubic functions, among others. In this study, a linear fit was employed. The fluctuation function, , is obtained averaging over all segments:
This procedure is iterated for multiple values of the scale parameter s to examine the dependence of on s. The scaling behavior of the fluctuation function is assessed by analyzing the log-log plot of against s using standard fractal methods. If the series X is long-range power-law correlated, increases as a power-law,
In this case, the fractal scaling exponent can be interpreted as a long-range correlation exponent, namely an auto-affinity parameter [28].
2.3. Permutation Entropy
Permutation entropy (PE) is widely used in nonlinear time series analysis due to its simplicity and effectiveness in capturing dynamical complexity [18]. This method quantifies the irregularity or unpredictability of a time series by analyzing the order relations (ordinal patterns) between consecutive values, thus making it fast to compute, less sensitive to noise and outliers, does not require assumptions about the underlying system, and works well with normalized data.
To compute PE, a time series is transformed into a sequence of ordinal patterns that represent the relative ranking of values within small overlapping segments. The probability distribution function obtained from these patterns is then used to computed the Shannon entropy. This transformation is governed by two parameters: the embedding dimension, D, which defines segment length, and the time lag, , which determines the spacing between values. Given a discrete time series of length T, overlapping segments of size D are extracted, each separated by , resulting in segments. Each segment is assigned an orinal pattern (OP) based on the relative order of its D elements. Since there are possible permutations, each segment corresponds to one of these patterns. The relative frequency of the different OPs in the time series defines a probability distribution. PE is computed using the normalized Shannon entropy, which quantifies the uncertainty in the OP distribution. To ensure comparability across different embedding dimensions, the entropy is normalized by its maximum possible value, :
A low PE value indicates a structured, predictable process, while a high value suggests randomness or chaotic behavior. The entropy reaches its minimum value of 0 when a single OP dominates, reflecting complete determinism, and its maximum value of 1 when all OPs appear with equal probability, indicating a fully unpredictable system.
2.4. Scaling exponent from PE time series
The time series to which we applied DFA was the PE value across epochs throughout the night, derived from the EEG signal. For each subject and channel location, the EEG signal was segmented into 30-second epochs, as this duration aligns with the standard classification of sleep stages. This segmentation resulted in an average of 1158 epochs per subject (SD = 286). PE was then calculated for each epoch based on Equation Section 2.3, with parameters and . No preprocessing filters were applied to the EEG signal prior to the computation of PE. The embedding dimension and time delay were selected based on their adequate performance in characterizing sleep stages, as reported in the literature [25].
Once PE was obtained over time, the FS exponent was calculated by deriving the fluctuation function from Equation Section 2.2. Fifteen segment sizes were selected in logarithmic space (base 10) within the range of and fitted a first-degree polynomial. The FS exponent was computed for each subject condition, and used as a feature parameter to develop a binary classifier. An optimal decision threshold was determined to maximize discriminative performance between pathological (unhealthy) and control (healthy) states. In Figure 1 we show the complete processing workflow.
To evaluate the discriminative power of the FS exponent, we first conducted statistical analyses on RBD vs. healthy controls, since RBD was the condition which appears to distinguish itself from healthy in the most pronounced manner. A parametric Student’s t-test was applied to assess the significance of differences in FS exponent values between RBD and healthy cohorts with EEG acquisitions from the same derivations (C4-A1, F4-C4).
To account for inter-channel variability and enhance statistical robustness, a mixed linear model (MLM) was implemented, aggregating all FS exponents across conditions. This approach ensured generalized inference while controlling for within-subject dependencies. Finally, a binary classification framework was constructed to differentiate any pathological sleep condition from healthy controls (v.g., a unhealthy vs. healthy classifier). To the best of our knowledge, this work presents the first proposed framework for developing a sleep pathology detector that is not restricted to specific disorders. Instead, it enables the identification of generalized pathological sleep conditions, irrespective of their underlying etiology.
3. Results
In this section, we present the findings of our analysis, beginning with a visualization of the temporal evolution of permutation entropy (PE) and its fractal scaling exponent . We then proceed to a detailed statistical analysis to assess differences between RBD and healthy subjects, followed by a classification analysis aimed at distinguishing between the two groups. Finally, we grouped all conditions under the FS exponent to differentiate between healthy and unhealthy.
To visualize the evolution of PE over time, we plotted the different channels (C4-A1 and F4-C4) for both a healthy subject and a subject with RBD, along with the Fpz-Cz channel for one healthy subject (Figure 2). Following the extraction of the PE time series for the selected channels in each subject, we calculated and grouped the results by channel (C4-A1, F4-C4, and Fpz-Cz) and condition (RBD vs. healthy). The distribution of these values is illustrated using box plots in Figure 3, providing a comparative visualization of the differences between both conditions. Additionally, the mean values of for each condition and channel are summarized in Table 2, providing a concise overview of observed trends.
3.1. Statistical Analysis for RBD and Healthy conditions
This subsection presents a comprehensive statistical analysis to evaluate the significance of differences in the FS exponent between RBD and healthy subjects. We first examine differences by channel within the same database using t-tests, followed by the application of Mixed Linear Model (MLM). The MLM was applied twice: initially to assess intra-subject variability and its potential effects and then to investigate the variability between channels. This approach enhances the robustness of our findings by accounting for between-channel variability.
First, differences between groups were analyzed by channel within the same database. To ensure the validity of our comparisons, we performed independent t-tests after evaluating normality (Shapiro-Wilk test) and homoscedasticity (Levene test). Statistical power analysis was conducted to ensure that the independent samples t-tests had sufficient power to detect differences between RBD and Healthy groups. Cohen’s d was calculated to estimate the effect size for each comparison. Significant differences were found between channels: , for F4-C4, and , for C4-A1. The effect size was large in both cases (Cohen’s for F4-C4, and for C4-A1), and the statistical power was approaching 1.0 (0.999 and 1.000), indicating a highly robust comparison. These results indicate that the scaling exponent differs between groups in both EEG channels.
Before applying MLM to include the values from all EEG channels, we first determined whether the EEG channels in healthy subjects (F4-C4/C4-A1 and Fpz-Cz) could be combined. Independent samples t-test were performed (, ) after evaluating normality and homoscedasticity (Levene’s test = 0.309). Cohen’s d was calculated to assess size effects (Cohen’s ), indicating a small effect. This supported the aggregation of EEG channels within each condition. A linear mixed-effect model (MLM) was employed twice to analyze the exponent, incorporating random effects. The first implementation accounted for within-subject variability, while the second addressed channel variability.
In the first case, the model was specified as follows: the dependent variable was the exponent, while the fixed effects was the condition (RBD vs. healthy). A random intercept per subject was included to account for individual variability in baseline values regardless of the EEG channel. The results indicate a significant effect of group (, CI [-0.220, -0.142], 0.001), suggesting that RBD subjects exhibit lower values compared to healthy subjects. The random effect of subject showed a variance of 0.007 (SD = 0.155), indicating relatively low variability among individuals beyond the group-level differences.
In the second implementation, the model assessed the effect of EEG channel variability on the exponent while controlling for pathology. The results confirmed a significant effect of pathology (, ), with a confidence interval of [-0.292, -0.066]. The estimated variance of the random effect was 0.005, indicating that channel variability contributed minimally to the observed differences. This suggest that the effect on RBD pathology on the exponent is robust and largely independent of EEG channel variations.
3.2. Subject classification
To address the primary objective of distinguishing between RBD and healthy subjects, we developed a binary classifier that determines the subject condition solely on their FS exponent. For this classifier, we computed the Receiver Operating Characteristic (ROC) curve under different FS thresholds. The analysis was performed by grouping all subjects according to their condition, independently of the EEG channels. Figure 4 shows the resulting ROC curve, where the optimal threshold value of is hightlighted. This threshold was determined by maximizing F1-score and yields a True Positive Rate (TPR) of 0.86 and a False Positive Rate (FPR) of 0.92. Consequently, it results in a weighted accuracy of 0.90, where weighted accuracy is calculated as the average of TPR and TNR, weighted by the proportion of each class.
Finally, FS exponent was used to classify each condition (SDB, RBD, PLM, INS, NARCO) against healthy subjects. For those conditions, optimal thresholds were determined by maximizing the F1-score, using all available FS values from the EEG channels for each subject. In the case of healthy subjects, this included different combinations of channels depending on the subject (some had one channel, others had both). The performance comparison for each classifier is summarized in Table 3.
Furthermore, Figure 5 presents a visualization of the healthy and unhealthy populations using boxplots. The unhealthy population includes all values from the sleep pathologies, computed for the selected EEG channels. A horizontal line represents the threshold that separates both classes.
4. Discussion
Our study demonstrates that the fractal scaling exponent of permutation entropy time series, derived from single-channel EEG, serves as a robust biomarker for distinguishing pathological sleep conditions from healthy controls. The FS exponent exhibited significant discriminative power, particularly for REM sleep behavior disorder (RBD), achieving a weighted accuracy of 90% (F1-score: 0.89) at an optimal threshold of . Notably, this approach generalizes across multiple sleep pathologies –including insomnia, narcolepsy, and sleep-disordered breathing– with an aggregate classification accuracy of 74% (F1-score: 0.74) for all conditions combined.
4.1. Methodological and theoretical implications
To our knowledge, this is the first framework capable of detecting generalized sleep pathologies without requiring syndrome-specific feature engineering. Unlike prior studies focused on individual disorders (v.g., sleep apnea detection with 97.14% accuracy [14] or insomnia classification at 90.90% [15]), our method leverages the FS exponent’s sensitivity to non-linear dynamics in EEG signals. The evolution of permutation entropy across all the sleep cycle shows a noticeable higher fractal exponent in healthy subjects. This confirms other findings that show that healthier biosignals exhibit more complex fractal features as compared with unhealthier ones (see for instance the discussion in [34] regarding how EEG complexity decreases in neurological diseases, or the general idea presented by [35] that healty systems operate at "the edge of chaos"). Also, the success of this approach aligns with growing evidence that sleep disorders share common electrophysiological signatures, such as altered long-range temporal correlations in neural activity [27].
The superior performance for RBD ( vs. healthy ; ) may reflect its distinct neurophysiological underpinnings, including pontine and cortical dysregulation during REM sleep [7]. However, the FS exponent’s consistency across channels (MLM random effect variance: 0.005) underscores its applicability to diverse EEG montages, addressing a key limitation of prior channel-dependent methods.
4.2. Clinical and practical advantages
This work bridges a critical gap in sleep medicine by providing a tool for non-specific pathology detection, which could prioritize patients for detailed diagnostics. In this sense, it presents several advantages as compared with other proposals.
- Scalability: The use of single-channel EEG and computational efficiency makes this method suitable for wearable or at-home devices.
- Generalizability: By avoiding syndrome-specific assumptions, the classifier is adaptable to comorbid or undiagnosed conditions, a critical advantage for early screening.
- Non-Invasiveness: Compared to polysomnography, this approach reduces the need for multichannel recordings, lowering costs and patient burden.
- Dataset Constraints: The method is robust with respect to heterogeneity in sampling rates and channels (Table 1). However, future validation in larger, standardized cohorts is needed (see below).
- Absence of Sleep Staging Context: While epoch-level PE was computed, the FS exponent was derived from whole-night signals, disentangling pathology effects from sleep-stage-specific dynamics (v.g., NREM vs. REM).
4.3. Limitations
Both the overall methodology and this specific study entail certain limitations and potential shortcomings
- Pathology-Specific Variability: Lower accuracy for insomnia (65%) and narcolepsy (64%) suggests these conditions may require complementary information (v.g., autonomic measures).
- Limited Sample Sizes for Rare Conditions: Small cohorts (e.g., n=4 for SDB, n=5 for NARCO) reduce statistical power and generalizability. Aggregating pathologies mitigated this but may obscure condition-specific signatures.
- Static Thresholding: The binary classifier used a fixed FS threshold (v.g., 1.18 for all pathologies), which may ignore potential inter-individual variability in FS exponents due to age, medication, or comorbidities. This could be refined via personalized thresholds or continuous risk scoring.
5. Conclusions and further research
Sleep is a fundamental biological process whose disruption has far-reaching consequences for cognitive health, emotional regulation, and physical well-being. The growing prevalence of sleep disorders –linked to conditions ranging from neurodegenerative diseases to cardiovascular dysfunction– demands tools that can identify pathological sleep early, accurately, and accessibly. We presented a study that advances this goal by demonstrating that the fractal scaling properties of brain-wave complexity, quantified through permutation entropy dynamics in single-channel EEG, provide a robust and generalizable marker of sleep pathology. Our findings reveal that the loss of long-range temporal correlations in neural activity, reflected in reduced FS exponents , is a hallmark of disordered sleep across multiple syndromes, from REM sleep behavior disorder RBD to insomnia. This insight not only bridges gaps in sleep diagnostics but also deepens our understanding of how nonlinear brain dynamics are perturbed in disease.
The quest to understand sleep –and its disorders– has long been hampered by the tension between simplicity and precision. Our study demonstrates that complexity-based metrics like the FS exponent can reconcile these goals, offering a window into the brain’s dynamical state with minimal data requirements. As sleep research increasingly embraces computational psychiatry frameworks, such methods may pave the way for a new taxonomy of sleep disorders, grounded in shared dynamical dysfunction rather than symptomatic evidence.
5.1. Steps towards a paradigm shift
Traditional approaches to sleep diagnostics rely on polysomnography and manual staging, which are resource-intensive and often syndrome-specific. By contrast, our method leverages the inherent complexity of EEG signals –captured through PE and its FS properties– to detect pathology without requiring stage annotations, multi-channel setups, specific preprocessing, sampling rates or filtering adjustments, etc. This aligns with a broader trend in computational neuroscience: the shift from linear, feature-engineered analyses to methods that embrace the nonlinear, non-stationary nature of brain activity. The success of the FS exponent in discriminating pathologies (v.g., RBD with 90% accuracy) underscores that sleep disorders may share underlying dynamical signatures, such as degraded signal complexity or disrupted self-organization, even when their clinical manifestations differ.
Clinically, this work addresses a critical need for simple and scalable screening tools. The FS exponent’s consistency across EEG montages and sampling rates (Table 1) suggests compatibility with emerging wearable technologies, potentially enabling at-home monitoring for high-risk populations (v.g., older adults or patients with psychiatric comorbidities). Moreover, the method’s nonspecificity –its ability to flag any divergent sleep condition– could help prioritize patients for detailed PSG, optimizing healthcare resource allocation.
5.2. Theoretical implications in neurophysiology
The observed reduction in FS exponents in pathological sleep parallels findings in other neuropsychiatric conditions, where disrupted fractal scaling has been tied to degraded neural network efficiency, and also with the observed fact that healthy biosignals exhibit in general a dense fractal nature. In our specific context, our findings may trigger speculative neurophysiological explanations. For example, the lower values in RBD (1.06 vs. 1.24 in healthy subjects) may be consequence of a destabilization of brainstem-cortical circuits during REM sleep, a hallmark of the disorder. Similarly, the intermediate values in insomnia (1.17) could point to hyperarousal-driven fragmentation of sleep microstructure. These hypotheses, while speculative, highlight how the FS exponent might serve as a bridge between system-level dynamics (e.g., network stability) and clinical phenotypes. Future studies could test these links by correlating with neuroimaging or molecular biomarkers.
5.3. Limitations and future directions
While our results are promising, several limitations were already mentioned, regarding pathology-specific variability, limited sizes, and a rigid threshold setting. Apart from addressing these issues, we are currently expanding the breadth of this research among other things in the following aims:
- Integration with actigraphy or heart rate variability to enhance specificity.
- Longitudinal applications to track disease progression (v.g., RBD as a prodrome to Parkinson’s [8]).
- Real-time implementation in clinical wearables for continuous monitoring.
- The use of sleep-stage context, which might enhance classifier’s specificity.
- The fixed threshold could be refined using population-adjusted or adaptive models to account for inter-individual variability.
- Collaborate with initiatives like the National Sleep Research Resource (NSRR) to access larger, harmonized datasets.
- Combine FS exponents with time-domain features (v.g., spectral power, Hjorth parameters) to capture complementary information.
- Analyze the PE time series in more complex terms, for instance multifractality.
A focus on embedding these tools into scalable platforms would validate them in real-world settings, and explore their mechanistic underpinnings. By doing so, we move closer to a future where sleep health is monitored as routinely as blood pressure, preventing disease before it takes hold.
Author Contributions
Conceptualization, C.D.D. and C.D.; methodology, C.D.D. and C.D.; software, C.D.D., M.M.M. and F.I.; validation, C.D.D. and C.D.; formal analysis, C.D.D.; investigation, C.D.D. and C.D.; data curation, C.D.D.; writing—original draft preparation, C.D.D., M.M.M and C.D.; writing—review and editing, C.D, A.W and G.G.; funding acquisition, C.D. and G.G. All authors have read and agreed to the published version of the manuscript.
Funding
This research was funded by the Science and Technology Office of the Universidad Nacional del Sur under grant 24/K093
Informed Consent Statement
Not applicable (the employed datasets are under public domain).
Data Availability Statement
The code developed for this study will be made available upon the acceptance for publication.
Conflicts of Interest
The authors declare no conflicts of interest.
References
- Gottesman, R.F.; Lutsey, P.L.; Benveniste, H.; Brown, D.L.; Full, K.M.; Lee, J.M.; Osorio, R.S.; Pase, M.P.; Redeker, N.S.; Redline, S.; et al. Impact of Sleep Disorders and Disturbed Sleep on Brain Health: A Scientific Statement From the American Heart Association. Stroke 2024, 55, e61–e76. [Google Scholar] [CrossRef]
- Palagini, L.; Geoffroy, P.A.; Miniati, M.; Perugi, G.; Biggio, G.; Marazziti, D.; Riemann, D. Insomnia, sleep loss, and circadian sleep disturbances in mood disorders: a pathway toward neurodegeneration and neuroprogression? A theoretical review. CNS Spectrums 2022, 27, 298–308. [Google Scholar] [CrossRef]
- Gilley, R.R. The Role of Sleep in Cognitive Function: The Value of a Good Night’s Rest. Clinical EEG and Neuroscience 2023, 54, 12–20. [Google Scholar] [CrossRef] [PubMed]
- Porter, V.R.; Buxton, W.G.; Avidan, A.Y. Sleep, Cognition and Dementia. Current Psychiatry Reports 2015, 17. [Google Scholar] [CrossRef] [PubMed]
- Yan, T.; Qiu, Y.; Yu, X.; Yang, L. Glymphatic Dysfunction: A Bridge Between Sleep Disturbance and Mood Disorders. Frontiers in Psychiatry 2021, 12. [Google Scholar] [CrossRef] [PubMed]
- Pearson, O.; Uglik-Marucha, N.; Miskowiak, K.W.; Cairney, S.A.; Rosenzweig, I.; Young, A.H.; Stokes, P.R. The relationship between sleep disturbance and cognitive impairment in mood disorders: A systematic review. Journal of Affective Disorders 2023, 327, 207–216. [Google Scholar] [CrossRef] [PubMed]
- de Boer, M.; Nijdam, M.J.; Jongedijk, R.A.; Bangel, K.A.; Olff, M.; Hofman, W.F.; Talamini, L.M. The spectral fingerprint of sleep problems in post-traumatic stress disorder. Sleep 2019, 43, zsz269. [Google Scholar] [CrossRef]
- Barone, D.A. Dream enactment behavior—a real nightmare: a review of post-traumatic stress disorder, REM sleep behavior disorder, and trauma-associated sleep disorder. Journal of Clinical Sleep Medicine 2020, 16, 1943–1948. [Google Scholar] [CrossRef]
- Panossian, L.A.; Avidan, A.Y. Review of Sleep Disorders. Medical Clinics of North America 2009, 93, 407–425. [Google Scholar] [CrossRef]
- Cavelli, M.; Rojas-Líbano, D.; Schwarzkopf, N.; Castro-Zaballa, S.; Gonzalez, J.; Mondino, A.; Santana, N.; Benedetto, L.; Falconi, A.; Torterolo, P. Power and coherence of cortical high-frequency oscillations during wakefulness and sleep. European Journal of Neuroscience 2018, 48, 2728–2737. [Google Scholar] [CrossRef]
- Malhotra, R.K. Neurodegenerative Disorders and Sleep. Sleep Medicine Clinics 2022, 17, 307–314. [Google Scholar] [CrossRef] [PubMed]
- Al-Fahoum, A.S.; Al-Fraihat, A.A. Methods of EEG Signal Features Extraction Using Linear Analysis in Frequency and Time-Frequency Domains. International Scholarly Research Notices 2014, 2014, 730218. [Google Scholar] [CrossRef]
- Xu, S.; Faust, O.; Seoni, S.; Chakraborty, S.; Barua, P.D.; Loh, H.W.; Elphick, H.; Molinari, F.; Acharya, U.R. A review of automated sleep disorder detection. Computers in Biology and Medicine 2022, 150, 106100. [Google Scholar] [CrossRef] [PubMed]
- Almuhammadi, W.S.; Aboalayon, K.A.; Faezipour, M. Efficient obstructive sleep apnea classification based on EEG signals. In Proceedings of the 2015 Long Island Systems, Applications and Technology. IEEE; 2015; pp. 1–6. [Google Scholar]
- Qu, W.; Kao, C.H.; Hong, H.; Chi, Z.; Grunstein, R.; Gordon, C.; Wang, Z. Single-channel EEG based insomnia detection with domain adaptation. Computers in biology and medicine 2021, 139, 104989. [Google Scholar] [CrossRef]
- Sharma, M.; Patel, V.; Tiwari, J.; Acharya, U.R. Automated characterization of cyclic alternating pattern using wavelet-based features and ensemble learning techniques with eeg signals. Diagnostics 2021, 11, 1380. [Google Scholar] [CrossRef] [PubMed]
- Terzano, M.; Parrino, L.; Smerieri, A. Atlas, rules, and recording techniques for the scoring of cyclic alternating pattern (CAP) in human sleep. Sleep Med 2001, 3, 187–199. [Google Scholar] [CrossRef]
- Bandt, C.; Pompe, B. Permutation entropy: a natural complexity measure for time series. Physical review letters 2002, 88, 174102. [Google Scholar] [CrossRef]
- Chouvarda, I.; Rosso, V.; Mendez, M.O.; Bianchi, A.M.; Parrino, L.; Grassi, A.; Terzano, M.; Cerutti, S. Assessment of the EEG complexity during activations from sleep. Computer methods and programs in biomedicine 2011, 104, e16–e28. [Google Scholar] [CrossRef]
- Kryger, M.H. Atlas of Clinical Sleep Medicine: Expert Consult-Online; Elsevier Health Sciences, 2022.
- Bandt, C. A new kind of permutation entropy used to classify sleep stages from invisible EEG microstructure. Entropy 2017, 19, 197. [Google Scholar] [CrossRef]
- Rosso, O.A.; Larrondo, H.; Martin, M.T.; Plastino, A.; Fuentes, M.A. Distinguishing noise from chaos. Physical review letters 2007, 99, 154102. [Google Scholar] [CrossRef] [PubMed]
- Duarte, C.D.; Pacheco, M.; Iaconis, F.R.; Rosso, O.A.; Gasaneo, G.; Delrieux, C.A. Statistical Complexity Analysis of Sleep Stages. Entropy 2025, 27, 76. [Google Scholar] [CrossRef] [PubMed]
- Hou, F.; Zhang, L.; Qin, B.; Gaggioni, G.; Liu, X.; Vandewalle, G. Changes in EEG permutation entropy in the evening and in the transition from wake to sleep. Sleep 2021, 44, zsaa226. [Google Scholar] [CrossRef] [PubMed]
- Mateos, D.; Guevara Erra, R.; Wennberg, R.; Perez Velazquez, J. Measures of entropy and complexity in altered states of consciousness. Cognitive neurodynamics 2018, 12, 73–84. [Google Scholar] [CrossRef]
- Kantelhardt, J.W.; Zschiegner, S.A.; Koscielny-Bunde, E.; Havlin, S.; Bunde, A.; Stanley, H.E. Multifractal detrended fluctuation analysis of nonstationary time series. Physica A: Statistical Mechanics and its Applications 2002, 316, 87–114. [Google Scholar] [CrossRef]
- Bachmann, M.; Lass, J.; Hinrikus, H. Single channel EEG analysis for detection of depression. Biomedical Signal Processing and Control 2017, 31, 391–397. [Google Scholar] [CrossRef]
- Oliveira Filho, F.M.; Ribeiro, F.F.; Leyva Cruz, J.A.; Nunes de Castro, A.P.; Zebende, G.F. Statistical study of the EEG in motor tasks (real and imaginary). Physica A: Statistical Mechanics and its Applications 2023, 622, 128802. [Google Scholar] [CrossRef]
- Farag, A.F.; El-Metwally, S.M.; Morsy, A.A.A. Automated sleep staging using detrended fluctuation analysis of sleep EEG. In Proceedings of the Soft Computing Applications: Proceedings of the 5th International Workshop Soft Computing Applications (SOFA).
- Lee, J.M.; Kim, D.J.; Kim, I.Y.; Park, K.S.; Kim, S.I. Nonlinear-analysis of human sleep EEG using detrended fluctuation analysis. Medical engineering & physics 2004, 26, 773–776. [Google Scholar]
- Zhou, J.; Wu, X.M.; Zeng, W.J. Automatic detection of sleep apnea based on EEG detrended fluctuation analysis and support vector machine. Journal of clinical monitoring and computing 2015, 29. [Google Scholar] [CrossRef]
- Kemp, B.; Zwinderman, A.; Tuk, B.; Kamphuisen, H.; Oberyé, J. Analysis of a sleep-dependent neuronal feedback loop: The slow-wave microcontinuity of the EEG. Biomedical Engineering, IEEE Transactions on 2000, 47, 1185–1194. [Google Scholar] [CrossRef]
- Peng, C.K.; Buldyrev, S.; Goldberger, A.; Havlin, S.; Simons, M.; Stanley, H. Mosaic organization of DNA nucleotides. Phys. Rev. E 1994, 49, 1685–1689. [Google Scholar] [CrossRef]
- Pereda, E.; Quiroga, R.Q.; Bhattacharya, J. Nonlinear multivariate analysis of neurophysiological signals. Progress in neurobiology 2005, 77, 1–37. [Google Scholar] [CrossRef] [PubMed]
- West, B.J. Fractal physiology and the fractional calculus: a perspective. Frontiers in physiology 2010, 1, 12. [Google Scholar] [CrossRef] [PubMed]
Figure 1.
The complete processing workflow.
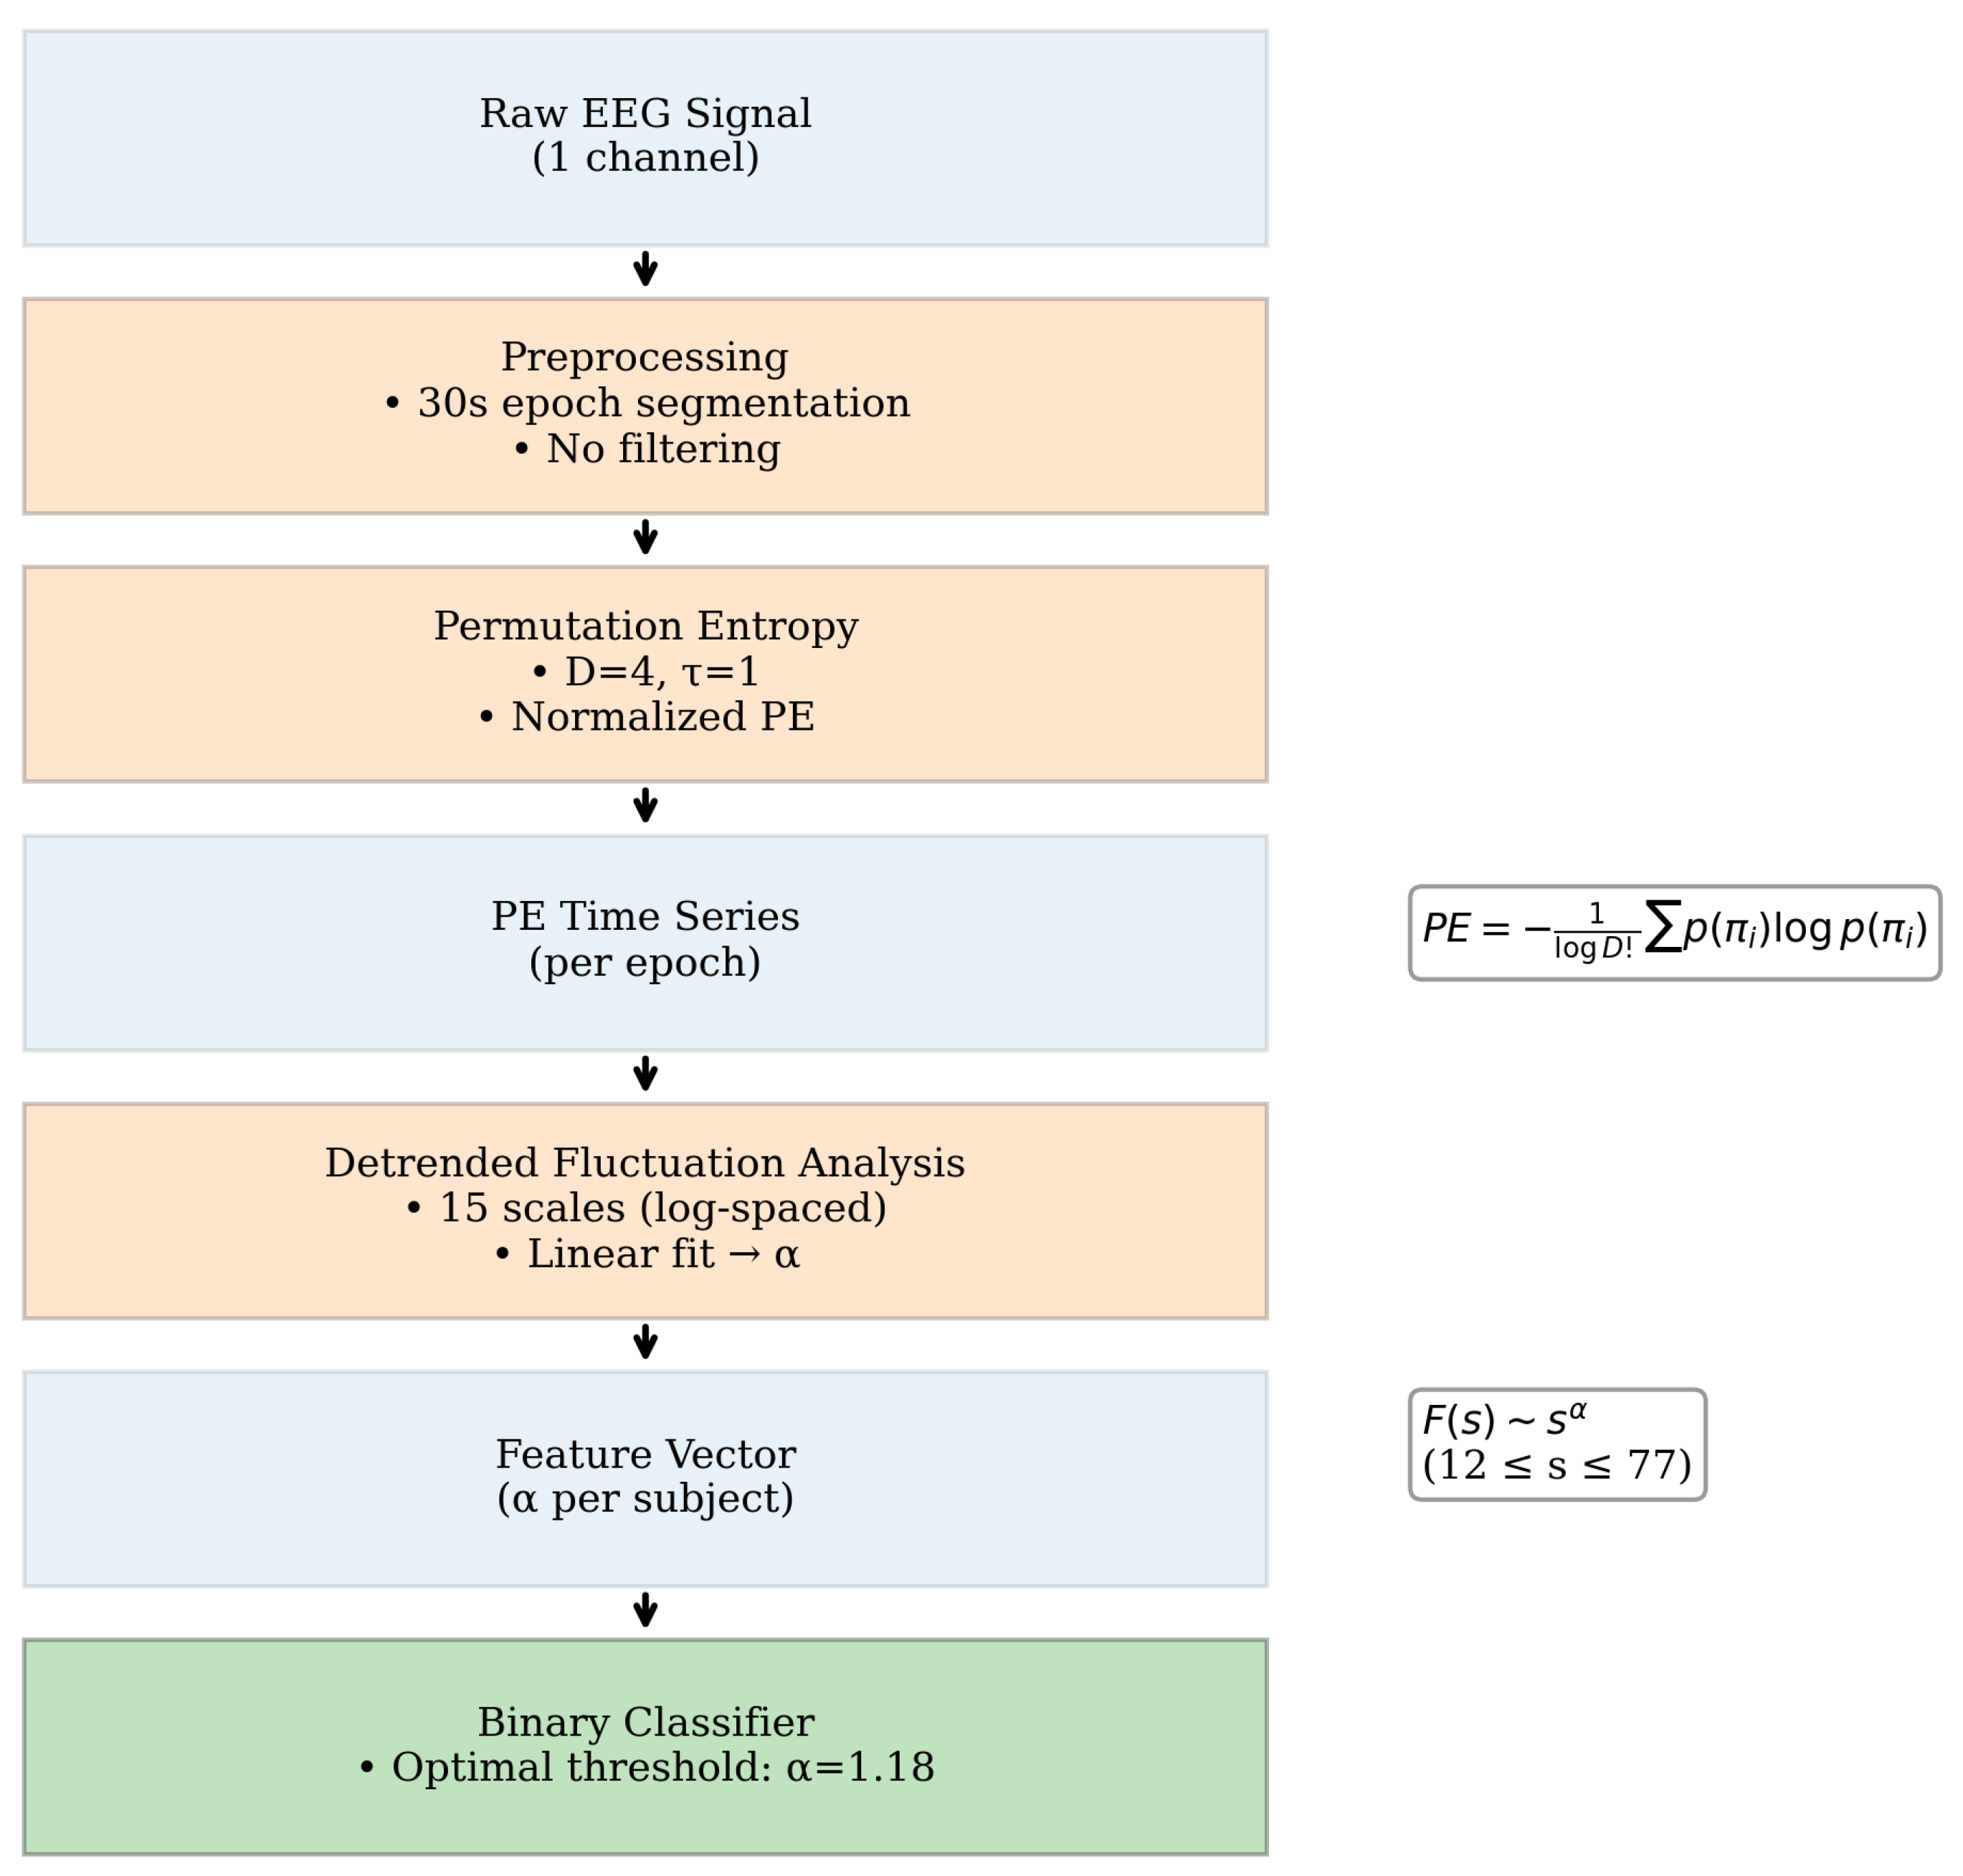
Figure 2.
Temporal evolution of Permutation Entropy (PE) for different EEG channels in subjects with RBD and healthy controls along one night. The first two panels correspond to the C4-A1 and F4-C4 channels in one RBD subjects. The last three panels correspond to the C4-A1, F4-C4 (same subject), and Fpz-Cz channels in healthy subjects.
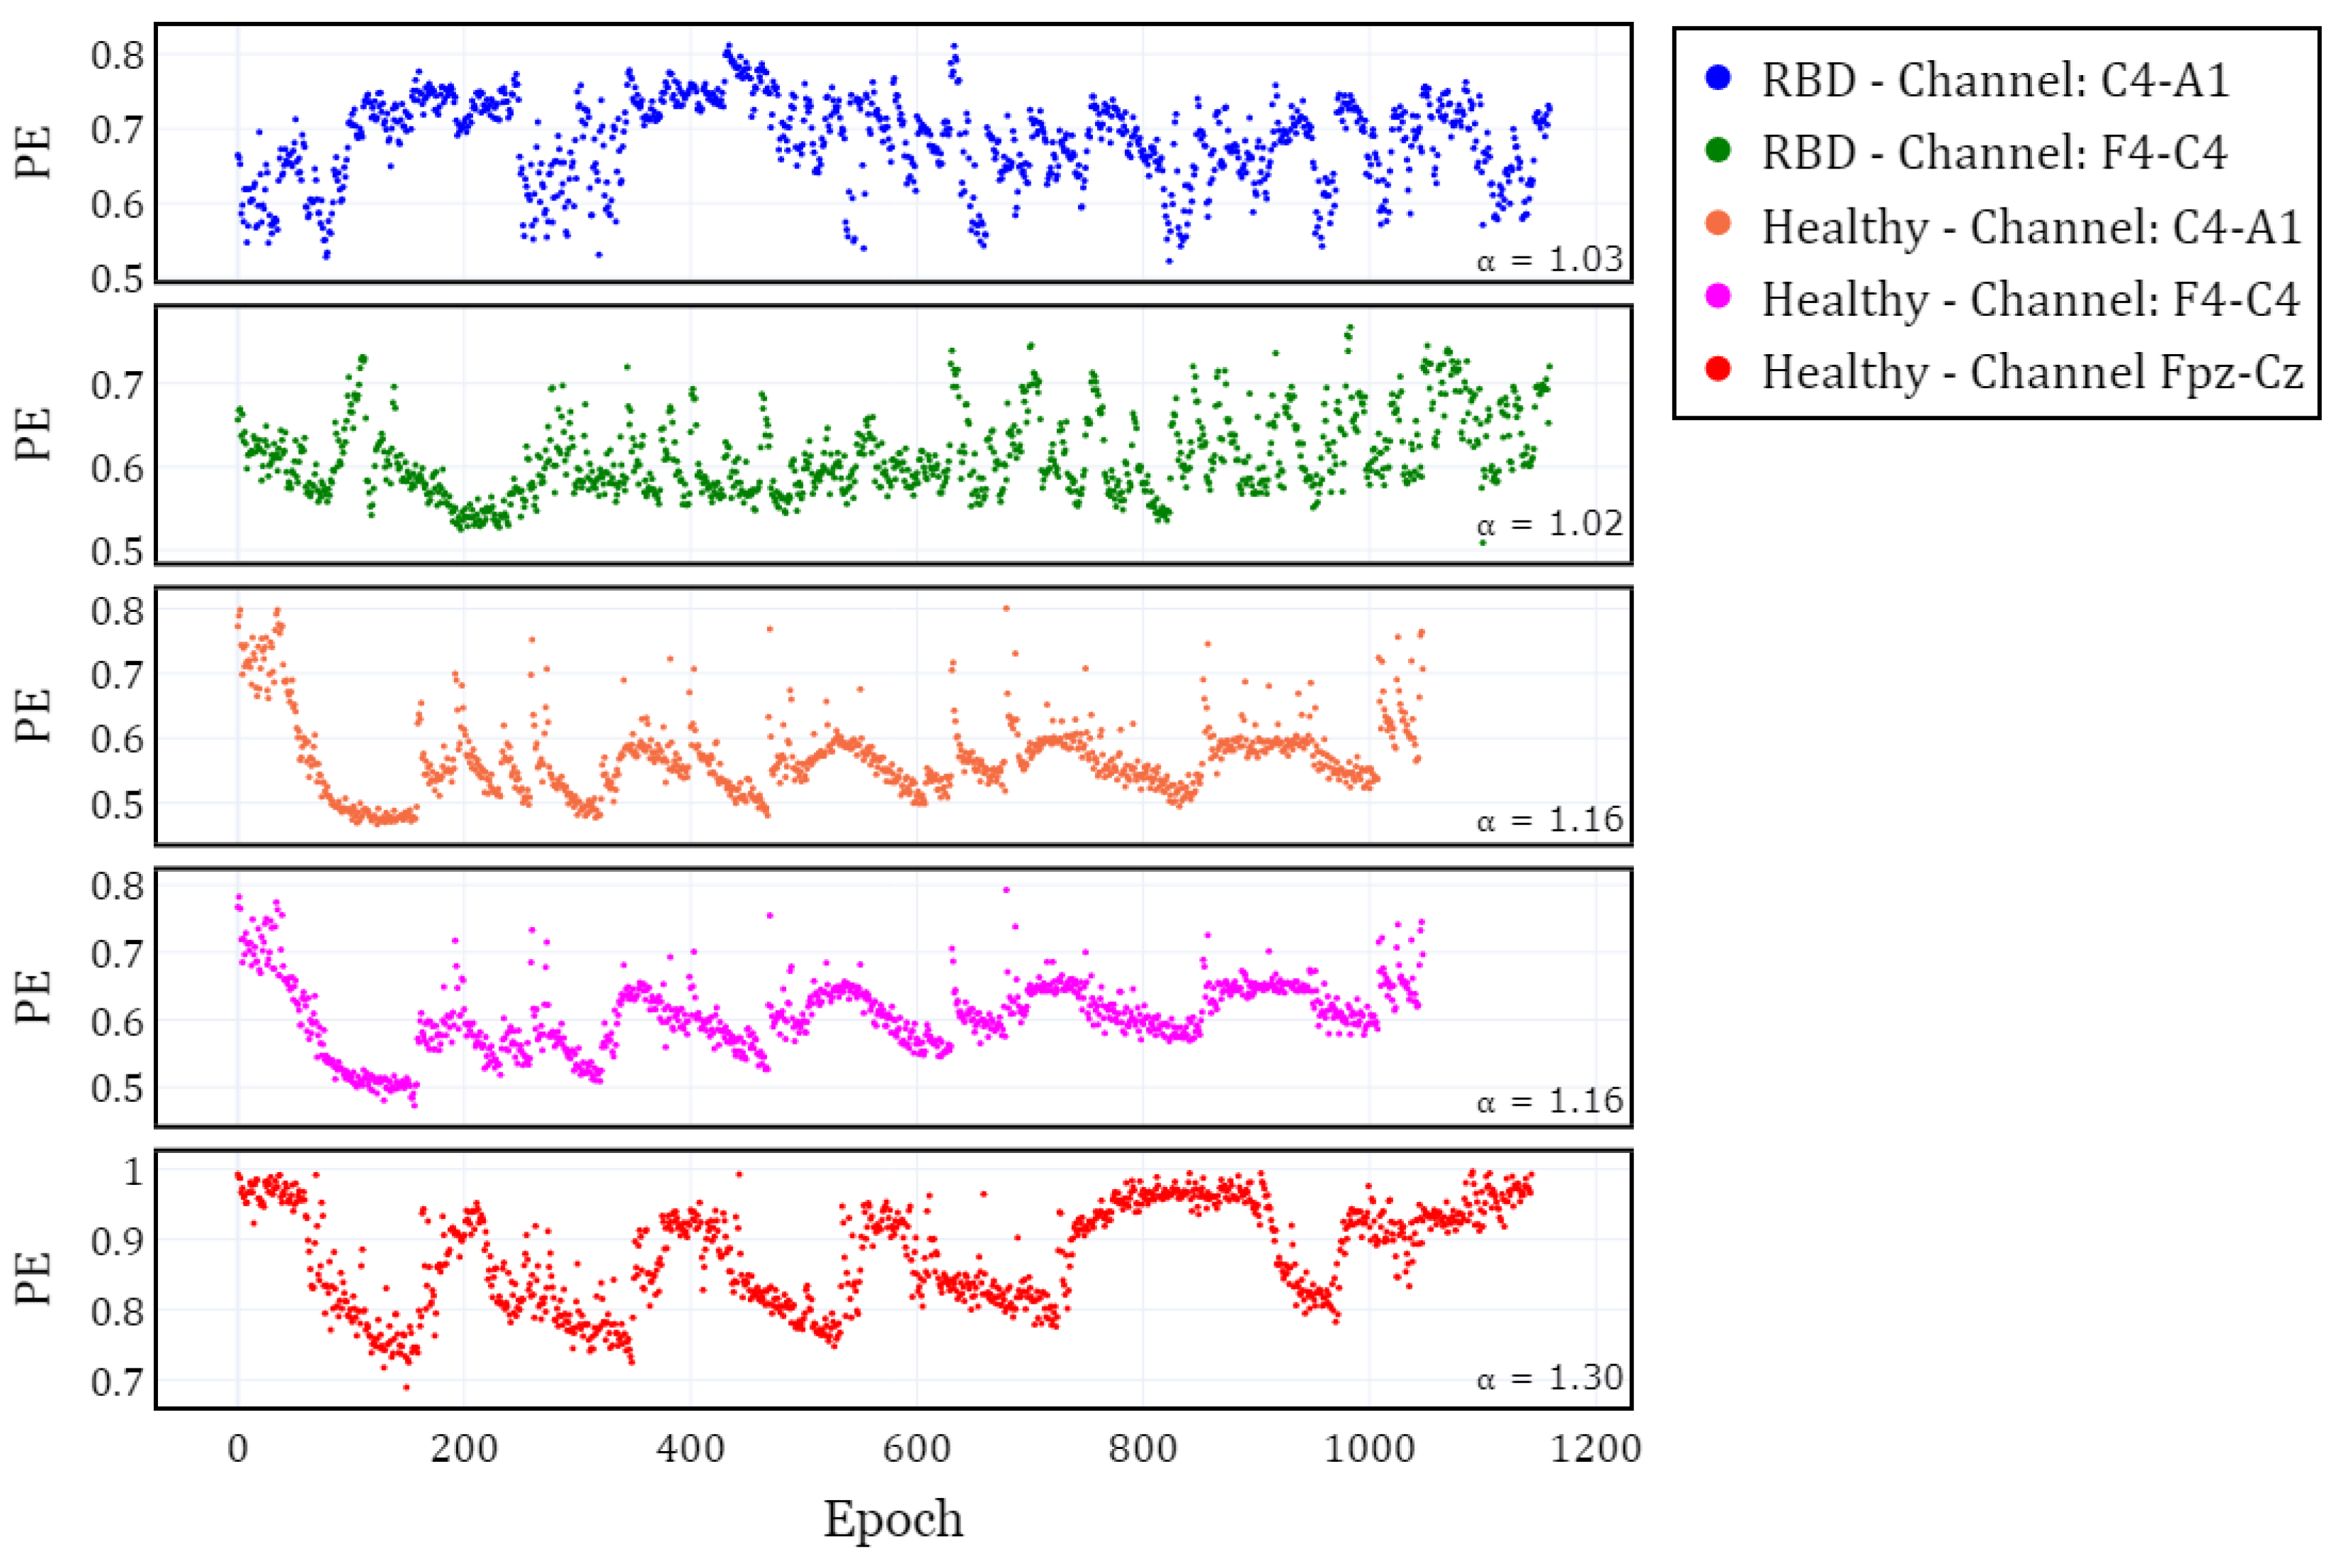
Figure 3.
Box plot of the fractal scaling exponent () for different EEG channels in subjects with RBD and healthy controls
Figure 3.
Box plot of the fractal scaling exponent () for different EEG channels in subjects with RBD and healthy controls
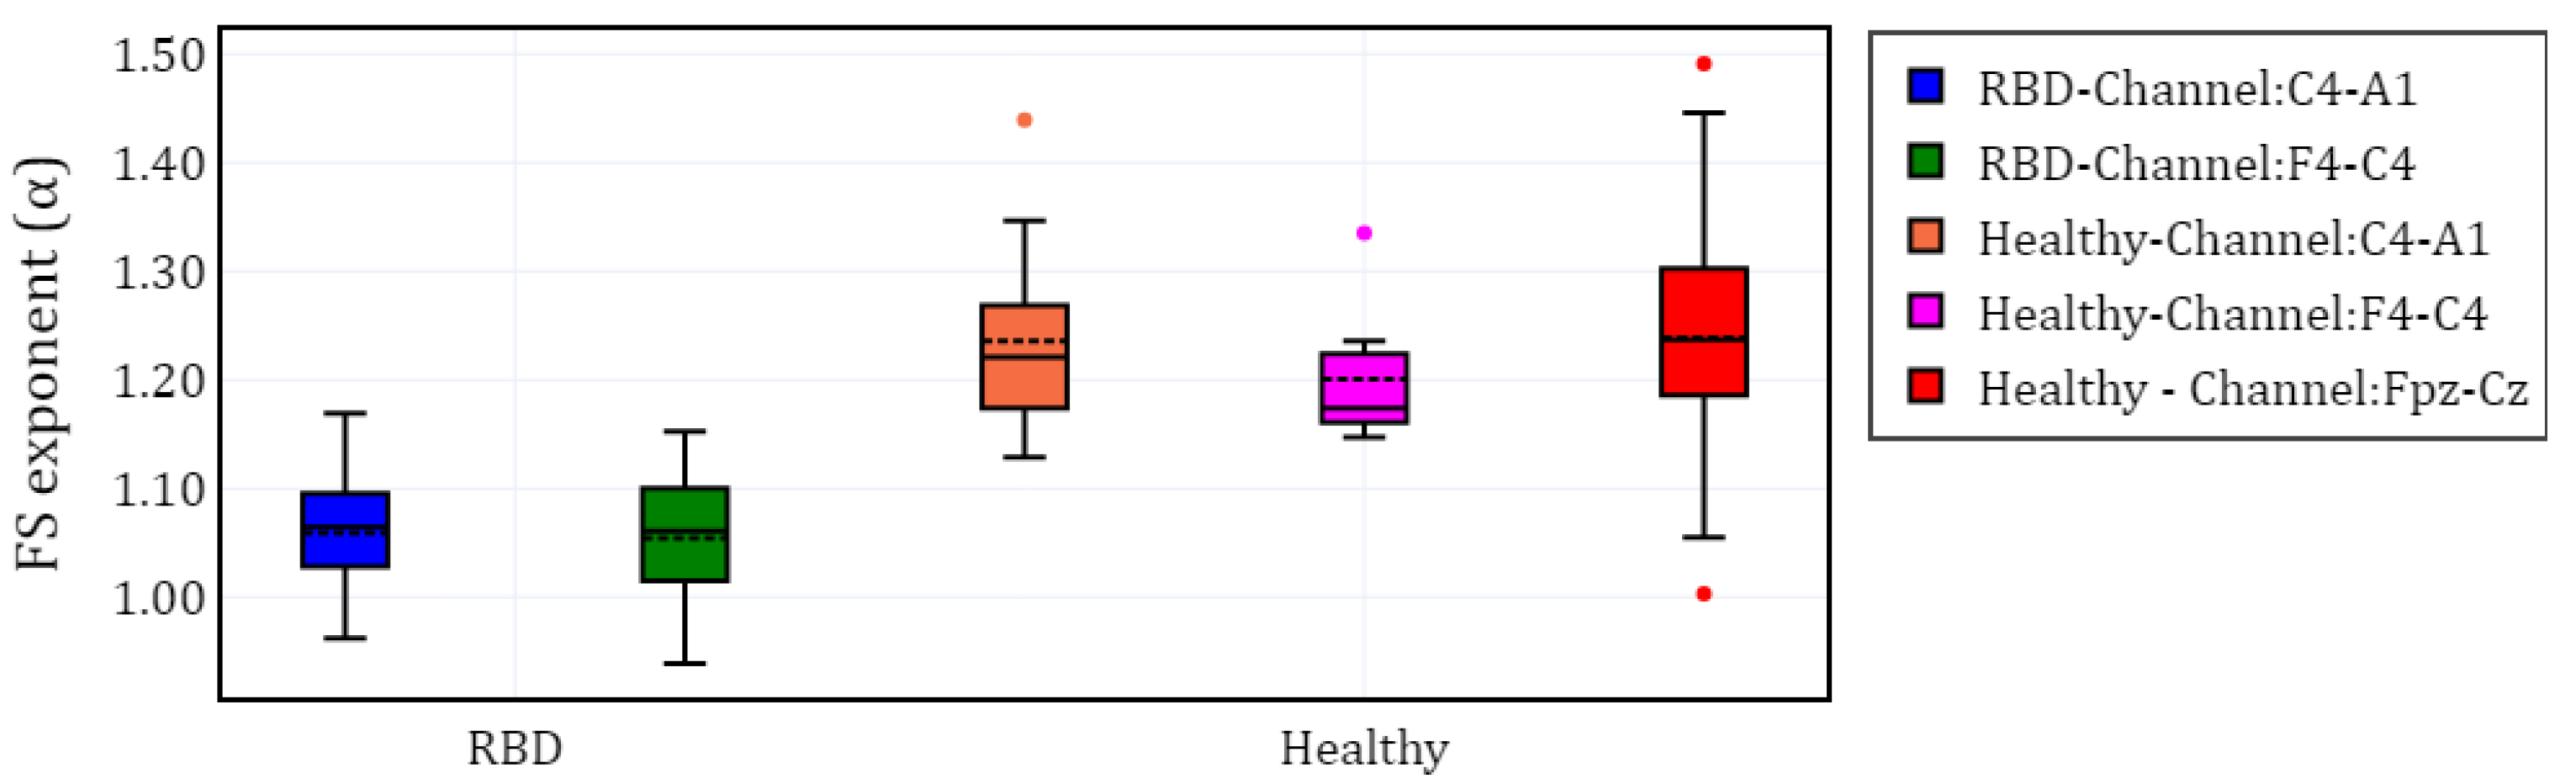
Figure 4.
ROC curve for the classification of RBD and Healthy subjects, obtained by varying the FS exponent and grouping all subjects independently of the EEG channel.
Figure 4.
ROC curve for the classification of RBD and Healthy subjects, obtained by varying the FS exponent and grouping all subjects independently of the EEG channel.
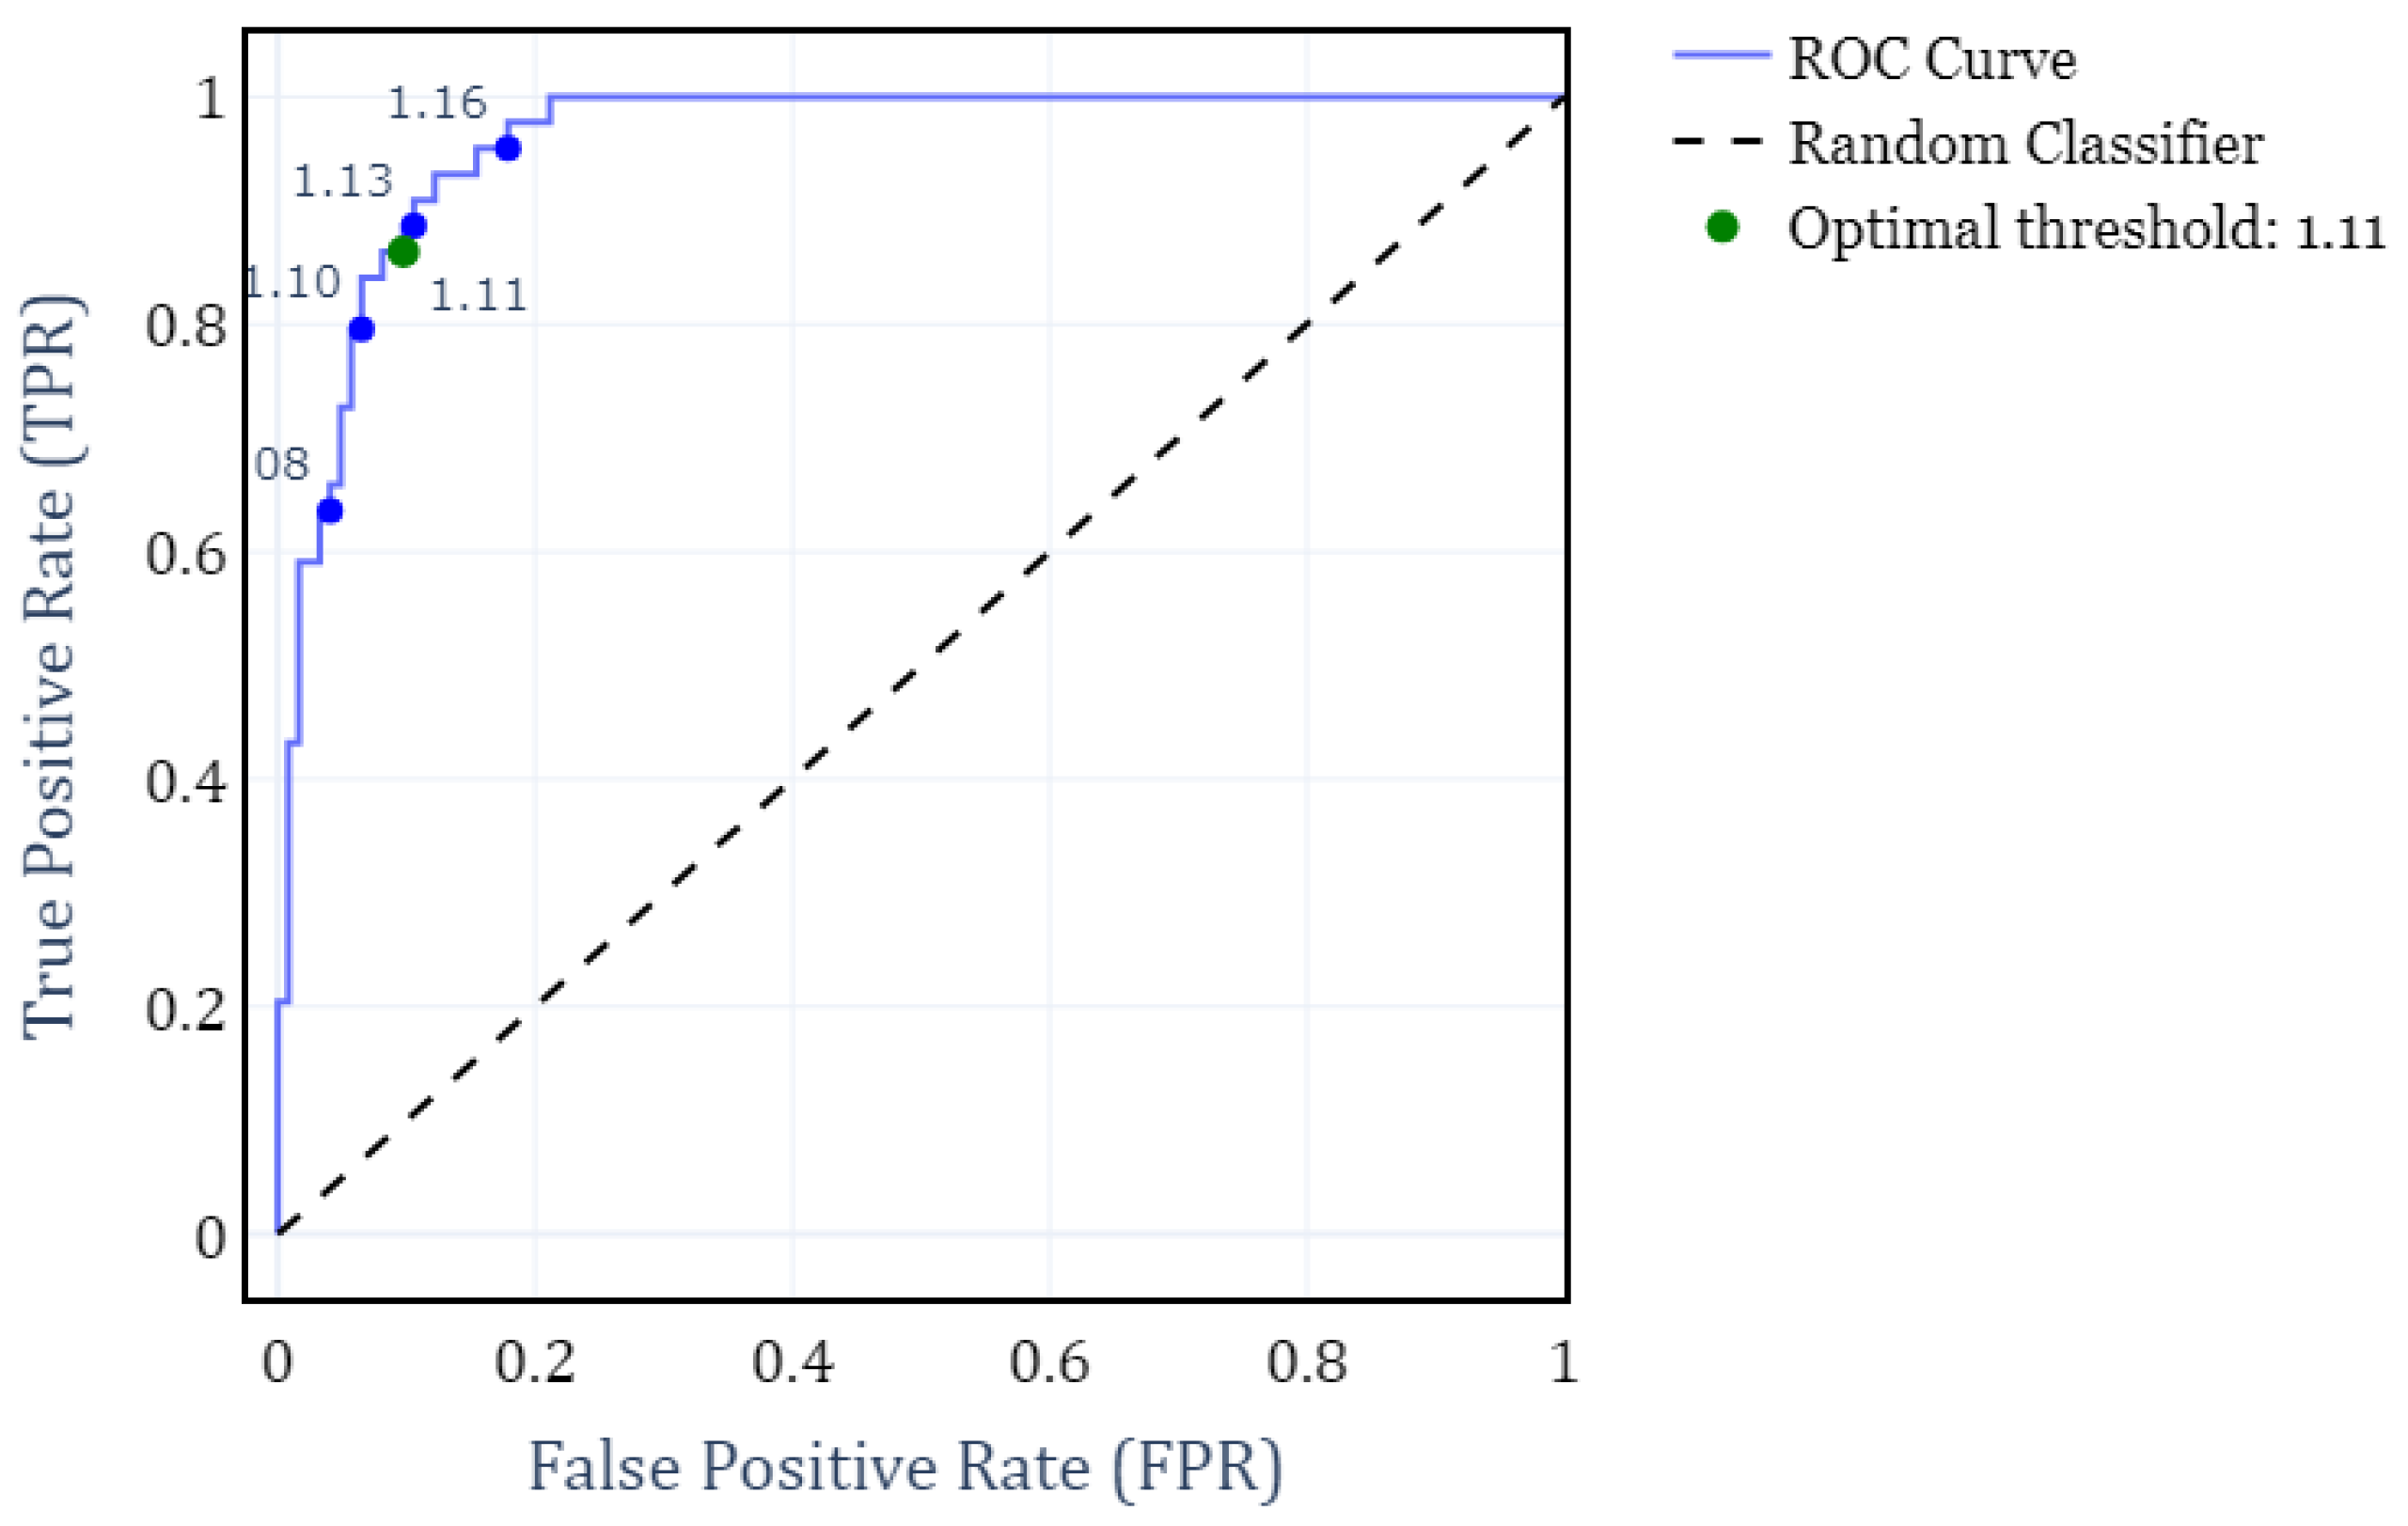
Figure 5.
Box plot of the FS exponent () for healthy and unhealthy subjects (SDB, RBD, PLM, INS, and NARCO), with all values grouped according to the available channels for each subject .
Figure 5.
Box plot of the FS exponent () for healthy and unhealthy subjects (SDB, RBD, PLM, INS, and NARCO), with all values grouped according to the available channels for each subject .
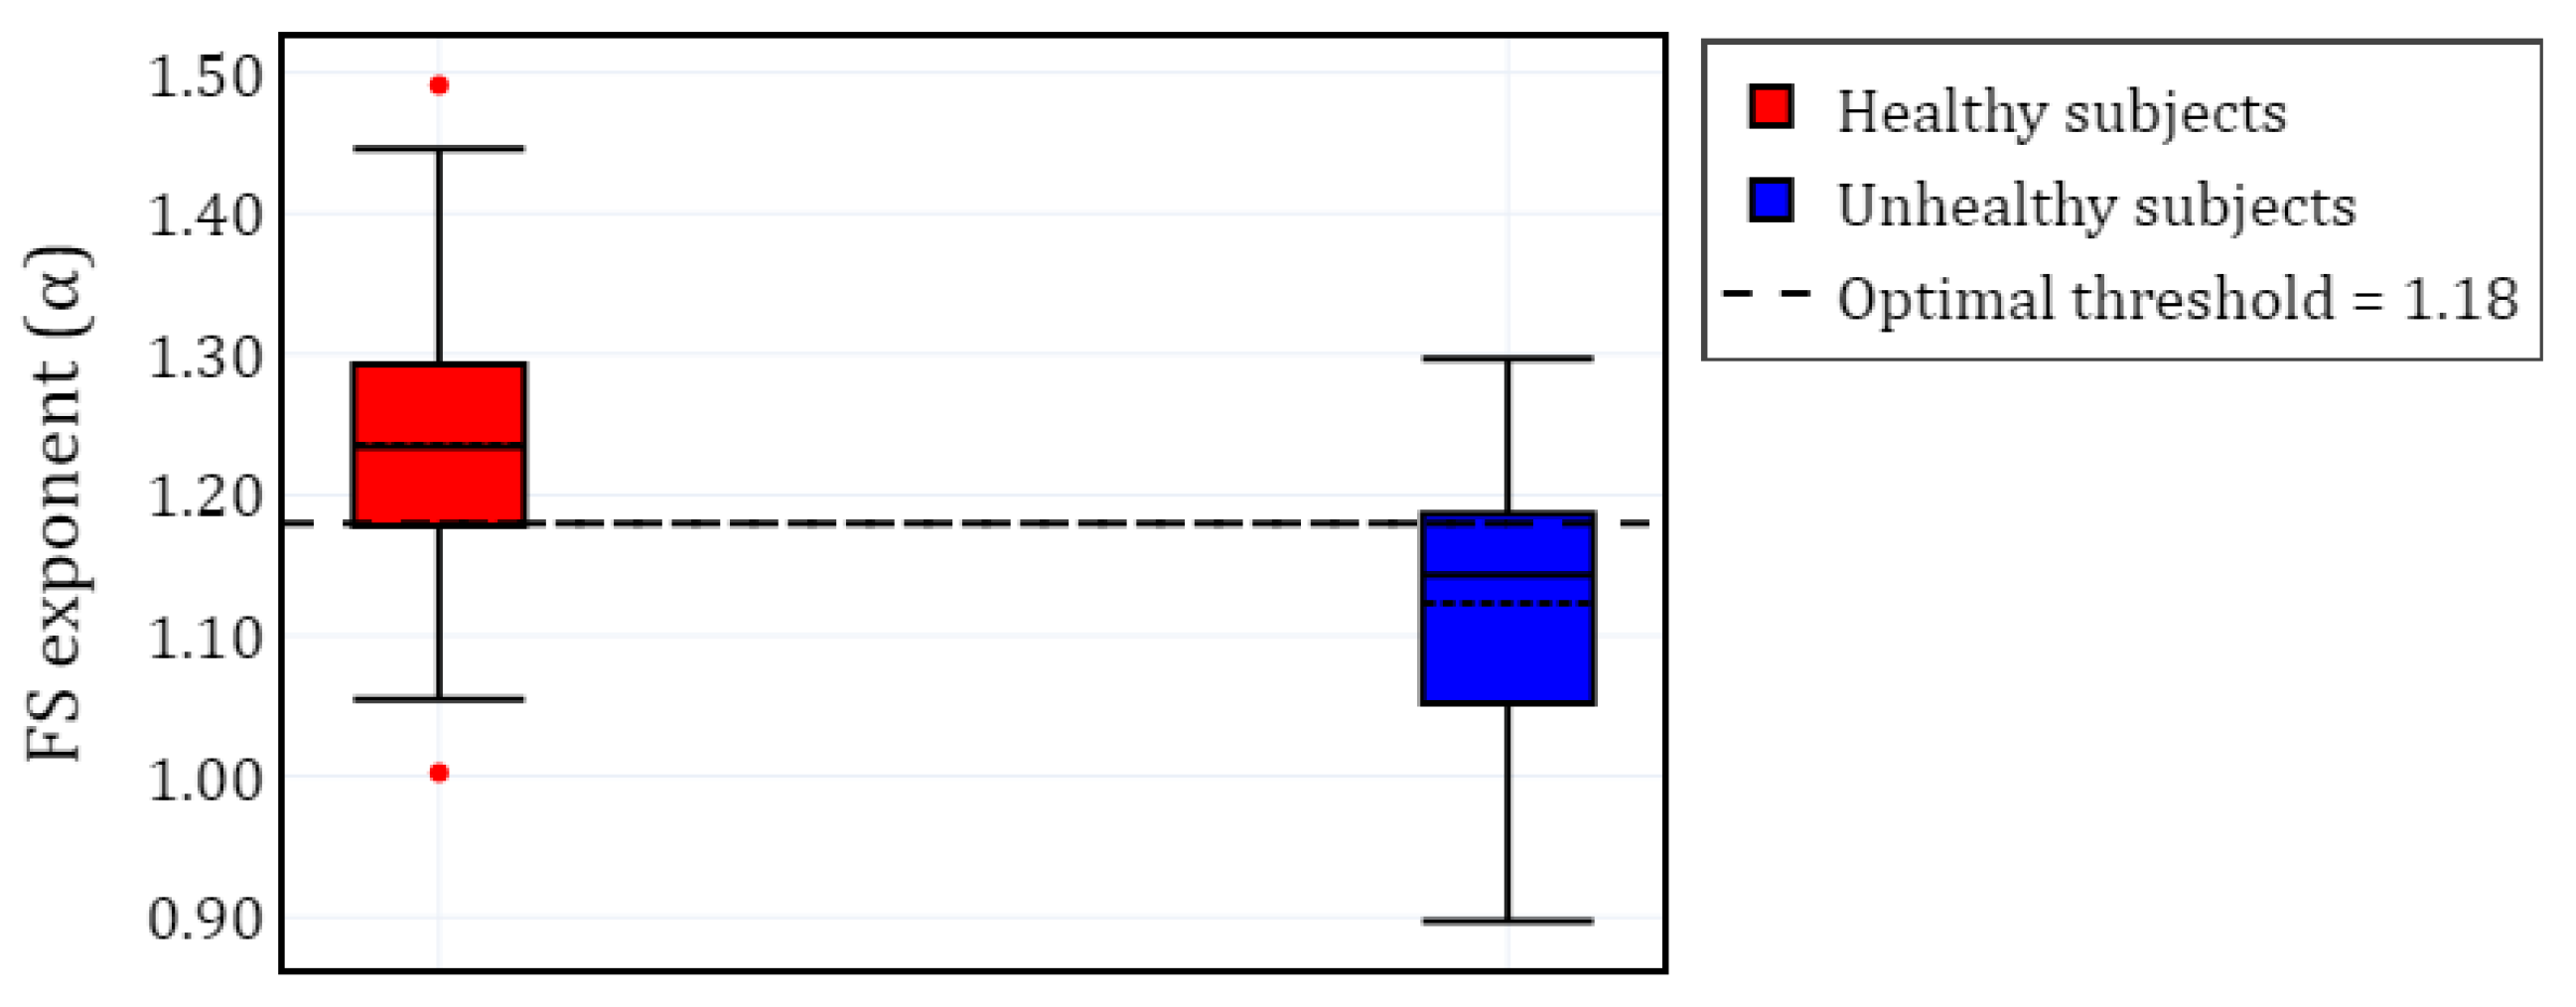

Table 1.
Summary of EEG sources, including the available EEG channels, Sampling Rates (SR) and lowpass (LP) filtering.
Table 1.
Summary of EEG sources, including the available EEG channels, Sampling Rates (SR) and lowpass (LP) filtering.
| Condition | Database | Subject Count | EEG Channels | SR (Hz) | LP filter (Hz) |
|---|---|---|---|---|---|
| SDB | CAP | 1 | C4-A1 and F4-C4 | 512 | 30 |
| 3 | C4-A1 and F4-C4 | 256 | 30 | ||
| NFLE | CAP | 29 | C4-A1 and F4-C4 | 512 | 30 |
| 9 | C4-A1 and F4-C4 | 256 | 30 | ||
| RBD | CAP | 22 | C4-A1 and F4-C4 | 512 | 30 |
| PLM | CAP | 9 | C4-A1 and F4-C4 | 512 | 30 |
| 1 | C4-A1 and F4-C4 | 256 | 30 | ||
| INS | CAP | 7 | C4-A1 and F4-C4 | 512 | 30 |
| 2 | C4-A1 and F4-C4 | 256 | 30 | ||
| NARCO | CAP | 5 | C4-A1 and F4-C4 | 512 | 30 |
| Healthy | CAP | 6 | C4-A1 and F4-C4 | 512 | 30 |
| 1 | C4-A1 and F4-C4 | 200 | 100 | ||
| 1 | C4-A1 and F4-C4 | 100 | 50 | ||
| 3 | C4-A1 | 200 | 100 | ||
| 1 | C4-A1 | 100 | 50 | ||
| 1 | F4-C4 | 200 | 100 | ||
| Expanded | 99 | Fpz-Cz | 100 | 50 |
Table 2.
Mean value () and standard deviation (SD) of the scaling exponent for each EEG channel in healthy and sleep pathology conditions.
Table 2.
Mean value () and standard deviation (SD) of the scaling exponent for each EEG channel in healthy and sleep pathology conditions.
| Condition | Channel | ||
|---|---|---|---|
| SDB | C4-A1 | 1.12 | 0.02 |
| F4-C4 | 1.12 | 0.04 | |
| NFLE | C4-A1 | 1.15 | 0.11 |
| F4-C4 | 1.15 | 0.11 | |
| RBD | C4-A1 | 1.06 | 0.06 |
| F4-C4 | 1.05 | 0.06 | |
| PLM | C4-A1 | 1.11 | 0.06 |
| F4-C4 | 1.10 | 0.06 | |
| INS | C4-A1 | 1.17 | 0.01 |
| F4-C4 | 1.18 | 0.02 | |
| NARCO | C4-A1 | 1.16 | 0.01 |
| F4-C4 | 1.16 | 0.01 | |
| Healthy | C4-A1 | 1.24 | 0.09 |
| F4-C4 | 1.20 | 0.06 | |
| Fpz-Cz | 1.24 | 0.09 |
Table 3.
Classifier performance for unhealthy vs. healthy subjects, by condition and in aggregate across all pathologies. The optimal threshold for the value is also presented
Table 3.
Classifier performance for unhealthy vs. healthy subjects, by condition and in aggregate across all pathologies. The optimal threshold for the value is also presented
| Classification | Threshold | F1-score | Weighted acc. |
|---|---|---|---|
| SDB vs. healthy | 1.14 | 0.68 | 0.88 |
| RBD vs. healthy | 1.11 | 0.89 | 0.90 |
| PLM vs. healthy | 1.11 | 0.78 | 0.89 |
| INS vs. healthy | 1.17 | 0.65 | 0.77 |
| NARCO vs. healthy | 1.17 | 0.64 | 0.80 |
| All pathologies vs. healthy | 1.18 | 0.74 | 0.74 |
Disclaimer/Publisher’s Note: The statements, opinions and data contained in all publications are solely those of the individual author(s) and contributor(s) and not of MDPI and/or the editor(s). MDPI and/or the editor(s) disclaim responsibility for any injury to people or property resulting from any ideas, methods, instructions or products referred to in the content. |
© 2025 by the authors. Licensee MDPI, Basel, Switzerland. This article is an open access article distributed under the terms and conditions of the Creative Commons Attribution (CC BY) license (http://creativecommons.org/licenses/by/4.0/).
Copyright: This open access article is published under a Creative Commons CC BY 4.0 license, which permit the free download, distribution, and reuse, provided that the author and preprint are cited in any reuse.


