
Submitted:
09 May 2025
Posted:
09 May 2025
You are already at the latest version
Abstract
Low- and medium-temperature thermal sources have the potential to reduce reliance on pollutant energy carriers such as fossil fuels. Among the most promising sources globally are solar thermal, geothermal, and residual heat. Organic Rankine Cycles (ORCs) are systems capable of harnessing these resources to produce electricity efficiently. The method by which heat is transferred from the thermal source to the working fluid plays a crucial role in ORC performance. This study evaluates several thermal oils as intermediate heat transfer media between the thermal source and the working fluid, aiming to support their selection based on key performance indicators. The parameters assessed include thermal and exergetic efficiencies, as well as mass and volumetric flow rates of both the working fluid and the thermal oil. Results indicate that incorporating a thermal oil significantly enhances the exergetic efficiency of the ORC system.
Keywords:
Organic Rankine Cycle
; Thermal Energy recovery
; thermal oil
; Exergy
; Efficiency
1. Introduction
Efficient energy use is crucial for mitigating climate change driven by anthropogenic carbon dioxide (CO2) emissions, primarily from fossil fuel consumption [1,2] and other greenhouse gases (GHGs), such as hydrofluorocarbons (HFCs) [3]. Enhancing energy efficiency has been identified as one of the most cost-effective measures to curb GHG emissions [4]. In this context, Organic Rankine Cycles (ORCs) have emerged as a prominent technology due to their operational flexibility, compact design, and capacity to harness low-grade thermal energy for electricity generation or mechanical work [2,5]. Traditional methods for improving ORC performance have focused on optimising working conditions [6,7] and selecting appropriate working fluids to maximise thermal () and exergetic () efficiencies [8,9].
ORC optimisation strategies prioritised increasing the heat source temperature to elevate the vapour pressure of the working fluid, thereby enhancing the thermodynamic cycle’s output [10,11]. Several studies have investigated using fluids such as R134a, R245fa, and R236fa for improved thermal conversion. However, these compounds are being phased out due to their high Global Warming Potential (GWP) mandated by the Kigali Amendment [12,13,14]. Beyond fluid optimisation, innovative designs have integrated Thermal Energy Recovery (TER) subsystems into ORCs to enhance heat transfer efficiency and system stability. These TER units commonly employ intermediate fluids, such as commercial thermal oils, to decouple the ORC from the primary heat source, mitigating exergy destruction and improving control over the heat exchange process [15,16]. This thermal decoupling enables more resilient system performance under variable heat input conditions, promoting sustainable energy conversion.
Recent studies have highlighted the growing interest in Organic Rankine Cycles (ORCs) coupled with thermal energy receivers (TERs) or accumulators (TEA) systems using thermal oils. These configurations enhance energy efficiency and operational flexibility, particularly in applications involving intermittent or low-temperature heat sources. TER systems allow for effective heat management and improved stability of ORC operations, enabling continuous power generation even during fluctuations in thermal input. For instance, an ORC pilot plant with a thermal energy storage chamber has been experimentally analysed, demonstrating enhanced system stability and efficiency under varying thermal loads [17]. Similarly, other studies have explored advanced configurations integrating ORC with sensible and phase change thermal storage using commercial thermal oils as heat transfer media. This integration optimises waste heat recovery in industrial settings and contributes to higher exergetic efficiencies [18,19]. The literature also emphasises the importance of selecting appropriate thermal oils and designing efficient TER systems to maximise ORC performance. From a general point of view, integrations of indirect heating improve energy efficiency and support sustainable energy utilisation by enhancing renewable energy integration and reducing greenhouse gas emissions [20].
This study presents a comprehensive thermodynamic analysis of an ORC system enhanced by a TER unit operating with three industrial thermal oils: Therminol LT, Paratherm HR, and Paratherm NF. Two TER configurations are evaluated to analyse the impact of temperature profiles and pinch-point temperatures on energy delivery quality and overall system performance. An integrated simulation model is developed to assess thermal () and exergetic () efficiencies, net power output, mass and volumetric flow rates, and key design parameters of the heat exchangers. The primary objective of this work is to identify optimal conditions and configurations that maximise system efficiency while minimising irreversibilities, providing clear guidelines for the sustainable design of ORC-TER systems in industrial applications, leveraging low-temperature waste heat sources.
2. Thermodynamic Theory and Modelling
2.1. Thermodynamic Model
Figure 1a shows a basic ORC fed by a thermal source, while Figure 1b displays the same layout connected to a thermal energy recovery (TER) that operates with a thermal oil. In the standard ORC, depicted in Figure 1a, a saturated liquid (1) is compressed in a pump, obtaining a subcooled liquid (2); the liquid is heated until a saturated liquid at high pressure (3l) and then vaporised (3). These isobaric processes (2 to 3) obtain energy from exhaust gases. Finally, the saturated vapour (3) is expanded until the condenser pressure (4). In contrast, in Figure 1b, the thermal source energises the boiler while the remaining energy is used to heat a thermal oil. The oil preheats the fluid from the subcooled liquid to saturation. The rest of the cycle is identical to the previously described.
The configuration of Figure 1 are represented in the temperature vs entropy projection in Figure 2. Figure 2 represent the thermal source (exhaust gases) in crimson lines, while the TER is depicted in blue. In both cases, the points of the cycle are illustrated in green. The latter profile shows three fundamental points for analysing the source. The thermal source enters the boiler or heat exchanger with a temperature . After the phase change of the working fluid, the temperature of the thermal source is , constituting an intermediated temperature of the source. The remaining energy from the thermal source is then delivered to the working fluid to preheat the saturated liquid after the compression in the pump, yielding a final temperature of .
Figure 2b displays two different TER configurations representing the limiting conditions of of the system. The configuration C1 is set to have a thermal oil with a temperature near to the thermal source with a pinch point, , as a fixed parameter. The second configuration, C2, is defined as having a pinch point as a function of the outlet temperature of the condenser, as shown in the blue lines. In both cases, configurations can be set using the design of the heat exchanger, the temperature of the thermal source, and the mass flow of oil or the heated fluid. The entropy scales in Figure 2 are merely illustrative. It is important to remark that the pinch-point temperature is defined differently depending on the configuration, as shown in Figure 2b.
The thermal efficiency of a power cycle is determined by the ratio between the net power output, , to the energy used in the process, . In a single-stage ORC, where each piece of equipment has the same mass flow, the thermal efficiency, , is given by
The added heat is the sum of the amount of energy of the heater and the boiler, . Additionally, the net work may be written as , being the amount of extracted heat in the condenser.
The amount of heat can be calculated by the enthalpy differences between two points of the cycle. For instance, for the heater stage, the energy change is given by
where the subscripts represent the same nomenclature shown in Figure 2. The ORC uses one of the most common working fluids, R134a [21,22]. The thermophysical properties are obtained using the multiparametric equation of state for the compound [23].
The flow-specific exergy can be defined as [24]
where the subscript k concerns the cycle’s flows while the subscript 0 represents the dead-point condition, chosen at a temperature of 293.15 K.
In a simple and adiabatic tube-and-shell heat exchanger, the supplied exergy is obtained through the decrease in the hot-flow exergy. Also, the recovered exergy is the increase in the cold-flow exergy, as long as it is not at a lower temperature than the surroundings [24,25]. Therefore, the exergetic efficiency between the heater-boiler and the source yields
In the same way, which is evaluated as heater-boiler exergetic efficiency, the heater and the boiler can be separately assessed. This study is centred on the evaluation of heater exergetic efficiency. The latter can be written as
Adding the TER between the thermal source and the working fluid changes Eq (4). Considering Configuration 1 and 2, the exergetic efficiency for both configurations can be expressed as
where the differences in the TER exergies for both configurations are given by
where is the dead-point temperature, while and are the operational temperatures. Additionally, the isobaric heat capacity of the thermal oil, , may be function of the temperature.
Three commercial thermal oils have been analysed in this work: Therminol LT ( g/mol) [26], Paratherm HR ( g/mol) [27], and Paratherm NF ( g/mol) [28]. The selection among twenty nine thermal oils was performed based on a first analysis of the density, viscosity, heat capacity, thermal conductivity, flash point, and, mainly, operational temperature range. The isobaric heat capacity of the selected thermal oils had been fitted to experimental data [26,27,28] by a second-order polynomial as
Table 1 shows the constants, for the thermal oils heat capacity in the temperature range between 313.15 to 493.15 K. Table 2 presents the assumptions that delimit this study’s scope, including using an ORC turbine with a displaced volume of per revolution. A steam turbine is probably the most flexible driver available to industry. With the advent of modern precision gears, turbine speeds are seldom below 1200 rpm and may be as high as 25000 rpm [29]. This study is considered 2900 rpm for the operation of the ORC turbine. The condenser has a fixed temperature of 303.15 K. Moreover, the driving equipment is isentropic, i.e., their efficiency is 100 %. In any event, the efficiency of the turbomachinery does not influence the exergetic evaluation of the isobaric stages.
Combustion exhaust gas is used as the thermal source. The gas is modelled using the standard air assumptions and data [30]. The air temperature entering the ORC is fixed at 493.15 K. In contrast, the outlet temperature is fixed at 373.15 K. Consequently, the mass flow ratio of the thermal source varies depending on the energy the working fluid needs to reach the saturated vapour state. As shown in Table 2, three values for the pitch point temperature are considered in typical operation ranges. The enthalpy and entropy of the air are calculated using second-order polynomial [31]. Furthermore, to simplify the analysis, the system is considered to have steady-state conditions in all components, and the heat and friction losses in the system are neglected.
2.2. Heat Exchanger Sizing Model
In order to size the shell-and-tube heat exchanger used for the heat transfer between the thermal oil and the refrigerant, the mass flow oil that passes through the heat exchanger is the key parameter. The ass flow refrigerant is obtained using compressor load [31,32], which is given by
where is the displaced volume in , the volumetric performance, and the working fluid density in the turbine outlet. The mentioned density is related to the maximum value that may take the vapour density in an ORC. Therefore, also is related to the maximum value of mass flow working fluid that may be taken advantage of in the turbine. Further, is a function of the compression relation, .
The oil mass flow in the heat exchanger varies depending on the energy the working fluid needs to reach the saturated vapour state. Therefore, their values also depend on the mass flow of working fluid. To compute the volumetric flow, , the density as a function of the temperature is obtained by a fitted second-order polynomial. Table 1 shows the constants, , for
The velocity in the heat exchanger is a critical variable. Shell-side velocity lies between 0.6 to 1.5 m/s for water and similar liquids, and the number of tubes is chosen so that the tube-side velocity for water and similar liquids lies between 0.9 to 2.4 m/s [33,34]. In this work, the velocity is used as a function of the volumetric flow and piping diameter concerning the selection and sizing of the piping, fitting, valves, and pumps in hydraulic systems [35]. The velocity can calculated as
where v is the velocity in m/s, is the volumetric flow in , and D is the interior tube diameter in mm, limited to the commercial diameter (DN or NPS). The heat exchanger’s base case comprises six tubes, as in Pasupuleti’s work [33].
3. Thermodynamic Behaviour of ORC-TER System
To elucidate the performance enhancement introduced by the integration of an intermediate energy accumulator based on thermal oil, a direct-heated ORC configuration is employed as a benchmark. Figure 3 presents the thermal and exergetic efficiencies for the three evaluated scenarios: the two TER configurations (C1 and C2) and the direct thermal source case, each assessed as a function of the boiler saturation temperature. The thermal efficiency, , as depicted in Figure 3a, demonstrates no sensitivity to the inclusion of a TEA. This outcome is consistent with the thermodynamic expectation that the mode of heat delivery to the boiler does not influence the first-law performance of the cycle. Furthermore, a positive correlation between boiler saturation temperature and thermal efficiency is observed, reflecting the classical behaviour of Rankine-based systems. Notwithstanding these trends, the selection of operational parameters must account for critical system constraints, including the need to avoid proximity to the working fluid critical point [36], to operate below the maximum allowable pressure of construction materials, and to ensure a sufficiently high vapour quality at the turbine outlet [14] to mitigate the risk of mechanical degradation.
Furthermore, Figure 3b illustrates the exergetic efficiency of both TEA configurations at a fixed pinch temperature of 10 °C concerning the working fluid, compared to the direct-heated benchmark, depicted in black. Configuration C2 exhibits a markedly higher exergetic efficiency than C1. This result highlights the importance of aligning the thermal oil temperature with the working fluid profile, maintaining proximity to the system’s saturation temperature while preserving the specified pinch temperature difference. From a design perspective, this alignment enables more effective utilisation of the available thermal potential, reduces irreversibilities in the heat transfer process, and maximises the quality of the delivered energy.
As illustrated in Figure 3b, the improvement in heat delivery quality is substantial when thermal oil is employed to indirectly preheat the working fluid. Consequently, it is essential to evaluate the influence of thermal oil properties and pinch-point temperature on this effect. Figure 4 presents the average relative percentage difference in exergetic efficiency for the three thermal oils analysed.
In configuration C1, shown in Figure 4a, exergetic efficiency decreases at low pinch-point temperatures and exhibits only a slight improvement as the pinch-point increases, with minimal variation across the different oils. Conversely, configuration C2, shown in Figure 4b, demonstrates a pronounced increase in exergetic efficiency at low pinch-point temperatures, reaching up to a twofold improvement. These findings indicate that configuration C2, combined with a low pinch-point temperature, yields superior performance. Nevertheless, the pinch-point must be sufficiently high to ensure adequate heat transfer, depending on the heat exchanger design.
The characteristics of the system impose constraints on the working fluid flow rate, while turbine specifications define the flow demands and the mechanical output. Equipment design and dimensions are also established based on these parameters. Figure 3a illustrates the mass flow rate, whereas Figure 5b presents the volumetric flow rate. Although volumetric flow is the primary variable for equipment sizing and scaling, the mass flow exhibits a distinct minimum near 80 °C. This trend provides a practical guideline for system optimisation, as selecting a boiler temperature in proximity to this minimum allows for a balanced design that reduces equipment size while maintaining efficient operation.
Once the working fluid flow rates are characterised, it becomes essential to compare them with the thermal oil flows, which constitutes a critical design parameter for the boiler. Figure 6a–c illustrate the mass flow rates of the thermal oils, while Figure 6d–f present the corresponding volumetric flow rates as functions of the working fluid saturation temperature, under three different pinch-point temperature conditions. In all mass flow cases, configuration C2 exhibits higher flow rates compared to the configuration that follows the working fluid temperature profile. A similar behaviour is observed in the volumetric flows, where the thermophysical properties of each oil influence the slope and magnitude of the curves. For instance, Oil 2 displays limited thermal expansion across the evaluated pinch-point temperature range. Additionally, a notable variation in flow behaviour is observed at higher working fluid temperatures (above approximately 80 °C), where flow rates either significantly increase or decrease depending on the configuration. This effect must be considered in the design of heat exchangers. Although configuration C2 achieves superior efficiency, it also demands higher flow rates, which in turn increases the required heat transfer surface and equipment size. Therefore, while elevated working fluid temperatures enhance system efficiency, their impact on the physical dimensions and overall feasibility of the thermal equipment must be carefully balanced during the design phase.
Figure 7 provides a general overview of the thermodynamic behaviour of the cycle in the absence of the thermal oil heating system. Although the behaviours are independent of the thermal oil configuration, the analysis offers valuable insights into the internal heat distribution and phase change characteristics. In Figure 7a, the black bold line represents the total heat input to the boiler, while the crimson line denotes the heat distribution between the boiler and the heater. An inverse trend is observed: as the boiler temperature approaches the critical point of the working fluid, the heat in the boiler decreases, whereas the heat absorbed in the heater increases. Despite the differing heat transfer mechanisms, the total energy input remains almost constant, maintaining thermal balance and aiding in equipment sizing. Additionally, Figure 7b presents the vapour fraction at the boiler outlet. As shown, increasing the boiler temperature results in a higher proportion of liquid phase at the outlet. However, the vapour fraction remains below 0.90 in all cases, ensuring stable operation within the design specifications.
The previous analysis indicates that the design and operational parameters converge to favourable values around 80 °C for R134a, the working fluid under study. Therefore, a detailed discussion of system performance at the aforementioned temperature is warranted to elucidate its behaviour near optimal operating conditions. This evaluation should account not only for thermal and exergetic efficiencies but also for design and sizing considerations of the involved components.
Figure 8 presents the performance of the overall system at an operating temperature of 80 °C. In Figure 8a, the exergetic efficiencies of all configurations are displayed. The grey line denotes the reference case of a direct-heated ORC, while the grouped bars represent the results obtained using different thermal oils. A general decrease in exergetic efficiency is observed when Configuration 1 is employed, except for a pinch-point temperature of 15 °C, which slightly exceeds the benchmark. Conversely, Configuration 2 consistently enhances the quality of heat delivery from a second-law perspective.
Figure 8b shows the corresponding volumetric flow rates. These remain consistent across the thermal oils and are significantly lower than the flow rate of the working fluid. Figure 8c illustrates the resulting pipe diameters, determined based on average flow velocities. The calculated diameters fall within standard commercial ranges: approximately 6.35 mm (3/8 in) for thermal oil circuits and 19.05 mm (3/4 in) for the working fluid lines.
These results indicate that the most influential factors in system performance are the configuration and operating conditions rather than the specific choice of thermal oil, as key design parameters remain comparable across all tested fluids.
4. Concluding Remarks
This study assessed the quality of energy transfer from a residual heat source to a working fluid in an Organic Rankine Cycle (ORC), focusing on the use of a shell-and-tube Thermal Energy Receiver (TER) as a benchmark configuration. The results indicate that both thermal and exergetic efficiencies increase with boiler temperatures approaching the critical point of the working fluid. For the direct-heated ORC, thermal efficiency depends primarily on the temperature difference between the boiler and the heat source, with a maximum value of approximately 50 %.
Incorporating a TER with an optimised temperature profile significantly enhances the exergetic efficiency. Two limiting configurations were evaluated: one following the thermal source profile and the other aligned with the isobaric heating profile of the working fluid. The latter showed superior performance, with exergetic efficiency reaching nearly 90 %. The pinch-point temperature exhibited negligible influence on system thermal efficiency.
Furthermore, all thermal oils investigated yielded similar mass and volumetric flow rates, inner velocities, and required pipe diameters, which correspond well with commercially available tubing (6.35 mm). Thermal Oil 2 demonstrated favourable behaviour among the tested fluids due to its thermal stability and minimal variation in thermophysical properties under operating conditions. These results indicate that the most influential factors in system performance are the configuration and operating conditions rather than the specific choice of thermal oil, as key design parameters remain comparable across all tested fluids.
Author Contributions
Conceptualization, A. Birriel and J. González; methodology, J. González, A. Birriel, and H. Quinteros-Lama; validation, A. Birriel and J. Romero; formal analysis, J. González, N. Saavedra, A. Birriel, and J. Romero; investigation, A. Birriel, J. Romero, and N. Saavedra; resources, J. González, and H. Quinteros-Lama; writing-original draft preparation, A. Birriel, J. González, and H. Quinteros-Lama; writing-review and editing, J. González and H. Quinteros-Lama; visualization, J. González and H. Quinteros-Lama; supervision, J. González, and H. Quinteros-Lama; project administration, A. Birriel; funding acquisition, J. González and H. Quinteros-Lama. All authors have read and agreed to the published version of the manuscript.
Acknowledgments
A. Birriel gratefully acknowledges the support provided by the Guillermo Blanco Scholarship from the Universidad de Talca, Chile. J. G. and H. Q.-L. acknowledge funding from the National Fund for Scientific and Technological Development (FONDECYT), Chile, under Grant Nos. 11250144 and 1240765.
Conflicts of Interest
The authors declare no conflict of interest.
Abbreviations
The following abbreviations are used in this manuscript:
| C1 | Configuration 1 |
| C2 | Configuration 2 |
| GHG | Greenhouse gases |
| GWP | Global Warming Potential |
| ORC | Organic Rankine cycle |
| TEA | Thermal Energy Accumulator |
| TER | Thermal Energy Receiver |
| WF | Working Fluid |
References
- Sorrell, S. Reducing energy demand: A review of issues, challenges and approaches. Renewable and Sustainable Energy Reviews 2015, 47, 74–82. [Google Scholar] [CrossRef]
- Jiménez-García, J.C.; Ruiz, A.; Pacheco-Reyes, A.; Rivera, W. A comprehensive review of organic rankine cycles. Processes 2023, 11. [Google Scholar] [CrossRef]
- Forman, C.; Muritala, I.K.; Pardemann, R.; Meyer, B. Estimating the global waste heat potential. Renewable and Sustainable Energy Reviews 2016, 57. [Google Scholar] [CrossRef]
- Intergovernmental Panel on Climate Change. Climate Change 2007: Synthesis Report; IPCC, 2007.
- Goyal, A.; Sherwani, A.F.; Tiwari, D. Optimization of cyclic parameters for ORC system using response surface methodology (RSM). Energy Sources, Part A: Recovery, Utilization, and Environmental Effects 2021, 43, 993–1006. [Google Scholar] [CrossRef]
- González, J.; Garrido, J.M.; Quinteros-Lama, H. Analysis of the Maximum Efficiency and the Maximum Net Power as Objective Functions for Organic Rankine Cycles Optimization. Entropy 2023, 25, 882. [Google Scholar] [CrossRef] [PubMed]
- Zhang, X.; Zhang, Y.; Wang, J. New classification of dry and isentropic working fluids and a method used to determine their optimal or worst condensation temperature used in Organic Rankine Cycle. Energy 2020, 201, 117722. [Google Scholar] [CrossRef]
- Yadav, K.; Sircar, A. Selection of working fluid for low enthalpy heat source Organic Rankine Cycle in Dholera, Gujarat, India. Case Studies in Thermal Engineering 2019, 16, 100553. [Google Scholar] [CrossRef]
- González, J.; Llovell, F.; Garrido, J.M.; Quinteros-Lama, H. Selection of a suitable working fluid for a combined organic Rankine cycle coupled with compression refrigeration using molecular approaches. Fluid Phase Equilibria 2023, 572, 113847. [Google Scholar] [CrossRef]
- Bronicki, L.Y. Technologies and Applications. In Organic Rankine Cycle Power Systems; Elsevier, 2017; pp. 25–66. [Google Scholar]
- Liu, B.T.; Chien, K.H.; Wang, C.C. Effect of working fluids on organic Rankine cycle for waste heat recovery. Energy 2004, 29, 1207–1217. [Google Scholar] [CrossRef]
- European Parliament and Council. Amendment to the Montreal protocol on substances that deplete the ozone layer, 2016.
- Loni, R.; et al. Waste heat recovery with ORCs: Challenges and future outlook. Journal of Cleaner Production 2021, 287. [Google Scholar] [CrossRef]
- González, J.; Llovell, F.; Garrido, J.M.; Quinteros-Lama, H. A rigorous approach for characterising the limiting optimal efficiency of working fluids in organic Rankine cycles. Energy 2022, 124191, 254. [Google Scholar] [CrossRef]
- Dragomir-Stanciu, D.; Luca, C. Solar power generation system with low temperature heat storage. Procedia Technology 2016, 22, 848–853. [Google Scholar] [CrossRef]
- Ezgi, C.; Kepekci, H. Thermodynamic Analysis of Marine Diesel Engine Exhaust Heat-Driven Organic and Inorganic Rankine Cycle Onboard Ships. Applied Sciences 2024, 14. [Google Scholar] [CrossRef]
- Guerron, G.; Nicolalde, J.F.; Martínez-Gómez, J.; Dávila, P.; Velásquez, C. Experimental analysis of a pilot plant in Organic Rankine Cycle configuration with regenerator and thermal energy storage (TES-RORC). Energy 2024, 308, 132964. [Google Scholar] [CrossRef]
- Daniarta, S.; Nemś, M.; Kolasiński, P.; Pomorski, M. Sizing the Thermal Energy Storage Device Utilizing Phase Change Material (PCM) for Low-Temperature Organic Rankine Cycle Systems Employing Selected Hydrocarbons. Energies 2022, 15. [Google Scholar] [CrossRef]
- Paramita, P.D.P.; Daniarta, S.; Imre, A.R.; Kolasiński, P. Techno-Economic Analysis of Waste Heat Recovery in Automotive Manufacturing Plants. Applied Sciences 2025, 15. [Google Scholar] [CrossRef]
- Kolahi, M.; Yari, M.; Mahmoudi, S.M.; Mohammadkhani, F. Thermodynamic and economic performance improvement of ORCs through using zeotropic mixtures: Case of waste heat recovery in an offshore platform. Case Studies in Thermal Engineering 2016, 8, 51–70. [Google Scholar] [CrossRef]
- Siddiqui, M.U.; Owes, A.; Al-Amri, F.G.; Saeed, F. Recent developments in the search for alternative low-global-warming-potential refrigerants: A review. International Journal of Air-Conditioning and Refrigeration 2020, 28. [Google Scholar] [CrossRef]
- Shaik, S.V.; Babu, T.P. Theoretical Performance Investigation of Vapour Compression Refrigeration System Using HFC and HC Refrigerant Mixtures as Alternatives to Replace R22. Energy Procedia 2017, 109, 235–242. [Google Scholar] [CrossRef]
- Tillner Roth, R.; Baehr, H.D. An International Standard Formulation for the Thermodynamic Properties of 1,1,1,2-Tetrafluoroethane (HFC-134a) for Temperatures from 170 K to 455 K and Pressures up to 70 MPa. Journal of Physical and Chemical Reference Data 1994, 23, 657–729. [Google Scholar] [CrossRef]
- Yekoladio, P.J.; Bello-Ochende, T.; Meyer, J.P. Thermodynamic analysis and performance optimization of organic rankine cycles for the conversion of low-to-moderate grade geothermal heat. International Journal of Energy Research 2015, 39, 1256–1271. [Google Scholar] [CrossRef]
- Peyrovedin, H.; Haghbakhsh, R.; Duarte, A.R.C.; Shariati, A. Deep eutectic solvents as phase change materials in solar thermal power plants: Energy and exergy analyses. Molecules 2022, 27. [Google Scholar] [CrossRef] [PubMed]
- Therminol, E. Therminol LT. https://www.therminol.com/sites/therminol/files/documents/TF-8726_Therminol_LT.pdf, 2024. Accessed: 01-07-2024.
- Paratherm, H.T.F. Paratherm HR. https://thermalprops.paratherm.com/HRFrange.asp, 2024. Accessed: 01-07-2024.
- Paratherm, H.T.F. Paratherm NF. https://www.paratherm.com/heat-transfer-fluids/paratherm-nf-htf/, 2024. Accessed: 01-07-2024.
- Bhatia, S. Advanced Renewable Energy Systems, (Part 1 and 2); Woodhead Publishing India in Energy, WPI India, 2014.
- Keenan, J.; Chao, J.; Kaye, J. Gas Tables: Thermodynamic Properties of Air Products of Combustion and Component Gases, Compressible Flow Functions; Wiley, 1980.
- González, L.; Romero, J.; Saavedra, N.; Garrido, J.M.; Quinteros-lama, H.; González, J. Heat pump performance mapping for the energy recovery from an industrial building. Processes 2024, 1–18. [Google Scholar] [CrossRef]
- Moshinsky, M. Chapter 5. In Manual de refrigeración; Reverté, 2012.
- Pasupuleti, R.K.; Bedhapudi, M.; Jonnala, S.R.; Kandimalla, A.R. Computational Analysis of Conventional and Helical Finned Shell and Tube Heat Exchanger Using ANSYS-CFD. International Journal of Heat and Technology 2021, 39, 1755–1762. [Google Scholar] [CrossRef]
- Patel, Mihir M.. Shell & tube heat exchangers: Thermal design and optimization, 2023.
- Menon, E.S. Chapter 1. In Piping calculations manual; McGraw-Hill Calculations, 2005.
- González, J.; Llovell, F.; Garrido, J.M.; Quinteros-Lama, H. A study of the optimal conditions for organic Rankine cycles coupled with vapour compression refrigeration using a rigorous approach based on the Helmholtz energy function. Energy 2023, 285, 129554. [Google Scholar] [CrossRef]
Figure 1.
Schematic representation of an ORC composed of a pump, a heater, a heater or heat exchanger, a turbine, and a condenser. (a) The ORC is powered by exhaust. (b) The ORC is powered by a TER fed by exhaust gases.
Figure 1.
Schematic representation of an ORC composed of a pump, a heater, a heater or heat exchanger, a turbine, and a condenser. (a) The ORC is powered by exhaust. (b) The ORC is powered by a TER fed by exhaust gases.
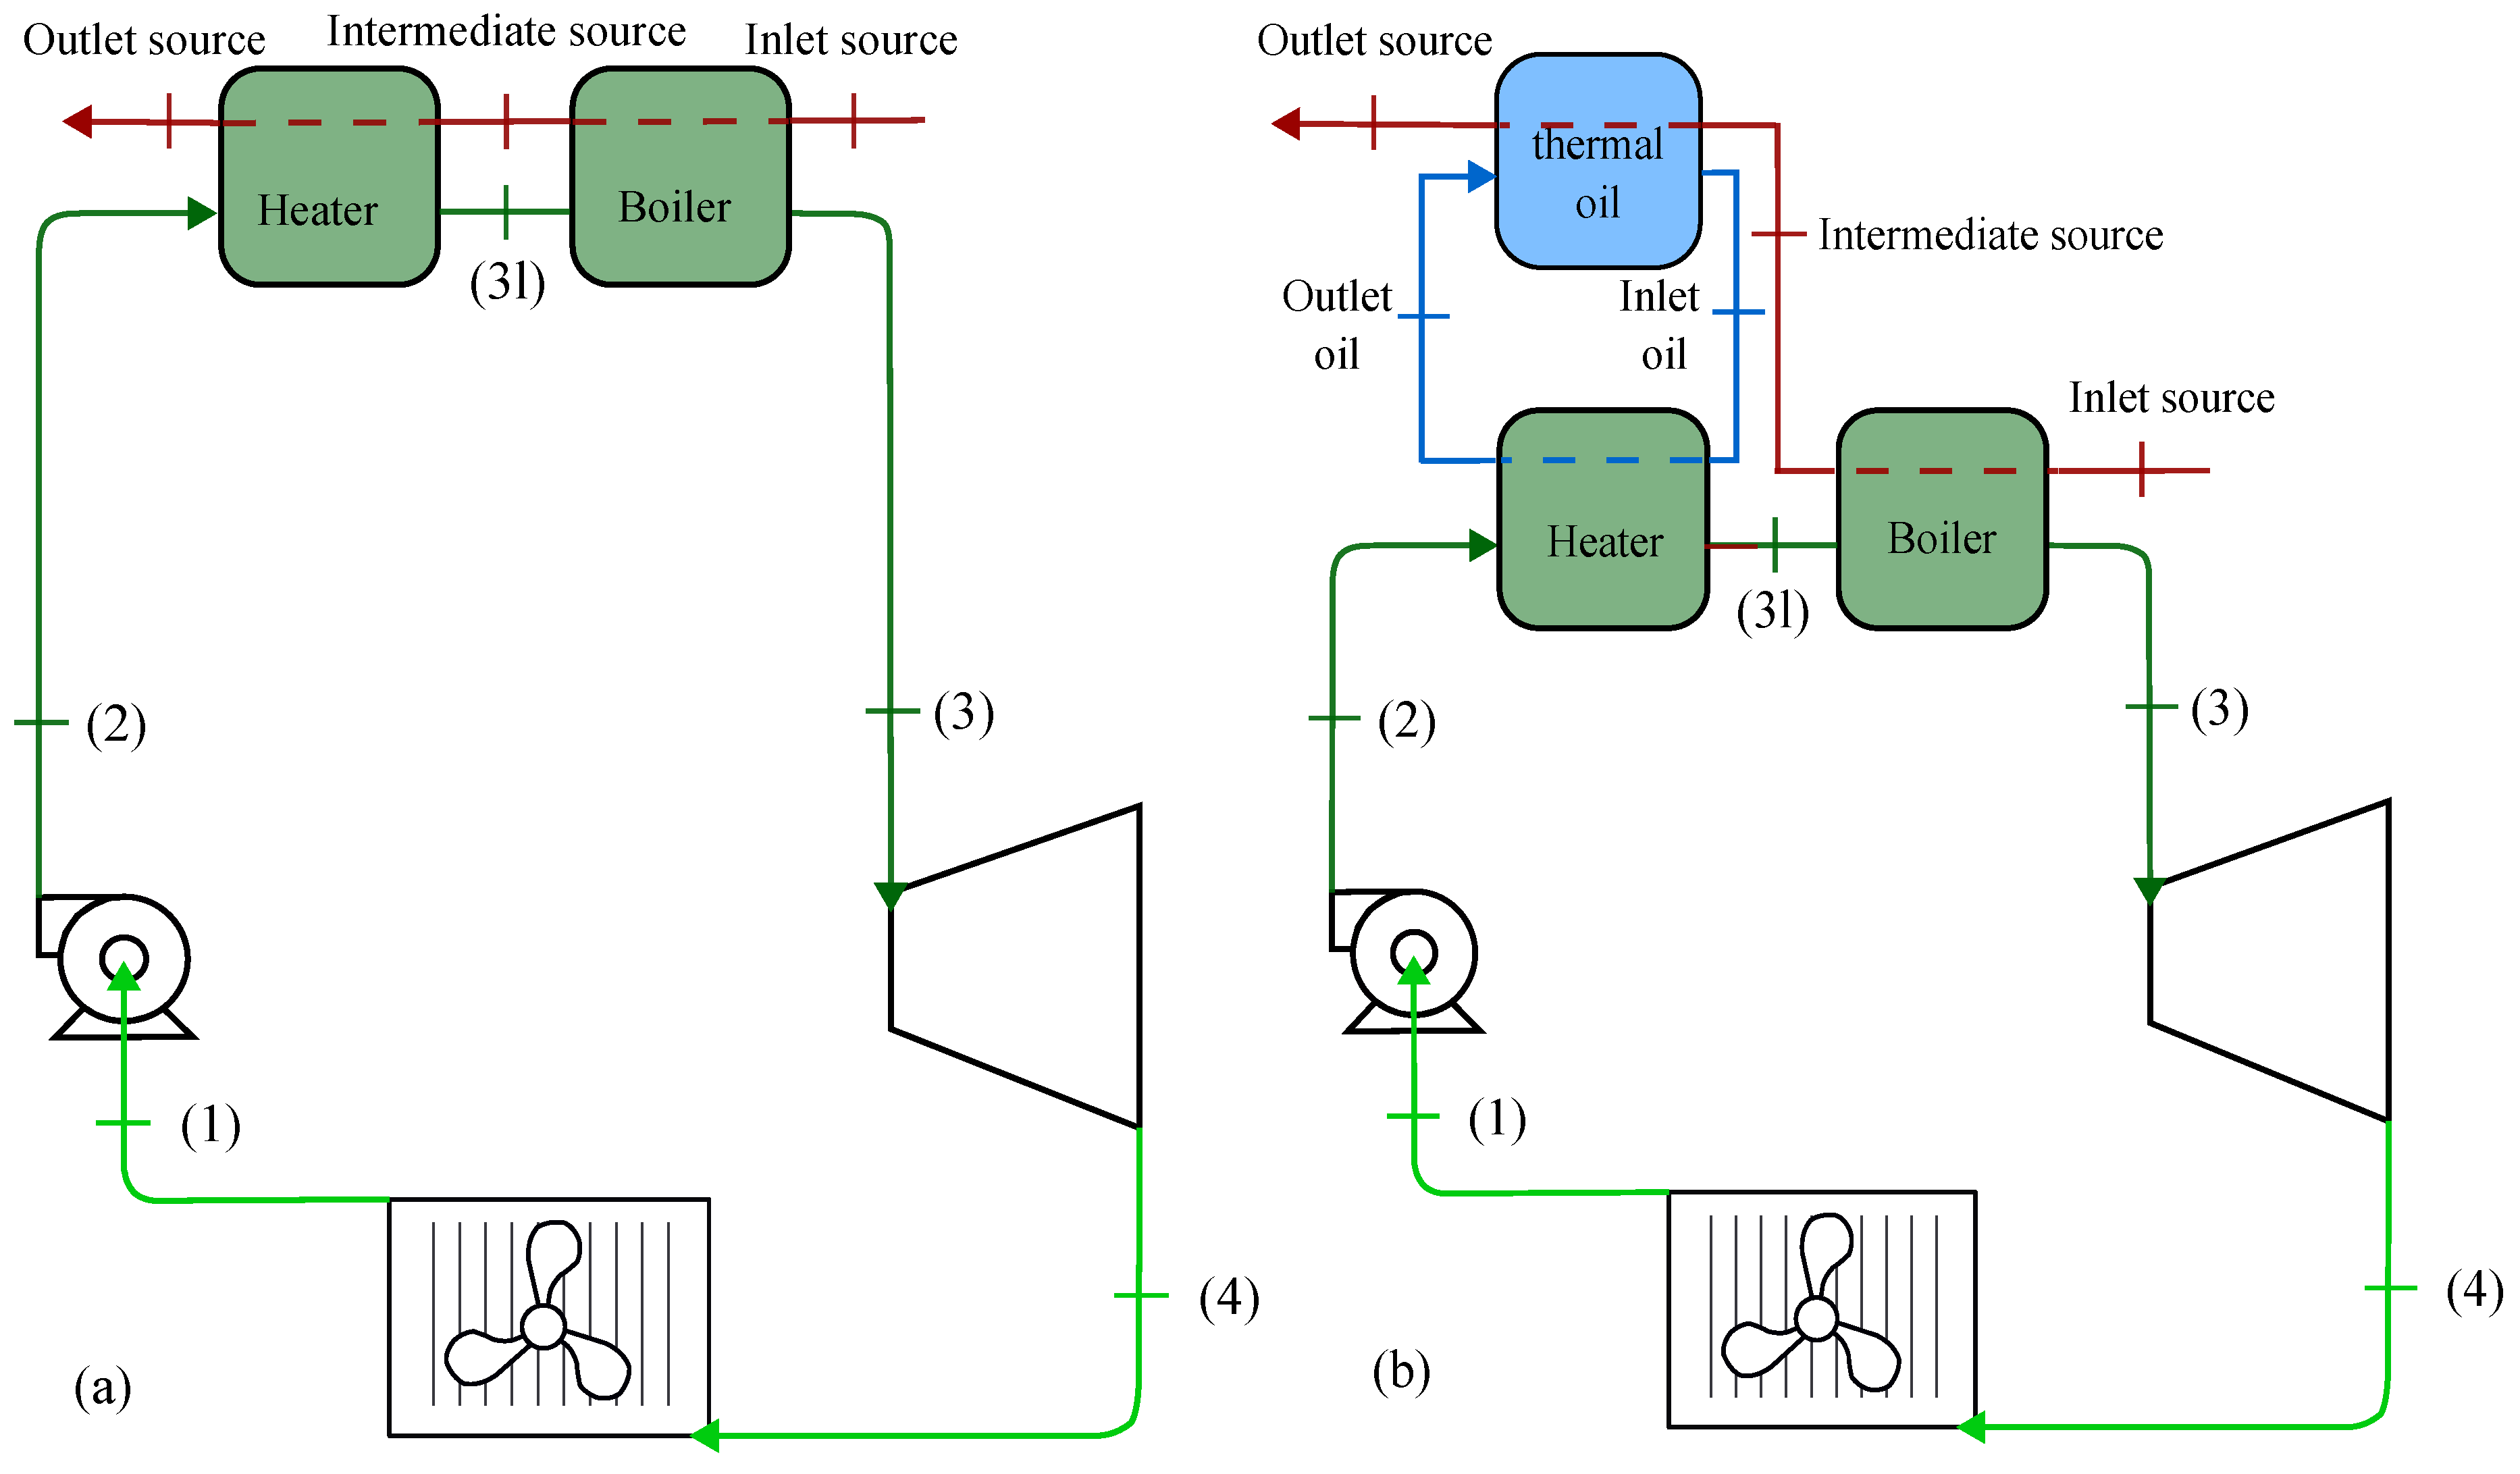
Figure 2.
Schematic illustrations of a rudimentary ORC in the temperature vs entropy projection. Illustrations also depict the thermal source and thermal energy recovery temperature profiles. (a) ORC without TER. (b) ORC with two TER configurations.
Figure 2.
Schematic illustrations of a rudimentary ORC in the temperature vs entropy projection. Illustrations also depict the thermal source and thermal energy recovery temperature profiles. (a) ORC without TER. (b) ORC with two TER configurations.
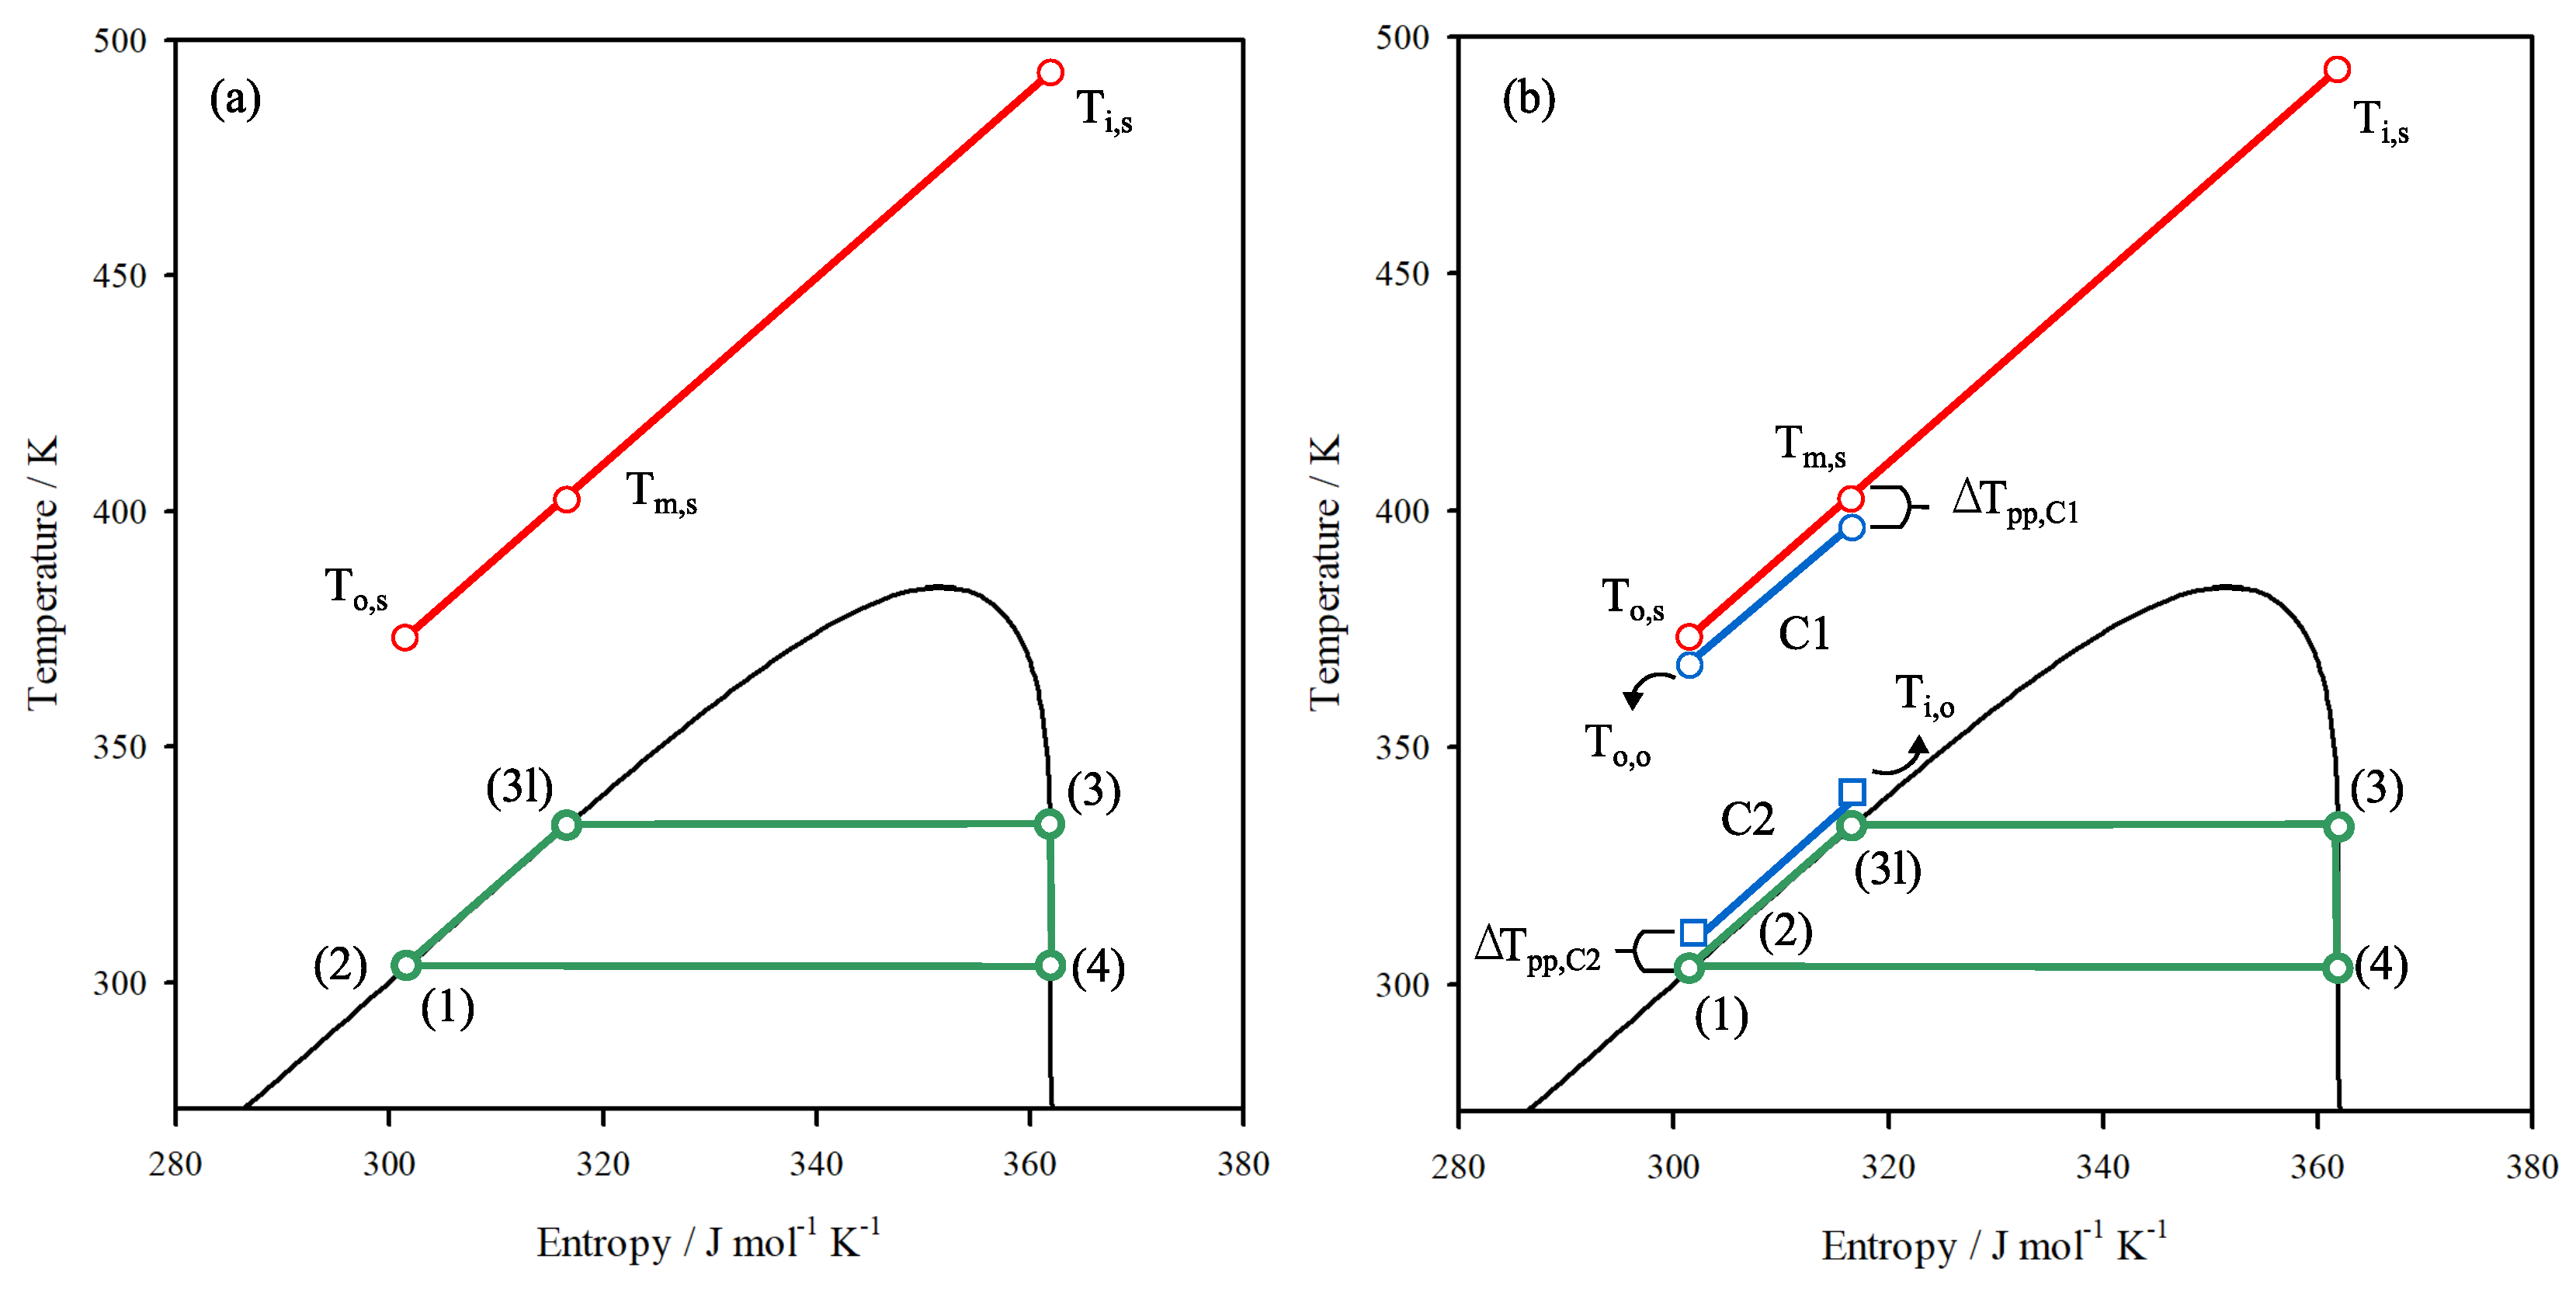
Figure 3.
Basic thermodynamic analysis of the ORC-TEA system. (a) Thermal efficiency as a function of the boiler saturation temperature. (b) Exergetic efficiency of the ORC-TEA system at a fixed pinch temperature of 10 °C with Therminol LT (thermal point No. 1). Solid line corresponds to configuration C1, and dashed line to configuration C2.
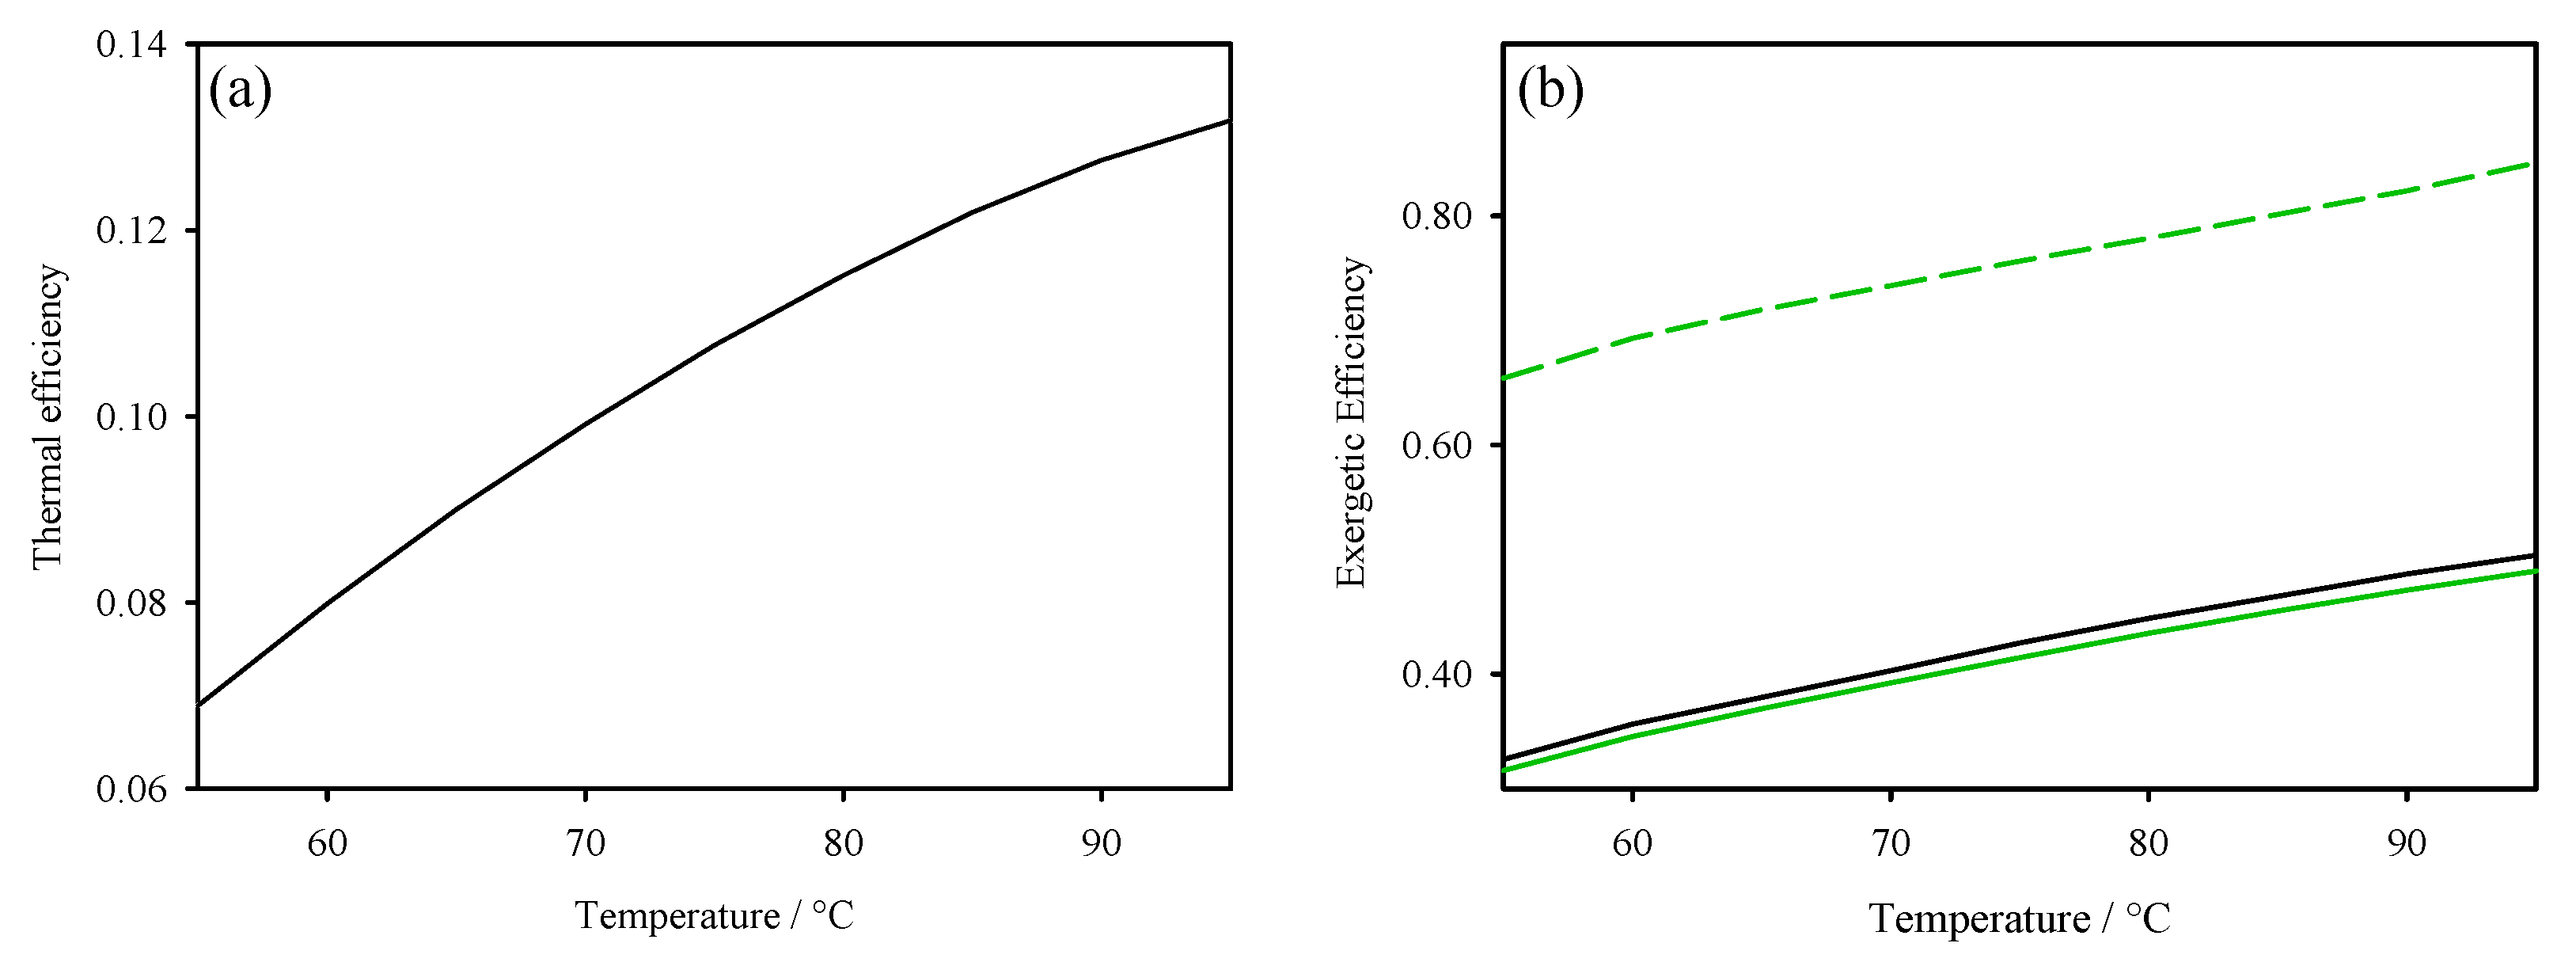
Figure 4.
Average relative percentage difference in exergetic efficiency for the three thermal oils evaluated, across varying pinch-point temperatures, in configurations (a) C1 and (b) C2. In both figures, crimson represents Therminol LT, blue corresponds to Paratherm HR, and yellow denotes Paratherm NF.
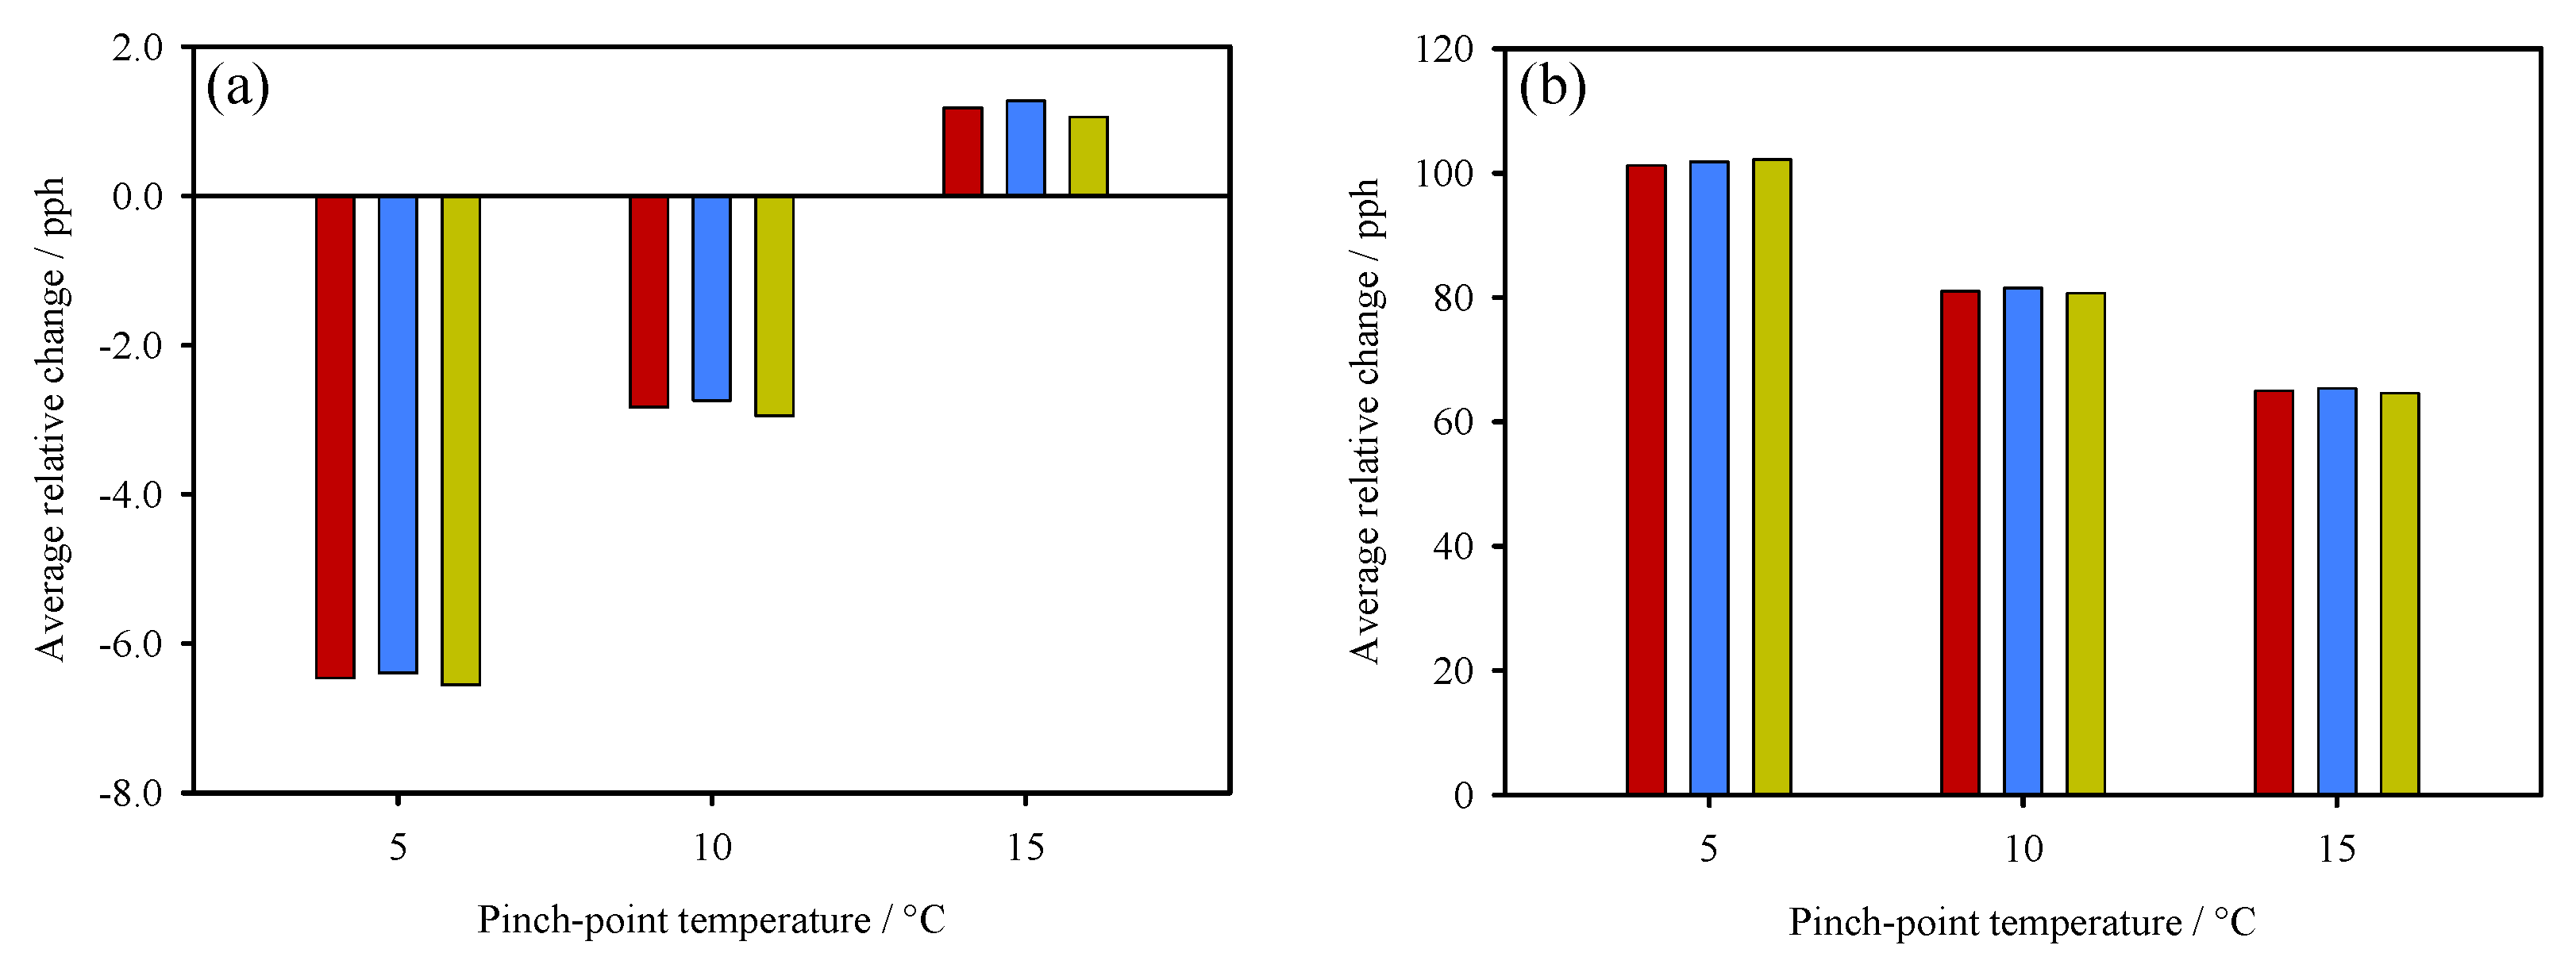
Figure 5.
Working fluid flow rates as a function of turbomachinery characteristics and boiler temperature. (a) Mass flow rate. (b) Volumetric flow rate.
Figure 5.
Working fluid flow rates as a function of turbomachinery characteristics and boiler temperature. (a) Mass flow rate. (b) Volumetric flow rate.
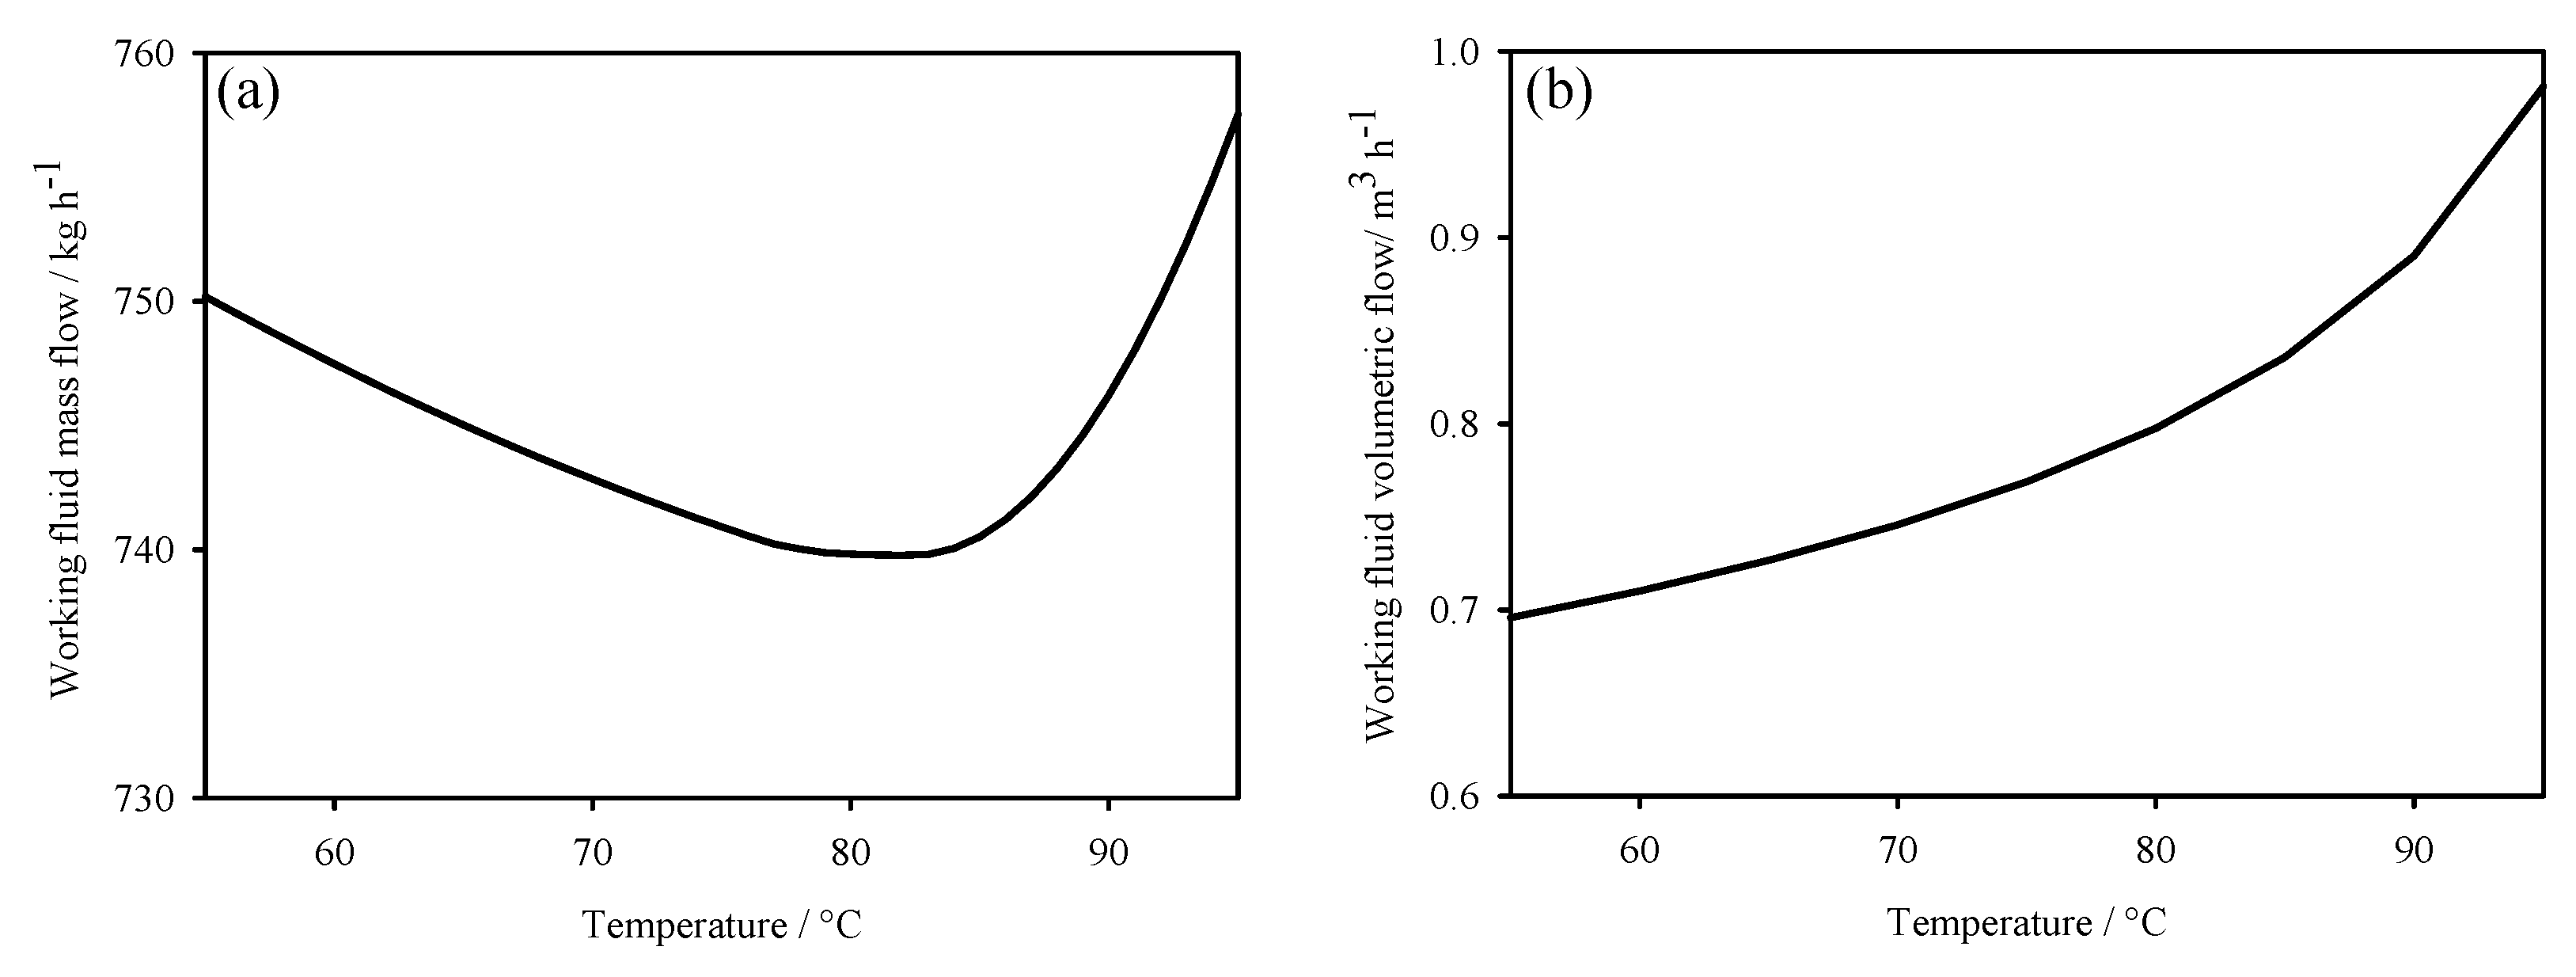
Figure 6.
Mass (a–c) and volumetric (d–f) flow rates of the thermal oils under study. Solid lines represent configuration C1, while dashed lines correspond to configuration C2. blue, green, and crimson lines indicate pinch-point temperatures of 5 °C, 10 °C, and 15 °C, respectively.
Figure 6.
Mass (a–c) and volumetric (d–f) flow rates of the thermal oils under study. Solid lines represent configuration C1, while dashed lines correspond to configuration C2. blue, green, and crimson lines indicate pinch-point temperatures of 5 °C, 10 °C, and 15 °C, respectively.
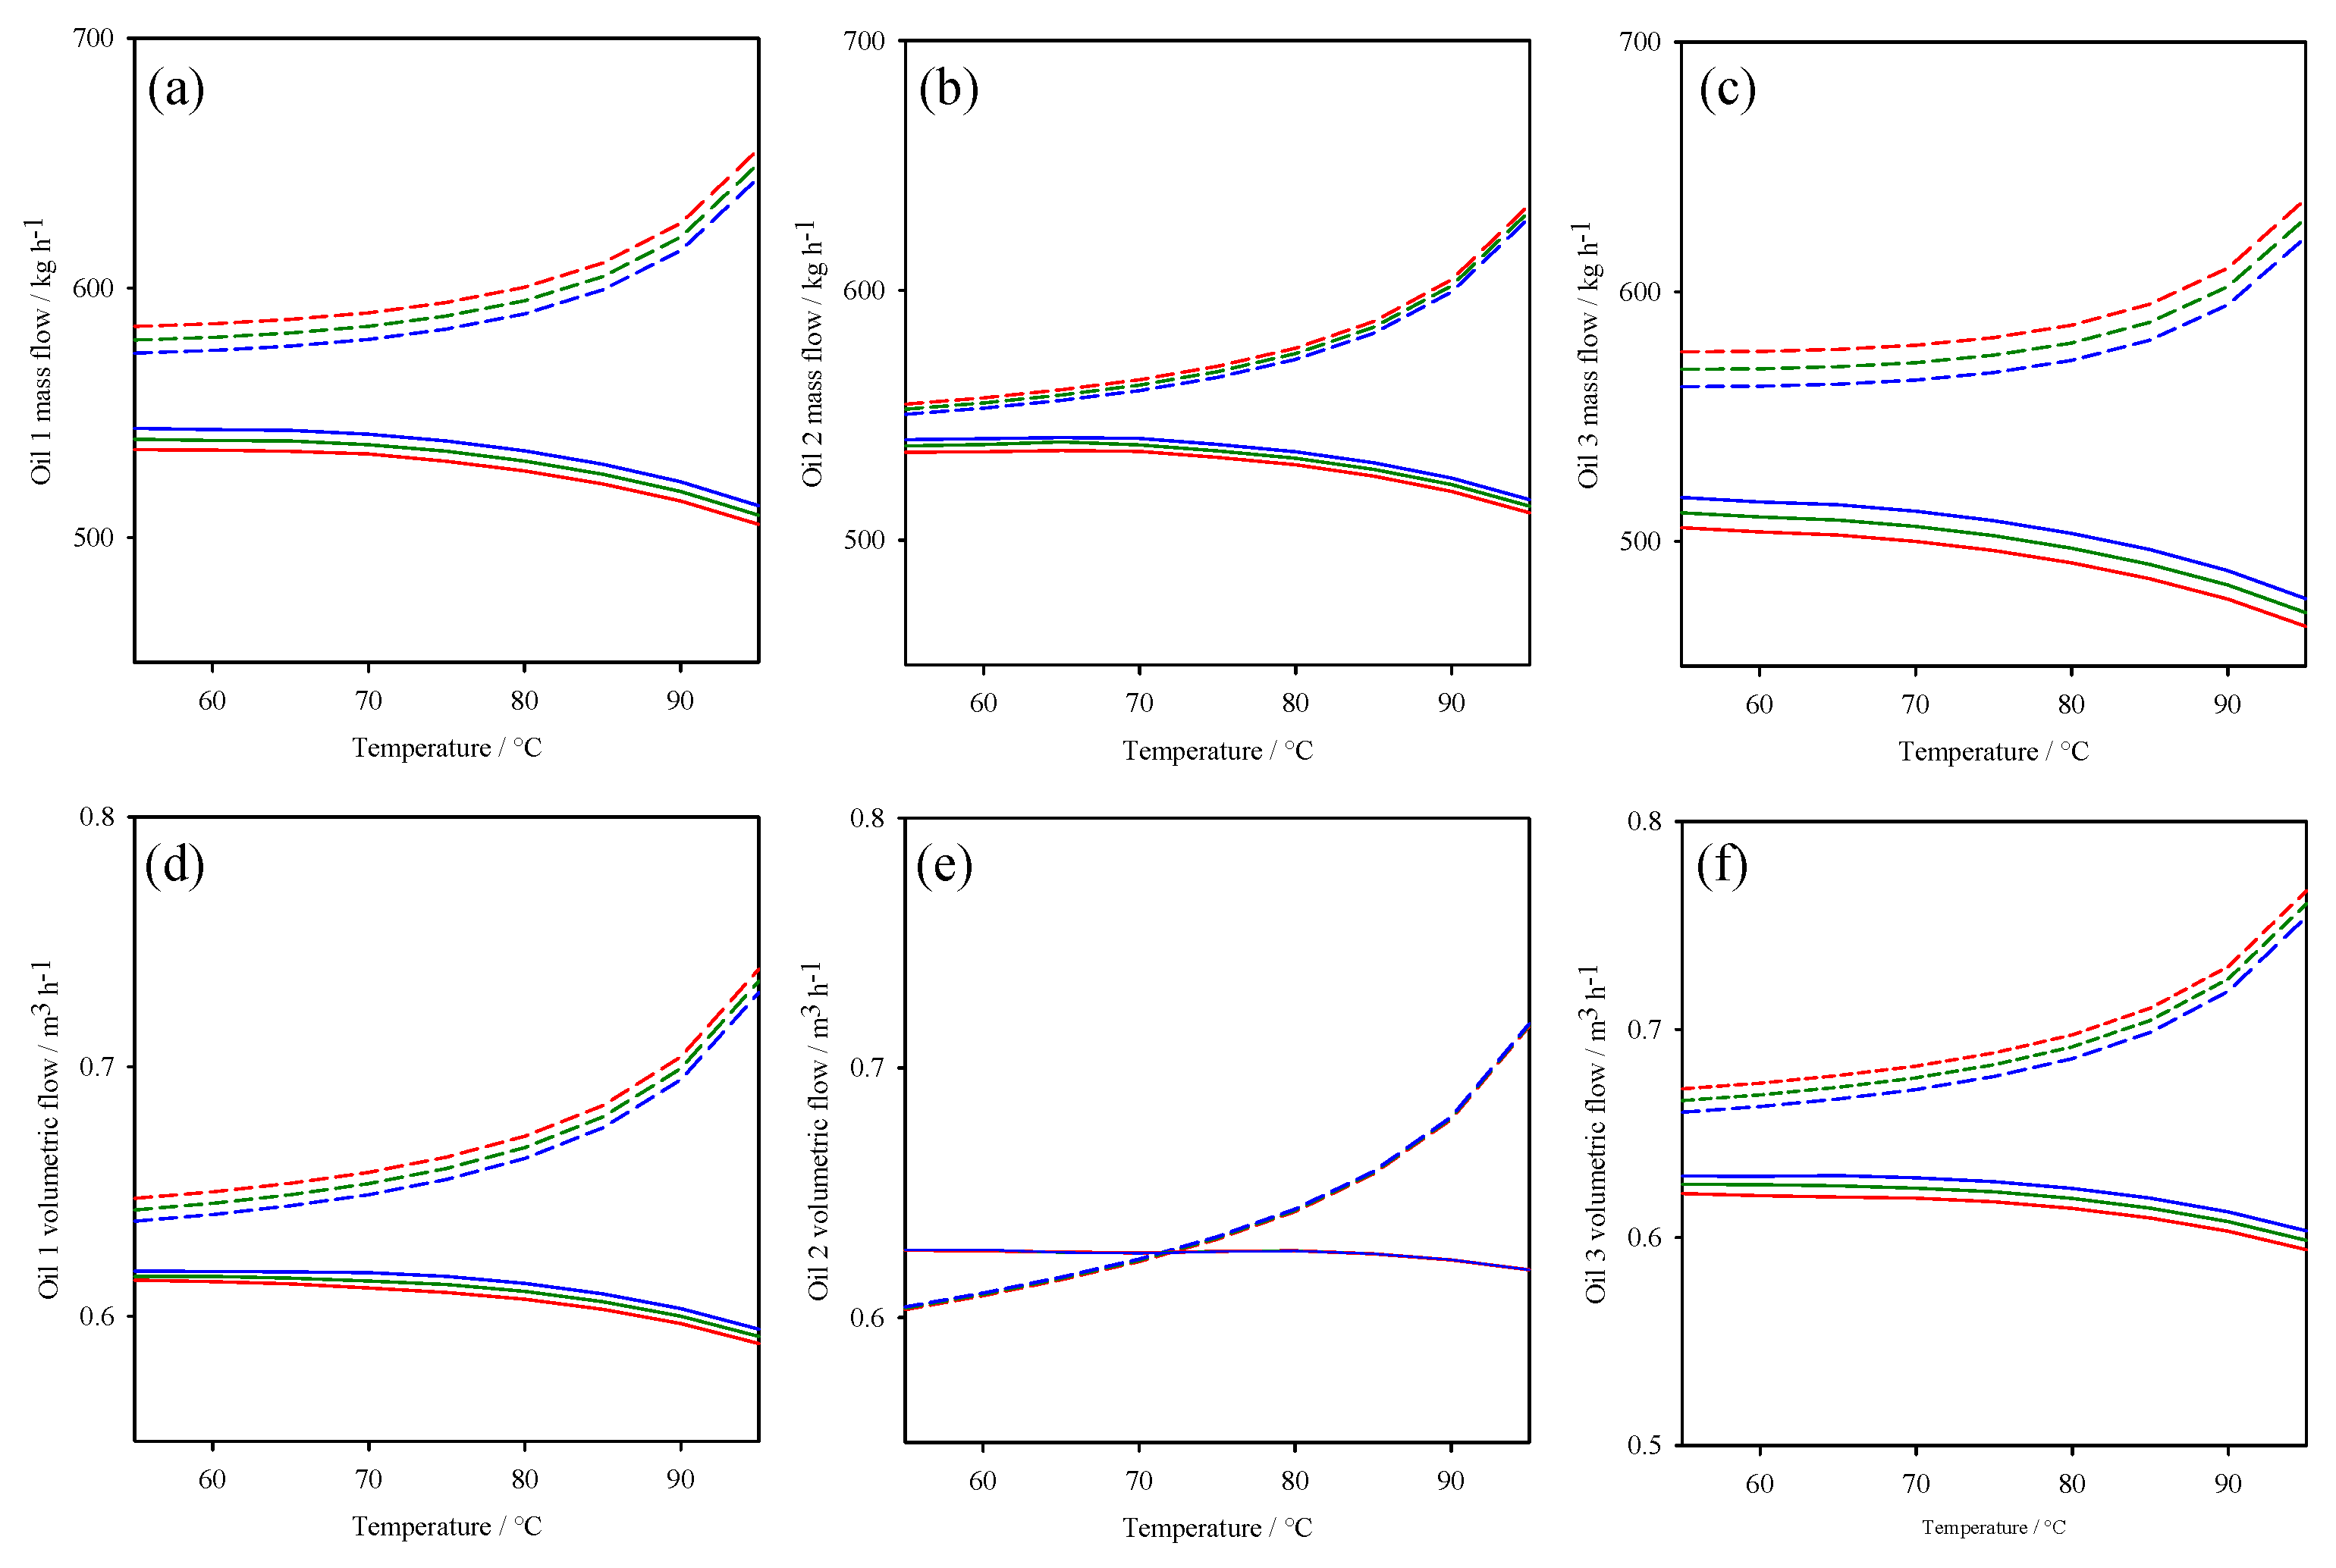
Figure 7.
Key thermal parameters of the ORC system. (a) Heat input to the boiler: the total heat is shown as a bold black line, the heat delivered to the heater as a solid crimson line, and the heat for vapour generation as a dashed crimson line. (b) Vapour fraction at the turbine outlet.
Figure 7.
Key thermal parameters of the ORC system. (a) Heat input to the boiler: the total heat is shown as a bold black line, the heat delivered to the heater as a solid crimson line, and the heat for vapour generation as a dashed crimson line. (b) Vapour fraction at the turbine outlet.
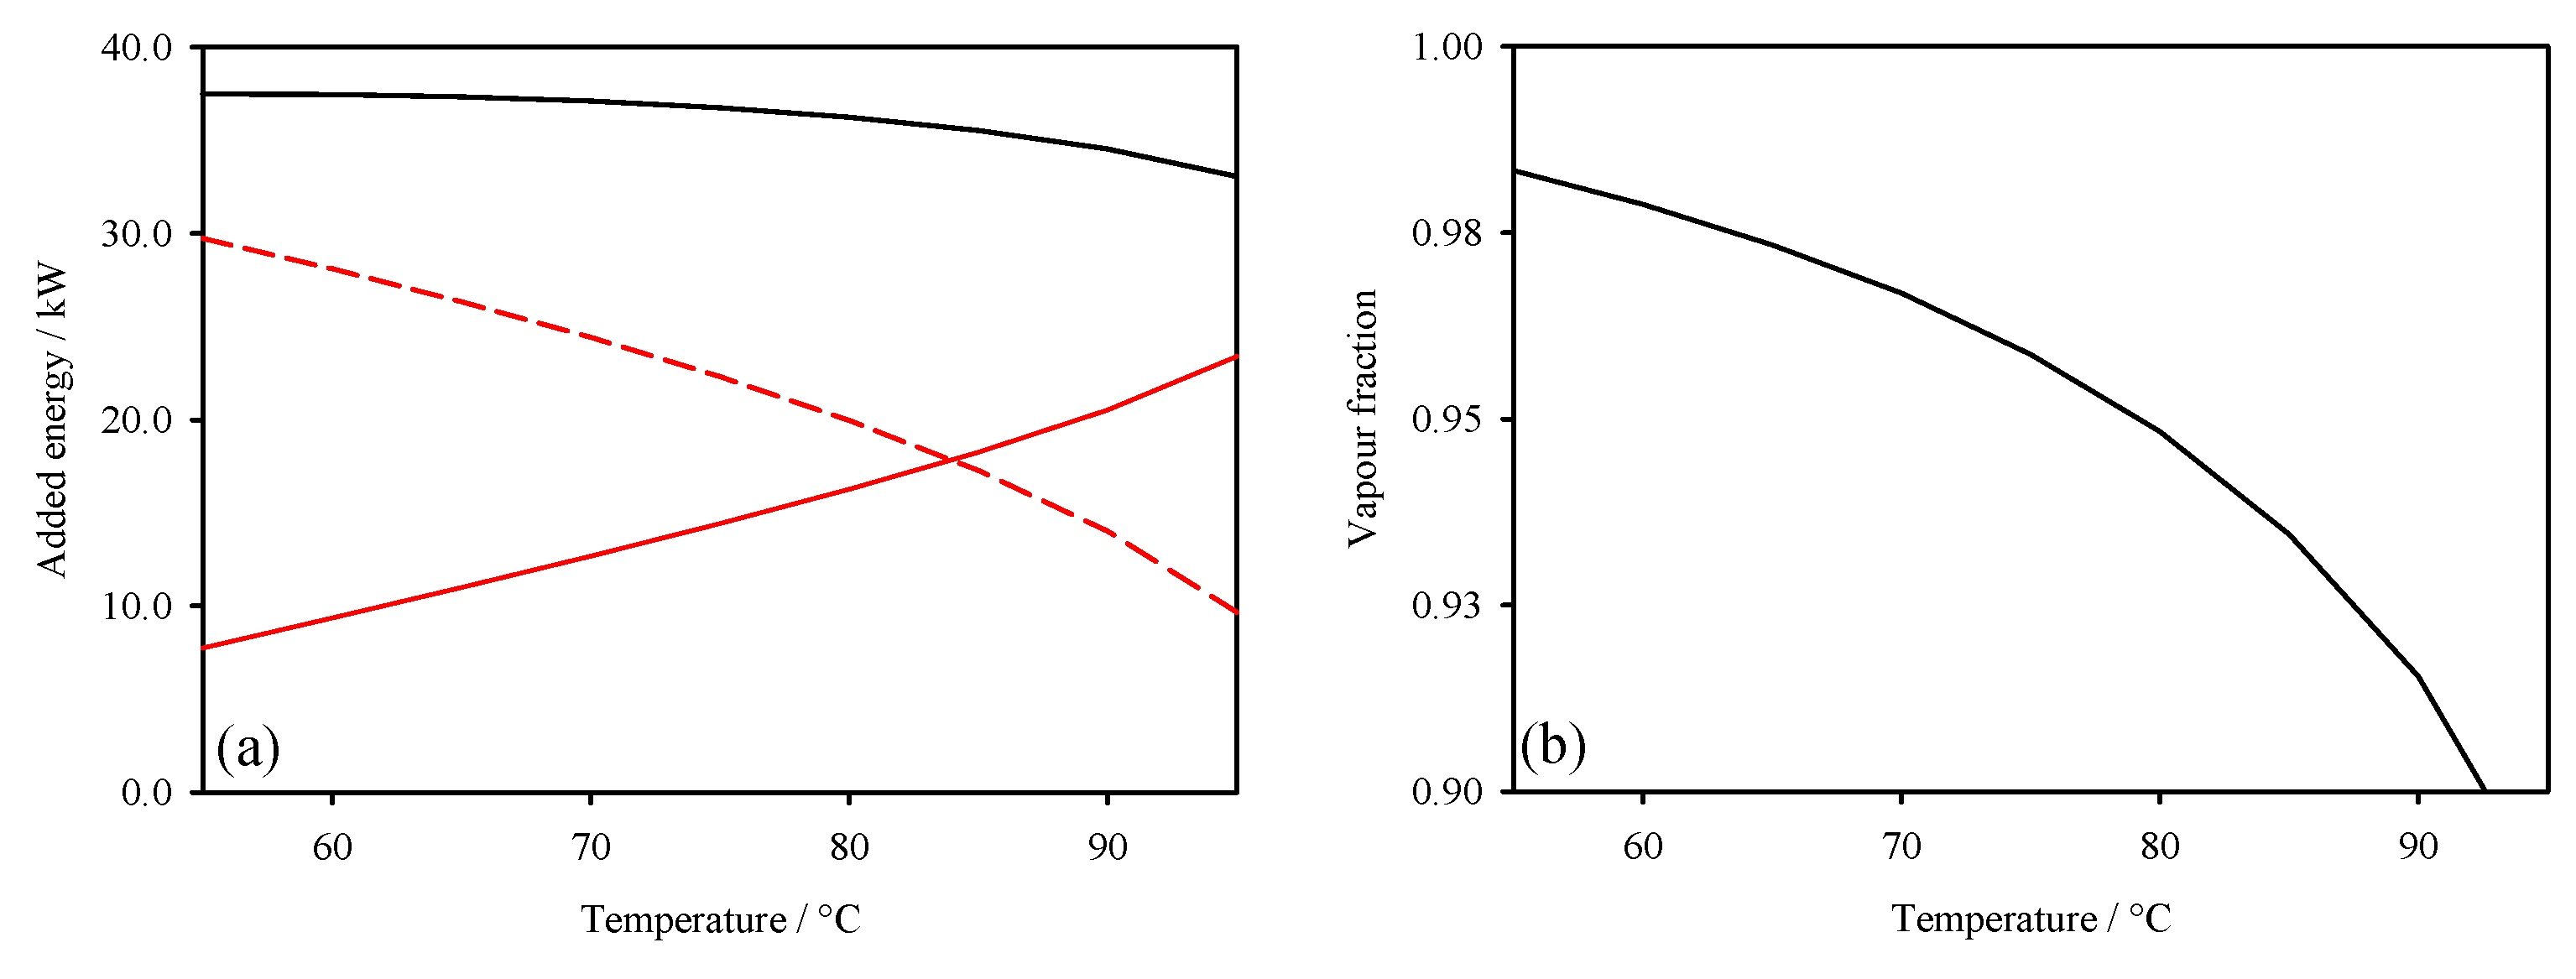
Figure 8.
Exergetic and sizing key parameters of the ORC-TER system for the three pinch-point temperatures, in crimson, yellow, and blue, respectively, are at 5 °C, 10 °C, and 15 °C. (a) Exergetic efficiencies. (b) volumetric flows. (c) pipeline diameters.
Figure 8.
Exergetic and sizing key parameters of the ORC-TER system for the three pinch-point temperatures, in crimson, yellow, and blue, respectively, are at 5 °C, 10 °C, and 15 °C. (a) Exergetic efficiencies. (b) volumetric flows. (c) pipeline diameters.
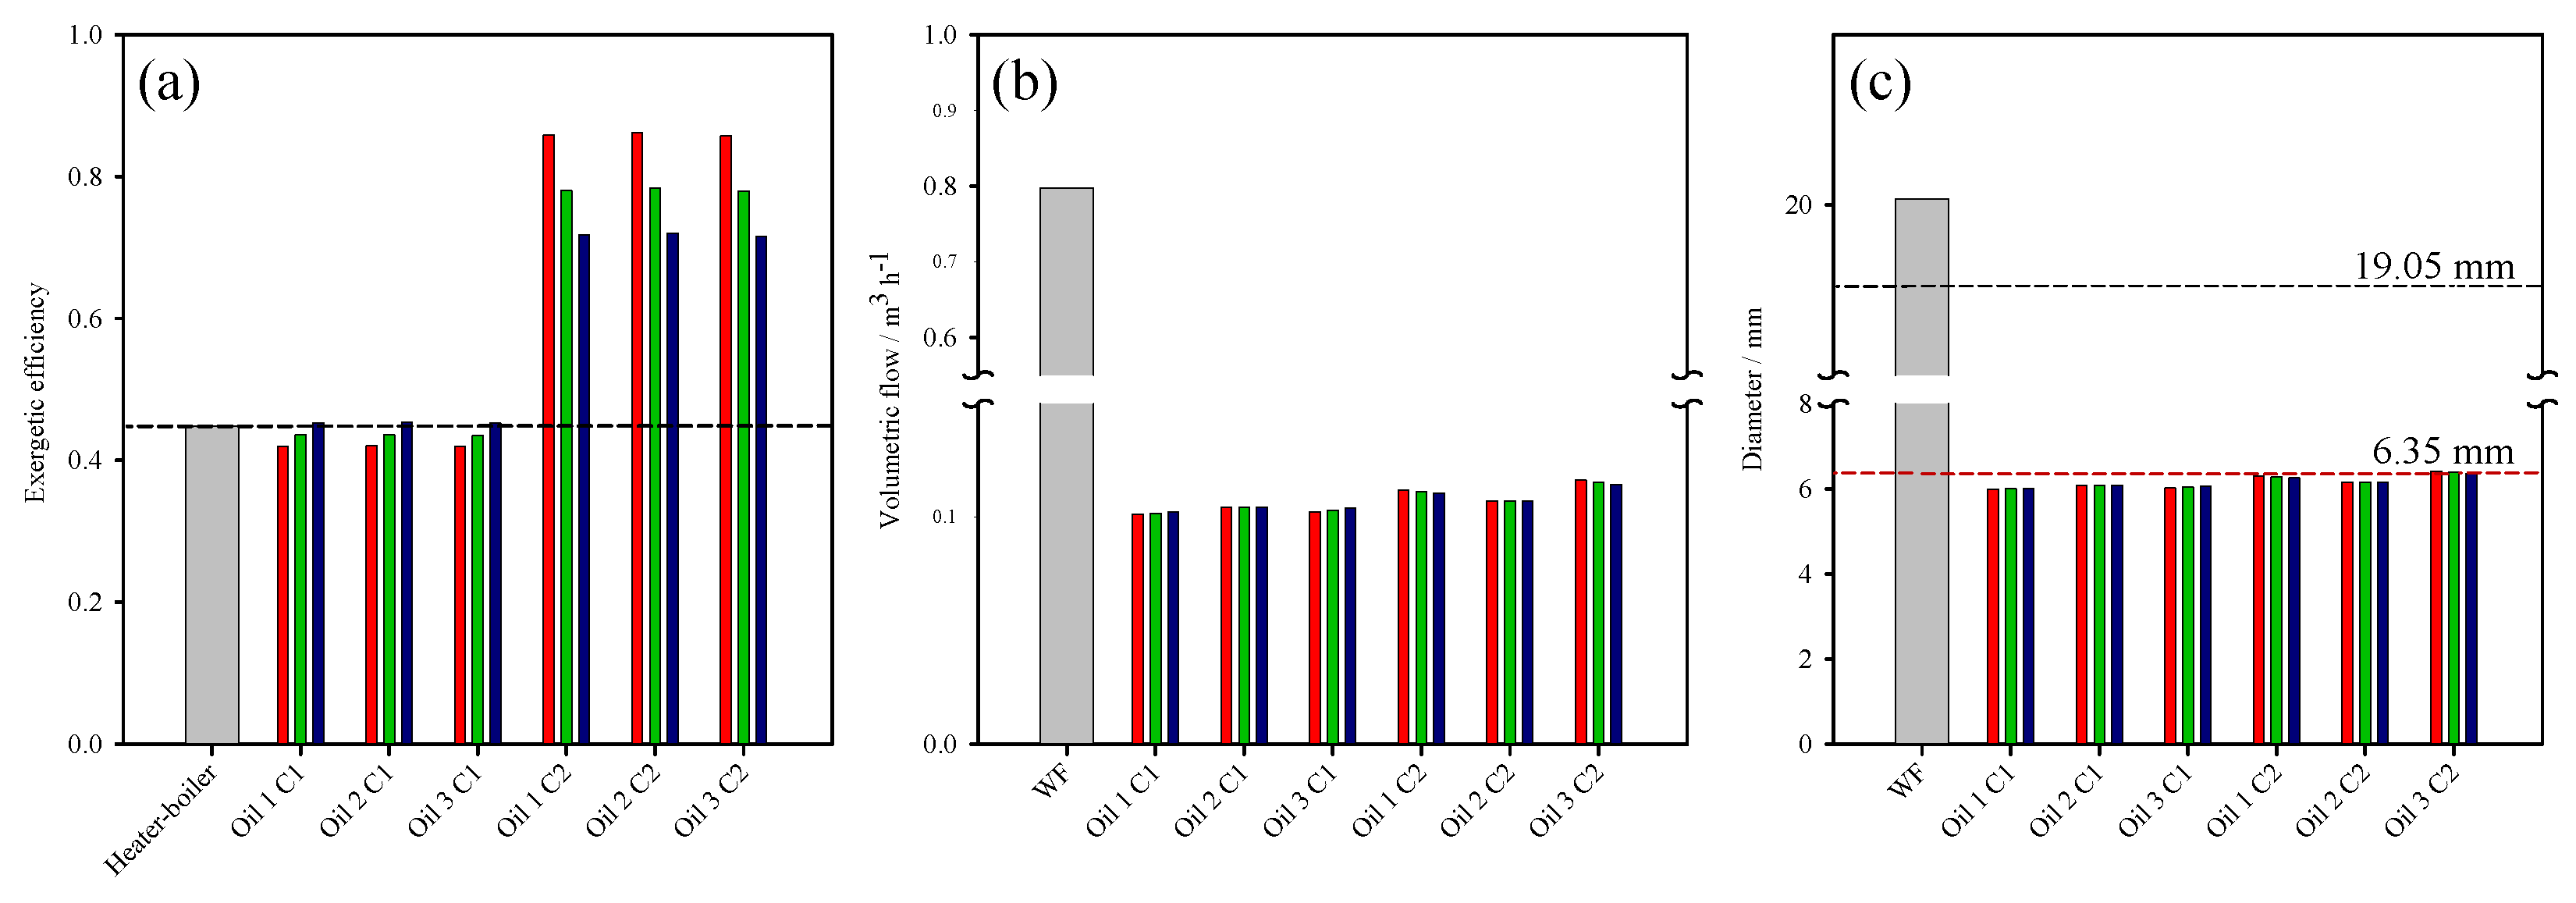

Table 1.
Parameters for the isobaric heat capacity for the used thermal oils valid in the range between 313.15 K to 493.15 K.
Table 1.
Parameters for the isobaric heat capacity for the used thermal oils valid in the range between 313.15 K to 493.15 K.
| Commercial name | ref | ||||
|---|---|---|---|---|---|
| Oil 1 | Therminol LT | 12.8067 | 5.5078 | 2.4950 | [26] |
| Oil 2 | Paratherm HR | 43.8256 | 2.8091 | 46.8136 | [27] |
| Oil 3 | Paratherm NF | 7.7397 | 23.0976 | –15.0726 | [28] |
| kg | kg | kg | |||
| Oil 1 | Therminol LT | 1027.42 | –0.3530 | –6.8775 | [26] |
| Oil 2 | Paratherm HR | 1188.77 | –0.7852 | 0.1843 | [27] |
| Oil 3 | Paratherm NF | 1081.53 | –0.6787 | 0.1990 | [28] |
Table 2.
Input parameters and boundary conditions for ORC thermally powered by thermal energy recovery.
Table 2.
Input parameters and boundary conditions for ORC thermally powered by thermal energy recovery.
| Value | Range | |
|---|---|---|
| Organic Rankine cycle | ||
| Turbine displaced volume | – | |
| Turbine revolutions per minute | 2900.00 rpm | – |
| boiler saturation temperature | – | 330.15 to 368.15 K |
| Condenser temperature | 303.15 K | – |
| Expander isentropic efficiency | 1.0 | – |
| Pump isentropic efficiency | 1.0 | – |
| Energy source and TER | ||
| Exhaust gases temperature | – | 493.15 K to 373.15 K |
| Pinch point temperature | – | 5, 10, and 15 K |
Disclaimer/Publisher’s Note: The statements, opinions and data contained in all publications are solely those of the individual author(s) and contributor(s) and not of MDPI and/or the editor(s). MDPI and/or the editor(s) disclaim responsibility for any injury to people or property resulting from any ideas, methods, instructions or products referred to in the content. |
© 2025 by the authors. Licensee MDPI, Basel, Switzerland. This article is an open access article distributed under the terms and conditions of the Creative Commons Attribution (CC BY) license (http://creativecommons.org/licenses/by/4.0/).
Copyright: This open access article is published under a Creative Commons CC BY 4.0 license, which permit the free download, distribution, and reuse, provided that the author and preprint are cited in any reuse.


