
Submitted:
07 May 2025
Posted:
13 May 2025
You are already at the latest version
Preprints on COVID-19 and SARS-CoV-2
Abstract
Universities in China are implementing intervention management to prevent widespread transmission of COVID-19 both on and off campus. During this period, the thermal and humid environments, as well as air quality within dormitory buildings, are critical not only for comfort but also for student health and productivity. A representative dormitory building in Xi’an, China, was selected for on-site measurements of indoor environmental parameters. The study employed the CRITIC method to weight the environmental parameters AP-I, which combined IAQ and indoor thermal comfort. In addition to standard pollutants (CO2, PM2.5), this research also considered occupants’ perceptions of air quality (freshness - NAIs), quantifying these perceptions as scoring indicators. The study further investigated the psychological-behavioral differences of university students under closed campus management, using the SCL-90 psychological scale. It analyzed various aspects, including interpersonal sensitivity and anxiety, to understand the impact on students’ sensation, awareness, behavior, and living habits. Findings indicated that while indoor air quality met standard levels, it was not satisfactory to most students, with over 75% reporting adverse emotional responses due to prolonged dormitory stays, leading to increased sensitivity to indoor air quality. Future intervention programs in China for managing pandemics will aim to improve disease infection control efficiency. The outcomes of this study will contribute to optimizing the indoor air environment through real-time composite scoring and mental health assessments, thereby enhancing students’ living experiences and mitigating negative emotions under intervention management.
Keywords:
campus containment and management system
; university dormitory buildings
; IEQ
; indoor air quality
; composite score
; scl-90 psychometric scale
1. Introduction
Intermittent COVID-19 outbreaks leading to school closures have had devastating effects, causing not only academic setbacks but also impacting the mental health of the student population [1] and the on-campus living environment [2]. During campus closures, most colleges and universities shifted to online teaching, making dormitories the primary activity space for students. A survey revealed a significant increase in dormitory occupancy rates, from 30%-62.5% pre-online teaching to 48%-95% post-online teaching [3]. The Chinese government’s intervention management policy for regional colleges and universities, which limited students’ activities to campus and controlled access to dormitory buildings, was a response to control the spread of the disease. This paper aims to study the indoor environmental conditions of university dormitory buildings under closed management following the increase in occupancy and usage duration. However, the lack of monitoring and evaluation models for dormitory environments in this state presents challenges in optimizing dormitory design and improving the living experience.
The evaluation of indoor environmental quality (IEQ) includes four categories: thermal comfort, air quality, acoustics, and lighting. Recent trends in research have shifted focus towards healthy thermal environments under various conditions, departing from traditional steady-state uniform thermal comfort theories . Ventilation effectiveness has a significant impact on virus exposure levels, highlighting the importance of indoor air quality research in the context of pandemic disease spread, such as COVID-19 . Since 2001, the IEQ model assessment tool has been proposed [4] to evaluate indoor space environmental quality by considering all IEQ aspects [5]. The variables included in current IEQ models [5,6,7,8] and the methodologies applied vary significantly across studies. Occupant health in buildings, especially during normal operation , is an emerging field in both academic research and industrial practice. It is increasingly recognized that building design and operation must account for periods of extreme events like global pandemics, necessitating pragmatic guidance for designers, facility managers, and occupants on reducing health risks in buildings. WHO documents related to COVID-19 [9,10] and guidelines for schools and care facilities emphasize proper ventilation and increased fresh air circulation. Green plants contribute to thermal environment improvement and pollutant mitigation [1], with studies suggesting that plant distribution can directly influence air quality [11]. Negative air ions (NAIs) enhance cognitive ability , and studies have explored their effects on the cognitive ability and health of college students in environments with high concentrations of carbon dioxide. The concentration of NAIs in urban residential areas reflects the extent to which air ionization levels approach those found in nature [12]. Continued focus on optimizing indicator selection in IEQ has led this paper to quantify negative oxygen ions as an evaluation indicator, exploring the perceived fresh air amount by occupants. This approach aims to go beyond pollutant indicators in IAQ, handling the relationship between non-pollutant indicators and IEQ scores more effectively. This study focuses on indoor thermal comfort and air quality, employing the CRITIC method to calculate the weight ratio of each indicator and their correlations, ultimately expressing the comprehensive score results as the algebra AP–I. Secondly, the evaluation of the indoor environment must take into account the behavioral activities of occupants. The dynamic adjustment of human living environments due to COVID-19 has directed new research toward refining the IEQ model for extreme conditions. The psychological state feedback from occupants becomes a vital indicator of their living environment experience. Hong Leong Chong [13] investigated the impact of indoor environmental quality on occupant perception in a laboratory setting, highlighting ways to enhance IEQ. Jimin Kim [14] explored the effects of IEQ factors on occupant behavior and air change rates. Peder Wolkoff [15] conducted a literature review on indoor air humidity, air quality, and health, contributing to the understanding of perceived Iraq’s impact on work performance, viral infections, sleep quality, and acoustics. Yosuke Yamada [16] et al. identified regional differences in physical activity, sedentary behavior, sleep duration, and steps taken in core urban areas, underscoring the importance of researching indoor environments in university dormitories. Jingwei Liu and Jiajing Hao [17] analyzed psychological fluctuations in university students during major epidemics, noting that closed living led to negative subjective feelings and psychological reactions among students.
This study’s foundation is an online subjective questionnaire survey on students’ complaints about the campus environment and their psychological state under closed campus management, where over 75% of respondents registered complaints, and those with psychological distress showed negative online behaviors. To conceptualize and assess this phenomenon, and to study the relationship between the environment and occupancy feelings, this research traced changes in building occupant behavior and collected SC-90-R Symptom Self-Assessment Scale questionnaires . Occupancy feelings and psychological states were analyzed in terms of sensation, awareness, behavior, and even living habits through factors such as interpersonal sensitivity and anxiety. Understanding the contribution and interaction of individual EI factors is a newly developed research area, where differences in weighting schemes and variability of user exposure times in buildings are critical reference factors. This study aimed to provide in-depth insights for indoor environmental optimization efforts, incorporating not only thermal comfort and air quality questionnaires but also the psychological distress questionnaire of the SC-90, following reports of conflicts in dormitories and symptoms of self-depression.
Furthermore, the evaluation model, environment, and criteria are dynamically updated to reflect societal changes. This paper aims to support data for optimizing indoor air environments in future similar situations, by evaluating indoor environmental quality conditions during a public health event and collecting psychological symptoms of the occupants. The update of the calculation model for two EI factors (thermal comfort, air quality) and logistic analysis parameter calculation were integral to this approach.
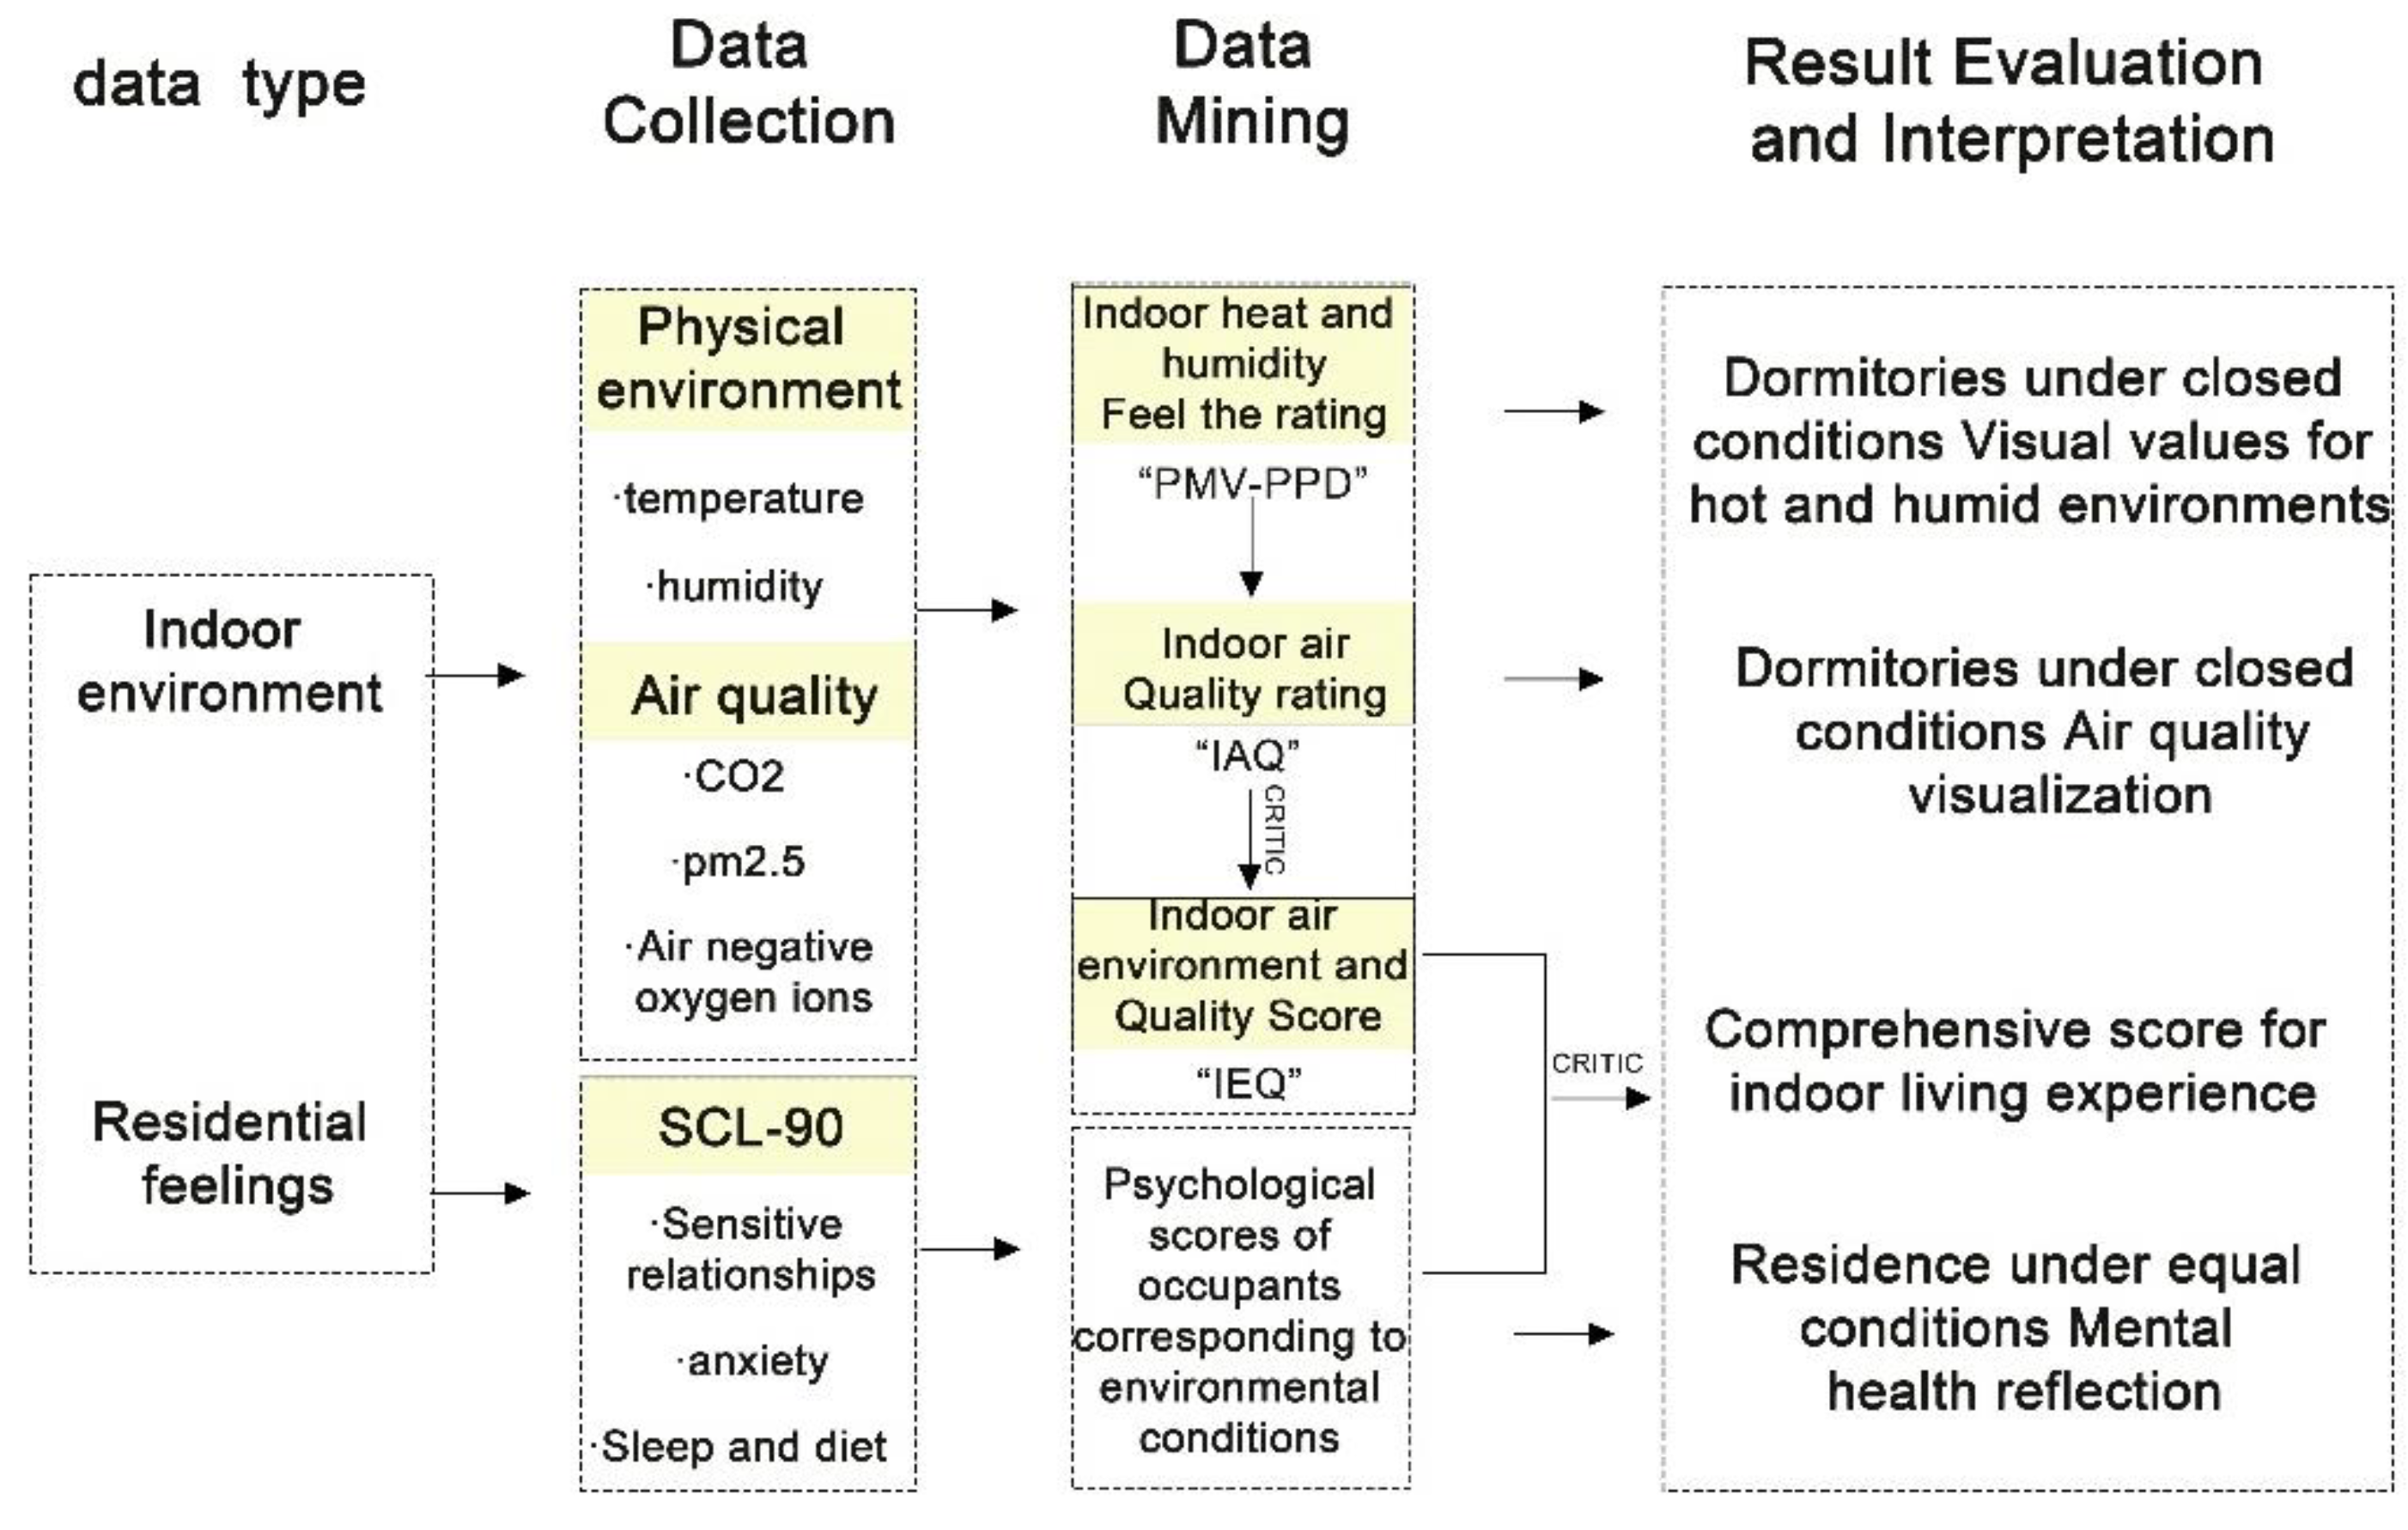
This study was conducted in five steps: (i) real-time collection of data on indoor air, air pollutant factors, and negative oxygen ions; (ii) assessment of indoor climate and air quality (IRAQ); (iii) calculation of real-time A-scores based on indoor temperature and humidity environment and air quality factors (including indoor thermal environment, air quality, and negative oxygen ions); (iv) presentation of scores on the SC-90 symptom self-assessment scale and analysis of occupant emotional characteristics; (v) analysis of building occupant behavior and SC-90 symptom self-assessment scale scores.
Materials and Methods
2.1. Outline
The current descriptive analysis study was conducted in a dormitory on a university campus in Xi’an, China, during the autumn-winter transition season (November, with no indoor heating turned on) during the COVID-19 pandemic in 2022. At the time of the experiment, the school was under closed administration and 100% of the students completed their studies via online teaching. At the same time,the school underwent a temporary closure of the teaching area to indirectly restrain the students and limit the basic activities to the dormitory. A systematic random sampling method was used to collect the required data for this study. Three categories of data were collected: the physical parameters of the dormitory environment, the subjects’ complaints about the physical environment and their own psychological status. After considering the type of dormitory building, the distribution of dormitories, and the year of construction of the dormitories in the experimental university, the author chose to conduct a survey study of four typical dormitory buildings (representative in terms of construction year and dormitory form) on the experimental campus:,Four buildings in total:Building 1、Building 5、Building 8、Building 10.To ensure that the observation tense was consistent with the tense of the subject’s responses to the questionnaire, each dormitory environmental parameter corresponded to the questionnaire responses of the population in which it was housed. The steps of the research survey were as follows:
Figure 1.
Steps in the research investigation.
2.1. Sampling locations and sampling program
2.1.1. Real-Time Collection of Indoor Climate and Air Pollutant Factor Data
The standard categorization of the examined dormitory buildings identified two typical types: dormitories with balconies and additional sunrooms and those with exposed balconies. Occupant numbers in both dormitory types adhered to design standards and fell within reasonable ranges. Measurements were conducted in the autumn/winter transition season (pre-heating), without mechanical ventilation systems or energy equipment, and with a balanced proportion of samples from both dormitory types. All sampled dormitories were fully occupied. The sampling process included:
- Step 1 Test subjects: Test Objects: Sixteen randomly selected rooms in student dormitory buildings were chosen for sampling. These rooms were uniformly distributed in the middle of the buildings. Basic information about the sample dormitories, such as test time, location, building age, renovation time, and household type, is detailed in Table 2. The building forms included dormitories with sunrooms in the balconies and those with exposed balconies, all constructed between 2001–2002. The locations of selected points within the test buildings are illustrated in Figure 2 and Figure 3.
- Step 2 Test parameters: The study’s indoor air quality parameters included thermal and humid environments as well as air quality. Thermal and humid environment parameters comprised indoor temperature, humidity, wind speed, and black sphere temperature. Air quality test parameters included CO₂, PM2.5, and anions. As per China’s national standard for indoor air quality [18], rooms smaller than 50 ㎡ require one to three sampling points [19]. Considering the distribution of occupants, indoor ventilation, air exchange medium, and dormitory area (approximately 21 ㎡), three sampling points were selected. The height of the sampling points was aligned with the human breathing zone. During measurements, the students were predominantly seated, setting the sampling height at 1.1 m.

Table 1.
Sample dormitory basic information.
| Residential | Testing time (2022) | Age of renovation | Room Type | Floor | Number of people in the room |
| R1 | 11/10 - 11/12 | 2002 | With additional | 3/6 | 4/4 |
| R2 | 11/10 - 11/12 | 2002 | With additional | 3/6 | 4/4 |
| R3 | 11/10 - 11/12 | 2002 | With additional | 3/6 | 4/4 |
| R4 | 11/10 - 11/12 | 2002 | With additional | 3/6 | 4/4 |
| R5 | 11/10 - 11/12 | 2002 | With additional | 3/6 | 4/4 |
| R6 | 11/10 - 11/12 | 2002 | With additional | 3/6 | 4/4 |
| R7 | 11/10-11/12 | 2002 | With additional | 3/6 | 4/4 |
| R8 | 11/10-11/12 | 2002 | With additional | 3/6 | 4/4 |
| R9 | 11/10 - 11/12 | 2002 | Exposed balconies | 3/6 | 6/6 |
| R10 | 11/10 - 11/12 | 2002 | Exposed balconies | 3/6 | 6/6 |
| R11 | 11/10 - 11/12 | 2002 | Exposed balconies | 3/6 | 6/6 |
| R12 | 11/10 - 11/12 | 2002 | Exposed balconies | 3/6 | 6/6 |
| R13 | 11/10 - 11/12 | 2002 | Exposed balconies | 3/6 | 6/6 |
| R14 | 11/10 - 11/12 | 2002 | Exposed balconies | 3/6 | 6/6 |
| R15 | 11/10 - 11/12 | 2002 | Exposed balconies | 3/6 | 6/6 |
| R16 | 11/10-11/11 | 2002 | Exposed balconies | 3/6 | 6/6 |
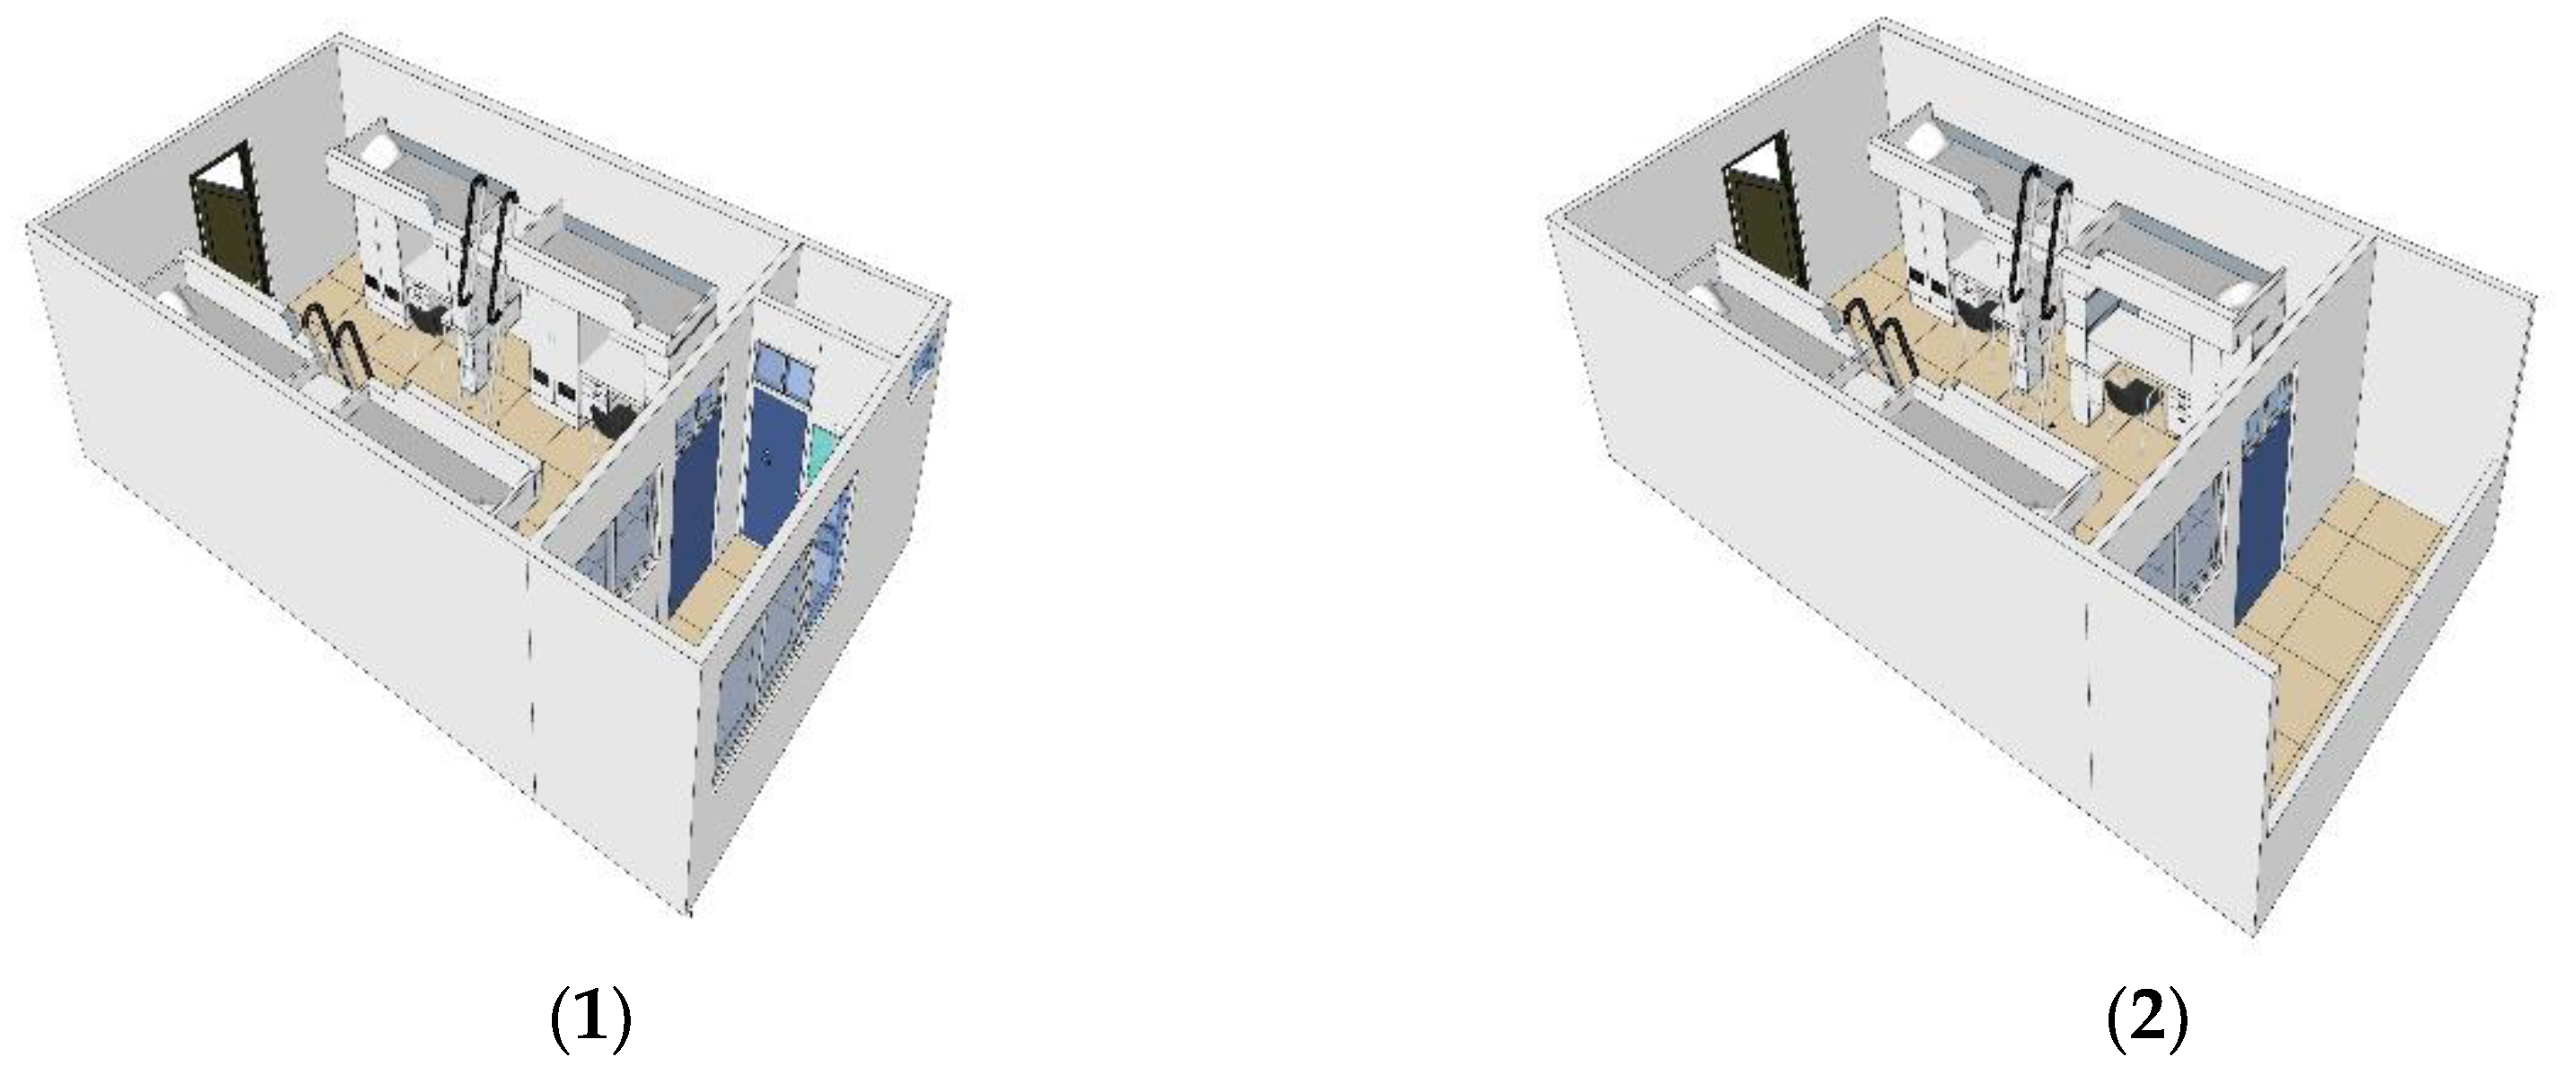
Figure 5.
3D view of the test room.
2.1.2. Assess indoor climate and air pollution factors
To mitigate the influence of random factors, each residence was measured for at least one hour, and the sampling was repeated over three days using professional precision instruments. The data monitoring instruments were positioned at a height of 1.1 m, facing the center of the room, without disrupting normal occupant activities. During PM2.5 and CO₂ sampling and testing, the indoor crowd’s activity trajectories were observed and recorded to exclude discrete data. Given the study’s focus on the impact of occupant behavior on the environment, the room occupants were known to be under closed management constraints prior to sampling. Table 2 presents specific information about the instruments’ accuracy at measurement points.
According to the Chinese indoor environmental quality standard [18], the collected data were converted into scientific expressions. The study utilized theories of human thermal comfort and indoor air quality for evaluation. Indoor climate factors were evaluated using the Predicted Mean Vote (PMV) thermal comfort index, which represents a comprehensive response to human thermal comfort rather than an individual indicator. The PMV assessment incorporated four environmental factors (indoor air temperature, air velocity, relative humidity, and mean radiant temperature) and two personal factors (clothing thermal resistance and metabolic rate) to calculate the thermal comfort of inhabitants. The actual calculated PMV values in this study are displayed in Table 3.
Several domestic and international standards have different methods for the study of PMV, as shown in Table 5. In this study, GB/T50785 [19] was used and the range of PMV was set at –1.0 < PMV < 1.0.
Indoor air quality standards from domestic and international studies are summarized in Table 3, highlighting that the evaluation of indoor air quality should consider multiple indicators rather than a single one. Indicators measuring the impact of human activity on the indoor environmental quality of dormitory buildings in various spatial forms include both pollutants and beneficial airborne particles. Indoor CO₂ concentration levels, often used as an indicator of fresh air levels, impact the cognitive ability and attention of inhabitants. PM2.5, a key pollutant, affects inhabitant health [24]. Negative (oxygen) ions in the air can adsorb fine particles, settling as wet and dry dust; thus, improving air quality. The benefits of adding NAIs to environments with high purity CO₂ are more pronounced than in low CO₂ conditions. NAIs also help reduce nasal irritation or dryness, skin irritation or dryness, drowsiness symptoms, and elevated heart rate problems caused by pure CO₂ . This significant study aligns with the campus intervention management and dormitory closure control conditions mentioned in this article; thus, underscoring the research relevance of incorporating NAIs into the IAQ evaluation system. This study aims to explore the feasibility of this incorporation.
The highest level of air-negative oxygen ions [25] greater than or equal to 1200 per cubic centimetre, is typically found in forest and waterfall areas. These conditions have therapeutic and rehabilitative effects. The second level, ranging from 500–1200 per cubic centimetre, can enhance the immune system and antimicrobial power of the human body. This level is generally found in wilderness areas and maintains basic human health needs, often appearing in parks. The third class, usually less than 500 per cubic centimetre, includes street green areas with concentrations ranging from 200–500 per cubic centimetre. The fourth class, typically representing the urban family environment, has negative oxygen ion concentrations less than 100 per cubic centimetre, with roads and vehicles having less than 30 per cubic centimetre. Consequently, this study selects these three types of substances as representative indicators for evaluating indoor air quality. The standards of various countries are depicted in Table 4. This study sets the upper limits of PM2.5, CO2, and anion concentrations at 75 µg/m³, 1,000 ppm, and 1,200 µg/m³, respectively.
Greater variations in temperature and humidity characteristics correlate with poorer indoor thermal comfort. Elevated carbon dioxide concentrations and increased PM2.5 content indicate a decline in indoor air quality. Conversely, negative oxygen ion values within the specified range signify excellent environmental status and superior air quality. Owing to 48 h of continuous sampling in the experiment, a substantial number of data samples were generated. This paper independently analyzes, verifies, and screens each index. Subsequently, the data were weighted to deduce comprehensive sample characteristics of the indoor environmental quality in the dormitory under a sealed control state. Consequently, indicators most relevant to human health were identified to evaluate indoor environmental quality.
2.1.3. Calculating real-time IEQ scores based on indoor climate and air pollution factors
- Evaluation score of individual indoor air environment parameters [30]
At this stage, the rate of PMV values was computed using online software (PMV 2008 ver 1.0, Ingvar Holmer) [22]. This involved considering individual specifications such as metabolic rate and clothing thermal resistance, alongside environmental specifications like air velocity and drying and radiation temperatures, to determine PMV indices . Euclidean distance, successfully utilized in other engineering fields, served as a comprehensive evaluation method. Although traditional Euclidean distance effectively calculates the “distance” between samples, it overlooks differing attributes. To address this limitation, the “weighted Euclidean distance” was introduced, with a fitness function established based on four environmental parameter indicators[28]. This was defined as the value of the AP-I (a combination of indoor air quality and indoor thermal comfort) score, starting from a base value of 0. The calculation formula is presented in Equation (1) [28].
where: YA is the evaluation score of a single indoor air environment parameter indicator; WA is the weight value of each air environment parameter indicator, with ∑W = 1; N is the total number of indoor air environment parameter indicators. The method of determining the evaluation scores and weights of individual indoor environmental parameter indicators is detailed based on comprehensive evaluation principles.
The environmental parameters were standardized based on the standard threshold value and actual index values, converting the results of individual indoor air environmental parameters into specific score values. The standardization formulae are as follows
where: XAmax is defined as the maximum limit standard range value of environmental parameter A according to the specification; XAmin is the minimum indicator value of environmental parameter A. XA is the actual indicator value of a certain environmental parameter, determined through the research of relevant domestic and foreign standards, to ascertain the upper limit value of the specification of the evaluation index for the test parameter. The minimum value of the environmental parameter indicator is established at zero. Quantitative indicators of air quality include not only pollutants but also beneficial air particles such as negative oxygen ions. For harmful substances, the standardized formula for environmental parameters is designated as formula (2), and for beneficial substances, it is formula (3). Additionally, it is stipulated that when indoor air environment evaluation indexes exceed the upper limit value specified in the standard, the score result defaults to zero.
- 2.
- Weighting analysis of indoor air environment parameters [30]
Due to the subjective nature of the weight determination method , the objective weight determination method is employed for calculating the weight value W. Currently, methods such as the entropy weight method, standard deviation method, and CRITIC method are utilized. The objective weight determination method includes the entropy weight method, standard deviation method, and CRITIC method. The CRITIC method, differing from the entropy weight method and standard deviation method, considers both the variability of the indicators and the correlation between them. Due to the mutual influence of indoor air environment parameters, this paper adopts the CRITIC method for determining the weight value W in the IEQ score formula. The objective CRITIC method mitigates the randomness and uncertainty of subjective evaluation, while also calculating the objective weight value W through the correlation of relevant indicators. This method diminishes the correlation of indicators, striving for a more comprehensive and balanced result. However, due to the differences in the values and units of different environmental parameters, direct theoretical calculations on results of environmental parameters with diverse characteristics are impractical. Therefore, it is essential to standardize the environmental parameters. The standardization formula is as follows [14].
where: denotes the jth indicator of the ith classroom, where i = 1, 2, 3, ..., and j = 1, 2, 3.... Equation (4) is applied for the lowest indicator value, suitable when higher indicator values are preferable; Equation (5) is used for the highest indicator value, applicable when lower indicator values are desired. Based on the standardization of indicators, the amount of information contained in the indicators is calculated using the CRITIC method:
The indicator conflict quantitative R is calculated as in equation (8), where rij is the correlation coefficient between indicators i and j, reflecting the degree of the relationship between the variables Aoki, based on the deviation of the two times and their respective mean values. Rj is calculated by the product difference method.
where rij is a linear unidirectional relationship, positive correlation when r>0, negative correlation when r<0, |r|= 1 for linear correlation, r = 0 no linear correlation.
where: Cj denotes the amount of information in the jth evaluation indicator; σj is the size and standard deviation of differences in program values within the same indicator; and rij represents the correlation coefficient between different evaluation indicators. Based on the obtained results, the weights between the indicators can be determined using the following calculation method:
where: Wj is the objective weight value of each indicator.
2.2.4. Presentation of scl-90 symptom self-rating scale scores and occupant mood characteristics
The SCL-90 symptom self-assessment scale scores and occupant mood characteristics are presented in Section 2.2.4. The SCL-90 scale assesses nine factors: somatization, obsessive-compulsive, interpersonal sensitivity, depression, anxiety, hostility, paranoia, psychotic symptoms, and phobia [17], with this study focusing on interpersonal sensitivity, anxiety, and other factors Items were rated on a 5-point Likert scale from 0 (not at all) to 4 (extremely likely), where a subscale rating of 2 or higher suggests potential psychological problems. Scores for the 80 subjects in the 16 rooms were tallied, and a composite psychological score for each room was calculated using the mean method. To exclude the effect of pre-existing mental illness, none of the subjects had a history of psychiatric illness. Additionally, 455 questionnaires completed by non-measurement dormitory occupants were collected to reflect overall campus conditions.
A questionnaire survey on the subjective evaluation of the indoor environment and human behavior in the student dormitories of Chang’an University Weishui Campus was conducted, including 535 participants, including 80 direct occupants of the measured environments. The questionnaires gathered information about the students’ basic details, living habits, efforts to create an indoor air environment (e.g., planting of plants, use of purification equipment, shading measures), satisfaction with indoor environmental parameters, and scores on the SCL-90 self-assessment scale for mental health symptoms. Participants also completed the Symptom Checklist SCL-90 Revised (SCL90-R) questionnaire and engaged their family members through the Family Environment Scale (FES). This study also included the Subjective Indoor Thermal Comfort Survey and the Air Quality Survey, alongside questionnaires and scales to assess subjective perceptions of and satisfaction with the AP-I [19], as well as their health status.
3. Results and discussion
3.1. Evaluation of individual indoor air environment parameters
- Hot and humid environments
The test results indicate that the average indoor temperature range in the Sunny Room dormitory is between 19.11 °C and 23.13 °C, while the mean relative humidity range is from 59.03% to 72.73%. The Sunny Room dormitory’s indoor temperature and humidity range from 19.57 °C to 23.04 °C and 58.57% to 78.40%, respectively. Although the average relative humidity range typically varies from 40% to 80%, the frequency of values exceeding 60% is 87.50%, indicating a predominantly high humidity condition. The PMV values, calculated based on tested temperature, relative humidity, average radiation temperature, wind speed, and metabolic rate, are detailed in Figure 6. These values, considering a metabolic rate of 1 met for sedentary activities and clothing insulation values of 1 clo for indoor winter clothing (0.5 clo for typical summer clothing), all fall within the thermal comfort range of this study (reference: GB/T50785: –1.0<PMV<1.0).
- 2.
- Indoor air quality
As depicted in Figure 7, the statistical analysis of CO₂ concentration data in the indoor environment of the dormitories during the test period revealed that CO₂ concentrations in sunny dormitories varied from 419.40 ppm to 805.70 ppm, whereas in dormitories without sunlight, the range was 428.78 ppm to 865.30 ppm. In all samples from the dormitories, CO₂ levels remained below the 1000 ppm limit, yet the concentrations in dormitories lacking sunlight exhibited significant fluctuations.
Figure 8 and Figure 9 present the statistical results for PM2.5 and NAI concentration data in the dormitories during the test period. In sunny dormitories, the mean indoor PM2.5 concentrations ranged from 57.29 µg/m3 to 91.56 µg/m3, surpassing the standard limit of 35 µg/m3, with 50% exceeding the 75 µg/m3 threshold. Conversely, the mean indoor PM2.5 concentrations in non-sunny dormitories varied from 75.62 µg/m3 to 106.21 µg/m3, all exceeding the 75 µg/m3 limit. Therefore, the sunny dormitories demonstrated better air quality than those without sunlight. Regarding NAI concentrations, sunny dormitories showed mean values from 203.17 µg/m3 to 955.35 µg/m3, with 67.5% exceeding the 500 µg/m3 limit. In contrast, dormitories without sunlight had mean NAI concentrations ranging from 137.07 µg/m3 to 399.40 µg/m3, remaining below the 500 µg/m3 limit, indicating superior results in sunlit dormitories.
3.2. Comprehensive evaluation analysis
3.2.1. General Analysis of environmental parameters
The data from all test subjects were processed and summarized. Utilizing the CRITIC method, as per Equations (4) to (7), the weights of four index values (PMV, CO₂, PM2.5, NAIs) were calculated, yielding results for single environmental parameter indicators as shown in Figure 10. The comprehensive scores of AP–I for 16 dormitories, derived from formula (1), are presented in Figure 11. The highest score was recorded for R2 (0.4937), while the lowest was for R12 (0.1395). Generally, dormitories with sunny rooms scored higher than those without, indicating better overall indoor environmental quality. All experimental rooms, uniformly naturally ventilated with an air exchange rate of 5 times/h and HVAC systems operational during the test period (2 November to 6 November, as heating in northern China starts on 15 November), exhibited significant differences in indoor environmental quality under natural ventilation conditions.
3.2.2. Subjective psychological questionnaire score processing
Given the closed management environment, students typically spend over 90% of their time indoors [31]. During public health emergencies, abnormal psychological conditions can emerge, particularly among college students, manifesting as interpersonal sensitivity, anxiety, poor diet, and sleep disturbances. In this context, 80 individuals living in the test environment completed questionnaires, with data processing [32] results shown in Table 5.
Table 5.
Results of comparison of scl-90 scores with national normative SCL-90 scores under experimental conditions.
Table 5.
Results of comparison of scl-90 scores with national normative SCL-90 scores under experimental conditions.
| Factor | Measurement of environmental occupants(n=80) | National permanent model (n=1388) | t | P |
| Interpersonal sensitivity (with sunroom) | 1.67±0.63 | 1.65±0.61 | 2.153 | 0.039 |
| Interpersonal sensitivity (no sunroom) | 1.69±0.62 | 1.65±0.61 | 4.189 | 0.000 |
| Anxiety (with sun room) | 1.40±0.57 | 1.39±0.43 | 1.864 | 0.072 |
| Anxiety (no sunroom) | 1.41±0.51 | 1.39±0.43 | 3.738 | 0.001 |
| Other - including eating and sleeping (with sunroom) | 1.51±0.61 | 1.50±0.59 | 0.863 | 0.395 |
| Other - including diet and sleep (no sunroom) | 1.53±0.58 | 1.50±0.59 | 3.169 | 0.003 |
A comparison with the national norm reveals that under closed campus management, factors such as interpersonal sensitivity, anxiety, and other conditions (diet and sleep) were elevated, especially in dormitories without sunlight, showing a significant difference [33] (P < 0.01). During closed campus management in transitional seasons, reduced window openings and ventilation lead to poorer indoor air quality, contributing to various psychological conditions [33]. According to the SCL-90 symptom self-assessment scale, the trend in environmental complaints and psychological condition scores among test room occupants indicates that physical environment influences psychological states. Continued exposure to suboptimal indoor air quality has been correlated with persistent symptoms of psychological distress [34].
3.3. Analysis of IEQ factors and scl-90 symptom self-rating scale scores based on building occupant behavior
By examining the results from Figure 10 and Figure 11, the AP–I composite scores of different residences indicate that the main factors affecting indoor air environment can be categorized as follows (as shown in Table 6):
Category 1 comprises cases where indoor heat and humidity environmental factors adversely affect the overall evaluation score. For example, R14, with an average winter indoor temperature of 15.8 °C and no heating equipment use during the monitoring period, resulted in poor resident satisfaction regarding indoor thermal sensation. In contrast, R2, R6, R7, and R8, with indoor temperatures of 19.8 °C, 17.3 °C, 17.6 °C, and 18.9 °C respectively, and equipped with sunrooms, demonstrated significantly more effective thermal insulation. Improving the quality of the indoor thermal environment in these cases would correspondingly enhance their composite scores.
Category 2 includes dormitories where indoor air quality factors contribute to lower comprehensive evaluation scores. This category mainly comprises R1, R2, R7, R13, and R15, which have low scores in environmental parameters of air quality. The comprehensive score reflects the overall effect of the dormitory environment. Sunroom installations in these dormitories reduce the frequency of indoor-outdoor air exchange, leading to poor ventilation. Therefore, improving indoor ventilation is crucial for enhancing the comprehensive indoor environment of these residences.
Category 3 involves residences that fare poorly in both indoor thermal comfort and air quality, primarily R13 and R15. During autumn and winter in northern China, low outdoor temperatures and poor thermal comfort often lead households to close doors and windows for heat preservation, resulting in poor indoor ventilation. Improvements in both indoor thermal and humid environments, as well as air quality, are necessary for these types of housing.
Table 6 results show that during closed campus management, dormitory occupants expressed dissatisfaction with prolonged stays indoors. Significant symptoms of interpersonal sensitivity were observed in sunless inter-dormitories (t = 3.738), along with depressive symptoms (t = 3.169). After comparing post-test scores to national norms, respondents with higher symptom scores were re-contacted. Most indicated increased sensitivity to indoor air quality during closed management, leading to negative moods and related psychological symptoms. 22 out of 425 respondents reported significant mania symptoms during study and rest periods, seeking help from university counsellors. Upon consulting counsellors in April 2023, it was found that 12 of these students required multiple sessions of psychological counselling and guidance, stemming from special circumstances in their family backgrounds. Accordingly, psychological counselling was recommended, alongside optimizing indoor ventilation and air quality. The study highlights that mental health management at universities during intervention management often overlooks the renewal of living environments. In fact, building management optimization was not feasible on the campus during the pandemic due to lack of access to data on occupants’ psychological feelings and living comfort under extreme conditions.
4. Conclusions
This paper analyzes indoor air quality, including CO2 and particulate matter PM2.5, under COVID-19 intervention management conditions. It weighs individual scores to produce a composite AP–I score, wherein anions, as a nonpollutant indicator, are considered positively in weighting and calculation. The final IEQ score demonstrates consistency with individual scores, affirming the applicability of negative oxygen ions in the AP–I score.
However, this study has limitations. It does not deeply investigate the index calculation for indoor light and acoustic environments and focuses only on optimizing IAQ indexes. The model construction is simplified with two parameters, PMV and IAQ, suggesting future development directions for IEQ models. Pandemic diseases or public health emergencies pose challenges and opportunities for building operations and design. The in-depth exploration of occupants’ living experiences includes subjective assessments of thermal comfort and air quality and innovative research on psychological distress in extreme situations, attempting to establish a relationship between negative emotional states and indoor environments. The study reveals that in indoor environments without obvious discomfort in the thermal environment and air quality, people may still exhibit psychological distress due to social constraints and interpersonal situations.
From the results of the study, we can conclude that:
University management interventions during public health emergencies significantly impact building operations, occupant adaptation, and building renewal. These interventions have alerted various disciplines, including building science and health.
In optimizing IEQ’s model for individual factors, logical and linear analyses are more conducive to comparing and selecting results. The treatment of indicators like negative oxygen ions in IAQ evaluation exemplifies this approach.
The primary difference between building forms (dormitories with exposed balconies vs. additional sunrooms) lies in ventilation efficiency, affecting both thermal comfort and air quality.
Completing subjective state surveys and psychological distress risk assessments requires alignment with the social environment and physical health status of individuals. Psychological issues often stem from a range of factors, including family backgrounds.
Overall, the study underscores the need for more data support and analysis methods in developing IEQ models, emphasizing the importance of considering social background, population state, and social pressure in evaluating indoor environments. This research provides data supplementation and model validation under the status quo of COVID-19 intervention management, highlighting the evolving role of subjectivity in indoor environment evaluation.
Author Contributions
Conceptualization, Qingya Xu, Lei Zhang and Yan Yang; Data curation, Lei Zhang and Yan Yang; Formal analysis, Qingya Xu, Lei Zhang and Yan Yang; Funding acquisition, Lei Zhang; Investigation, Qingya Xu and Lei Zhang; Methodology, Qingya Xu, Lei Zhang and Yan Yang; Project administration, Lei Zhang; Resources, Lei Zhang; Software, Qingya Xu, Lei Zhang and Yan Yang; Supervision, Lei Zhang; Validation, Qingya Xu and Yan Yang; Visualization, Qingya Xu and Yan Yang; Writing – original draft, Qingya Xu, Lei Zhang and Yan Yang; Writing – review & editing, Qingya Xu, Lei Zhang and Yan Yang.
Funding
This research received no external funding.
Data Availability Statement
The data presented in this study are available on request from the corresponding author.
Acknowledgments
The authors would like to thank Mr. Lei Zhang for helpful discussions on topics related to this work.
Conflicts of Interest
The authors declare no conflicts of interest.
References
- Liu, F.D., et al., A review on indoor green plants employed to improve indoor environment. JOURNAL OF BUILDING ENGINEERING, 2022. 53.
- Sandang, G., et al., A Review of the Interactive Relations Between People and the Built Environment. Mathematics in Practice and Theory, 2022. 52(07): p. 51-59.
- Feng, J.J., Z.N. Zhou, and W.W. Li, Associating indoor air temperature with building spatial design and occupancy features: A statistical analysis on university classrooms. Building and Environment, 2022. 216: p. 19.
- Chiang, C.M., et al., A methodology to assess the indoor environment in care centers for senior citizens. Building and Environment, 2001. 36(4): p. 561-568.
- Roumi, S., et al., Commercial building indoor environmental quality models: A critical review. Energy Build, 2022: p. 263.
- Roumi, S., F. Zhang, and R.A. Stewart, Global Research Trends on Building Indoor Environmental Quality Modelling and Indexing Systems—A Scientometric Review. Energies, 2022. 15(12): p. 4494.
- Heinzerling, D., et al., Indoor environmental quality assessment models: A literature review and a proposed weighting and classification scheme. Building and Environment, 2013. 70: p. 210-222.
- Zhang, D., K.-W. Mui, and L.-T. Wong Ten Questions Concerning Indoor Environmental Quality (IEQ) Models: The Development and Applications. Applied Sciences, 2023. 13, DOI: 10.3390/app13053343.
- .
- (WHO), W.H.O. Considerations for school-related public health measures in the context of COVID-19. 2020 [cited 2020 5.10].
- 오근숙 and G. Jung, A Field Study on Improvement of Indoor Air Quality, Occupants’ Perceived Air Quality, Sick Building Syndrome Symptoms, and Learning Concentration with Indoor Plants in University Classrooms. Journal of the Architectural Institute of Korea Planning & Design, 2012. 28(07): p. 261-268.
- Zhenyan, Y., et al., Effect of meteorological and environmental factors on negative oxygen ions concentration in Zhejiang province. China Environment Science, 2023: p. 1-23.
- Chong, H.L., S.M. Jasman, and M.E, 2019 Theory and Technique International Aerosol Conference and Malaysia Air Quality Annual Symposium (T&T IAC MAQAS2019). IOP Conference Series: Earth and Environmental Science, 2019. 373.
- Kim, J., et al., Analyzing the real-time indoor environmental quality factors considering the influence of the building occupants’ behaviors and the ventilation. Building and Environment, 2019. 156: p. 99-109.
- Wolkoff, P., Indoor air humidity, air quality, and health – An overview. International Journal of Hygiene and Environmental Health, 2018. 221(3): p. 376-390.
- Yamada, Y., et al., Regional Difference in the Impact of COVID-19 Pandemic on Domain-Specific Physical Activity, Sedentary Behavior, Sleeping Time, and Step Count: Web-Based Cross-sectional Nationwide Survey and Accelerometer-Based Observational Study. JMIR Public Health Surveill., 2023. 20.
- Jingwei,, L. and H. Jiajing, Psychological fluctuations and guidance strategies for university students in major epidemics;Zhongda yiqing zhongde xuesheng dexin libo dongyu yindao celve. Ideological Education Research;Sixiang zhengzhi jiaoyu, 2020. No.309(03): p. 66-70.
- Committee, N.H.a.W., Indoor air quality standard. 2022, National Health Commission of the People’s Republic of China.
- Miao, D., X.D. Cao, and W.X. Zuo, Associations of Indoor Environmental Quality Parameters with Students’ Perceptions in Undergraduate Dormitories: A Field Study in Beijing during a Transition Season. International Journal of Environmental Research and Public Health, 2022. 19(24): p. 17.
- China, M.o.H.a.U.-R.D.o.t.P.s.R.o., Indoor Heat and Wet Environment Evaluation Standard for Civil Buildings. 2012, China State Engineering and Construction Pres: China.
- Kelechava, B., Thermal Environmental Conditions for Human Occupancy. 2021, US-ASHRAE.
- E, I., ISO 7730 Ergonomics of the Thermal Environment— Analytical Determination and Interpretation of Thermal Comfort Using Calculation of the PMV and PPD Indices and Local Thermal Comfort Criteria. Management, 2005. 710(3): p. 605-615.
- B., O., Revision of EN15251 standard related to criteria for the indoor environment. REHVA, 2012. 49(4): p. 611.
- Tham, K.W., Indoor air quality and its effects on humans-A review of challenges and developments in the last 30 years. Energy and Buildings, 2016. 130: p. 637-650.
- China, F.B.o.t.P.s.R.o., Specification on observation on air negative oxygen ion concentration. 2016.
- Orgnization, W.H., Word Health Orgnization.Airquality guidelines:global update2005:particulate matter,ozone,nitrogendioxide,and sulfur dioxide. 2006.
- China, M.o.H.a.U.-R.D.o.t.P.s.R.o., GB50325-2020;Code for indoor environmental pollution control of civil building engineering. 2020, Ministry of Housing and Urban-Rural Development of the People’s Republic of China.
- Website, C.M.S., Grade of air negative (oxygen)ion concentration. 2017.
- Chengzhang, L., et al., Study on Establishment of the Technical System for Monitoring Air Negative Oxygen Ion in China. Forest Resources Management, 2019(03): p. 20-25.
- Zhiwei, Z., et al., Comprehensive Evaluation on Indoor Air Environment Quality of Urban Residences in Hot-summer and Cold-winter Zone:A Case Study of Hangzhou City. Building Science, 2022. 38(08): p. 54-60+183.
- Liu, Z.B., Y.X. Li, and L. Zhao, Monitoring and Analysis of Indoor Air Quality in Graduate Dormitories in Northern China. Atmosphere, 2022. 13(12): p. 26.
- Huiyan, L., et al., A survey on the mental health of postgraduate medical students during the control of a local outbreak of novel coronavirus pneumonia in the post-epidemic era;Houyi qingshi daixin xingguan zhuangbing dufei yanju bubao fafang kongqi jianyi xuesheng xinli jiankang zhuangkuang diaocha. Journal of Practical Medicine;shiyong yixue zazhi, 2021. 37(23): p. 3067-3071.
- Zhengyu, W., th Self-Report Symptom Inventory,Symptom Check-List90,SCL-90. Shanghai Archives of Psychiatry, 1984(02): p. 68-70.
- Dengbei, A. Yating, and Huhui, Anxiety status of university students in Wuhan during the novel coronavirus pneumonia outbreak and its influencing factors;Xinxing guangzhuang bingdu feiyan yiqing qijian wuhan shida xuesheng jiaolv zhuangkuang jiqi yingxinag yinsu. Journal of Wuhan University (Medical Edition);Wuhan daxue xuebao(yixxue ban), 2021. 42(03): p. 369-372.
Figure 2.
Schematic diagram of a sample of test rooms with sunroom dormitories (R1-R8).
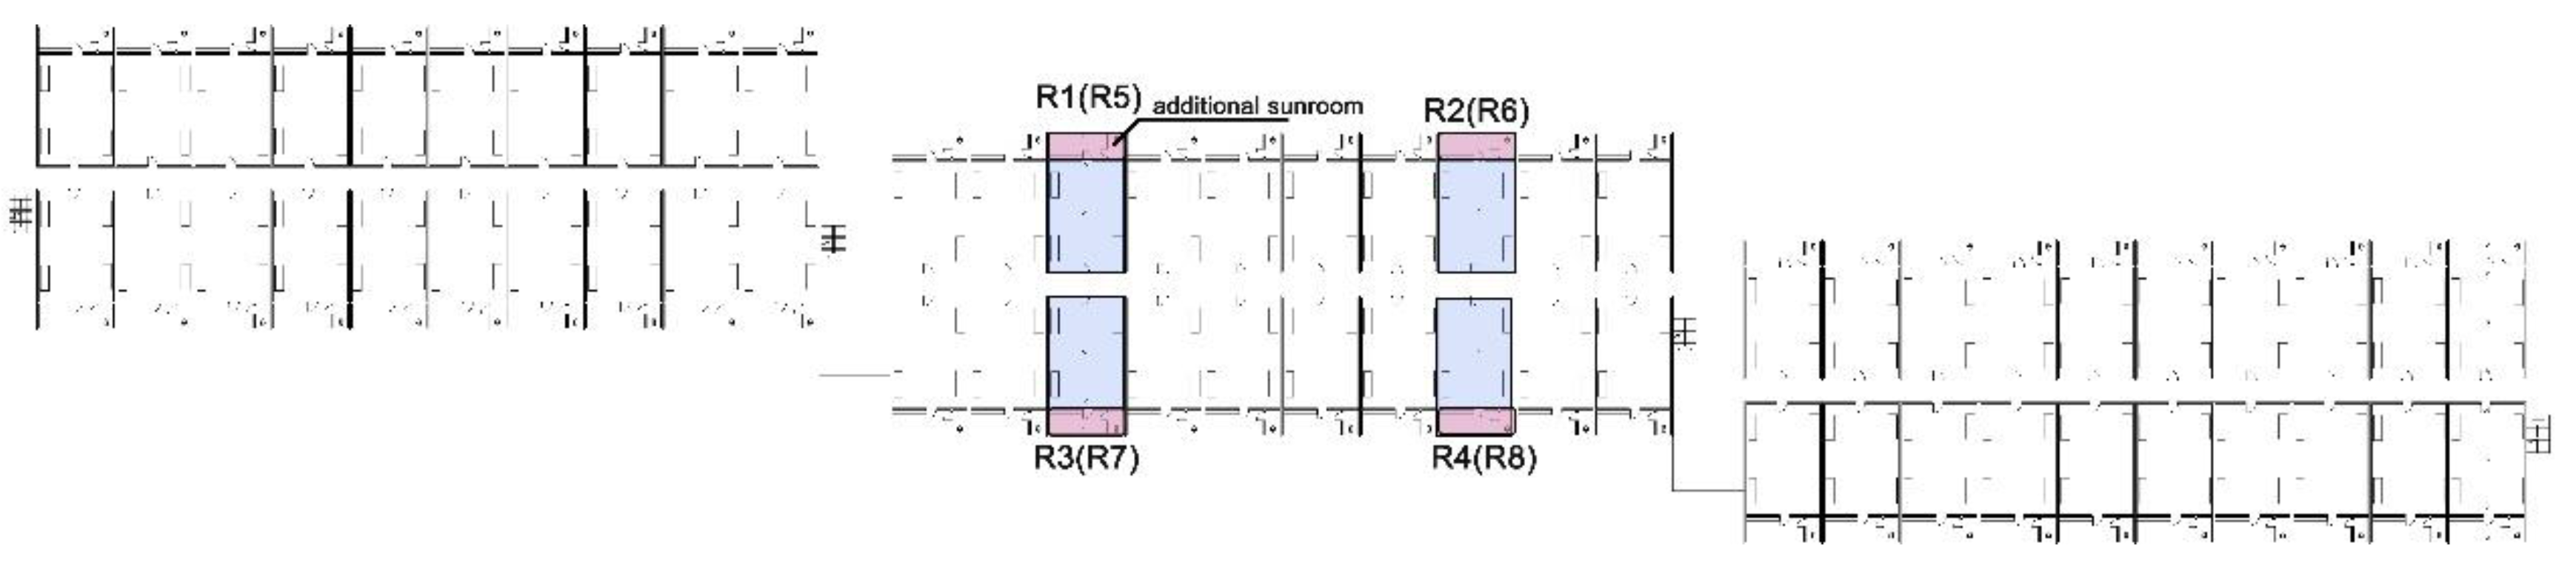
Figure 3.
Schematic diagram of a sample of test rooms in a dormitory without sunrooms (R9-R16).
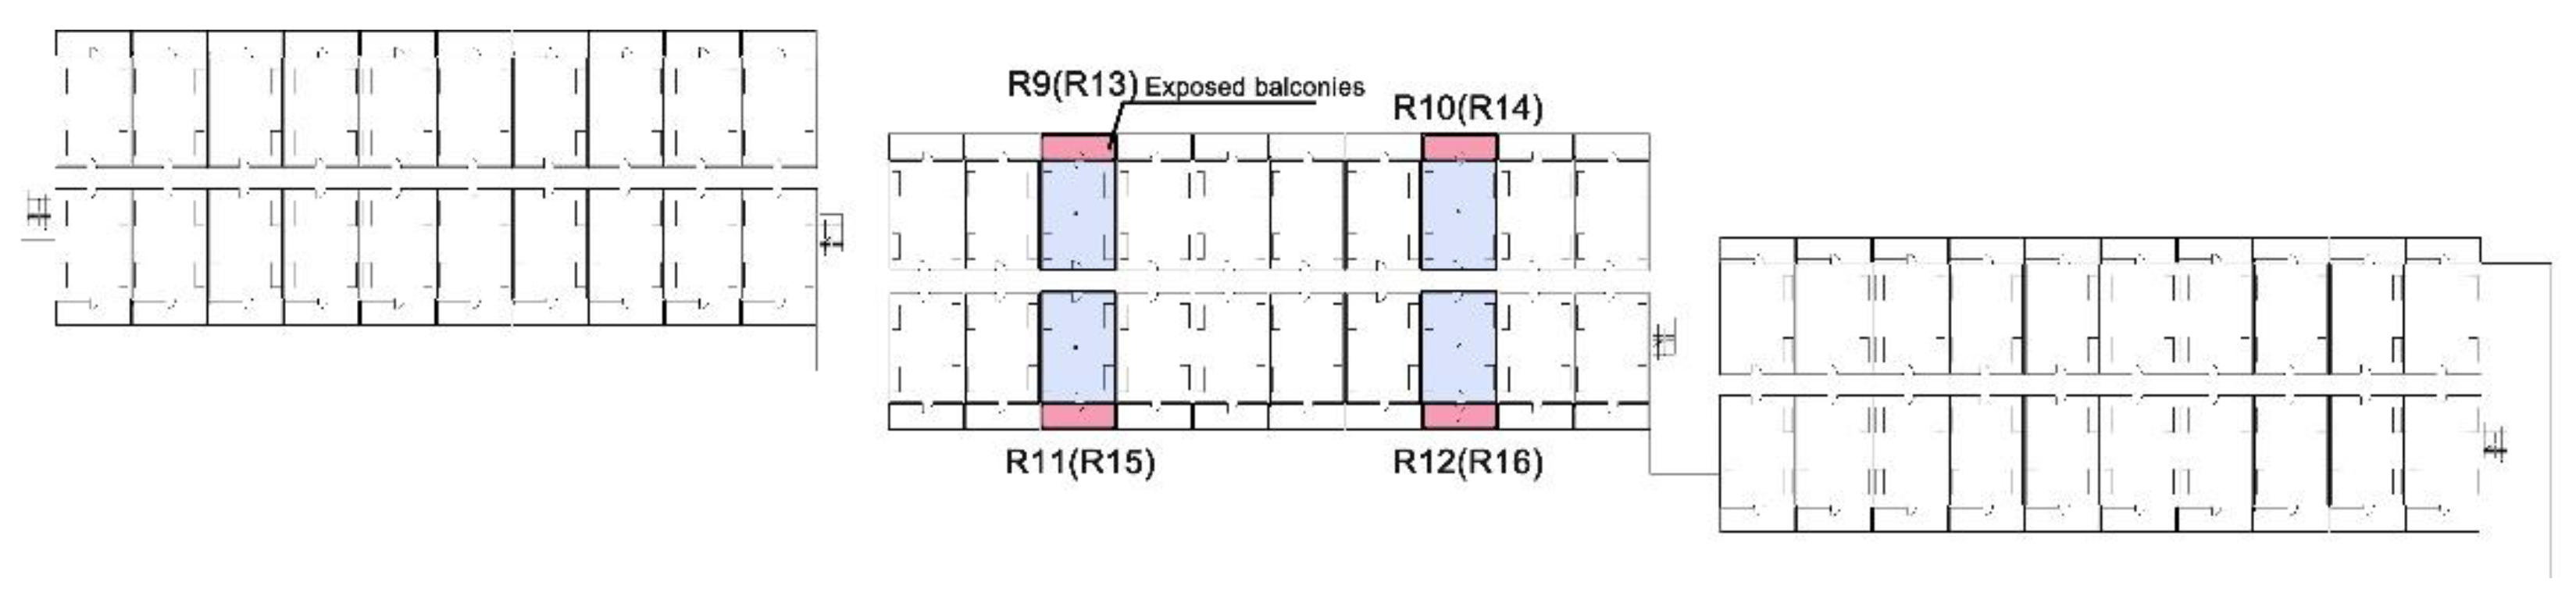
Figure 4.
Test room plan.
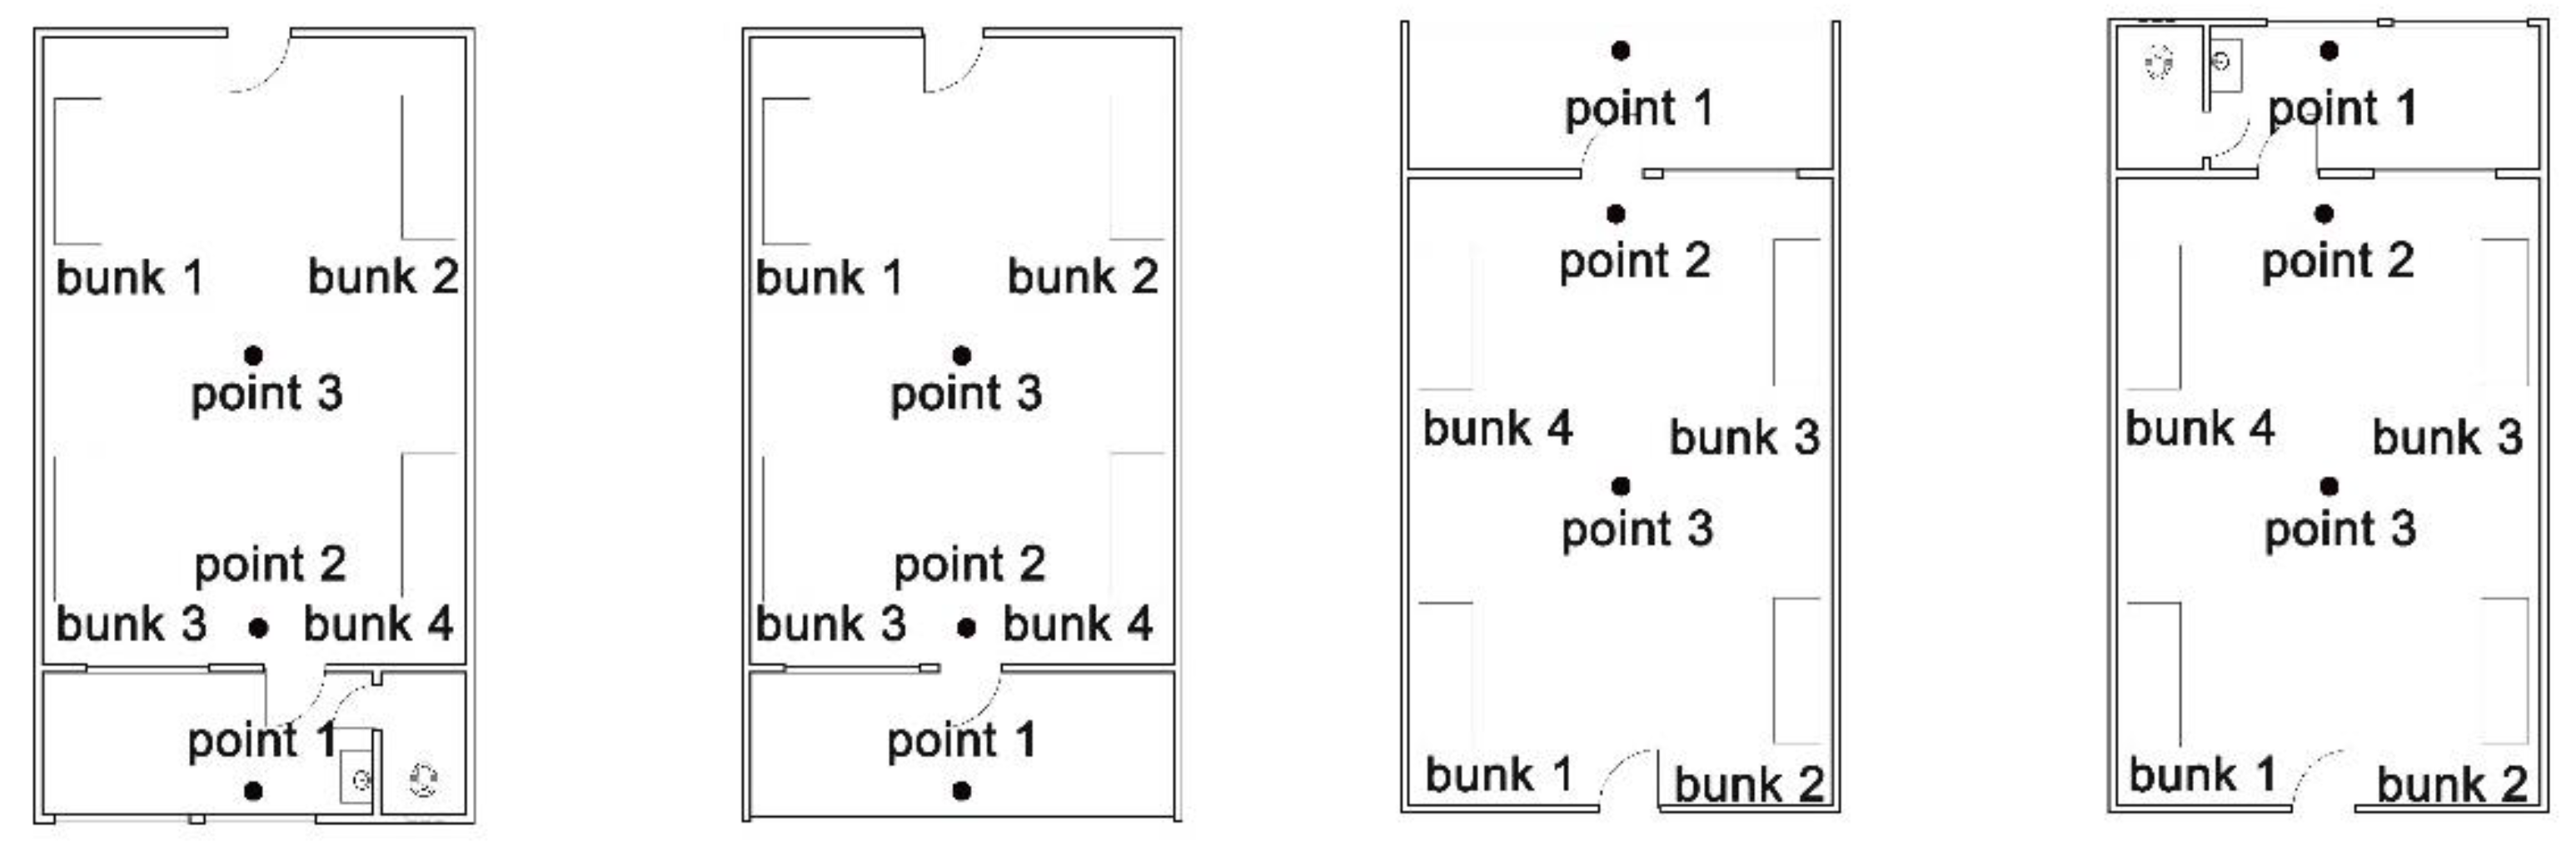
Figure 6.
Calculated indoor PMV-PPD values for dormitories.
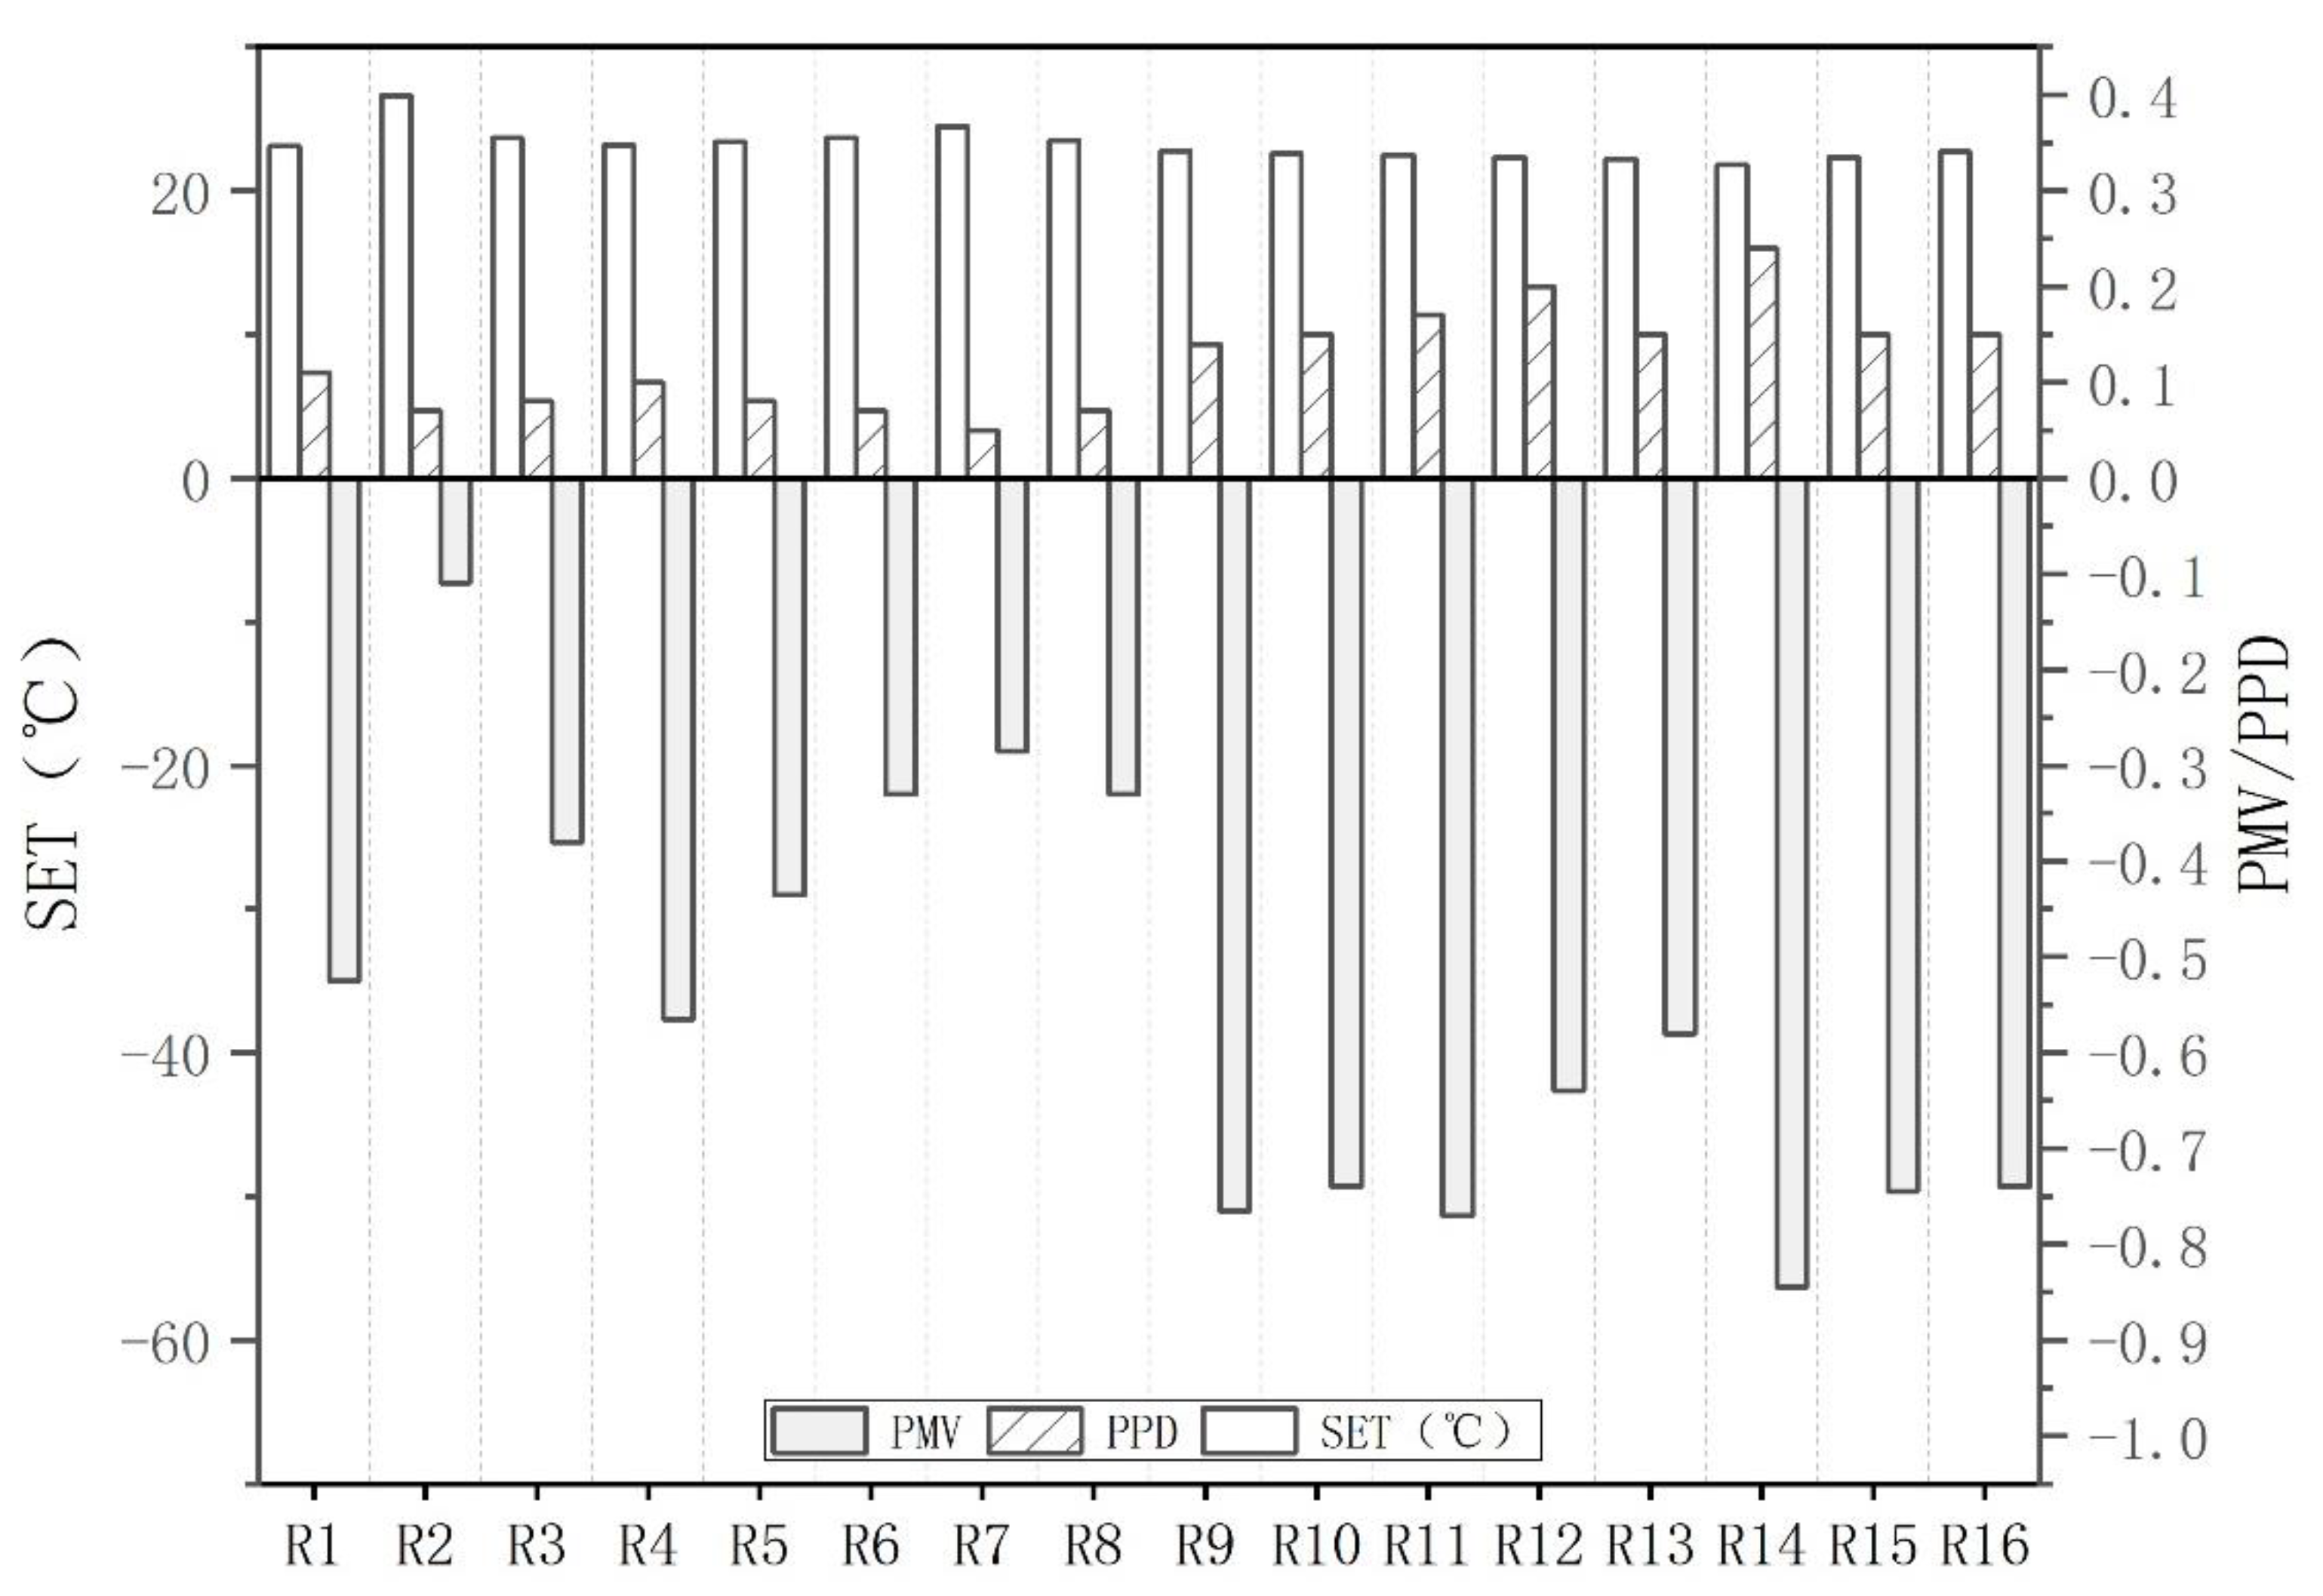
Figure 7.
Testing co2 concentration in the dormitory room.
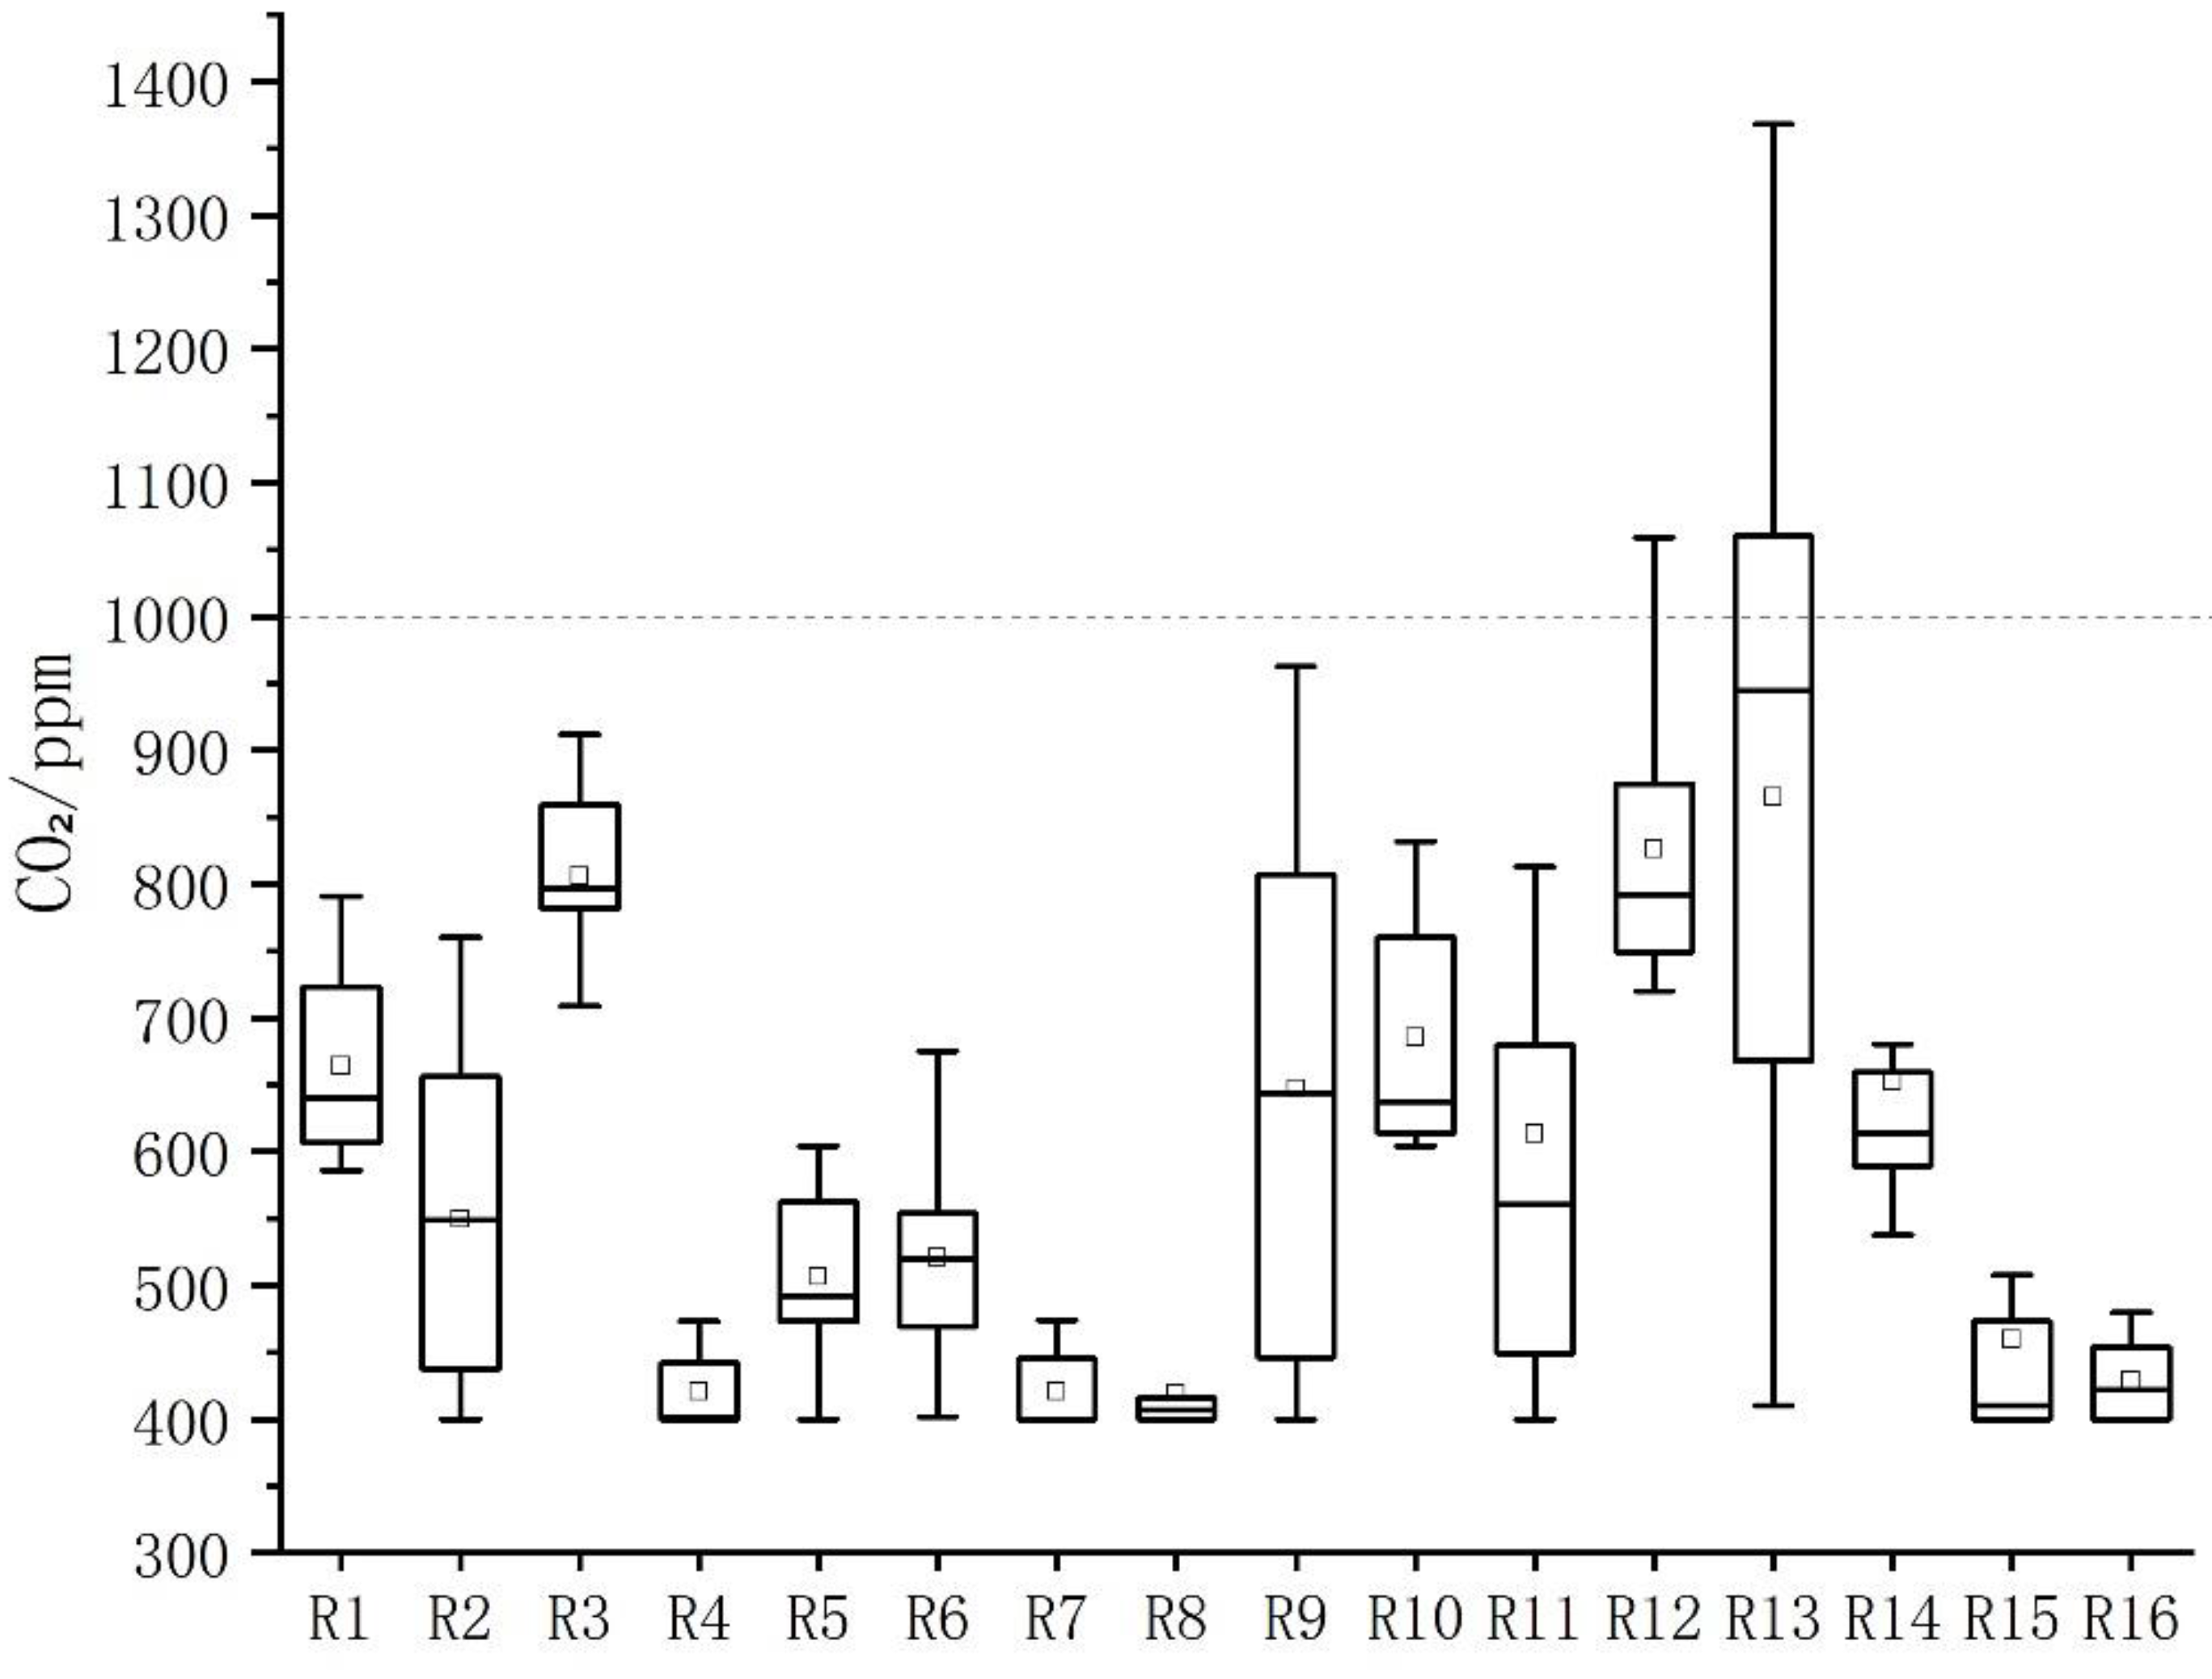
Figure 8.
Testing of pm2.5 concentration in dormitory rooms.

Figure 9.
Testing the concentration of negative oxygen ions in the dormitories.
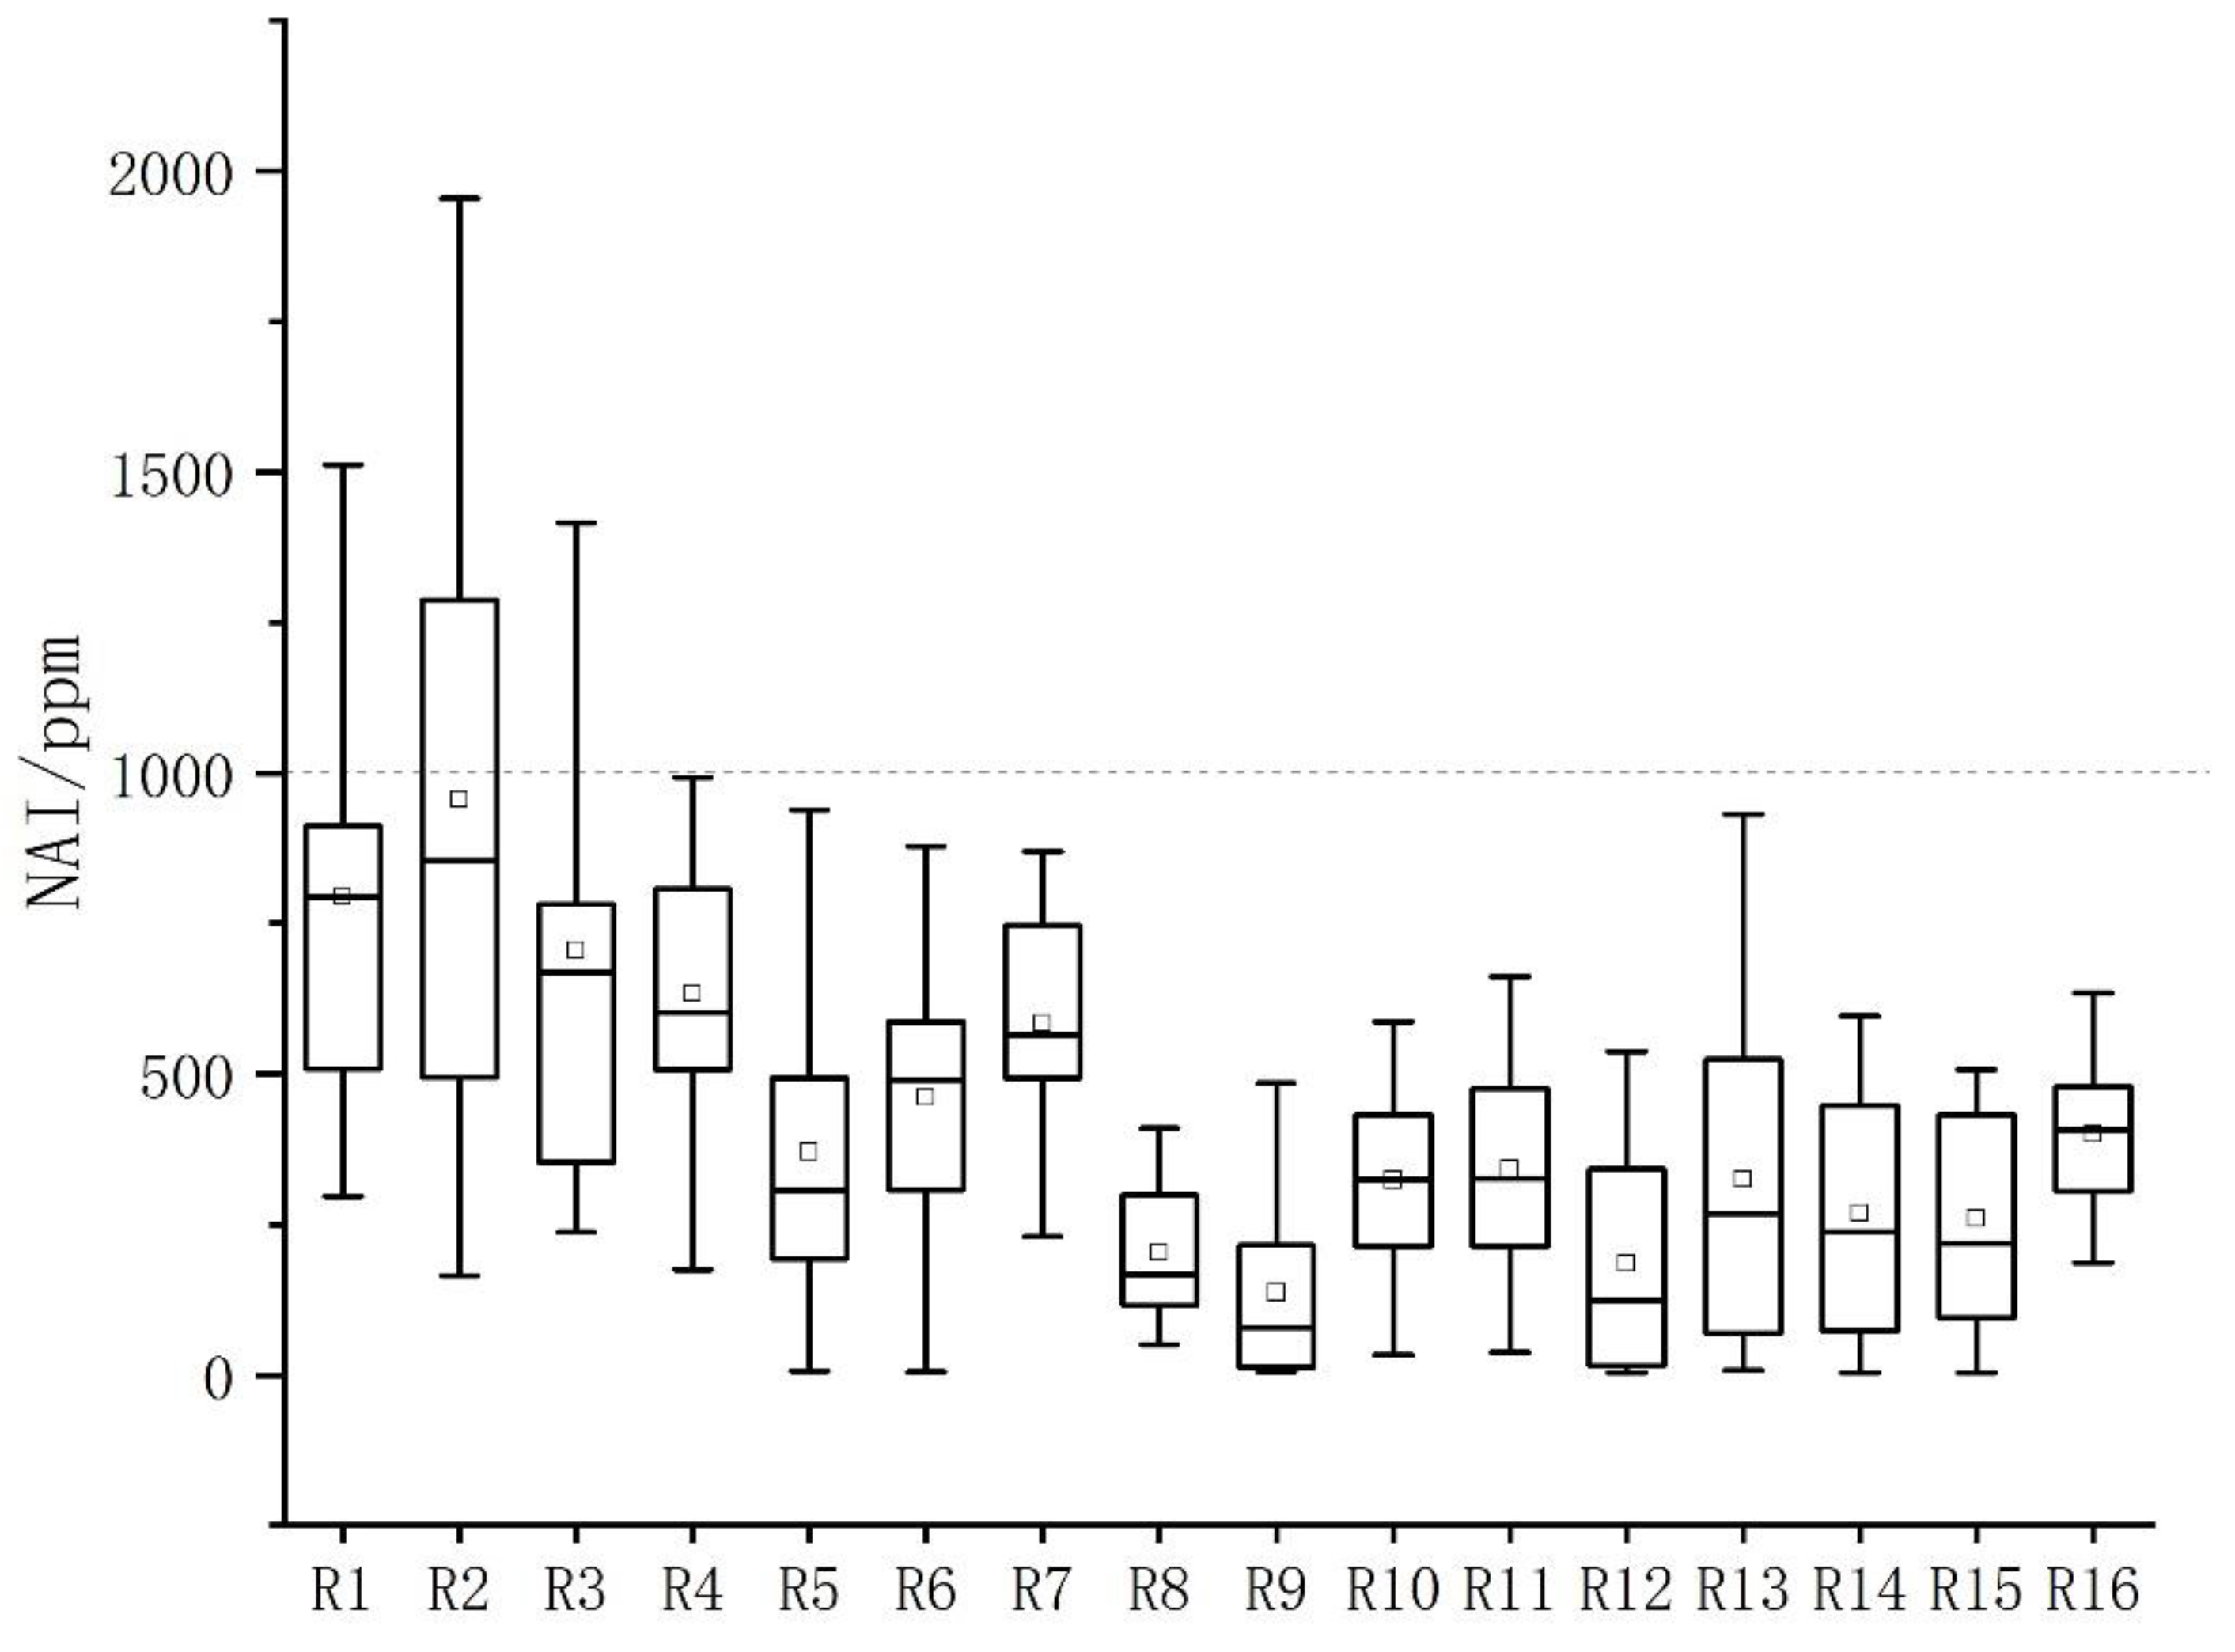
Figure 10.
Results of the standardized treatment of indoor environmental indicators.
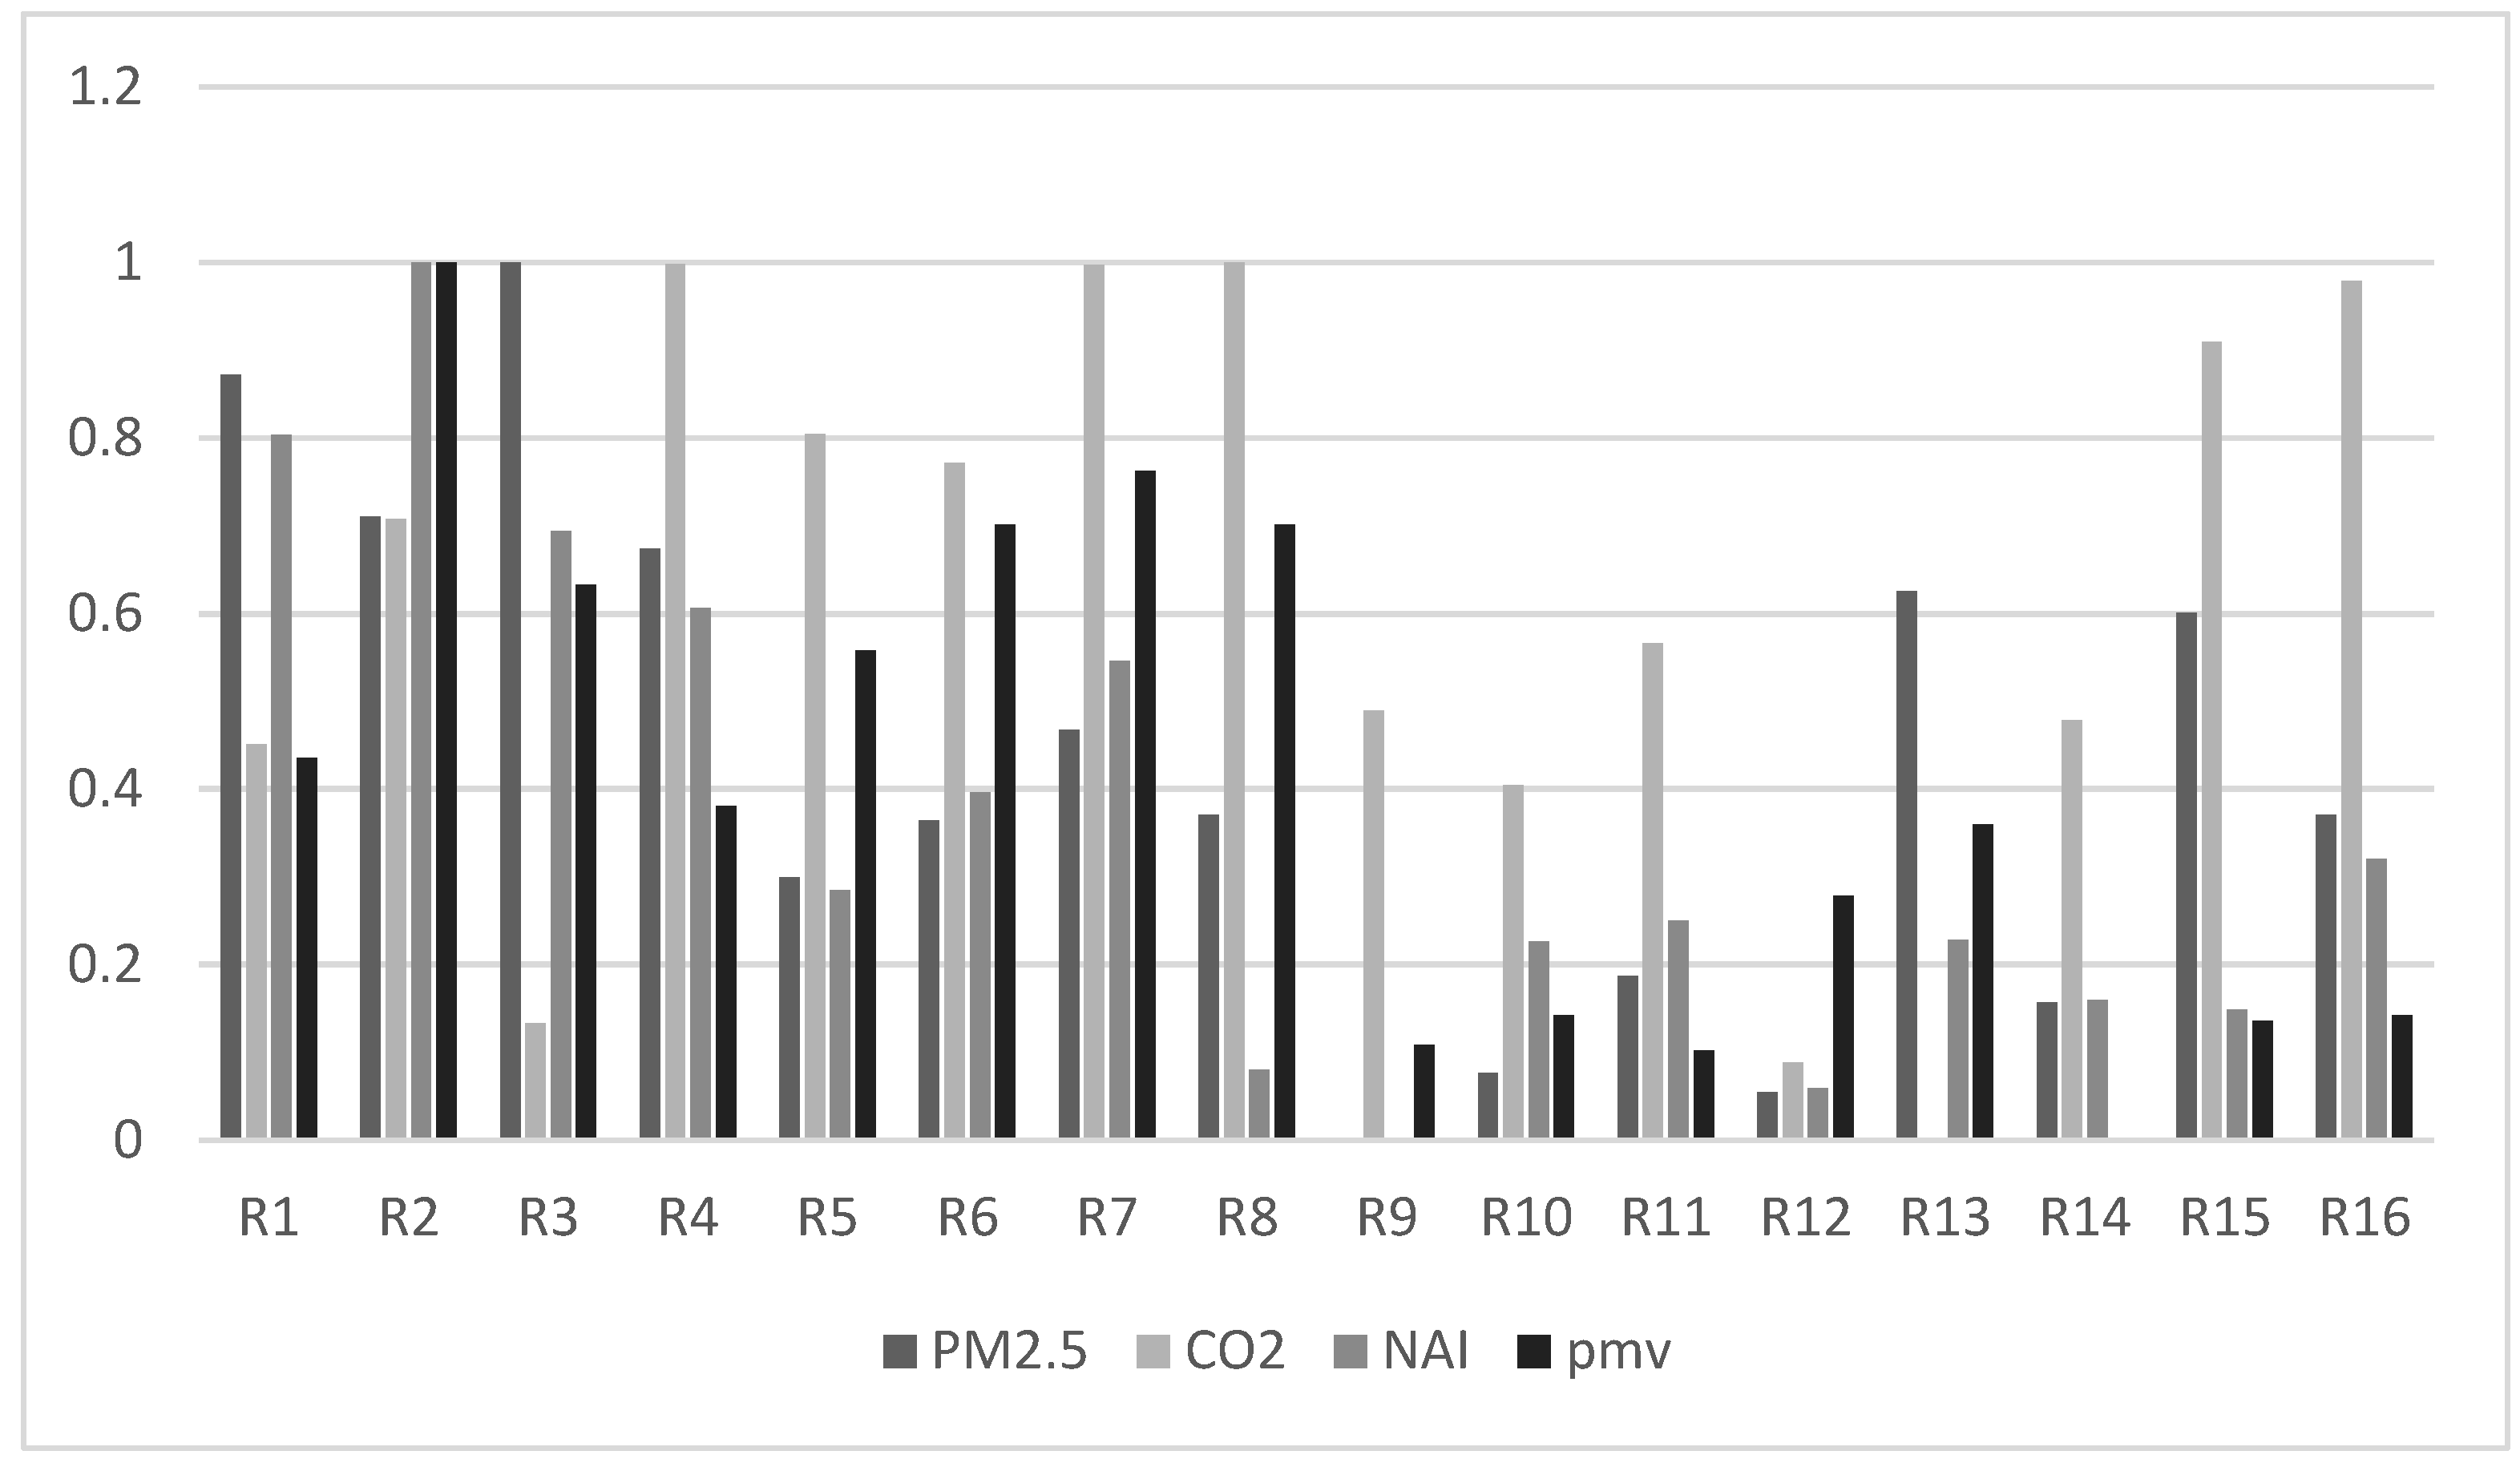
Figure 11.
IEQ composite score results.
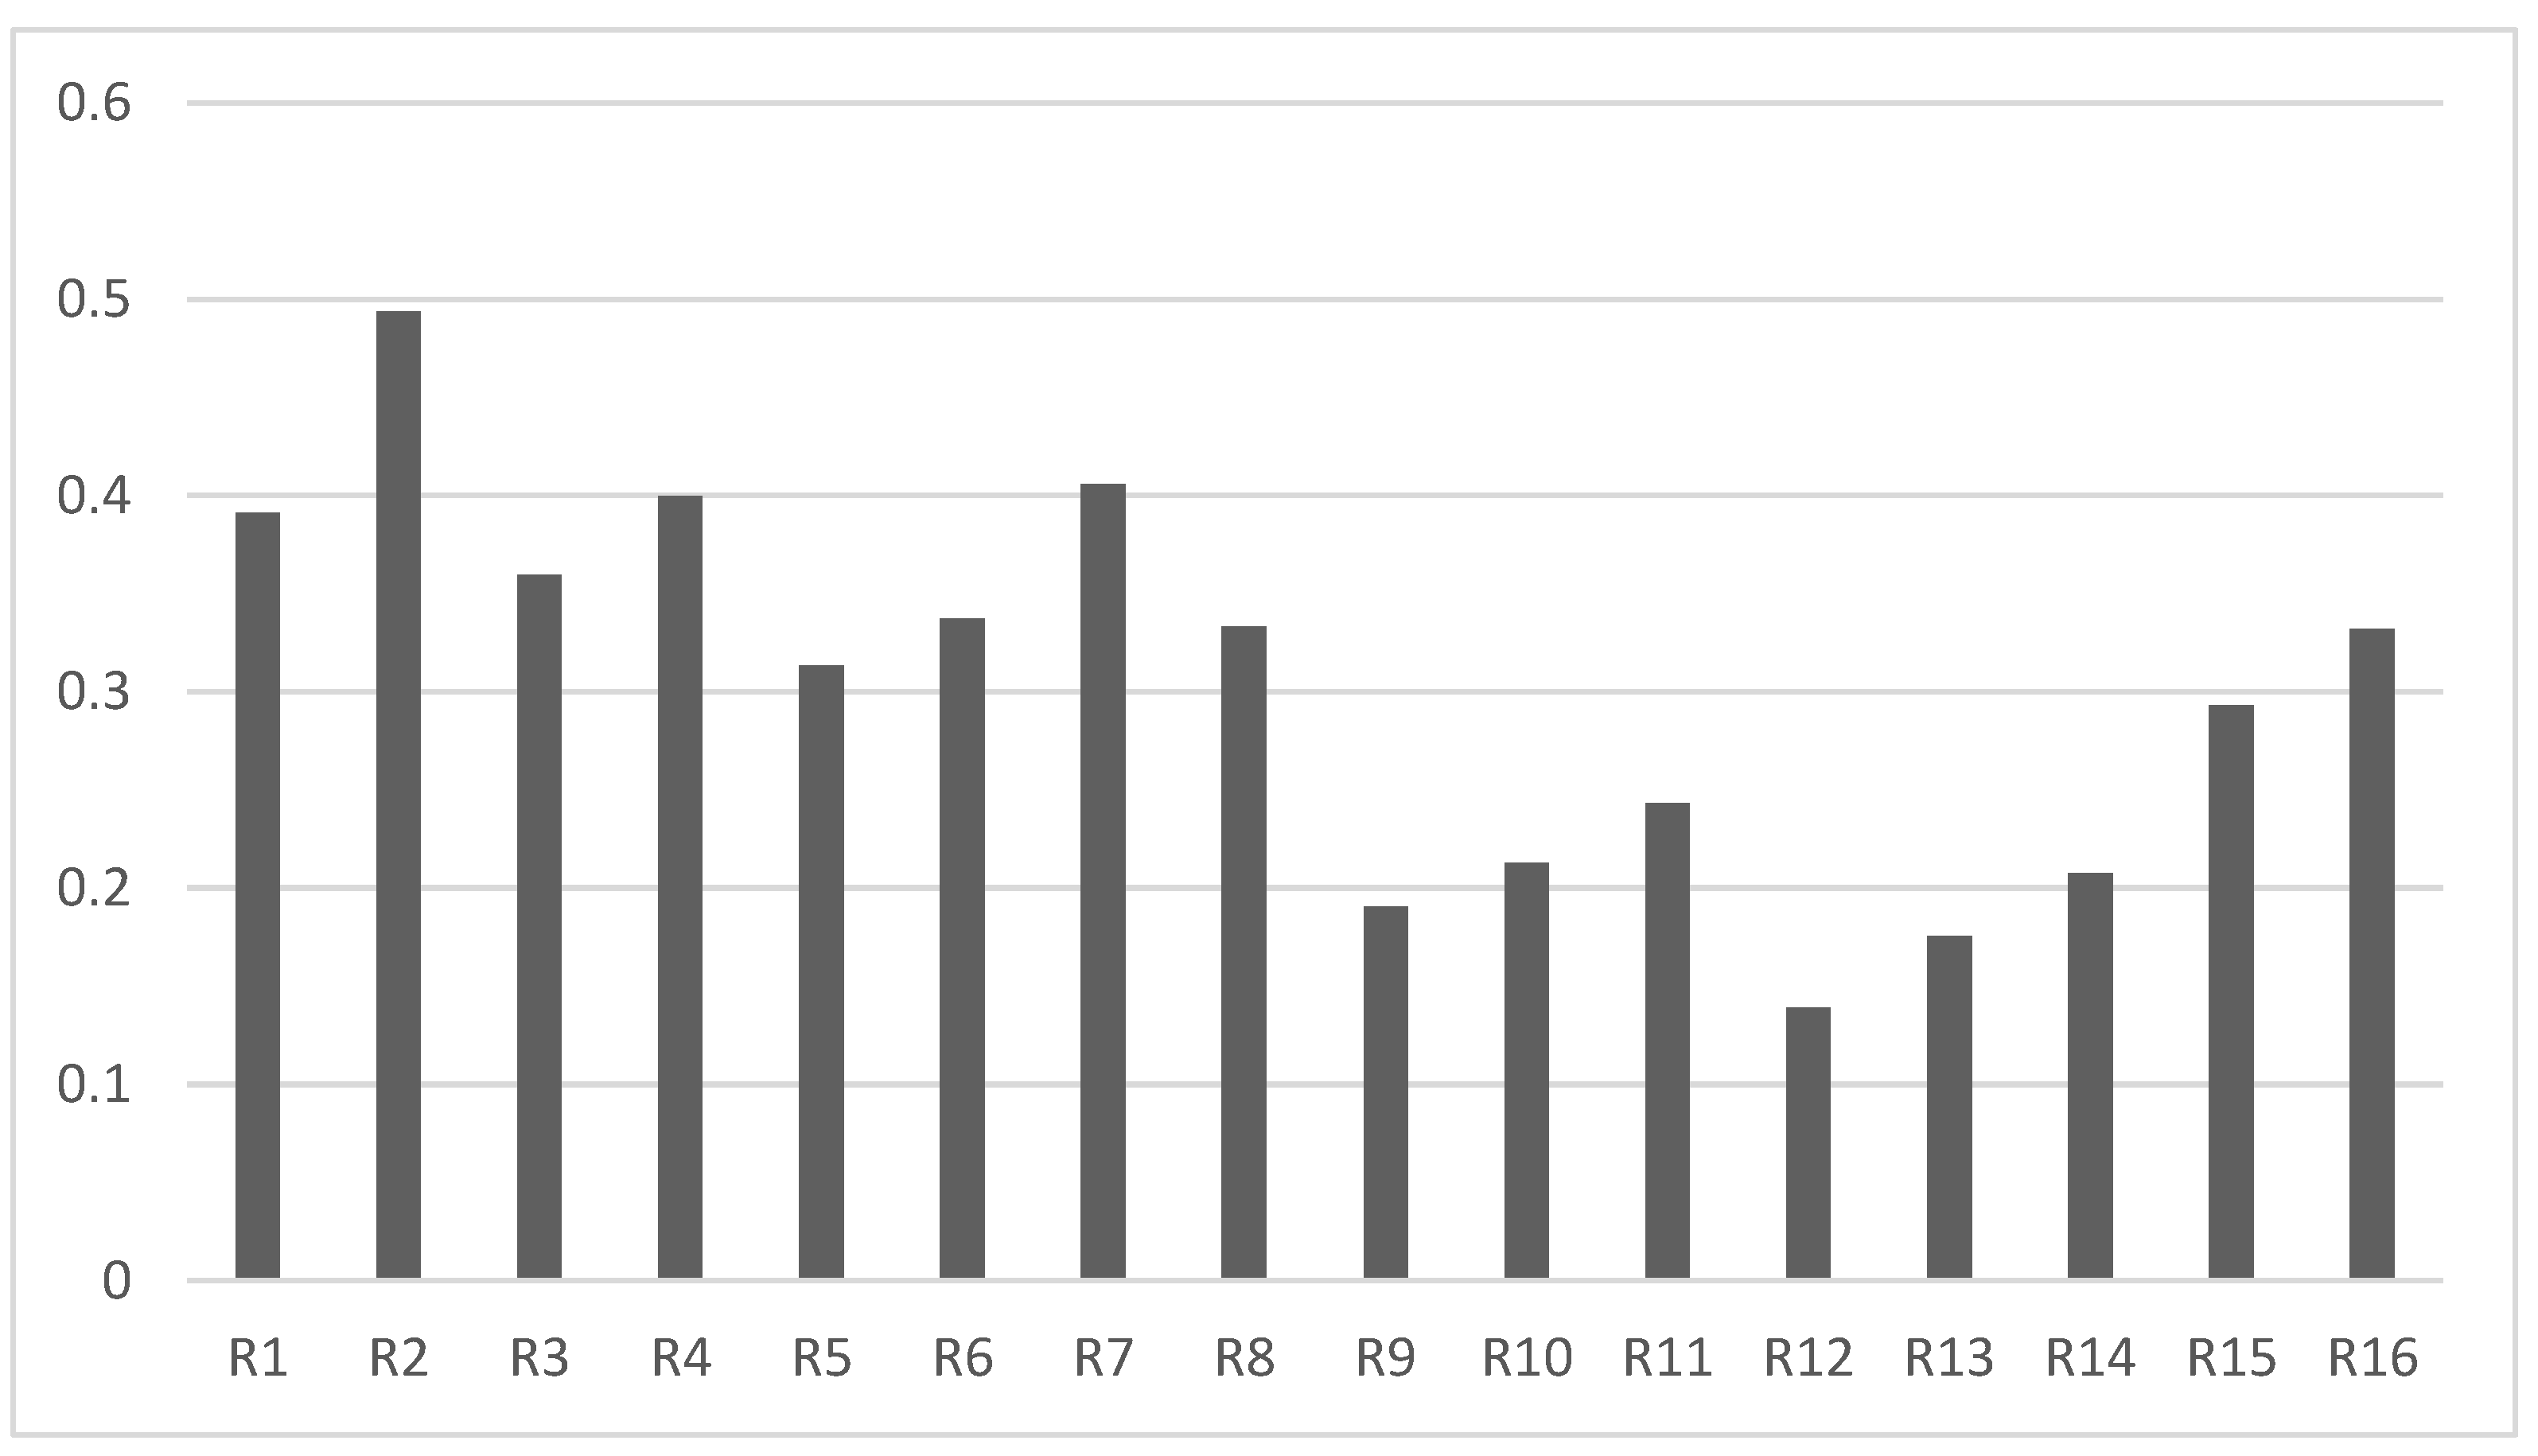
Table 3.
List of test instruments.
| Serial number | Parameters | Unit | Experimental apparatus | Instrument number | Measuring range | Error |
| 1 | Room temperature | ℃ | Temperature and humidity self-meter | HOBO MX2301A | -40 to 70°C (-40 to 158°F) | ±0.2 (0-70°C) |
| 2 | Indoor relative humidity | % | Temperature and humidity self-meter | HOBO MX2301A | 0-100%RH | ±2.5 (10-90% typical) |
| 3 | Dew point temperature | ℃ | Temperature and humidity self-meter | HOBO MX2301A | -40 to 70°C (-40 to 158°F) | ±0.2 (0-70°C) |
| 4 | Outdoor temperature | ℃ | Black Sphere Thermometer | JTR04 | 5°C - 120°C | ±0.5°C |
| 5 | Air flow rate | M/s | Digital Anemometer | TES1341 | 0.1 - 30.0 m/s | ±3% of reading ±1% of full scale value |
| 6 | Indoor CO2 levels | % | Nitrogen and oxygen detectors | WST-10C | 0-2000ppm | ±5% |
| 7 | Indoor Respirable Particulate Matter pm2.5 | Mg/m³ | Nitrogen and oxygen detectors | WST-10C | 0-999ug/m³ | ±5% |
| 8 | Negative Oxygen Ion | pcs-cm³ | Negative Oxygen Ion Tester (also known as Nitrogen Oxygen Detector) | WST-10C | 0-5 million/cm³ | ±5% |
Table 3.
Thermal comfort index in national and international standards.
| International standards | Category | Pmv |
| ASHRAE55[21] | 90% | -0.5 ≤ PMV ≤ +0.5 |
| 80% | -0.85 ≤ PMV ≤ +0.85 | |
| ISO 7730 [22] | I | -0.2 ≤ PMV ≤ +0.2 |
| II | -0.5 ≤ PMV ≤ +0.5 | |
| III | -0.7 ≤ PMV ≤ +0.7 | |
| EN15251[23] | I | -0.2 ≤ PMV ≤ +0.2 |
| II | -0.5 ≤ PMV ≤ +0.5 | |
| III | -0.7 ≤ PMV ≤ +0.7 | |
| IV | PMV<-0.7, PMV>+0.7 | |
| GB/T50785[20] | I | -0.5 ≤ PMV ≤ +0.5 |
| II | -1 ≤ PMV ≤ -0.5, +0.5 < PMV ≤ +1 | |
| III | PMV<-1, PMV>1 |
Table 4.
Indoor air quality indicators in national and international standards.
| China | WHO [26] | United StatesASHRAE [21] | Korea | |||
| PM2.5/(μg/m³) | 35, years Mean value [20] | 10, annual average | 15,8 h mean | _ | ||
| 75,24 h mean [20] | 25,24 h mean | |||||
| CO2/ppm | 1000[27] | _ | _ | 1000 | ||
| Negative oxygen ions/cm³ | I | 1200 [28], h mean | I | 0 to 500, h, [29] average values | - | - |
| II | 500-1200[28], h mean | II | 500 to 900,[29] h average values | |||
| III | 100-500 [28], h mean | III | 900 to 1200,[29] h mean | |||
| IV | 0-100[28], h mean | IV | 1200 to 1800,[29] h mean | |||
| V | 1800 to 2100, [29] h mean | |||||
| VI | ≥2100, h mean | |||||
Table 6.
Analysis of factors influencing the indoor air environment.
| Analysis of factors influencing indoor air environment | ||
| Category | Major environmental issues | Representative homes |
| 1. Poor thermal comfort | Low room temperature in autumn and winter with poor external wall insulation | r9, r10, r11, r14, r15, r16 |
| 2. Poor air quality | Poor indoor air quality and inefficient ventilation | r1, r2, r7, r13, r15 |
| 3. Poor overall indoor air environment quality | Poor thermal environment and air quality | R13, R15 |
Disclaimer/Publisher’s Note: The statements, opinions and data contained in all publications are solely those of the individual author(s) and contributor(s) and not of MDPI and/or the editor(s). MDPI and/or the editor(s) disclaim responsibility for any injury to people or property resulting from any ideas, methods, instructions or products referred to in the content. |
© 2025 by the authors. Licensee MDPI, Basel, Switzerland. This article is an open access article distributed under the terms and conditions of the Creative Commons Attribution (CC BY) license (http://creativecommons.org/licenses/by/4.0/).
Copyright: This open access article is published under a Creative Commons CC BY 4.0 license, which permit the free download, distribution, and reuse, provided that the author and preprint are cited in any reuse.


