
Submitted:
06 May 2025
Posted:
07 May 2025
You are already at the latest version
Abstract
Background/Objectives: Venous thromboembolism (VTE) and major hemorrhagic events are significant complications in hospitalized leukemia patients, but contemporary analyses of their epidemiology, predictors and impact on clinical outcomes remain limited.
Methods: We conducted a cross-sectional study using the National Inpatient Sample (NIS) database from 2016 to 2020. Hospitalized leukemia patients were identified using ICD-10 codes. Trends in the incidence of venous thromboembolism (VTE) and bleeding were assessed across the years, and multivariable logistic regression models were used to evaluate the predictors of VTE and bleeding. We assessed the influence thromboembolic and hemorrhagic complications on length of stay, cost, and mortality outcomes.
Results: Among 430,780 leukemia hospitalizations, the overall incidence of VTE was 5.4% and remained stable throughout the study period (p=0.09), while hemorrhagic events =5.6%) showed a significant upward trend (p=0.01). Cerebrovascular accidents, central venous catheter insertion, and protein calorie malnutrition (PCM) were significant predictors of both VTE and hemorrhage. PCM demonstrated a dose-dependent relationship with both complications. VTE was associated with a 33.5% increase in length of stay (LOS) and a 35% increase in cost of care (COC). Hemorrhage was associated with 23.2% increase in LOS and 32.6% increase in COC. Only hemorrhagic events were independently associated with increased mortality (adjusted OR 2.88, p<0.001).
Conclusions: The incidence of VTE in hospitalized leukemia patients has remained stable while hemorrhagic complications have increased significantly. Nutritional status represents a potentially modifiable risk factor for both VTE and bleeding complications. The competing risk between thrombosis and hemorrhage varies with age and nutritional status, suggesting the need for nuanced thromboprophylaxis strategies in this vulnerable population.
Keywords:
Venous thrombosis
; Major bleeding
; Leukemia
; Protein calories malnutrition
; Healthcare economics
1. Introduction
Venous thromboembolism (VTE), which includes deep vein thrombosis (DVT) and pulmonary embolism (PE), is a major complication in hospitalized patients. Malignancy represents a major risk factor for VTE due to increased endothelial injury from inflammatory cytokines, excess secretion of procoagulant factors, and dysregulated activation of the coagulation cascade. Individuals with acute leukemia are at particularly high risk of VTE due to marked hyperviscosity and leukocytosis. Between 5 and 15% of patients with leukemia will develop VTE, most often within the first year of diagnosis [1,2]. There are additional VTE risk factors that are unique to the inpatient hospital setting, including reduced mobility, repeat venipuncture, and placement of central venous catheters. The need for VTE prophylaxis therefore represents a priority for clinicians in the hospital environment.
Hemorrhagic complications represent an equally important concern in acute leukemia due to disease-related factors such as thrombocytopenia, platelet dysfunction, and coagulopathy. The risk for major bleeding is increased in the hospital setting due to medically necessary invasive procedures, chemotherapy-induced myelosuppression, and anticoagulation for VTE prophylaxis and management. The incidence of major hemorrhage among patients with acute leukemia ranges from 0.22 to 0.46 per 100 hospitalization [3]. Major bleeding events range from gastrointestinal bleeding to life-threatening intracranial hemorrhage, which significantly impact patient outcomes and resource utilization.
The complex interplay between anticoagulation and hemorrhagic complications presents a clinical challenge in patients with acute leukemia. Clinicians must carefully balance thromboprophylaxis and bleeding risk to prevent avoidable complications and optimize patient outcomes. Although VTE prevention and treatment strategies have evolved, a contemporary evaluation of VTE incidence, trends, and risk factors in hospitalized leukemia patients and the accompanying hemorrhagic complications remains limited. In this cross-sectional study, we use the National Inpatient Sample (NIS) database (2016 – 2020) to provide an updated analysis of VTE and bleeding event epidemiology and trends in hospitalized leukemia patients. The study further assesses association between thromboembolic and hemorrhagic complications and length of stay, cost of care, and inpatient mortality as secondary outcomes. The study examines trends and risk factors to inform clinical practice and guide thromboprophylaxis strategies in this vulnerable population.
2. Materials and Methods
2.1. Study Population and Data Elements
We extracted discharge encounters from the NIS from 2016 through 2020, using appropriate International Classification of Diseases, Tenth Revision, Clinical Modification (ICD-10-CM) codes for diagnoses and the International Classification of Diseases, Tenth Revision, Procedure Coding System (ICD-10-PCS codes) for inpatient procedures to create the cohort of interest for this study [4]. ICD-10-CM codes and ICD-10-PCS codes used for the study have been previously described [5]. We defined major hemorrhagic events as a composite of intracranial hemorrhage, pulmonary hemorrhage or gastrointestinal bleeding. The NIS is the largest publicly available all-payer inpatient care survey database in the United States. It was developed for the Healthcare Cost and Utilization Project (HCUP); it is sponsored by the Agency for Healthcare Research and Quality (AHRQ) and systematically samples approximately 20% of all hospitalizations in the United States, covering over 97% of the nation [4].
2.2. Statistical Analyses
Continuous data were summarized as median with interquartile range or mean with standard deviation, where applicable, and categorical variables as counts expressed as a percentage of the study sample. We compared the distribution of baseline characteristics and outcomes between patients who had VTE and bleeding and those who did not, using the Chi-squared test for categorical variables and the Wilcoxon Rank Sum test for equality of the means for continuous variables. We used logistic regression to model trends in VTE and bleeding across years (as a continuous variable) and assessed trend significance by the Jonckheere–Terpstra test for trend. In post hoc analyses, we then used marginal effects to generate predicted probabilities of VTE and bleeding by age across defined classes of malnutrition. We then used multinomial logistic regression to assess the competing risk of VTE and hemorrhage for each malnutrition class. To assess the predictors of VTE and hemorrhagic complications, we performed univariate logistic regression analysis, using patient and hospital level characteristics and included covariates with statistical significance and/or those deemed to have clinical significance in a base multivariable model of the odds of the outcomes. We selected the most parsimonious model using manual stepwise elimination of covariates and ensured model fitness with appropriate post-estimation tests. We applied a similar approach to assess the predictors of length of stay, cost of care and all-cause inpatient mortality. Encounters with age less than 18 years old and observations with missing data for age, sex, and race were excluded from the analyses. To account for the complex nature of the NIS survey database, appropriate survey weights were applied where appropriate as recommended by the HCUP. All analyses were performed at a two-tailed 5% level of significance using Stata version 18.0 (Stata Corporation, College Station, TX, USA).
3. Results
3.1. Baseline Characteristics and Primary Outcomes
There were 86,202 (430,780 when survey-weighted) patient encounters involving leukemia representing 0.3% of the NIS sample in the study. Table 1 summarizes the baseline characteristics of subject who experienced venous thromboembolism (VTE) and those who experienced hemorrhagic events compared to those who did not. There were 23,205 encounters involving VTE in the study period, representing 5.4% of the survey-weighted sample. There were no differences in the distribution of VTE among males and females (p=0.81). The median age of encounters with VTE was significantly lower than those who did not: median age (interquartile rage, IQR): 60 (44 – 69 years) vs 61 (44 – 71 years), p <0.001 by the Kruskal-Wallis equality of populations rank test. This difference is more obvious among patients in the 60 – 69-year groups and those 80 years or older. There were no differences in income distribution (p=0.31) and insurance status differences were minimal. Analysis of hospital-level characteristics showed that a significantly higher proportion of VTE occurred in large-sized hospitals (72.9% vs 69.1%, p<0.001), and was more common in those in urban teaching hospitals (92.5% vs 88.3%, p<0.001). Comorbid conditions that showed significant associations with VTE occurrence included atrial fibrillation (6.9% vs 5.9%), CVA (2.6% vs 1%), heart failure (14.4% vs 13.1%), and obstructive sleep apnea (7.5% vs 6.5%). Protein calorie malnutrition (PCM) and obesity showed a dose-dependent association where there were significantly more VTE events in the more severe disease state.
There were 24,300 encounters with discharge codes for major hemorrhagic events, representing 5.6% of the survey-weighted sample. There were no significant differences in the distribution of sex between those who had bleeding and those who did not (p=0.39) (Table 1). There were significantly more bleeding episodes in the older age groups (p<0.001) from 60 years at ten-year increments. Subjects who experienced bleeding were significantly older than those who did not: Median age, years (IQR) 60 (43 – 71) vs 65 (52 – 74), p<0.001. Income level did not affect the distribution of bleeding episodes. However, significantly more patients had bleeding events among Medicare patients (50.9% vs 41.9%, p<0.001). Hospital-level characteristics did not influence the incidence of bleeding, i.e. p>0.05 for bed size, location and hospital teaching status. Among comorbid conditions, atrial fibrillation (7.3% vs 5.9%), COPD (15.4% vs 14.1%), CVA (3.5% vs 0.9%), heart failure (16.9% vs 13%), hypertension (25.3% vs 21.3%), renal disease (13.7% vs 11.7% any degree of protein calorie malnutrition was associated with higher incidence of bleeding, p<0.05. The relationship between weight and bleeding is less linear compared to VTE.
We identified and analyzed several acute inpatient clinical events and procedures that potentially influence the occurrence of VTEs or hemorrhagic complications and summarized their distribution in Table 2. Patients who developed VTE showed significantly higher rates of central venous catheter (CVC) insertion (33.4% vs 18.1%, p<0.001) and CVC infection (5.3% vs 2.5%, p<0.001). While CVC insertion was associated with significantly higher rates of major hemorrhage (27.3% vs 18.5%, p<0.001), CVC infection rates did not differ by hemorrhage status. Predictably, thrombocytopenia was more common in those who had major bleeding episodes (31.8% vs 22.9%, p<0.001). Acute kidney injury, acute liver injury, invasive mechanical ventilation, sepsis, and septic shock were significantly associated with higher VTE and bleeding rates (Table 2). Receiving chemotherapy or immunotherapy was associated with significantly lower rates of VTE and hemorrhage.
3.2. Acute Inpatient Events and Secondary Outcomes
The event rates for the secondary outcomes and acute inpatient events of importance to this study are summarized in Table 2. Patients who developed VTE had significantly longer hospital stays with a median of 11.5 days (interquartile rage: 5 – 27 days) compared to 5 days (IQR: 3 – 13 days) for those without VTE (p<0.001). Similarly, patients who had hemorrhagic complications had extended hospital stays with a median of 10 days (IQR: 4 – 26 days) versus 5 days (IQR: 3 – 13 days) for those without bleeding events (p<0.001). Cost of care rounded to the nearest US dollar, was significantly higher among those with VTE or bleeding complications. Those who had VTE were charged approximately 2.2 times more compared to those without VTE, $46,872 (IQR: $16,473 – $125,724), p<0.001. Subject with hemorrhagic complication were billed twice as much as those without major bleeding episodes $43,663 (IQR: $15,287 – $126,279), p<0.001. The cost of care represents the total charge for the care received in the hospital and not necessarily how much the patient paid for that care. It was adjusted for variations across hospitals and clinical conditions using conversion factors provided by the HCUP. All-cause inpatient mortality rate was higher in those with thromboembolic and bleeding complications. The overall mortality rate for encounters with acute leukemia was 7.1%. From Table 2, the excess mortality with VTE was calculated as 3.3% and the proportion of total mortality attributable to VTE was 2.5%. Similarly, for those with hemorrhagic complications, the excess mortality with bleeding was 17.9%, with 14.1% of the total mortality attributable to bleeding complications.
3.3. Trends in VTE and Hemorrhagic Complications
Figure 1 shows the year-to-year rate of VTE and bleeding events among leukemia patients in the study sample. The overall incidence of VTE was 5.4% and remained relatively stable over the 5-year period, with an absolute increase of 0.46 percentage points from 5.2% in 2016 to 5.6% in 2020. While there were small fluctuations in VTE rates between years, the Jonckheere–Terpstra test for trend returned a p-value of 0.09, indicating a lack of statistically significant linear trend over the 5-year period. Deep vein thrombosis occurred more frequently than pulmonary embolism. The incidence of bleeding was 5.6%. Overall, bleeding events showed a slight upward trend, particularly from 2018 to 2019. The test for trend showed an increasing linear trend in hemorrhagic complications from 2016 to 2020, p=0.01. Gastrointestinal bleeding was the most common hemorrhagic complication, with an overall rate of 3.7%, which remained stable despite the slight uptick in rates from 2018 to 2019. Interestingly, despite being a less common bleeding complication with an overall incidence of 1.7%, intracranial hemorrhage showed a significant upward linear trend over time, p=0.01. Thus, the increase in overall bleeding rates from 5.4% to 5.9% was primary driven by increases in intracranial hemorrhage. Pulmonary hemorrhage remained the least common event with an insignificant linear trend.
3.4. Predictors of VTE and Hemorrhagic Complications
Figure 2 displays the result of a multivariate analysis of VTE predictors in acute leukemia patients. Cerebrovascular accident had the highest odds of VTE (adjusted odds ratio, OR 2.32, 95% Confidence Interval (CI) 1.74 – 3.09, p<0.001); followed by central venous catheter insertion (OR 2.07, 95% CI 1.87 – 2.29, p<0.001), likely reflecting a shared pathophysiological mechanism of vascular injury and hypercoagulability. Protein calorie malnutrition shows a stepwise gradient of increasing risk, with odds ratios escalating from mild (OR 1.08, non-significant) to moderate (OR 1.28, 95% CI 1.06 – 1.54, p=0.01) to severe protein calorie malnutrition (OR 1.37, 95% CI 1.18 – 1.59, p<0.001), suggesting a linear relationship between malnutrition and thromboembolic tendencies. Odds for VTE were higher at urban teaching hospitals.
Analysis of the risk factors for hemorrhagic events among acute leukemia patients reveals several significant predictors. Figure 3 is a forest plot showing the relative strengths of the Cerebrovascular accident demonstrates the strongest association with major bleeding (OR) 3.17, 95% CI 2.49 – 4.04, p<0.001). Followed by invasive mechanical ventilation (OR 2.60, 95% CI 2.18 – 3.10, p<0.001). Central venous catheter insertion is associated with significantly higher odds of bleeding (OR 1.49, 95% CI 1.34 – 1.65, p<0.001). Protein calorie malnutrition (PCM) exhibits a striking dose-response relationship with bleeding risk, where severe PCM (OR 1.80, 95% CI 1.58 – 2.05) and moderate PCM (OR 1.50, 95% CI 1.26 – 1.78) have substantially increased bleeding risk while mild PCM shows no significant association. On the other hand, excess calories expressed as obesity classes by BMI show a non-linear, complex relationship between body mass and major bleeding events in leukemia patients: class 2 obesity shows a protective effect (OR 0.61, 95% CI 0.42 – 0.87, p=0.01), while the other obesity BMI categories lack significant associations. Urban teaching hospitals demonstrate significantly higher hemorrhage rates (OR 1.64, 95% CI 1.19 – 2.27, p=0.01) compared to non-teaching facilities possibly reflecting more case complexity.
3.5. The Influence of Malnutrition on VTE and Hemorrhagic Risks
To further explore the complex relationship between age, malnutrition status and the primary outcomes, we conducted post hoc margins analysis to estimate predicted probabilities across patient subgroups while holding other covariates at their mean values. Figure 4 shows margins plot of the relationship. The top panel shows predicted probability of VTE by age across different protein calorie malnutrition (PCM) categories. VTE probability modestly decreases with advancing age across all malnutrition status categories, in contrast to findings in the general population where thrombotic risk increases with age. The nutritional gradient remains consistent throughout the age spectrum, with severe PCM maintaining approximately 40% higher VTE risk (~7%) compared to well-nourished patients (~5%). Moderate PCM demonstrates an intermediate risk profile, supporting the dose-dependent relationship between malnutrition and thromboembolic tendencies.
The bottom panel demonstrates predicted probability of hemorrhagic events by age for all PCM classifications. In contrast to VTE, bleeding risk increases substantially with age across all PCM categories. Increasing age consistently elevated bleeding risk across all PCM categories from age 20 to 90, and worsening malnutrition progressively increases risk, with severe PCM showing substantially higher probability of hemorrhage than those without PCM across all age groups. Elderly subjects (≥ 80 years) with severe PCM face hemorrhagic risks of more than 12%, which is nearly threefold increase compared to young, well-nourished patients (~4%). This gradient remains consistent across the age spectrum, with malnutrition severity consistently stratifying risk.
3.6. Influence of Malnutrition on the Risk for VTE and/or Major Bleeding
We employed multinomial logistic regression methods to address the competing risk for VTE and hemorrhage in hospitalized acute leukemia patients with a focus on the role of malnutrition. Table 3 shows the nuanced relationship between malnutrition severity and thrombo-hemorrhagic complications in our patient group. Both VTE and hemorrhagic risks progressively increase with worsening malnutrition status and the association is more robust in severe disease as evidenced by the trend from non-significant relationships in mild PCM to very strong statistical significance in severe PCM. Hemorrhagic events have a stronger association with malnutrition than thromboembolic events, with severe PCM having an increased risk of hemorrhage only by 78% (RRR 1.73, 95% CI 1.50 – 1.99, p<0.001) compared to a 28% increase in VTE-only risk (RRR 1.28, 95% CI 1.08 – 1.51, p<0.001). There is a substantial increase in risk for both complications simultaneously among subjects with more serious malnutrition status: severe PCM nearly triples the risk (RRR 2.88) while moderate PCM doubles the risk (RRR 2.00). There appears to be a threshold effect of malnutrition as mild PCM shows no statistically significant associations with any outcome category. Thus, the deleterious effect of malnutrition is only apparent in moderate-to-severe stages of malnutrition.
3.7. Predictors of Length of Stay and Cost of Care
Both thromboembolic and hemorrhagic events were associated with increased length of stay (LOS) and cost of care (COC). In both instances, subjects had at least twice as long median hospital stays, and they were billed at least twice as much compared to those without thrombo-hemorrhagic complications. Figure 5 summarizes the influence of covariables on LOS and COC. In multivariable linear regression analysis, VTE was associated with a 33.5% increased LOS and 35% increased COC (Coefficient, 0.33, 95% CI: 0.29 – 0.38) and (Coeff, 0.35, 95% CI: 0.29 – 0.41, p <0.001) respectively. Bleeding was associated with a 23.2% increase in LOS (Coeff, 0.23, 95% CI: 0.18 – 0.28, p <0.001) and a 32.6% increased COC (Coeff, 0.32, 95% CI: 0.26 – 0.39, p <0.001). Insertion of central venous catheters has the highest impact on both LOS and COC, with more than 0.8 log unit increase in both parameters: Coeff 0.91 (0.86 – 0.96, p<0.001) and Coeff 0.84 (0.81 – 0.87, p<0.001) respectively. This intervention was also associated with increased odds of VTE and hemorrhage. Acute kidney injury, which was also associated with increased odds of VTE, and hemorrhage show significant association with increased LOS and COC.
3.8. Predictors of Inpatient Mortality
Invasive mechanical ventilation showed the strongest association with all-cause inpatient mortality (aOR 10.26, 95% CI: 8.42 – 12.51), which is a 10-fold increased risk of death. The adjusted odd for VTE and hemorrhage were 1.05 (a modest increase) and 2.88 respectively. However, the aOR for VTE did not reach statistical significance (p=0.66). From Figure 6, other significant risk factors for mortality includes sepsis and septic shock (2.29, 2.00 – 2.26 and 3.44, 2.90 – 4.08, respectively), Acute kidney injury (2.58, 2.28 – 2.88) and acute liver injury (2.16, 1.65 – 2.83), as well as cerebrovascular accidents (2.51, 1.81–3.50). Patients with severe protein calorie malnutrition have significantly higher odds of mortality (1.11, 1.33 – 1.59). Patients who are healthy enough to receive chemo/immune therapy had significantly lower odds of death (aOR 0.41, 0.34 – 2.61). Obesity appears to have a protective effect as those with class 1 and class 2 obesity had significantly lower adjusted odds of death compared to those without obesity (aOR 0.55 and 0.57, respectively).
4. Discussion
Individuals with acute leukemia face a high risk of both VTE and hemorrhagic complications, which are heighted in the inpatient setting secondary to decreased mobility, administration of induction chemotherapy, and medically necessary invasive procedures. The existing prophylaxis strategies have been moderately effective in preventing VTE among hospitalized patients. However, little progress has been made in VTE prevention over the past several decades. In an analysis of California Cancer Registry data collected between 1993 and 1999, the two-year cumulative incidence of VTE among patients with acute leukemia was 5.2% [6]. A subsequent study of NIS data collected between 2011 and 2015 showed little improvement; the VTE rate among patients hospitalized with acute leukemia ranged between 6.0 and 6.6% [7]. A more recent meta-analysis and systematic reviews described similar findings [1]. In our analysis, the overall incidence of VTE ranged from 5.2% to 5.6% with no significant change over the course of the five-year study period.
There have been remarkable advancements in hematology and oncology over the past thirty years. Imatinib was developed for the treatment of chronic myeloid leukemia in the late 1990s [8]. The first immune-checkpoint inhibitors were introduced just over a decade later in 2011 [9]. Chimeric antigen receptor T cell (CAR-T) therapy was recently approved by the Food and Drug Administration and is now widely used at community and academic centers across the country [10]. However, during this period of unprecedented medical progress and biomedical innovation, the incidence of VTE failed to improve. There is a strong association between VTE and cost of care, length of stay, and mortality [11]. The effect of VTE on mortality is particularly pronounced among patients with an underlying malignancy [12]. The development of new strategies to reduce the rate of VTE therefore has the potential to make a meaningful impact on clinical outcomes.
The risk of VTE and hemorrhage exists in a state of dynamic equilibrium; aggressive pharmacologic VTE prophylaxis is inextricably linked with an increased risk of bleeding. In our analysis, there was a small but significant upward trend in bleeding events over the course of the study period, with an overall increase in bleeding rates from 5.4% in 2016 to 5.9% in 2020. The approach to reducing VTE rates should therefore emphasize medical optimization and mitigation of modifiable risk factors rather than increased use of anticoagulants. In our analysis, there was a stepwise gradient of increasing risk associated with PCM and both VTE and hemorrhage. Rates of VTE in patients with mild, moderate, and severe PCM were 1.1%, 5.2%, and 9.6%, respectively. Rates of hemorrhage in patients with mild, moderate, and severe PCM were 1.3%, 6.1%, and 11.5%, respectively. PCM therefore appears to represent a promising target for intervention, potentially reducing both VTE and bleeding complications among hospitalized patients. Routine assessment of serum prealbumin on admission could be useful to identify patients at risk of PCM [13]. Revising coding and billing for PCM may improve reimbursement and incentivize aggressive interventions in the inpatient setting [14]. In addition, integrating registered dietitian nutritionists in the medical team and implementing order-writing privileges has been shown to improve patient nutrition status [15]. Nutritional supplementation and monitoring serum prealbumin and albumin could be performed at a low cost and significantly improve outcomes.
Other factors that influenced both VTE and bleeding risk to varying degrees included cerebrovascular accident, central venous catheter insertion, and invasive mechanical ventilation. A tool incorporating these factors to provide a semiquantitative analysis of relative risk would be useful to guide clinical decision-making. Although several algorithms have been developed to assess the risk of bleeding among patients on anticoagulation, including the VTE-BLEED score, there are no comprehensive risk stratification constructs that integrate multiple competing risk factors for both VTE and hemorrhage. The results of this analysis, among others, provide important foundational data that could be used to improve patient management.
The small but significant increase in hemorrhage in the setting of stable VTE rates suggests that routine inpatient VTE prophylaxis protocols should be revisited. It has been definitively established that low-molecular-weight heparin (LMWH) is more effective and associated with a decreased risk of bleeding complications relative to unfractionated heparin, and most hospital systems and healthcare networks now use LMWH as the standard anticoagulant agent in the inpatient setting [16,17,18]. However, emerging evidence indicates that direct oral anticoagulants (DOACs) may represent a suitable alternative to LMWH. In a 2014 meta-analysis by Castellucci et al., the authors reported that DOACs were associated with a lower bleeding risk as compared to LMWH among patients undergoing therapeutic anticoagulation for VTE [19]. A subsequent analysis by Kapoor et al. showed that DOACs may also be appropriate for VTE prophylaxis. The Kapoor group assessed the relative risk of VTE versus hemorrhage among patients requiring VTE prophylaxis following orthopedic surgery and found that DOACs had a significantly more favorable VTE-to-hemorrhage profile relative to LMWH [20]. In addition to a lower risk of bleeding, DOACs have been shown to be more efficacious and cost-effective than LMWH for the treatment of cancer-associated thrombosis [21,22]. Moreover, patients strongly prefer and demonstrate better adherence to DOACs as compared to LMWH [23]. Although some data suggest that DOACs may be associated with a slightly increased risk of non-major bleeding relative to LMWH [24], the preponderance of the evidence indicates that DOACs offer greater effectiveness than LMWH with a similar or lower risk of hemorrhage [25]. Future large-scale randomized-controlled trials comparing DOACs and LMWH would be of value to clarify the most appropriate inpatient pharmacologic VTE prophylaxis strategy. Novel factor XI(a) inhibitors also show a great deal of promise for VTE prophylaxis and warrant further investigation [26].
There are several limitations to this study inherent to its design. The study was retrospective and therefore causation could not be assessed. In addition, the NIS database does not include information pertaining to VTE prophylaxis; it cannot be determined if all hospitals included in the dataset used routine VTE prophylactic strategies. The relationship between obesity and bleeding outcomes in our sample was somewhat paradoxical with class 2 obesity demonstrating a significant protective effect. Previous data show that obesity increases bleeding risk among patients on VTE prophylaxis and it is conceivable that the protective effect observed in our analysis represented statistical noise[27]. Nevertheless, despite these limitations, the findings presented herein provide important information related to VTE and bleeding risk among patients hospitalized with leukemia. Future large-scale studies are warranted to develop risk stratification tools and determine optimal VTE prophylaxis strategies.
5. Conclusions
Our analysis reveals a complex interplay between thrombotic and hemorrhagic risks in hospitalized leukemia patients. While VTE rates remained stable from 2016 to 2020, hemorrhagic events increased significantly, especially intracranial hemorrhage. This study identifies protein calorie malnutrition as a critical modifiable risk factor with a dose-dependent association with both VTE and bleeding. We also identified a critical age-dependent shift in the thrombosis-hemorrhage balance: younger patients with malnutrition face higher VTE risks, while elderly malnourished patients demonstrate elevated hemorrhagic risk, suggesting the need for age-stratified thromboprophylaxis approaches. The findings from our study have immediate clinical implications, and we suggest that nutritional optimization may represent a cost-effective intervention to simultaneously reduce both VTE and bleeding complications in this vulnerable population. Further research focused on developing risk assessment tools should incorporate the competing thrombotic and hemorrhagic risks identified in this study, especially accounting for the role of nutrition and age.
Author Contributions
Conceptualization, D.A. and M.B.; methodology, D.A., V.N., and M.B.; formal analysis, D.A., V.N., and M.B.; investigation, D.A. and B.D.B.; resources, D.A. and B.D.B.; data curation, D.A. and B.D.B.; writing—original draft preparation, D.A. and B.D.B.; writing—review and editing, B.D.B., V.N., and M.B.; visualization, D.A.; supervision, M.B. All authors have read and agreed to the published version of the manuscript.
Funding
This research received no external funding.
Institutional Review Board Statement
Not applicable.
Informed Consent Statement
Not applicable.
Data Availability Statement
The raw data supporting the conclusions of this article will be made available by the authors on request.
Acknowledgments
None.
Conflicts of Interest
The authors declare no conflicts of interest.
Abbreviations
The following abbreviations are used in this manuscript:
| MDPI | Multidisciplinary Digital Publishing Institute |
| DOAJ | Directory of open access journals |
| HCUP | Healthcare Cost and Utilization Project |
| TLA | Three letter acronym |
| LD | Linear dichroism |
| DVT | Deep vein thrombosis |
| VTE | Venous thromboembolism |
| AHRQ | Agency for Healthcare Research and Quality |
| NIS | National Inpatient Sample |
| ICD-10-CM | International Classification of Diseases, Tenth Revision, Clinical Modification |
| ICD-10-PCS | International Classification of Diseases, Tenth Revision, Procedure Coding System |
References
- Y.-Y. Wu, L. Tang, and M.-H. Wang, “Leukemia and Risk of Venous Thromboembolism: A Meta-analysis and Systematic Review of 144 Studies Comprising 162,126 Patients,” Sci Rep, vol. 7, p. 1167, Apr. 2017. [CrossRef]
- F. Al-Ani, Y. P. Wang, and A. Lazo-Langner, “Development of a Clinical Prediction Rule for Venous Thromboembolism in Patients with Acute Leukemia,” Thromb Haemost, vol. 120, no. 2, pp. 322–328, Feb. 2020. [CrossRef]
- L. Kreuger et al., “The identification of cases of major hemorrhage during hospitalization in patients with acute leukemia using routinely recorded healthcare data,” PLOS ONE, vol. 13, no. 8, p. e0200655, Aug. 2018. [CrossRef]
- “HCUP-US NIS Overview.” Accessed: May 02, 2025. [Online]. Available: https://hcup-us.ahrq.gov/nisoverview.jsp.
- M. B. Ulanja et al., “Patient outcomes in myeloproliferative neoplasm-related thrombosis: Insights from the National Inpatient Sample,” Thrombosis Research, vol. 194, pp. 72–81, Oct. 2020. [CrossRef]
- G. H. Ku, R. H. White, H. K. Chew, D. J. Harvey, H. Zhou, and T. Wun, “Venous thromboembolism in patients with acute leukemia: incidence, risk factors, and effect on survival,” Blood, vol. 113, no. 17, pp. 3911–3917, Apr. 2009. [CrossRef]
- V. Bakalov, A. Tang, A. Yellala, R. Kaplan, J. Lister, and S. Sadashiv, “Risk factors for venous thromboembolism in hospitalized patients with hematological malignancy: an analysis of the National Inpatient Sample, 2011–2015,” Leukemia & Lymphoma, Jan. 2020, Accessed: May 02, 2025. [Online]. Available: https://www.tandfonline.com/doi/abs/10.1080/10428194.2019.1666380.
- D. B. Geffen and S. Man, “New Drugs for the Treatment of Cancer, 1990±200”.
- C. Robert, “A decade of immune-checkpoint inhibitors in cancer therapy,” Nat Commun, vol. 11, p. 3801, Jul. 2020. [CrossRef]
- Mitra, A. Barua, L. Huang, S. Ganguly, Q. Feng, and B. He, “From bench to bedside: the history and progress of CAR T cell therapy,” Front Immunol, vol. 14, p. 1188049, May 2023. [CrossRef]
- G. H. Lyman, E. Culakova, M. S. Poniewierski, and N. M. Kuderer, “Morbidity, mortality and costs associated with venous thromboembolism in hospitalized patients with cancer,” Thrombosis Research, vol. 164, pp. S112–S118, Apr. 2018. [CrossRef]
- G. Gussoni, S. Frasson, M. L. Regina, P. D. Micco, and M. Monreal, “Three-month mortality rate and clinical predictors in patients with venous thromboembolism and cancer. Findings from the RIETE registry,” Thrombosis Research, vol. 131, no. 1, pp. 24–30, Jan. 2013. [CrossRef]
- M. A. Potter and G. Luxton, “Prealbumin measurement as a screening tool for protein calorie malnutrition in emergency hospital admissions: a pilot study,” Clin Invest Med, vol. 22, no. 2, pp. 44–52, Apr. 1999.
- Doley and W. Phillips, “Coding for Malnutrition in the Hospital: Does It Change Reimbursement?,” Nutrition in Clinical Practice, vol. 34, no. 6, pp. 823–831, 2019. [CrossRef]
- B. D. Arney, S. A. Senter, A. C. Schwartz, T. Meily, and S. Pelekhaty, “Effect of Registered Dietitian Nutritionist Order-Writing Privileges on Enteral Nutrition Administration in Selected Intensive Care Units,” Nutrition in Clinical Practice, vol. 34, no. 6, pp. 899–905, 2019. [CrossRef]
- M. B. Rothberg, P. S. Pekow, M. Lahti, and P. K. Lindenauer, “Comparative effectiveness of low-molecular-weight heparin versus unfractionated heparin for thromboembolism prophylaxis for medical patients,” Journal of Hospital Medicine, vol. 7, no. 6, pp. 457–463, 2012. [CrossRef]
- B. N. Jacobs et al., “Unfractionated heparin versus low-molecular-weight heparin for venous thromboembolism prophylaxis in trauma,” J Trauma Acute Care Surg, vol. 83, no. 1, pp. 151–158, Jul. 2017. [CrossRef]
- S. Laporte et al., “Individual patient data meta-analysis of enoxaparin vs. unfractionated heparin for venous thromboembolism prevention in medical patients,” Journal of Thrombosis and Haemostasis, vol. 9, no. 3, pp. 464–472, Mar. 2011. [CrossRef]
- L. A. Castellucci et al., “Clinical and safety outcomes associated with treatment of acute venous thromboembolism: a systematic review and meta-analysis,” JAMA, vol. 312, no. 11, pp. 1122–1135, Sep. 2014. [CrossRef]
- Kapoor et al., “Comparative effectiveness of venous thromboembolism prophylaxis options for the patient undergoing total hip and knee replacement: a network meta-analysis,” Journal of Thrombosis and Haemostasis, vol. 15, no. 2, pp. 284–294, Feb. 2017. [CrossRef]
- N. D. Brunetti et al., “Direct oral anticoagulants more effective than low-molecular-weight heparin for venous thrombo-embolism in cancer: an updated meta-analysis of randomized trials,” J Thromb Thrombolysis, vol. 50, no. 2, pp. 305–310, Aug. 2020. [CrossRef]
- K. Wumaier, W. Li, N. Chen, and J. Cui, “Direct oral anticoagulants versus low molecular weight heparins for the treatment of cancer-associated thrombosis: a cost-effectiveness analysis,” Thromb J, vol. 19, p. 68, Sep. 2021. [CrossRef]
- T. Cohen et al., “Patient-reported outcomes associated with changing to rivaroxaban for the treatment of cancer-associated venous thromboembolism – The COSIMO study,” Thrombosis Research, vol. 206, pp. 1–4, Oct. 2021. [CrossRef]
- Li, D. A. Garcia, G. H. Lyman, and M. Carrier, “Direct oral anticoagulant (DOAC) versus low-molecular-weight heparin (LMWH) for treatment of cancer associated thrombosis (CAT): A systematic review and meta-analysis,” Thrombosis Research, vol. 173, pp. 158–163, Jan. 2019. [CrossRef]
- W. Kang et al., “Effectiveness and safety of continuous low-molecular-weight heparin versus switching to direct oral anticoagulants in cancer-associated venous thrombosis,” Nat Commun, vol. 15, p. 5657, Jul. 2024. [CrossRef]
- Jones and R. A. Al-Horani, “Venous Thromboembolism Prophylaxis in Major Orthopedic Surgeries and Factor XIa Inhibitors,” Med Sci (Basel), vol. 11, no. 3, p. 49, Aug. 2023. [CrossRef]
- Ogunsua, S. Touray, J. K. Lui, T. Ip, J. V. Escobar, and J. Gore, “Body mass index predicts major bleeding risks in patients on warfarin,” J Thromb Thrombolysis, vol. 40, no. 4, pp. 494–498. [CrossRef]
Figure 1.
Temporal trends in venous thromboembolism (VTE) and hemorrhagic complications among hospitalized acute leukemia patients, 2016 – 2020. VTE is a composite of deep vein thrombosis and/or pulmonary embolism. Bleeding comprises gastrointestinal (GI) bleeding, intracranial hemorrhage, and pulmonary hemorrhage.
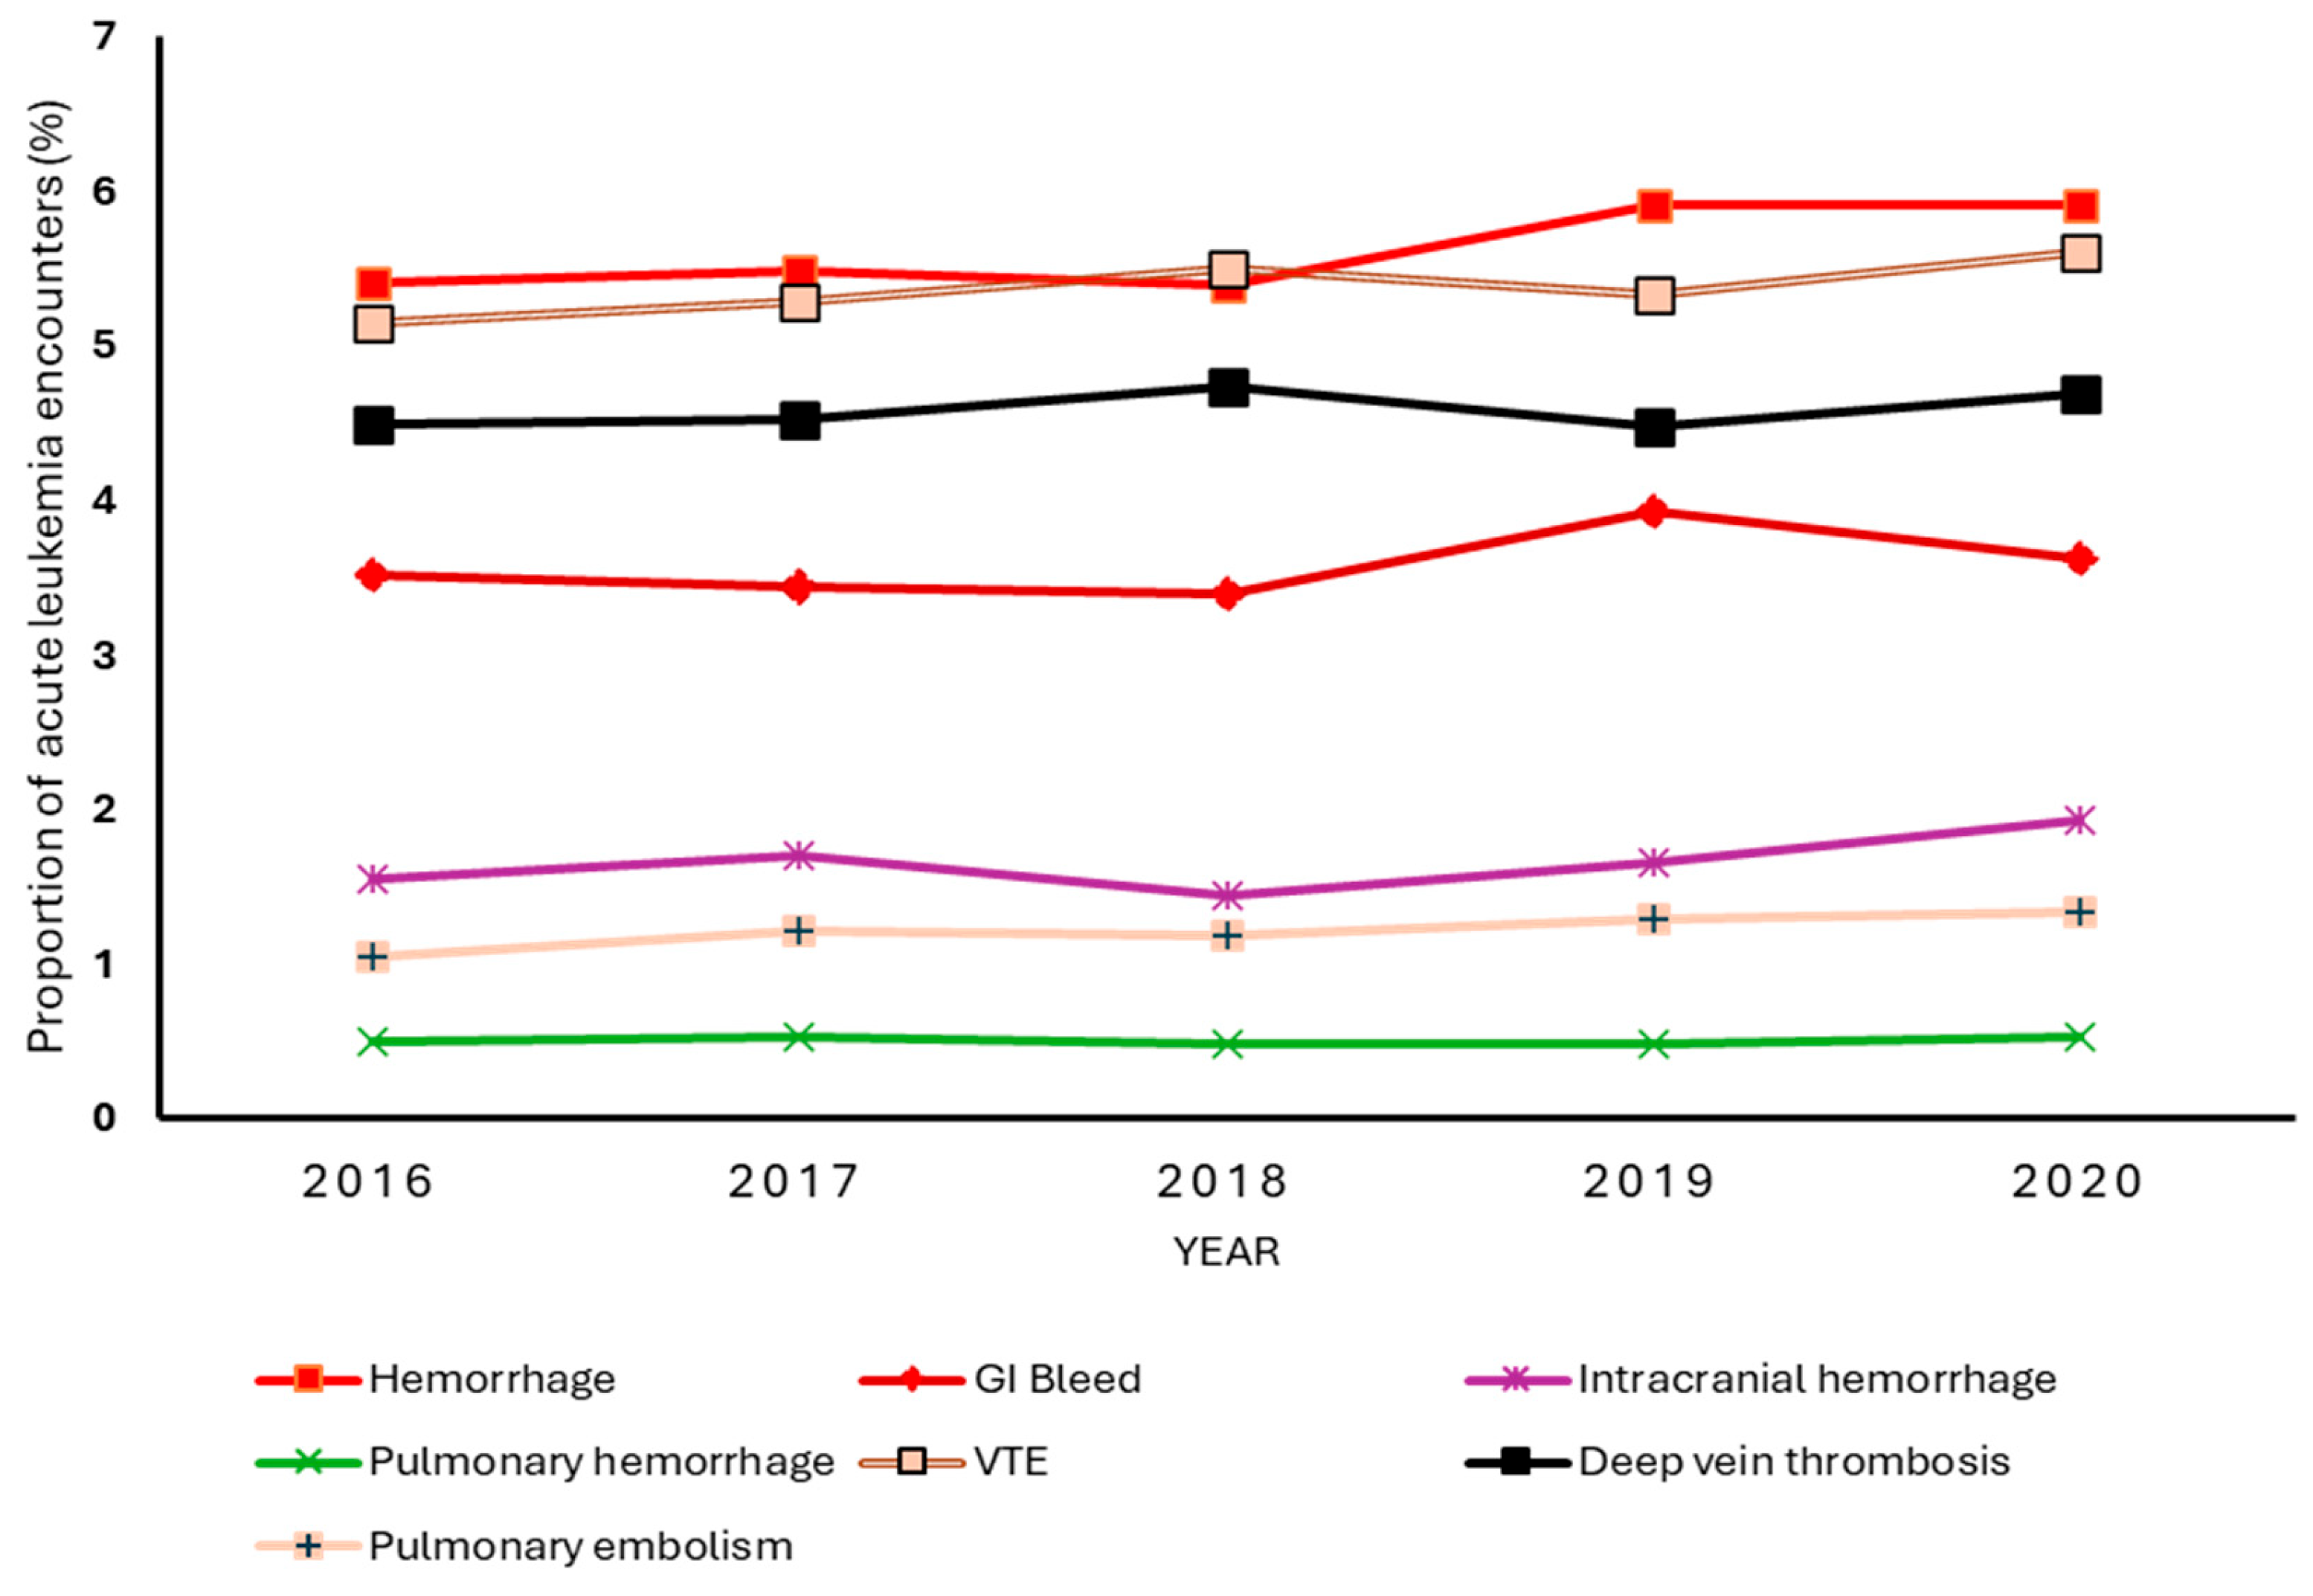
Figure 2.
Forest plot showing the adjusted odds ratio (95% confidence intervals) for venous thromboembolism for various predictor variables in the multi variable logistic regression model. Key: β = compared to males; § = compared to Medicare; ψ = compared to subjects with zip codes in the 0 – 25th percentile of US household income; £ = compared to small bed sized hospital; * = compared to northeastern region of the United States; φ = compared to normal BMI 18.5 – 24.5. Legend: COPD: chronic obstructive pulmonary disease apnea; CVA = cerebrovascular accident; BMI = body mass index.
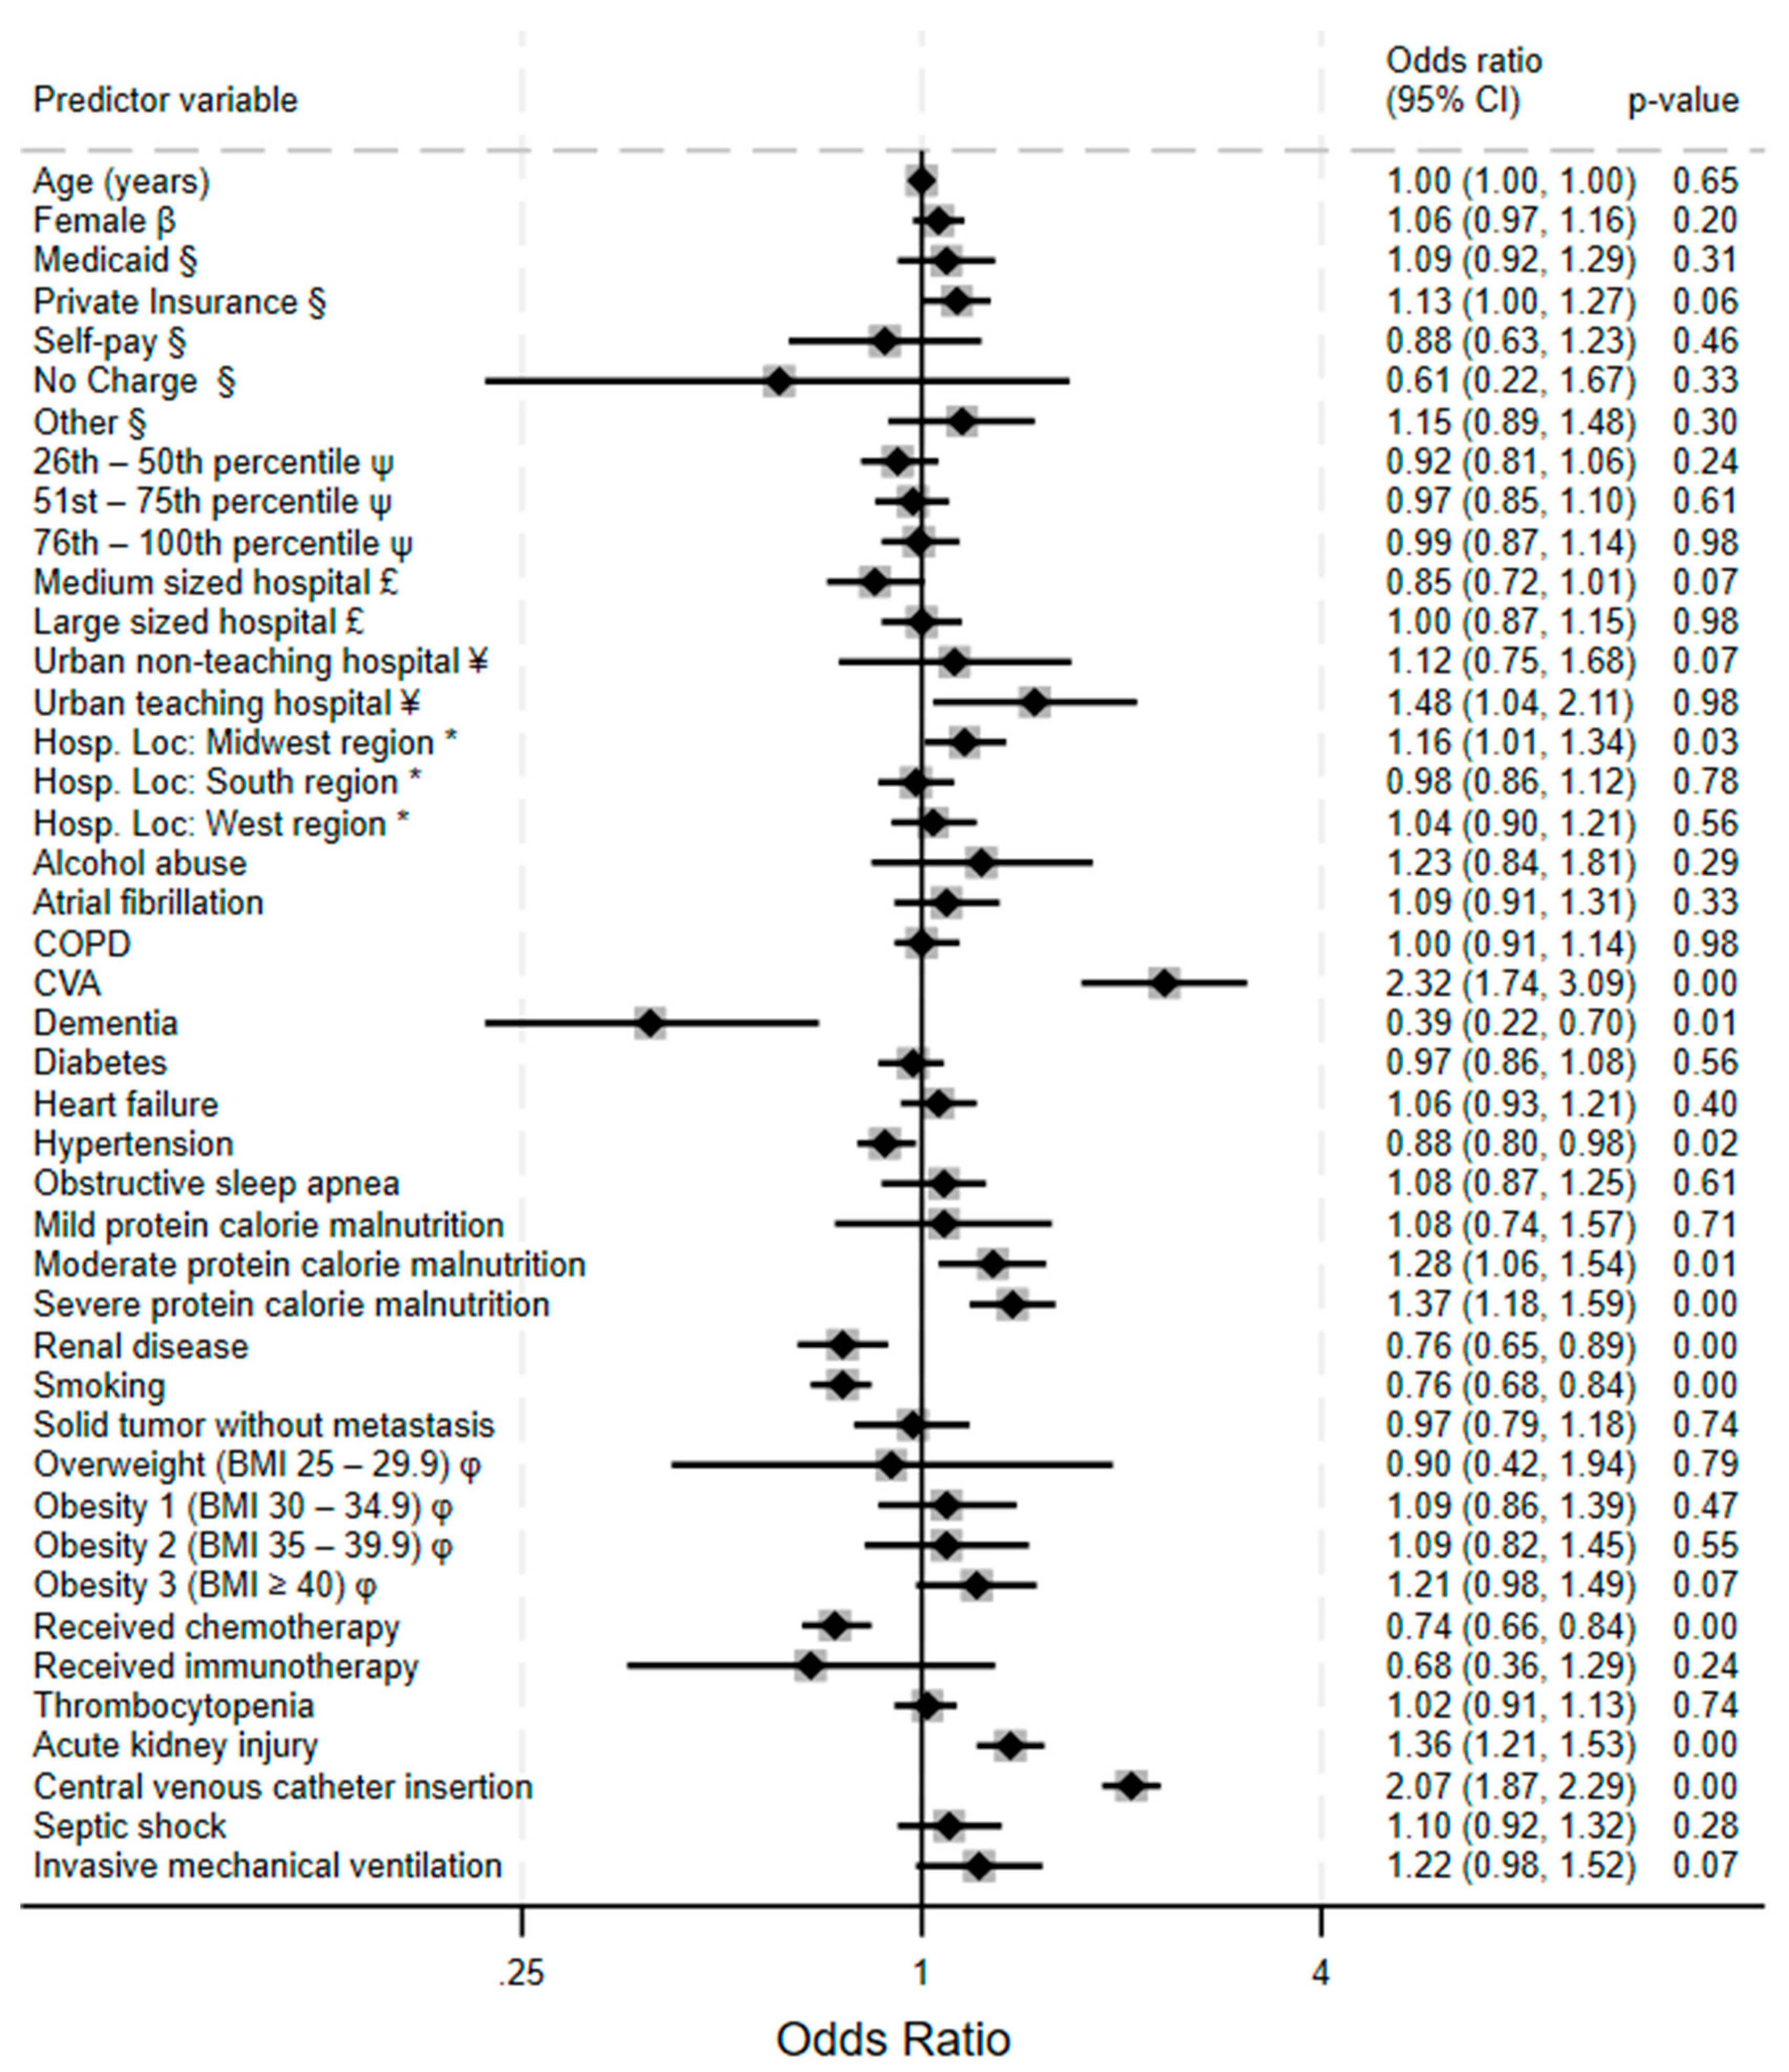
Figure 3.
Forest plot showing the adjusted odds ratio (95% confidence intervals) for hemorrhagic events for various predictor variables in the multi variable logistic regression model. Key: β = compared to males; § = compared to Medicare; ψ = compared to subjects with zip codes in the 0 – 25th percentile of US household income; £ = compared to small bed sized hospital; * = compared to northeastern region of the United States; φ = compared to normal BMI 18.5 – 24.5. Legend: COPD: chronic obstructive pulmonary disease apnea; CVA = cerebrovascular accident; BMI = body mass index.
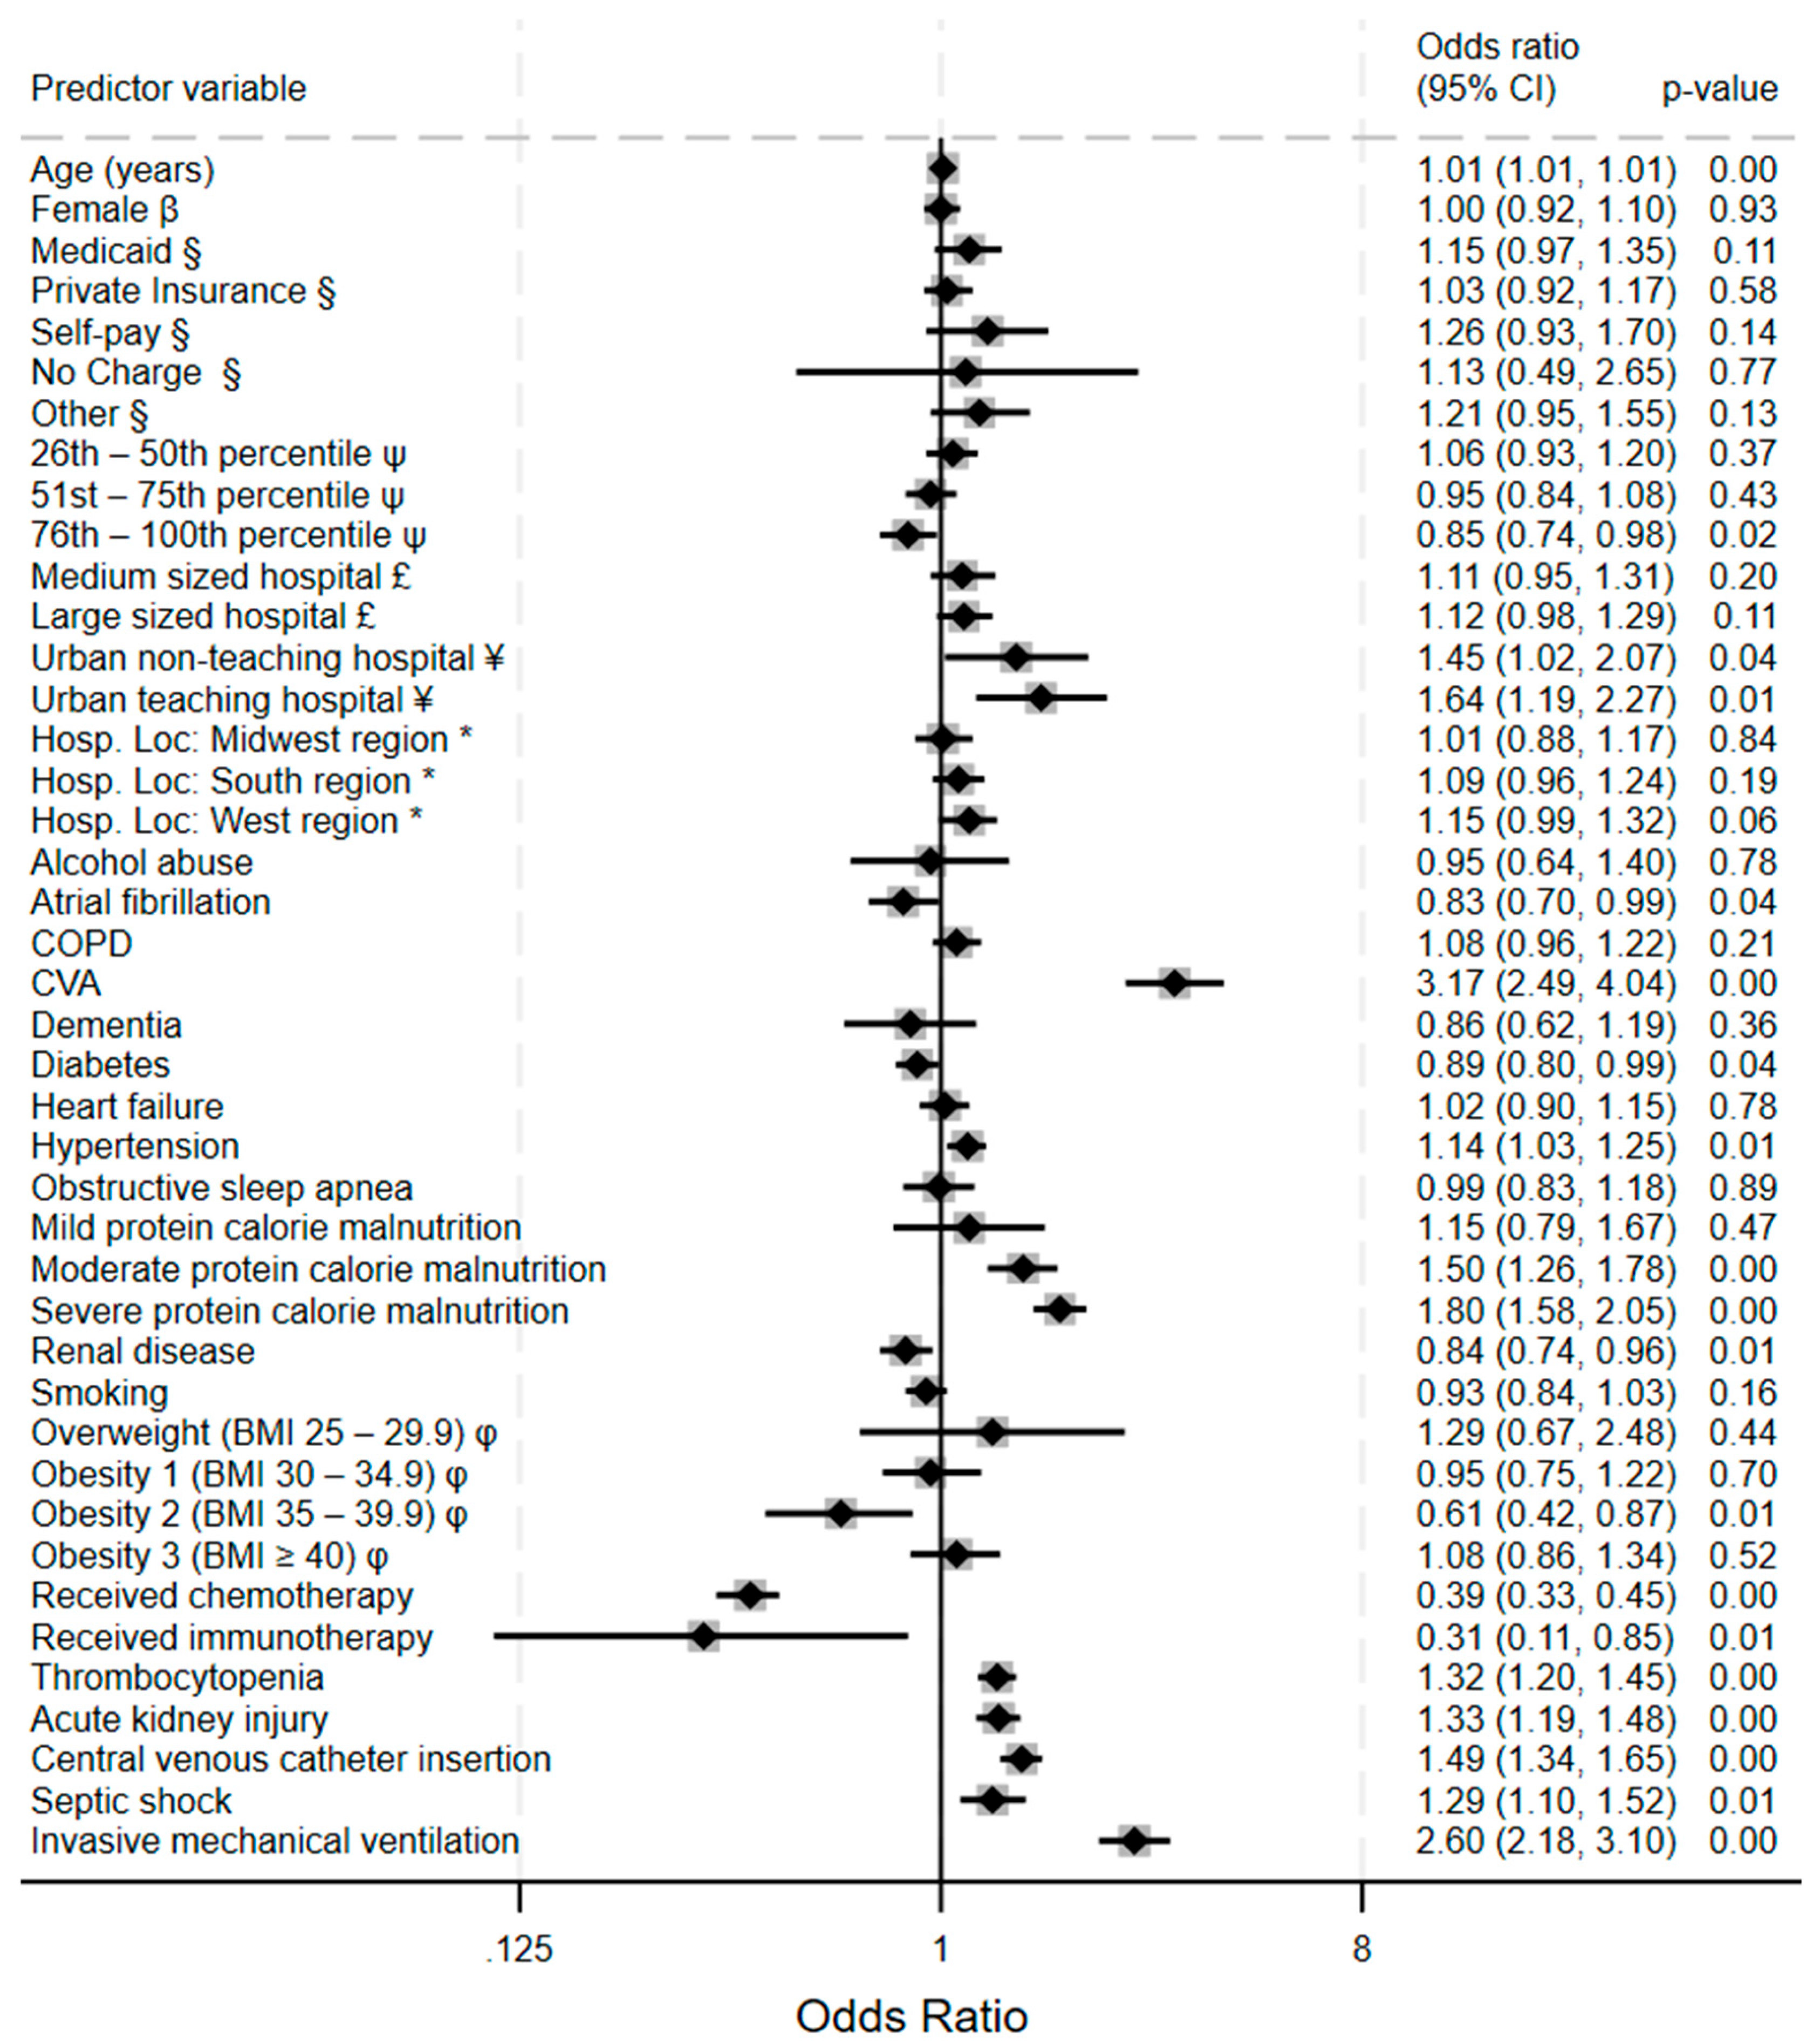
Figure 4.
Predicted probabilities of venous thromboembolism (top panel) and hemorrhagic events (bottom panel) by age and protein calorie malnutrition (PCM) status in hospitalized acute leukemia patients. Predictions are derived from multivariable logistic regression model adjusted for the covariates. Error bars represent 9% confidence interval.
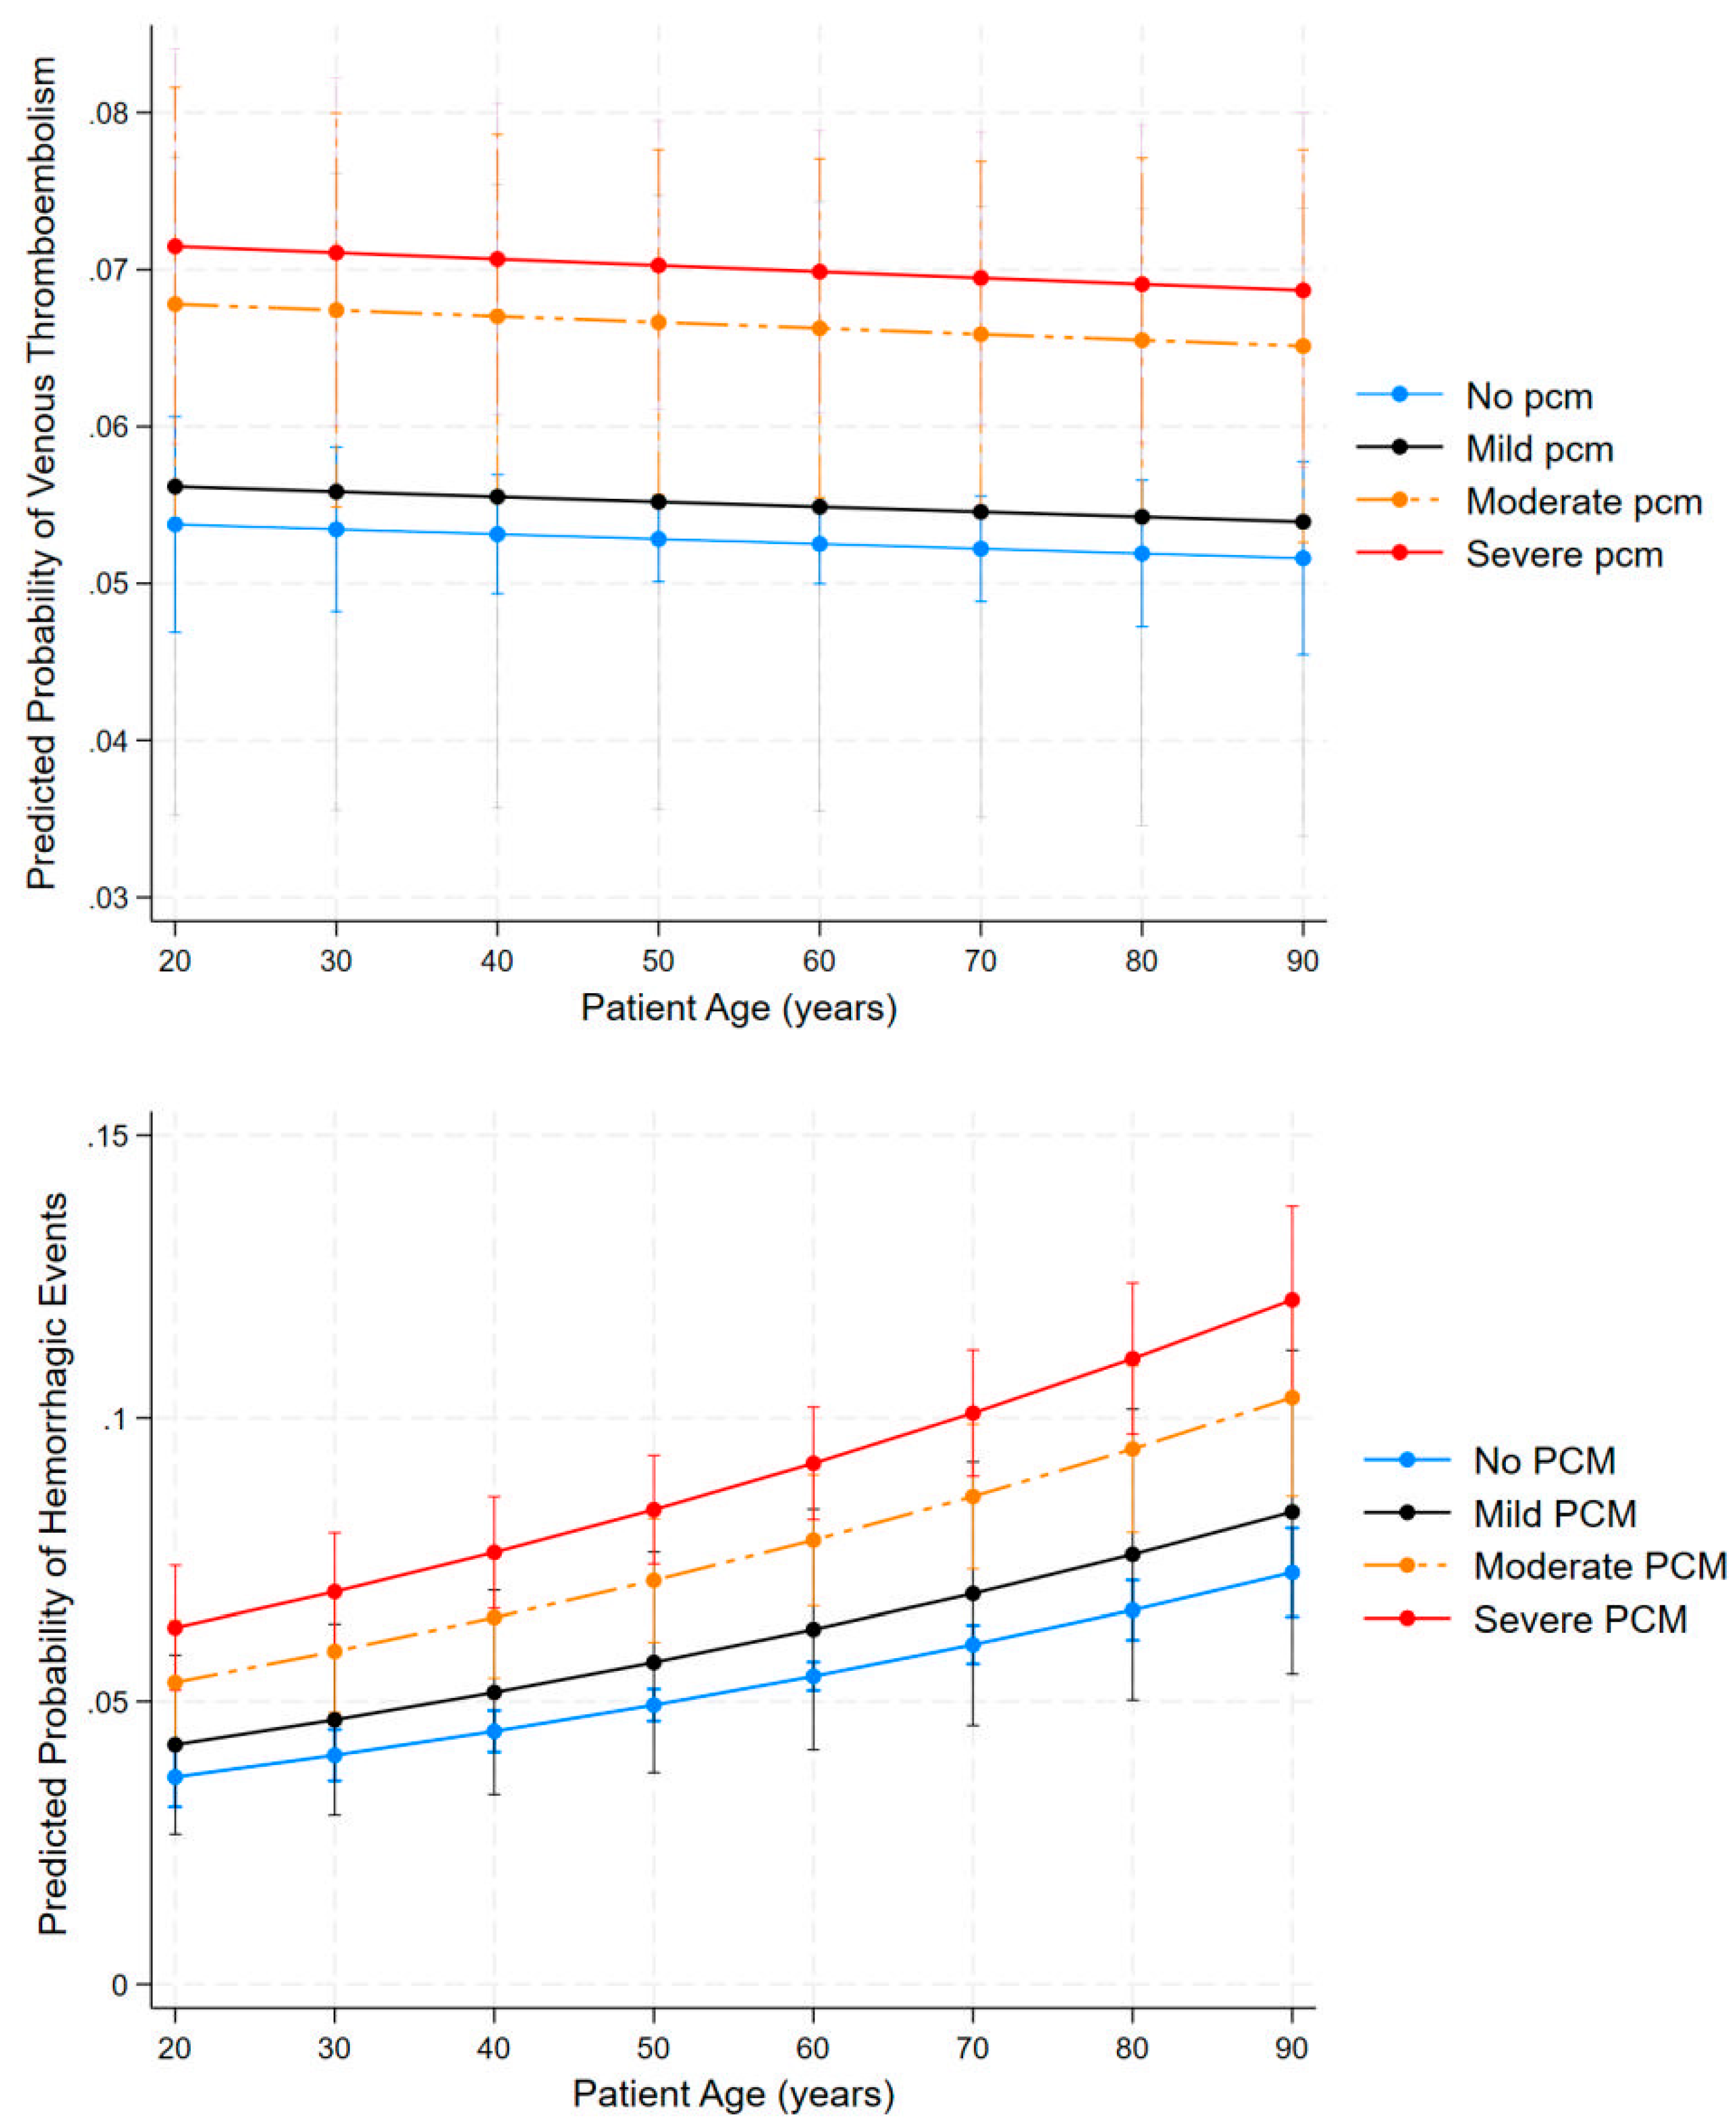
Figure 5.
Predictors of hospital length of stay and cost of care in acute leukemia in multivariable linear regression analysis. The blue squares represent coefficients for log-transformed length of stay; red squares represent coefficients for log-transformed cost. Horizontal lines indicate 95% confidence intervals. Values greater 0 indicated increased length of stay or cost; values less than 0 indicates decreased length of stay or cost. Multiplying the coefficient by 100 provides an approximate percentage change in the value of interest. Base comparators are previously described in Figure 2. IMV = invasive mechanical ventilation. CVC = central venous catheter. CHF = congestive heart failure.
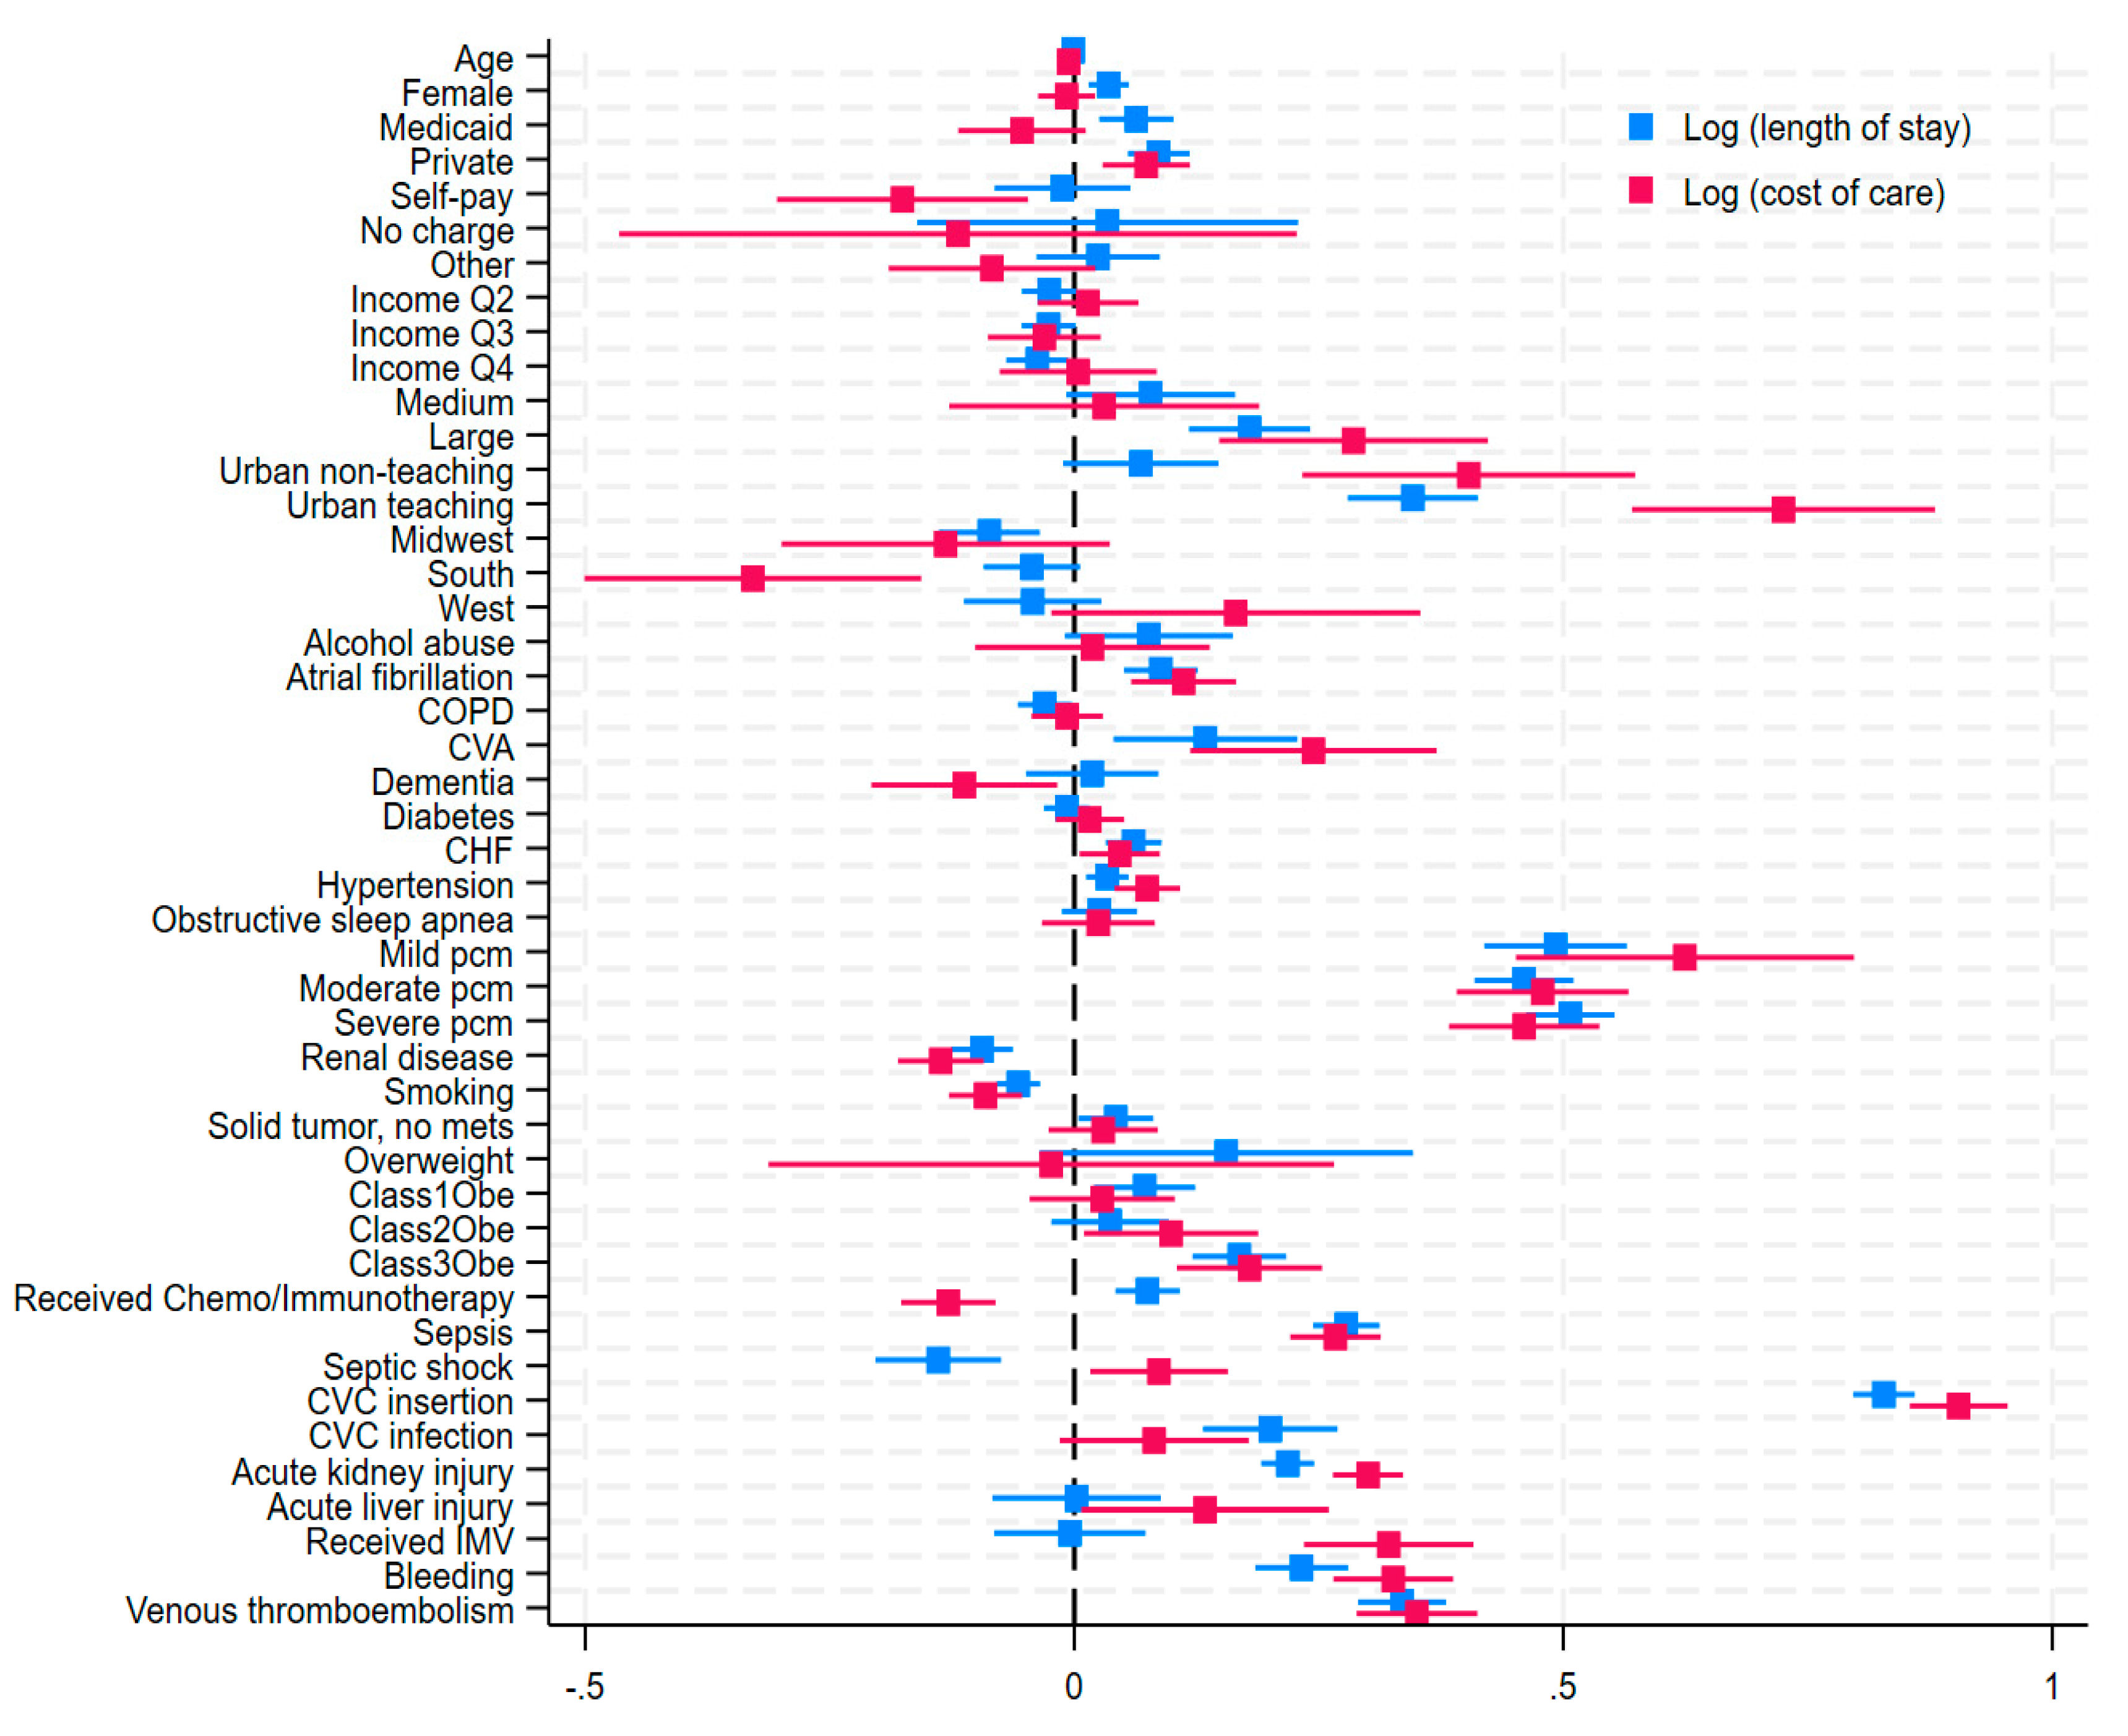
Figure 6.
Forest plot of adjusted odds ratios for inpatient mortality predictors among hospitalized acute leukemia patients. VTE = venous thromboembolism, PCM = protein calorie malnutrition. All estimates adjusted for demographics, hospital characteristics, comorbidities and clinical complication.
Figure 6.
Forest plot of adjusted odds ratios for inpatient mortality predictors among hospitalized acute leukemia patients. VTE = venous thromboembolism, PCM = protein calorie malnutrition. All estimates adjusted for demographics, hospital characteristics, comorbidities and clinical complication.
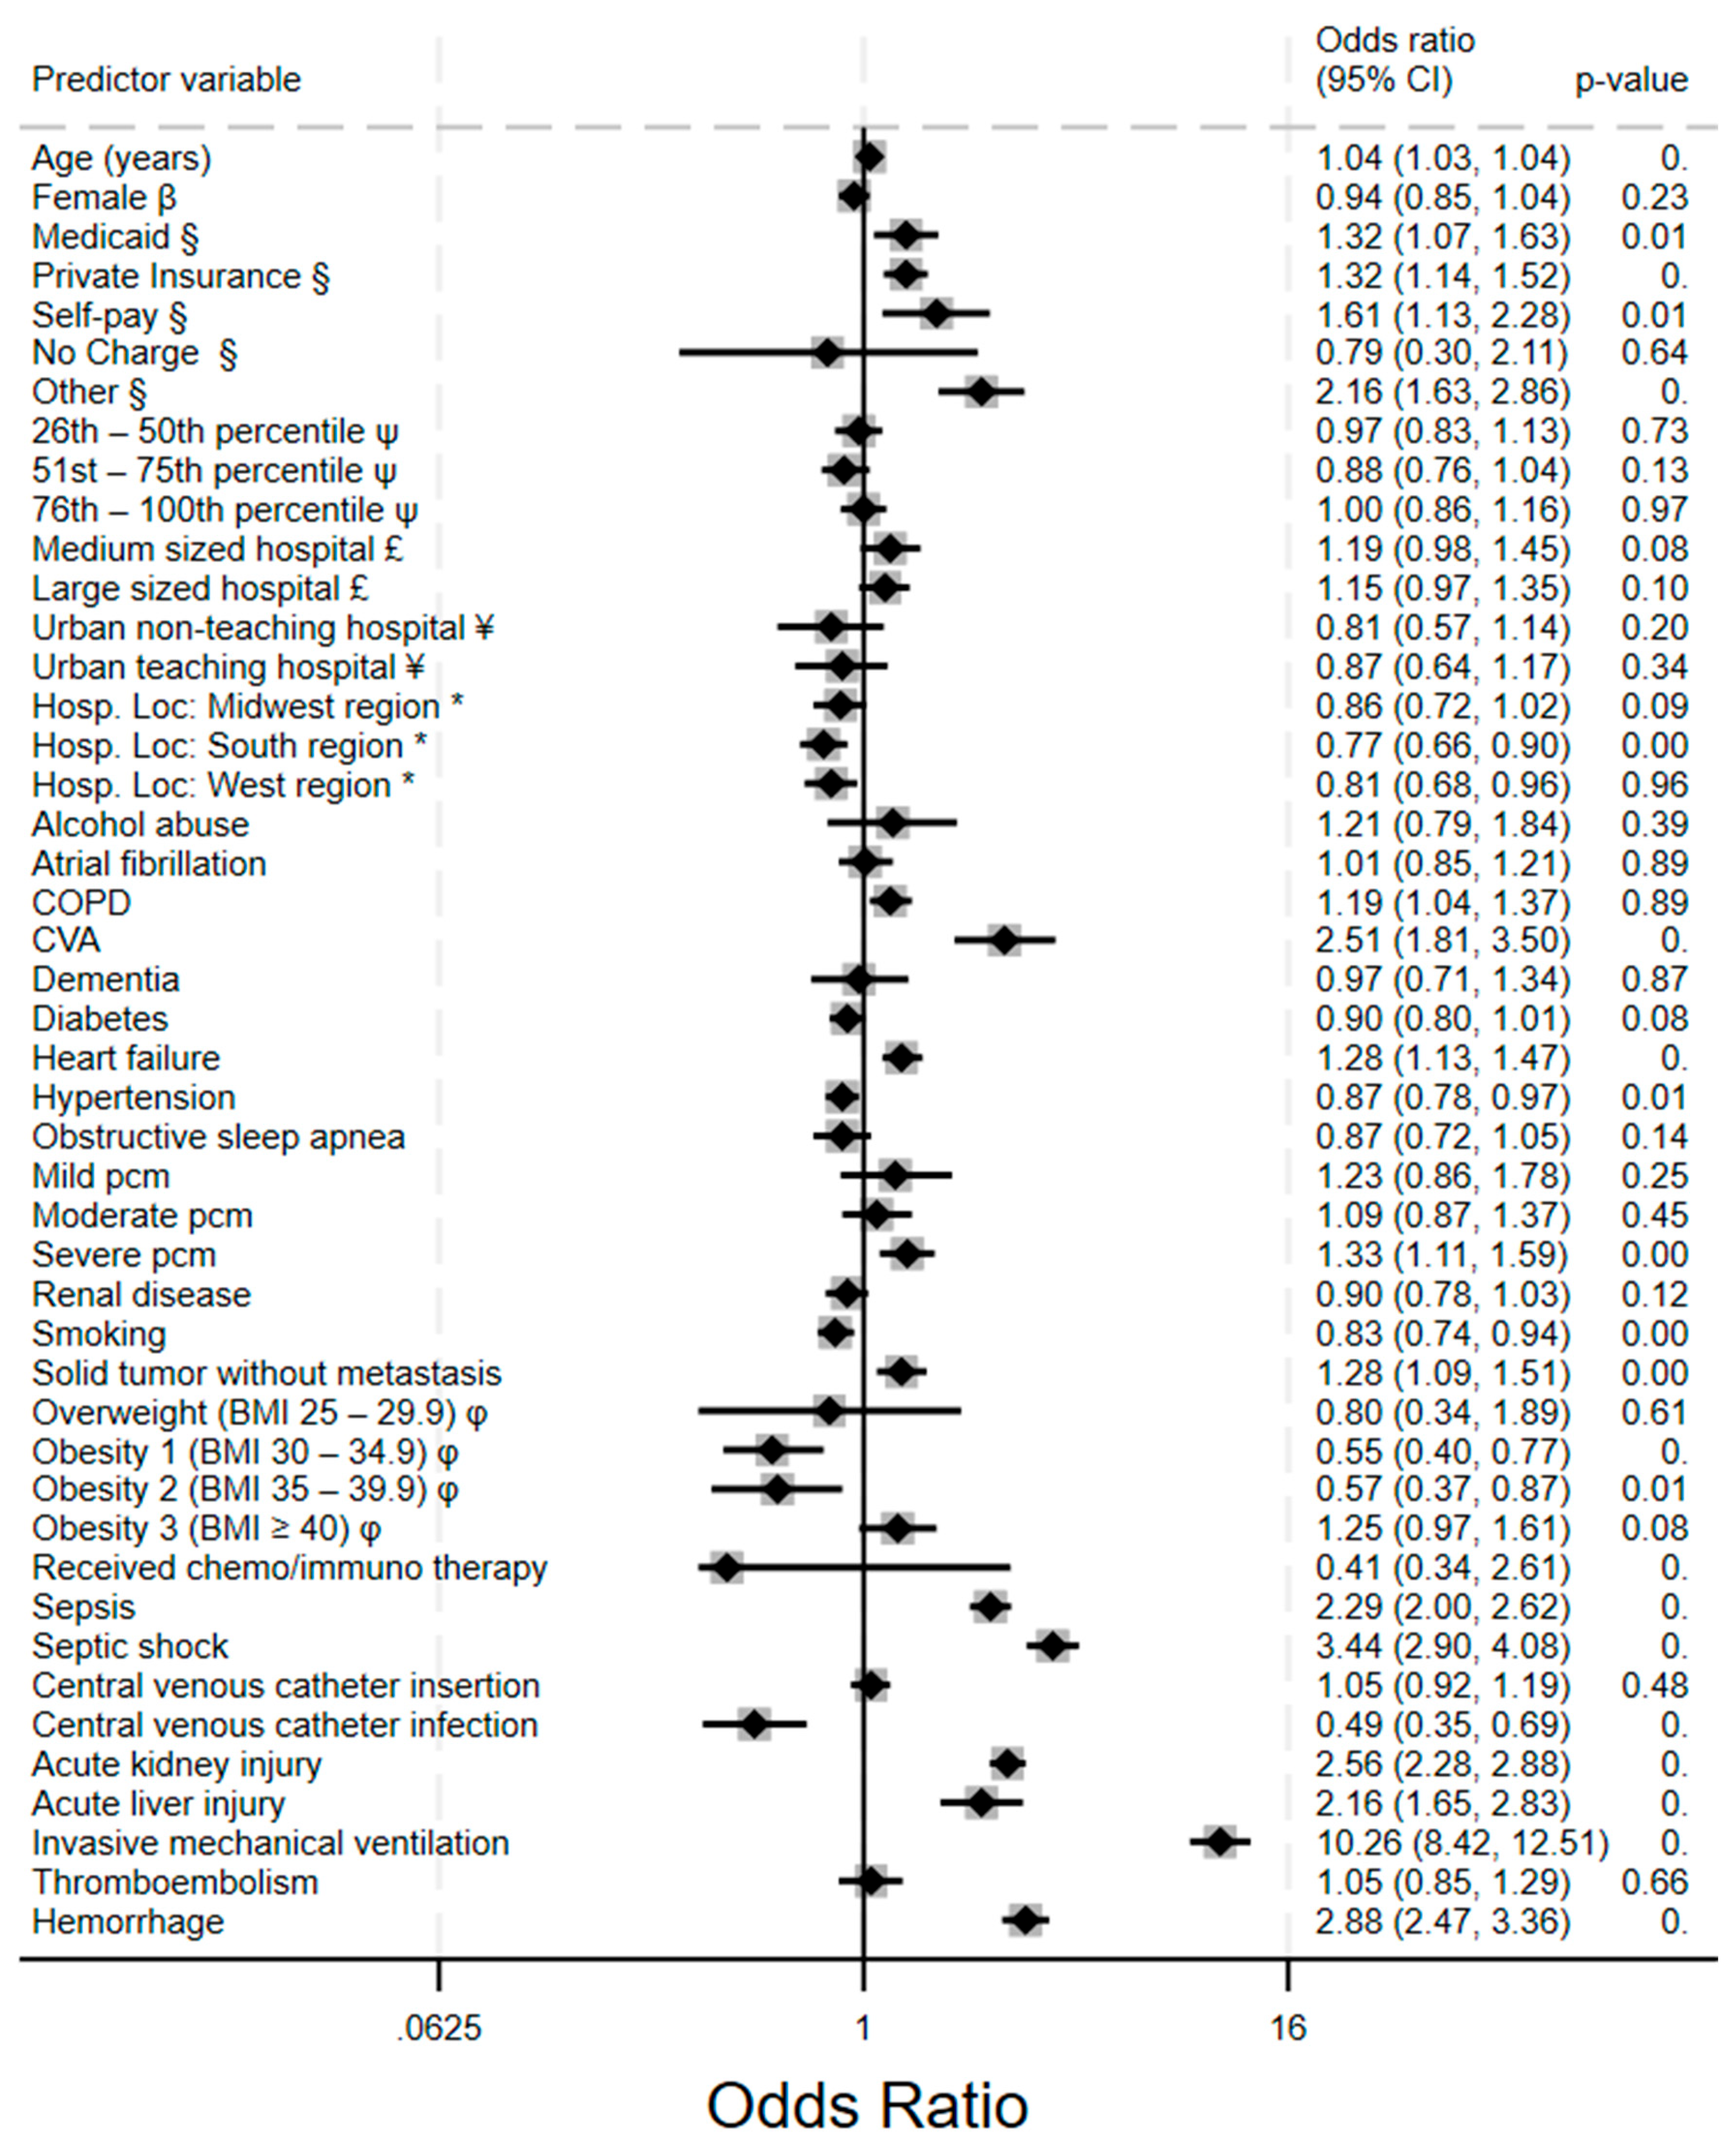

Table 1.
Baseline characteristics of hospitalized acute leukemia encounters stratified by venous thromboembolism (VTE) and hemorrhagic outcome status. ***= p<0.001.
Table 1.
Baseline characteristics of hospitalized acute leukemia encounters stratified by venous thromboembolism (VTE) and hemorrhagic outcome status. ***= p<0.001.
| Variable | VTE absent 407,575 (94.6%) | VTE present 23,205 (5.4%) | p-value | Hemorrhage absent 406,710 (94.4%) | Hemorrhage present 24,300 (5.6%) |
p-value | |
| Age categories (years) | *** | *** | |||||
| 18 – 39 | 85,560 (21.0) | 4,755 (20.5) | 87,025 (21.4) | 3,290 (13.5) | |||
| 40 – 49 | 43,425 (10.7) | 2,705 (11.7) | 43,965 (10.8) | 2,165 (8.9) | |||
| 50 – 59 | 66,095 (16.2) | 3,990 (17.2) | 66,505 (16.4) | 3,580 (14.7) | |||
| 60 – 69 | 93,805 (23.0) | 6,210 (26.8) | 93,800 (23.1) | 6,215 (25.6) | |||
| 70 – 79 | 80,925 (18.9) | 4,135 (17.8) | 79,065 (19.4) | 5,995 (24.7) | |||
| ≥ 80 | 37,965 (9.3) | 1,415 (17.8) | 36,325 (8.9) | 3,055 (12.6) | |||
| Sex | 0.81 | 0.39 | |||||
| Male | 226,115 (55.5) | 12,830 (55.3) | 225,315 (55.4) | 13,630 (56.1) | |||
| Females | 181,460 (44.5) | 10,375 (44.7) | 181,170 (44.6) | 10,665 (43.9) | |||
| Insurance Type | *** | *** | |||||
| Medicare | 173.385 (42.6) | 9,180 (39.6) | 170,205 (41.9) | 12,360 (50.9) | |||
| Medicaid | 62,605 (15.4) | 3,585 (15.5) | 63,090 (15.5) | 3,100 (12.8) | |||
| Private Insurance | 146,340 (35.9) | 9,070 (39.1) | 148,020 (36.4) | 7,390 (30.5) | |||
| Self-pay | 10,575 (2.6) | 540 (2.3) | 10,530 (2.6) | 585 (2.4) | |||
| No Charge | 1,395 (0.3) | 65 (0.3) | 1,400 (0.3) | 60 (0.2) | |||
| Other | 12,985 (3.2) | 745 (3.2) | 12,955 (3.2) | 775 (3.2) | |||
| Household income | 0.31 | 0.13 | |||||
| 0 – 25th percentile | 96,090 (23.9) | 5,210 (22.8) | 95,330 (23.8) | 5,970 (25.0) | |||
| 26th – 50th percentile | 99,670 (24.9) | 5,875 (25.7) | 99,455 (24.9) | 6,090 (25.5) | |||
| 51st – 75th percentile | 104,105 (25.9) | 6,025 (26.3) | 104,125 (26.0) | 6,005 (25.1) | |||
| 76th – 100th percentile | 101,245 (25.2) | 5,765 (25.2) | 101,170 (25.3) | 5,840 (24.4) | |||
| Hospital Bed Size | *** | 0.94 | |||||
| Small sized | 47,730 (11.7) | 2,595 (11.2) | 47,510 (11.7) | 2,815 (11.6) | |||
| Medium sized | 78,8220 (19.2) | 3,685 (15.9) | 77,325 (19.) | 4,580 (18.9) | |||
| Large sized | 281,850 (69.1) | 16,930 (72.9) | 281,875 (69.3) | 16,905 (69.6) | |||
| Hospital Location | *** | 0.05 | |||||
| Rural | 10,655 (26.1) | 350 (1.5) | 10,520 (25.9) | 485 (2.0) | |||
| Urban non-teaching | 37,235 (9.1) | 1,390 (6.0) | 36,445 (9.0) | 2,180 (9.0) | |||
| Urban teaching | 359,910 (88.3) | 21,470 (92.5) | 359,745 (8.8) | 21,635 (8.9) | |||
| Hospital Region | 0.18 | 0.43 | |||||
| Northeast | 79,385 (19.5) | 4,655 (20.1) | 79,120 (19.5) | 4,920 (20.3) | |||
| Midwest region | 88,210 (21.6) | 5,175 (22.3) | 88,250 (21.7) | 5,135 (21.1) | |||
| South region | 152,220 (37.3) | 8,210 (35.4) | 151,285 (37.2) | 9,145 (37.6) | |||
| West region | 87,985 (21.6) | 5,170 (22.3) | 88,055 (21.7) | 5,100 (21.0) | |||
| Comorbid Conditions | |||||||
| Alcohol abuse | 2,170 (1.2) | 150 (1.5) | 0.36 | 2,175 (1.2) | 145 (1.3) | 0.75 | |
| Atrial fibrillation | 24,045 (5.9) | 1,590 (6.9) | 0.01 | 23,870 (5.9) | 1,765 (7.3) | *** | |
| COPD | 57,840 (14.2) | 3,290 (14.2) | 0.99 | 57,380 (14.1) | 3,750 (15.4) | 0.01 | |
| CVA | 3,995 (1.0) | 595 (2.6) | *** | 3,730 (0.9) | 860 (3.5) | *** | |
| Dementia | 6,310 (1.5) | 205 (0.9) | *** | 6,105 (1.5) | 410 (1.7) | 0.29 | |
| Diabetes | 40,910 (10.0) | 2,210 (9.5) | 0.29 | 40,565 (10.0) | 2,555 (10.5) | 0.25 | |
| Heart failure | 53,420 (13.1) | 3,340 (14.4) | 0.02 | 52,655 (13.0) | 4,105 (16.9) | *** | |
| Hypertension | 87,930 (21.6) | 4,690 (20.2) | 0.05 | 86,480 (21.3) | 6,140 (25.3) | *** | |
| Obstructive sleep apnea | 26,585 (6.5) | 1,750 (7.5) | *** | 26,850 (6.6) | 1,485 (6.1) | 0.19 | |
| Mild protein calorie malnutrition | 4,405 (1.1) | 255 (1.1) | 0.91 | 4,340 (1.1) | 320 (1.3) | 0.11 | |
| Moderate protein calorie malnutrition | 16,370 (4.0) | 1,200 (5.2) | *** | 16,080 (3.9) | 1,490 (6.1) | *** | |
| Severe protein calorie malnutrition | 24,670 (6.1) | 2,225 (9.6) | *** | 24,090 (5.9) | 2,805 (11.5) | *** | |
| Renal disease | 48,650 (11.9) | 2,295 (9.9) | *** | 47,625 (11.7) | 3,320 (13.7) | *** | |
| Smoking | 121,095 (29.7) | 5,865 (25.7) | *** | 119,860 (29.5) | 7,100 (29.2) | 0.72 | |
| Solid tumor, no metastasis | 10,430 (5.9) | 550 (5.4) | *** | 10,215 (5.8) | 765 (6.9) | 0.03 | |
| BMI Class | *** | 0.02 | |||||
| Normal | 368,645 (90.4) | 20,375 (87.8) | 367,005 (90.2) | 22,015 (90.6) | |||
| Overweight | 1,375 (0.3) | 50 (0.2) | 1,350 (0.3) | 75 (0.3) | |||
| Class 1 obesity | 12,750 (3.1) | 875 (3.8) | 12,830 (3.1) | 795 (3.3) | |||
| Class 2 obesity | 9,085 (2.2) | 610 (2.6) | 9,315 (2.3) | 380 (1.6) | |||
| Class 3 obesity | 15,945 (3.9) | 1,300 (5.6) | 16,210 (4.0) | 1,035 (4.3) |
COPD: chronic obstructive pulmonary disease; CVA: cerebrovascular accident; BMI: body mass index.
Table 2.
Summary of acute inpatient event rates and secondary outcomes in patients who had venous thromboembolism (VTE), and hemorrhagic events compared to those who did not.
Table 2.
Summary of acute inpatient event rates and secondary outcomes in patients who had venous thromboembolism (VTE), and hemorrhagic events compared to those who did not.
| Acute inpatient events | VTE absent [407,575 (94.61%)] | VTE present [23,205 (5.39%)] | p-value | Hemorrhage absent [406,710 (94.36%)] | Hemorrhage present [24,300 (5.64%)] | p-value | |
| Acute kidney injury | 79,600 (19.5) | 6,490 (28.0) | <0.001 | 77,835 (19.1) | 8,255 (34.0) | <0.001 | |
| Acute liver injury | 5,515 (1.4) | 530 (2.3) | <0.001 | 5,260 (1.3) | 785 (3.2) | <0.001 | |
| Central venous catheter insertion | 73,605 (18.1) | 7,775 (33.4) | <0.001 | 75,020 (18.5) | 6,640 (27.3 | <0.001 | |
| Central venous catheter infection | 10,300 (2.5) | 1,220 (5.3) | <0.001 | 10,780 (2.7) | 740 (3.0) | 0.09 | |
| Received chemotherapy | 96,585 (23.7) | 4,495 (19.4) | <0.001 | 99,000 (24.3) | 2,080 (8.6) | <0.001 | |
| Received immunotherapy | 2,485 (0.6) | 105 (0.5) | <0.001 | 2,545 (0.6) | 45 (0.2) | <0.001 | |
| Invasive mechanical ventilation | 12,525 (3.1) | 1,470 (6.3) | <0.001 | 10,970 (2.7) | 3,025 (12.5) | <0.001 | |
| Sepsis | 73,430 (18.0) | 5,825 (25.1) | <0.001 | 72,250 (17.8) | 7,005 (28.8) | <0.001 | |
| Septic shock | 21,705 (5.3) | 2,245 (9.7) | <0.001 | 20,85 (5.1) | 3,265 (13.4) | <0.001 | |
| Thrombocytopenia | 95,205 (23.4) | 5,455 (23.5) | 0.81 | 92,945 (22.9) | 7,715 (31.8) | <0.001 | |
| Thrombocythemia | 2,410 (0.6) | 155 (0.7) | 0.51 | 2,410 (0.6) | 155 (0.6) | 0.69 | |
| Secondary Outcomes | |||||||
| Length of stay [Median (Interquartile rage)], days |
5 (3 – 13) | 11.5 (5 – 27) | <0.001 | 5 (3 – 13) | 10 (4 – 26) | <0.001 | |
| Cost of Care [MD (IQR)], US Dollars | 21,363 (9,530 – 57,201) | 46,872 (16,473 – 125,724) | <0.001 | 21,404 (9,541 – 57,250) | 43,663 (15,287 – 126,279) | <0.001 | |
| All-cause inpatient mortality | 28,315 (6.9) | 2,365 (10.2) | <0.001 | 24,860 (6.1) | 5,820 (24.0) | <0.001 |
Table 3.
Relative risk of venous thromboembolic and hemorrhagic outcomes by malnutrition status (compared to those without protein calorie malnutrition, PCM) using multinomial regression analysis. Base outcome for comparison was Neither outcome (i.e. No VTE and No hemorrhage). KEY: ns = not significant; * p-value <0.05; ** p-value <0.01; *** p-value <0.001.
| Relative Risk Ratio (95% Confidence intervals) | |||
| Outcome | Mild PCM | Moderate PCM | Severe PCM |
| VTE Only | 1.1 (0.74 – 1.62) ns | 1.27 (1.04 – 1.54) * | 1.28 (1.08 – 1.51) ** |
| Hemorrhage Only | 1.25 (0.85 – 1.83) ns | 1.48 (1.23 – 1.78) *** | 1.73 (1.50 – 1.99) *** |
| VTE & Hemorrhage | 0.37 (0.05 – 2.73) ns | 2.00 (1.21 - 3.37) * | 2.88 (2.00 – 4.14) *** |
Disclaimer/Publisher’s Note: The statements, opinions and data contained in all publications are solely those of the individual author(s) and contributor(s) and not of MDPI and/or the editor(s). MDPI and/or the editor(s) disclaim responsibility for any injury to people or property resulting from any ideas, methods, instructions or products referred to in the content. |
© 2025 by the authors. Licensee MDPI, Basel, Switzerland. This article is an open access article distributed under the terms and conditions of the Creative Commons Attribution (CC BY) license (http://creativecommons.org/licenses/by/4.0/).
Copyright: This open access article is published under a Creative Commons CC BY 4.0 license, which permit the free download, distribution, and reuse, provided that the author and preprint are cited in any reuse.


