
Submitted:
06 May 2025
Posted:
07 May 2025
You are already at the latest version
Abstract
Research concerning green marketing has predominantly focused on consumer behavior. However, aspects such as the extent to which SMEs embrace green marketing values, their ability to implement the green marketing mix, and the integration of green marketing into their business culture are critically important. This study introduces a foundational measurement instrument to the 4P-focused green marketing literature, designed to identify and measure the implementation of the green marketing mix by SMEs. The study employs a descriptive design and also possesses an exploratory nature. Scale development involved two stages: First, analyses were conducted on a pre-test sample of 159 individuals, revealing the initial scale structure. Second, these analyses were repeated on a larger group of 387 participants. The scale was finalized by confirming the consistency of results across both analyses. SPSS and AMOS software were utilized for descriptive statistics and the scale development process. According to the measurement models, no items exhibited factor loadings below 0.50. The ∆CFI value was found to be below 0.01 in both samples, indicating that the developed scale demonstrates measurement invariance. Within the scope of this study, an original scale comprising 12 items and three primary dimensions (“Environmental Publicity”, “Green Packaging”, “Green Distribution”) was developed, and its statistical validity and reliability were confirmed. The scale is deemed applicable to larger populations.
Keywords:
green marketing
; SMEs
; scale development
; green culture
1. Introduction
In recent years, interest in green marketing and sustainability concepts has markedly increased within the business world. Green marketing appears to have emerged as a consequence of businesses' efforts to integrate environmental sustainability principles into their marketing strategies, largely driven by growing consumer environmental sensitivity. According to Papadas et al. [1], green marketing can be considered a reflection of contemporary business efforts to reduce environmental impacts while simultaneously fulfilling social responsibilities. It is a marketing approach that minimizes businesses' environmental impacts, activates consumer environmental consciousness, and contributes to a sustainable future [2].
Although numerous studies on green marketing exist in the literature, scale development efforts in this area have remained limited. Previous research has primarily examined consumer responses to various types of green appeals [3,4,5,6]. The adaptation of scales across different cultures is a critical step for enhancing the reliability of international comparative research in the green marketing field. For example, the green marketing scale developed by Vilkaite-Vaitone et al. [7] was adapted into Turkish by Budak and Filiz [8]. According to the authors, this adaptation facilitates the examination of global environmental issues within a local context, aiming for a better understanding of Turkish consumers' attitudes and behaviors towards green marketing. Scales developed by Moravcikova et al. [9] assist businesses in enhancing the effectiveness of their green marketing strategies. Another study by Bailey et al. [10] involved the application of a “green” scale to determine US consumer responses to green marketing communication. The “Green” scale developed by Haws et al. [11] was designed to measure green consumption values. Chen and Yang [12] conducted a study applying a multi-criteria decision-making approach to the determination of green marketing audit criteria. Eyadat et al. [13] conducted research aiming to explore the relationship between green marketing practices, leadership commitment, and environmental performance in the Jordanian pharmaceutical sector. Their study investigates the impact of green marketing strategies on the competitive advantage of Jordan's leading green companies.
A review of the literature on green marketing identifies several tools developed to measure marketers' perceptions of green marketing initiatives. These scales include Chen and Yang's [12] green marketing audit scale and Fraj et al.'s [14] green marketing strategy scale. Chahal et al. [15] demonstrated that SMEs in developing countries, such as India, could achieve greater success by adopting green marketing practices, specifically within the electrical sector.
Research Problem: This research addresses the development of a scale to identify and measure the extent to which SMEs in Turkey adopt and implement the green marketing mix elements (4P). Within this framework, the research focuses solely on the concepts known as the 4Ps – "green product, green price, green distribution, and green promotion" – and the items in the pool used during the scale development process were generally constructed within this scope. The primary reasons for limiting the research scope to only the 4Ps are as follows:
- Although marketing mix elements have been expanded to 7Ps in the literature, particularly within the contexts of service marketing and experiential marketing, the initial 4Ps represent the first and most tangible steps firms take in transitioning to green marketing, as well as their core strategic orientations. These four elements typically form the backbone of a green marketing strategy.
- Due to the focused nature of scale development, a 'practice culture' scale encompassing all 7Ps could have increased conceptual complexity and scale administration (dimensions/items) challenges, potentially weakening its practicality and statistical power. Therefore, focusing initially on the fundamental 4Ps was preferred to maintain methodological robustness.
- A lack of a valid and reliable scale measuring the practice culture of the basic 4Ps of green marketing was identified in the literature, and this study primarily aims to fill this gap. The measurement of the extended 7Ps (people, physical evidence, process) involves different dynamics and likely requires a separate study, hence it was excluded from the current scope.
- The current 4P-focused scale provides a foundational measurement instrument for the green marketing literature. This study can serve as a basis and starting point for future research that will examine the extended mix elements (people, physical evidence, process) or expand the scale.
- The primary aim of this study is to develop a scale through which SMEs can measure and evaluate their Green Marketing Mix (4P) practices. This study presents an instrument for the identification and evaluation of the Green Marketing Mix Practice Culture (GMMPC) among SMEs operating in different industry sectors. Thus, it aims to contribute to filling such a gap identified in the literature. The developed scale may provide the following benefits:
- It can offer detailed information about the current status of SMEs regarding their GMMPC and assist in making assessments; it can also provide data for determining businesses' green marketing strategies.
- It can enable comparative analyses among firms of different sizes operating in various industry sectors across different regions.
- It can play a supportive role in evaluating the effectiveness of green marketing practices and providing a scientific basis for research.
In summary, this scale, developed to measure GMMPC in SMEs, can contribute to understanding the green transformation processes of SMEs by providing significant insights for research in this field.
2. Green Marketing Mix
Green marketing (also known as environmental, ecological, or sustainable marketing) involves the integration of environmental factors into marketing activities [16] and sustainability-oriented practices [17]. As a comprehensive approach, it aims to minimize long-term ecological impact while simultaneously achieving consumer satisfaction and organizational objectives [18], and promoting products/services with a lower environmental impact [19]. This approach encompasses activities aimed at creating a positive environmental image or mitigating the negative impacts of products/services [20], as well as the process of designing, implementing, and controlling marketing mix elements to minimize environmental harm, in alignment with customer and organizational goals [21]. Essentially, it represents a holistic approach that targets the achievement of customer satisfaction and organizational objectives while reducing the environmental impacts of business operations. As mentioned in the introduction section of this study, only the initial 4Ps, which form the backbone of the marketing mix, are addressed and briefly explained below.
Green Product: Forming the foundation of the green marketing mix [22], the green product holds critical importance for the overall strategy [23]. Inherently eco-friendly and sustainable [24], these products are designed, manufactured, and marketed to minimize environmental impact throughout their lifecycle [25,26]. Their aims include ensuring safety for use [27] and minimizing adverse effects on the ecosystem and human health [24,28]. Green product strategies encompass eco-friendly packaging, the use of recyclable materials, and extending product lifespan, while also adopting a circular economy approach to preserve resource value [29].
Green product development favors safe raw materials and processes [22,28,30]. During manufacturing, principles of reducing energy/input consumption, waste, and pollution [25], conserving resources, and non-cruelty to animals are adopted. This approach requires a holistic perspective covering the entire lifecycle from design to disposal [22,26,31] and often involves the adoption of the 5R principles (reuse, reconditioning, repair, remanufacture, recycling) [32,33]. Green products often exhibit characteristics such as recyclability, biodegradability, resource efficiency, reduced/eco-friendly packaging, non-toxicity, and natural/organic production [34]. Factors such as growing consumer awareness, activism, legal regulations, and the demand for sustainable options [28,35] drive businesses towards green product development and marketing [24]. This trend promotes environmental responsibility while also creating new market opportunities [36].
Green Price: Green price is a pricing strategy that reflects the environmental costs associated with a product/service [37] and balances the costs of sustainable production practices with consumer willingness to pay [38]. It holds the potential to incorporate the external environmental costs often disregarded by traditional prices [39], thereby potentially reducing overconsumption by fostering conscious consumption [40]. Rather than lowering prices for sales maximization, sustainable companies often invest in eco-friendly technologies that reduce long-term costs; their prices typically reflect production and marketing costs [41]. Eco-friendly pricing takes into account factors such as the product's environmental impacts, donations, green campaigns, lifecycle, carbon emissions, and competitive pricing [29,42].
Environmentally conscious consumers are often willing to pay a higher price [43]. Green product prices are often higher than those of conventional products due to their environmental/social benefits [3,31,44,45,46]. This price difference often stems from the additional costs businesses incur for greener processes, materials, waste management, or technology [31,47], and the price may also encompass non-monetary costs such as opportunity or energy costs [22]. Nevertheless, research indicates that a significant segment of consumers is willing to pay a premium price for products possessing positive environmental attributes [27,48,49,50,51]. This willingness may stem from heightened environmental concerns [52] or the perceived ethical value (leading to a willingness to incur an additional cost of 7-20%) [53,54]. Consumers who understand that environmental knowledge influences their behavior are also more inclined to accept premium pricing [51].
Consequently, the green price serves as an indicator reflecting market behaviors [40] and is influenced by factors such as the product's degree of greenness, its advertising [55], market demand, and consumer awareness [56]. Furthermore, it can promote sustainability through mechanisms such as subsidies or tax incentives [57]. However, it should also be noted that some green products (e.g., fuel-efficient vehicles) may prove more economical in the long term when lifecycle costs are taken into account [58].
Green Place/Distribution: Green Place/Distribution involves the strategic positioning and distribution of products in a manner that reduces environmental impact and promotes sustainability [59,60]. This includes both physical distribution and the conceptual positioning of the brand as environmentally conscious (strengthening its image) [59], encompassing elements such as channels, transportation, location, and logistics [61]. A significant focus of the green place strategy is optimizing logistics and distribution channels [59] to reduce the carbon footprint [61]. This involves selecting routes with minimal environmental harm [36,62,63] and conducting a holistic assessment of the supply chain [64]. This approach can decrease emissions, energy usage [65], and transportation costs [61]. In terms of physical location, green place incorporates the responsible and sustainable design (e.g., recycled materials, energy efficiency, green technology [66] and operation (e.g., waste/resource reduction) of the space. Factors such as accessibility [67], proximity to local suppliers, and surrounding green infrastructure are considered in location selection. The inclusion of green products in retail supply chains and the availability of specialized points of sale are also associated with this concept [68,69].
In the context of distribution channels, the green place strategy requires that the physical or virtual places and methods through which environmentally friendly products are sold also embody environmental responsibility [70,71]. While online channels offer convenience and cost advantages [71], the environmentally friendly activities of distributors are important [72]. Since accessibility and convenience influence the adoption of green products [67], strategic positioning and availability are critical [72]. Designing a supply chain that ensures the efficient flow of materials and information for sustainability and determining the optimal location for facilities/centers/points of sale to minimize logistics impact are crucial [3]. Distribution is considered one of the mix elements with the highest potential for reducing environmental impact. Environmental impact within the process can be reduced through methods such as collaborating with eco-friendly partners, waste reduction, promoting reuse, product recycling, and lifecycle assessment (cradle-to-cradle) [41]. This may necessitate redesigning the distribution network and developing secondary markets [43].
Green distribution is a fundamental mix element focused on minimizing harmful environmental impacts [73]. Sustainable companies should oversee the ethical/ecological practices of their suppliers/distributors, the locality of products, and price fairness [41]. Green packaging is also important; it describes packaging that is environmentally sustainable, often natural, reusable/recyclable, biodegradable, and designed to minimize harm throughout its lifecycle [74,75]. Green packaging can influence consumer awareness [76] and purchasing behavior [77,78], and is sometimes considered a marketing mix element itself [45].
In summary, green place/distribution strategies aim to reduce environmental impact across a broad spectrum, including logistics, physical spaces, distribution channels, and packaging. Successful implementation creates an environmentally conscious image [65], facilitates access to green products, contributes to sustainability, and attracts relevant consumers [59].
Green Promotion: Green promotion refers to the strategies businesses employ to communicate their environmental benefits and sustainability commitments to target audiences [79,80,81]. Grounded in sustainability theory [82], its primary aim is to inform, persuade, and remind stakeholders (particularly consumers) about environmental efforts [36,83], while also providing accurate product information in a manner that respects both ethical and materialistic values [22]. Green promotion activities aim to enhance consumer knowledge regarding environmental issues, alter their perceptions of eco-friendly products/services, and educate them [31,54]. To this end, various communication techniques and channels, such as advertising and public relations, are utilized [83,84,85].
Effective green promotion activities can positively influence individuals' attitudes towards advertising and their intentions towards environmentally conscious actions [86]. Consequently, businesses are inclined to gain a better brand reputation [87], attract environmentally conscious stakeholders (consumers, investors, talent), and achieve a competitive advantage [79,80]. Indeed, green promotion has been shown to have a significant impact on purchasing decisions [65,88]. Its effectiveness can be evaluated based on indicators such as the accuracy of advertising media, message delivery, contribution to brand image, informativeness, and its impact on consumer interest and loyalty [32]. The effectiveness of green promotion relies heavily on the company's perceived credibility and the authenticity of its environmental claims [89,90]. Credibility, which is key to success, necessitates communication that is data-driven [51], non-exaggerated, and consistent [90]. Such credible and transparent communication facilitates consumers' internalization of environmental information [91] and encourages purchasing behavior [92]. Green advertising, in particular, aims to persuade consumers by highlighting the product's eco-friendly attributes [33,85] or a relevant environmental issue [22,86]. These advertisements serve functions such as establishing the product-environment connection, promoting a pro-environmental lifestyle, and showcasing the organization's green identity [4,30].
Green promotion plays a critical role in enabling businesses to communicate their environmental sustainability efforts, build a green brand image, and persuade consumers of the benefits of environmental protection [3]. Promotional strategies can communicate environmental sponsorships, product modifications, and tangible actions [18]. Digital channels (social media, blogs, websites) enhance communication by facilitating direct dialogue about green products/services and educating consumers [93], which may necessitate a shift in communication strategies towards online media [29].
Green promotion messages should be tailored according to the expectations of environmentally conscious customers [23] and must effectively convey the business's commitment to eco-friendliness [31]. As environmental attributes, which are often not immediately apparent, must be made visible [94], green labeling, certifications and green packaging serve as important communication tools in this context. Green packaging, utilizing eco-friendly technology [95], can influence consumer awareness and the decision-making process [96].
3. Method
While the research is descriptive in nature, it also possesses exploratory characteristics. It describes the current state of SMEs actively operating in the Ankara Ostim Organized Industrial Zone (OSB) concerning their existing green marketing practices. This study involved an extensive literature review; additionally, informal, conversational interviews were conducted with relevant stakeholders in the field to capture idioms that could provide insights for formulating the item pool. Coşkun et al. [97] state that the foundation of an exploratory study consists of a comprehensive literature review and interviews with field experts. These methods allow for the development of new perspectives on the research topic. According to Burns and Bush [98], the most common purpose of exploratory research is to understand existing information more deeply and develop new hypotheses. Methods such as secondary data analysis and experience surveys are often preferred to achieve this purpose. Specifically, secondary data analysis forms the basis of exploratory research.
Population and Sample: The research population consists of managers and/or officials of firms operating in Ankara Ostim OSB. There are over 6,500 businesses operating in 17 different sectors within Ostim OSB [99]. Yazıcıoğlu and Erdoğan [100] state that for a population of 5000 and above with a 0.05 margin of error, a sample size of 357 individuals is sufficient. Similarly, Sekeran [101] suggests 361 individuals for populations up to 6000, and Israel [102] indicates 375 individuals for populations of the same size. In this study, a total of 387 individuals (managers and/or officials) from 360 businesses constitute the sample size.
Data Collection Instrument and Characteristics: In this study, primary data were collected through questionnaires. The Likert-type statements included in the questionnaire form are those remaining in the item pool after expert review. Accordingly, the questionnaire form consists of three sections in total. The first section comprises 62 statements related to determining the Green Marketing Mix Practice Culture (GMMPC). These statements were rated using a 5-point Likert-type scale. The second section covers general business information and consists of 15 questions in total, including 'yes-no' and multiple-choice formats. The final section includes 6 multiple-choice questions to determine the participants' demographic characteristics. Nominal and ordinal scales were used to measure the questions in the last two sections, generally involving discrete variables. The relevant literature for the study was obtained from secondary sources such as books, articles, theses, and websites.
Data Collection (Questionnaire Administration): With permission obtained from the managers of Ankara Ostim OSB Directorate and Ostim İŞKUR Service Center, the questionnaire administration was conducted between February 22, 2024, and July 8, 2024. The Ankara Ostim OSB Directorate and its Green Transformation and Sustainability Office significantly contributed to the study's progress through their meetings and sensitivity in providing information on environmental issues, as well as their support in reaching out to firms. Of the 387 valid questionnaires included in the evaluation, 330 were administered face-to-face, 30 were obtained via Google Forms, and 27 were personally delivered to participants and retrieved the subsequent day. Participation in the questionnaire administration was notably higher during promotional events attended by middle and senior-level company officials, including the “İş Pozitif Women's Employment Promotion Fair”, “OSTİMTECH Promotion Days”, “Prosumer Renewable Energy e-Mobility Charging Fair”, “Green Transformation in Industry Summit”, and “Çevrefest, Solar Energy Solutions for Clean Production” programs. Firms visiting Ostim İŞKUR also showed high participation rates in the survey.
Data Analysis: The validity and reliability of the scale used in the research were initially assessed using the SPSS 24 statistical package program. Item analysis and the Cronbach's alpha coefficient were determined to assess the scale's internal consistency. The construct validity of the scale was examined using Exploratory Factor Analysis (EFA), and the resulting factor structure was confirmed using Confirmatory Factor Analysis (CFA) in the AMOS program.
4. Scale Development Study on Green Marketing Mix Practice Culture (GMMPC)
In the scale development phase, the 10 steps defined by Carpenter [103] were followed. This involved two studies. The first concerned the scale structure emerging from analyses conducted on the pre-test sample of 159 individuals. Secondly, these analyses were replicated on a larger group of 387 individuals. Consequently, the scale was finalized after confirming the consistency of the results across both analyses. Carpenter’s [103] approach plays an important role in improving the quality and scientific value of scale development studies by providing a practical guide that is more structured, comprehensive, and reporting-oriented than other approaches. This approach is used by many authors in scale development studies [104,105,106].
4.1. Study 1: Pre-Test Analysis
Stages 1 & 2: Creation of the item pool and submission for expert review
The initial steps comprised several phases: Formulating appropriate conceptual statements from the literature (item pool generation), conducting qualitative research to establish dimensions and elements, submitting the generated pool for expert review, assessing the validity of the items within the pool, and determining the questionnaire structure and model. The responses given by 10 experts to the statements in the item pool are summarized in Appendix Table 1. Only the statements deemed 'necessary' by the experts were retained in the item pool. All experts were academic personnel specializing in the field of marketing, comprising 6 males and 4 females. All experts possessed a minimum of 10 years of professional experience.
Stage 3: Calculation of Content Validity Ratios (CVR)
The statements in the item pool were evaluated by 10 experts. The CVR for each statement was calculated using the following formula [107]:
Where:
NE = Number of experts rating the item as "Necessary"
N = Total number of experts
According to Table 1, the minimum number of experts needing to rate an item as "Necessary" for it to be considered acceptable among the 10 experts is 9. The corresponding CVR value when 9 out of 10 experts agree is 0.80.

Table 1.
CVR reference table.
|
Panel Size |
Proportion Agreeing Essential |
CVR Critical Exact Values |
One-Sided pValue | Ncritical (Min. No. of Experts Required to Agree Item Essential) | Ncriticaly Calculated From CRITBINOM Function |
| 5 | 1 | 1.00 | .031 | 5 | 4 |
| 6 | 1 | 1.00 | .016 | 6 | 5 |
| 7 | 1 | 1.00 | .008 | 7 | 6 |
| 8 | .875 | .750 | .035 | 7 | 6 |
| 9 | .889 | .778 | .020 | 8 | 7 |
| 10 | .900 | .800 | .011 | 9 | 8 |
| 15 | .800 | .600 | .018 | 12 | 11 |
| 20 | .750 | .500 | .021 | 15 | 14 |
| 25 | .720 | .440 | .022 | 18 | 17 |
| 30 | .667 | .333 | .049 | 20 | 19 |
Source: developed by the authors based on Ayre and Scally [108].
According to Table 2, items with a CVR of 0.80 or higher were interpreted as "Remained". Items with a CVR below 0.80 were interpreted as "Eliminated" and subsequently removed from the item pool. A total of 62 items, having CVRs of 0.80 or above, remained in the item pool and were included in the questionnaire form designated for field application. The average of the CVRs for these retained items constitutes the Content Validity Index (CVI). The content validity of the scale is considered statistically significant if the CVI meets or exceeds the minimum acceptable CVR value. Of the 62 retained items, 36 had a CVR of 0.80, while the remaining 26 had a CVR of 1.00. Consequently, the mean CVR for all retained items is 0.90. Therefore, since 0.90 ≥ 0.80 (the minimum acceptable CVR for 10 experts), the content validity of the scale is statistically significant.
Stage 4:
Step 1: Creation of the scale: After the CVRs and CVIs of the statements in the item pool were calculated, the final version of the scale in question is below and item numbers were reassigned.
Stages 2 & 3: Sample Determination and Pre-test Administration
The retained items (questions) from the scale were initially administered as a pre-test to a small group. It is emphasized in the literature that pre-tests should be conducted on a minimum of 100 participants [109,110,111]. In this study, a sample comprising 159 participants was obtained. This obtained sample size is deemed adequate [112,113]. Data regarding the demographic characteristics of the pre-test sample are presented in Table 4.
According to Table 4, 66.67% (106 individuals) of the subjects were male, and 33.33% (53 individuals) were female. More than half of the subjects were 40 years of age or younger, and predominantly held undergraduate degrees. In addition to demographic characteristics, normality analysis was conducted to examine the distribution of other data.
For large datasets, numerous statistical tests requiring normally distributed data tend to be robust to violations of this assumption. Various methods exist to formally check for normality in a dataset, including the well-known Kolmogorov-Smirnov and Shapiro-Wilk tests.
According to Table 5, the Skewness and Kurtosis values fall within the range of +1.96 to -1.96. Therefore, the sample can be considered normally distributed [114].
Stage 4: Establishing the Factor Structure of the Scale
Within this stage, the correlation matrix was first examined. The correlation test determined that there were no items without significant correlations. Accordingly, Exploratory Factor Analysis (EFA) was performed. Based on the EFA, Bartlett's test of sphericity yielded a chi-square value indicating significance (p ≤ .05), the KMO measure was ≥ 0.60, and factor loadings exceeded 0.50 [114]. EFA is important and widely used in scale development, refinement, and evaluation [115]. EFA is useful for data reduction and identifying latent relationships. Furthermore, EFA can provide significant flexibility to the model, offering insights to better explain the underlying structure and relationships, which can subsequently influence the inferences drawn from the analysis [116].
The values related to EFA and Parallel Analysis (PA) are presented in Table 6. According to the analysis, KMO = 0.895 (KMO > 0.60), Bartlett’s test of sphericity = 0.000 (Bartlett’s < 0.05), and Cronbach's Alpha = 0.913, which is above the 0.60 threshold [114,115,116]. Thus, the developed scale appears to meet the appropriate criteria. However, even if the analysis results meet the desired criteria, it is necessary to check the random distribution of items across the scale's sub-dimensions using PA [103]. Horn [117] recommended PA as an alternative to the commonly used Kaiser-Guttman criterion (eigenvalue > 1) for determining the number of factors to retain.
Horn recommends comparing the eigenvalues obtained from a factor analysis with those derived from a random data set of the same dimensions [118]. This comparison is considered a crucial step in determining whether the factor structure reflects a genuine underlying structure or is merely due to chance. No random distribution was observed through PA. However, the Kaiser-Guttman analysis was also deemed necessary to check the random distribution of items across the scale's sub-dimensions. Despite its critical aspects, an analysis based on the Kaiser-Guttman criterion was conducted regarding the distribution of items within the scale. This analysis is presented in Table 7.
Steps 5-9
In steps 5, 6, 7, 8, and 9, the EFA results and the required factor loading values are explained in significant detail [103]. Within this framework, analyses were conducted using the Maximum Likelihood method. The factor loading threshold was set at 0.50. "Direct Oblimin" was chosen as the rotation method. During the scale creation phase, DFA was repeated five times, and EFA and PA were performed. The values of the items deleted as a result of these analyses, along with the reasons for deletion, are provided in Table 8.
The correlation relationships within the structure formed after item deletion are presented in Table 9. The primary objective of conducting this analysis is to identify any potentially inconsistent scale items among the remaining variables. In this respect, items demonstrating a significant correlation of at least 0.50 with at least one other scale item are deemed appropriate.
Step 10: Application of Confirmatory Factor Analysis (CFA)
CFA is essentially utilized for conducting psychometric evaluations and confirming the structure [of a scale]. Furthermore, CFA can also be employed to assess method effects and factor invariance [119]. EFA and CFA are distinct. EFA is a statistical method that simplifies data by reducing the relationships among observable variables to a smaller number of latent variables. EFA is used in examining the structure related to correlation or covariance matrices [120]. EFA is fundamentally data-driven. It is widely criticized on this point because its application does not require any pre-specified hypotheses regarding the scale's factor structure [119]. In contrast, CFA is a statistical method used to test the validity of a theoretical model. Therefore, it holds a clear advantage over EFA [121]. The CFA was performed on the newly identified model, and its visual representation is provided below (Figure 1).
To test the suitability of the scales, CFA was applied using the AMOS 24 program. According to the analysis results, the required criteria are: X2/df < 5, p < 0.05, RMSEA < 0.08, CFI > 0.90, GFI > 0.85, NFI > 0.90, SRMR < 0.08, AVE > 0.50, and CR > 0.70 [114,122,123]. The goodness-of-fit indices for the analysis are provided in Table 10.
The measurement model and factor loadings for the analysis are presented in Table 11.
According to the measurement model, there were no items with a factor loading value below 0.50. The Green Marketing Mix Practice Culture (GMMPC) scale was revealed to consist of three factors and 12 items. The analyses are limited by the participants' ability to understand and respond to the questions. Therefore, the developed scale requires further testing on a larger sample [124,125]. Within this context, the developed scale will be re-tested on a new sample group (387 individuals). The analyses conducted in this scope are presented under the heading "Study 2".
4.2. Study 2
The 3-factor, 12-item scale resulting from the pre-test regarding GMMPC was re-administered to a group of 387 individuals. The analyses were again conducted following the relevant steps outlined by Carpenter [103] in his 10-step process. The demographic characteristics of the sample are presented in Table 12. Accordingly, the majority of the subjects were male. More than half of the subjects were 40 years of age or younger, predominantly held undergraduate degrees, and possessed more than 10 years of work experience. The subjects' tenure within their respective firms was generally less than 5 years. The firms have generally been operational for more than 10 years and employ significantly more than 100 people. Among the firms, those operating in the food and packaging products sector, as well as machinery and parts manufacturing, were more numerous. The majority of the firms utilize digital marketing, and more than half understand the importance of digital marketing. More than half of the firms engage in exporting, but none utilize any carbon offsetting systems. It was observed that more than half of the firms possess moderate to advanced knowledge regarding the European Union's Carbon Border Adjustment Mechanism (CBAM); they also believe that the CBAM will affect their business moderately to significantly. It is understood that most firms lack reverse logistics systems, while more than half use environmental marks or labels on their products, with "eco-friendly" and "recycling" being the most commonly used marks. According to the same table, most firms anticipate an increase in the number of personnel to be employed for green jobs in the future and do not possess ISO 14001 certification.
Following the pre-test of the GMMPC scale, the items corresponding to the resulting sub-dimensions were re-administered via survey to a larger sample (387 individuals). According to Table 13, the following notable findings were obtained: Respondents indicated that the green packaging approach reduces packaging waste ( = 3.76) and results in less damage to materials (such as breakage, spoilage) ( = 3.63). They also stated that they select cleaner transportation systems ( = 3.60), utilize specific environmental criteria for their suppliers ( = 3.58), participate in sponsorship activities related to environmental issues ( = 3.53), and highlight that their products are green in their advertisements ( = 3.49).
Normality analysis was conducted to examine the distribution of data beyond demographic variables.
According to Table 14, the Skewness and Kurtosis values fall within the range of +1.96 to -1.96. Therefore, the sample can be considered normally distributed [114]. Based on the item means for the sample and the normality results, EFA was re-applied to the resulting scale. According to the EFA, the item distribution within the scale is consistent with the previous analysis. PA was conducted on the sample to test for randomness. The results are presented in Table 15.
According to Table 16, KMO = 0.905 (KMO > 0.60), Bartlett’s test of sphericity = 0.000 (Bartlett’s < 0.05), Cronbach's Alpha = 0.912, X2/df < 5, p < 0.05, Average Variance Extracted (AVE) measuring convergent validity > 0.50, and Composite Reliability (CR) > 0.70 [114,115,116]. Thus, the developed scale was again found to meet the appropriate criteria. The goodness-of-fit indices for this analysis are provided in Table 16.
Although some values were observed to decrease and others to increase with the larger sample size, all obtained results remained within the acceptable threshold limits. The required criteria for the analysis results are: RMSEA < 0.08, CFI > 0.90, GFI > 0.85, NFI > 0.90, SRMR < 0.08, AVE > 0.50, and CR > 0.70 [122,123]. Even though the analysis results met the expected values, the Kaiser-Guttman analysis was conducted again to re-test the random distribution of items across the scale's sub-dimensions. According to this analysis, the scale items were found to be distributed across the correct sub-dimensions, and the values are presented in Table 17.
The correlation relationships within the resulting structure are presented in Table 18. The primary objective of conducting this analysis is to identify any potentially inconsistent scale items among the variables. In this regard, items demonstrating a significant correlation of at least 0.50 with at least one other scale item are deemed appropriate.
According to the EFA results, the values were found to meet the expected criteria. However, due to the advantages of CFA compared to EFA, it was necessary to apply CFA to the scale [121]. The visual representation of this analysis is provided below.
According to the measurement model in Table 19, no items were found with a factor loading value below 0.50. The scale, comprising three factors and 12 items, was re-tested. The quality of measurement is often difficult to ascertain in numerous published studies. Typically, little information beyond reliability is reported. According to Shevlin et al. [126], the reliability of a measurement instrument is not, by itself, a sufficient condition for its validity. Indeed, in some cases, reliability coefficients may appear artificially inflated due to measurement errors. This situation can lead to misleading conclusions regarding the validity of the measurement instrument. Such issues are unlikely to be detected through EFA. Although EFA can be reported, CFA provides a statistically stronger foundation for validating a theoretical model [115,116,118,120].
Fundamentally, a scale development study should entail a thorough examination of the research methods employed and potential sources of error. The validity and reliability of a scale depend on a well-structured conceptual framework and a stable factor structure. In this context, scale items should demonstrate consistency with pre-defined conceptual definitions and yield similar results across different samples and applications [127]. Within this framework, measurement invariance analysis covering both samples were conducted.
According to Table 20, the ∆CFI value was found to be below 0.01 in both samples [128]. The developed scale demonstrates invariance and can therefore be considered applicable to larger populations.
As a result of the conducted analyses, the GMMPC scale was finalized, comprising a total of 12 items under three dimensions (factors). The naming of the factors was influenced by the items exhibiting the highest factor loadings and containing common thematic words. Finally, the items pertaining to the GMMPC scale are provided in Table 21.
In this scale, there are no items that require reverse coding, and items can be evaluated based on means. There is no need to evaluate on the total score.
5. Discussion and Conclusion
The primary aim of this study was to understand the current green marketing practices of SMEs and to develop a valid and reliable instrument capable of measuring the level of establishment of these practices within the organization, i.e., the practice culture. Due to the typically different focuses of existing measurement tools in the literature (such as general surveys, Environmental Management Systems assessment tools, etc.), an original scale comprising 12 items and three primary dimensions (“Environmental Promotion”, “Green Packaging”, “Green Distribution”) was developed within the scope of this study specifically to measure the Green Marketing Mix Practice Culture (GMMPC) of SMEs, and its statistical validity and reliability were confirmed. Upon reviewing existing green marketing scales in the literature, significant differences are noticeable in terms of the number of factors, focal points, and naming conventions. For instance, Vilkaite-Vaitone et al. [7] present a broader four-factor structure (Strategy, Internal Marketing, Product, Marketing Communication), whereas Budak and Filiz [8] adapted a two-factor scale (strategic dimension, product dimension) measuring consumer perception. Papadas et al. [1] also proposed a three-dimensional structure (strategic, tactical, internal), but the dimensions differ from those in this study. Chahal et al. [15] concentrated on a larger number of distinct operational/strategic dimensions including "process greening," "green Supply Chain Management," "strategic policy," "energy saving," and "green innovation."
Vilkaite-Vaitone et al. [7] developed the four-dimensional (green strategy, green internal marketing, green product, green marketing communication) 14-item Green Marketing Scale (GMaS) to measure green marketing. While this scale offers a broad organizational perspective by including strategic and internal dimensions, it differs from the Green Marketing Mix Practice Culture (GMMPC) scale developed in the present study, as it does not treat tactical marketing mix elements like price and distribution as separate dimensions. The GMMPC scale provides greater depth at the tactical level compared to GMaS by focusing specifically on the practice cultures of Green Packaging and Green Distribution, which are particularly relevant for SMEs. The Green Marketing Orientation (GMO) scale developed by Papadas et al. [1] provides a comprehensive, multidimensional framework by integrating strategic, tactical, and internal dimensions to assess green marketing as a holistic organizational orientation. In contrast, the Green Marketing Mix Practice Culture (GMMPC) scale developed in the present study offers a more specific and tactically focused approach. While the Papadas et al. [1] scale captures the broader organizational perspective, including strategic decision-making and internal cultural aspects absent in the GMMPC, the latter delves deeper into the practical application culture of key tactical elements – specifically environmental promotion, green packaging, and green distribution – particularly within the context of SMEs.
The dimensions of the scale developed in this study (Environmental Publicity, Green Packaging, Green Distribution) are more specific and focus on the tactical application areas of the marketing mix compared to other scales in the literature. While the “Environmental Promotion” dimension shows partial similarity to the “Green Marketing Communication” dimension of Vilkaite-Vaitone et al. [7] or the “Green Packaging” and “Green Distribution” dimensions, treated as separate factors in this study, focus on areas that may be examined under broader headings like “Green Product” [7,8] or “Supply Chain Management” [15] in some literature or are not specifically emphasized. Furthermore, it differs from the process/market-oriented distinction of Fraj et al. [14], the approach of Qureshi and Mehraj [2] focusing entirely on internal green marketing, and the study by Chen and Yang [12] which primarily presents an audit framework. Consequently, the developed GMMPC scale, unlike other scales in the literature, offers a more concise and tactical-level measurement tool focusing specifically on the green marketing practice culture within firms concerning promotion, packaging, and distribution.
In their research, Huang et al. [129] utilized a two-factor green marketing measurement structure based on Zhang et al. [130], encompassing only 'Product' and 'Promotion' dimensions, rather than developing an original scale. This approach offers a limited tactical perspective by omitting critical marketing mix elements such as price and distribution. In contrast, the Green Marketing Mix Practice Culture (GMMPC) scale developed in the present study is more comprehensive, incorporating 'Green Packaging' and 'Green Distribution' dimensions absent in the approach used by Huang et al. [129]. While the GMMPC's 'Environmental Promotion' dimension parallels Huang et al.'s [129] 'Promotion', its 'Green Packaging' dimension provides a specific focus compared to the broader 'Product' dimension employed by Huang et al. [129]. Akude et al. [131] examined green marketing by treating different practice areas—such as green strategy, green internal marketing, green product, and green marketing communication—as distinct constructs, thereby allowing for the analysis of the independent impact of each on sustainability performance. However, this approach does not yield a single score representing the extent to which green marketing is embraced as a holistic practice culture. In contrast, the Green Marketing Mix Practice Culture (GMMPC) scale developed in the present study focuses on measuring the cultural embeddedness of specific marketing mix practices (Promotion, Packaging, Distribution) under a single construct. While the GMMPC's 'Environmental Promotion' dimension parallels Akude et al.'s 'Green Marketing Communication', its 'Green Packaging' and 'Green Distribution' dimensions offer a specific focus on areas that are either treated separately or subsumed under broader headings like 'Green Product' in Akude et al.'s model. Furthermore, the strategic and internal marketing dimensions included by Akude et al. fall outside the scope of the GMMPC; thus, the GMMPC concentrates on the culture of tactical applications, whereas Akude et al. focus on the performance impact of different practice areas. In a study within the golf club context, Jeong and Song [132] conceptualized green marketing as a single-dimensional, three-item construct measuring customers' direct experiences, utilizing it as a moderator variable. This approach fundamentally differs from the multidimensional GMMPC scale developed in the present study, which focuses on the practice culture of SMEs regarding promotion, packaging, and distribution, rather than customer perception of firms' specific marketing mix practices.
This developed GMMPC scale distinguishes itself from other existing academic scales, particularly through its focus on the tangible application areas of the marketing mix (promotion, packaging, and distribution) and the level of cultural embeddedness of these practices within SMEs. It is believed that this original scale will provide a theoretical contribution both by enriching green marketing theories in the academic field and by enabling clearer measurement of concepts like GMMPC and facilitating comparative research in different contexts (sector, region, firm size, etc.). It also serves as an important practical tool for SME managers and industry representatives. SMEs can use this scale to objectively evaluate their own green marketing performance, identify areas needing improvement, and shape their marketing strategies more consciously in this direction. Thus, the scale can serve to disseminate green marketing practices and increase the level of awareness in this area.
In conclusion, this study and the developed GMMPC scale offer both a theoretical framework and a practical evaluation mechanism for understanding and supporting the green marketing journey of SMEs. As SMEs increasingly need to respond to environmental expectations and achieve sustainability goals, the accurate measurement, understanding, and strategic development of green marketing practice culture will undoubtedly be a critical success factor. This scale is considered a significant step towards enhancing the body of knowledge in the field of green marketing, both in academia and industry, and contributing to a more sustainable future.
6. Theoretical Contribution
Despite previous studies aiming to measure green marketing from diverse perspectives, the need for the scale emerging from this study is apparent. This scale can offer academics a new instrument to deepen theoretical frameworks in the field of green marketing, while also assisting SME managers with practical applications, thereby contributing to green transformation efforts within the sector. By strengthening the theoretical framework in the field of green marketing, this scale can contribute to laying the groundwork for the development of new hypotheses and theories. Offering a robust methodological foundation supported by comprehensive validity and reliability studies, the GMMPC scale can enrich the theoretical framework in the field of green marketing. Consequently, this can facilitate an increase in both the quantity and quality of research conducted on green marketing in Turkey. For instance, it can enable a clearer definition and measurement of concepts such as 'GMMPC'. In other words, this scale can facilitate the conduct of quantitative research in the green marketing field. Researchers can use these scales to conduct comparative studies across different sectors, countries, or companies and measure the effectiveness of green marketing practices. It is anticipated that the scale developed in this study will aid in better understanding the relationships among concepts such as green packaging, green distribution, consumer environmental consciousness, and green product cost. For instance, answers can be sought to questions such as the impact of 'environmental promotion' on consumer environmental consciousness or the effect of 'green packaging' on green product cost. Such scales can lead to the emergence of new research questions in the green marketing field. For example, answers to questions such as 'how does GMMPC differ across various cultures?' can be explored using these scales.
7. Managerial/Practical Implications
The most significant contribution of this study is that the developed scale serves as a tool for evaluating the green marketing practices of SMEs. As also stated by Moravcikova et al. [9], such scales enable firms to evaluate their own green marketing practices and identify their shortcomings. According to Moravcikova et al. [9], such scales are expected to offer businesses an important instrument for evaluating and improving the performance of their green marketing strategies. For instance, a company identifying shortcomings in 'green packaging' can implement improvements in this area. Based on the results of these scales, firms can determine the environmental sensitivity level of their target audience and shape their marketing messages and products accordingly. By improving green marketing practices, companies can gain a competitive advantage. As the number of environmentally conscious consumers increases, the demand for green products and services will also rise. Through these scales, companies can reduce their environmental impacts and potentially increase their long-term profitability.
8. Future Studies
This research may not encompass all relevant studies or the latest developments in sustainable marketing. The research findings are based solely on SMEs operating in the Ankara Ostim OSB. The success of sustainable marketing strategies may be influenced by regional differences in environmental awareness and customer preferences, which could affect the applicability of the research findings. Consequently, the findings may not be representative of local businesses and their environment across all of Turkey. The quantitative methodology employed is insufficient for making statistical generalizations.
Further application and testing of the developed scale in a broader context are necessary. Therefore, future studies could apply the scale among other SME managers across Turkey using a more systematic sampling approach to enhance its validity. Utilizing the GMMPC scale, future research could better elucidate various aspects of green marketing essential for successfully managing sustainability issues in corporate settings, thereby strengthening environmentally and ethically acceptable manifestations of green marketing. This scale can help reveal more clearly the extent to which organizations have embraced green marketing cultures. Specifically, by conducting comparative studies on the green marketing practices of SMEs, opportunities for this segment to achieve sustainability goals can be better understood. Furthermore, comparing green marketing practices across different sectors can contribute to identifying cross-sector best practices and accelerating green transformation. Through this, enhancing the body of knowledge in the field of green marketing can encourage efforts towards a more sustainable future in both academia and the business world. Scales developed in future studies could focus on measuring different dimensions of green marketing separately (e.g., product design, production processes, marketing strategies). This would enable the identification of areas where SMEs exhibit strengths or weaknesses.
Author Contributions
Conceptualization: C.Ö.A and M.S.S.; methodology: C.Ö.A and M.S.S.; validation: C.Ö.A.; formal analysis: C.Ö.A.; investigation: all authors; resources: all authors; data curation: all authors; writing—original draft preparation: all authors; writing—review and editing: all authors; visualization, all authors; supervision, all authors; project administration, all authors; funding acquisition, all authors. All authors have read and agreed to the published version of the manuscript.
Funding
This study received no external funding.
Institutional Review Board Statement
To collect data, the necessary permission/approval was obtained from the Scientific Research and Publication Ethics Committee of Tekirdag Namik Kemal University with the official letter dated 1 March 2024, and numbered 420305.
Informed Consent Statement
Informed consent was obtained from all subjects involved in this study.
Data Availability Statement
The data that support the findings of this study are available from the corresponding author upon reasonable request.
Acknowledgments
Thank you to all the participants. We would like to thank Google AI Studio for English language editing.
Conflicts of Interest
The author, Candan Özgün AYAR, has been a public servant for many years and works as “Ankara Provincial Directorate of Labor and Employment Agency OSTİM Service Center Business and career counselor”. The author receives only a salary from this institution. No financial support was received from the organization for the research. All authors declare that the research was conducted without any commercial or financial relationship that could be constructed as a potential conflict of interest.
Appendix A
Table A1.
Expert assessment of the GMMPC item pool.
| No | Statements | Expert opinions | ||
| Number of experts who said "Not Necessary” | Number of experts who said "should be corrected | Number of experts who said “Necessary” | ||
| 1 | We design products to save energy with reduced materials | 0 | 1 | 9 |
| 2 | Choosing packaging materials from biodegradable products is effective in increasing the sales of the enterprise. | 0 | 1 | 9 |
| 3 | With the green packaging approach, our materials are less damaged (such as breakage, deterioration) | 0 | 1 | 9 |
| 4 | Green packaging approach reduces our packaging waste | 0 | 0 | 10 |
| 5 | Green packaging practices make our products even lighter. | 0 | 0 | 10 |
| 6 | Green packaging practices reduce costs. | 0 | 1 | 9 |
| 7 | We use recycled materials in our products. | 0 | 0 | 10 |
| 8 | We consider environmental issues in distribution. | 4 | 4 | 2 |
| 9 | We consider the environment when designing the product. | 0 | 0 | 10 |
| 10 | We use ecological green materials in production. | 0 | 1 | 9 |
| 11 | Our suppliers' products are recyclable | 0 | 1 | 9 |
| 12 | We advertise our green products. | 3 | 0 | 7 |
| 13 | We use renewable energy sources in production | 0 | 0 | 10 |
| 14 | Our company offers innovative green products to the market. | 0 | 0 | 10 |
| 15 | Green products provide our company with the opportunity to differentiate. | 0 | 1 | 9 |
| 16 | The raw materials we use are safe for the environment. | 0 | 1 | 9 |
| 17 | We try to use less material in packaging | 0 | 2 | 8 |
| 18 | Our company produces environmentally friendly products | 0 | 1 | 9 |
| 19 | Environment is the main criterion for supplier selection. | 0 | 1 | 9 |
| 20 | We support the green environmental components of the product. | 0 | 1 | 9 |
| 21 | A separate unit that monitors environmental costs has been established in our organization. | 0 | 1 | 9 |
| 22 | The use of recycled materials in the enterprise reduces costs. | 0 | 1 | 9 |
| 23 | Customers are willing to pay higher prices for green products. | 2 | 3 | 5 |
| 24 | Our customers are willing to pay high prices for green products. | 0 | 1 | 9 |
| 25 | We take environmental factors into account in price policy. | 0 | 1 | 9 |
| 26 | We use local products to reduce transport costs. | 0 | 1 | 9 |
| 27 | Green packaging practices make our products lighter | 0 | 2 | 8 |
| 28 | We cover the additional cost of an environmentally friendly product. | 0 | 1 | 9 |
| 29 | We consider environmental issues in distribution. | 0 | 1 | 9 |
| 30 | We encourage the use of e-commerce as it is more environmentally friendly. | 0 | 2 | 8 |
| 31 | The environmental damage of our distribution channel is minimized. | 0 | 3 | 7 |
| 32 | We use electronic information systems in green transport. | 0 | 0 | 10 |
| 33 | Thanks to green transport, we use less fuel. | 0 | 1 | 9 |
| 34 | Thanks to green transport, we can reduce costs by saving time on the delivery route | 0 | 1 | 9 |
| 35 | We monitor emissions from the distribution of the product. | 0 | 0 | 10 |
| 36 | The environmental aspect of our products is at the forefront in marketing. | 0 | 1 | 9 |
| 37 | Our environmentally friendly practices are updated on our website. | 0 | 0 | 10 |
| 38 | Our company chooses packaging materials from degradable products. | 0 | 0 | 10 |
| 39 | The profit margin has increased because of material reduction in the provision of services. | 6 | 0 | 4 |
| 40 | Our business uses the environmentally friendly green label. | 0 | 0 | 10 |
| 41 | The labels contain information on recycling. | 0 | 0 | 10 |
| 42 | We prevent the use of dangerous substances in packaging. | 0 | 1 | 9 |
| 43 | The amount of goods is minimized to increase delivery flexibility. | 0 | 1 | 9 |
| 44 | The warehouse of our company is organized environmentally friendly methods. | 0 | 0 | 10 |
| 45 | The use of environmentally friendly green labels is effective in increasing business sales. | 2 | 2 | 6 |
| 46 | We choose cleaner transport systems | 0 | 0 | 10 |
| 47 | We use green arguments in marketing communication. | 0 | 1 | 9 |
| 48 | Our marketing communication reflects the company's commitment to the environment. | 0 | 0 | 10 |
| 49 | Environmental claims in advertising are often met with criticism from the environment (competitors, consumer organizations, etc.). | 0 | 1 | 9 |
| 50 | We support the green environmental components of the product. | 0 | 2 | 8 |
| 51 | Environmental labelling is an effective promotional tool for our company. | 0 | 1 | 9 |
| 52 | We inform consumers about environmental management in the company | 0 | 0 | 10 |
| 53 | We participate in sponsorship activities on environmental issues. | 1 | 0 | 9 |
| 54 | We use specific environmental criteria for our suppliers. | 0 | 0 | 10 |
| 55 | We prevent the use of hazardous substances in the packaging of the product | 4 | 2 | 4 |
| 56 | We implement a paperless policy in our procurement as much as possible. | 1 | 0 | 9 |
| 57 | We emphasize the image of "environmentally friendly business" in promotional activities | 0 | 0 | 10 |
| 58 | Our company uses statements reflecting the reality of the product advertisements. | 0 | 0 | 10 |
| 59 | Our image as an environmentally friendly company gives us a competitive advantage. | 0 | 1 | 9 |
| 60 | We emphasize in our advertisements that our products are green. | 0 | 1 | 9 |
| 61 | The product packaging is colored green, which is identical to the environment. | 0 | 0 | 10 |
| 62 | Our product promotions include environmental protection activities. | 0 | 0 | 10 |
| 63 | We aim to minimize negative impacts on the environment throughout the product life cycle. | 1 | 2 | 7 |
| 64 | The use of Information Technologies in the enterprise reduces distribution costs | 0 | 1 | 9 |
| 65 | We make sure that recycled materials are used in production. | 0 | 2 | 8 |
| 66 | The production process in our enterprise is based on ISO 14001 certification. | 0 | 0 | 10 |
| 67 | Customers want the company to produce green products. | 5 | 1 | 4 |
| 68 | When promoting products, we prefer digital communication as it is more environmentally friendly | 0 | 0 | 10 |
| 69 | It is normal for green products to be priced slightly higher than other products. | 0 | 1 | 9 |
| 70 | We use environmentally friendly technologies in the production process | 0 | 5 | 5 |
| 71 | We use recycled materials for packaging. | 0 | 0 | 10 |
| 72 | Our company tries to convince its customers to be environmentally conscious during direct sales. | 2 | 3 | 5 |
| 73 | Our company tries to convince its customers to be environmentally sensitive during direct sales. | 0 | 1 | 9 |
| 74 | We utilize green vehicles in the distribution channel. | 0 | 0 | 10 |
| 75 | We can reduce our costs with green transport | 2 | 3 | 6 |
| 76 | We design for remanufacturing so that waste can be recycled. | 0 | 1 | 9 |
| 77 | The enterprise uses minimal packaging materials. | 5 | 4 | 2 |
| 78 | We use integrated transport systems in distribution | 0 | 1 | 9 |
| 79 | Our business is trying to reduce the use of packaging. | 0 | 0 | 10 |
| 80 | Producing green products increases costs | 0 | 3 | 7 |
| 81 | The company co-operates with environmental groups to effectively promote a "green image" | 0 | 1 | 9 |
| 82 | We minimize our waste in production | 0 | 1 | 9 |
References
- Papadas, K.-K.; Avlonitis, G.J.; Carrigan, M. Green Marketing Orientation: Conceptualization, Scale Development and Validation. Journal of Business Research 2017, 80, 236–246. [Google Scholar] [CrossRef]
- Qureshi, I.H.; Mehraj, D. Identifying the Factors of Internal Green Marketing: A Scale Development and Psychometric Evaluation Approach. International Journal of Manpower 2021, 43, 786–804. [Google Scholar] [CrossRef]
- Davari, A.; and Strutton, D. Marketing Mix Strategies for Closing the Gap between Green Consumers’ pro-Environmental Beliefs and Behaviors. Journal of Strategic Marketing 2014, 22, 563–586. [Google Scholar] [CrossRef]
- Grimmer, M.; and Woolley, M. Green Marketing Messages and Consumers’ Purchase Intentions: Promoting Personal versus Environmental Benefits. Journal of Marketing Communications 2014, 20, 231–250. [Google Scholar] [CrossRef]
- Reich, B.J.; Soule, C.A.A. Green Demarketing in Advertisements: Comparing “Buy Green” and “Buy Less” Appeals in Product and Institutional Advertising Contexts. Journal of Advertising 2016, 45, 441–458. [Google Scholar] [CrossRef]
- Selvi, M.S.; Önem, Ş. Impact of Variables in the UTAUT 2 Model on the Intention to Use a Fully Electric Car. Sustainability 2025, 17, 3214. [Google Scholar] [CrossRef]
- Vilkaite-Vaitone, N.; Skackauskiene, I.; Díaz-Meneses, G. Measuring Green Marketing: Scale Development and Validation. Energies 2022, 15, 718. [Google Scholar] [CrossRef]
- Budak, O.; Filiz, M. Yeşil Pazarlama Ölçeğinin Türkçe Geçerlik ve Güvenirlik Çalışması. ESAD 2023, 19, 425–437. [Google Scholar]
- Moravcikova, D.; Krizanova, A.; Kliestikova, J.; Rypakova, M. Green Marketing as the Source of the Competitive Advantage of the Business. Sustainability 2017, 9, 2218. [Google Scholar] [CrossRef]
- Bailey, A.A.; Mishra, A.S.; Tiamiyu, M.F. Application of GREEN Scale to Understanding US Consumer Response to Green Marketing Communications. Psychology & Marketing 2018, 35, 863–875. [Google Scholar] [CrossRef]
- Haws, K.L.; Winterich, K.P.; Naylor, R.W. Seeing the World through GREEN-Tinted Glasses: Green Consumption Values and Responses to Environmentally Friendly Products. Journal of Consumer Psychology 2014, 24, 336–354. [Google Scholar] [CrossRef]
- Chen, H.-C.; Yang, C.-H. Applying a Multiple Criteria Decision-Making Approach to Establishing Green Marketing Audit Criteria. Journal of Cleaner Production 2019, 210, 256–265. [Google Scholar] [CrossRef]
- Eyadat, A.A.; Almuhana, M.; Al-Bataineh, T. The Role of Green Marketing Strategies for a Competitive Edge: A Case Study about Analysis of Leading Green Companies in Jordan. Business Strategy & Development 2024, 7, e70000. [Google Scholar] [CrossRef]
- Fraj, E.; Martínez, E.; Matute, J. Green Marketing in B2B Organisations: An Empirical Analysis from the Natural-resource-based View of the Firm. Journal of Business & Industrial Marketing 2013, 28, 396–410. [Google Scholar] [CrossRef]
- Chahal, H.; Dangwal, R.; Raina, S. Conceptualisation, Development and Validation of Green Marketing Orientation (GMO) of SMEs in India: A Case of Electric Sector. Journal of Global Responsibility 2014, 5, 312–337. [Google Scholar] [CrossRef]
- Crane, A. Facing the Backlash: Green Marketing and Strategic Reorientation in the 1990s. Journal of Strategic Marketing 2000, 8, 277–296. [Google Scholar] [CrossRef]
- Dangelico, R.M.; Vocalelli, D. “Green Marketing”: An Analysis of Definitions, Strategy Steps, and Tools through a Systematic Review of the Literature. Journal of Cleaner Production 2017, 165, 1263–1279. [Google Scholar] [CrossRef]
- Polonsky, M.J.; Rosenberger, P.J. Reevaluating Green Marketing: A Strategic Approach. Business Horizons 2001, 44, 21–30. [Google Scholar] [CrossRef]
- Peattie, K. Towards Sustainability: The Third Age of Green Marketing. The Marketing Review 2001, 2, 129–146. [Google Scholar] [CrossRef]
- Jain, S.K.; Kaur, G. Green Marketing: An Attitudinal and Behavioural Analysis of Indian Consumers. Global Business Review 2004, 5, 187–205. [Google Scholar] [CrossRef]
- Chamorro, A.; Bañegil, T.M. Green Marketing Philosophy: A Study of Spanish Firms with Ecolabels. Corporate Social Responsibility and Environmental Management 2006, 13, 11–24. [Google Scholar] [CrossRef]
- Astuti, K.; Batubara, H.M.; Rosalina, R.; Evanita, S.; Friyatmi, F. Effect of Green Marketing Mix on Purchase Intention: Moderating Role of Environmental Knowledge. Jurnal Apresiasi Ekonomi 2024, 12, 238–239. [Google Scholar] [CrossRef]
- Mahmoud, T.O. Impact of Green Marketing Mix on Purchase Intention. International Journal of Advanced and Applied Sciences 2018, 5, 127–135. [Google Scholar] [CrossRef]
- Han, J.; Prabhakar, G.; Luo, X.; Tseng, H.-T. Exploring Generation Z Consumers’ Purchase Intention towards Green Products during the COVID-19 Pandemic in China. e-Prime - Advances in Electrical Engineering, Electronics and Energy 2024, 8, 100552. [Google Scholar] [CrossRef]
- Jave-Chire, M.; Alvarez-Risco, A.; Guevara-Zavaleta, V. Footwear Industry’s Journey through Green Marketing Mix, Brand Value and Sustainability. Sustainable Futures 2025, 9, 100561. [Google Scholar] [CrossRef]
- Sdrolia, E.; Zarotiadis, G. A Comprehensive Review for Green Product Term: From Definition to Evaluation. Journal of Economic Surveys 2019, 33, 150–178. [Google Scholar] [CrossRef]
- Tsai, P.-H.; Lin, G.-Y.; Zheng, Y.-L.; Chen, Y.-C.; Chen, P.-Z.; Su, Z.-C. Exploring the Effect of Starbucks’ Green Marketing on Consumers’ Purchase Decisions from Consumers’ Perspective. Journal of Retailing and Consumer Services 2020, 56, 102162. [Google Scholar] [CrossRef]
- Costa, C.S.R.; Costa, M.F. da; Maciel, R.G.; Aguiar, E.C.; Wanderley, L.O. Consumer Antecedents towards Green Product Purchase Intentions. Journal of Cleaner Production 2021, 313, 127964. [Google Scholar] [CrossRef]
- Kotler, P. Reinventing Marketing to Manage the Environmental Imperative. Journal of Marketing 2011, 75, 132–135. [Google Scholar] [CrossRef]
- Vijaya, P.; Sivakoti Reddy, M. Analyzing the Effect of Product, Promotion and Decision Factors in Determining Green Purchase Intention: An Empirical Analysis. International Journal of Psychosocial Rehabilitation 2020, 24, 84–90. [Google Scholar] [CrossRef]
- Agustini, M.; Baloran,Anna; Bagano,April; Tan,Ana; Athanasius,Sentot; and Retnawati, B. Green Marketing Practices and Issues: A Comparative Study of Selected Firms in Indonesia and Philippines. Journal of Asia-Pacific Business 2021, 22, 164–181. [Google Scholar] [CrossRef]
- Karunarathna, A.; Bandara, V.; Silva, A.; De Mel, D. Impact of Green Marketing Mix on Customers’ Green Purchasing Intention with Special Reference to Sri Lankan Supermarkets; 2020. [CrossRef]
- Peattie, K.; Crane, A. Green Marketing: Legend, Myth, Farce or Prophesy? Qualitative Market Research: An International Journal 2005, 8, 357–370. [Google Scholar] [CrossRef]
- Alharthey, B.K. Impact of Green Marketing Practices on Consumer Purchase Intention and Buying Decision with Demographic Characteristics as Moderator. International Journal of Advanced and Applied Sciences 2019, 6, 62–71. [Google Scholar] [CrossRef]
- Bhardwaj, A.K.; Garg, A.; Ram, S.; Gajpal, Y.; Zheng, C. Research Trends in Green Product for Environment: A Bibliometric Perspective. International Journal of Environmental Research and Public Health 2020, 17, 8469. [Google Scholar] [CrossRef]
- Mukonza, C.; Swarts, I. The Influence of Green Marketing Strategies on Business Performance and Corporate Image in the Retail Sector. Business Strategy and the Environment 2020, 29, 838–845. [Google Scholar] [CrossRef]
- Kim, M.-K.; Oh, J.; Park, J.-H.; Joo, C. Perceived Value and Adoption Intention for Electric Vehicles in Korea: Moderating Effects of Environmental Traits and Government Supports. Energy 2018, 159, 799–809. [Google Scholar] [CrossRef]
- Wahyuningtiyas, N.; Novianto, A.S. The Impact of Green Price, Green Promotion, and Green Place on the Economy of Communities in Tourism Areas through Environmental Sustainability Entering the New Normal. Quantitative Economics and Management Studies 2023, 4, 128–138. [Google Scholar] [CrossRef]
- Spencer Banzhaf, H. Green Price Indices. Journal of Environmental Economics and Management 2005, 49, 262–280. [Google Scholar] [CrossRef]
- Stiglitz, J.E. Addressing Climate Change through Price and Non-Price Interventions. European Economic Review 2019, 119, 594–612. [Google Scholar] [CrossRef]
- Leonidou, C.N.; Katsikeas, C.S.; Morgan, N.A. “Greening” the Marketing Mix: Do Firms Do It and Does It Pay Off? J. of the Acad. Mark. Sci. 2013, 41, 151–170. [Google Scholar] [CrossRef]
- Peattie, K. Rethinking Marketing: Shifting to a Greener Paradigm. In Greener Marketing; Routledge, 1999 ISBN 978-1-351-28308-3.
- Trujillo, A.; Arroyo, P.; Carrete, L. Do Environmental Practices of Enterprises Constitute an Authentic Green Marketing Strategy? A Case Study from Mexico. International Journal of Business and Management 2014, 9, p175. [Google Scholar] [CrossRef]
- Önem, Ş.; Selvi, M.S. Scale Development on the Effect of Social Media Influencers on Purchase Intention. MAKU IIBFD 2024, 11, 819–836. [Google Scholar] [CrossRef]
- Nguyen-Viet, B. The Impact of Green Marketing Mix Elements on Green Customer Based Brand Equity in an Emerging Market. Asia-Pacific Journal of Business Administration 2022, 15, 96–116. [Google Scholar] [CrossRef]
- Novela, S.; Novita; Hansopaheluwakan, S. Analysis of Green Marketing Mix Effect on Customer Satisfaction Using 7p Approach. Pertanika Journal of Social Sciences & Humanities 2018, 26, 131–144. [Google Scholar]
- Soelton, M.; Rohman, F.; Asih, D.; Saratian, E.T.P.; Wiguna, S.B. Green Marketing That Effect the Buying Intention Healthcare Products. European Journal of Business and Management 2020, 12, 1–8. [Google Scholar]
- Lyu, S.O. Unveiling Willingness to Pay for Green Stadiums: Insights from a Choice Experiment. Journal of Cleaner Production 2024, 434, 139985. [Google Scholar] [CrossRef]
- Shi, J.; Jiang, Z. Willingness to Pay a Premium Price for Green Products: Does a Reference Group Matter? Environ Dev Sustain 2023, 25, 8699–8727. [Google Scholar] [CrossRef]
- Yang, M.; Chen, H.; Long, R.; Wang, Y.; Hou, C.; Liu, B. Will the Public Pay for Green Products? Based on Analysis of the Influencing Factors for Chinese’s Public Willingness to Pay a Price Premium for Green Products. Environ Sci Pollut Res 2021, 28, 61408–61422. [Google Scholar] [CrossRef]
- Gelderman, C.J.; Schijns, J.; Lambrechts, W.; Vijgen, S. Green Marketing as an Environmental Practice: The Impact on Green Satisfaction and Green Loyalty in a Business-to-Business Context. Business Strategy and the Environment 2021, 30, 2061–2076. [Google Scholar] [CrossRef]
- Shahsavar, T.; Kubeš, V.; Baran, D. Willingness to Pay for Eco-Friendly Furniture Based on Demographic Factors. Journal of Cleaner Production 2020, 250, 119466. [Google Scholar] [CrossRef]
- Meet, R.K.; Kundu, N.; Ahluwalia, I.S. Does Socio Demographic, Green Washing, and Marketing Mix Factors Influence Gen Z Purchase Intention towards Environmentally Friendly Packaged Drinks? Evidence from Emerging Economy. Journal of Cleaner Production 2024, 434, 140357. [Google Scholar] [CrossRef]
- Mahmoud, M.A.; Seidu, A.S.; Tweneboah-Koduah, E.Y.; Ahmed, A.S. Green Marketing Mix and Repurchase Intention: The Role of Green Knowledge. African Journal of Economic and Management Studies 2024, 15, 501–518. [Google Scholar] [CrossRef]
- Liu, P.; Yi, S. Pricing Policies of Green Supply Chain Considering Targeted Advertising and Product Green Degree in the Big Data Environment. Journal of Cleaner Production 2017, 164, 1614–1622. [Google Scholar] [CrossRef]
- Rahmani, K.; Yavari, M. Pricing Policies for a Dual-Channel Green Supply Chain under Demand Disruptions. Computers & Industrial Engineering 2019, 127, 493–510. [Google Scholar] [CrossRef]
- Ferraro, P.J.; Uchida, T.; Conrad, J.M. Price Premiums for Eco-Friendly Commodities: Are ‘Green’ Markets the Best Way to Protect Endangered Ecosystems? Environ Resource Econ 2005, 32, 419–438. [Google Scholar] [CrossRef]
- Ottman, J.A.; Stafford,Edwin R. ; and Hartman, C.L. Avoiding Green Marketing Myopia: Ways to Improve Consumer Appeal for Environmentally Preferable Products. Environment: Science and Policy for Sustainable Development 2006, 48, 22–36. [Google Scholar] [CrossRef]
- Cheng, Q.; Yang, J. Is Green Place-Based Policy Effective in Mitigating Pollution? Firm-Level Evidence from China. Economic Analysis and Policy 2024, 83, 530–547. [Google Scholar] [CrossRef]
- Ahmed, R.R.; Streimikiene, D.; Qadir, H.; Streimikis, J. Effect of Green Marketing Mix, Green Customer Value, and Attitude on Green Purchase Intention: Evidence from the USA. Environ Sci Pollut Res 2023, 30, 11473–11495. [Google Scholar] [CrossRef]
- Mahmoud, T.; Ibrahim, S.; Hasaballah, A.H.; Bleady, A. The Influence of Green Marketing Mix on Purchase Intention: The Mediation Role of Environmental Knowledge. International Journal of Scientific and Engineering Research 2017, 8, 1040–1048. [Google Scholar] [CrossRef]
- Demir, B.; Akdemir, M.A.; Kara, A.U.; Sagbas, M.; Sahin, Y.; Topcuoglu, E. The Mediating Role of Green Innovation and Environmental Performance in the Effect of Green Transformational Leadership on Sustainable Competitive Advantage. Sustainability 2025, 17, 1407. [Google Scholar] [CrossRef]
- Zhang, H.; Zhang, Z.; Pu, X.; Li, Y. Green Manufacturing Strategy Considering Retailers’ Fairness Concerns. Sustainability 2019, 11, 4646. [Google Scholar] [CrossRef]
- Gustavo, J.U.; Trento, L.R.; de Souza, M.; Pereira, G.M.; Lopes de Sousa Jabbour, A.B.; Ndubisi, N.O.; Chiappetta Jabbour, C.J.; Borchardt, M.; Zvirtes, L. Green Marketing in Supermarkets: Conventional and Digitized Marketing Alternatives to Reduce Waste. Journal of Cleaner Production 2021, 296, 126531. [Google Scholar] [CrossRef]
- Al-Majali, M.; Tarabieh, S. Effect of Internal Green Marketing Mix Elements on Customers’ Satisfaction in Jordan: Mu’tah University Students. Jordan Journal of Business Administration 2020, 16. [Google Scholar]
- Hernández-López, L.E.; Álamo-Vera, F.R.; Ballesteros-Rodríguez, J.L.; De Saá-Pérez, P. Socialization of Business Students in Ethical Issues: The Role of Individuals’ Attitude and Institutional Factors. The International Journal of Management Education 2020, 18, 100363. [Google Scholar] [CrossRef]
- Ricci, E.C.; Banterle, A.; Stranieri, S. Trust to Go Green: An Exploration of Consumer Intentions for Eco-Friendly Convenience Food. Ecological Economics 2018, 148, 54–65. [Google Scholar] [CrossRef]
- Ramanathan, U.; Bentley, Y.; Pang, G. The Role of Collaboration in the UK Green Supply Chains: An Exploratory Study of the Perspectives of Suppliers, Logistics and Retailers. Journal of Cleaner Production 2014, 70, 231–241. [Google Scholar] [CrossRef]
- Tao, F.; Zhou, Y.; Bian, J.; Lai, K.K. Optimal Channel Structure for a Green Supply Chain with Consumer Green-Awareness Demand. Ann Oper Res 2023, 324, 601–628. [Google Scholar] [CrossRef]
- Oktaysoy, O.; Topcuoglu, E.; Ozgen-Cigdemli, A.O.; Kaygin, E.; Kosa, G.; Turan-Torun, B.; Kobanoglu, M.S.; Uygungil-Erdogan, S. The Mediating Role of Job Satisfaction in the Effect of Green Transformational Leadership on Intention to Leave the Job. Front. Psychol. 2025, 16, 1490203. [Google Scholar] [CrossRef]
- Vaibhav, R.; Bhalerao, V.; Deshmukh, A. Green Marketing: Greening the 4 Ps of Marketing. International Journal of Knowledge and Research in Management and E-Commerce 2015, 5, 5–8. [Google Scholar]
- Yan, Y.K.; Yazdanifard, R. The Concept of Green Marketing and Green Product Development on Consumer Buying Approach. Global Journal of Commerce & Management Perspective 2014, 3, 33–38. [Google Scholar]
- Arseculeratne, D.; Yazdanifard, R. How Green Marketing Can Create a Sustainable Competitive Advantage for a Business. International Business Research 2013, 7, p130. [Google Scholar] [CrossRef]
- Herbes, C.; Beuthner, C.; Ramme, I. How Green Is Your Packaging—A Comparative International Study of Cues Consumers Use to Recognize Environmentally Friendly Packaging. International Journal of Consumer Studies 2020, 44, 258–271. [Google Scholar] [CrossRef]
- Pan, C.; Lei, Y.; Wu, J.; Wang, Y. The Influence of Green Packaging on Consumers’ Green Purchase Intention in the Context of Online-to-Offline Commerce. Journal of Systems and Information Technology 2021, 23, 133–153. [Google Scholar] [CrossRef]
- Shabbir, M.S.; Bait Ali Sulaiman, M.A.; Hasan Al-Kumaim, N.; Mahmood, A.; Abbas, M. Green Marketing Approaches and Their Impact on Consumer Behavior towards the Environment—A Study from the UAE. Sustainability 2020, 12, 8977. [Google Scholar] [CrossRef]
- Antonysamy, K.; Paulraj, G. Examining the Effects of Green Attitude on the Purchase Intention of Sustainable Packaging. Sustainability, Agri, Food and Environmental Research-DISCONTINUED 2023, 12. [Google Scholar] [CrossRef]
- Prakash, G.; Choudhary, S.; Kumar, A.; Garza-Reyes, J.A.; Khan, S.A.R.; Panda, T.K. Do Altruistic and Egoistic Values Influence Consumers’ Attitudes and Purchase Intentions towards Eco-Friendly Packaged Products? An Empirical Investigation. Journal of Retailing and Consumer Services 2019, 50, 163–169. [Google Scholar] [CrossRef]
- Roh, T.; Noh, J.; Oh, Y.; Park, K.-S. Structural Relationships of a Firm’s Green Strategies for Environmental Performance: The Roles of Green Supply Chain Management and Green Marketing Innovation. Journal of Cleaner Production 2022, 356, 131877. [Google Scholar] [CrossRef]
- Sharma, A.P. Consumers’ Purchase Behaviour and Green Marketing: A Synthesis, Review and Agenda. International Journal of Consumer Studies 2021, 45, 1217–1238. [Google Scholar] [CrossRef]
- Hasan, Z.; Ali, N.A. The Impact of Green Marketing Strategy on the Firm’s Performance in Malaysia. Procedia - Social and Behavioral Sciences 2015, 172, 463–470. [Google Scholar] [CrossRef]
- Zhao, Y.; Huang, W.; Xu, E.; Xu, X. Pricing and Green Promotion Decisions in a Retailer-Owned Dual-Channel Supply Chain with Multiple Manufacturers. Cleaner Logistics and Supply Chain 2023, 6, 100092. [Google Scholar] [CrossRef]
- Sohail, M.S. Green Marketing Strategies: How Do They Influence Consumer-Based Brand Equity? JGBA 2017, 10, 229. [Google Scholar] [CrossRef]
- Hossain, M.; Rahman, Md.S. Measuring the Impact of Green Marketing Mix on Green Purchasing Behavior: A Study on Bangladeshi Consumers. The Comilla University Journal of Business Studies 2018, 5, 4–19. [Google Scholar]
- Kumar, P. State of Green Marketing Research over 25 Years (1990-2014): Literature Survey and Classification. Marketing Intelligence & Planning 2016, 34, 137–158. [Google Scholar] [CrossRef]
- Kim, W.-H.; Malek, K.; Roberts, K.R. The Effectiveness of Green Advertising in the Convention Industry: An Application of a Dual Coding Approach and the Norm Activation Model. Journal of Hospitality and Tourism Management 2019, 39, 185–192. [Google Scholar] [CrossRef]
- Dinh, K.C.; Nguyen-Viet,Bang; and Phuong Vo, H. N. Toward Sustainable Development and Consumption: The Role of the Green Promotion Mix in Driving Green Brand Equity and Green Purchase Intention. Journal of Promotion Management 2023, 29, 824–848. [Google Scholar] [CrossRef]
- Said, S.; Gani, A.; Taufan, R.; Syahnur, H.; Basalamah, J. Green Marketing Practice In Purchasing Decision Home Care Product. International Journal of Scientific & Technology Research 2020, 9, 893–896. [Google Scholar]
- Ding, H.; Su, W.; Hahn, J. How Green Transformational Leadership Affects Employee Individual Green Performance—A Multilevel Moderated Mediation Model. Behavioral Sciences 2023, 13, 887. [Google Scholar] [CrossRef]
- Junior, S.B.; Martínez, M.P.; Correa, C.M.; Moura-Leite, R.C.; Silva, D.D. Greenwashing Effect, Attitudes, and Beliefs in Green Consumption. RAUSP Management Journal 2019, 54, 226–241. [Google Scholar] [CrossRef]
- Lin, S.-T.; Niu, H.-J. Green Consumption: Environmental Knowledge, Environmental Consciousness, Social Norms, and Purchasing Behavior. Business Strategy and the Environment 2018, 27, 1679–1688. [Google Scholar] [CrossRef]
- Sun, Y.; Li, T.; Wang, S. “I Buy Green Products for My Benefits or Yours”: Understanding Consumers’ Intention to Purchase Green Products. Asia Pacific Journal of Marketing and Logistics 2021, 34, 1721–1739. [Google Scholar] [CrossRef]
- Belz, F.-M.; Peattie, K. Sustainability Marketing: A Global Perspective; John Wiley & Sons, 2012; ISBN 978-1-119-96619-7.
- Nguyen–Viet, B.; and Nguyen Anh, T. Green Marketing Functions: The Drivers of Brand Equity Creation in Vietnam. Journal of Promotion Management 2022, 28, 1055–1076. [Google Scholar] [CrossRef]
- Hao, Y.; Liu, H.; Chen, H.; Sha, Y.; Ji, H.; Fan, J. What Affect Consumers’ Willingness to Pay for Green Packaging? Evidence from China. Resources, Conservation and Recycling 2019, 141, 21–29. [Google Scholar] [CrossRef]
- Panda, D.; Masani, S.; Dasgupta, T. Packaging-Influenced-Purchase Decision Segment the Bottom of the Pyramid Consumer Marketplace? Evidence from West Bengal, India. Asia Pacific Management Review 2022, 27, 145–153. [Google Scholar] [CrossRef]
- Coşkun, R.; Altunışık, R.; Bayraktaroğlu, S.; Yıldırım, E. Research Methods in Social Sciences: SPSS Applications; 8th Edition.; Sakarya Publishing: Sakarya, 2015. [Google Scholar]
- Burns, A.C.; Bush, R.F. Marketing Research; Pearson/Prentice Hall, 2005; ISBN 978-0-13-228035-8.
- OSTİM OSTİM Hakkında. Available online: https://www.ostim.org.tr/sizin-fabrikaniz-ostim (accessed on 29 April 2025).
- Yazıcıoğlu, Y.; Erdoğan, S. SPSS Uygulamalı Bilimsel Araştırma Yöntemleri; 4th ed.; Detay Yayıncılık: Ankara, 2014. [Google Scholar]
- Sekeran, U. Research Methods for Business: A Skill-Building Approach; John Wiley & Sons: New York, 1992. [Google Scholar]
- Israel, G.D. Determining Sample Size. Available online: https://www.gjimt.ac.in/wp-content/uploads/2017/10/2_Glenn-D.-Israel_Determining-Sample-Size.pdf (accessed on 20 February 2025).
- Carpenter, S. Ten Steps in Scale Development and Reporting: A Guide for Researchers. Communication Methods and Measures 2018. [Google Scholar] [CrossRef]
- Abeele, V.V.; Spiel, K.; Nacke, L.; Johnson, D.; Gerling, K. Development and Validation of the Player Experience Inventory: A Scale to Measure Player Experiences at the Level of Functional and Psychosocial Consequences. International Journal of Human-Computer Studies 2020, 135, 102370. [Google Scholar] [CrossRef]
- Soulard, J.; McGehee, N.; Knollenberg, W. Developing and Testing the Transformative Travel Experience Scale (TTES). Journal of Travel Research 2021, 60, 923–946. [Google Scholar] [CrossRef]
- Önem, Ş.; Selvi, M.S. General Attitude Scale for Social Media Influencers. MMI 2024, 15, 122–139. [Google Scholar] [CrossRef]
- Lawshe, C.H. A Quantitative Approach to Content Validity. Personnel Psychology 1975, 28, 563–575. [Google Scholar] [CrossRef]
- Ayre, C.; Scally, A.J. Critical Values for Lawshe’s Content Validity Ratio. Measurement and Evaluation in Counseling and Development 2014. [Google Scholar] [CrossRef]
- Zenker, S.; Braun, E.; Gyimóthy, S. Too Afraid to Travel? Development of a Pandemic (COVID-19) Anxiety Travel Scale (PATS). Tourism Management 2021, 84, 104286. [Google Scholar] [CrossRef]
- Lytras, M.D.; Visvizi, A.; Chopdar, P.K.; Sarirete, A.; Alhalabi, W. Information Management in Smart Cities: Turning End Users’ Views into Multi-Item Scale Development, Validation, and Policy-Making Recommendations. International Journal of Information Management 2021, 56, 102146. [Google Scholar] [CrossRef]
- Rana, N.P.; Chatterjee,Sheshadri; Dwivedi,Yogesh K. ; and Akter, S. Understanding Dark Side of Artificial Intelligence (AI) Integrated Business Analytics: Assessing Firm’s Operational Inefficiency and Competitiveness. European Journal of Information Systems 2022, 31, 364–387. [Google Scholar] [CrossRef]
- Clark, L.A.; Watson, D. Constructing Validity: New Developments in Creating Objective Measuring Instruments. Psychol Assess 2019, 31, 1412–1427. [Google Scholar] [CrossRef] [PubMed]
- Lu, L.; Cai, R.; Gursoy, D. Developing and Validating a Service Robot Integration Willingness Scale. International Journal of Hospitality Management 2019, 80, 36–51. [Google Scholar] [CrossRef]
- Hair, J.F.; Black, C.W.; Babin, B.J.; Anderson, R.E. Multivariate Data Analysis; Seven edition.; Pearson Education Limited: Essex, 2014; ISBN 978-1-292-02190-4. [Google Scholar]
- Cudeck, R.; O’Dell, L.L. Applications of Standard Error Estimates in Unrestricted Factor Analysis: Significance Tests for Factor Loadings and Correlations. Psychological Bulletin 1994, 115, 475–487. [Google Scholar] [CrossRef]
- Luo, L.; Arizmendi, C.; Gates, K.M. Exploratory Factor Analysis (EFA) Programs in R. Structural Equation Modeling: A Multidisciplinary Journal 2019. [Google Scholar] [CrossRef]
- Horn, J.L. A Rationale and Test for the Number of Factors in Factor Analysis. Psychometrika 1965, 30, 179–185. [Google Scholar] [CrossRef]
- Weng, L.-J.; Cheng, C.-P. Parallel Analysis with Unidimensional Binary Data. Educational and Psychological Measurement 2005, 65, 697–716. [Google Scholar] [CrossRef]
- Kääriäinen, M.; Kanste, O.; Elo, S.; Pölkki, T.; Miettunen, J.; Kyngäs, H. Testing and Verifying Nursing Theory by Confirmatory Factor Analysis. Journal of Advanced Nursing 2011, 67, 1163–1172. [Google Scholar] [CrossRef] [PubMed]
- Ottem, E. Confirmatory Factor Analysis of the WPPSI for Language-Impaired Children. Scandinavian Journal of Psychology 2003, 44, 433–439. [Google Scholar] [CrossRef]
- Hair, J.F.; Risher, J.J.; Sarstedt, M.; Ringle, C.M. When to Use and How to Report the Results of PLS-SEM. European Business Review 2019, 31, 2–24. [Google Scholar] [CrossRef]
- Schermelleh-Engel, K.; Moosbrugger, H.; Müller, H. Evaluating the Fit of Structural Equation Models: Tests of Significance and Descriptive Goodness-of-Fit Measures. Methods of Psychological Research Online 2003, 8, 23–74. [Google Scholar]
- Yaşlıoğlu, M.M. Sosyal Bilimlerde Faktör Analizi ve Geçerlilik: Keşfedici ve Doğrulayıcı Faktör Analizlerinin Kullanılması. İstanbul Üniversitesi İşletme Fakültesi Dergisi 2017, 46, 74–85. [Google Scholar]
- Whittaker, T.A.; Worthington, R.L. Item Response Theory in Scale Development Research: A Critical Analysis. The Counseling Psychologist 2016, 44, 216–225. [Google Scholar] [CrossRef]
- Friesner, D.; Bozman, C.; McPherson, M.; Valente, F.; Zhang, A. Information Entropy and Scale Development. Journal of Survey Statistics and Methodology 2021, 9, 1183–1203. [Google Scholar] [CrossRef]
- Shevlin, M.; Miles, J.N.V.; Davies, M.N.O.; Walker, S. Coefficient Alpha: A Useful Indicator of Reliability? Personality and Individual Differences 2000, 28, 229–237. [Google Scholar] [CrossRef]
- Cuhadar, I.; Yang, Y.; Paek, I. Consequences of Ignoring Guessing Effects on Measurement Invariance Analysis. Applied Psychological Measurement 2021, 45, 283–296. [Google Scholar] [CrossRef] [PubMed]
- Cheung, G.W.; and Rensvold, R.B. Evaluating Goodness-of-Fit Indexes for Testing Measurement Invariance. Structural Equation Modeling: A Multidisciplinary Journal 2002, 9, 233–255. [Google Scholar] [CrossRef]
- Huang, K.-P.; Lee, L.; Chou, C.J. Correlations among Product Development, Product Innovation, and Green Marketing in Healthcare Industry. RCIS 2024, 186–196. [Google Scholar] [CrossRef]
- Zhang, Y.; Wang, W.; Wu, D.; Cheng, S.; Shi, Y.; Ma, X. Analysis on the Path of Agricultural Scientific Research Institutes to Promote the Industrialization of Intellectual Property. Hubei Agricultural Sciences 2021, 60, 190–192. [Google Scholar] [CrossRef]
- Akude, D.N.; Akuma, J.K.; Kwaning, E.A.; Asiama, K.A. Green Marketing Practices and Sustainability Performance of Manufacturing Firms: Evidence from Emerging Markets. Nature Environment and Pollution Technology 2025, 24, 1–16. [Google Scholar] [CrossRef]
- Jeong, K.-H.; Song, J. Effect of Eco-Friendly Management of Golf Clubs on Golfers’ Behavioral Intention to Return: Green Image, Perceived Quality as Meditator and Green Marketing as Moderator 2025.
Figure 1.
Study 1 CFA analysis path diagram.
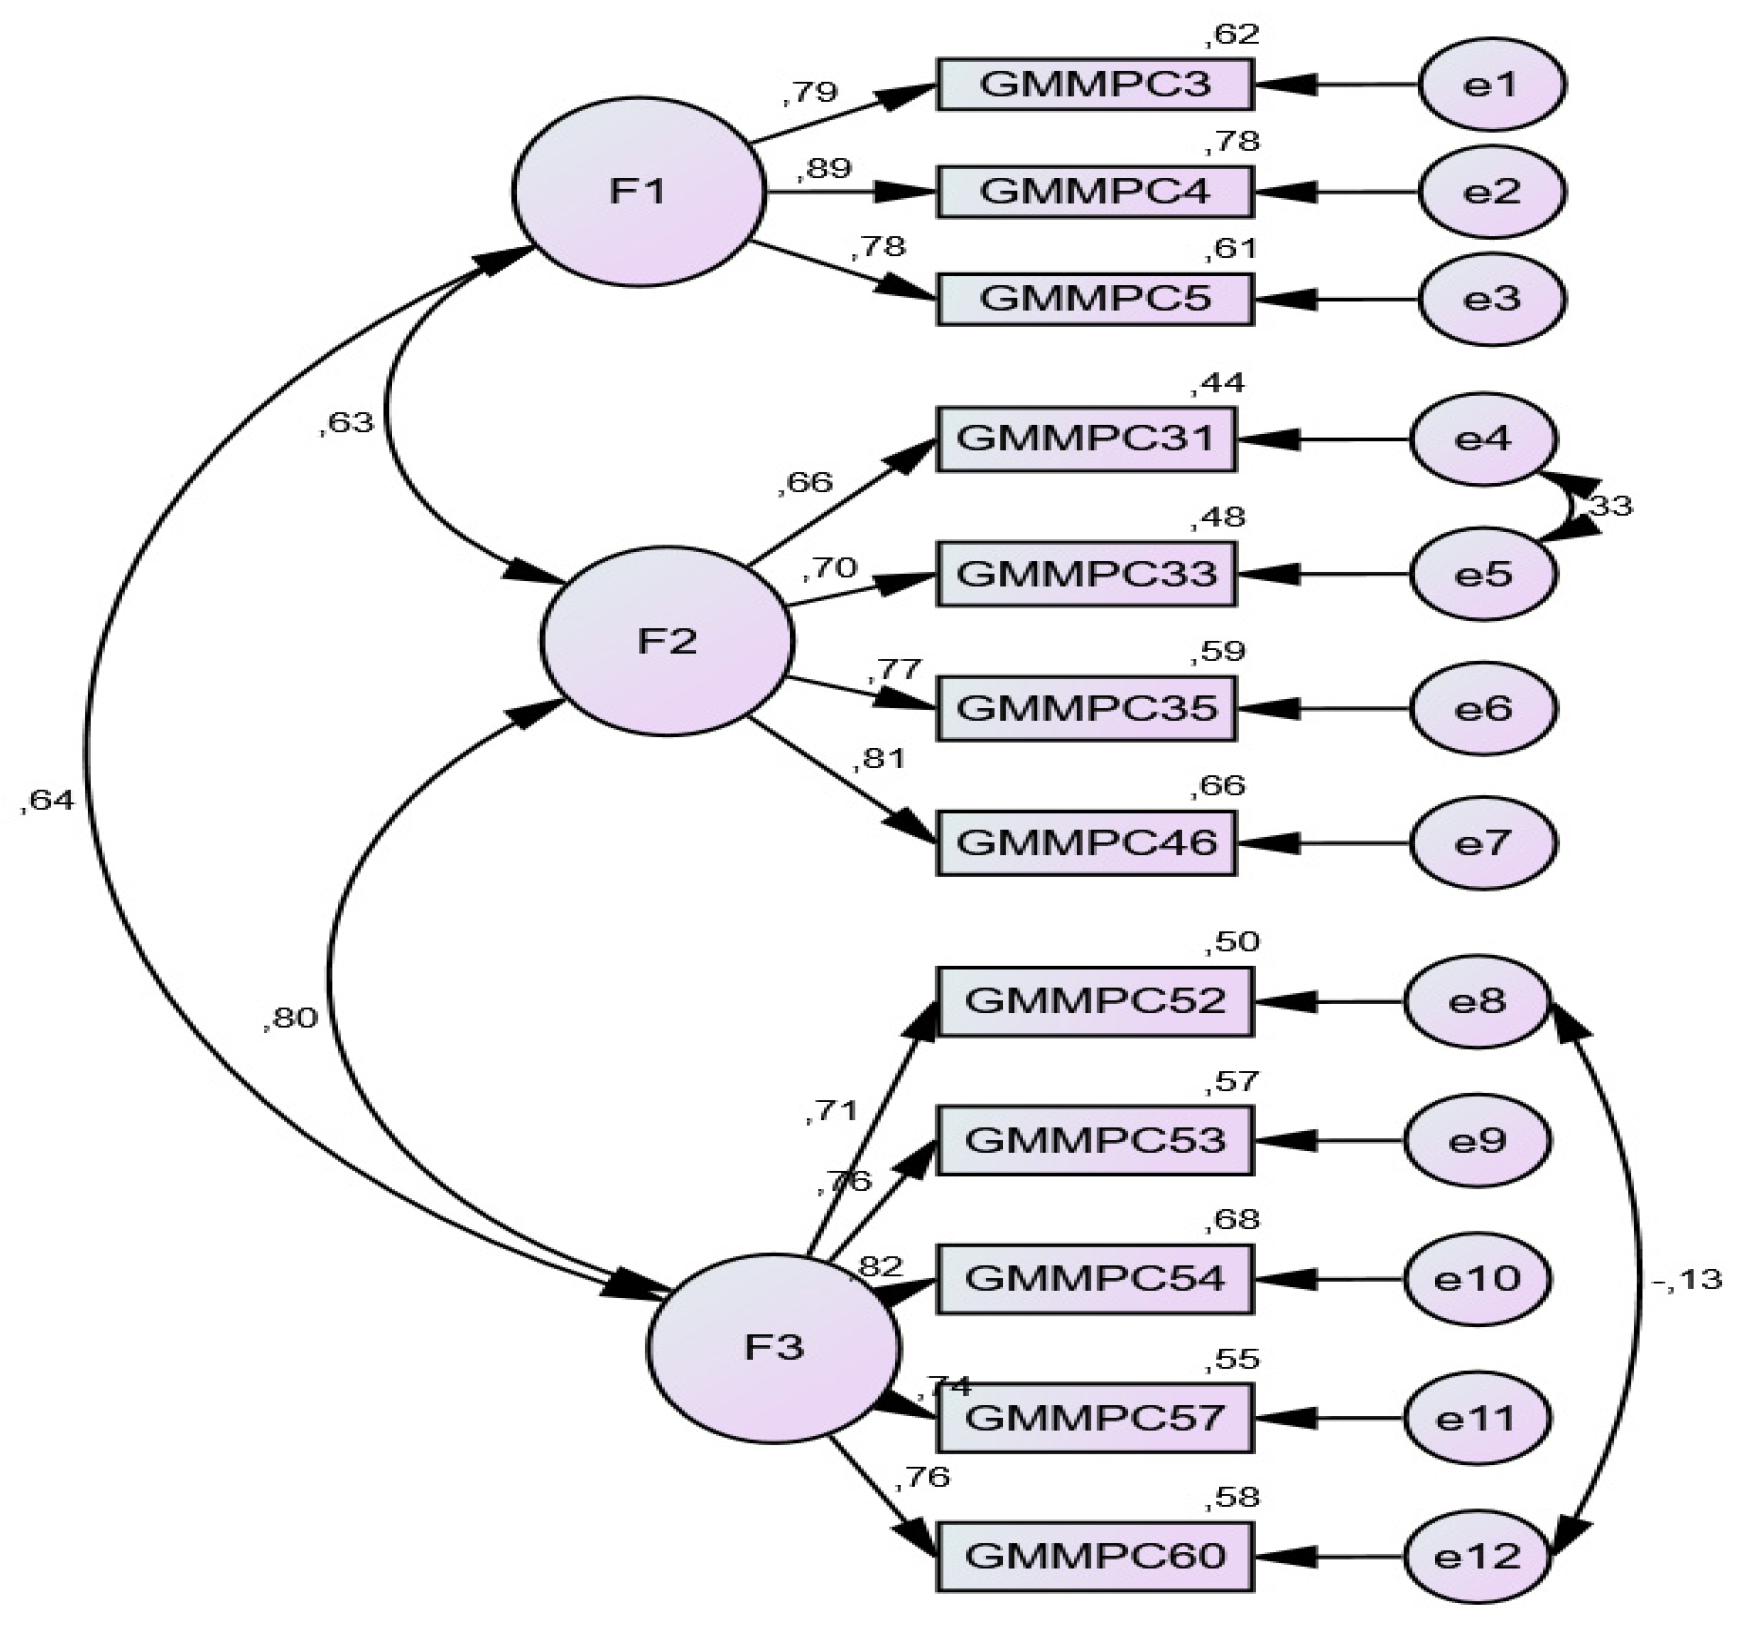
Figure 2.
Study 2 CFA analysis path diagram.
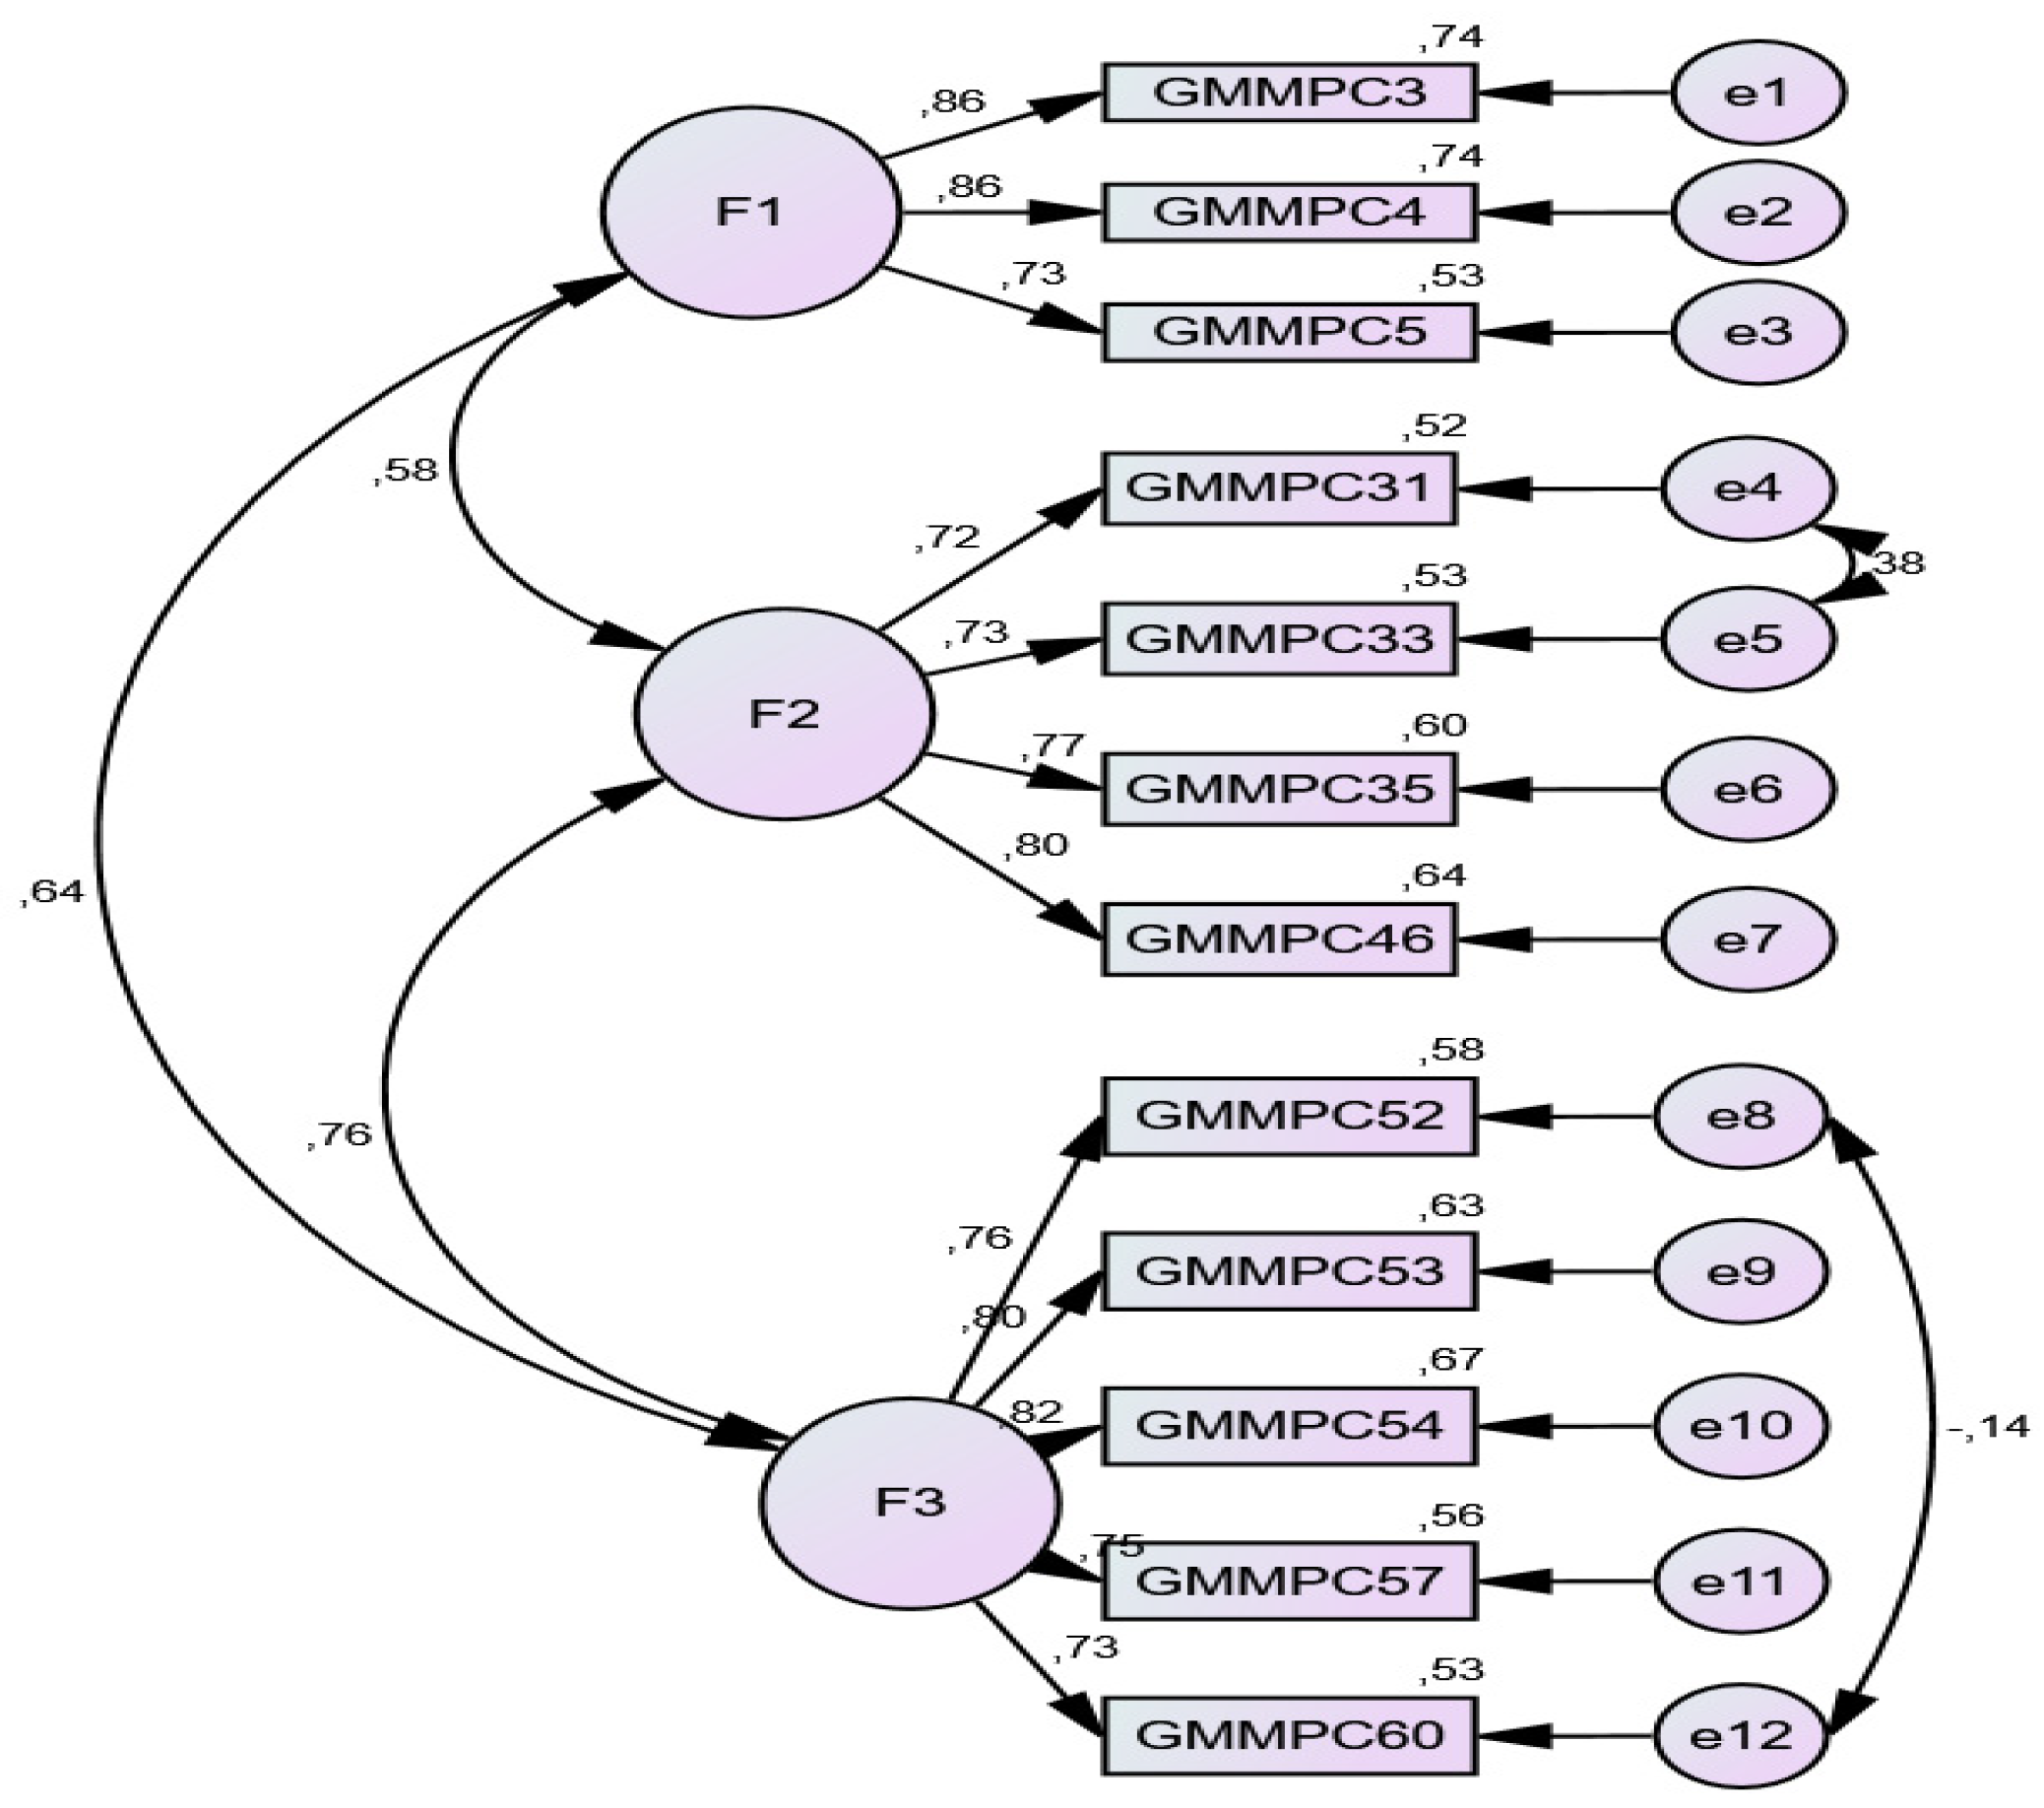
Table 2.
GMMPC item pool-CVR and comments.
| Item No | NE | CVR | Comment | Item No | NE | CVR | Comment |
| 1 | 9 | 0,80 | Remained | 42 | 9 | 0,80 | Remained |
| 2 | 1 | -0.80 | Eliminated | 43 | 9 | 0,80 | Remained |
| 3 | 9 | 0,80 | Remained | 44 | 10 | 1,00 | Remained |
| 4 | 10 | 1,00 | Remained | 45 | 6 | 0,20 | Eliminated |
| 5 | 10 | 1,00 | Remained | 46 | 10 | 1,00 | Remained |
| 6 | 9 | 0,80 | Remained | 47 | 9 | 0,80 | Remained |
| 7 | 10 | 1,00 | Remained | 48 | 10 | 1,00 | Remained |
| 8 | 2 | -0,60 | Eliminated | 49 | 9 | 0,80 | Remained |
| 9 | 10 | 1,00 | Remained | 50 | 8 | 0,60 | Eliminated |
| 10 | 9 | 0,80 | Remained | 51 | 9 | 0,80 | Remained |
| 11 | 9 | 0,80 | Remained | 52 | 10 | 1,00 | Remained |
| 12 | 7 | 0,40 | Eliminated | 53 | 9 | 0,80 | Remained |
| 13 | 10 | 1,00 | Remained | 54 | 10 | 1,00 | Remained |
| 14 | 10 | 1,00 | Remained | 55 | 4 | -0,20 | Eliminated |
| 15 | 9 | 0,80 | Remained | 56 | 9 | 0,80 | Remained |
| 16 | 9 | 0,80 | Remained | 57 | 10 | 1,00 | Remained |
| 17 | 8 | 0,60 | Eliminated | 58 | 10 | 1,00 | Remained |
| 18 | 9 | 0,80 | Remained | 59 | 9 | 0,80 | Remained |
| 19 | 9 | 0,80 | Remained | 60 | 9 | 0,80 | Remained |
| 20 | 9 | 0,80 | Remained | 61 | 10 | 1,00 | Remained |
| 21 | 9 | 0,80 | Remained | 62 | 10 | 1,00 | Remained |
| 22 | 9 | 0,80 | Remained | 63 | 7 | 0,40 | Eliminated |
| 23 | 5 | 0,00 | Eliminated | 64 | 9 | 0,80 | Remained |
| 24 | 9 | 0,80 | Remained | 65 | 8 | 0,60 | Eliminated |
| 25 | 9 | 0,80 | Remained | 66 | 10 | 1,00 | Remained |
| 26 | 9 | 0,80 | Remained | 67 | 4 | -0,20 | Eliminated |
| 27 | 8 | 0,60 | Eliminated | 68 | 10 | 1,00 | Remained |
| 28 | 9 | 0,80 | Remained | 69 | 9 | 0,80 | Remained |
| 29 | 9 | 0,80 | Remained | 70 | 5 | 0,00 | Eliminated |
| 30 | 8 | 0,60 | Eliminated | 71 | 10 | 1,00 | Remained |
| 31 | 7 | 0,40 | Eliminated | 72 | 5 | 0,00 | Eliminated |
| 32 | 10 | 1,00 | Remained | 73 | 9 | 0,80 | Remained |
| 33 | 9 | 0,80 | Remained | 74 | 10 | 1,00 | Remained |
| 34 | 9 | 0,80 | Remained | 75 | 6 | 0,20 | Eliminated |
| 35 | 10 | 1,00 | Remained | 76 | 9 | 0,80 | Remained |
| 36 | 9 | 0,80 | Remained | 77 | 2 | -0,60 | Eliminated |
| 37 | 10 | 1,00 | Remained | 78 | 9 | 0,80 | Remained |
| 38 | 10 | 1,00 | Remained | 79 | 10 | 1,00 | Remained |
| 39 | 4 | -0,20 | Eliminated | 80 | 7 | 0,40 | Eliminated |
| 40 | 10 | 1,00 | Remained | 81 | 9 | 0,80 | Remained |
| 41 | 10 | 1,00 | Remained | 82 | 9 | 0,80 | Remained |
Table 3.
Attitude Scale for GMMPC.
| Nu. | Items |
| 1 | We design products to save energy with reduced materials |
| 2 | We design for remanufacturing so that waste can be recycled. |
| 3 | With the green packaging approach, our materials are less damaged (such as breakage, deterioration) |
| 4 | Green packaging approach reduces our packaging waste |
| 5 | Green packaging practices make our products even lighter. |
| 6 | Green packaging practices reduce costs. |
| 7 | We use recycled materials in our products. |
| 8 | We use recycled materials for packaging. |
| 9 | We consider the environment when designing the product. |
| 10 | We use ecological green materials in production. |
| 11 | Our suppliers' products are recyclable |
| 12 | We minimize our waste in production |
| 13 | We use renewable energy sources in production |
| 14 | Our company offers innovative green products to the market. |
| 15 | Green products provide our company with the opportunity to differentiate. |
| 16 | The raw materials we use are safe for the environment. |
| 17 | The production process in our enterprise is based on ISO 14001 certification. |
| 18 | Our company produces environmentally friendly products |
| 19 | Environment is a key criterion for supplier selection. |
| 20 | We support the green environmental components of the product. |
| 21 | A separate unit monitoring environmental costs has been established in our organization. |
| 22 | The use of recycled materials in our business reduces costs. |
| 23 | It is normal for green products to be priced slightly higher than other products. |
| 24 | Our customers are willing to pay high prices for green products. |
| 25 | We take environmental factors into account in our price policy. |
| 26 | We use local products to reduce transportation costs. |
| 27 | The use of Information Technologies in the enterprise reduces distribution costs |
| 28 | We cover the additional cost of a green product. |
| 29 | We consider environmental issues in distribution. |
| 30 | Our company tries to persuade its customers to be environmentally conscious during direct sales. |
| 31 | We utilize green vehicles in the distribution channel. |
| 32 | We use electronic information systems in green transportation. |
| 33 | Thanks to green transport, we use less fuel. |
| 34 | Thanks to green transportation, we can reduce costs by saving time on the shipment route |
| 35 | We monitor emissions from the distribution of the product. |
| 36 | The environmental aspect of our products is at the forefront in marketing. |
| 37 | Our environmental practices are updated on our website. |
| 38 | Our company chooses packaging materials from degradable products. |
| 39 | Our business is trying to reduce the use of packaging. |
| 40 | Our business uses environmentally friendly green label. |
| 41 | The labels contain information on recycling. |
| 42 | We prevent the use of hazardous substances in packaging. |
| 43 | The amount of handling of goods is minimized to increase delivery flexibility. |
| 44 | The warehouse of our business is organized with environmentally friendly methods. |
| 45 | We use integrated transportation systems in distribution |
| 46 | We choose cleaner transportation systems |
| 47 | We use green arguments in marketing communication. |
| 48 | Our marketing communications reflect the company's commitment to the environment. |
| 49 | Environmental claims in advertising are often met with criticism from the environment (competitors, consumer organizations, etc.). |
| 50 | The company cooperates with environmental groups to effectively promote “green image" |
| 51 | Environmental labeling is an effective promotional tool for our company. |
| 52 | We inform consumers about environmental management in the company |
| 53 | We participate in sponsorship activities on environmental issues. |
| 54 | We use specific environmental criteria for our suppliers. |
| 55 | When promoting our products, we prefer digital communication as it is more environmentally friendly |
| 56 | We implement paperless policy in our procurement as much as possible. |
| 57 | We emphasize the image of "green business" in promotional activities |
| 58 | Our company uses factual statements in product advertisements. |
| 59 | Our image as an environmentally friendly company gives us a competitive advantage. |
| 60 | We emphasize in our advertisements that our products are green. |
| 61 | Green identical to the environment dominates the product packaging. |
| 62 | Our product promotions include environmental protection activities. |
Table 4.
Demographic variables (n=159).
| Variable | Group | n | % | Variable | Group | n | % |
| Sex | Female | 53 | 33.33 | Experience | Less than 5 years | 23 | 14.50 |
| Male | 106 | 66.67 | 6-10 years | 55 | 34.60 | ||
| Age | 30 and below | 43 | 27.00 | 11-15 years | 38 | 23.90 | |
| 31-40 years | 37 | 23.30 | 16-20 years | 22 | 13.80 | ||
| 41-50 years | 48 | 30.20 | 21 years and above | 21 | 13.20 | ||
| 51 and above | 31 | 19.50 | Position | Lower level manager | 39 | 24.50 | |
| Marital Status |
Married | 92 | 57.90 | Middle manager | 61 | 38.40 | |
| Single | 67 | 42.10 | Senior executive | 45 | 28.30 | ||
| Educational Level | High school and below | 21 | 13.20 | Boss (business owner) | 14 | 9.80 | |
| Associate degree | 34 | 21.40 | |||||
| Undergraduate | 71 | 44.60 | |||||
| Postgraduate | 33 | 20.80 | |||||
Table 5.
Normality analysis.
| Scale | Kolmogorov-Smirnov | Central Tendency Measurements | |||||||
| Statistic | df | Sig. | Mean | Median | Skewness | Kurtosis | |||
| GMMPC | 0,101 | 159 | 0,000 | 3,417 | 3,583 | -0,727 | 0,539 | ||
Table 6.
EFA and PA.
| Statements | Factor Load Value (SPSS) |
Cron. Alfa (α) |
PA Results | |||
| (Ncases: 159; Nvar: 12; Ndataset:100; Percent: 95; Brian Oc) | ||||||
| Raw Data | Means | Percently | ||||
| Dimension 1 | α= 0,869 | 6,147 | 1,473 | 1,584 | ||
| % of Variance: 46,564 ;Eigen-value: 6,147 | ||||||
| GMMPC 52 | We inform consumers about the environmental management within our company | 0,730 | ||||
| GMMPC 53 | We participate in sponsorship activities related to environmental issues. | 0,760 | ||||
| GMMPC 54 | We utilize specific environmental criteria for our suppliers | 0,820 | ||||
| GMMPC 57 | We emphasize the 'eco-friendly business' image in our promotional activities. | 0,645 | ||||
| GMMPC 60 | We highlight the green attributes of our products in our advertisements. | 0,601 | ||||
| Dimension 2 | α= 0,854 | 1,419 | 1,352 | 1,419 | ||
| % Of Variance: 8,940 ;Eigen-Value: 1,419 | ||||||
| GMMPC 3 | Our materials sustain less damage (such as breakage, spoilage) due to our green packaging approach | -0,666 | ||||
| GMMPC 4 | The green packaging approach reduces our packaging waste. | -0,982 | ||||
| GMMPC 5 | Green packaging practices make our products even lighter. | -0,704 | ||||
| Dimension 3 | α= 0,842 | 1,347 | 1,254 | 1,320 | ||
| % Of Variance: 5,325 ;Eigen-Value: 1,347 | ||||||
| GMMPC 31 | We utilize green vehicles in our distribution channel. | 0,764 | ||||
| GMMPC 33 | We use less fuel thanks to green transportation | 0,815 | ||||
| GMMPC 35 | We monitor emissions resulting from product distribution | 0,608 | ||||
| GMMPC 46 | We select cleaner transportation systems | 0,510 | ||||
| Extraction Method: Maximum Likelihood (ML) | ||||||
| Rotation Method: Direct Oblimin | ||||||
| KMO: 0,895; | ||||||
| Bartlett’s sphericity test; (χ2=1.033,152; df=66; p=,000) | ||||||
Table 7.
Unidimensionality Analysis (Kaiser-Guttman Criterion).
| Factors | No. of items | 1. Eigenvalue | 2. Eigenvalue |
3. Eigenvalue |
4. Eigenvalue |
Total Variance |
| GMMPC | 12 | 6,147 | 1,419 | 1,347 | 0,621 | 60,728 |
Table 8.
Deleted items*.
| Nu | Items |
| GMMPC 1 | We design products to save energy using reduced materials. |
| GMMPC 2 | We design for remanufacturing to facilitate waste recycling. |
| GMMPC 6 | Green packaging practices reduce our costs. |
| GMMPC 7 | We use recycled materials in our products. |
| GMMPC 8 | We use recycled materials for packaging. |
| GMMPC 9 | We consider the environment when designing products. |
| GMMPC 10 | We use ecological/green materials in production. |
| GMMPC 11 | Our suppliers' products are suitable for recycling. |
| GMMPC 12 | We minimize the amount of waste in our production processes. |
| GMMPC 13 | We use renewable energy sources in production. |
| GMMPC 14 | Our company offers innovative green products to the market. |
| GMMPC 15 | Green products provide our company with differentiation opportunities. |
| GMMPC 16 | The raw materials we use are safe for the environment. |
| GMMPC 17 | Our production process is based on the ISO 14001 certification. |
| GMMPC 18 | Our business produces environmentally friendly products. |
| GMMPC 19 | The environment is a key criterion in our supplier selection. |
| GMMPC 20 | We promote the green environmental components of the product. |
| GMMPC 21 | A separate unit has been established in our business to monitor environmental costs. |
| GMMPC 22 | Using recycled materials in our business reduces costs. |
| GMMPC 23 | It is normal for green products to be priced slightly higher than other products. |
| GMMPC 24 | Our customers accept paying higher prices for green products. |
| GMMPC 25 | We consider environmental factors in our pricing policy. |
| GMMPC 26 | We use local products to reduce transportation costs. |
| GMMPC 27 | The use of Information Technology (IT) in our business reduces distribution costs. |
| GMMPC 28 | We account for the additional cost of an environmentally friendly product. |
| GMMPC 29 | We consider environmental issues in distribution. |
| GMMPC 30 | Our company tries to persuade customers to be environmentally conscious during direct sales. |
| GMMPC 32 | We use electronic information systems in green transportation. |
| GMMPC 34 | Through green transportation, we can save time on shipment routes and reduce costs. |
| GMMPC 36 | The environmentally friendly aspect of our products is prominent in our marketing. |
| GMMPC 37 | Our environmentally friendly practices are updated on our website. |
| GMMPC 38 | Our business selects packaging materials from biodegradable products. |
| GMMPC 39 | Our business tries to reduce the use of packaging. |
| GMMPC 40 | Our business uses environmentally friendly green labels. |
| GMMPC 41 | Information regarding recycling is included on our labels. |
| GMMPC 42 | We avoid the use of hazardous materials in packaging. |
| GMMPC 43 | The quantity of goods handling is minimized to increase delivery flexibility. |
| GMMPC 44 | Our business's warehouse is organized using environmentally friendly methods. |
| GMMPC 45 | We use integrated transportation systems in distribution |
| GMMPC 47 | We use green arguments in our marketing communications. |
| GMMPC 48 | Our marketing communication reflects the company's commitment to the environment. |
| GMMPC 49 | Environmental claims in advertisements are often met with criticism from external parties (e.g., competitors, consumer organizations). |
| GMMPC 50 | The company collaborates with environmental groups to effectively promote its 'green image'. |
| GMMPC 51 | Environmental labeling is an effective promotional tool for our company. |
| GMMPC 55 | We prefer digital communication for promoting our products because it is more environmentally friendly. |
| GMMPC 56 | We implement a paperless policy in our procurement activities whenever possible. |
| GMMPC 58 | Our company uses truthful statements in its product advertisements. |
| GMMPC 59 | Our environmentally friendly company image provides us with a competitive advantage. |
| GMMPC 61 | The color green, synonymous with the environment, dominates our product packaging. |
| GMMPC 62 | Our product promotions include environmental protection activities. |
*: These items were deleted because their factor loading values were below 0.50.
Table 9.
Correlation Table.
| No | 1 | 2 | 3 | 4 | 5 | 6 | 7 | 8 | 9 | 10 | 11 | 12 | 13 | 14 | 15 | |
| 1 | GMMPC 3 | 1 | ||||||||||||||
| 2 | GMMPC 4 | ,701** | 1 | |||||||||||||
| 3 | GMMPC 5 | ,579** | ,702** | 1 | ||||||||||||
| 4 | GMMPC 31 | ,407** | ,350** | ,379** | 1 | |||||||||||
| 5 | GMMPC 33 | ,326** | ,420** | ,340** | ,637** | 1 | ||||||||||
| 6 | GMMPC 35 | ,440** | ,402** | ,317** | ,529** | ,558** | 1 | |||||||||
| 7 | GMMPC 46 | ,466** | ,440** | ,362** | ,518** | ,560** | ,623** | 1 | ||||||||
| 8 | GMMPC 52 | ,319** | ,384** | ,374** | ,349** | ,321** | ,400** | ,450** | 1 | |||||||
| 9 | GMMPC 53 | ,445** | ,330** | ,344** | ,438** | ,403** | ,487** | ,530** | ,560** | 1 | ||||||
| 10 | GMMPC 54 | ,396** | ,429** | ,433** | ,414** | ,461** | ,472** | ,583** | ,600** | ,672** | 1 | |||||
| 11 | GMMPC 57 | ,399** | ,438** | ,494** | ,361** | ,416** | ,459** | ,460** | ,519** | ,490** | ,608** | 1 | ||||
| 12 | GMMPC 60 | ,451** | ,415** | ,490** | ,453** | ,425** | ,483** | ,528** | ,484** | ,557** | ,582** | ,626** | 1 | |||
| 13 | GMMPC 1st dimension |
,872** | ,909** | ,858** | ,431** | ,411** | ,441** | ,482** | ,407** | ,426** | ,476** | ,503** | ,514** | 1 | ||
| 14 | GMMPC 2nd dimension |
,499** | ,489** | ,424** | ,812** | ,830** | ,827** | ,824** | ,463** | ,566** | ,587** | ,516** | ,575** | ,537** | 1 | |
| 15 | GMMPC 3rd dimension |
,495** | ,492** | ,525** | ,497** | ,499** | ,567** | ,629** | ,787** | ,812** | ,856** | ,798** | ,795** | ,573** | ,667** | 1 |
| 16 | GMMPC | ,694** | ,700** | ,675** | ,680** | ,682** | ,722** | ,763** | ,674** | ,731** | ,775** | ,729** | ,753** | ,784** | ,865** | ,904** |
Table 10.
Goodness-of-Fit Indices.
| X2(df) | p | RMSEA | CFI | GFI | SRMR | AVE | CR |
| 1.468 | 0.000 | 0.054 | 0.977 | 0.930 | 0.028 | 0.589 | 0.967 |
Table 11.
Measurement Model.
| Items | β1 | β2 | Ss | t | p | CR | AVE | ||
| Measurement Model | |||||||||
| GMMPC 3 | ← | 2 nd.dimension | 0,786 | 1,000 | 0,967 | 0,589 | |||
| GMMPC 4 | ← | 2nd.dimension | 0,886 | 1,053 | 0,095 | 11,123 | <0,001 | ||
| GMMPC 5 | ← | 2 nd.dimension | 0,779 | 0,906 | 0,090 | 10,072 | <0,001 | ||
| GMMPC 31 | ← | 3 rd. dimension | 0,662 | 1,000 | |||||
| GMMPC 33 | ← | 3 rd. dimension | 0,696 | 1,014 | 0,111 | 9,119 | <0,001 | ||
| GMMPC 35 | ← | 3 rd. dimension | 0,769 | 1,209 | 0,152 | 7,973 | <0,001 | ||
| GMMPC 46 | ← | 3 rd. dimension | 0,815 | 1,275 | 0,154 | 8,274 | <0,001 | ||
| GMMPC 52 | ← | 1 st dimension | 0,710 | 1,000 | |||||
| GMMPC 53 | ← | 1 st dimension | 0,758 | 1,043 | 0,119 | 8,776 | <0,001 | ||
| GMMPC 54 | ← | 1 st dimension | 0,824 | 1,111 | 0,118 | 9,451 | <0,001 | ||
| GMMPC 57 | ← | 1 st dimension | 0,740 | 0,990 | 0,115 | 8,589 | <0,001 | ||
| GMMPC 60 | ← | 1 st dimension | 0,764 | 0,968 | 0,115 | 8,420 | <0,001 | ||
β1: Standard Coefficients, β2: Non-Standard Coefficients.
Table 12.
Demographic characteristics of participants (n=387) and information regarding SMEs.
| Variable | Groups | F | % | Variable | Groups | F | % |
| Sex | Female | 163 | 42,1 | Use of Digital Marketing |
Yes | 295 | 76,2 |
| Male | 224 | 57,9 | No | 92 | 23,8 | ||
| Total | 387 | 100,0 | Total | 387 | 100,0 | ||
| Age | 30 and below | 94 | 24,3 | Importance of Digital Marketing | Low importance, | 33 | 8,5 |
| 31-40 years | 166 | 42,9 | Moderate importance | 89 | 23,0 | ||
| 41-50 years | 92 | 23,8 | High importance | 129 | 33,3 | ||
| 51 and above | 35 | 9,0 | Very high importance | 136 | 35,1 | ||
| Total | 387 | 100,0 | Total | 387 | 100,0 | ||
| Marital Status |
Married | 251 | 64,9 | Export | Yes | 232 | 59,9 |
| Single | 136 | 35,1 | No | 155 | 40,1 | ||
| Total | 387 | 100,0 | Total | 387 | 100,0 | ||
| Educational Level | High school and below | 49 | 12,7 | Existence of Carbon Offsetting System (e.g., tree planting | Yes | 149 | 38,5 |
| Associate Degree | 48 | 12,4 | No | 238 | 61,5 | ||
| Undergraduate | 203 | 52,5 | Total | 387 | 100,0 | ||
| Postgraduate | 87 | 22,5 | Level of Knowledge Regarding Carbon Border Adjustment Mechanism (CBAM) | Nothing | 62 | 16,0 | |
| Total | 387 | 100,0 | Less | 104 | 26,9 | ||
| Position | Lower level manager | 84 | 21,7 | Middle | 142 | 36,7 | |
| Middle manager | 191 | 49,4 | More | 43 | 11,1 | ||
| Senior executive | 81 | 20,9 | Too much | 36 | 9,3 | ||
| Boss (business owner) | 31 | 8,0 | Total | 387 | 100,0 | ||
| Total | 387 | 100,0 | Expected Level of Impact of CBAM on the Business |
No impact | 58 | 15,0 | |
| Experience | Less than 5 years | 90 | 23,3 | Low impact | 73 | 18,9 | |
| 6-10 years | 93 | 24,0 | Moderate impact | 140 | 36,2 | ||
| 11-15 years | 94 | 24,3 | High impact | 78 | 20,2 | ||
| 16-20 years | 48 | 12,4 | Very high impact | 38 | 9,8 | ||
| 21 years and above | 62 | 16,0 | Total | 387 | 100,0 | ||
| Total | 387 | 100,0 | Reverse Logistics System |
Yes | 88 | 22,7 | |
| Length of Employment (at the company) | Between 1-5 years | 198 | 51,2 | No | 299 | 77,3 | |
| Between 6-10 years | 110 | 28,4 | Total | 387 | 100,0 | ||
| Between 11-15 years | 40 | 10,3 | Use of Environmental Marks or Labels on Products | Yes | 215 | 55,6 | |
| Between 16-20 years | 13 | 3,4 | No | 172 | 44,4 | ||
| Between 21 years or more | 26 | 6,7 | Total | 387 | 100,0 | ||
| Total | 387 | 100,0 | Labels/Marks Used | CE | 78 | 20.2 | |
| Company's Years in Operation | Between 1-10 years | 144 | 37,2 | Recycling | 119 | 30.7 | |
| Between 11-20 years | 80 | 20,7 | Green Dot | 23 | 5.9 | ||
| Between 21-30 years | 77 | 19,9 | Eco-friendly, | 108 | 27.9 | ||
| Between 31-40 years | 27 | 7,0 | ÇEVKO, | 13 | 3,4 | ||
| Between 41 years | 59 | 15,2 | Ozone-friendly | 5 | 1.3 | ||
| Total | 387 | 100,0 | Eco-label | 15 | 3.9 | ||
| Number of Employees | Between 100 employees or less | 217 | 56,1 | Total | 387 | 100,0 | |
| Between 101-200 employees | 54 | 14,0 | Expectation of an Increase in Personnel to be Employed for Green Jobs in the Future: | Yes | 283 | 73,1 | |
| Between 201-300 employees | 35 | 9,0 | No | 104 | 26,9 | ||
| Between 301-400 employees | 28 | 7,2 | Total | 387 | 100,0 | ||
| 401 employees or more | 53 | 13,7 | ISO 14001 Certification | Yes | 182 | 47,0 | |
| Total | 387 | 100,0 | No | 205 | 53,0 | ||
| Sector of Operation | IT/Technology Products | 94 | 24,3 | Total | 387 | 100,0 | |
| Food and Packaging Products | 100 | 25,8 | |||||
| Construction Products | 41 | 10,6 | |||||
| Machinery and Parts Manufacturing | 117 | 30,2 | |||||
| Medical, Optical, and Eyewear Manufacturing | 7 | 1,8 | |||||
| Defense Industry | 2 | ,5 | |||||
| Textile, Leather, and Leather Products | 10 | 2,6 | |||||
| Logistics | 6 | 1,6 | |||||
| Publishing House | 10 | 2,6 | |||||
| Total | 387 | 100,0 | |||||
Table 13.
Post-test GMMPC scale (n=387).
| Sequence no. | Statements | 1-Strongly disagree | 2-Disagree |
3-Neither disagree nor agree |
4-Agree |
5-Strongly agree |
Mean | S.D. | |
| 1 | GMMPC 3- Our materials sustain less damage (such as breakage, spoilage) due to our green packaging approach. | f | 26 | 43 | 80 | 136 | 102 | 3,63 | 1,17 |
| % | 6,7 | 11,1 | 20,7 | 35,1 | 26,4 | ||||
| 2 | GMMPC 4- The green packaging approach reduces our packaging waste. | f | 20 | 38 | 66 | 154 | 109 | 3,76 | 1,12 |
| % | 5,2 | 9,8 | 17,1 | 39,8 | 28,2 | ||||
| 3 | GMMPC 5- Green packaging practices make our products even lighter. | f | 18 | 60 | 107 | 133 | 69 | 3,45 | 1,09 |
| % | 4,7 | 15,5 | 27,6 | 34,4 | 17,8 | ||||
| 4 | GMMPC 31- We utilize green vehicles in our distribution channel. | f | 29 | 77 | 122 | 88 | 71 | 3,25 | 1,18 |
| % | 7,5 | 19,9 | 31,5 | 22,7 | 18,3 | ||||
| 5 | GMMPC 33- We use less fuel thanks to green transportation. | f | 24 | 68 | 111 | 121 | 63 | 3,34 | 1,13 |
| % | 6,2 | 17,6 | 28,7 | 31,3 | 16,3 | ||||
| 6 | GMMPC 35- We monitor emissions resulting from product distribution. | f | 32 | 101 | 83 | 107 | 64 | 3,18 | 1,22 |
| % | 8,3 | 26,1 | 21,4 | 27,6 | 16,5 | ||||
| 7 | GMMPC 46- We select cleaner transportation systems. | f | 15 | 60 | 79 | 144 | 89 | 3,60 | 1,11 |
| % | 3,9 | 15,5 | 20,4 | 37,2 | 23,0 | ||||
| 8 | GMMPC 52- We inform consumers about the environmental management within our company. | f | 33 | 85 | 63 | 135 | 71 | 3,33 | 2,24 |
| % | 8,5 | 22,0 | 16,3 | 34,9 | 18,3 | ||||
| 9 | GMMPC 53- We participate in sponsorship activities related to environmental issues. | f | 21 | 69 | 69 | 138 | 90 | 3,53 | 1,18 |
| % | 5,4 | 17,8 | 17,8 | 35,7 | 23,3 | ||||
| 10 | GMMPC 54- We utilize specific environmental criteria for our suppliers. | f | 26 | 54 | 60 | 162 | 85 | 3,58 | 1,17 |
| % | 6,7 | 14,0 | 15,5 | 41,9 | 22,0 | ||||
| 11 | GMMPC 57- We emphasize the 'eco-friendly business' image in our promotional activities. | f | 31 | 74 | 70 | 134 | 78 | 3,40 | 1,22 |
| % | 8,0 | 19,1 | 18,1 | 34,6 | 20,2 | ||||
| 12 | GMMPC 60- We highlight that our products are green in our advertisements. | f | 19 | 69 | 74 | 155 | 70 | 3,49 | 1,12 |
| % | 4,9 | 17,8 | 19,1 | 40,1 | 18,1 | ||||
Table 14.
Normality analysis.
| Scale and Sub-dimensions | Kolmogorov-Smirnov | Central Tendency Measurements | |||||
| Statistic | df | Sig. | Mean | Median | Skewness | Kurtosis | |
| GMMPC | 0,083 | 387 | 0,000 | 3,461 | 3,583 | -0,512 | 0,026 |
Table 15.
EFA ve PA.
| Items |
Factor Load value (SPSS) |
Cron. Alfa (α) |
PA Results | |||
| (Ncases: 387; Nvar: 12; Ndataset:100; Percent: 95; Brian Oc) | ||||||
| Raw Data | Means | Percently | ||||
| 1 st dimension | α= 0,855 | 6,132 | 1,297 | 1,346 | ||
| % of Variance: 47,755 ;Eigen-value: 6,132 | ||||||
| GMMPC 52 | We inform consumers about the environmental management within our company. | 0,819 | ||||
| GMMPC 53 | We participate in sponsorship activities related to environmental issues. | 0,726 | ||||
| GMMPC 54 | We utilize specific environmental criteria for our suppliers. | 0,847 | ||||
| GMMPC 57 | We emphasize the 'eco-friendly business' image in our promotional activities. | 0,648 | ||||
| GMMPC 60 | We highlight that our products are green in our advertisements. | 0,491 | ||||
| 2 nd dimension | α= 0,858 | 1,334 | 1,217 | 1,265 | ||
| % Of Variance: 8,450 ;Eigen-Value: 1,334 | ||||||
| GMMPC 3 | Our materials sustain less damage (such as breakage, spoilage) due to our green packaging approach. | -0,793 | ||||
| GMMPC 4 | The green packaging approach reduces our packaging waste. | -0,946 | ||||
| GMMPC 5 | Green packaging practices make our products even lighter. | -0,690 | ||||
| 3 rd dimension | α= 0,876 | 1,208 | 1,158 | 1,200 | ||
| % Of Variance: 6,437 ;Eigen-Value: 1,208 | ||||||
| GMMPC 31 | We utilize green vehicles in our distribution channel. | 0,863 | ||||
| GMMPC 33 | We use less fuel thanks to green transportation. | 0,847 | ||||
| GMMPC 35 | We monitor emissions resulting from product distribution. | 0,611 | ||||
| GMMPC 46 | We select cleaner transportation systems. | 0,543 | ||||
| Extraction Method: Maximum Likelihood (ML) | ||||||
| Rotation Method: Direct Oblimin | ||||||
| KMO: 0,905; | ||||||
| Bartlett’s sphericity test; (χ2=2.620,395; df=66; p=,000) | ||||||
Table 16.
Goodness-of-Fit Indices.
| X2(df) | p | RMSEA | CFI | GFI | SRMR | AVE | CR |
| 2.563 | 0.000 | 0.064 | 0.970 | 0.949 | 0.037 | 0.605 | 0.970 |
Table 17.
Unidimensionality analysis (Kaiser-Guttman Criterion).
| Factors | No. of items | 1. Eigenvalue | 2. Eigenvalue |
3. Eigenvalue |
4. Eigenvalue |
Total Variance |
| GMMPC | 12 | 6,132 | 1,334 | 1,208 | 0,561 | 62,603 |
Table 18.
Correlation table.
| Items | 1 | 2 | 3 | 4 | 5 | 6 | 7 | 8 | 9 | 10 | 11 | 12 | 13 | 14 | 15 |
| GMMPC 3 | 1 | ||||||||||||||
| GMMPC 4 | ,743** | 1 | |||||||||||||
| GMMPC 5 | ,603** | ,641** | 1 | ||||||||||||
| GMMPC 31 | ,390** | ,324** | ,346** | 1 | |||||||||||
| GMMPC 33 | ,352** | ,367** | ,297** | ,704** | 1 | ||||||||||
| GMMPC 35 | ,419** | ,358** | ,291** | ,589** | ,573** | 1 | |||||||||
| GMMPC 46 | ,426** | ,372** | ,327** | ,562** | ,586** | ,601** | 1 | ||||||||
| GMMPC 52 | ,369** | ,384** | ,343** | ,326** | ,339** | ,406** | ,463** | 1 | |||||||
| GMMPC 53 | ,468** | ,375** | ,339** | ,455** | ,442** | ,503** | ,547** | ,599** | 1 | ||||||
| GMMPC 54 | ,464** | ,436** | ,427** | ,394** | ,395** | ,431** | ,509** | ,641** | ,682** | 1 | |||||
| GMMPC 57 | ,430** | ,420** | ,434** | ,408** | ,412** | ,432** | ,413** | ,599** | ,530** | ,635** | 1 | ||||
| GMMPC 60 | ,463** | ,378** | ,431** | ,468** | ,433** | ,494** | ,529** | ,493** | ,585** | ,540** | ,551** | 1 | |||
| GMMPC 1st dimension |
,894** | ,903** | ,844** | ,402** | ,385** | ,406** | ,427** | ,415** | ,449** | ,503** | ,486** | ,482** | 1 | ||
| GMMPC 2nd dimension |
,474** | ,424** | ,376** | ,853** | ,851** | ,831** | ,815** | ,457** | ,581** | ,515** | ,497** | ,574** | ,483** | 1 | |
| GMMPC 3 rd. dimension |
,535** | ,487** | ,482** | ,500** | ,493** | ,553** | ,600** | ,820** | ,829** | ,855** | ,815** | ,768** | ,570** | ,640** | 1 |
| GMMPC | ,713** | ,672** | ,634** | ,696** | ,687** | ,715** | ,738** | ,702** | ,764** | ,767** | ,736** | ,742** | ,765** | ,846** | ,907** |
Table 19.
Measurement model.
| Items | β1 | β2 | Ss | t | p | CR | AVE | ||
| Measurement model | |||||||||
| GMMPC 3 | ← | 2 nd.dimension | 0,860 | 1,000 | 0,970 | 0,605 | |||
| GMMPC 4 | ← | 2nd.dimension | 0,860 | 0,951 | 0,051 | 18,742 | <0,001 | ||
| GMMPC 5 | ← | 2 nd.dimension | 0,728 | 0,785 | 0,050 | 15,642 | <0,001 | ||
| GMMPC 31 | ← | 3 rd. dimension | 0,723 | 1,000 | |||||
| GMMPC 33 | ← | 3 rd. dimension | 0,725 | 0,957 | 0,057 | 16,705 | <0,001 | ||
| GMMPC 35 | ← | 3 rd. dimension | 0,774 | 1,108 | 0,082 | 13,590 | <0,001 | ||
| GMMPC 46 | ← | 3 rd. dimension | 0,798 | 1,041 | 0,075 | 13,904 | <0,001 | ||
| GMMPC 52 | ← | 1 st dimension | 0,759 | 1,000 | |||||
| GMMPC 53 | ← | 1 st dimension | 0,796 | 0,999 | 0,064 | 15,662 | <0,001 | ||
| GMMPC 54 | ← | 1 st dimension | 0,819 | 1,016 | 0,063 | 16,139 | <0,001 | ||
| GMMPC 57 | ← | 1 st dimension | 0,746 | 0,973 | 0,067 | 14,622 | <0,001 | ||
| GMMPC 60 | ← | 1 st dimension | 0,730 | 0,872 | 0,065 | 13,484 | <0,001 | ||
β1: Standard Coefficients, β2: Non-Standard Coefficients.
Table 20.
Invariance analysis.
| Model | χ2 | df | χ2/df | SRMR | CFI | RMSEA | ∆χ2 | ∆df | ∆CFI | p-value for ∆χ2 | |
| Grup1 | 71,927 | 49 | 1,468 | 0,028 | 0,977 | 0,054 | - | - | - | ||
| Grup2 | 125,574 | 49 | 2,563 | 0,037 | 0,970 | 0,064 | - | - | - | ||
|
Model 1: Configural |
197,501 | 98 | 2,015 | 0,037 | 0,972 | 0,043 | - | - | - | ||
| Model 2: Weak (Metric) | 202,34 | 107 | 1,891 | 0,036 | 0,973 | 0,04 | 4,839 | 9 | 0,001 | 0,024 | |
| Model 3: Scalar | 204,106 | 113 | 1,806 | 0,036 | 0,975 | 0,038 | 1,766 | 6 | 0,002 | 0,009 | |
| Model 4: Strong | 214,827 | 127 | 1,692 | 0,037 | 0,976 | 0,036 | 10,721 | 14 | 0,001 | 0,050 | |
|
Model 5: Partial (GMMPC 3-a1) |
198,481 | 99 | 2,005 | 0,037 | 0,972 | 0,043 | 16,346 | 28 | 0,004 | 0,082 | |
| ∆χ2: χ2 change (|χ2n- χ2n-1|); ∆df: df change (|dfn-dfn-1|); ∆χ2/df: χ2/df change (|χ2n/ dfn -| χ2n-1/ dfn-1); ∆CFI: CFI change (|CFIn- CFIn-1|); ∆CFI<0,01**; p-value for ∆χ2: χ2 significance value of change (p<0,05*) | |||||||||||
Table 21.
GMMPC scale-factors, items and factor loadings.
|
Factors (Sub-dimensions) |
GMMPC Scale items | Factor loading | |
|
1 st.dimension: Environmental publicity |
We inform consumers about the environmental management within our company | 0.819 | |
| We participate in sponsorship activities related to environmental issues. | 0.726 | ||
| We utilize specific environmental criteria for our suppliers | 0.847 | ||
| We emphasize the 'eco-friendly business' image in our promotional activities | 0.648 | ||
| We highlight that our products are green in our advertisements | 0.491 | ||
|
2 nd.dimension: Green Packaging |
Our materials sustain less damage (such as breakage, spoilage) due to our green packaging approach. | 0.793 | |
| The green packaging approach reduces our packaging waste | 0.946 | ||
| Green packaging practices make our products even lighter | 0.690 | ||
|
3 rd.dimension: Green Distribution |
We utilize green vehicles in our distribution channel | 0.863 | |
| We use less fuel thanks to green transportation | 0.847 | ||
| We monitor emissions resulting from product distribution | 0.611 | ||
| We select cleaner transportation systems | 0.543 | ||
Disclaimer/Publisher’s Note: The statements, opinions and data contained in all publications are solely those of the individual author(s) and contributor(s) and not of MDPI and/or the editor(s). MDPI and/or the editor(s) disclaim responsibility for any injury to people or property resulting from any ideas, methods, instructions or products referred to in the content. |
© 2025 by the authors. Licensee MDPI, Basel, Switzerland. This article is an open access article distributed under the terms and conditions of the Creative Commons Attribution (CC BY) license (http://creativecommons.org/licenses/by/4.0/).
Copyright: This open access article is published under a Creative Commons CC BY 4.0 license, which permit the free download, distribution, and reuse, provided that the author and preprint are cited in any reuse.


