Submitted:
07 May 2025
Posted:
07 May 2025
You are already at the latest version
Abstract
Tomato crops are treated with high concentrations of synthetic fertilizers and insecticides to increase yields, but the careless use of these chemicals harms the environment, human health, and plant pathogen resistance. The effect of the foliar application of three concentrations of chitosan (500, 1000, and 2000 mg L-1) on plant growth, yield, and physiological performance in two tomato varieties (Candela F1 and Floradade) was determined. Morphometric variables (height, stem diameter, and root, stem, and leaf dry biomass); production (number of bunches, number of fruits, and fruit weight), and physiological traits (water potential, gas exchange, leaf area index (LAI), and chlorophyll content (SPAD)) were evaluated throughout the experiment. Applying chitosan induced positive responses in biomass increase, yield, photosynthesis, SPAD, and LAI of the two tomato varieties. The responses of tomato plants to chitosan application were different depending on the variety evaluated, indicating a differential response to the biostimulant. Chitosan is an efficient compound to biostimulate the growth, positively modified the plants’ physiology, increasing the yield in both varieties of tomato. The use of chitosan in agriculture is a tool that has no negative effects on plants and the environment and can stimulate the productive capacity of tomato plants.
Keywords:
growth
; yield
; biostimulant
; photosynthesis
; correlation
1. Introduction
Tomato (Solanum lycopersicum L.) is one of the most important horticultural crops in the world due to its industrialization, consumption, and nutritional and organoleptic properties [1,2]. It is cultivated in different soil and climatic conditions, both in open fields and greenhouses. Its demand continuously increases, therefore so do its cultivation, production, and trade [3].
Currently, high doses of synthetic fertilizers and pesticides are used for tomato crop production to increase yields and control phytopathogens. However, synthetic fertilizers and pesticides cause damage to the environment, human health, and animal health, as well as resistance in phytopathogens [4,5]. Moreover, they impact soils, causing erosion, salinity, and the accumulation of heavy metals and nitrates. They also pollute the air through emissions of nitrogen oxides (NO, N2O, and NO2), contributing to the greenhouse effect [6,7,8].
Thus, there is a need to search for alternatives to synthetic chemical products that do not cause damage to the environment and increase crop yield [9,10]. One of the alternatives is the use of chitosan due to its biocompatibility, biodegradability, and bioactivity [11]. Chitosan is extracted from chitin present in crustacean exoskeletons [12], fungal cell walls [13], and insect cuticles [14], among others.
The positive effects of chitosan in agriculture have been demonstrated in that it induces defense responses in plants such as proteins related to pathogenesis, phytoalexins, and lytic enzymes [11,15,16,17]. It has also been used to increase the antagonistic capacity of beneficial microorganisms [18] as well as crop growth, productivity, and quality [19,20].
The foliar application of chitosan on different species (Zea mays, Sorghum bicolor, S. lycopersicum, and Cymbopogon flexuosus) has shown positive effects on chlorophyll and carotenoid content, total nitrogen content, and phosphorus content [21,22,23,24,25], improving chlorophyll fluorescence, carboxylation efficiency, and, therefore, net photosynthesis rate (A). Additionally, it affects stomatal conductance (gs), regulating transpiration rate (E) and water use efficiency (WUE) [25,26,27,28,29,30]. All these effects translate into an increased photosynthetic process and, consequently, an improvement in plant growth and development [18,31].
It was found that the increase in productivity of S. bicolor in response to foliar application of chitosan was associated with higher A, E, and gs, showing a higher harvest index and greater tolerance to water deficit [30]. It has been suggested that the foliar application of chitosan, especially when dissolved in ascorbic or citric acid, could be used to stimulate tomato plants grown under salinity stress [32]. Soil and foliar applications of chitosan nanoparticles to Triticum aestivum [33], Catharanthus roseus [34], and Z. mays [35] mitigated the adverse effects of drought by increasing chlorophyll concentration, A, antioxidant enzyme activity, relative water content, yield, and biomass [35].
Chitosan alleviated photosynthetic limitations and enhanced enzymatic antioxidative defense, including superoxide dismutase (SOD), catalase (CAT), and peroxidase (POD) activities that minimized salt stress-induced oxidative damage, improving gs and A to favor the overall development of C. flexuosus [29]. Chitosan is a biopolymer that increases crop growth, development, and yield [19,20]. Reyes-Pérez et al. [36] have shown that chitosan increases seed germination, plant vigor, and agricultural yield. In addition, chitosan improves nutrient assimilation in plants [37]. The application of chitosan has increased the growth, development, germination, and yield of bell pepper, cucumber, lettuce, and carrot crops [38,39,40].
Due to the positive effects of chitosan on different plant species, the objective was to determine the impact of the foliar application of chitosan on the agronomic and physiological parameters of plants of two tomato varieties and to determine whether chitosan positively affects the growth, physiological performance and yield of tomato plants.
2. Materials and Methods
2.1. Study Site
The present research was carried out at La María Campus of the Quevedo State Technical University (UTEQ), Ecuador, with the following geographical coordinates: 79° 27“ West longitude and 1° 06” South latitude. The altitude is 75 masl, average annual temperature is 24º C, relative humidity is 84%, and average annual rainfall is 2,295 mm.
2.2. Experimental Design and Treatments
A completely randomized design with a bifactorial arrangement was used, where Factor A was the tomato varieties (Floradade and Candela F1), the certified seeds being acquired from Agrosad productos agropecuarios (Quito, Ecuador). Factor B comprised three concentrations of chitosan (500, 1000, and 2000 mg L-1) (medium molecular weight; Sigma-Aldrich) plus a control, with a total of eight treatments and three replicates per treatment.
2.3. Experiment Management
Seeding was carried out in plastic 2 mm-deep germination trays, using as substrate a mixture of four parts soil, two parts organic matter (compost), and one part sand. The trays were covered with plastic for 48 hours to facilitate germination and growth. Transplanting was performed when the plants reached an average height of 15 cm in pots of approximately 8 kg, which contained the aforementioned substrate. The soil used had a loamy texture (32% sand, 48% silt, and 20% clay), an organic matter content of 3.8%, and a pH of 6.0. After transplanting, the crop was grown for 120 days.
Trellising was carried out 21 days after transplanting, whereby a stake was tied to the trellis-work 10 centimeters from the base of the plant to provide support. One plant was placed in each pot to ensure the success of the transplant. Once the plants were transplanted, daily irrigation occurred using drinking water to maintain soil moisture close to field capacity. This helps cover the evapotranspiration requirements of the plants and avoids water stress that could affect crop yield. Broken, diseased, and/or old leaves were removed every week.
The chitosan was applied of three concentrations of chitosan (500, 1000, and 2000 mg L-1) by spraying the leaves at 6, 12, and 25 days after transplanting, and water was used as a control treatment. The experiment consisted of 3 rows per plot, with 9 plants per treatment (36 plants per row) and a total of 108 plants per tomato variety, for a total of 216 plants.
2.4. Microclimate
Photosynthetic photon flux density (PPFD) was measured with a quantum sensor and light meter (LI-250, LI-COR Inc., Lincoln, NE, USA). Leaf temperature was measured with thermistors (YSI 409B) connected to a Switch Craft LN4153-405 (8402-10, Cole-Parmer Instrument Company, IL, USA) and a tele-thermometer (Yellow Springs Instruments Co., Texas, USA). Air temperature and relative humidity in the greenhouse were measured with a HOBO Pro V2 logger, and data were stored in a HOBO Waterproof Shuttle (Onset Computer Corporation, Pocasset, MA, USA). The microclimatic variables were measured hourly between 07:00 and 17:00.
2.5. Morphometric Variables
The variables evaluated at 50 days after transplanting (DAT) were plant height (cm), stem diameter (mm), and root, stem, and leaf dry biomass (g). Plant height was measured from the base of the stem to the apex, and stem diameter was measured with a caliper. To obtain the dry biomass in all stages, the tissues corresponding to leaves, stems, or roots were placed in paper bags and placed in a drying oven (Shel-Lab®, model FX-5, series-1000203) at 80 °C until complete dehydration was achieved (approximately 72 hours). They were then weighed on an analytical balance (Mettler® Toledo, AG204), expressing the weight in grams of dry plant matter.
The number of bunches per plant was determined by counting five plants taken at random from each experimental unit, and the number of fruits per bunch was evaluated by counting plants taken at random from each experimental unit. In addition, the number of usable fruits was counted per plant within the useful area of each experimental unit in order to calculate the average per plant. For fruit weight, 10 randomly selected fruits were weighed, and their average was calculated. For the polar diameter of the fruit, all the fruits harvested from the plants of each treatment were measured with a tape measure to later obtain an average. The equatorial diameter of the fruit was measured in exactly the same way to obtain an average.
2.6. Physiological Variables
2.6.1. Leaf Water Potential
The morning leaf water potential (Ψam) was determined between 06:30 and 07:30 and the afternoon potential at 13:00 (Ψpm) using six fully expanded adult leaves of different plants from each treatment (n = 6) and a PMS 200 pressure chamber (PMS Instruments Inc., Corvallis, OR, USA).
2.6.2. Gas Exchange
Gas exchange was evaluated, including A, E, gs, intercellular CO2 concentration (Ci), and water use efficiency (WUE = A/E), using a CIRAS 2 portable infrared gas analyzer (PP Systems Inc., Amesbury, MA, USA). All measurements were performed on fully expanded and healthy adult leaves from 6 different plants in each treatment (n = 6) and the two tomato varieties. The conditions were as follows: ambient CO2 concentrations (Ca) of 420 ± 10 ppm, 21% O2, temperatures of 28 ± 1 °C, PPFD of 1000 ± 50 µmol m-2 s-1, and leaf-air water vapor pressure deficit (VPD) of 1.2–1.6 KPa. The gas exchange analysis was performed between 8:30 and 15:00.
2.6.3. Leaf Area Index Measurement
The leaf area index (LAI) of tomato plants from the two varieties in each treatment was determined using a plant canopy analyzer (LAI-2200 C, Li-COR, Lincoln, NE, USA). Six randomly chosen plants were measured for each treatment (n = 6), with a homogeneous canopy, using the plant canopy analyzer sensor wand, complemented with a 90° cover to block the equipment operator and the canopy of nearby plants. Measurements were taken with the sensor outside the canopy and below in the direction of the 4 cardinal points (north, south, east, and west).
2.7. Chlorophyll Content
Chlorophyll content was determined using a SPAD-502 Plus chlorophyll meter (Minolta, Japan). SPAD units are directly proportional to leaf chlorophyll content. Chlorophyll concentration was measured in 5 different leaf leaves on 6 different plants for each treatment (n = 6).
2.8. Statistical Analysis
Statistica version 10 software was used to perform the two-way analysis of variance (ANOVA): factor 1 being chitosan concentration and factor 2 being tomato variety for the evaluated variables. Fisher’s least significant difference (LSD) a posteriori test was applied to determine the significance (p < 0.05) of differences observed in the variables studied. The SigmaPlot 11.0 program was used to create the corresponding graphs. In addition, a Pearson’s correlation analysis, hierarchical cluster analysis, and principal component analysis were performed using Origin software (v2016). For the hierarchical cluster analysis of the variables, the group average as the cluster method and Pearson’s correlation as distance type were used.
3. Results
3.1. Microclimate
The maximum PPFD values were observed in the afternoon, with values of 350 and 150 μmol m-2 s-1 above the canopy and below the crop, respectively. The lowest temperatures were found in the morning hours (23 °C). In the afternoon, the air and leaf temperature of Candela F1 was 36 °C, while in Floradade it was 34 °C (Figure 1). In the morning hours, the maximum RH (90 %) was observed, while the minimum RH (44 %) were recorded in the afternoon.
3.2. Morphometric Variables
Chitosan (1000 mg L-1) only caused a significant increase in plant height in the Candela F1 tomato variety. In both tomato varieties, the highest results were obtained with the highest dose of chitosan (2000 mg L-1). In the Floradade variety, diameter was not affected by the 500 and 1000 mg L-1 doses of chitosan. However, in the Candela F1 variety, all chitosan treatments were superior to the control treatment. The dry biomass of all organs was higher in Floradade than in Candela F1; chitosan caused a significant increase in the dry biomass of all plant organs with respect to the control treatment. The Sh/R ratio was not affected much by chitosan in Floradade, while it caused a significant increase in Candela F1 (Table 1).
Both varieties showed an increase in fruit yield with increasing chitosan concentrations. In Floradade, the yield increased from 5.41 t ha-1 in the control to 8.21 t ha-1 with 2000 mg L-1 of chitosan, showing an increasing trend with higher concentrations. Similarly, yield increased in Candela F1 from 5.03 to 7.67 t ha-1 under the same conditions. In terms of the total number of bunches, the Floradade variety experienced a significant increase from 2.07 in the control to 3.07 with 2000 mg L-1 of chitosan. The 2000 mg L-1 treatment was significantly different in this variable from the rest of the treatments. In the Candela F1 variety, there were no significant differences between the control and chitosan treatments for this variable (Table 2).
In the number of fruits harvested, the Floradade variety showed no differences between the control treatment and the different concentrations of chitosan. Candela F1, meanwhile, showed a significant increase in the number of fruits harvested with the highest chitosan concentration (2000 mg L-1). However, the 500 and 1000 mg L-1 treatments showed no significant differences with the control treatment. In polar and equatorial fruit diameters, both varieties showed an increase for both diameters as chitosan concentration increased. The greatest increase was obtained in the Floradade variety, where the polar diameter increased from 15.1 mm in the control to 21.2 mm with 2000 mg L-1 and the equatorial diameter from 16.7 mm to 23.6 mm (Table 2).
3.3. Water Potential
Morning leaf water potential (Ψam) at 38 DAT showed no significant difference between the two varieties in any of the treatments studied. The control treatment plants had a higher Ψam, and when chitosan was applied at 1000 mg L-1 the values of Ψam were close to -0.2 MPa in both varieties. The afternoon leaf water potential (Ψpm) of the two varieties and for all treatments did not vary significantly, with a tendency to decrease in both varieties, the decrease being more accentuated in Candela F1. It is noteworthy that with applications of chitosan at 2000 mg L-1 in the afternoon, there was a greater decrease in Ψpm in Candela F1, whose results were the opposite in the morning (Figure 2).
At 58 DAT, significant differences were only found for the Ψpm between both varieties when chitosan was applied at 2000 mg L-1 in the morning hours, with the difference in the same hours with respect to 38 DAT. The Ψpm of the plants at 58 DAT was lower, and with the dose of 2000 mg L-1 at 58 DAT, Candela F1 presented a lower Ψpm than Floradade. But at 38 DAT, the Floradade variety had the lowest Ψpm. In the afternoon, there were no significant differences between the two varieties across all treatments, and an increase in plant Ψpm was generally observed in both varieties (Figure 2).
3.4. Gas Exchange
The net photosynthetic rate (A) and transpiration rate (E) at 38 and 58 DAT for the two tomato varieties plus the control showed significant differences between the three doses of chitosan applied and between the two varieties studied (Figure 3). At both 38 and 58 DAT, chitosan applications at the different doses did not cause significant variations in gs, Ci, or WUE between the two varieties, nor between treatments. At 58 DAT, E was lower in both varieties and for all treatments (Figure 3). Similar results were achieved for gs, Ci, and WUE. The distinctive feature for the latter was that at 58 DAT there was an increase in WUE in the treatments compared to 38 DAT which could be considered a consequence of the decrease in E at that age of the crop (Figure 3).
3.5. Leaf Area Index
The LAI at 38 and 58 DAT showed significant differences between the two vegetative phases evaluated in the two varieties and in the different doses of chitosan used in the research, whose values were between 2.0 and 2.5. At 38 DAT, the Floradade variety reached a significantly higher LAI than the Candela F1 variety in the control treatment, in which no chitosan was applied (Figure 4).
The application of the three dosages of chitosan stimulated the leaf development in the Candela F1 variety, which resulted in no significant differences in the LAI values with respect to the Floradade variety. At 58 DAT, when chitosan was applied at 1000 and 2000 mg L-1, there were significant differences in the LAI when comparing both varieties in that Candela F1 reached higher LAI values, contrary to the results achieved at 38 DAT. The control treatment and the application of chitosan at 500 mg L-1 did not cause significant differences in this index between the two varieties (Figure 4).
3.6. Chlorophyll Content
Chlorophyll content (SPAD) evaluated at 38 DAT no significant differences were found among the varieties for the control treatment and the 500 and 1000 mg L-1 treatments, whereas with the 2000 mg L-1 dose, the Floradade variety significantly surpassed Candela F1. At 58 DAT, the same trend was observed with the difference that with 2000 mg L-1 of chitosan, the chlorophyll content of Floradade was not statistically superior to Candela F1 (Figure 5).
3.7. Multivariate Analysis
Pearson’s correlation analysis shows a positive correlation in most of the agronomic parameters (TC, NHF, FPD, FED, FY, RDW, SDW, LDW, and ShDW), as well as with Ψpm at 58 DAT, LAI at 38 DAT, A, A2, and SPAD units (Figure 6a). In contrast, LAI at 58 DAT (LAI2), Sh/R ratio, Ψpm at 38 DAT, Ci at 38 DAT, and WUE at 58 DAT (WUE2) were negatively correlated with agronomic parameters.
The results of the Principal Component Analysis (PCA) of the evaluated variables show that the main axis of variation explained 45.9% of the data, while the second axis explained 17.0% (Figure 7b). The Biplot shows 4 groups of treatments associated with different variables: One group comprises Candela F1 control (C-0) and Candela F1-500 mgL-1 (C-500) which are negatively associated with Ci at 38 DAT. Another group, formed by Candela F1-1000 mgL-1 (C-1000) and Candela F1-2000 mgL-1 (C-2000), is negatively associated with LAI2, Ψpm, WUE2, Sh/R, gs, and E. A group formed by the treatments Floradade Control (F-0) and Floradade-1000 mgL-1 (F-1000) is positively associated with practically all agronomic and physiological parameters. And finally, the group with Floradade-2000 mgL-1 (F-2000), and Floradade-500 mgL-1 (F-500) is negatively associated with physiological variables at 58 DAT (A2, E2, gs2, Ψam2 and Ψpm2) and RDW (Figure 6b).
4. Discussion
Chitosan is a very interesting compound, with particular characteristics that make it a very useful tool for agriculture. This research demonstrated that the foliar application of chitosan induced positive responses in growth (increase in plant height, stem diameter and root, stem, and leaf biomass), yield, and physiological performance (net photosynthetic rate, chlorophyll content, and leaf area index) in the two tomato varieties studied. Therefore, chitosan application is an alternative to reduce the use of synthetic fertilizers and improve tomato yield. The responses of tomato plants to chitosan application were different depending on the variety evaluated, indicating a differential response to the biostimulant.
Similar to what was found in this study, an increase in tomato plant height with chitosan application has been reported by other authors [20]. Amirkhani [41] reported that the application of biostimulants increased plant height compared to the control treatment in broccoli (Brassica oleracea). The increase in crop growth and development when chitosan is applied is related to the increased availability and uptake of nutrients and the photosynthesis process through the accumulation of metabolites and increased foliar pigments [42].
Chitosan has been applied to leaves as an effective biostimulant in different crops such as S. lycopersicum [18], T. aestivum [33], Z. mays [35], Curcuma longa [43], Ocimum ciliatum and Ocimum basilicum [44], and Pisum sativum [45,46]. These authors obtained results consistent with what was observed in this study (Table 1) since the application of chitosan generally produced positive effects on plant growth.
The effects of chitosan on plant growth and development have been linked to an increase in plant chlorophyll content after chitosan application [38,47]. In addition, the agronomic responses of chitosan-treated plants are related to increased plant resistance to phytopathogens [11].
The application of chitosan increased stem diameter in the tomato crop with respect to the control treatment, results that agree with those obtained by Reyes-Pérez et al. [20]. Other authors also found that increasing the dose of chitosan increases stem diameter in tomato crops as well as plant growth [48]. Similarly, in tobacco (Nicotiana tabacum L), stem diameter increased with the application of chitosan, showing significant differences with the control treatment [49]. It has been shown that chitosan stimulates the proliferation of initial spindle and radial cells, which is reflected in an increase in stem diameter [48].
The application of biostimulants such as chitosan stimulates the production of secondary metabolites, e.g., alkaloids, phytoalexins, flavonoids, lignin, and compounds with protective functions, which could trigger cell thickening and, therefore, cause an increase in plant growth and development [50].
Regarding biomass, similar results to those reported in this work were obtained by Chanaluisa-Saltos et al. [51] in tomato cultivation. They observed that the application of chitosan increased the fresh root biomass, showing significant differences with the control treatment. Also, the application of a biostimulant (vermicompost humates) in tomato crops increased root dry mass, showing significant differences with the control treatment, results that correlate with those obtained in this work [52].
In bell pepper plants, an increase in fresh and dry biomass was obtained with the application of biostimulants such as humic acids, chitosan, and mycorrhizal fungi [53]. Applying chitosan to tomato plants increased the fresh and dry biomass of the stem and leaves, similar to our results [54]. The rise in nutrient content in the soil through the application of biostimulants is reflected in an increase in the crops’ biomass and dry matter production [55].
When chitosan has been applied to the soil, it positively influences plant nutrition, especially when combined with other fertilizers, with the great advantage of not affecting beneficial soil microorganisms [16]. This is because chitosan can function as a very efficient nutrient or biostimulant carrier [5]. This will also indirectly induce positive responses in plant growth and development.
In agreement with our investigation (Table 1), the application of chitosan has induced positive responses in the growth of a variety of agricultural crops. The foliar application of chitosan at a concentration of 2.5 mg/mL to tomato plants (S. lycopersicum cv. MicroTom) caused the number of flowers to increase [18]. A concentration of 0.1 % chitosan applied to T. aestivum leaves induced a higher chlorophyll content, in addition to increasing the activity of the enzyme peroxidase [33].
In Z. mays plants, an increase in chlorophyll content and a larger stem diameter were observed with the foliar application of chitosan at a concentration of 0.01 % [35]. Meanwhile, in O. ciliatum plants, a higher chlorophyll and proline content was observed with the foliar application of chitosan at a concentration of 0.2–0.4 g/L [44]. In our work, a trend of increased SPAD units was observed with the application of chitosan, which potentially indicates a higher chlorophyll content in the leaves. In addition to the changes induced by the application of chitosan on chlorophyll content, it also has a positive impact on phenol content since it modifies the activity of the enzyme phenylalanine ammonia-lyase. This was observed in P. sativum plants where chitosan was foliar applied at a concentration of 100 mg L-1 [45].
It has been shown that chitosan causes stomatal closure in plants, preventing water losses via transpiration [56]. However, stomatal conductance is strongly influenced by soil water availability. When water is a limiting factor, the plant responds by closing its stomata to reduce water loss through transpiration, resulting in a reduction of stomatal conductance [57,58]. In our study, no significant differences in stomatal conductance were observed between the chitosan treatments and the control; these results may be due to the fact that there was no water deficiency in the experimental environment.
The two tomato varieties treated with chitosan showed differences with the control treatment in A and E. However, there was no variation in gs, Ci, or WUE with respect to the control; these results indicate that the increase in CO2 assimilation at the expense of a large loss of water by transpiration generated a decrease in WUE, affecting the leaf water status. In S. bicolor in response to the foliar application of chitosan, a higher harvest index was associated with higher A and gs values [30]. The soil and foliar application of chitosan nanoparticles to T. aestivum, C. roseus, and Z. mays mitigated the adverse effects of drought by increasing chlorophyll concentration and A [33,34,35].
Chitosan did not significantly increase WUE in the two varieties studied. It appears that its use would be more convenient in minor or occasional drought situations. Under these conditions, chitosan would allow plants to use their natural and physiological mechanisms to rapidly recover maximum carbohydrate uptake, maintaining biomass production and yield [59]. The non-significant differences in WUE of chitosan-treated plants compared to the control suggest that A and gs change proportionally, reducing assimilated carbon as water consumption decreases [60]; however, it is important to bear in mind that WUE was evaluated in the leaves.
In the case of the SPAD index in the two tomato varieties (Floradade and Candela F1), none of the chitosan treatments showed differences with the control. These results are similar to those reported by Morales-Guevara et al. [61], who reported no differences between the chitosan-based biostimulant treatments (QuitoMax®) and that at the times when they were most distant, the values did not exceed 0.2 SPAD units. The results suggest that the plants had an adequate supply of nutrients, so their availability was not a limiting factor for their normal development. Furthermore, it can be inferred that the photosynthetic system of the leaves maintained its integrity, which ensures favorable conditions for plant development.
The PCA with its two main axes explained 62. 9 % of the variation of all the data obtained. Four well-defined groups were found, which were corroborated by cluster analysis. These were: 1) the Candela F1 control and Candela F1-500 mgL-1; 2) Candela F1-1000 mgL-1; 3) Candela F1-2000 mgL-1 and Floradade-1000 mgL-1 (negatively associated with the physiological variables LAI, Ψpm, WUE, gs, and E); and 4) Floradade Control, Floradade-500mg L-1 and Floradade-2000 mg L-1 (positively associated with virtually all agronomic and physiological parameters). This grouping supports the fact that depending on the tomato variety, a different agronomic and physiological response to chitosan application was obtained.
5. Conclusions
The responses of the tomato plants to chitosan application were different depending on the variety evaluated. This indicates that the biostimulant capacity in tomato crops is largely determined by the plant species and even the crop variety. Chitosan is an efficient compound to biostimulate the growth and development of tomato plants, in addition to positively modifying tomato physiology, which can potentially increase the yield of agricultural crops. Therefore, the use of chitosan in agriculture can be a useful tool to increase the productive capacity of crops, with the advantages of being an easily accessible compound and having no negative effects on crops or the environment.
Supplementary Materials
The following supporting information can be downloaded at the website of this paper posted on Preprints.org.
Author Contributions
Author Contributions: Conceptualization, J.J.R.-P; methodology, J.J.R.-P., L.T.LL.-R, and W.T.; software, W.T., V.R., J.J.R.-P., L.G.H.-M and A.J.-M.; validation, W.T., V.R., L.T.LL.-R and A.J.-M; formal analysis, J.J.R.-P., W.T. and L.G.H.-M.; investigation, J.J.R.-P., L.T.LL.-R., V.R. and W.T.; resources, J.J.R.-P..; data curation, J.J.R.-P., W.T. and R.A.P.-G.; writing—original draft preparation, J.J.R.-P. and W.T.; writing—review and editing, J.J.R.-P., W.T. and, L.G.H.-M; supervision, J.J.R.-P., L.T.LL.-R and W.T.; project administration, J.J.R.-P.; funding acquisition, J.J.R.-P. All authors have read and agreed to the published version of the manuscript.
Funding
Please add: This research was funded by the Scientific and Technological Research (FOCICYT), , grant number PFOC9-07-2023.
Data Availability Statement
We encourage all authors of articles published in MDPI journals to share their research data. In this section, please provide details regarding where data supporting reported results can be found, including links to publicly archived datasets analyzed or generated during the study. Where no new data were created, or where data is unavailable due to privacy or ethical restrictions, a statement is still required. Suggested Data Availability Statements are available in section “MDPI Research Data Policies” at https://www.mdpi.com/ethics.
Acknowledgments
To the State Technical University of Quevedo, for the support granted through the Competitive Fund for Scientific and Technological Research (FOCICYT) 9th Call, through the project PFOC9-07-2023 “Response of horticultural crops to selenium application under controlled conditions.”.
Conflicts of Interest
The authors declare no conflicts of interest.
References
- Campos, M.D.; Felix, M.D.R.; Patanita, M.; Materatski, P.; Albuquerque, A.; Ribeiro, J.A.; Varanda, C. Defense strategies: The role of transcription factors in tomato–pathogen interaction. Biology, 2022, 11(2), 235. [CrossRef]
- Meng, F.; Li, Y.; Li, S.; Chen, H.; Shao, Z.; Jian, Y.; Mao, Y.; Liu L.; Wang, Q. Carotenoid biofortification in tomato products along whole agro-food chain from field to fork. rends Food Sci Technol. 2022, 124, 296-308. [CrossRef]
- Terry Alfonso, E.; Falcón Rodríguez, A.; Ruiz Padrón, J.; Carrillo Sosa, Y.; Morales Morales, H. Respuesta agronómica del cultivo de tomate al bioproducto QuitoMax®. Cultivos Tropicales, 2017, 38(1), 147-154.
- Torres-Rodriguez, J.A.; Reyes-Pérez, J.J.; Quiñones-Aguilar, E.E.; Hernandez-Montiel, L.G. Actinomycete potential as biocontrol agent of phytopathogenic fungi: Mechanisms, source, and applications. Plants, 2022, 11(23), 3201.
- Sabiha-Javied., Siddque, N., Waheed, S., Uz Zaman, Q.; Aslam, A.; Tufail, M.; Nasir, R. Uptake of heavy metal in wheat from application of different phosphorus fertilizers. J. Food Compos. Anal., 2023, 115, 104958. [CrossRef]
- Guangbin, Z.; Kaifu, S.; Xi, M.; Qiong, H.; Jing, M.; Huang Q.; Ma, J.; Gong H.; Zhang Y.; Paustian, K.; Yan, X.; Hua, X. Nitrous oxide emissions, ammonia volatilization, and grain-heavy metal levels during the wheat season: Effect of partial organic substitution for chemical fertilizer. Agric. Ecosyst. Environ., 2021, 311, 107340. [CrossRef]
- Li, R.; Liu, B.; Xu, W.; Yu, L.; Zhang, C.; Cheng, J.; Tao, L.; Li Z; Zhang, Y. DNA damage and cell apoptosis induced by fungicide difenoconazole in mouse mononuclear macrophage RAW264. 7. Environ. Toxicol. 2022, 37(3), 650-659. [CrossRef]
- Wang, Q.; Mao, Y.; Li, S.; Li, T.; Wang, J.; Zhou, M.; Duan, Y. Molecular mechanism of Sclerotinia sclerotiorum resistance to succinate dehydrogenase inhibitor fungicides. J. Agric. Food Chem. 2022, 70(23), 7039-7048.
- Reyes-Pérez, J.J.; Rodríguez-Rodríguez, S.; Torres-Rodríguez, J.A.; Llerena-Ramos, L.T.; Hernández-Montiel, L.G.; Ruiz-Espinoza, F.H. Biofortificación con Silicio en el Crecimiento y Rendimiento de Pimiento (Capsicum annuum L.) en Ambiente Controlado. Terra Latinoamericana, 2023, 41, 1-10. [CrossRef]
- Torres-Rodriguez, J.A.; Ramos-Remache, R.A.; Reyes-Pérez, J.J.; Quinatoa-Lozada, E.F.; Rivas-García, T. (2024). Silicio como Bioestimulante en el Cultivo de Cacao (Theobroma cacao L.) y Agente de Control Biológico de Moniliophthora roreri. 2024, 42, 1-11 e1817. [CrossRef]
- Torres-Rodriguez, J.A.; Reyes-Perez, J. J.; Castellanos, T., Angulo, C.; Quinones-Aguilar, E. E.; Hernandez-Montiel, L.G; A biopolymer with antimicrobial properties and plant resistance inducer against phytopathogens: Chitosan. Not Bot Horti Agrobo., 2021, 49(1), 12231-12231.
- Qiu, S.; Zhou, S.; Tan, Y.; Feng, J.; Bai, Y.; He, J.; Cao, H.; Che, Q.; Guo, J.; Su, Z. Biodegradation and Prospect of Polysaccharide from Crustaceans. Mar. Drugs 2022, 20, 310. [CrossRef]
- Mohan, K., Ganesan, A.R., Ezhilarasi, P.N., Kondamareddy, K. K., Rajan, D. K., Sathishkumar, P., Rajarajeswaran, J., Conterno, L. Green and eco-friendly approaches for the extraction of chitin and chitosan: A review. Carbohydr. Polym., 2022, 287, 119349. [CrossRef]
- Hahn, T.; Tafi, E.; von Seggern, N.; Falabella, P.; Salvia, R.; Thomä, J.; Febel E.; Fijalkowska M.; Schmitt E.; · Stegbauer, L.; Zibek, S. Purification of Chitin from Pupal Exuviae of the Black Soldier Fly. Waste Biomass Valor 2022, 13, 1993–2008. [CrossRef]
- Suarez-Fernandez, M., Marhuenda-Egea, F.C.; Lopez-Moya, F.; Arnao, M.B.; Cabrera Escribano, F.; Nueda, M.J.; Gunsé, B.; Lopez-Llorca L.V. Chitosan Induces Plant Hormones and Defenses in Tomato Root Exudates. Front. Plant Sci. 2020, 11:572087. [CrossRef]
- Singh, R.K.; Ruiz-May, E.; Rajput, V.D.; Minkina, T.; Gómez-Peraza, R.L.; Verma, K.K.; Shekhawat, M.S.; Pinto, C.; Falco, V.; Quiroz-Figueroa, F.R. Viewpoint of Chitosan Application in Grapevine for Abiotic Stress/Disease Management towards More Resilient Viticulture Practices. Agriculture 2022, 12, 1369. [CrossRef]
- Suwanchaikasem, P.; Nie, S.; Idnurm, A.; Selby-Pham, J.; Walker, R.; &Boughton, B. A. Effects of chitin and chitosan on root growth, biochemical defense response and exudate proteome of Cannabis sativa. PEI, 2023, 4(3), 115-133. [CrossRef]
- El Amerany, F.; Meddich, A.; Wahbi, S.; Porzel, A.; Taourirte, M.; Rhazi, M.; Hause, B. Foliar Application of Chitosan Increases Tomato Growth and Influences Mycorrhization and Expression of Endochitinase-Encoding Genes. Int. J. Mol. Sci. 2020, 21, 535. [CrossRef]
- Parvin, M.A.; Zakir, H.M.; Sultana, N.; Kafi, A.; Seal H.P. Effects of different application methods of chitosan on growth, yield and quality of tomato (Lycopersicon esculentum Mill.). Arch. Agric. Environ., 2019, 4(3): 261-267. [CrossRef]
- Reyes-Pérez, J.J.; Enríquez-Acosta, E.A.; Ramírez-Arrebato, M.Á.; Zúñiga Valenzuela, E.; Lara-Capistrán, L.; Hernández-Montiel, L.G. Efecto del quitosano sobre variables del crecimiento, rendimiento y contenido nutricional del tomate. Rev. Mex. Cienc. Agríc., 2020, 11(3), 457-465.
- Hussain, I.; Ahmad, S.; Ullah, I.; Ahmad, I.; Alam, M.; Khan, S.; Ayaz S. Foliar application of Chitosan modulates the morphological and biochemical characteristics of tomato. Asian J Agric & Biol. 2019, 7(3):365-372.
- Kumar, S.; Ye, F.; Dobretsov, S.; Dutta, J. Chitosan Nanocomposite Coatings for Food, Paints, and Water Treatment Applications. Appl. Sci. 2019, 9(12), Article 2409. [CrossRef]
- Costales-Menéndez, D.; Nápoles-García, M.C.; Travieso-Hernández, L.; Cartaya-Rubio, O.; Falcón-Rodríguez, A.B. Compatibilidad Quitosano-Bradyrhizobium aplicados a semillas y su efecto en el desarrollo vegetativo de soya (Glycine max (L.) Merrill). Agron. Mesoam. 2021, 32(3):869-887. [CrossRef]
- Attaran Dowom, S.; Karimian, Z.; Mostafaei Dehnavi, M. et al. Chitosan nanoparticles improve physiological and biochemical responses of Salvia abrotanoides (Kar.) under drought stress. BMC Plant Biol 2022, 22, 364 . [CrossRef]
- El Amerany, F.; Rhazi, M.; Balcke, G.;Wahbi, S.; Meddich, A.; Taourirte, M.; Hause, B. The Effect of Chitosan on Plant Physiology, Wound Response, and Fruit Quality of Tomato. Polymers 2022, 14, 5006. [CrossRef]
- dos Reis, C.O.; Magalhães, P. C. ; Avila, R.G.; Almeida, L.G.; Rabelo, V.M.; Carvalho, D. .; Cabral, D.F.; Karam, D.de Souza, T. Action of N-Succinyl and N,O-Dicarboxymethyl Chitosan Derivatives on Chlorophyll Photosynthesis and Fluorescence in Drought-Sensitive Maize. J Plant Growth Regul. 2019, 38, 619–630 (2019). [CrossRef]
- Salimi, A.Z.; Ardebili, O; Salehibakhsh. ‘Potential benefits of foliar application of chitosan and Zinc in tomato’. ran. J. Plant Physiol. 2019, (2), 2703-2708.
- Chakraborty, M.; Hasanuzzaman, M.; Rahman, M.; Khan, M.A.R.; Bhowmik, P.; Mahmud, N.U.; Tanveer, M.; Islam, T. Mechanism of Plant Growth Promotion and Disease Suppression by Chitosan Biopolymer. Agriculture 2020, 10, 624. [CrossRef]
- Mukarram, M.; Khan, M.M.A., Kurjak, D; Corpas, F.J. Chitosanoligomers (COS) trigger a coordinated biochemical response of lemongrass (Cymbopogon flexuosus) plants to palliate salinity-induced oxidative stress. Sci. Rep. 2023, 13, 8636. [CrossRef]
- Ávila, R.G.; Magalhães, P.C.; Ávila, R.G. ;· Magalhães, P.C.; Vitorino, L.C.; Bessa, L.A.; Dázio de Souza, K.R..;· Barros Queiroz, R.; Jakelaitis, A.; Teixeira, M.B. Chitosan Induces Sorghum Tolerance to Water Deficits by Positively Regulating Photosynthesis and the Production of Primary Metabolites, Osmoregulators, and Antioxidants. J Soil Sci Plant Nutr. 2023, 23, 1156–1172 . [CrossRef]
- Lakshari, W.A.I.; Sukanya, M.; Hewavitharan, K.H.I.K. Effect of different concentrations of foliar application of chitosan on growth development of tomato (Solanum lycopersicum L.) cultivar grown in Sri Lanka. J. Res. Technol. Eng., 2023, 4 (3), 01-08.
- Attia, M.S.; Osman, M.S.; Mohamed, A.S.; Mahgoub, H.A.; Garada, M.O.; Abdelmouty, E.S.; Abdel Latef, A.A.H. Impact of Foliar Application of Chitosan Dissolved in Different Organic Acids on Isozymes, Protein Patterns and Physio-Biochemical Characteristics of tomato Grown under Salinity Stress. Plants 2021, 10, 388. [CrossRef]
- Behboudi F, Tahmasebi-Sarvestani Z, Kassaee MZ, Modarres-Sanavy SAM, Sorooshzadeh A, Mokhtassi-Bidgoli A. Evaluation of chitosan nanoparticles effects with two application methods on wheat under drought stress. J Plant Nutr. 2019;42(13):1439–51.
- Ali, E.F.; El-Shehawi, A.M.; Ibrahim, O.H.M.; Abdul-Hafeez, E.Y.; Moussa, M.M.; Hassan, F.A.S. A vital role of chitosan nanoparticles in improvisation the drought stress tolerance in Catharanthus roseus (L.) through biochemical and gene expression modulation. PPB, 2021, 161, 166-175.
- Rabelo, V.M.; Magalhaes, P.C.; Bressanin, L.A.; Carvalho, D.T.; Reis, C.O.D.; Karam D.; Doriguetto, A.C.; Santos, M.H.D.; Santos Filho, PRDS; Souza, T.C. The foliar application of a mixture of semisynthetic chitosan derivatives induces tolerance to water deficit in maize, improving the antioxidant system and increasing photosynthesis and grain yield. Sci Rep. 2019; 9(1):1–13.
- Reyes-Pérez, J.J.; Rivero-Herrada, M.; García-Bustamante, E.L.; Beltran-Morales, F.A.; Ruiz-Espinoza, F.H. Aplicación de quitosano incrementa la emergencia, crecimiento y rendimiento del cultivo de tomate (Solanum lycopersicum L.) en condiciones de invernadero. Biotecnia, 2020,22(3), 156-163.
- Kahromi, S.; Khara, J. Chitosan stimulates secondary metabolite production and nutrient uptake in medicinal plant Dracocephalum kotschyi. Journal of the Science of Food and Agriculture, 2021, 101(9), 3898-3907.
- Reyes-Pérez, J.J.; Rivero-Herrada, M.; Andagoya Fajardo, C. J.; Beltrán-Morales, F.A.; Hernández-Montiel, L.G.; García Liscano, A.E.; Ruiz-Espinoza, F. H. Emergencia y características agronómicas del Cucumis sativus a la aplicación de quitosano, Glomus cubense y ácidos húmicos. Biotecnia, 2021, 23(3), 38-44.
- Reyes-Pérez, J.J.; Llerena-Ramos, L.T.; Rivero-Herrada, M.; Pincay-Ganchozo, R.A.; Hernández-Montiel, L.G.; Ruiz-Espinoza, F.H. (2022). Agrobiological ef fectiveness of chitosane, humic acids and mycorrhzic fungi in two varieties of tomato (Solanum lycopersicum L.). Terra Latinoamericana, 2022, 40.
- Terry Alfonso, E.; Ruiz Padrón, J.; Rivera Espinosa, R.; Falcón Rodríguez, A.; Carrillo Sosa, Y. Bioproducts as partial substitutes for the mineral nutrition of the pepper crop (Capsicum annuum L.). Acta Agronómica, 2021, 70(3), 266-273.
- Amirkhani, M.; Netravali, A. N.; Huang, W.; Taylor, A.G. (2016). Investigation of soy protein–based biostimulant seed coating for broccoli seedling and plant growth enhancement. HortScience, 2016, 51(9), 1121-1126.
- Sharif, R.; Mujtaba, M.; Ur Rahman, M.; Shalmani, A.; Ahmad, H.; Anwar, T.; Tianchan, D.; Wang, X. The Multifunctional Role of Chitosan in Horticultural Crops; A Review. Molecules 2018, 23, 872. [CrossRef]
- Sathiyabama, M.; Bernstein, N.; Anusuya S, Chitosan elicitation for increased curcumin production and stimulation of defence response in turmeric (Curcuma longa L.), Ind. Crops Prod., 2016, 89, 87-94, . [CrossRef]
- Ghasemi Pirbalouti, A.; Malekpoor, F.; Salimi, A.; Golparvar, A. Exogenous application of chitosan on biochemical and physiological characteristics, phenolic content and antioxidant activity of two species of basil (Ocimum ciliatum and Ocimum basilicum) under reduced irrigation, Sci. Hortic., 2017, 217, 114-122, . [CrossRef]
- Tabassum, M.; Noreen, Z.; Aslam, M.; Shah, A.N.; Usman, S.; Waqas, A.; Alsherif, EA.; Korany, S.M.; Nazim, M. 2024. Chitosan modulated antioxidant activity, inorganic ions homeostasis and endogenous melatonin to improve yield of Pisum sativum L. accessions under salt stress Sci. Hortic., 2024,323,112509, . [CrossRef]
- Anjum, S.; Ain, Qu.; Sarwar, M.; Alam, M.W.; Mushtaq, Z.; Mukhtar, A.M.; Ashraf, I.; Alasmari, A. Chitosan Induced Modification in Morpho-Physiological, Biochemical and Yield Attributes of Pea (Pisum Sativum L.) Under Salt Stress. J Soil Sci Plant Nutr 2025, 25, 1311–1321 (). [CrossRef]
- Holguin-Peña, R. J.; Vargas-López, J. M.; López-Ahumada, G.A.; Rodríguez-Félix, F.; Borbón-Morales, C.G.; Rueda-Puente, E. O. Effect of chitosan and Bacillus amilolyquefasciens on sorghum yield in the indigenous area “Mayos” in Sonora. Terra Latinoamericana, 2020, 38(3), 705-714.
- Pincay-Manzaba, D.F.; Cedeño-Loor, J.C.; Espinosa Cunuhay, K.A. Efecto del quitosano sobre el crecimiento y la productividad de Solanum lycopersicum. Centro Agrícola, 2021, 48(3), 25-31.
- González, L.G.; Paz, I.; Martínez, B.; Jiménez, M.C.; Torres, J. A.; Falcón, A. Respuesta agronómica del cultivo del tomate (Solanum lycopersicum, L) var. HA 3019 a la aplicación de quitosana. UTCiencia, 2017, 2(2), 55-60.
- González Peña, D.; Costales, D.; Falcón, A.B. (2014). Influencia de un polímero de quitosana en el crecimiento y la actividad de enzimas defensivas en tomate (Solanum lycopersicum L.). Cultivos Tropicales, 2014, 35(1), 35-42.
- Chanaluisa-Saltos, J.S.; Sánchez, A.R.Á.; Reyes-Pérez, J.J.; Lizarde, N.A. Respuesta agronómica y fitosanitaria de plantas de tomate (Solanum lycopersicum L.) a la aplicación de quitosano en condiciones controladas. Revista Científica Agroecosistemas, 2022, 10(1), 139-145.
- Torres Rodríguez, J.A.; Reyes Pérez, J.J.; González Rodríguez, J.C. Efecto de un bioestimulante natural sobre algunos parámetros de calidad en plántulas de tomate (Solanum lycopersicum, L.) bajo condiciones de salinidad. Biotecnia, 2016, 18(2), 11-15.
- Reyes-Pérez, J.J.; Rivero-Herrada, M.; Solórzano-Cedeño, A.E.; Carballo-Méndez, F.D.J.; Lucero-Vega, G.; Ruiz-Espinoza, F.H. Aplicación de ácidos húmicos, quitosano y hongos micorrízicos como influyen en el crecimiento y desarrollo de pimiento. Terra Latinoamericana, 2021, 39. [CrossRef]
- Reyes-Pérez, J.J.; Enríquez-Acosta, E.A.; Ramírez-Arrebato, M.Á.; Rodríguez-Pedroso, A.T.; Rivero-Herrada, M. Respuesta de plántulas de cultivares de tomate a la aplicación de quitosano. Centro Agrícola, 2019, 46(4), 21-29.
- Peralta-Antonio, N.; Bernardo de Freitas, G.; Watthier, M.; Silva Santos, R H.Compost, bokashi y microorganismos eficientes: sus beneficios en cultivos sucesivos de brócolis. Idesia (Arica), 2019, 37(2), 59-66.
- Morales Guevara, D.; Dell Amico Rodríguez, J.; Jerez Mompié, E.; Hernández, Y.D.; Martín Martín, R. Efecto del QuitoMax® en el crecimiento y rendimiento del frijol (Phaseolus vulgaris L.). Cultivos Tropicales, 2016, 37(1), 142-147.
- Cardona-Ayala, C.; Jarma-Orozco, A.; Araméndiz-Tatis, H.; Peña-Agresott, M.; Vergara-Córdoba, C. Respuestas fisiológicas y bioquímicas del fríjol caupí (Vigna unguiculata L. Walp.) bajo déficit hídrico. Rev. Colomb. Cienc., 2014, 8(2), 250-261.
- Pedroza-Sandoval, A.; Trejo-Calzada, R.; Sánchez-Cohen, I.; Samaniego-Gaxiola, J.A.; Yáñez-Chávez, L.G. Evaluation of three pinto bean varieties under drought and irrigation in Durango, Mexico. Agron. Mesoam., 2016, 27(1), 167-176.
- Bittelli, M.; Flury, M.; Campbell, G. S.; Nichols, E.J. Reduction of transpiration through foliar application of chitosan. Agric. For. Meteorol., 2001, 107(3), 167-175.
- Iriti, M.; Picchi, V.; Rossoni, M.; Gomarasca, S., Ludwig, N.; Gargano, M.; Faoro, F. Chitosan antitranspirant activity is due to abscisic acid-dependent stomatal closure. Environmental and Experimental Botany, 2009, 66(3), 493-500.
- Morales-Guevara, D.; Dell Amico-Rodríguez, J.; Jerez-Mompie, E.; Rodríguez-Hernández, P.; Álvarez-Bello, I.; Díaz-Hernández, Y.; Martín-Martín, R. Efecto del Quitomax® en plantas de (Phaseolus vulgaris L.) sometidas a dos regímenes de riego. II. Variables Fisiológicas. Cultivos Tropicales, 2017, 38(4), 92-101.
Figure 1.
Microclimatic variables measured in the greenhouse: photosynthetic photon flux density (PPFD) above and below the tomato plants; air temperature (Tair, black circles) and leaf temperature for Floradade (white circles) and Candela F1 (green circles).
Figure 1.
Microclimatic variables measured in the greenhouse: photosynthetic photon flux density (PPFD) above and below the tomato plants; air temperature (Tair, black circles) and leaf temperature for Floradade (white circles) and Candela F1 (green circles).
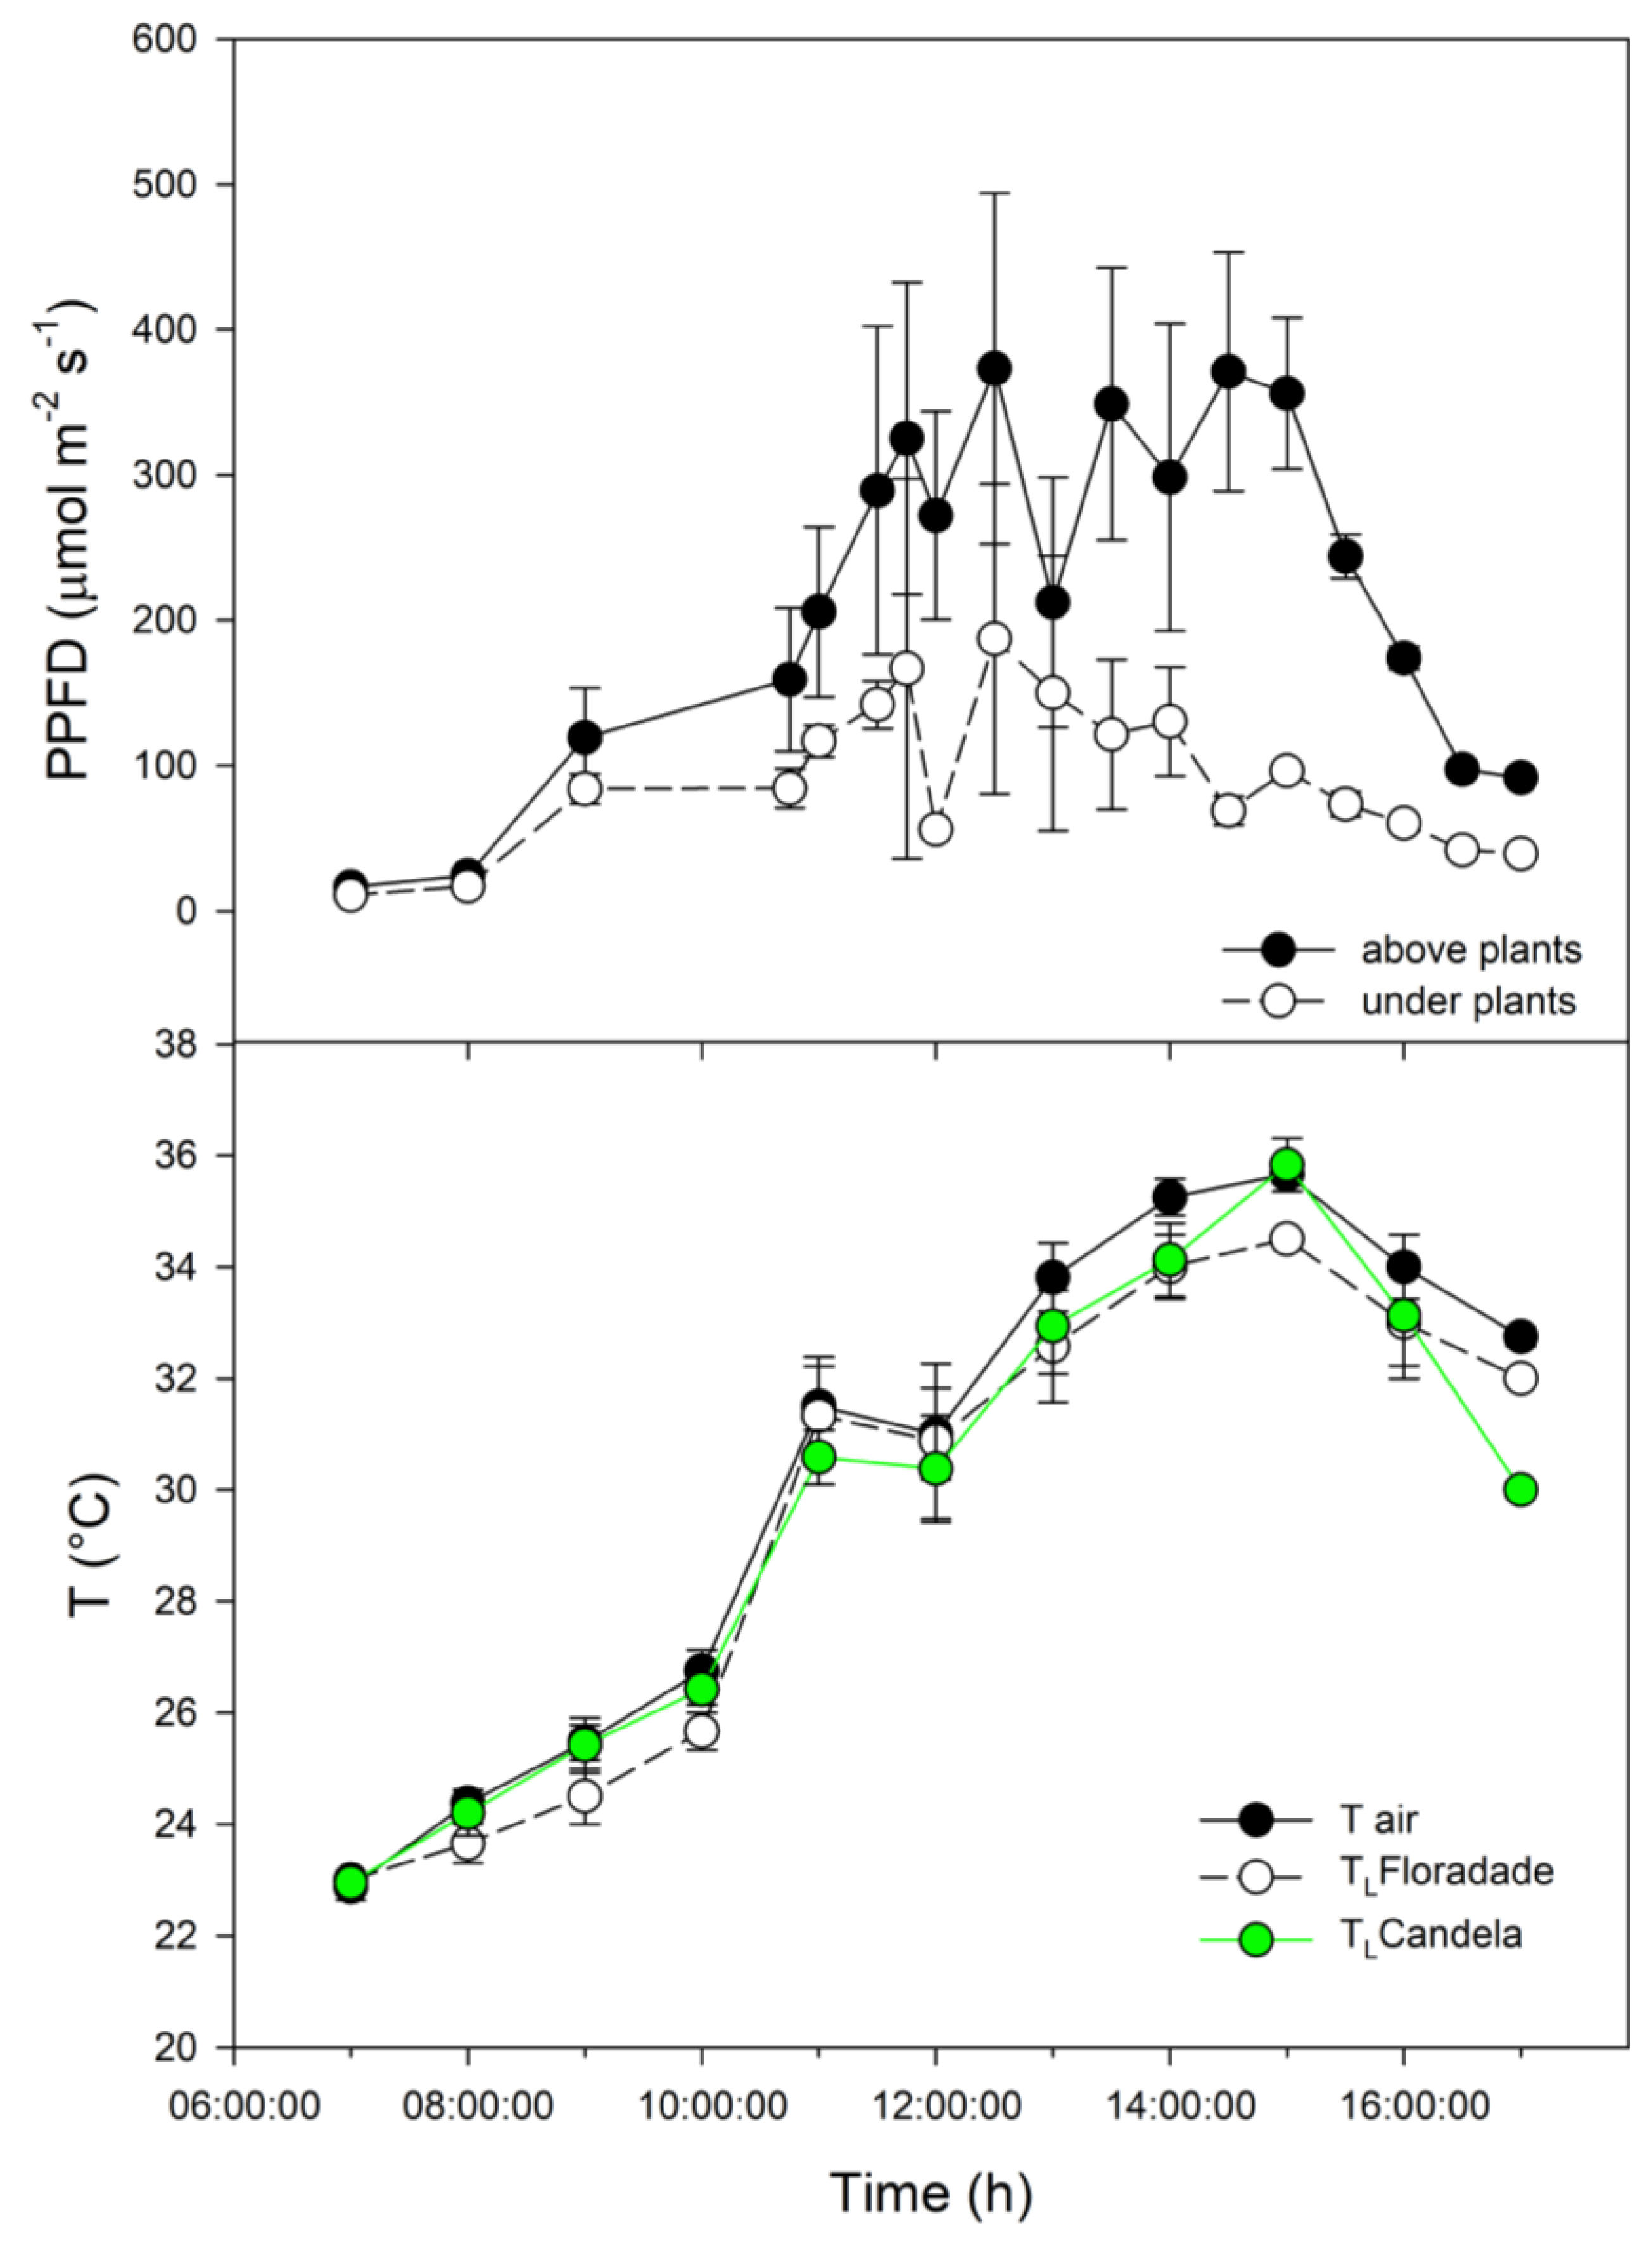
Figure 2.
Leaf water potential in two tomato varieties (Floradade and Candela F1) treated with chitosan and evaluated in the morning (Ψam) and afternoon (Ψpm) at 38 (A) and 58 (B) days after transplanting. Different letters per column indicate significant differences between treatments according to Fisher’s test (p<0.05).
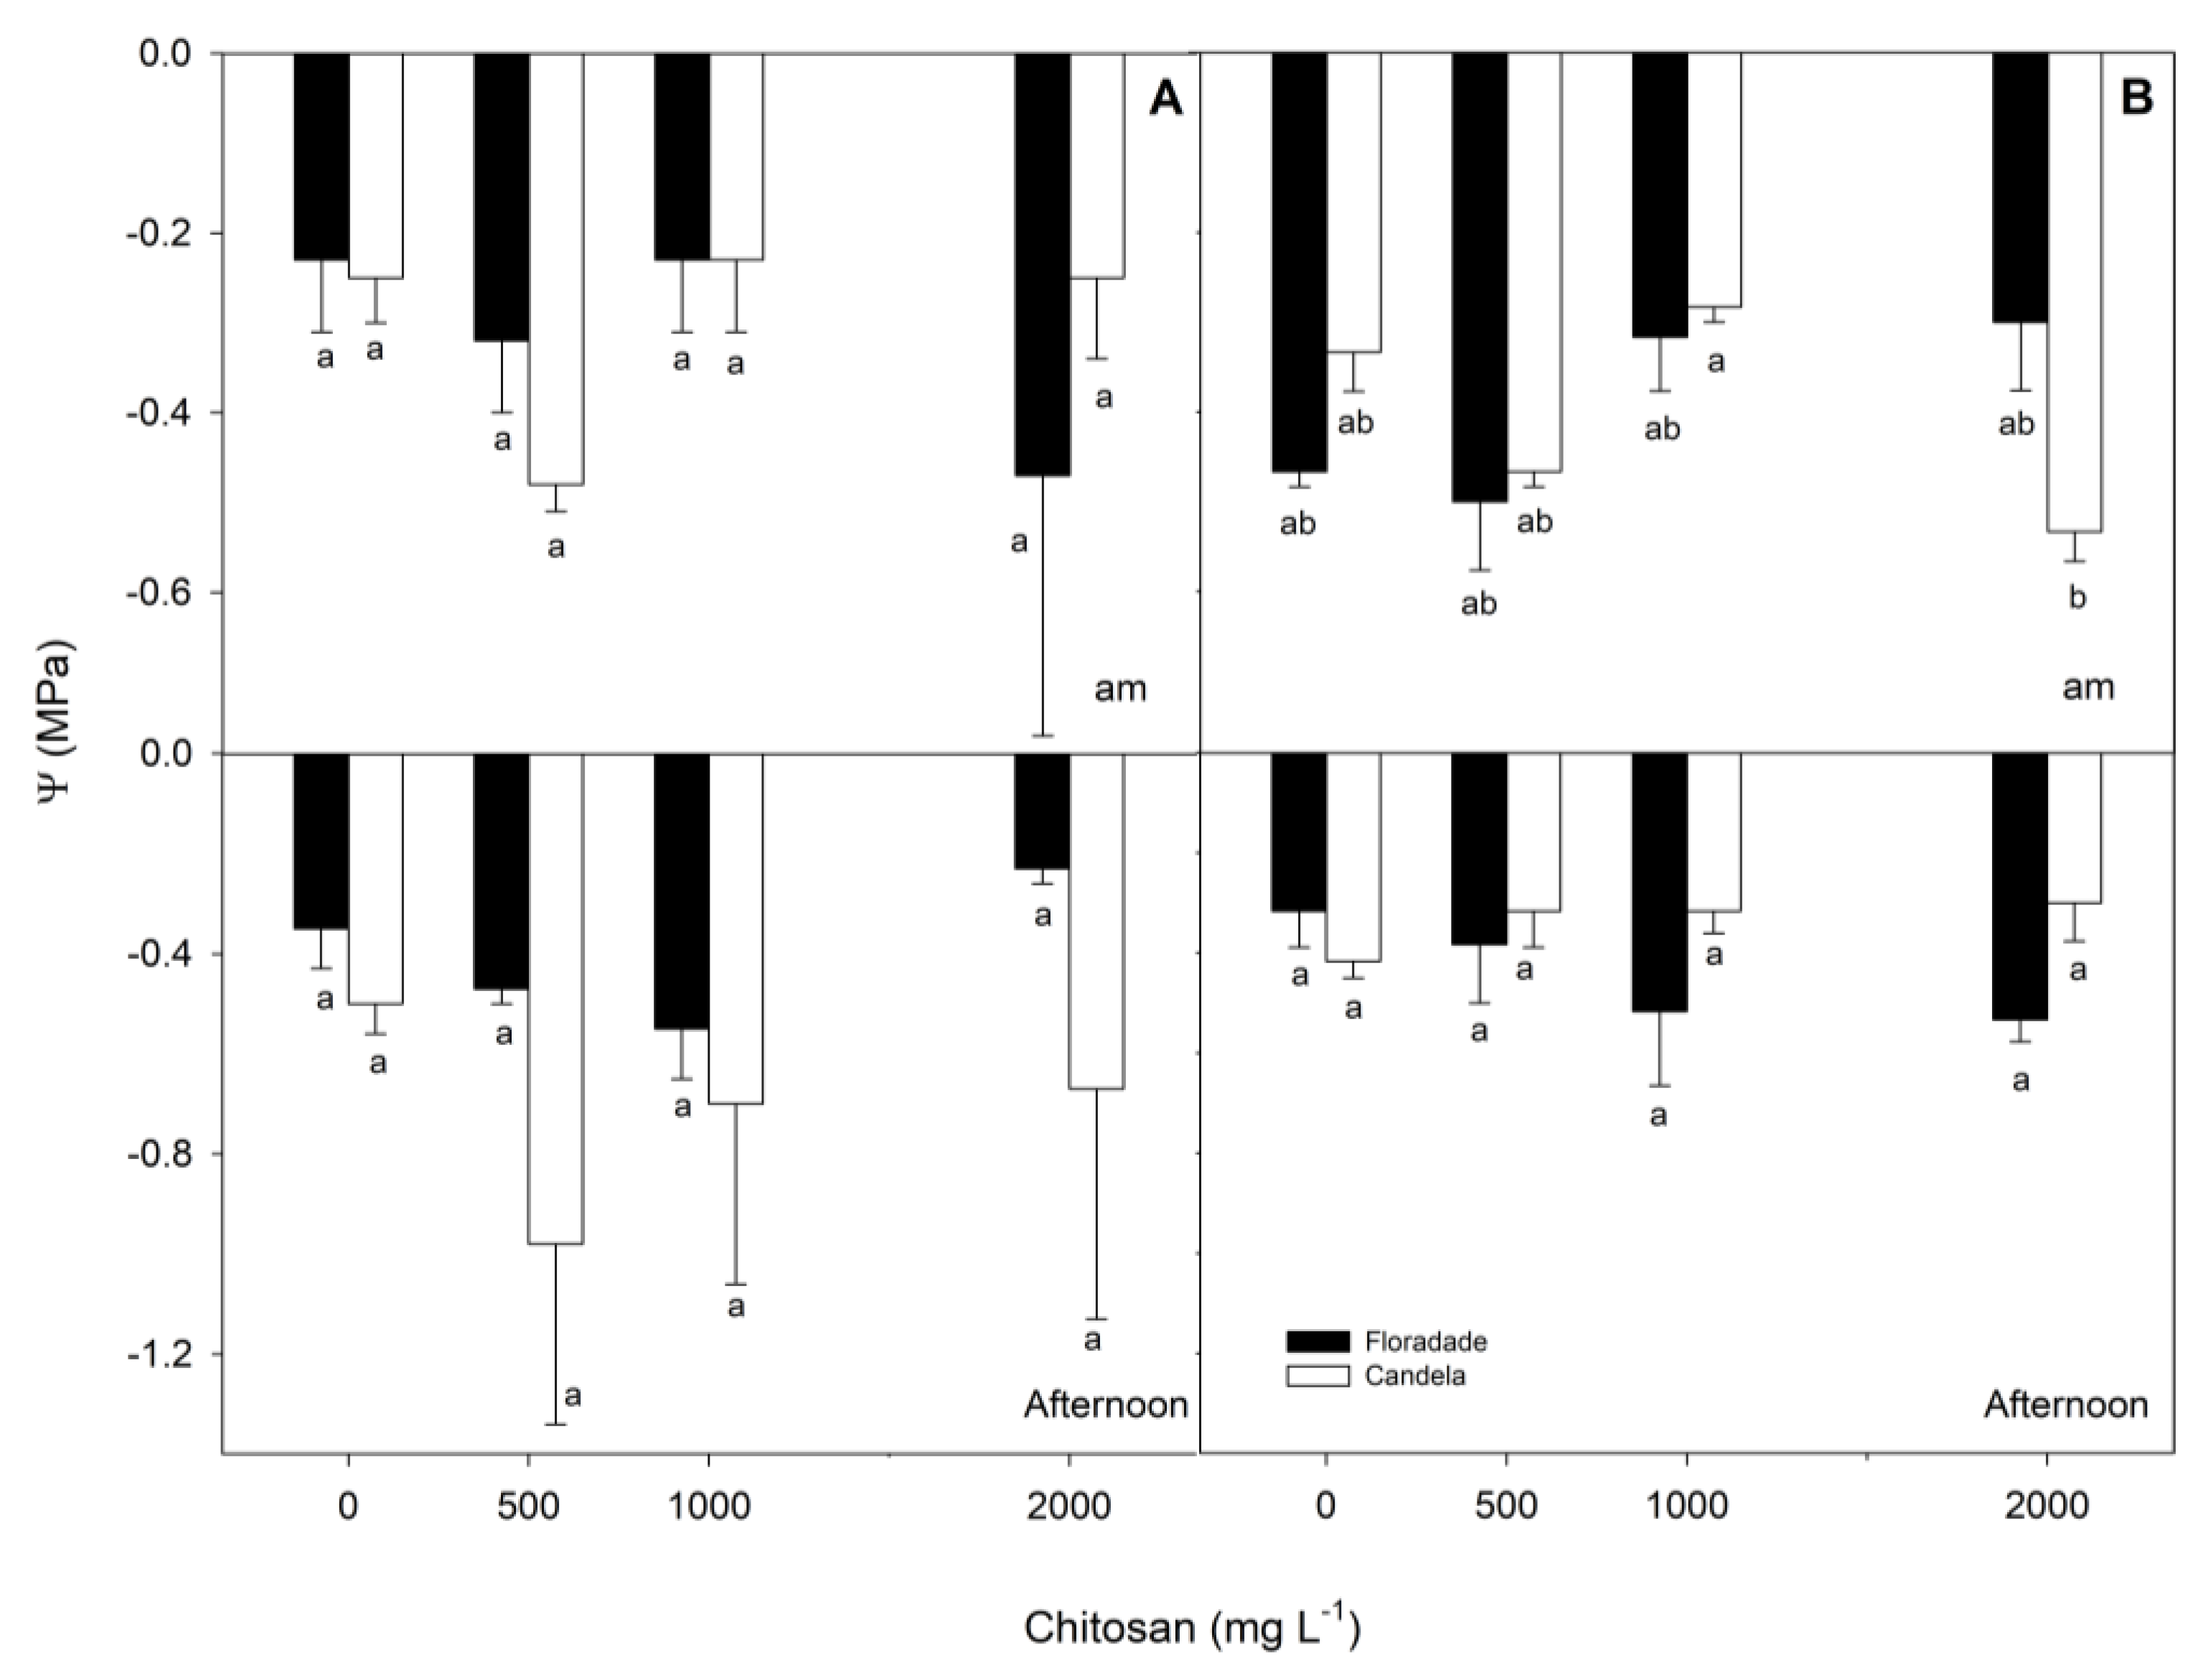
Figure 3.
Net photosynthetic rate (A) and transpiration rate (E), stomatal conductance (gs), intercellular CO2 concentration (Ci), and water use efficiency (WUE) in two tomato varieties (Floradade and Candela F1) treated with chitosan and evaluated at 38 (A) and 58 (B) days after transplanting. Different letters per column indicate significant differences between treatments according to Fisher’s test (p<0.05).
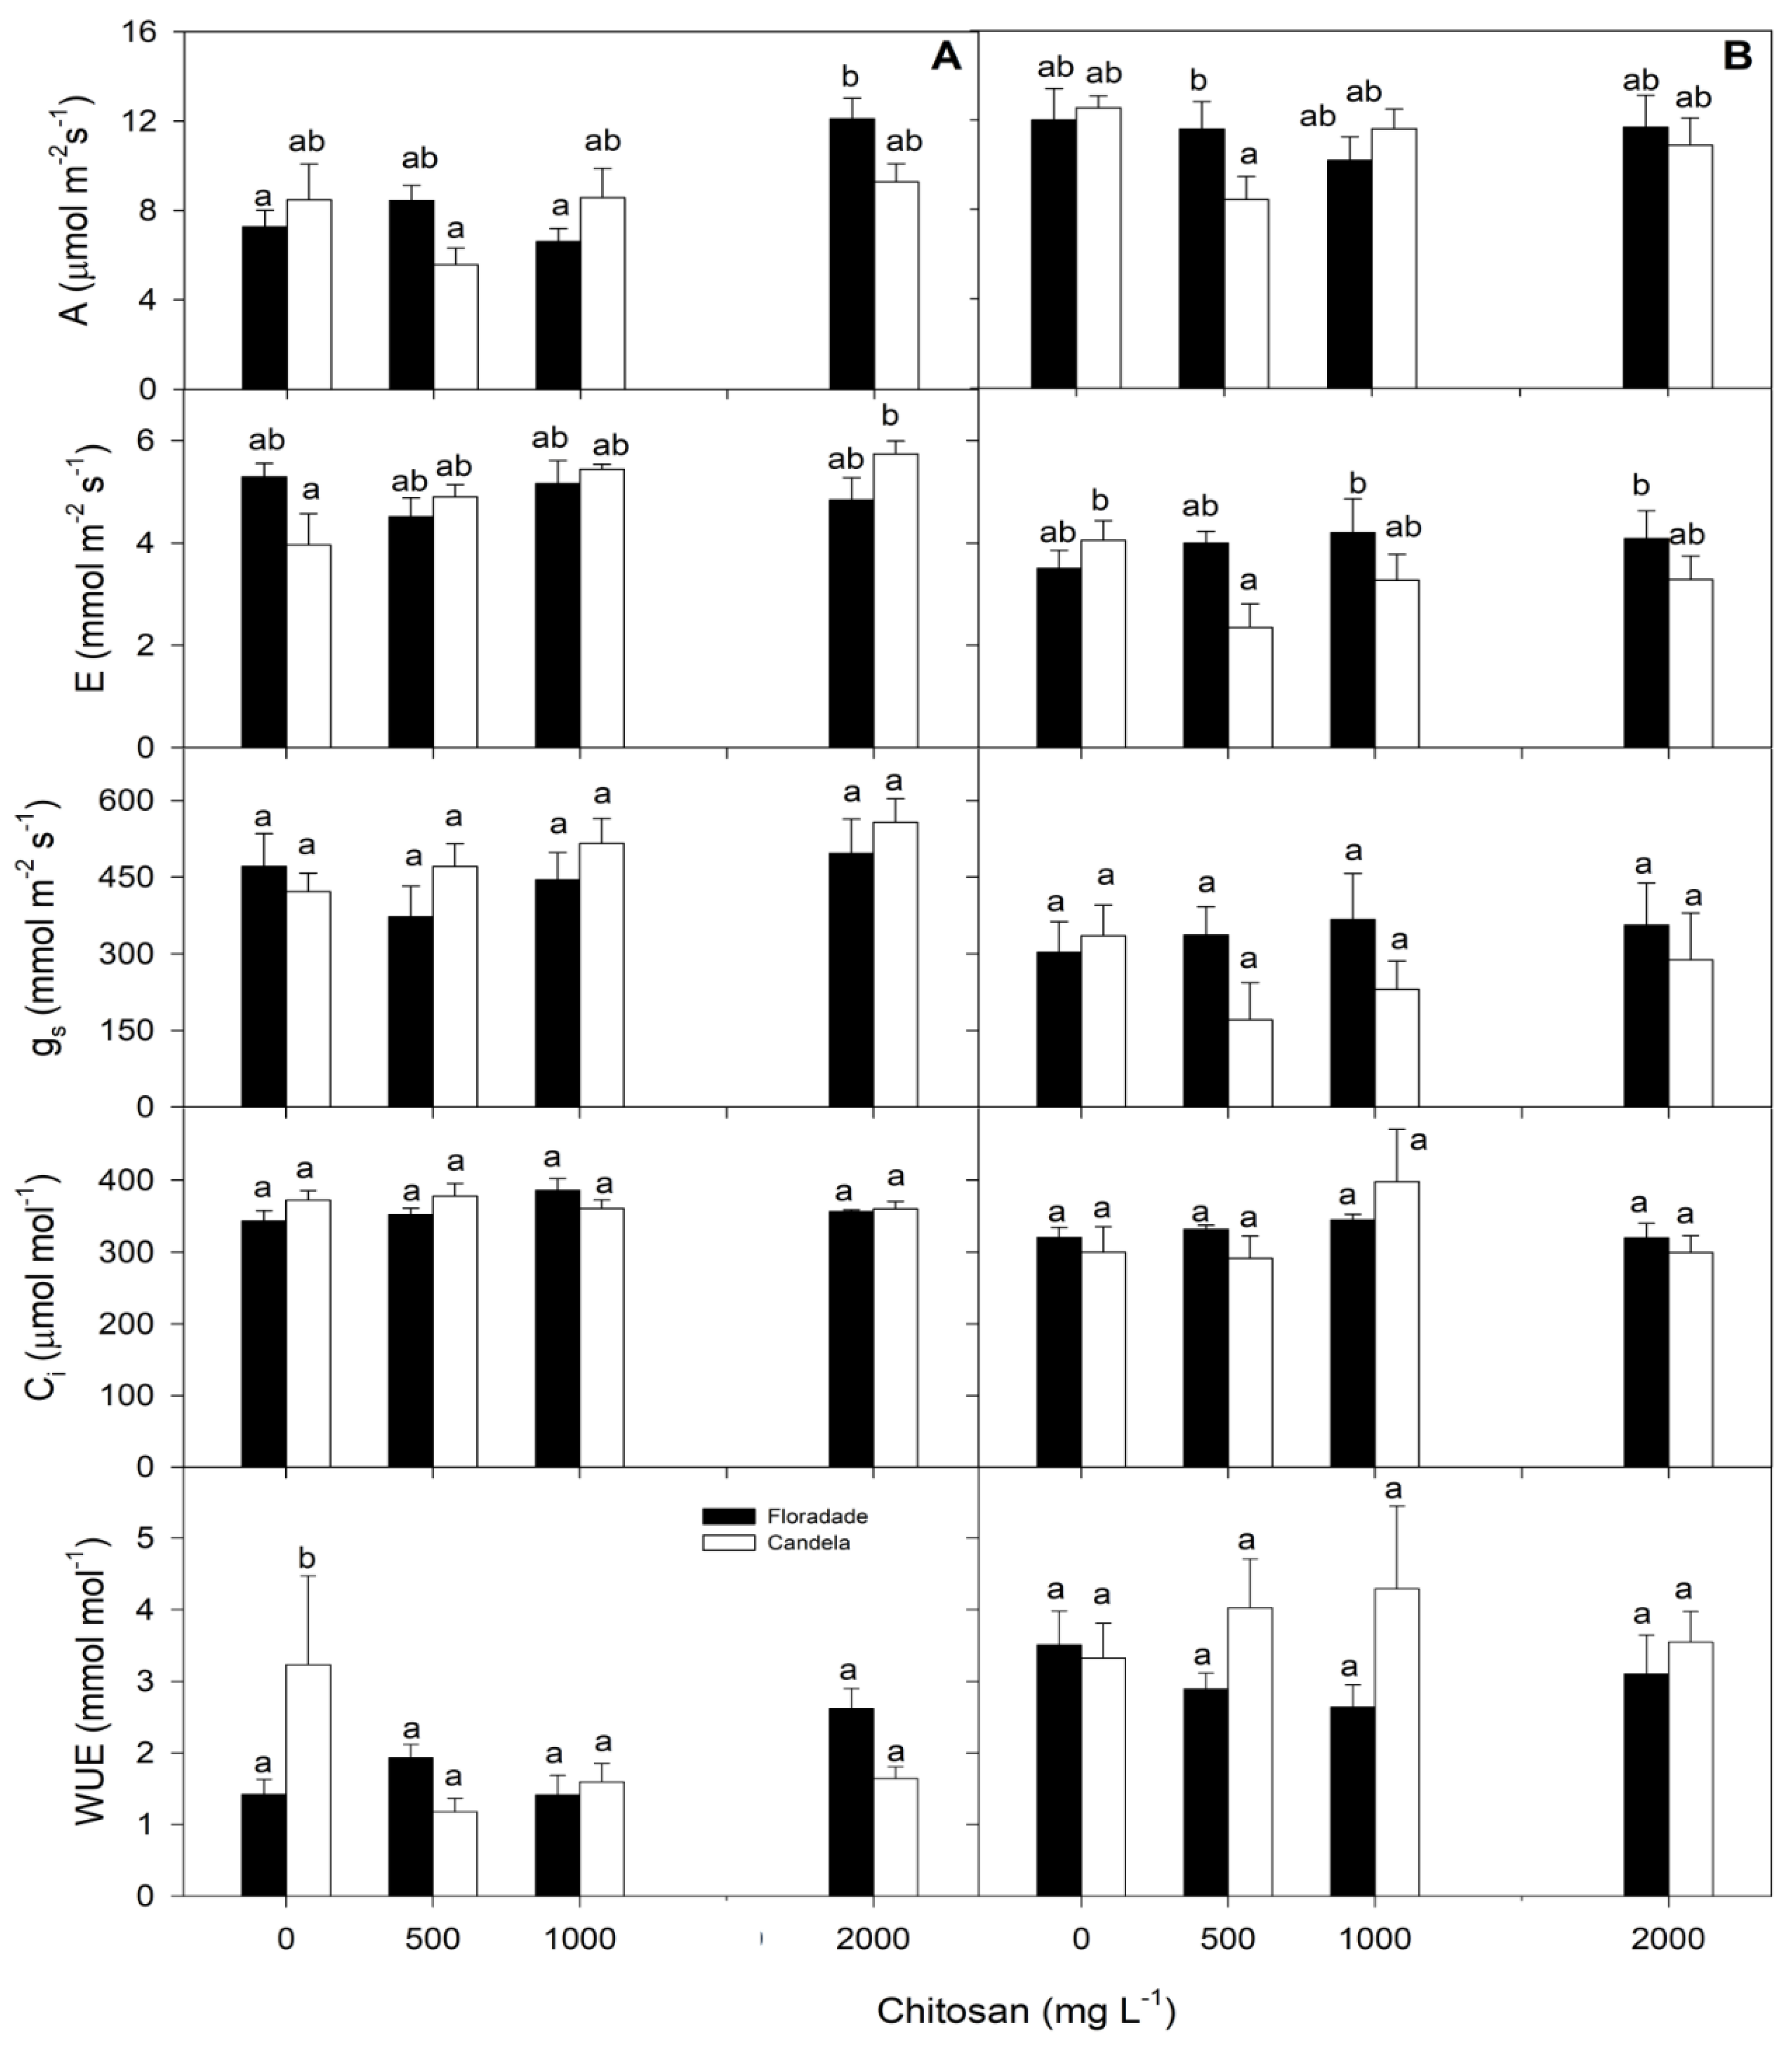
Figure 4.
Leaf area index (LAI) in two tomato varieties (Floradade and Candela F1) treated with chitosan and evaluated at 38 (A) and 58 (B) days after transplanting. Different letters per column indicate significant differences between treatments according to Fisher’s test (p<0.05).
Figure 4.
Leaf area index (LAI) in two tomato varieties (Floradade and Candela F1) treated with chitosan and evaluated at 38 (A) and 58 (B) days after transplanting. Different letters per column indicate significant differences between treatments according to Fisher’s test (p<0.05).
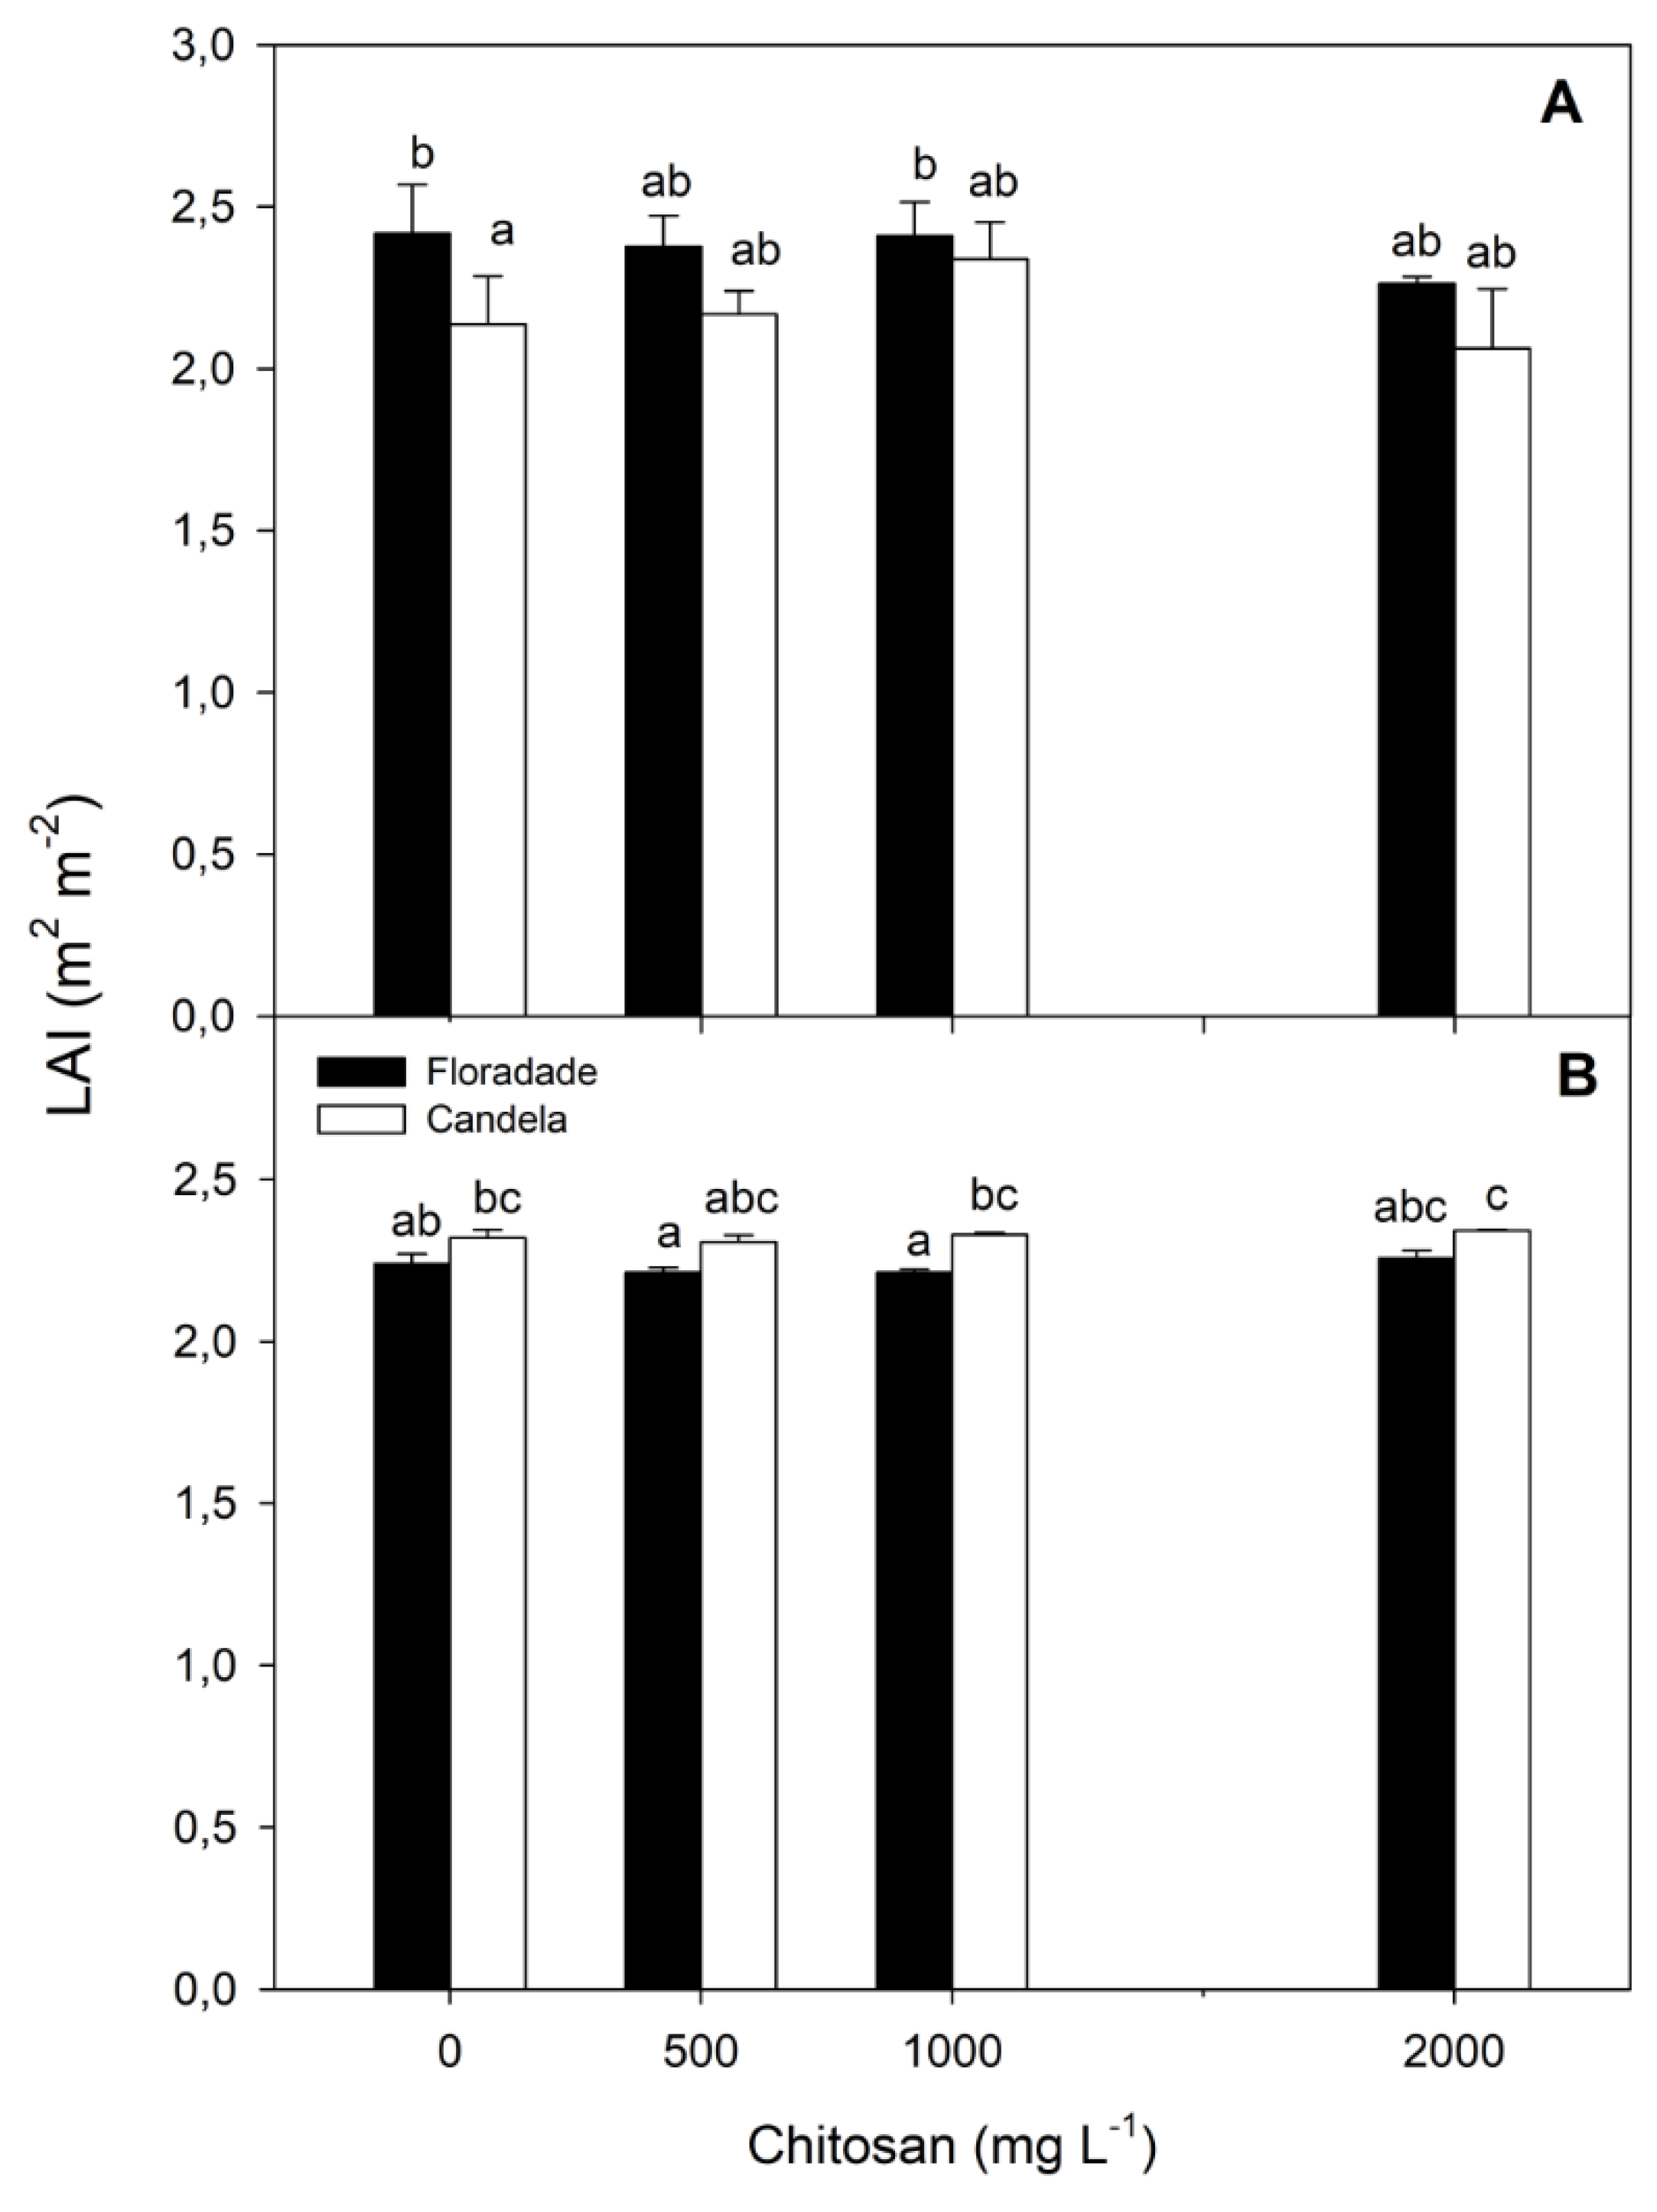
Figure 5.
SPAD units in two tomato varieties (Floradade and Candela F1) treated with chitosan and evaluated at 38 (A) and 58 (B) days after transplanting. Different letters per column indicate significant differences between treatments according to Fisher’s test (p<0.05).
Figure 5.
SPAD units in two tomato varieties (Floradade and Candela F1) treated with chitosan and evaluated at 38 (A) and 58 (B) days after transplanting. Different letters per column indicate significant differences between treatments according to Fisher’s test (p<0.05).
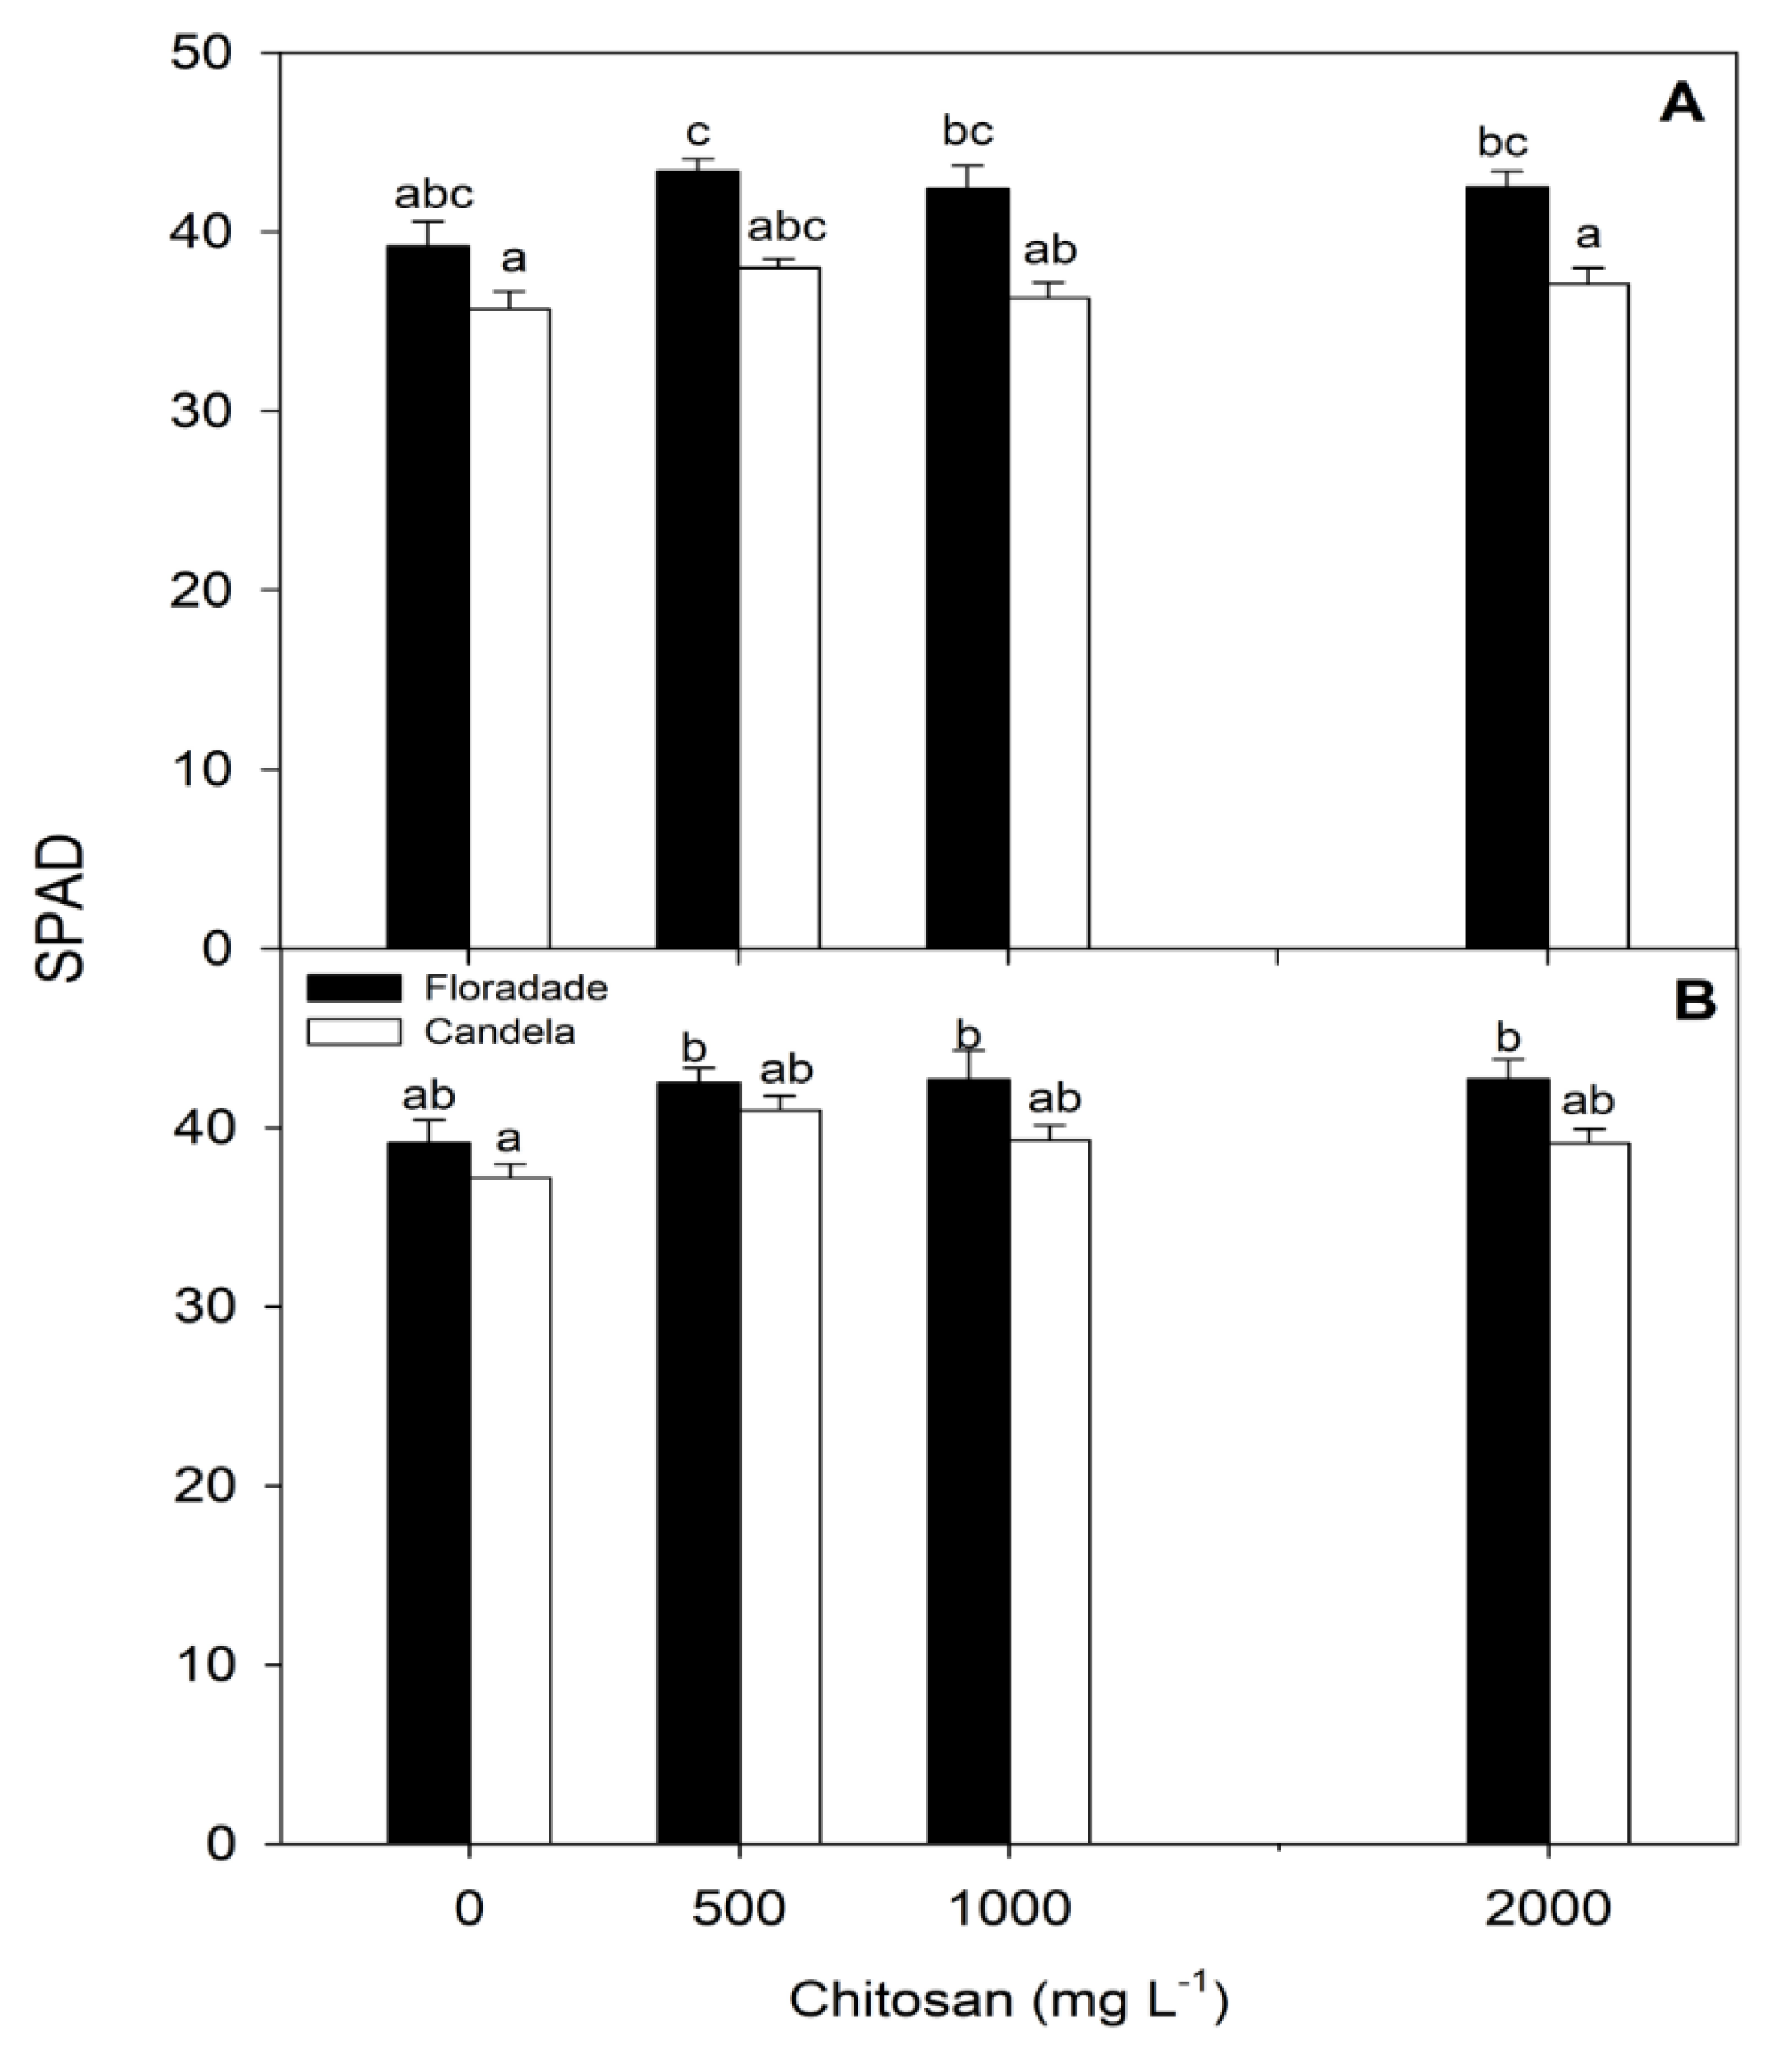
Figure 6.
(a) Pearson correlation of the response variables, and (b) Biplot of the treatments and response variables in two tomato varieties (Floradade and Candela F1) treated with chitosan and evaluated at 38 and 58 days after transplanting.
Figure 6.
(a) Pearson correlation of the response variables, and (b) Biplot of the treatments and response variables in two tomato varieties (Floradade and Candela F1) treated with chitosan and evaluated at 38 and 58 days after transplanting.
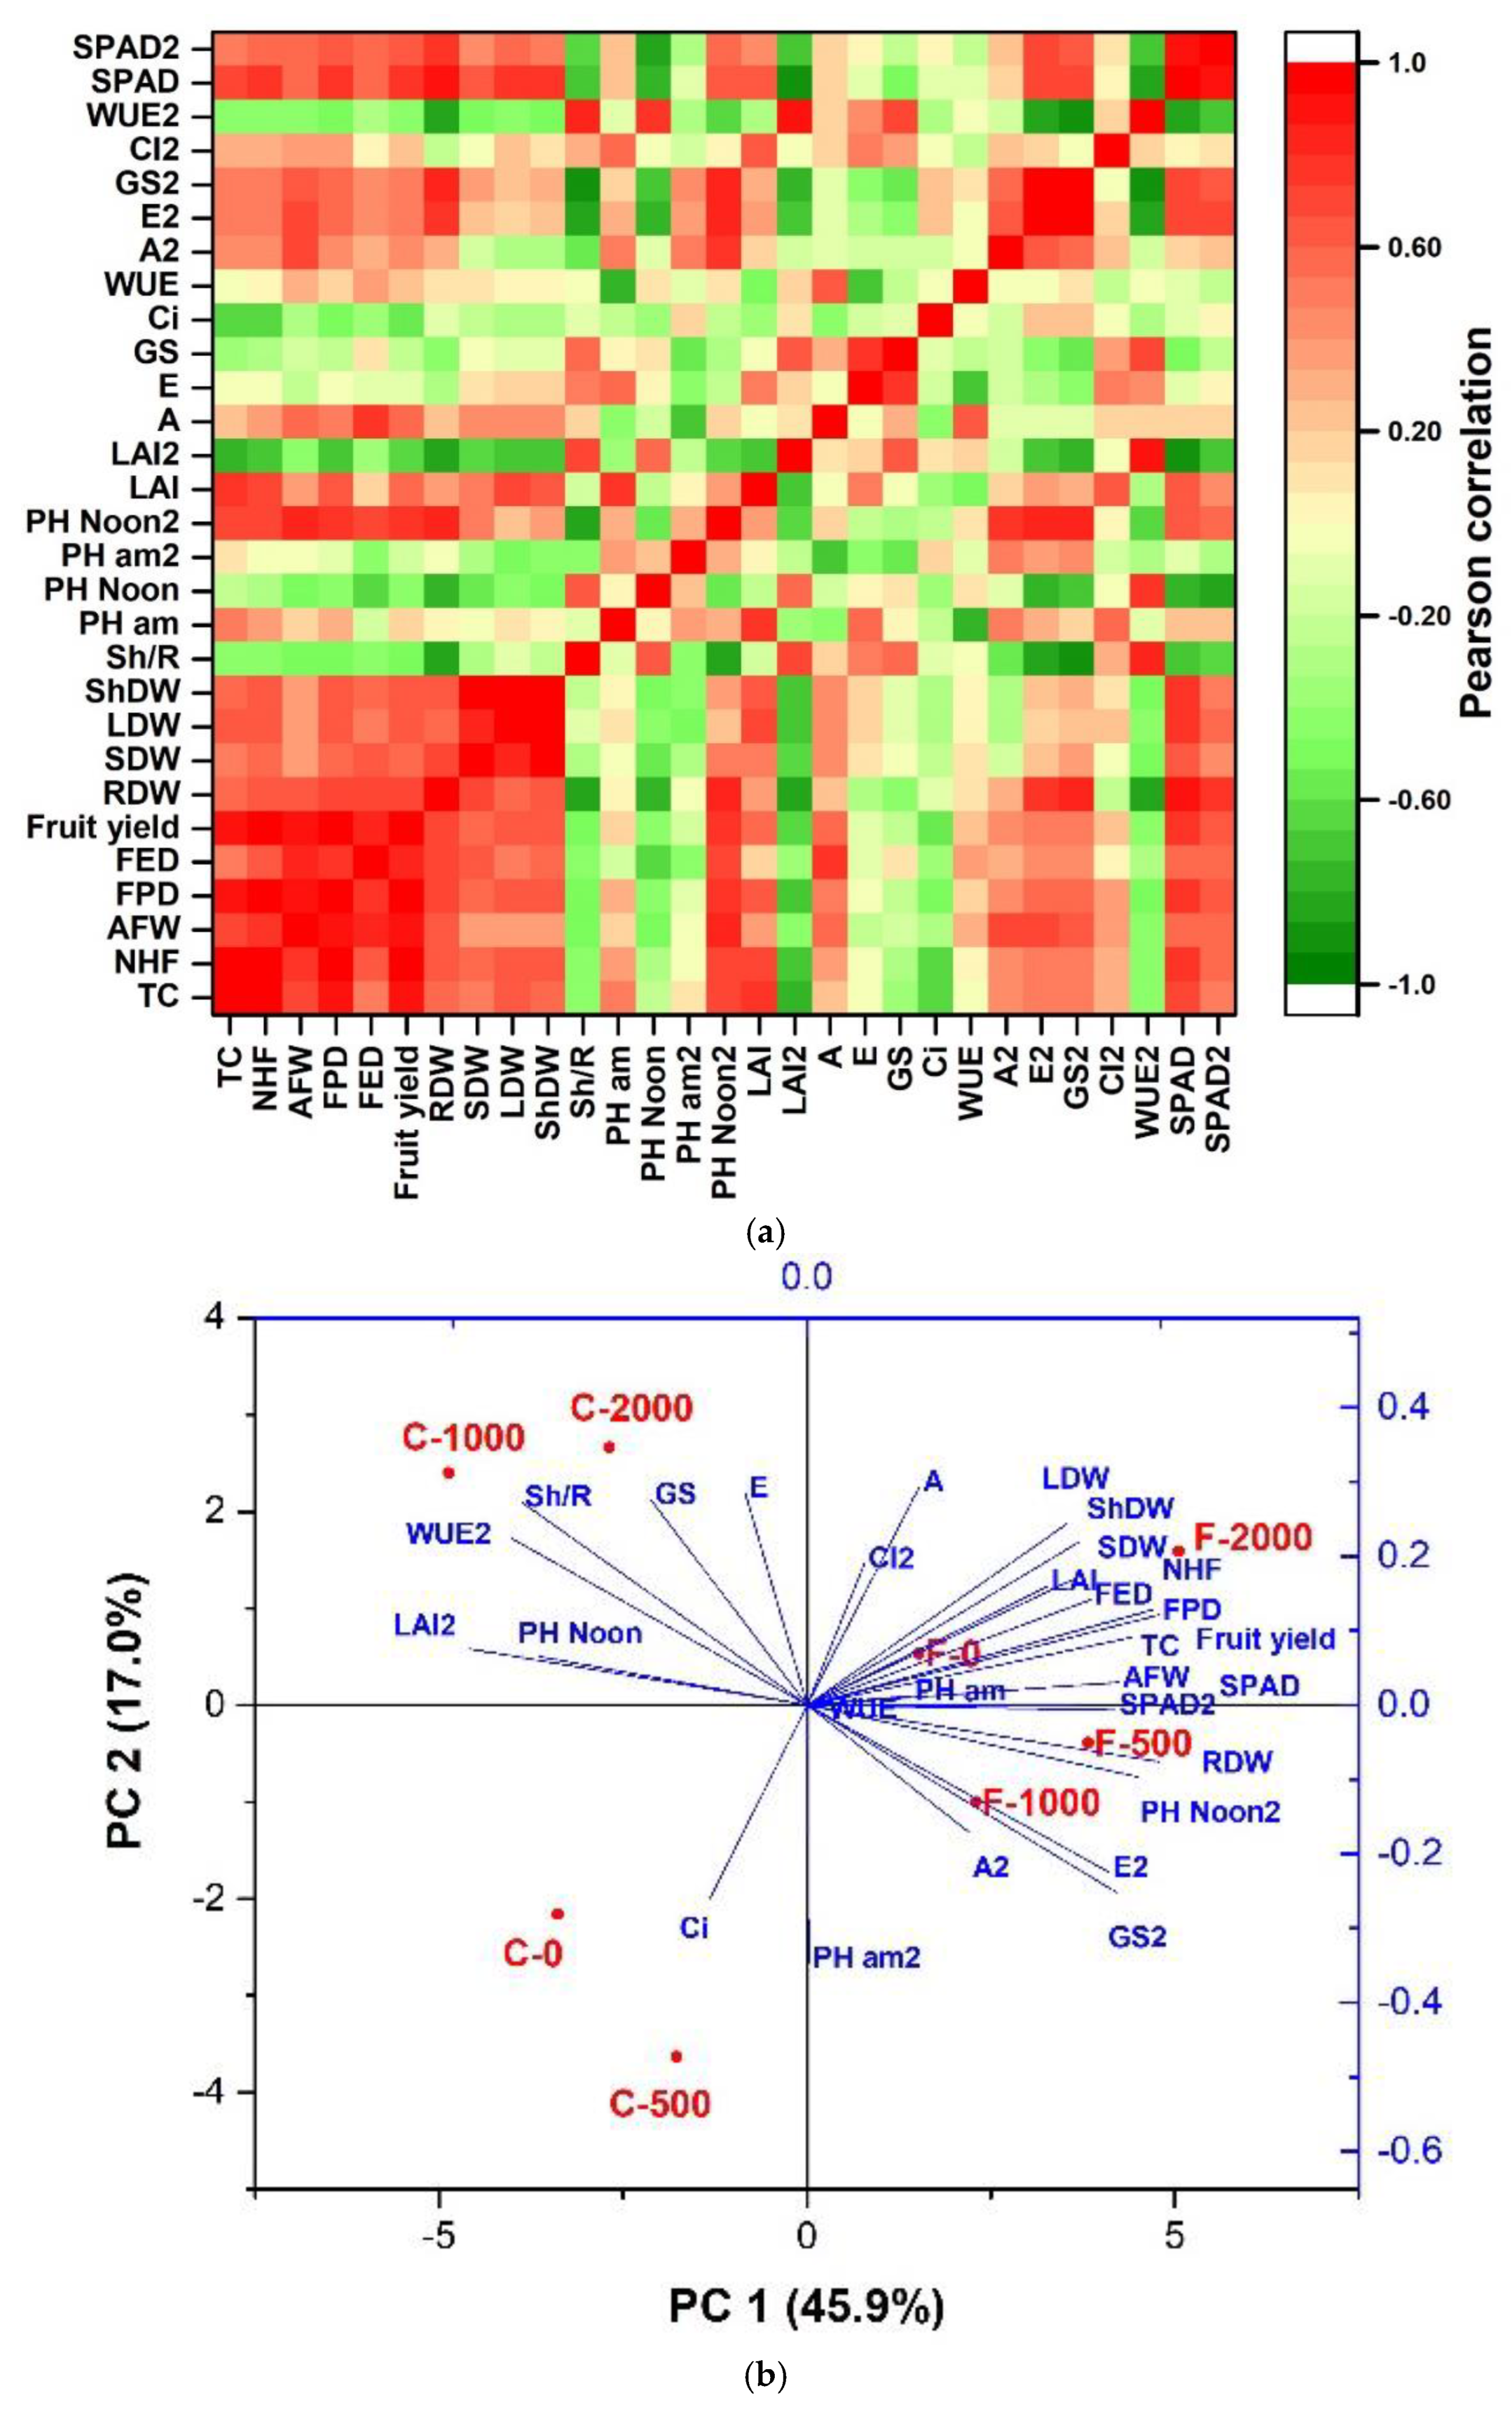
Figure 7.
Hierarchical cluster analysis in two tomato varieties (Floradade and Candela F1) treated with chitosan and evaluated at 38 and 58 days after transplanting.
Figure 7.
Hierarchical cluster analysis in two tomato varieties (Floradade and Candela F1) treated with chitosan and evaluated at 38 and 58 days after transplanting.
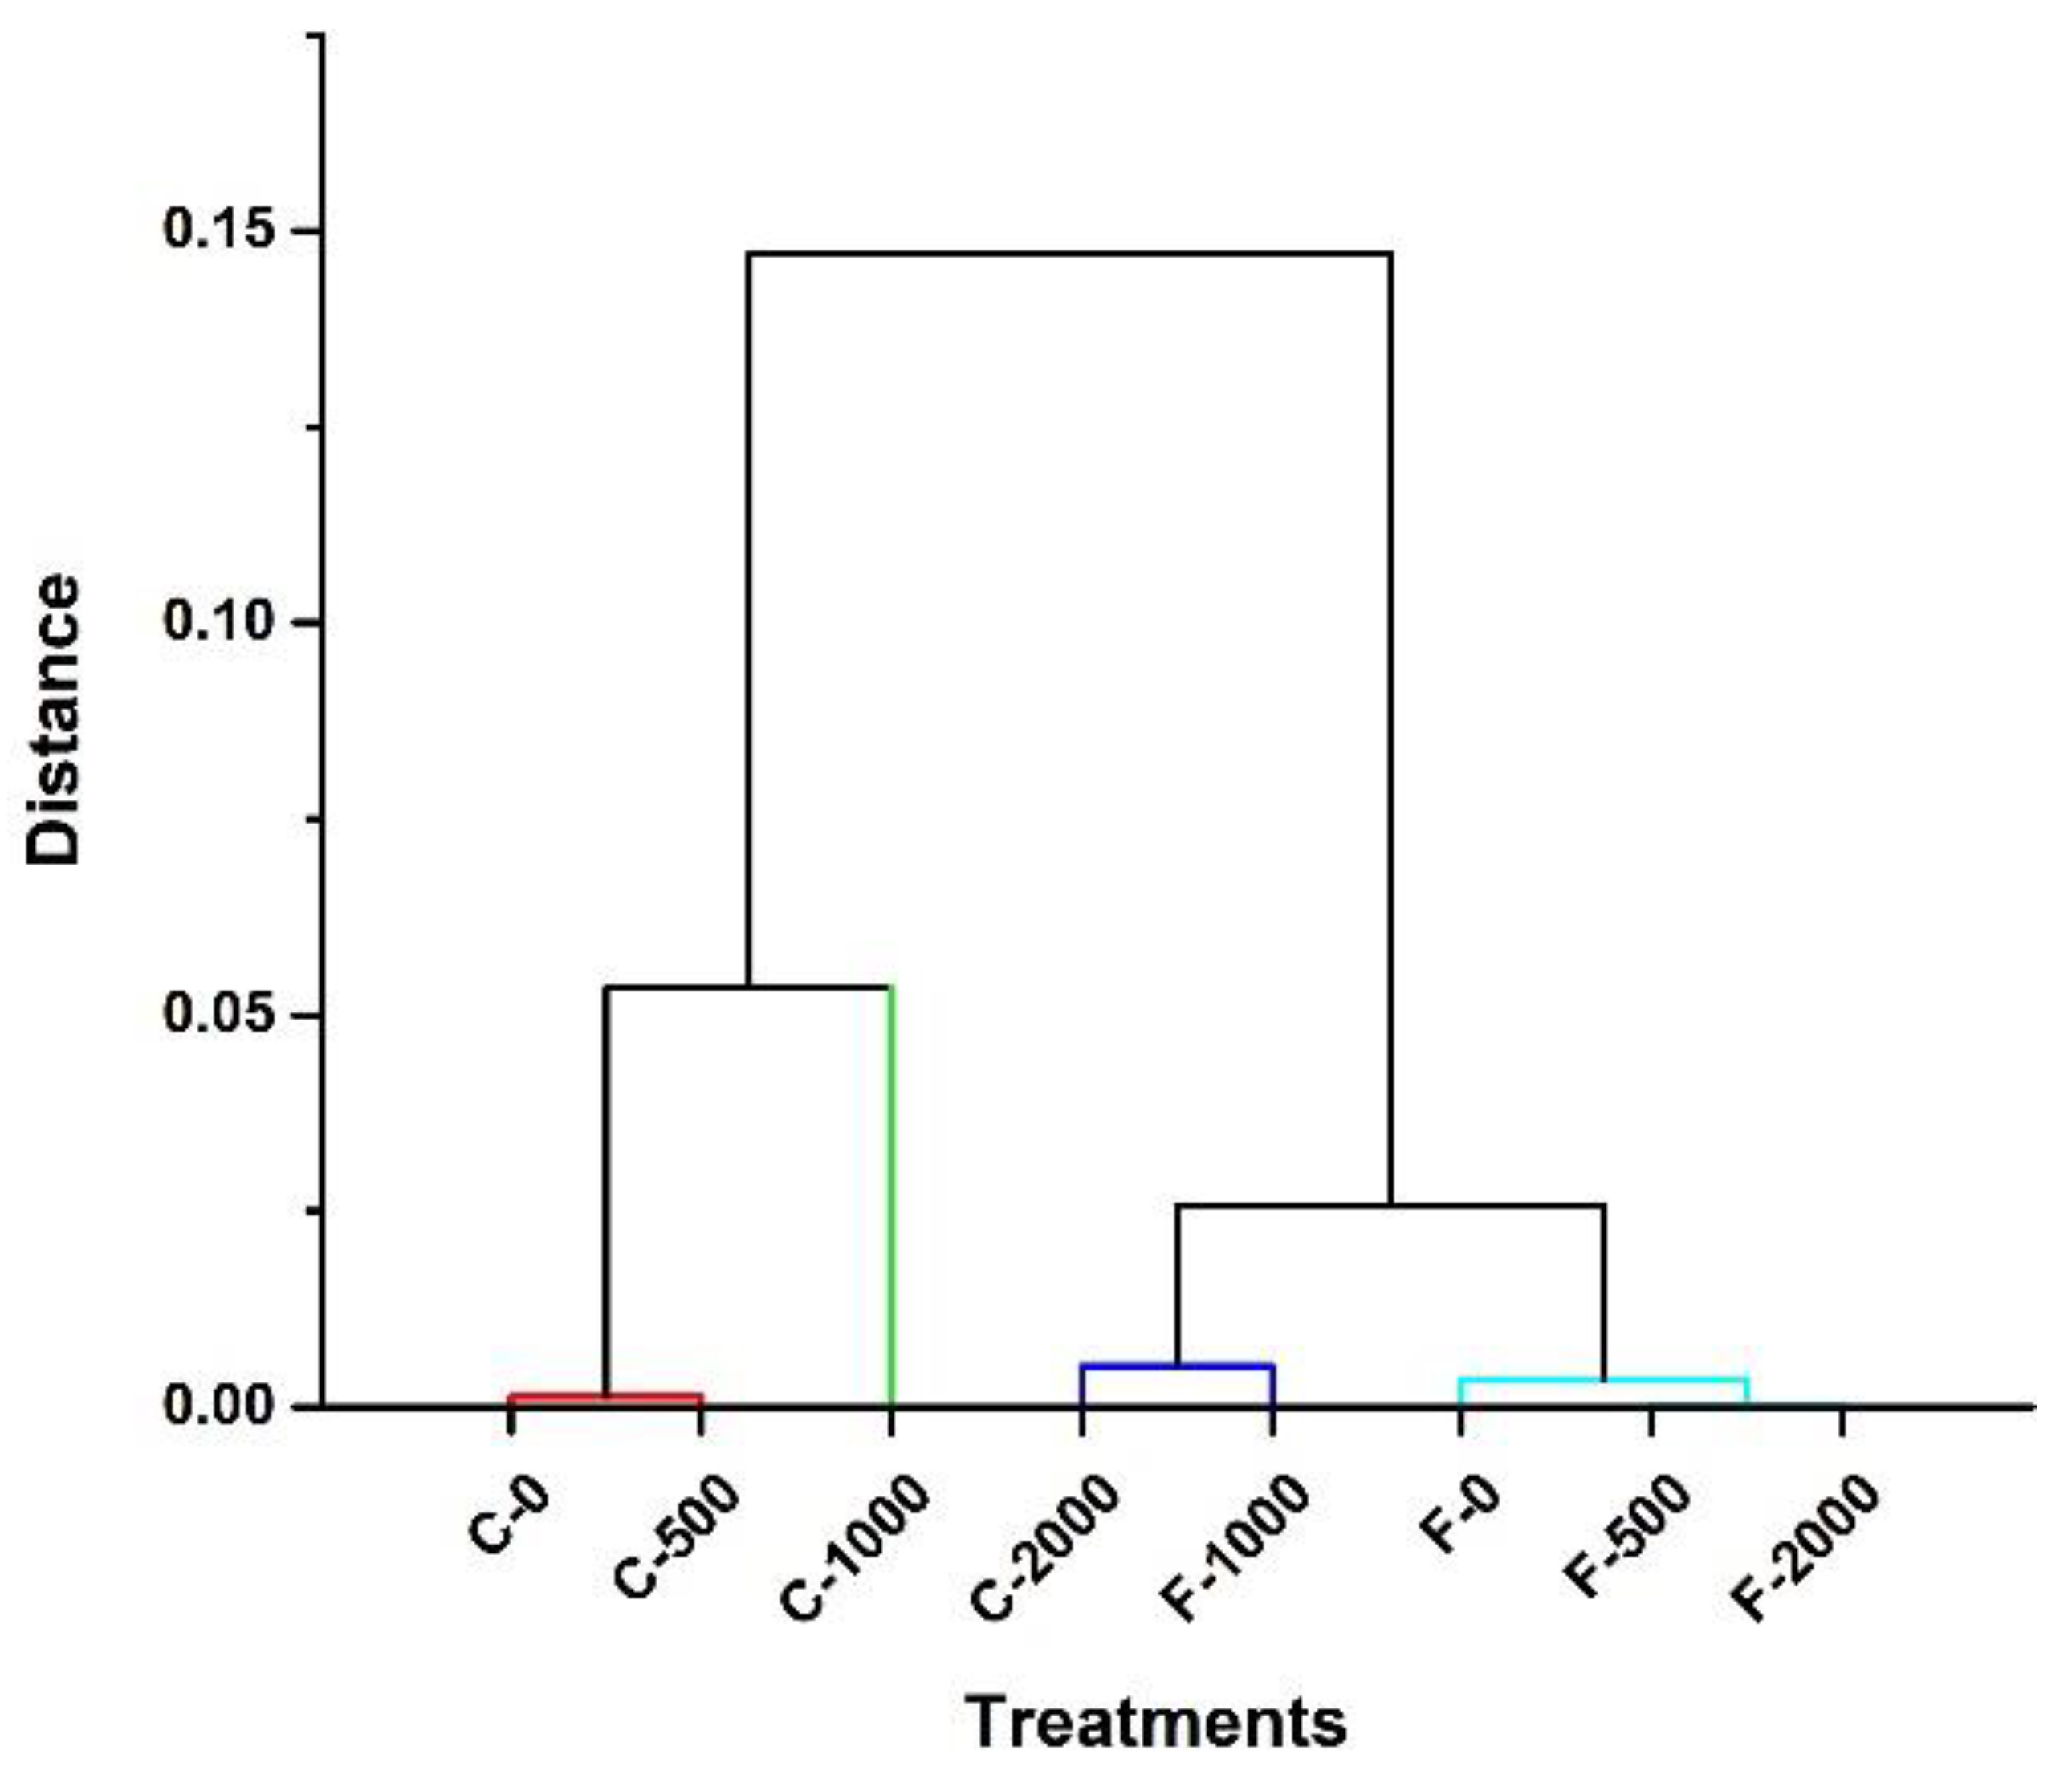

Table 1.
Morphometric variables – height, stem diameter, root dry weight, leaf dry weight, stem dry weight, shoot dry weight, and shoot/root ratio – of two tomato varieties (Floradade and Candela F1) at 50 days after transplanting. The plants were subjected to different concentrations of chitosan. Different letters between rows indicate significant differences for p < 0.05 according to Fisher’s least significant difference (LSD). Values show the mean ± standard error.
| Variable | Variety | Control | 500 mg L-1 | 1000 mg L-1 | 2000 mg L-1 |
|---|---|---|---|---|---|
| Height (cm) | Floradade | 106.5 ± 3.0 b | 114.27 ± 2.1 ab | 117.20 ± 2.1 ab | 116.53 ± 1.8 ab |
| Candela F1 | 120.02 ± 2.5 c | 123.47 ± 2.1 bc | 125.9 ± 1.8 b | 130.47 ± 1.9 a | |
| Stem diameter (mm) | Floradade | 9.40 ± 0.3 b | 9.67 ± 0.2 b | 9.67 ± 0.2 b | 10.13 ± 0.4 a |
| Candela F1 | 8.20 ± 0.3 b | 10.30 ± 0.2 a | 10.30 ± 0.3 a | 10.80 ± 0.21 a | |
| Root Dry Weight (RDW) (g) | Floradade | 52.8 ± 7.1 c | 56.7 ± 5.4 b | 58.3 ± 6.5 b | 70.3 ± 6.5 a |
| Candela F1 | 28.3 ± 2.0 c | 36.7 ± 4.7 b | 38.7 ± 4.7 b | 48.2 ± 1.9 a | |
| Leaf Dry Weight (LDW) (g) | Floradade | 38.0 ± 2.5 c | 42.0 ± 3.7 b | 42.7 ± 2.1 b | 44.0 ± 1.9 a |
| Candela F1 | 32.2 ± 3.7 c | 36.7 ± 1.7 b | 37.2 ± 2.8 b | 39.3 ± 2.4 a | |
| Stem Dry Weight (SDW) (g) | Floradade | 23.8 ± 1.6 b | 26 .0 ± 1.3 a | 27.2 ± 1.9 a | 27.0 ± 0.7 a |
| Candela F1 | 15.5 ± 1.1 d | 18.7 ± 1.9 c | 21.2 ± 2.2 b | 23.8 ± 1.6 a | |
| Shoot Dry Weigh (ShDW) (g) | Floradade | 64.8 ± 4.6 c | 65.8 ± 3.3 c | 69.8 ± 3.7 b | 71.0 ± 2.3 a |
| Candela F1 | 50.7 ± 4.5 c | 55.8 ± 4.1 b | 57.8 ± 3.5 b | 63.2 ± 3.2 a | |
| Shoot/Root (Sh/R) | Floradade | 1.0 ± 0.2 b | 1.2 ± 0.1 a | 1.3 ± 0.1 a | 1.4 ± 0.1 a |
| Candela F1 | 1.1 ± 0.2 b | 1.6 ± 0.3 b | 2.1 ± 0.4 a | 2.1 ± 0.2 a |
Table 2.
Production parameters (fruit yield, number of bunches, number of harvested fruits, FPD, and FED) of two tomato varieties (Floradade and Candela F1) subjected to different concentrations of chitosan. Letters between rows indicate significant differences for p < 0.05 according to Fisher’s least significant difference (LSD). Values show the mean ± standard mean ± standard error.
| Variable | Variety | Control | 500 mg L-1 | 1000 mg L-1 | 2000 mg L-1 |
|---|---|---|---|---|---|
| Fruit Yield (FY)(t ha-1) | Floradade | 5.41 ± 0.07 c | 6.60 ± 0.09 b | 7.19 ± 0.13 a | 8.21 ± 0.22 a |
| Candela F1 | 5.03 ± 0.10 d | 6.37 ± 0.16 c | 6.93 ± 0.07 b | 7.67 ± 0.08 a | |
| Total clusters (TC) | Floradade | 2.07 ± 0.2 d | 2.5 ± 0.2 c | 2.87 ± 0.2 b | 3.07 ± 0.2 a |
| Candela F1 | 1.47 ± 0.1 a | 1.47 ± 0.1 a | 1.27 ± 0.1a | 2.0 ± 0.2 ab | |
| Number of Harvested Fruits (NHF) | Floradade | 4.87 ± 0.3 b | 5.53 ± 0.5 b | 3.93 ± 0.4 ab | 5.73 ± 0.6 b |
| Candela F1 | 2.87 ± 0.3 b | 2.8 ± 0.3 b | 2.93 ± 0.3 b | 4.13 ± 0.4 a | |
| Polar Diameter of the Fruit (FPD) | Floradade | 15.1 ± 1.3 bc | 17.3 ± 1.3 b | 20.8 ±1.8 a | 21.2 ± 2.5 a |
| Candela F1 | 9.5 ± 1.0 c | 11.5 ± 1.4 b | 11.6 ±1.3 b | 15.4 ± 1.3 a | |
| Equatorial Diameter of the Fruit (FED) | Floradade | 16.7 ± 1.5 c | 20.1 ± 1.4 b | 22.7 ± 1.9 b | 23.6 ± 2.6 a |
| Candela F1 | 11.2 ± 1.1 c | 13.1 ± 1.5 b | 13.4 ± 1.5 b | 17.5 ± 1.4 a |
Disclaimer/Publisher’s Note: The statements, opinions and data contained in all publications are solely those of the individual author(s) and contributor(s) and not of MDPI and/or the editor(s). MDPI and/or the editor(s) disclaim responsibility for any injury to people or property resulting from any ideas, methods, instructions or products referred to in the content. |
© 2025 by the authors. Licensee MDPI, Basel, Switzerland. This article is an open access article distributed under the terms and conditions of the Creative Commons Attribution (CC BY) license (https://creativecommons.org/licenses/by/4.0/).
Copyright: This open access article is published under a Creative Commons CC BY 4.0 license, which permit the free download, distribution, and reuse, provided that the author and preprint are cited in any reuse.


