
Submitted:
06 May 2025
Posted:
07 May 2025
You are already at the latest version
Abstract
Lameness significantly compromises dairy cattle welfare and productivity. Early detection enables prompt intervention, enhancing both animal health and farm efficiency. Current computer vision approaches often rely on isolated lameness feature quantification, disregarding critical interdependencies between gait parameters. This limitation is exacerbated by the distinct kinematic patterns exhibited across lameness severity grades, ultimately reducing detection accuracy. This study presented an integrated computer vision and deep learning framework for dairy cattle lameness detection and severity classification. The proposed system comprises: (1) a Cow Lameness Feature Map (CLFM) model extracting holistic gait kinematics (hoof trajectories and dorsal contour) from walking sequences, and (2) a DenseNet-Integrated Convolutional Attention Module (DCAM) that mitigates inter-individual variability through multi-feature fusion. Experimental validation utilized 3,150 annotated lameness feature maps derived from 175 Holsteins under natural walking conditions, demonstrating robust classification performance. The classification accuracy of the method for varying degrees of lameness was 92.80%, the sensitivity was 89.21% and the specificity was 94.60%. The detection of healthy and lameness dairy cows’ accuracy was 99.05%, the sensitivity was 100% and the specificity was 98.57%. The experimental results demonstrate the advantage of implementing lameness severity-adaptive feature weighting through hierarchical network architecture.
Keywords:
dairy cattle
; lameness detection
; computer vision
; deep learning
; precision livestock farming
1. Introduction
Lameness in dairy cows severely impacts their daily activities and is a significant challenge in dairy farming, affecting both welfare and production [1,2]. Lameness in dairy cows primarily stems from infectious or non-infectious hoof disorders, causing limb injuries, altered behavior, reduced milk yield, and increased culling rates [3]. Early detection of lameness in dairy cows is essential for timely treatment, mitigating premature culling risks, lowering production costs, and improving farm profitability [4]. Conventional lameness detection relies on manual assessment, which is labor-intensive, time-consuming, and prone to subjectivity [5,6]. Automated lameness detection systems are critical for eliminating subjective bias, optimizing detection efficiency, and enhance cow welfare [7].
While contact sensors—including weighing platforms, pressure-sensitive pads [8,9,10] and accelerometers [11,12]—offer lameness detection capabilities, their physical attachment risks device damage, displacement, and potential stress induction in cattle during monitoring [13]. Recent advances in computer vision have enabled its successful application to automated lameness detection. This technology offers non-invasive monitoring, eliminating physical stress on cattle while enhancing detection reliability and operational efficiency [14,15,16,17,18,19].
Hoof disease represent a primary etiology of lameness in dairy cattle, clinically manifested through gait abnormalities and asymmetric weight distribution across the extremities [20]. Lame dairy cattle typically demonstrate quantifiable gait abnormalities, including asymmetric stride patterns, reduced tracking distance, and decreased locomotion velocity. Researchers systematically characterized bovine gait kinematics to identify lameness-specific biomechanical markers for automated detection [21]. For example, Song [22] demonstrated the feasibility of visually capturing hoof positions and evaluated the correlation between automatically computed hoof overlaps and visual motion scores. Wu [23] employed a deep learning algorithm to detect cow leg positions and calculated the relative step lengths of cows to identify lameness.
To minimize the impact of individual cow variability on lameness detection, Kang [24] proposed a support-phase-based method for detecting lameness in dairy cows and diseased hooves. In further research, Kang [25] extracted spatiotemporal gait characteristics of dairy cows and constructed a spatiotemporal gait map, which improved the accuracy of lameness detection. Li [26] proposed a spatiotemporal energy network that more comprehensively captures walking patterns by compressing walking videos into gait energy images and history energy images. This approach achieved a lameness detection accuracy of 96.22%.
While abnormal gait characteristics are indicative of lameness severity, relying solely on gait information and ignoring other significant features of lameness can reduce detection accuracy. The characteristic arched back exhibited by lame dairy cattle serves as a clinically observable indicator of lameness severity. Bahr [27] used the curvature of the circle to represent the curvature of the cow’s back as an indicator of lameness. Poursaberi [28] improved the algorithm and introduced a new Body Movement Pattern (BMP) that assessed lameness using back curvature and head position. Myint [18] proposed a method to calculate back curvature using three key points along the cow’s back and implemented a machine learning-based method for lameness detection.
However, dairy cows exhibit individual variability in both gait and walking style, and lameness is also an individual expression [28,29,30]. Lameness manifestation in dairy cattle exhibits distinct kinematic patterns across severity levels, with varying degrees of postural adaptation and gait modification. Unimodal detection systems relying exclusively on either spinal curvature analysis or gait kinematics demonstrate limited diagnostic robustness due to inter-individual variability and pathological complexity. Multivariate feature integration addresses these limitations, improving both detection sensitivity and severity classification accuracy.
The effectiveness of multiple locomotion traits for lameness detection was demonstrated [17,31]. However, the movements of each hoof in dairy cow gait are coupled and interdependent; an affected hoof can lead to coordinated changes in the movement patterns of other healthy hooves [32]. The feature extraction and quantification step removes most of this interdependent information. Therefore, we hypothesized that extracting gait information and directly using it as input for the classification algorithm is a more comprehensive approach. Furthermore, research has confirmed that dairy cows with varying degrees of lameness exhibit different gait characteristics. Early lameness features are more focused on the hoof area [33,34,35], while changes in back posture become more apparent in later stages of the condition [31]. Therefore, adjustments need to be made to the focus of information according to different classification objectives.
In light of these challenges, this study presents a deep learning-based lameness detection framework that comprehensively analyzes bovine gait patterns while dynamically weighting discriminative features for severity classification, thereby enhancing detection robustness and diagnostic precision. The kernel of our model is as follows: a cow lameness feature maps (CLFM) model was used to extract comprehensive gait information of cows, including characteristics of both the hoof and back, from video data of cows walking. The gait information was put into a DenseNet+Convolutional Block Attention classifier (DCAC) model to detect lameness in dairy cows, which aims to improve the interpretability and accuracy of lameness detection by reducing the effect of individual cow variability and integrating multiple lameness features.
2. Materials and Methods
2.1. Dataset Acquisition
The study was conducted at Dingyuan Farm in Hebei Province, China during September 2020. From a herd of 1,000 lactating Holstein cows, a random sample of 300 multiparous individuals was selected for observation. After excluding cows that exhibited interrupted movement patterns due to stopping, crowding, or visual occlusion during recording, the final dataset comprised 175 cows with complete gait records.
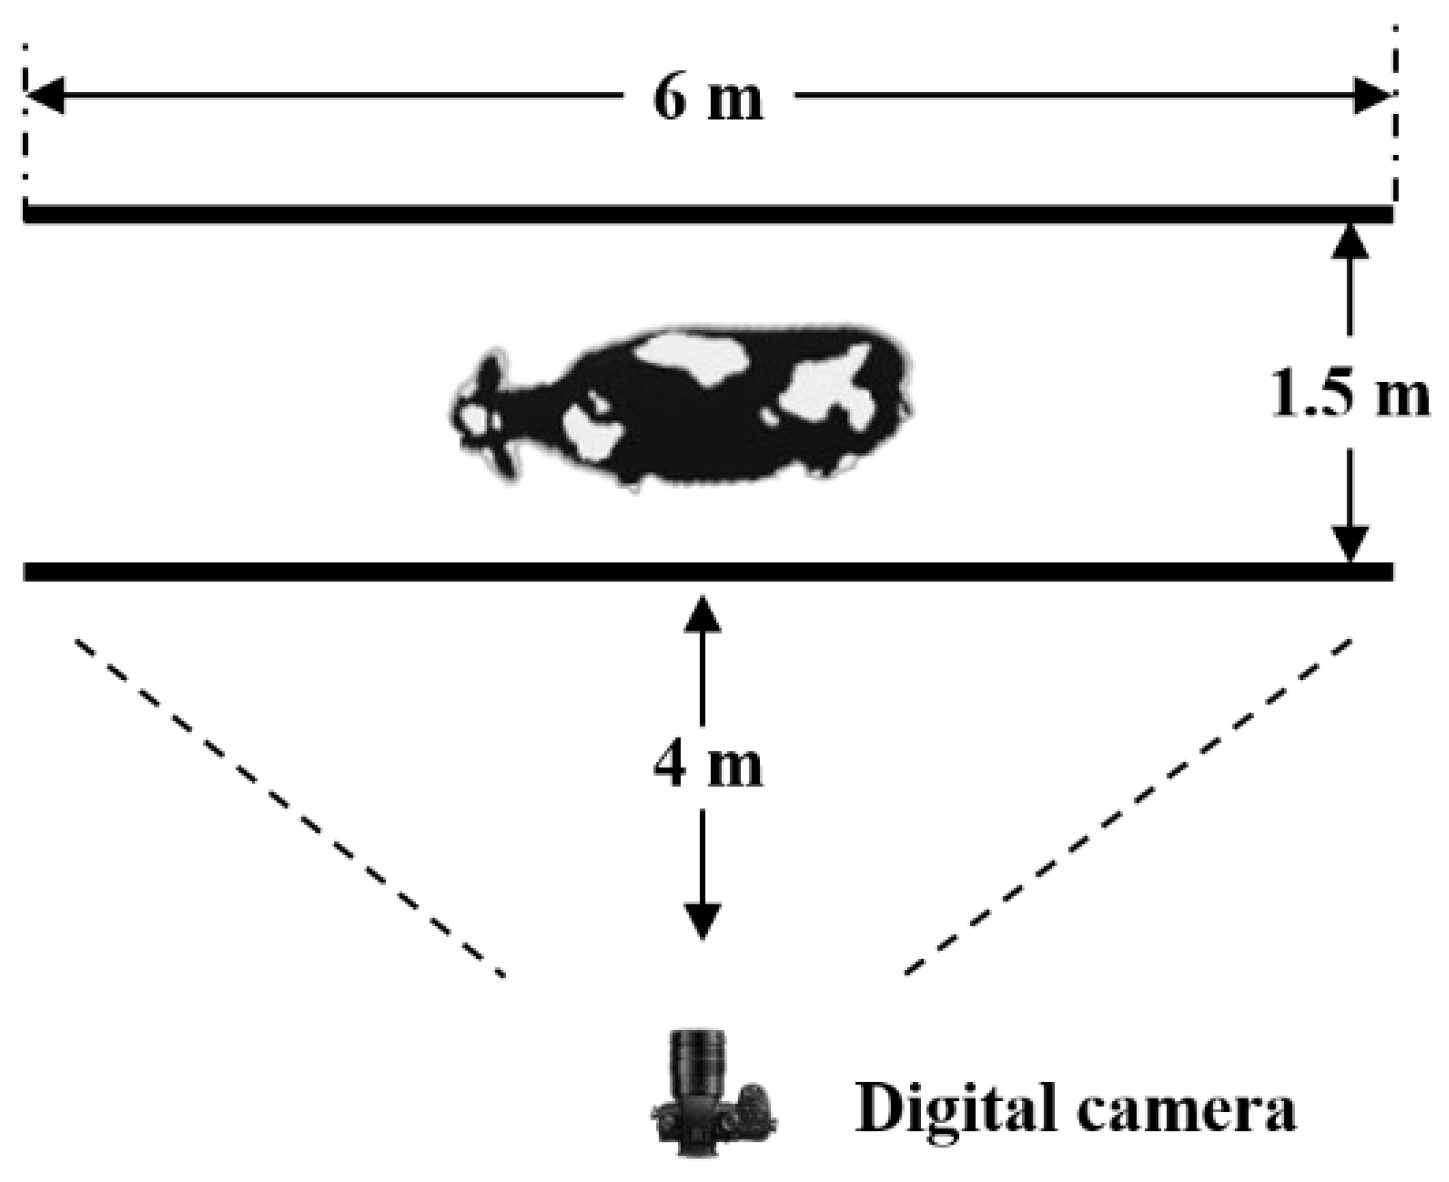
The data collection system featured a dedicated 6-meter long by 1.5-meter wide passageway positioned at the milking parlor exit. A high-resolution Panasonic DC-GH5S digital camera was mounted on a stabilized tripod system, positioned 4 meters laterally from the walking alley at an optimal elevation and angle to capture full-body kinematic profiles. The setup ensured consistent video quality for subsequent gait analysis while minimizing disturbances to normal cow movement patterns (Figure 1).
Ethical approval was not required for this study, as the data collection process was entirely non-invasive. Video recordings were obtained using a stationary camera placed at a distance from the cows, ensuring that no physical contact or interference with the animals occurred.
The locomotion of the cows was scored by two observers trained in locomotion scoring at the passing alley. We used a simplified locomotion scoring system to categorize the cows’ movement into three scores: Score 1 indicates cows that are not lame, Score 2 indicates cows with mild lameness, and Score 3 indicates cows with severe lameness [36]. The description for each score is shown in Table 1. Each observer scored the cows at the passing alley located at the exit from the milking parlor and also scored the cows twice from the video recordings.
The videos were categorized into three groups according to the locomotion scores to create a date set. Each video recording lasted between 5 and 10 seconds, and the data were divided into training and test sets with an 80%:20% ratio.
Figure 1.
Schematic diagram of data collection.
2.2. Methods
2.2.1. Model Architecture
The overall architecture of the model, as shown in Figure. 2, consists of two main parts. The first part is the cow lameness feature maps (CLFM) model. The input data is a 4D tensor of size 1920×1080×3×f, and individual dairy cows are segmented using the Segment Anything algorithm [37]. The lameness feature, which extracts back contour and key gait information from the segmented binary images of the dairy cows using target detection techniques. And the extracted back contour features and key gait information are processed to generate lameness feature maps. The second part is DenseNet+Convolutional Block Attention classifier (DCAC) model, the lameness feature map is categorized into three classes using the improved DenseNet algorithm, which divided the classification process into two steps with Convolutional Block Attention Module (CBAM) being incorporated into different network locations for classification in each step.
2.2.2. CLFM Model
The Segment Anything Model (SAM) is a promptable foundation model designed for image segmentation. SAM leverages the zero-shot and few-shot generalization capabilities demonstrated by large language models that have been pre-trained on web-scale datasets. It is intended to serve as a segmentation model that enables zero-shot transfer to a wide range of tasks through a prompting approach.
In this paper, SAM is employed for individual dairy cow segmentation. The video of a cow walking is decomposed into a sequence of frames. The model is then pre-trained using SAM, with the bounding box serving as input to the prompt encoder. This approach eliminates the need for additional model training and directly outputs the cow’s mask, as illustrated in Figure. 3.
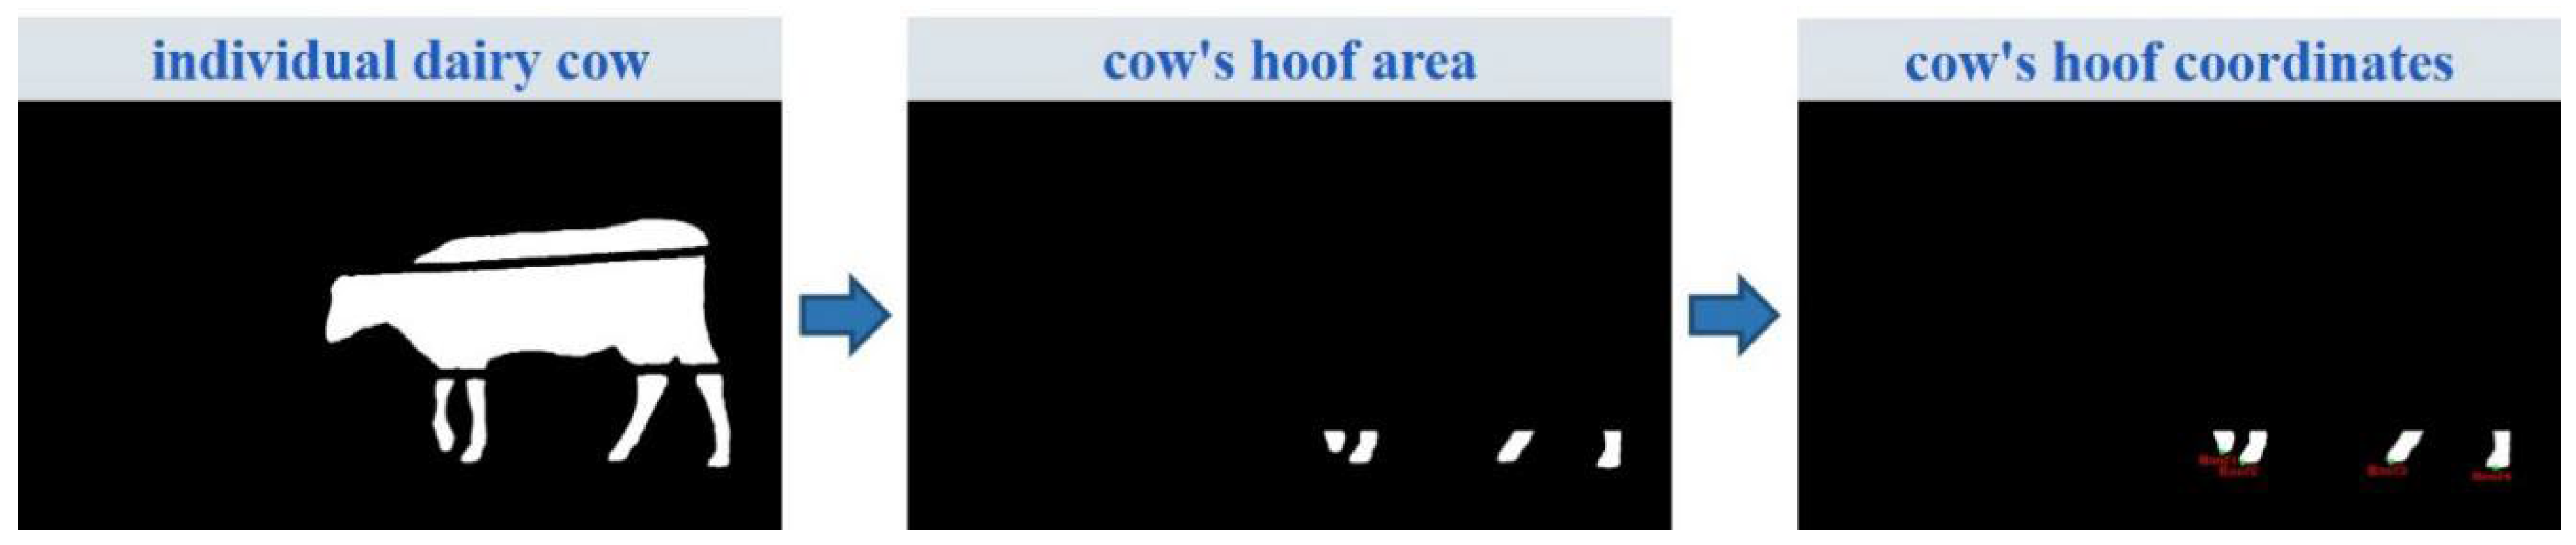
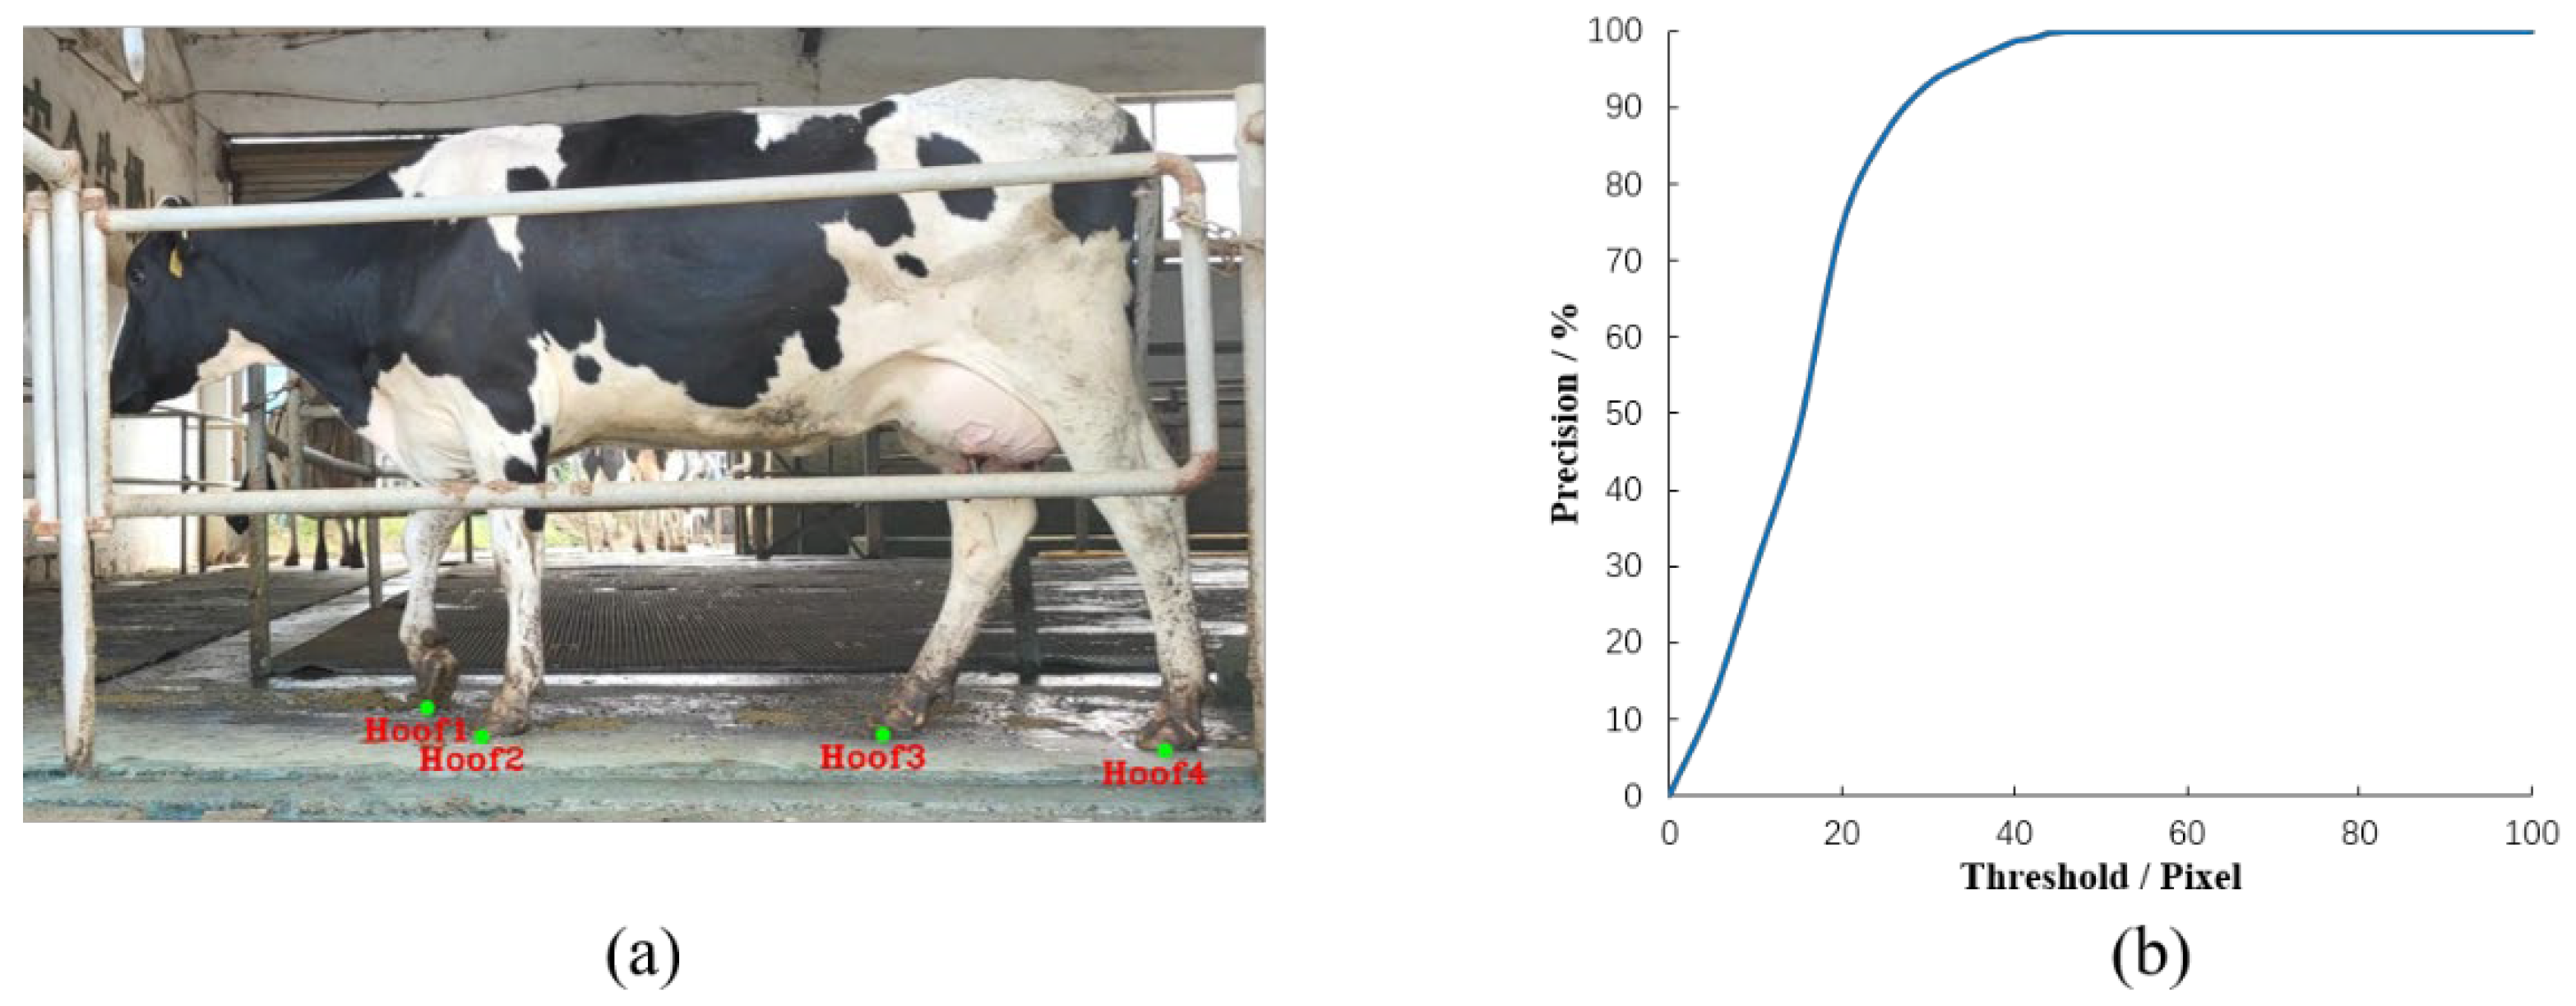
Lameness in dairy cows is primarily caused by hoof disease and is characterized by abnormalities in gait, back arching, and other signs. To capture the gait characteristics of dairy cows, we use an image processing algorithm to extract the positional coordinates of the cow hooves in the video frames. The process for obtaining the hoof coordinates of dairy cows is shown in Figure. 4. This involves first obtaining the segmentation results for individual dairy cows and then identifying the lowest point in the connected domain space of the segmentation results as the hoof position. Each video frame of a cow is processed in the same way to generate a sequence of hoof coordinates.
To evaluate the accuracy of the extracted hoof coordinates, we selected 5,309 images of stress-free, naturally walking dairy cows from the captured videos for analysis. The cow walking videos were processed using the hoof coordinate extraction algorithm described in this paper. The extracted hoof positions were manually labeled on the original images, and the distance, in pixel units, between the extracted hoof coordinates and the manually labeled points was calculated. The Euclidean distance between the coordinates extracted by the algorithm and the manually labeled points was used to establish a threshold, and the percentage of coordinates falling below this threshold was calculated to verify the accuracy of the cow hoof coordinate extraction algorithm.
Figure 4.
The process for obtaining hoof coordinates of dairy cows.
To facilitate subsequent processing, the hoof coordinates were extracted in order from the front hoof to the back hoof of the cow, resulting in a sequence of coordinates represented as [(HF1(x1, y1),HF2(x1, y1),HF3(x1, y1),HF4(x1, y1)),(HF1(x2, y2),HF2(x2, y2),HF3(x2, y2),HF4(x2, y2))…(HF1(xn, yn),HF2(xn, yn),HF3(xn, yn),HF4(xn, yn))]. Due to occlusions of the cow’s hooves during walking, some of the extracted coordinates from each video frame may be missing, meaning not all frames contain four sets of coordinates. To accurately obtain the gait characteristics of the dairy cows, the extracted hoof coordinates need to be cleaned, and coordinates corresponding to the same hoof must be grouped together.
By observing the walking process in the video frames and combining it with preprocessing during the hoof coordinate extraction, the classification process is as follows: for frames with complete hoof coordinates, HF1 and HF2 correspond to the front hooves, while HF3 and HF4 correspond to the back hooves. In frames with two hooves obscured, the hooves are categorized by the horizontal position, with the smaller horizontal coordinate representing the front hooves and the larger one representing the back hooves. This allows for categorizing the hooves by classifying the front and back hooves separately.
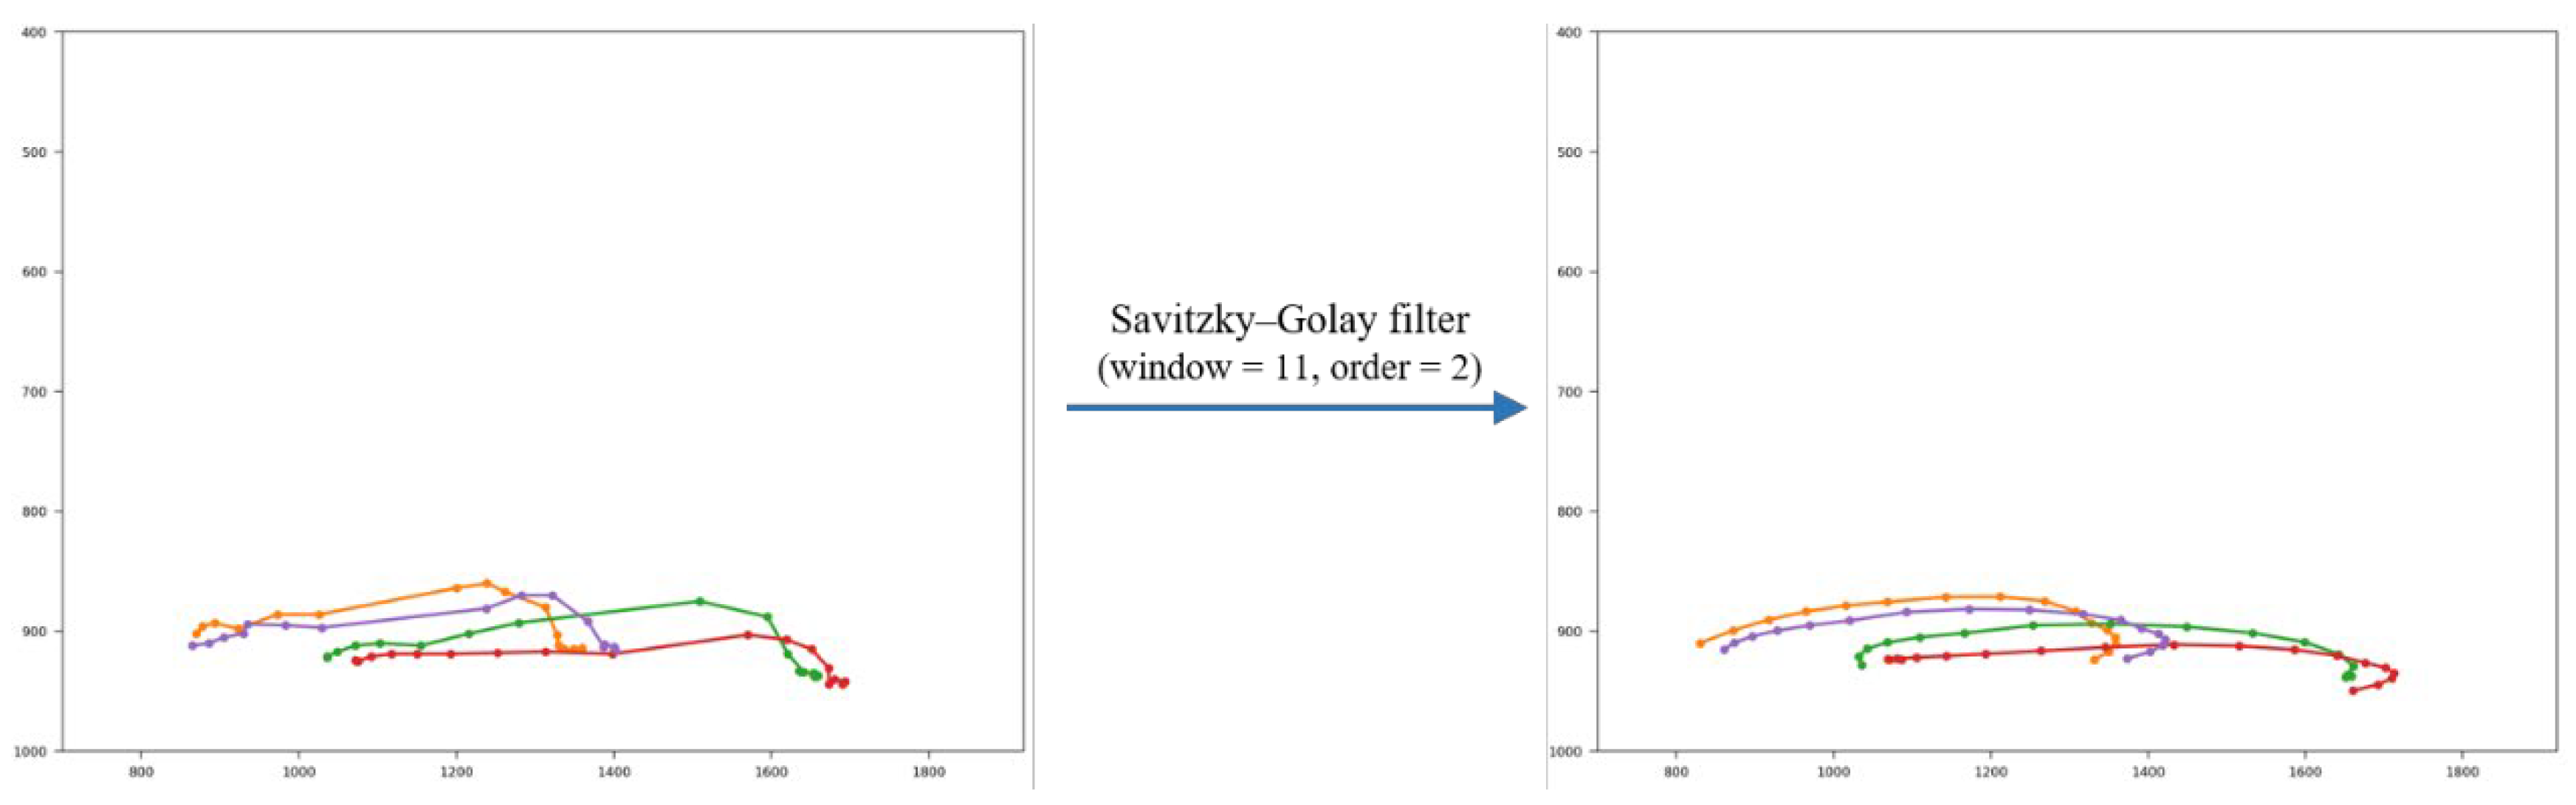
After categorizing the hooves, the acquired hoof coordinate sequences are plotted as trajectories. To further reduce errors in the hoof trajectories, we smooth the trajectories using the Savitzky-Golay filter (window size = 11, order = 2) [38].
Figure 5.
Dairy cows hoof track processing.
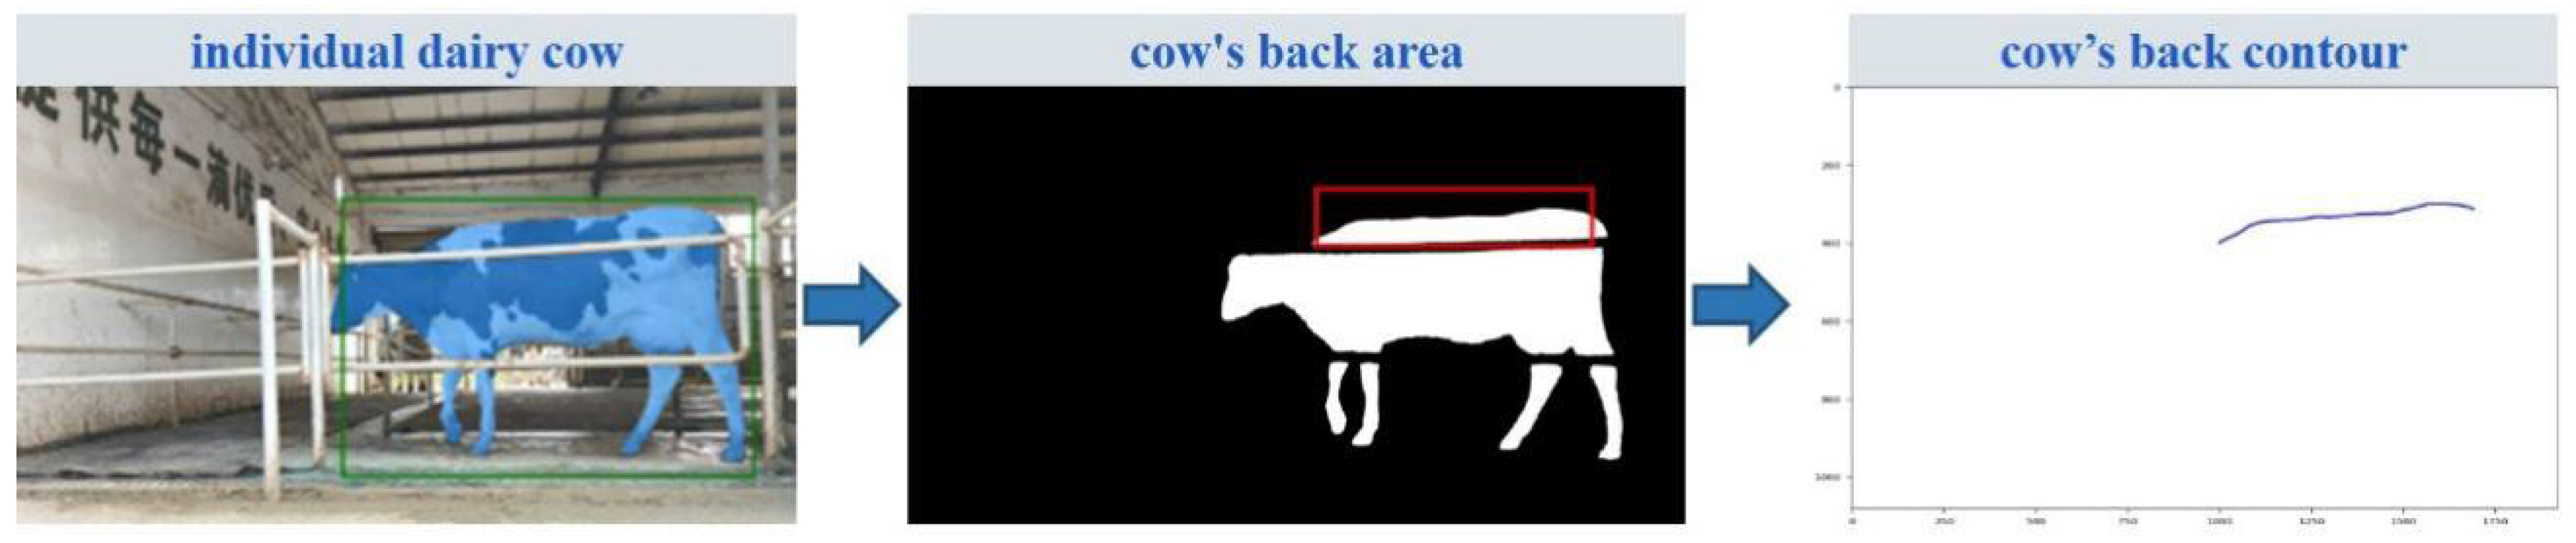
The back contour features of dairy cows are effective indicators for detecting lameness. To improve lameness detection, we use image processing methods to extract the back contour curve of dairy cows. The steps for extracting the back contour are shown in Figure. 6.
First, individual dairy cows are segmented from the video using a segmentation network. Next, noise is removed from the image using erosion and dilation techniques. The back region of the cow is then extracted, starting from the point where the shoulder region first appears smooth in the image. After this, the highest point of each horizontal coordinate is identified within the space of the maximum connected domain of the back of the dairy cow, following the increasing order of the horizontal coordinates of the pixel points. Finally, the acquired sequence of coordinates is plotted on the image, and curve smoothing is applied to generate the back contour of the dairy cow.
Figure 6.
Extraction process of the back contour of dairy cows.
Using image processing methods, we extracted the hoof tracks and back contour of the dairy cows from the video frames. The size of the feature map generated by combining these two features was 1920 × 1080. However, the hoof track was mainly concentrated in the lower-right section of the feature map, which did not effectively highlight the hoof track characteristics. To address this, we optimized the feature map by cropping and resizing, repositioning the back contour in the upper section and the hoof tracks in the lower section, both centered within the feature map. After this optimization, the final size of the acquired lameness feature map was 500×370, which is then used as input for the subsequent image classification process. Through the feature extraction module, we transformed the walking video of dairy cows into lameness feature maps, so the classification model only needs to classify the resulting lameness feature map.
2.2.3. DCAC Model
The lameness feature map eliminates information unrelated to lameness, retaining only the visual representations of gait and back arch. Each feature map captures the hoof trajectory and back condition of a dairy cow while walking. Thus, lameness detection is transformed into a classification task of these feature maps. In this paper, we build upon the DenseNet121 classification model by integrating the Convolutional Block Attention Module (CBAM), resulting in the DCAC model for classifying lameness feature maps and enabling accurate lameness detection.
Figure 7.
Classification network architecture.
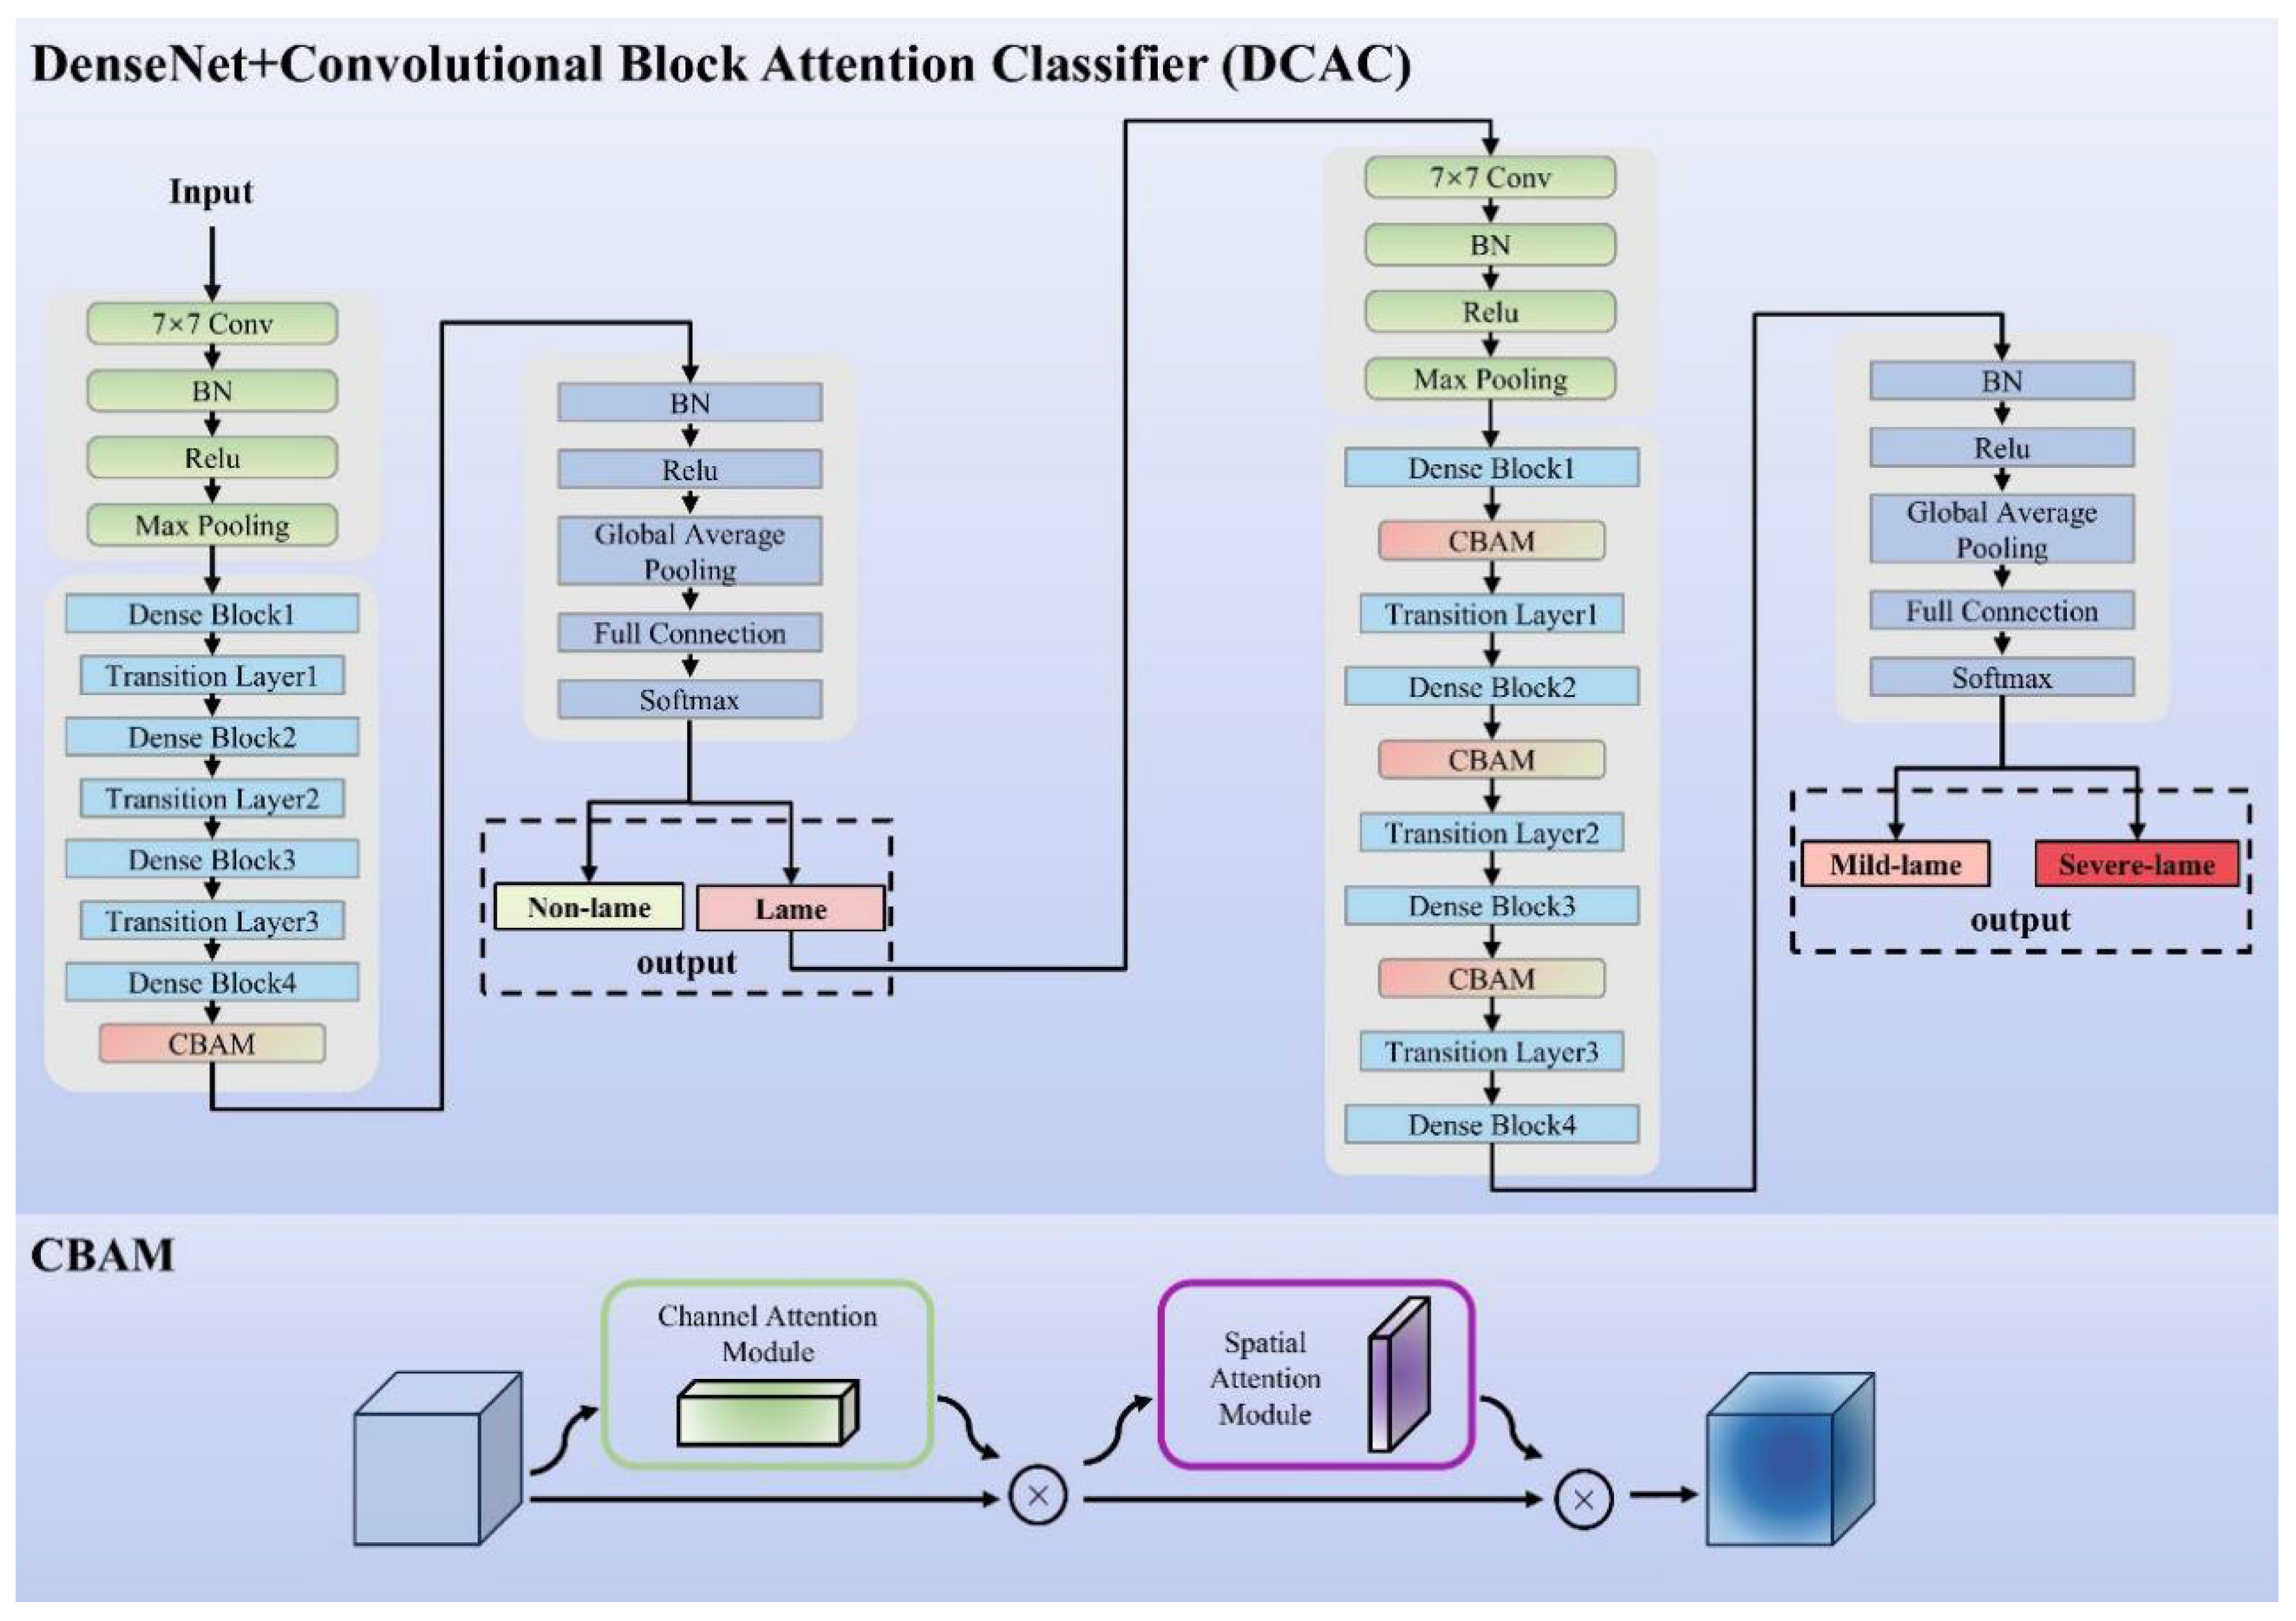
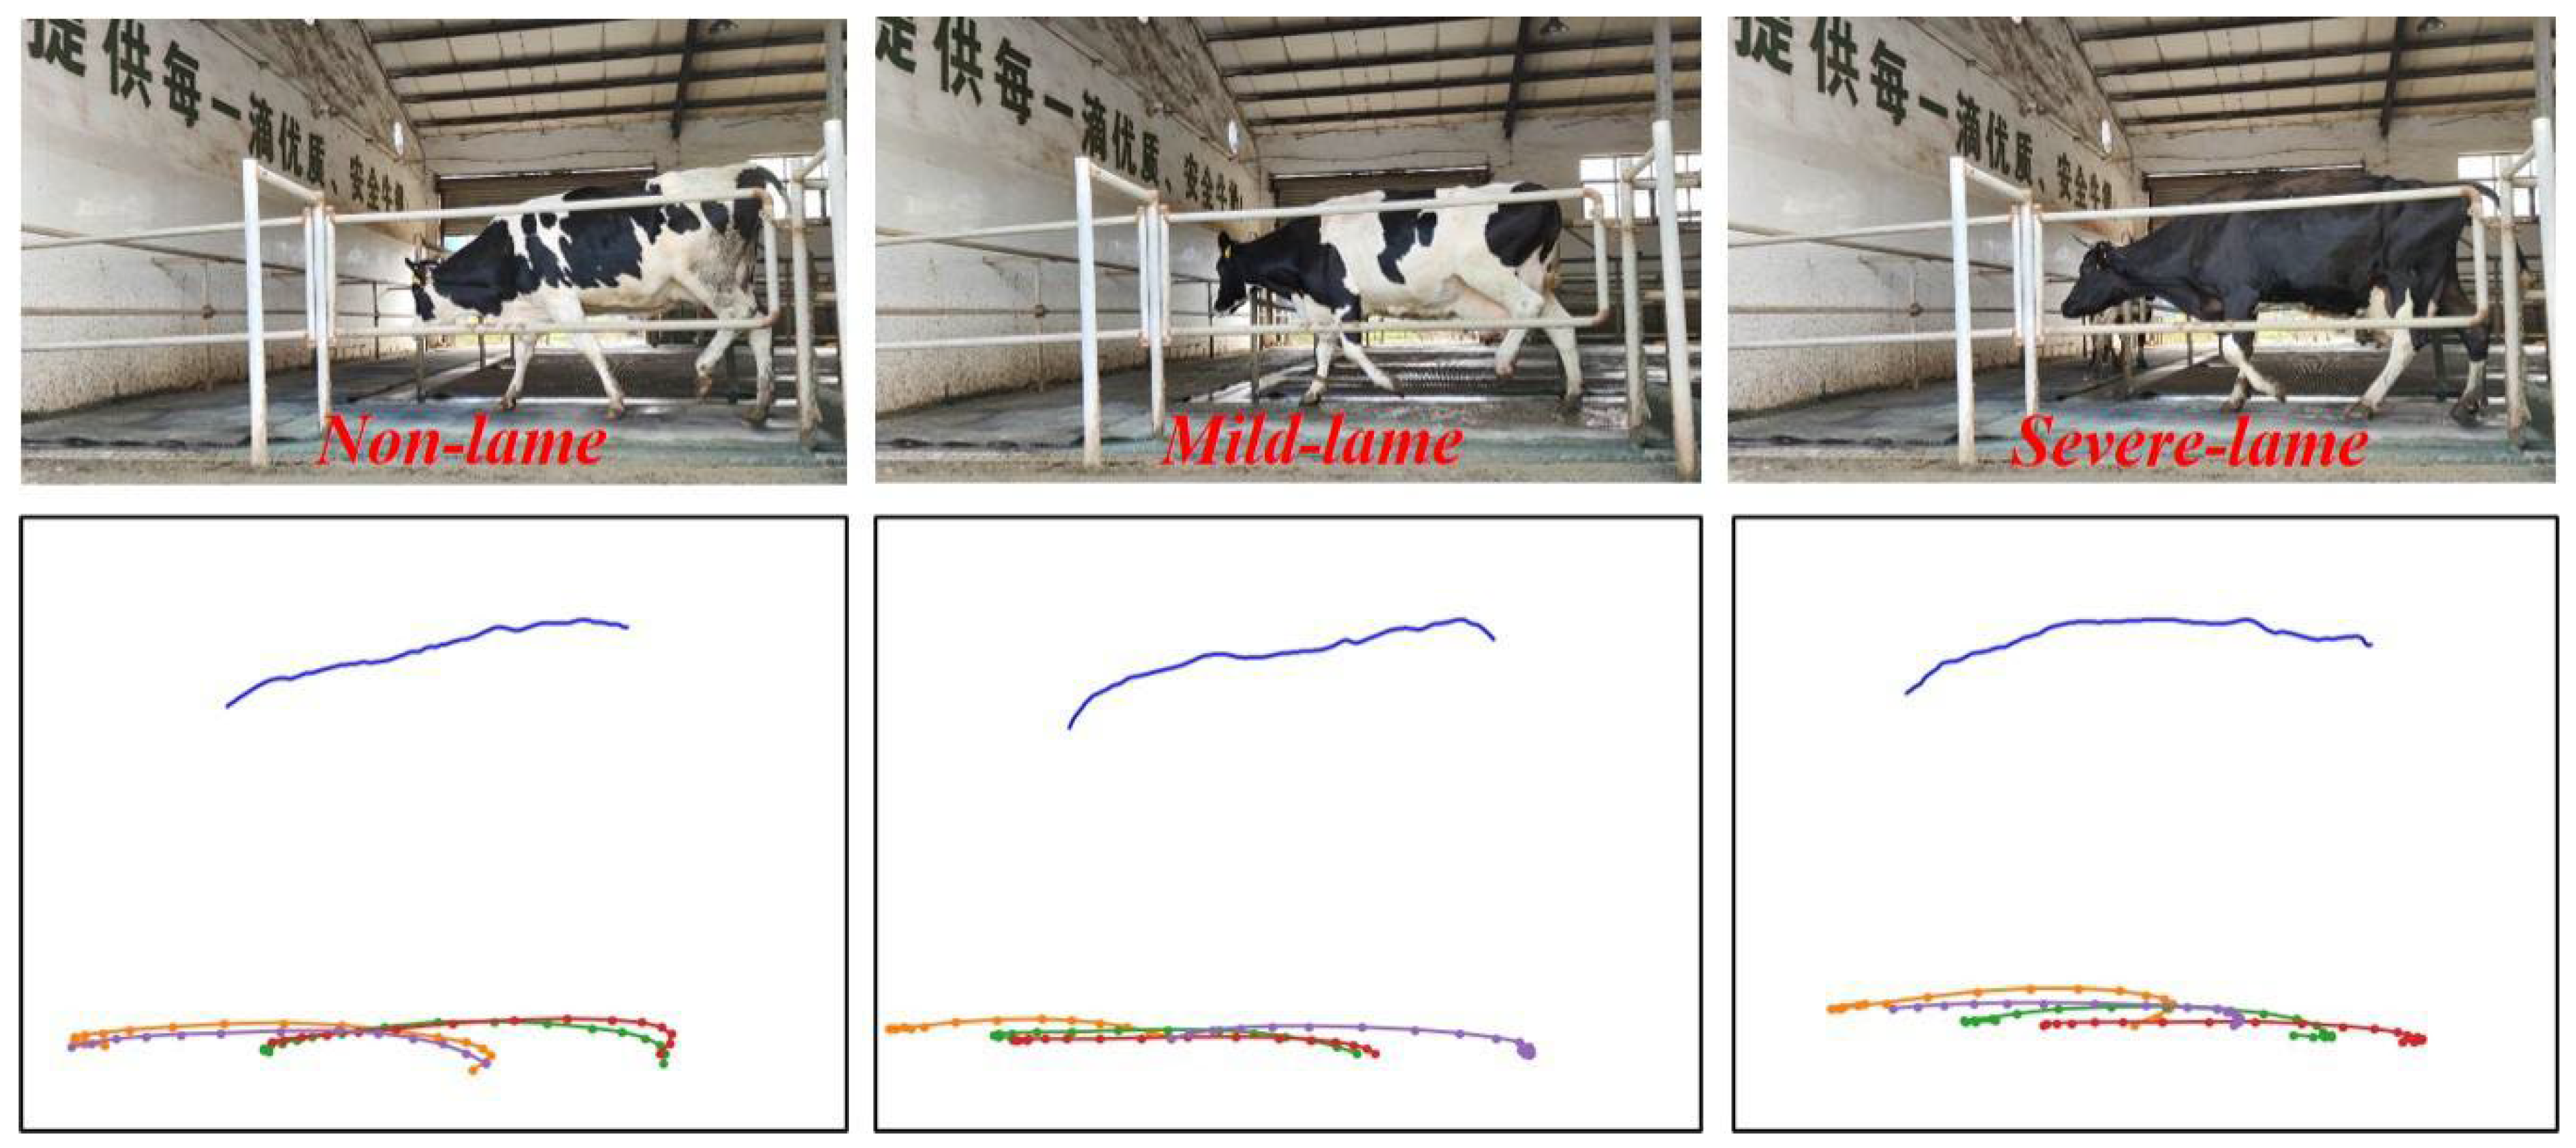
Our lameness feature map contains diverse information related to the severity of lameness in dairy cows(Figure 8). To extract and classify these features, we selected the DenseNet121 network and embedded the CBAM (Convolutional Block Attention Module) into its original structure. Given that different features influence the classification of dairy cows with varying degrees of lameness [32], we divided the classification process into two steps. First, a CBAM attention module was applied after the fourth Dense Block of the DenseNet121 network to classify the lameness feature map into healthy and lame categories. Then, a CBAM attention module was added after the first three Dense Blocks to further classify the lame cows from the first step into mild and severe lameness categories. The detection process through two-step translation, although more cumbersome compared to one-step classification methods, allows for the adjustment of the network’s attention to features, thereby improving detection accuracy.
Figure 8.
Different levels of feature maps.
We set the batch size to 16 and trained the model using the SGD optimizer with a momentum of 0.9 and an initial learning rate of 0.0001, reducing the learning rate by a factor of 10 every 1000 iterations. L2 regularization is applied to the loss function to prevent overfitting. After 3000 iterations, training is concluded. The input data consists of the feature maps generated by the lameness feature extraction process, with the output corresponding to the three levels of lameness. The model training in this study was conducted on an Ubuntu 20.04 operating system with the following hardware configuration: an Intel(R) Xeon(R) Platinum 8255C CPU @ 2.50GHz, 40GB of RAM, and an NVIDIA GeForce RTX 3080 GPU with 10GB of memory. The system also utilized CUDA version 11.6. The deep learning framework used for model development was PyTorch 1.13.0, and the programming language employed was Python 3.8.
3. Results
3.1. Extraction of Hoof
Accurate localization of dairy cows’ hooves is crucial for lameness detection, as it directly impacts the precision of lameness classification. A sample image illustrating the hoof localization of dairy cows is shown in Figure. (a), where the green-marked point represents the hoof position automatically generated by the algorithm. The results of the hoof localization accuracy measurements are presented in Figure. (b). As shown, 93.1% of the video frames exhibit a Euclidean distance of less than 30 pixels between the algorithm-extracted coordinates and the manually calibrated positions. Additionally, the Euclidean distance for all extracted coordinates is below 46 pixels. The average pixel distance for the hooves of the dairy cows is approximately 50 pixels, these results indicate that the algorithm used in this study can accurately localize the hooves of dairy cows.
Figure 9.
Extraction of hoof coordinates of dairy cows. (a) Results of hoof localization of dairy cows; (b) accuracy measurement results.
Figure 9.
Extraction of hoof coordinates of dairy cows. (a) Results of hoof localization of dairy cows; (b) accuracy measurement results.
3.2. Detection Results
To evaluate the classification performance of the DenseNet algorithm with the added attention module on the lameness feature map, we compared DenseNet121 with DCAC model models. To maintain balance across different lameness classes in the dataset, we applied data augmentation by randomly fusing the extracted gait and back features of dairy cows. The models were tested on a dataset containing 3150 lameness feature maps, including 1050 healthy cows, 1050 mildly lame cows, and 1050 severely lame cows. Approximately 80% of the feature maps were used for training and validation, while the remaining 20% were reserved for testing.
To assess the effectiveness of the proposed classification algorithm, we used common evaluation metrics in classification tasks: accuracy, sensitivity, and specificity. The formulas for these metrics are as follows:
Where TP is the number of true positive samples, TN is the number of true negative samples, FP is the number of false positive samples, and FN is the number of false negative samples.
The detection results for healthy and lame cows, using DenseNet121 and the improved DenseNet-CBAM classification algorithm, are summarized in Table 1.
From the results shown in Table 2, it is clear that the lameness feature maps we extracted produced excellent classification results for both healthy and lame dairy cows. The DCAC model model achieved a classification accuracy of 99.05%, with a sensitivity of 100% and specificity of 98.57%. In comparison, the DenseNet121 model achieved a classification accuracy of 95.08%, a sensitivity of 95.71%, and specificity of 94.76%.
Further, as shown in Table 3, the DCAC model demonstrated strong performance in classifying healthy, mildly lame, and severely lame cows, with a classification accuracy of 92.80%, sensitivity of 89.21%, and specificity of 94.60%. The conventional DenseNet121 model, on the other hand, achieved a classification accuracy of 88.99%, sensitivity of 83.49%, and specificity of 91.75%.
4. Discussion
Recent advances in computer vision have substantially progressed dairy cattle lameness detection, with deep learning demonstrating exceptional efficacy in both object localization and image classification tasks. This progress has greatly enhanced the accuracy of lameness detection in dairy cows. The method presented in this paper primarily consists of two components: CLFM model for video processing and DCAC model for lameness detection.
Several prior studies have established a strong correlation between specific motor characteristics, such as a bowed back and abnormal gait, and locomotion scores. However, relying on a single characteristic for lameness detection is prone to errors, including misdetection or underdetection [17,31]. To overcome these limitations, this study combines both the back contour and hoof trajectory features, thereby eliminating irrelevant information and retaining only the essential gait and back features. This approach enhances the model’s interpretability, reduces complexity, and improves classification accuracy.
However, despite the inclusion of features in the lameness feature map that can be used to distinguish between healthy, mild, and severe lameness, directly using the lameness feature map as input for three-class classification still results in numerous errors, because some features can interfere with the detection results. For example, the back arch is used to detect cows; however, some cows that are mild lame do not show an arched back, while some non-lame cows show an arched back [28]. Classification efficacy of distinct features varies significantly across lameness severity grades [31].
Therefore, the three-class lameness classification task is divided into two binary classification tasks: healthy vs. lame and mild lameness vs. severe lameness. For the first task, we use DenseNet121, a well-established classification model, and integrate the Convolutional Block Attention Module (CBAM) to adjust the model’s focus on lameness-specific features. For the classification of healthy versus lame cows, we place the CBAM module after the fourth Dense Block to emphasize gait features. Through experimental comparison, we determine the optimal attention ratio to be 6:4, favoring gait over back features.
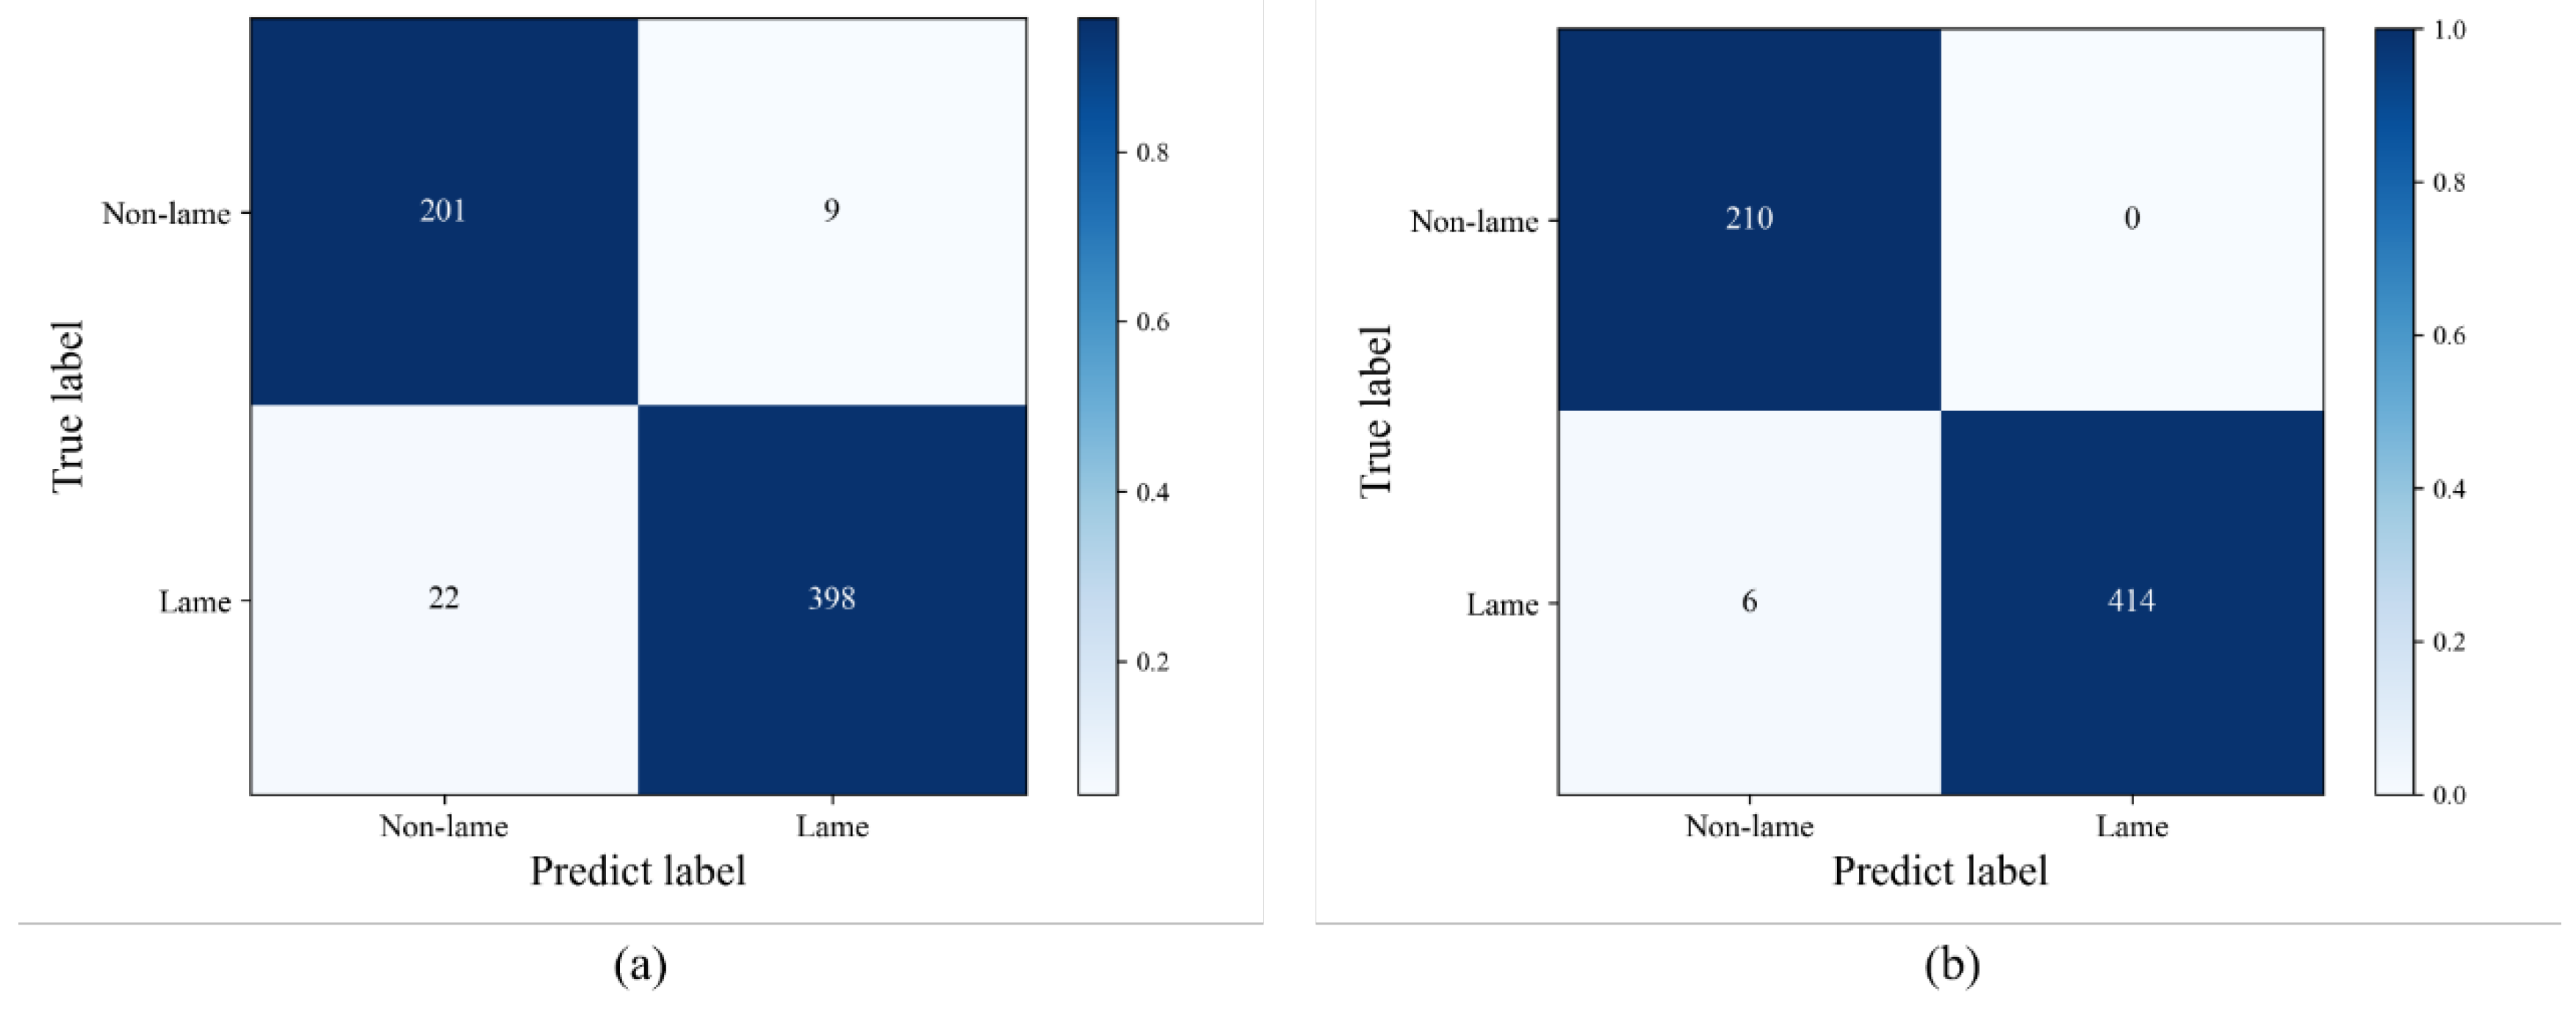
Figure. 8. Confusion matrix of classification results for lameness dairy cows. (a) Classification results using the DenseNet121 model; (b) classification results using the CLFM model.
0 presents the confusion matrices comparing the binary classification results of healthy and lameness cows using both DenseNet121 and CLFM models. (a) shows the results of the DenseNet121 model, while (b) shows the results of the CLFM model. As seen from the figure, the CLFM model significantly reduces the misclassification of healthy cows as lame and vice versa. As shown, nine healthy cows that were misclassified as lame by DenseNet121 were correctly identified as non-lame by the CLFM models, indicating that CBAM played a role in reducing misclassification caused by the influence of back posture on lameness detection. Additionally, out of 22 lame cows misclassified as healthy by DenseNet121, 16 were correctly detected as lame by the CLFM models, suggesting that paying more attention to hoof features can reduce the rate of missed detection for lameness.
Figure 8.
Confusion matrix of classification results for lameness dairy cows. (a) Classification results using the DenseNet121 model; (b) classification results using the CLFM model.
Figure 8.
Confusion matrix of classification results for lameness dairy cows. (a) Classification results using the DenseNet121 model; (b) classification results using the CLFM model.
For the second classification task—distinguishing between mild and severe lameness in lame cows—we focus more on the bowed back feature, as it is key to differentiating between the two levels of lameness. To accomplish this, we add CBAM modules after the first three Dense Blocks and adjust the attention ratio to 4:6, emphasizing back contour features. Using this improved classification network, we perform the binary classification task and present the results in Table 4. The final classification results show that all motion scores were accurately predicted, with the motion score of 1 achieving the best classification results: sensitivity of 100% and specificity of 98.57%. The motion score of 2, while having relatively lower specificity and sensitivity, still performed well with 92.14% sensitivity and 83.33% specificity.

Table 4.
Confusion matrix of the CLFM algorithm for classification results of lameness in dairy cows.
Table 4.
Confusion matrix of the CLFM algorithm for classification results of lameness in dairy cows.
| Locomotion scores | Algorithm classification | Total | Sensitivity (%) | ||||
|---|---|---|---|---|---|---|---|
| Score 1 | Score 2 | Score 3 | |||||
| Score 1 | 210 | 0 | 0 | 210 | 100 | ||
| Score 2 | 6 | 175 | 29 | 210 | 83.33 | ||
| Score 3 | 0 | 33 | 177 | 210 | 84.29 | ||
| Specificity (%) | 98.57 | 92.14 | 93.10 | ||||
To demonstrate the lameness classification effect of the proposed method, the proposed method is compared with the research results of lameness classification in recent years. Some studies have extracted multiple features from videos (such as Back Posture Measurement, Head Bobbing Amplitude, Tracking distance, Stride Length, Stance Duration, and Swing Duration) and combined them with machine learning algorithms (including Decision Tree, Support Vector Machine, K-Nearest Neighbor, Random Forests, and Logistic Regression) to develop classification algorithms for cow lameness [17,18,39], as shown in Table 4. As can be seen from Table 4, the lameness classification accuracy of the proposed method is 89.20%, sensitivity is 94.60%, and specificity is 89.21%, compared to the results of recent studies on lameness classification, there have been improvements.
Table 4.
Comparison with existing lameness classification methods.
| Algorithm | Accuracy (%) | Sensitivity (%) | Specificity (%) |
|---|---|---|---|
| AdaBoost [18] | 77.90 | - | - |
| SVM-R [17] | 80.07 | 76.78 | 81.15 |
| Logistic Regression [39] | 87.30 | 88.80 | 85.7 |
| Our | 92.80 | 89.21 | 94.60 |
In addition, some studies have used deep learning networks to address the detection problem of whether dairy cows are lame, including YOLOv3 + LSTM [23], Siam-AM + SVM [40], and SOLOv2+SVM [41] as well as deep learning algorithms, including C3D [42], R3D and R2plus1D [43], as shown in Table 5. As can be seen from Table 5, for the problem of lameness detection, the method proposed in this paper exhibits improved performance compared with existing lameness detection methods. The lameness detection accuracy of the proposed method is 99.05%, sensitivity is 100%, specificity is 98.57%. The accuracy, sensitivity and specificity of the C3D algorithm are 75.68%, 81.08%, and 70.27%, respectively. The accuracy, sensitivity, and specificity of the R3D algorithm are 74.32%, 70.27%, and 78.38%, respectively. The accuracy, sensitivity, and specificity of the R2Plus1D algorithm are 67.57%, 75.68%, and 59.46% , respectively. The accuracy using deep learning algorithm with video is less than 80 %, which indicates that it is difficult to extract high value lameness features directly using deep learning algorithm. It proves that the method combining feature extraction with a classification network demonstrates superior performance, and the method proposed in this paper can effectively retain the lameness features of cows and flexibly utilize these features to achieve lameness detection.
Although the overall results are promising, Table 3 reveals the misclassification, particularly between mild and severe lameness categories. The confusion matrix demonstrates that the model occasionally misclassifies mildly lame cows as severely lame, and vice versa. This inter-category confusion suggests that the current classification criteria lack sufficient discriminative power to reliably differentiate between these two severity levels, highlighting an important area for future refinement. We have analyzed the reasons behind these misclassifications, which are also issues to be addressed in our subsequent research. Firstly, lameness is a continuum rather than a binary concept [44]. The distinction between mild and severe lameness is subjective, as exemplified by descriptions such as a shortened stride and a noticeable arched back in locomotion scoring. Currently, there is no definitive research outlining the quantitative criteria for this distinction. Therefore, for the model to more accurately capture these descriptive differences between mild and severe lameness, it requires more data to learn and automatically quantify these distinctions. Secondly, cows are complex, individually different, and time-variant dynamic (CITD) systems [29] and show lameness in different ways. Therefore, defining individual models can enhance classification accuracy. Determining lameness based on individual cow information rather than population data is also one of our future research directions. Lastly, our attempt to incorporate an attention mechanism for different features to adjust their weights of influence on classification results proved useful, but there is still room for improvement. Since cow lameness involves an overall gait change, methods such as Cross-Attention and Feature Fusion can effectively facilitate feature information interaction and improve feature representation. In the future, we will also explore more effective classification models based on cow locomotion theory.
5. Conclusions
To solve the problems with missing input feature information and the varying impact of different features on classification, a cow lameness classification method based on deep learning and the CLFM-DCAC model was proposed in this paper. The detection accuracy is 99.05%, the sensitivity is 100% and the specificity is 98.57%. The classification accuracy of the method presented in this paper for lameness is 92.80%, the sensitivity is 94.60% and the specificity is 94.60%. Compared to currently existing lameness detection and classification methods, this method exhibits better performance. This study provides research directions for the extraction of lameness information and the construction of classification networks, and has important research significance for improving the level of intelligent dairy cow breeding and precision livestock management.
In the future, the method of determining lameness based on individual cow information will be further studied to solve the problem of eliminating the influence of individual specificity. More feature fusion and classification attention mechanisms for feature allocation will be studied and applied to represent the relationships among cow lameness features and to address the issue of different features appearing for different degrees of lameness.
Author Contributions
Conceptualization, Xi.Kang.; methodology, Xi.Kang.; software, Junjie.Liang.; validation, Xi.Kang. and Junjie.Liang.; formal analysis, Xi.Kang.; investigation, Qian.Li.; resources, Gang.Liu.; data curation, Xi.Kang. And Junjie.Liang.; writing—original draft preparation, Xi.Kang. and Junjie.Liang.; writing—review and editing, Gang.Liu.; visualization, Qian.Li.; supervision, Xi.Kang.; project administration, Gang.Liu.; funding acquisition, Xi.Kang. and Gang.Liu. All authors have read and agreed to the published version of the manuscript.
Funding
This work was supported by the Talent introduction fund (no. 20230323Z0062), and the National Natural Science Foundation of China (no. 32272930).
Institutional Review Board Statement
Not applicable.
Data Availability Statement
No new data were created.
Acknowledgments
We would like to thank the Talent introduction fund of Ningbo, National Natural Science Foundation of China, and NingboTech University for their support.
Conflicts of Interest
The authors declare no conflict of interest.
References
- Džermeikaitė, K.; Krištolaitytė, J.; Anskienė, L.; Šertvytytė, G.; Lembovičiūtė, G.; Arlauskaitė, S.; Girdauskaitė, A.; Rutkauskas, A.; Baumgartner, W.; Antanaitis, R. Effects of Lameness on Milk Yield, Milk Quality Indicators, and Rumination Behaviour in Dairy Cows. Agriculture 2025, 15, 286. [CrossRef]
- McLennan, K.M. Why Pain Is Still a Welfare Issue for Farm Animals, and How Facial Expression Could Be the Answer. Agriculture 2018, 8, 127. [CrossRef]
- Scott, G.B. Changes in limb loading with lameness for a number of friesian cattle. Br. Vet. J. 1989, 145, 28-38. [CrossRef]
- Van Nuffel, A.; Zwertvaegher, I.; Pluym, L.; Van Weyenberg, S.; Thorup, V. M.; Pastell, M.; Sonck, B.; Saeys, W. Lameness detection in dairy cows: Part 1. How to distinguish between non-lame and lame cows based on differences in locomotion or behavior. Animals 2015, 5, 838-860. [CrossRef]
- Greenough, P. R.; MacCallum, F. J.; Weaver, A. D. Lameness in Cattle. In Lameness in Cattle, 2nd ed.; Wright (Scientechnica): Bristol, UK, 1981.
- Schlageter-Tello, A.; Bokkers, E.A.; Groot Koerkamp, P.W.; Van Hertem, T.; Viazzi, S.; Romanini, C.E.; Halachmi, I.; Bahr, C.; Berckmans, D.; Lokhorst, K. . Relation between observed locomotion traits and locomotion score in dairy cows. J. Dairy Sci 2015, 98, 8623-8633. [CrossRef]
- Van Nuffel, A.; Zwertvaegher, I.; Van Weyenberg, S.; Pastell, M.; Thorup, V.M.; Bahr, C.; Sonck, B.; Saeys, W. Lameness Detection in Dairy Cows: Part 2. Use of Sensors to Automatically Register Changes in Locomotion or Behavior. Animals 2015, 5, 861-885. [CrossRef]
- Pastell, M.; Hanninen, L.; de Passillé, A.M.; Rushen, J. Measures of weight distribution of dairy cows to detect lameness and the presence of hoof lesions. J. Dairy Sci. 2010, 93, 954-960. [CrossRef]
- Poikalainen, V.; Praks, J.; Kokin, E.; Aland, A.; Veemäe, I.; Peets, S.; Ahokas, J.; Pastell, M.; Hautala, M.; Berckmans, D.; et al. Elaboration of basic methods for automatic analysis of cows’ gait. Agron. Res. 2010, 8, 216-225.
- Maertens, W.; Vangeyte, J.; Baert, J.; Jantuan, A.; Mertens, K.C.; De Campeneere, S.; Pluk, A.; Opsomer, G.; Van Weyenberg, S.; Van Nuffel, A. Development of a real time cow gait tracking and analysing tool to assess lameness using a pressure sensitive walkway: The GAITWISE system. Biosyst. Eng. 2011, 110, 29-39. [CrossRef]
- Pastell, M.; Tiusanen, J.; Hakojärvi, M.; Hänninen, L. A wireless accelerometer system with wavelet analysis for assessing lameness in cattle. Biosyst. Eng. 2009, 104, 545-551. [CrossRef]
- Mandel, R.; Harazy, H.; Gygax, L.; Nicol, C.J.; Ben-David, A.; Whay, H.R.; Klement, E. Detection of lameness in dairy cows using a grooming device. J. Dairy Sci. 2018, 101, 1511-1517. [CrossRef]
- Alsaaod, M.; Fadul, M.; Steiner, A. Automatic lameness detection in cattle. Vet. J. 2019, 246, 35-44. [CrossRef]
- Li, X.; Sun, K.; Fan, H.; He, Z. Real-Time Cattle Pose Estimation Based on Improved RTMPose. Agriculture 2023, 13, 1938. [CrossRef]
- Viazzi, S.; Bahr, C.; Van Hertem, T.; Schlageter-Tello, A.; Romanini, C.E.B.; Halachmi, I.; Lokhorst, C.; Berckmans, D. Comparison of a three-dimensional and two-dimensional camera system for automated measurement of back posture in dairy cows. Comput. Electron. Agric. 2014, 100, 139-147. [CrossRef]
- Zhao, K.; Bewley, J.M.; He, D.; Jin, X. Automatic lameness detection in dairy cattle based on leg swing analysis with an image processing technique. Comput. Electron. Agric. 2018, 148, 226-236. [CrossRef]
- Russello, H.; van der Tol, R.; Holzhauer, M.; van Henten, E.J.; Kootstra, G. Video-based automatic lameness detection of dairy cows using pose estimation and multiple locomotion traits. Comput. Electron. Agric. 2024, 223, 12. [CrossRef]
- Myint, B.B.; Onizuka, T.; Tin, P.; Aikawa, M.; Kobayashi, I.; Zin, T.T. Development of a real-time cattle lameness detection system using a single side-view camera. Sci. Rep. 2024, 14, 22. [CrossRef]
- Jiang, B.; Song, H.B.; He, D.J. Lameness detection of dairy cows based on a double normal background statistical model. Comput. Electron. Agric. 2019, 158, 140-149. [CrossRef]
- Hoffman, A. C.; Moore, D. A.; Vanegas, J.; Wenz, J. R. Association of abnormal hind-limb postures and back arch with gait abnormality in dairy cattle. J. Dairy Sci, 2014, 97, 2178–2185. [CrossRef]
- Flower, F.C.; Weary, D.M. Gait assessment in dairy cattle. Animal 2009, 3, 87-95. [CrossRef]
- Song, X.Y.; Leroy, T.; Vranken, E.; Maertens, W.; Sonck, B.; Berckmans, D. Automatic detection of lameness in dairy cattle - Vision-based trackway analysis in cow’s locomotion. Comput. Electron. Agric. 2008, 64, 39-44. [CrossRef]
- Wu, D.H.; Wu, Q.; Yin, X.Q.; Jiang, B.; Wang, H.; He, D.J.; Song, H.B. Lameness detection of dairy cows based on the YOLOv3 deep learning algorithm and a relative step size characteristic vector. Biosyst. Eng. 2020, 189, 150-163. [CrossRef]
- Kang, X.; Zhang, X.D.; Liu, G. Accurate detection of lameness in dairy cattle with computer vision: A new and individualized detection strategy based on the analysis of the supporting phase. J. Dairy Sci. 2020, 103, 10628-10638. [CrossRef]
- Kang, X.; Li, S.D.; Li, Q.; Liu, G. Dimension-reduced spatiotemporal network for lameness detection in dairy cows. Comput. Electron. Agric. 2022, 197, 10. [CrossRef]
- Li, Q.; Si, Y.S.; Chu, M.Y.; Liu, N.; Kang, X.; Liu, G. A novel lameness detection method for dairy cows based on temporal gait and spatial post features. Comput. Electron. Agric. 2024, 224, 13. [CrossRef]
- Bahr, C.; Leroy, T.; Song, X.; Vranken, E.; Maertens, W.; Vangeyte, J.; Van Nuffel, A.; Sonck, B.; Berckmans, D. Automatic detection of lameness in dairy cattle–analyzing image parameters related to lameness. American Society of Agricultural and Biological Engineers, Reno, NV, USA; 31 August–4 September 2009; Livestock Environment VIII: Iguassu Falls, 592 Brazil, 2009.
- Poursaberi, A.; Bahr, C.; Pluk, A.; Van Nuffel, A.; Berckmans, D. Real-time automatic lameness detection based on back posture extraction in dairy cattle: Shape analysis of cow with image processing techniques. Comput. Electron. Agric. 2010, 74, 110-119. [CrossRef]
- Viazzi, S.; Bahr, C.; Schlageter-Tello, A.; Van Hertem, T.; Romanini, C.E.B.; Pluk, A.; Halachmi, I.; Lokhorst, C.; Berckmans, D. Analysis of individual classification of lameness using automatic measurement of back posture in dairy cattle. J. Dairy Sci. 2013, 96, 257-266. [CrossRef]
- Piette, D.; Norton, T.; Exadaktylos, V.; Berckmans, D. Individualised automated lameness detection in dairy cows and the impact of historical window length on algorithm performance. Animal 2020, 14, 409-417. [CrossRef]
- Kang, X.; Liang, J.; Li, Q.; Liu, G. Accuracy of Detecting Degrees of Lameness in Individual Dairy Cattle Within a Herd Using Single and Multiple Changes in Behavior and Gait. Animals 2025, 15, 1144. [CrossRef]
- Annelies, V, N.; Ingrid, Z.; Liesbet, P. Lameness Detection in Dairy Cows: Part 1. How to Distinguish between Non-Lame and Lame Cows Based on Differences in Locomotion or Behavior. Animals. 2015, 5, 838-860.
- Haladjian, J.; Hodaie, Z.; Nüske, S.; Brügge, B. Gait Anomaly Detection in Dairy Cattle. The Fourth International Conference on Animal-Computer Interaction, Milton Keynes, UK, 21–23 November 2017; ACM: New York, NY, USA, 2017; pp. 1–8.
- Gardenier, J.; Underwood, J.; Clark, C. Object Detection for Cattle Gait Tracking. The 2018 IEEE International Conference on Robotics and Automation (ICRA), Brisbane, Australia, 21–25 May 2018; IEEE: Piscataway, NJ, USA, 2018; pp. 2206–2213.
- Van Nuffel, A.; Vangeyte, J.; Mertens, K. C.; Pluym, L.; De Campeneere, S.; Saeys, W.; Opsomer, G.; Van Weyenberg, S. Exploration of measurement variation of gait variables for early lameness detection in cattle using the GAITWISE. Livest. Sci. 2013, 156 88–95. [CrossRef]
- VanNuffel, A..; Sprenger, M..; Tuyttens, F.A.M..; Maertens, W. Cowgait scores and kinematic gait data: Can people see gait irregularities? Anim.Welf. 2009, 18, 433–439. [CrossRef]
- Kirillov, A.; Mintun, E.; Ravi, N.; Mao, H.Z.; Rolland, C.; Gustafson, L., Xiao, T.T.; Whitehead, S.; Berg, A.C.; Lo, W.Y.; Dolla’r, P.; Girshick, R. Segment Anything. 2023 IEEE/CVF International Conference on Computer Vision (ICCV), Paris, France, 2023, pp. 3992-4003.
- Savitzky, A.; Golay, M.J.E. Smoothing and differentiation of data by simplified least squares procedures. Anal. Chem. 1964, 36, 1627-1639. [CrossRef]
- Zhang, M., 2023. Research on Automatic Lameness Detection Method of Dairy Cows Based on Machine Learning. Mechanical engineering, Henan University of Science and Technology, Luoyang. MA Thesis.
- Zheng, Z.; Zhang, X.; Qin, L.; Yue, S.; Zeng, P. Cows’ legs tracking and lameness detection in dairy cattle using video analysis and Siamese neural networks. Comput. Electron. Agric. 2023, 205, 107618. [CrossRef]
- Li, Q.; He, Z.J.; Liu, X.W.; Chu, M.Y.; Wang, Y.C.; Kang, X.; Liu, G. Lameness detection system for dairy cows based on instance segmentation. Expert Syst. Appl. 2024, 249, 123775. [CrossRef]
- Tran, D.; Bourdev, L.; Fergus, R.; Torresani, L.; Paluri, M. Learning Spatiotemporal Features with 3D Convolutional Networks. In Proceedings of the 2015 IEEE International Conference on Computer Vision (ICCV), Santiago, Chile, 7-13 December 2015; IEEE: Piscataway, NJ, USA, 2015; pp. 4489–4497.
- Tran, D.; Wang, H.; Torresani, L.; Ray, J.; LeCun, Y.; Paluri, M. A Closer Look at Spatiotemporal Convolutions for Action Recognition. In Proceedings of the 2018 IEEE Conference on Computer Vision and Pattern Recognition (CVPR), Salt Lake City, UT, USA, 18-22 June 2018; IEEE: Piscataway, NJ, USA, 2018; pp. 6450–6459.
- Adair, S.; Baus, M.; Belknap, J.; Bell, R.; Boero, M.; Bussy, C.; Cardenas, F.; Casey, T.; Castro, J.; Davis, W. Response to letter to the editor: Do we have to redefine lameness in the era of quantitative gait analysis. Equine Vet. J. 2018, 50, 415–417. [CrossRef]
Figure 2.
Overall Architecture of the Model.
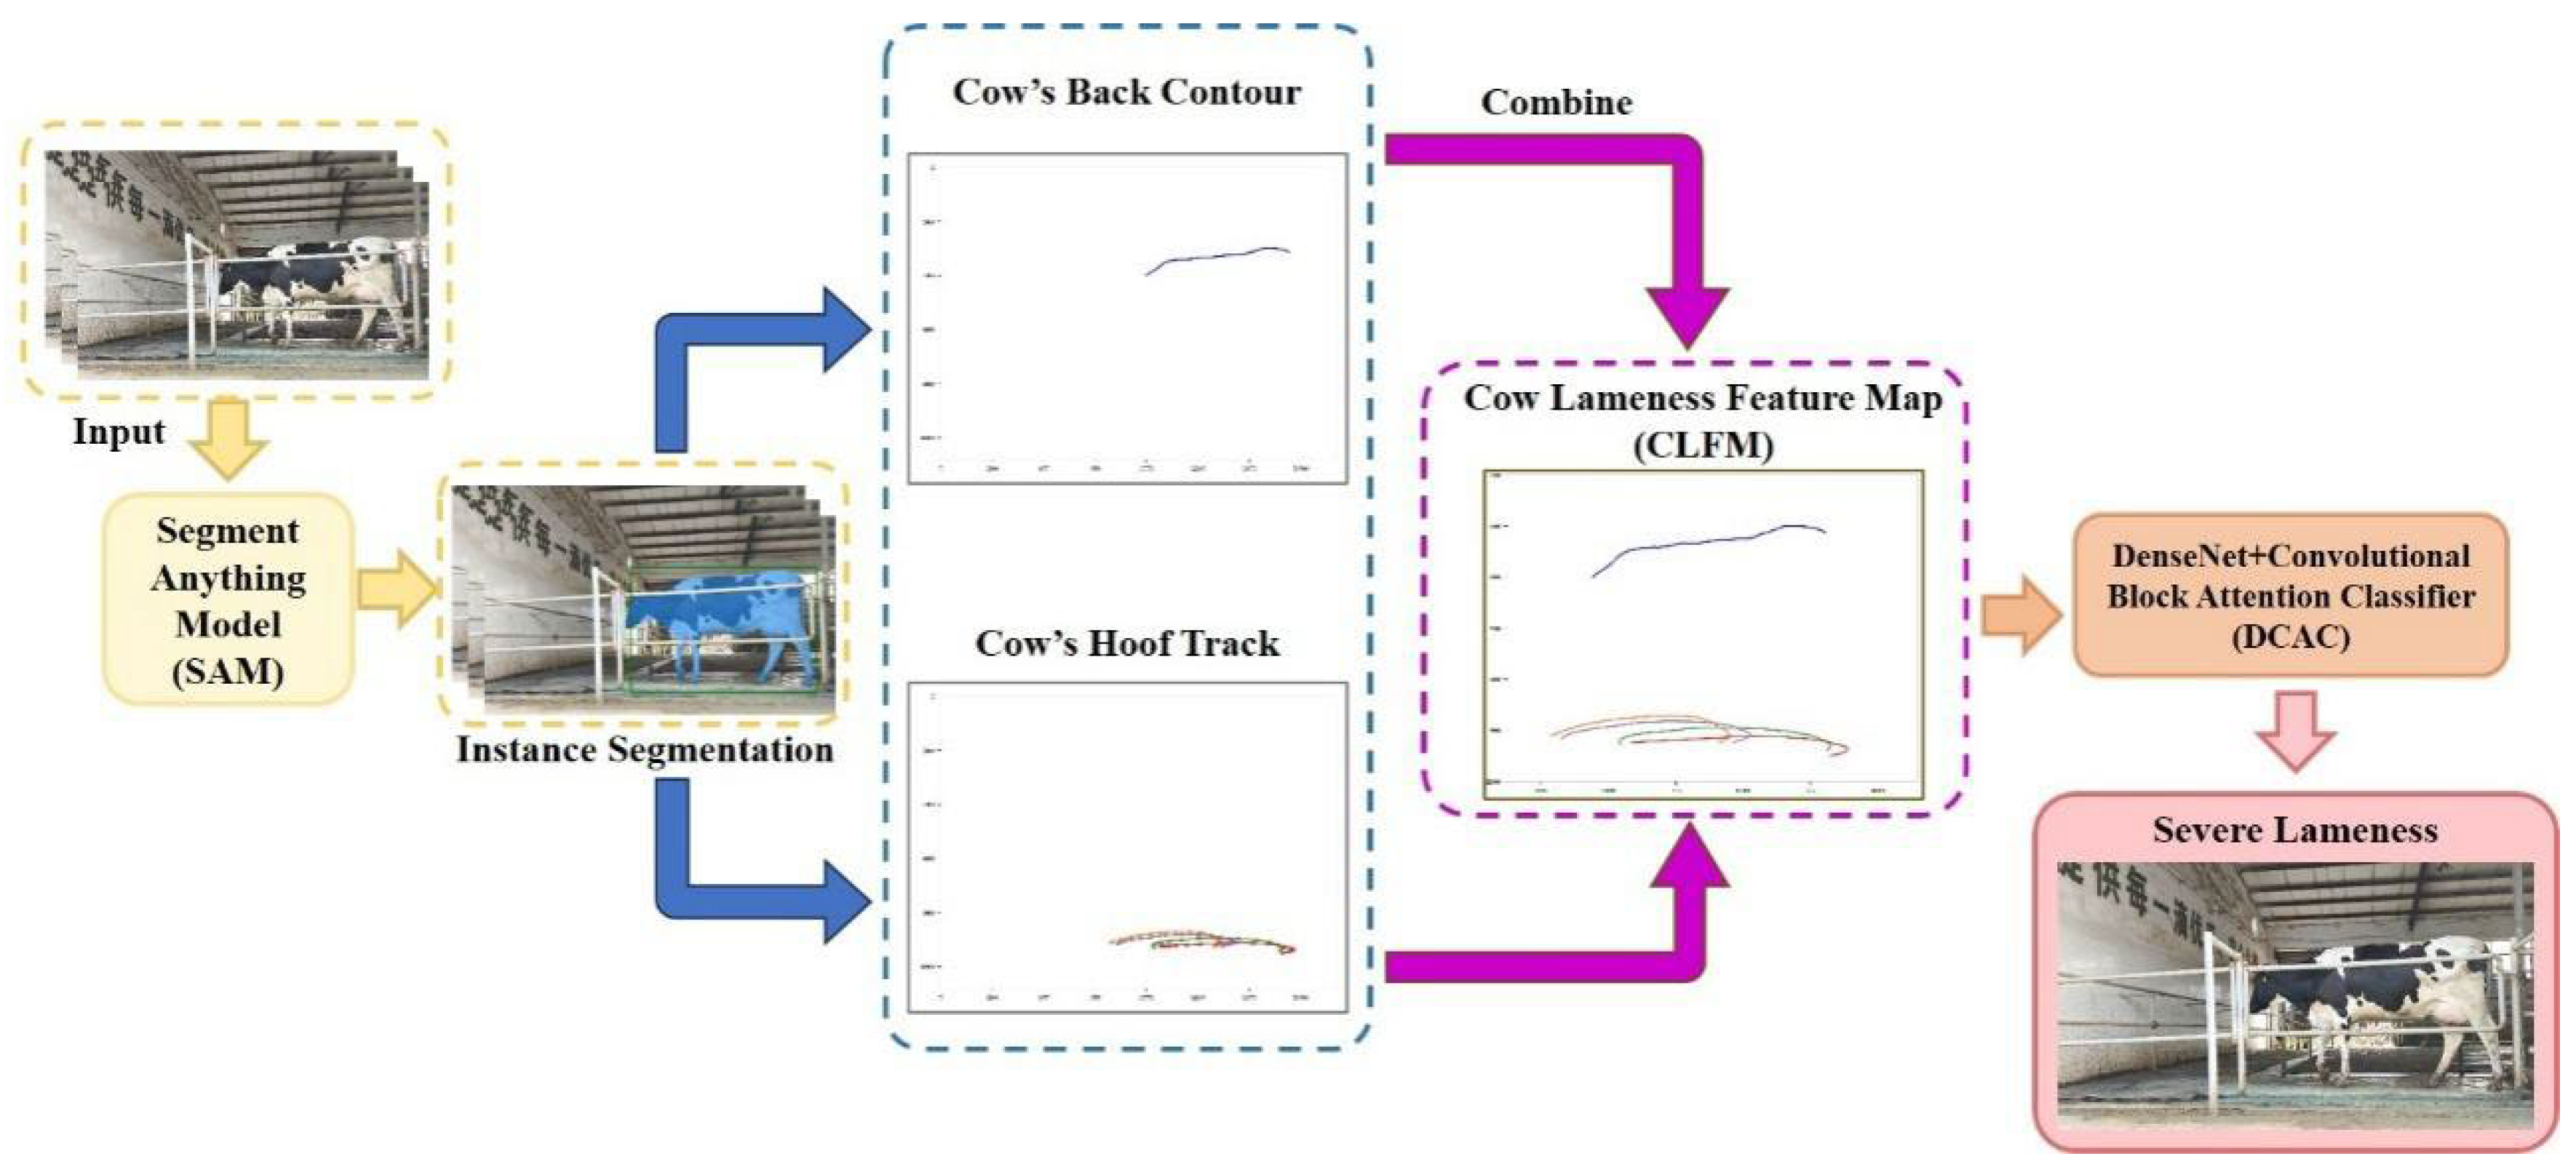
Figure 3.
Segment Anything Model (SAM) architecture. Using bounding boxes to prompt for segmented dairy cows.
Figure 3.
Segment Anything Model (SAM) architecture. Using bounding boxes to prompt for segmented dairy cows.
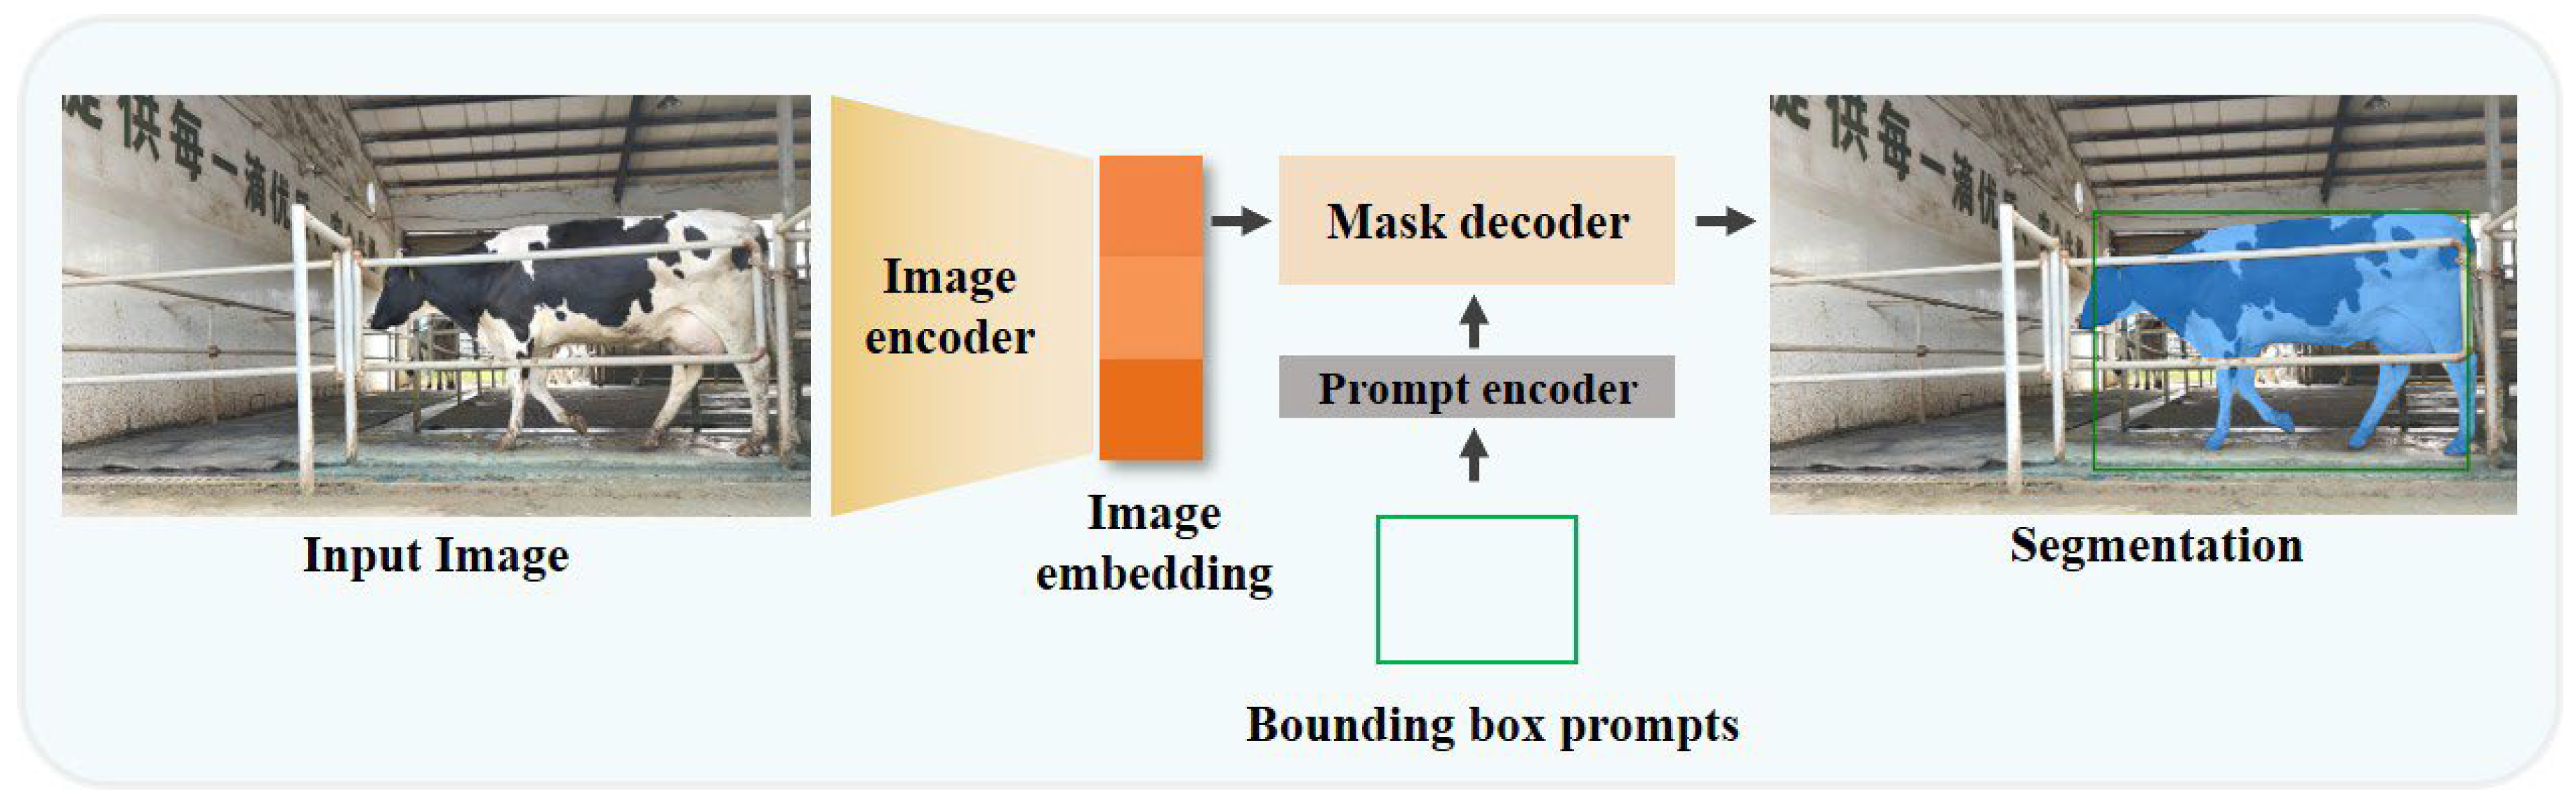
Table 1.
Description of a 3-point lameness score for dairy cows.
| Score | Description |
|---|---|
| 1 | The cow walks with a level-back posture. The gait is normal. No signs of head bob when the cow is walking. |
| 2 | In most cases, the back is arched when the cow is walking. The gait might be slightly uneven and the cow may walk with short strides. In most cases, there are no signs of head bob when walking. |
| 3 | The back is visibly arched when the cow is walking. The cow is obviously lame on 1 or more legs. The cow is unable, unwilling, or very reluctant to bear weight on the affected leg. In most cases, head bob will be evident when walking. |
Table 2.
Results of detection of healthy and lameness dairy cows.
| Classification model | Accuracy (%) | Sensitivity (%) | Specificity (%) |
|---|---|---|---|
| DenseNet121 | 95.08 | 95.71 | 94.76 |
| DCAC | 99.05 | 100 | 98.57 |
Table 3.
Results of different lameness classification models on lameness feature maps.
| Classification model | Accuracy (%) | Sensitivity (%) | Specificity (%) |
|---|---|---|---|
| DenseNet121 | 88.99 | 83.49 | 91.75 |
| DCAC | 92.80 | 89.21 | 94.60 |
Table 5.
Comparison with existing lameness detection methods.
| Algorithm | Accuracy (%) | Sensitivity (%) | Specificity (%) |
|---|---|---|---|
| YOLOv3 + LSTM [23] | 97.00 | - | - |
| Siam-AM + SVM [40] | 94.73 | 96.21 | 95.14 |
| C3D [42] | 75.68 | 81.08 | 70.27 |
| R3D [43] | 74.32 | 70.27 | 78.38 |
| R2Plus1D [43] | 67.57 | 75.68 | 59.46 |
| SOLOv2+SVM [41] | 98.65 | 100 | 97.30 |
| Our | 99.05 | 100 | 98.57 |
Disclaimer/Publisher’s Note: The statements, opinions and data contained in all publications are solely those of the individual author(s) and contributor(s) and not of MDPI and/or the editor(s). MDPI and/or the editor(s) disclaim responsibility for any injury to people or property resulting from any ideas, methods, instructions or products referred to in the content. |
© 2025 by the authors. Licensee MDPI, Basel, Switzerland. This article is an open access article distributed under the terms and conditions of the Creative Commons Attribution (CC BY) license (http://creativecommons.org/licenses/by/4.0/).
Copyright: This open access article is published under a Creative Commons CC BY 4.0 license, which permit the free download, distribution, and reuse, provided that the author and preprint are cited in any reuse.


