
Submitted:
27 May 2025
Posted:
28 May 2025
You are already at the latest version
Abstract
Accurate body condition score (BCS) monitoring in dairy cows is essential for optimizing health, productivity, and welfare. Traditional manual scoring methods are labor-intensive and subjective, driving interest in automated imaging-based systems. This study evaluated the effectiveness of 2D imaging and deep learning for BCS classification using three camera perspectives—front, back, and top-down—to identify the most reliable viewpoint. The research involved 56 Norwegian Red milking cows at the Center for Livestock Experiments (SHF) of Norges Miljo-og Biovitenskaplige Universitet (NMBU) in Norway. Images were classified into BCS categories of 2.5, 3.0, and 3.5 using a YOLOv8 model. The back view achieved the highest classification precision (mAP@0.5 = 0.439), confirming that key morphological features for BCS assessment are best captured from this angle. Challenges included misclassification due to overlapping features, especially in class 2.5 and background data. The study recommends improvements in algorithmic feature extraction, dataset expansion, and multi-view integration to enhance accuracy. Integration with precision farming tools enables continuous monitoring and early detection of health issues. This research highlights the potential of 2D imaging as a cost-effective alternative to 3D systems, particularly for small and medium-sized farms, supporting more effective herd management and improved animal welfare.
Keywords:
body condition score
; automated 2D imaging
; dairy cows
; 3D systems
1. Introduction
Body condition scoring (BCS) is a crucial tool in dairy cow management, providing valuable insights into an animal’s nutritional status, health, and productivity. BCS is widely recognized as an essential welfare indicator, influencing reproductive efficiency, milk yield, and disease susceptibility [16]. Traditional BCS assessments rely on manual scoring systems, such as the Welfare Quality® protocol, which are subjective and prone to inconsistency among evaluators [1,3,9]. These limitations have driven the development of automated imaging technologies, which enable more objective, reliable, and continuous assessments of dairy cow body condition.
Advanced BCS monitoring systems utilizing 3D imaging have demonstrated high accuracy and precision by capturing depth-related body shape features in dairy cows [4,6]. These systems provide detailed morphological data, allowing for consistent evaluation of body reserves and early detection of metabolic imbalances. However, the widespread adoption of 3D imaging is limited due to high costs, complex installations, and maintenance requirements, making them less accessible to small and medium-sized farms [20]. As a result, alternative 2D imaging solutions have emerged, offering a more cost-effective and scalable approach to BCS automation [6,20].
Recent advancements in machine learning and computer vision have significantly improved the accuracy of 2D imaging-based BCS systems [27]. While these systems do not capture depth information like 3D cameras, they leverage high-resolution images and deep learning algorithms to identify key morphological patterns related to body condition. 2D cameras are easier to integrate into existing farm infrastructure, require lower investment costs, and can provide real-time, 24/7 monitoring. Moreover, they can serve multiple purposes, including behavioral analysis and early health disorder detection, contributing to enhanced farm management efficiency [13,18].
A major challenge for smaller dairy farms is the limited access to expensive robotic milking systems, which often come equipped with integrated 3D imaging solutions [18]. For farms that do not use automated milking robots, standalone 2D imaging systems could represent a viable alternative [20]. These systems can be installed in key locations within barns such as feeding stations, weighing platforms, or milking parlors allowing farmers to continuously track BCS without manual assessment [18]. The potential for real-time decision-making based on automated BCS evaluations could help optimize nutritional strategies, reproductive planning, and health interventions, making dairy farming more efficient and sustainable [15].
This study aims to evaluate the potential of 2D imaging for BCS classification by identifying the most effective imaging angles using automated image analysis. The hypothesis is that 2D imaging, combined with deep learning techniques, can provide an accurate, cost-effective, and scalable alternative to manual BCS assessment and expensive 3D systems. This research focuses on analyzing three camera perspectives (front, rear, and top-down) to determine their effectiveness in classifying BCS. Additionally, it explores how image preprocessing, feature extraction, and dataset augmentation techniques impact classification performance.
Unlike previous studies, which primarily focused on single 2D imaging perspectives, this research provides a comprehensive evaluation of multiple viewpoints to determine the most effective approach for automated BCS assessment. By optimizing 2D imaging placement and processing strategies, this study aims to bridge the gap between research and practical application by identifying optimal imaging strategies that can be seamlessly integrated into dairy farm management systems. Furthermore, this study lays the groundwork for integrating automated BCS monitoring with real-time decision-support tools, ensuring that small and medium-sized farms can benefit from advancements in precision livestock farming without the need for costly infrastructure investments.
The novelty of this study stems from the absence of prior literature assessing the BCS of dairy cattle from multiple 2D imaging perspectives—front, back, and top-down. Through combining confidence threshold tuning, strong augmentation, and YOLOv8 inference across all views, the study demonstrates that the rear view allows for more reliable feature extraction and identification. Additionally, the study demonstrates the adaptability of 2D imaging as an inexpensive and scalable method for small and medium dairy farms, emphasizing radial and practical implementation rather than performance degradation. This work increases the precision livestock farming technology’s availability to regions and farms with tight financial resources.
2. Materials and Methods
2.1. Data Collection
2.1.1. Study Location and Duration
The study was conducted at the Animal Research Centre of the Norwegian University of Life Sciences (NMBU) in Ås, Norway, over a two-week period from November 5 to November 19, 2024. The research took place at a dairy cattle farm with two separate departments, both equipped with an Automated Milking System (AMS). The study focused on one department housing 56 Norwegian Red breed milking cows.
2.1.2. Subjects and Data Acquisition
- Cows’ Access to AMS: Cows voluntarily accessed the AMS between one and four times per day, where various physiological and behavioral parameters were recorded.
- BCS Reference Standard: A 3D camera system installed above the AMS served as the reference standard for BCS evaluation.
- Additional Data Recorded: The AMS automatically recorded cow identification (ID), milking session timestamps, and body weights, all compiled into a structured Excel database for further analysis.
2.2. Digital Tools and Camera Setup
2.2.1. Camera Specifications
- 2D Cameras: Three Foscam G4EP PoE 4MP cameras, each equipped with 128 GB SD cards for motion-triggered image capture.
- 3D Camera: Installed above the AMS, capturing depth-related morphological features of cows during milking.
- Data Storage and Processing: Cameras were connected to an Ethernet network, and recording schedules were configured via the Foscam mobile application.
2.2.2. Camera Placement
To capture comprehensive BCS data, both 3D and 2D cameras were strategically positioned within the AMS and the weighing station after milking:
-
3D Camera Placement:
- ○
- Installed directly above the AMS milking unit, ensuring a top-down view of cows for depth-based morphological analysis.
- ○
- This 3D-based BCS evaluation served as the gold standard for validation.
-
2D Camera Placement:
- ○
- Front View Camera – Positioned at the entrance of the weighing station, capturing head and shoulder regions.
- ○
- Rear View Camera – Mounted behind the weighing scale, providing a backward perspective of the cow’s hindquarters.
- ○
- Top-Down Camera – Installed above the weighing platform, capturing a bird’s-eye view of the cow’s topline and body structure.
All captured frames from 2D cameras were systematically linked to cow ID and BCS data, ensuring a high-quality dataset for training and validating the YOLOv8-based BCS classification model.
2.3. Image Data Processing and Annotation
Image Collection and Preprocessing:
- 1.
-
Data Collection:
- ○
- Video footage and snapshots were collected daily from 08:00 to 20:00, with images captured whenever movement was detected.
- 2.
-
Frame Extraction:
- ○
- At the end of each milking session, a screenshot was taken of each cow standing on the weighing scale, ensuring a direct link to BCS and ID records.
- 3.
-
Image Sorting:
- ○
- Screenshots were categorized based on cow ID and BCS score.
- 4.
-
BCS Score Adjustment:
- ○
- Scores were rounded to the nearest half or whole grade (e.g., BCS 1.7 → 1.5; BCS 2.8 → 3.0).
- Dataset Annotation and Preparation:
- 1.
-
Manual Annotation:
- ○
- The dataset was uploaded to Roboflow, utilizing their SAM annotation tool. In some cases, the manual polygon tool was used to assign object detection labels to front, rear, and top views.
- 2.
-
Dataset Splitting:
- ○
-
After annotation, the dataset was divided into three sets:
- ■
- 70% Training Data – Used to train the YOLOv8 model.
- ■
- 20% Validation Data – Used for hyperparameter tuning and overfitting prevention.
- ■
- 10% Testing Data – Used for final model evaluation.
2.4. Object Detection Model
2.4.1. Model Architecture and Justification
For automated BCS classification, we employed YOLOv8, a state-of-the-art object detection model developed by Ultralytics (Jocher et al., 2023). YOLOv8 consists of three primary components:
- Backbone: Extracts hierarchical image features using convolutional layers, C2f blocks, and spatial pyramid pooling.
- Neck: Fuses multi-scale feature maps, optimizing object detection across different perspectives (rear, front, and top).
- Head: Generates final predictions, including bounding box coordinates, class labels, and confidence scores.
YOLOv8 was selected for its high detection accuracy, real-time inference capabilities, and efficient feature extraction, making it well-suited for multi-view BCS assessment in dairy cows.
2.4.2. Data Preprocessing and Augmentation
To improve model generalization, the following image augmentation techniques were applied:
- Auto-orientation (Standardized image alignment).
- Resize (All images resized to 640×640 pixels).
- Contrast & Brightness Normalization (To enhance feature visibility).
-
Data Augmentation:
- ○
- Cropping: 0–15% random zoom.
- ○
- Hue & Saturation Adjustments: Random variations (-6 to +6).
- ○
- Brightness: Randomly adjusted (-15% to +15%).
- ○
- Blur & Noise: Minor Gaussian blur & noise applied.
To address class imbalances, underrepresented BCS categories (BCS 1.5 and 2.0) were removed, leaving three final classes:
- BCS 2.5 → Class 25
- BCS 3.0 → Class 30
- BCS 3.5 → Class 35
2.4.3. Model Training and Optimization
Training was conducted on Google Colab, utilizing an NVIDIA Tesla T4 GPU (16GB RAM).
- Pretrained Weights: Transfer learning was applied using MSCOCO weights.
- Optimizer: Adam optimizer with learning rate = 0.001.
-
Training Setup:
- ○
- Epochs: 50
- ○
- Batch size: 16
- ○
-
Loss Functions:
- ■
- Bounding Box (BBox) loss (Zheng et al., 2019).
- ■
- Classification loss.
- ■
- Distribution Focal Loss (DFL) (Li et al., 2023).
2.4.4. Model Evaluation
The trained model’s performance was evaluated using:
- Mean Average Precision (mAP@0.5 & mAP@0.5-0.95).
- Precision-Recall Curves.
- Confusion Matrices (Misclassification analysis).
- Confidence Threshold Optimization (for front, rear, and top views).
2.5. Data Analysis
The trained model’s performance was evaluated using three key assessment methods. First, Precision-Recall Curves were used to assess classification accuracy across BCS categories (2.5, 3.0, 3.5), providing insight into the trade-off between precision, which measures the accuracy of positive predictions, and recall, which indicates the detection rate. These curves were computed separately for each camera view, including the front, top, and back perspectives.
Next, Confusion Matrices were analyzed to evaluate misclassification rates and error distributions, allowing for the identification of systematic misclassification patterns. Overlapping feature representations between BCS classes were examined to understand where the model struggled to differentiate between categories.
Finally, Confidence Threshold Optimization was applied to determine the optimal probability cutoffs for classification performance. Thresholds were optimized separately for the front, top, and back views to improve detection reliability and ensure more precise predictions.
Model training was conducted on Google Colab using a GPU-accelerated environment with an NVIDIA Tesla T4 GPU and 16 GB RAM. Once trained, the model was tested on a local machine equipped with an Intel Core i7-12700H processor and 32 GB RAM, where CPU-based inference validation was performed to assess computational performance in a real-world application (Figure 5).
The overview of the Research Design; 2a) 2D camera placement around the AMS weighing station; 2b) Example of cow ID and BCS tracking in an Excel spreadsheet; 2c) Object detection annotation process in Roboflow as shown in Figure 4; 2d) Sample annotated images (front, top, and back views); 2e) Dataset split and augmentation process; 2f) YOLOv8 model training in Google Colab in Figure 5; 2g) Precision-Recall Curve comparison for front, rear, and top views; 2h) Figure 8: Confusion matrix showing misclassification patterns. Figure 6.
3. Results
3.1. Model Performance Based on Precision-Recall Curves
The Precision-Recall (PR) Curve was used to evaluate the classification performance of the model across three different camera views, including Front, Top, and Back.
The class-wise Average Precision (AP) was calculated for three body condition score (BCS) categories (2.5, 3.0, and 3.5), along with the mean Average Precision (mAP@0.5) across all classes.
For the Front View, Class 2.5 achieved an AP of 0.519, Class 3.0 reached an AP of 0.518, and Class 3.5 had an AP of 0.260. This resulted in an overall mAP@0.5 of 0.432.
For the Top View, Class 2.5 obtained an AP of 0.402, Class 3.0 an AP of 0.490, and Class 3.5 an AP of 0.372. The overall mAP@0.5 for this view was 0.421.
For the Back View, Class 2.5 recorded an AP of 0.428, Class 3.0 an AP of 0.483, and Class 3.5 an AP of 0.439. This view led to the highest overall mAP@0.5 of 0.439, as shown in Figure 7.
3.2. Precision-Confidence Analysis
The Precision-Confidence Curves were generated to assess model confidence at different probability thresholds for classification performance.
For the Front View, the model achieved 100% precision at a confidence threshold of 0.415. Class 2.5 showed steady precision growth, while Classes 3.0 and 3.5 had fluctuations in confidence scores (Figure 7).
In the Top View, the optimal confidence threshold was 0.276, where precision reached 100%. Class 2.5 and Class 3.0 showed moderate improvement in precision, whereas Class 3.5 exhibited greater variability.
In the Back View, the model reached 100% precision at a confidence threshold of 0.512. Class 2.5 and Class 3.0 demonstrated consistent improvements, but Class 3.5 showed significant fluctuations in detection accuracy (Figure 7).
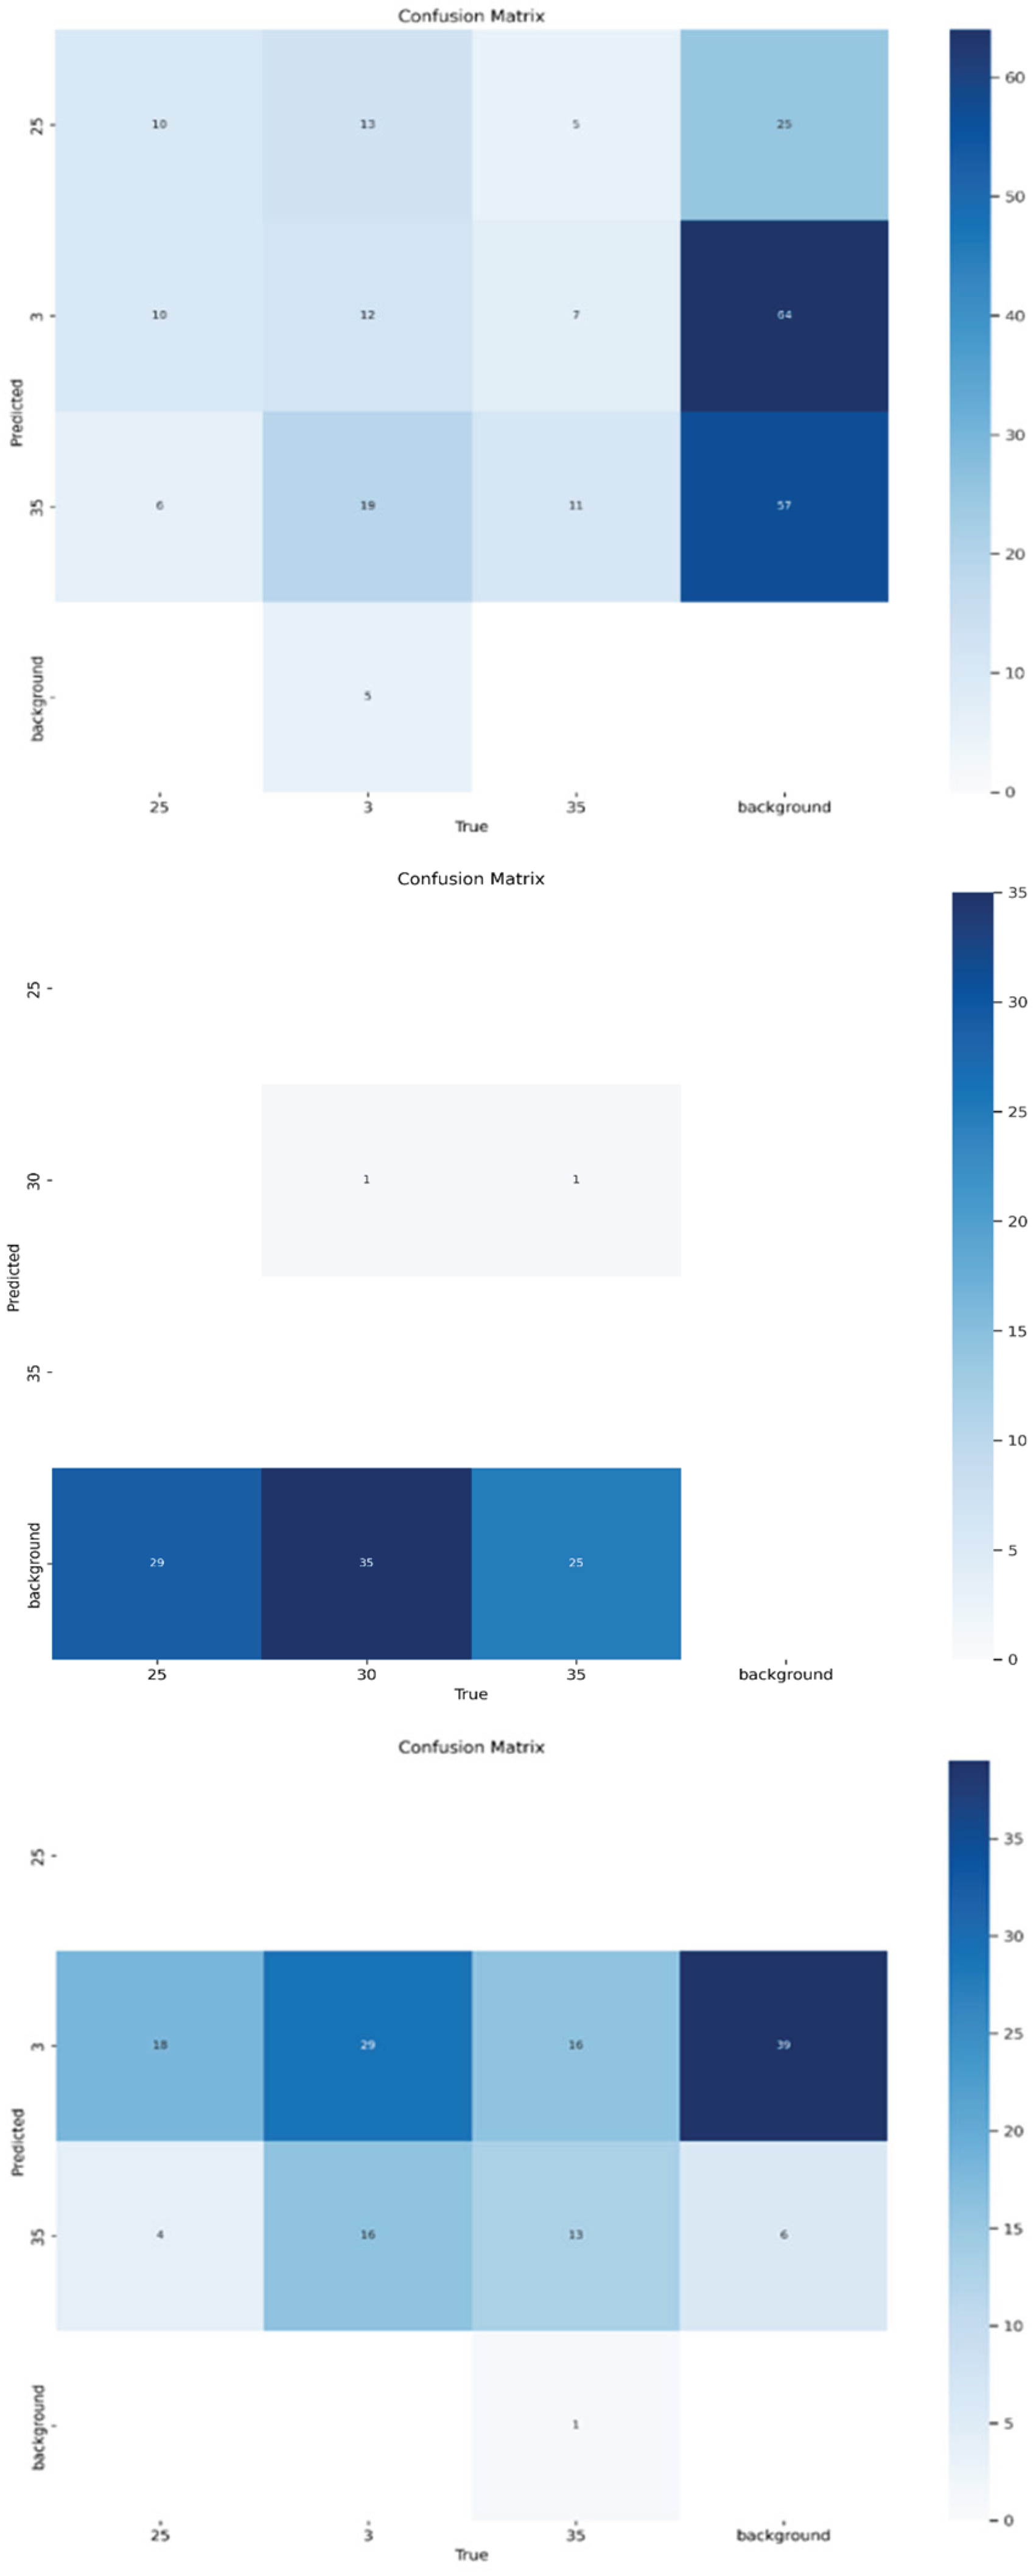
3.3. Classification Performance Based on Confusion Matrices
In Figure 8, the confusion matrices highlight classification accuracy and misclassification trends across different BCS categories and camera views.
For the Front View, Class 3.0 was correctly classified in 64 instances, while Class 3.5 was correctly classified in 57 instances. However, Class 2.5 had only 10 correct predictions, with 25 instances misclassified as background. Background data was frequently misclassified as Class 3.0, with 64 occurrences, indicating notable overlap in feature representation (Figure 7).
For the Top View, severe classification bias was observed, with nearly all predictions assigned to the background class. Class 2.5 was misclassified as background in 29 instances, Class 3.0 in 35 instances, and Class 3.5 in 25 instances. Only one correct prediction was recorded for Class 3.0, indicating poor classification performance in this view (Figure 7). For the Back View, Class 3.0 achieved 29 correct classifications. However, Class 2.5 was frequently misclassified as Class 3.0 in 18 instances, and background data was often misclassified as Class 3.0 in 39 instances. Class 3.5 had only 13 correct predictions, showing substantial misclassification across categories.
4. Discussion
We evaluated a 2D imaging-based BCS system by assessing classification performance across three different camera perspectives: front, top, and back. Our findings demonstrated that the back view provided the highest classification accuracy, followed by the front and top views. These results confirm that key morphological features for body condition assessment, such as fat deposition along the top line and tailhead, are most effectively captured from the back perspective [4,6].
We observed that classification errors were lowest when using the back view, reinforcing that spine curvature and pelvic bone prominence are critical indicators of body reserves. While manual BCS assessment remains the industry standard, recent advances in computer vision-based precision livestock farming suggest that automated imaging solutions can significantly improve consistency and reduce human bias [23].
Our results show that classification accuracy using 2D imaging remains moderate compared to high-precision 3D imaging systems. Other studies have shown that 3D imaging-based BCS assessments achieve significantly higher precision due to their ability to capture depth and structural variations more effectively [20,27]. The absence of depth information in 2D images limits the model’s ability to distinguish subtle differences in muscle tone and fat deposits, a known challenge in traditional photographic assessments of livestock [15]. These differences highlight the trade-offs between affordability and accuracy, particularly for farms without access to advanced 3D solutions.
We determined that confidence threshold optimization was necessary to achieve reliable classification. The back view required the highest confidence level, suggesting that the model was most reliable in detecting BCS features from this perspective. The top view performed the worst, with severe misclassification issues, likely due to limited morphological contrast in distinguishing fat deposits from background features. This aligns with previous research showing that overhead imaging struggles to differentiate body condition due to the lack of visible fat deposition markers [4,7]. Our data also suggest that leaner cows (Class 2.5) exhibited the highest misclassification rates, frequently being confused with the background class, reinforcing the challenge of detecting low BCS scores using surface-level imaging alone [5,16].
We recognize that a crucial next step is the development of a cow identification system integrated with a centralized database for real-time monitoring. Unique identification methods, such as ear tag recognition or RFID-based tracking, can be implemented to link individual BCS measurements to specific cows. By continuously collecting and storing BCS data, the system will enable farmers to monitor trends over time, allowing for early detection of deviations in body condition that may indicate potential health concerns [13,15].
Beyond early detection, maintaining optimal body condition is closely linked to key health and productivity outcomes. Poor body condition is associated with increased susceptibility to metabolic disorders, higher veterinary costs, and reduced reproductive efficiency [18]. Cows with inadequate body reserves are more likely to experience fertility issues, including delayed estrus and lower conception rates, directly impacting calving intervals and overall herd productivity [23,24]. Additionally, suboptimal BCS has been linked to an increased risk of lameness and mastitis, further elevating treatment costs and compromising milk quality (Islam et al., 2021; Tullo et al., 2019). In severe cases, significant deviations in body condition can result in culling decisions, leading to economic losses due to the premature removal of cows from the herd [27].
We propose a practical approach for integrating automated BCS monitoring into existing dairy farm workflows, especially for small and medium-sized farms without automated milking systems. The system should be designed for deployment in standing areas before or after milking, where cows are naturally stationary. Cameras can be installed near the weighing station or in controlled entry/exit zones to ensure accurate imaging. To enhance identification accuracy, ear tag scanning or barcode reading can be implemented when cows enter or exit these designated areas. By linking the captured images with cow ID numbers, all data can be compiled into a centralized database for long-term herd monitoring.
We suggest that this system should prioritize ease of use, ensuring that farmers receive only relevant alerts and insights without being overwhelmed by excessive data. An AI-based decision-support system can be integrated to flag significant deviations in BCS trends, prompting farmers to take necessary action. The software can be designed to store data locally on farm computers or cloud-based servers, depending on farm infrastructure and internet availability. For farms with limited internet access, an offline version that syncs periodically could be developed.
We recognize that such a system could provide additional insights beyond BCS monitoring, including tracking early signs of lameness, metabolic disorders, or reproductive issues. By integrating additional health indicators, the system could serve as a comprehensive herd management tool, allowing for predictive modeling of health outcomes. This would be particularly beneficial for Norwegian dairy farms, where economic sustainability is essential due to higher production costs and regulatory constraints. In other countries facing similar economic and environmental challenges, such an affordable monitoring system could provide significant long-term benefits.
The ability to track BCS dynamically allows for proactive herd management, minimizing health-related expenses and ensuring higher milk production efficiency. Poor body condition not only affects milk yield but also influences milk composition, with under-conditioned cows often producing lower butterfat and protein levels [6]. Furthermore, cows requiring frequent veterinary intervention or extended recovery times may face extended withdrawal periods where their milk cannot be sold, further reducing farm profitability [15]. Economic assessments indicate that prolonged health-related milk withdrawal periods can lead to financial losses exceeding €150 per cow annually, further justifying the need for proactive monitoring systems [16].
Investment in a real-time BCS monitoring system must be balanced against its economic returns. While the initial cost of implementing automated BCS monitoring and cow identification technology may be substantial, the long-term benefits in improved herd health, reduced veterinary costs, and optimized productivity can justify the expense [23]. Small and medium-sized farms may benefit from scalable solutions that integrate low-cost imaging technology with practical decision-support tools. By reducing reliance on manual scoring and enabling early intervention, such systems offer a pathway toward more sustainable and economically viable dairy farming.
We anticipate that an advanced BCS monitoring system will provide deeper insights into herd management beyond individual scoring. By analyzing trends in BCS alongside other health indicators such as lameness detection and milk yield patterns, farmers will be able to make data-driven decisions that enhance productivity and welfare. Future development will focus on integrating these additional health markers into a unified system, creating a static model that can be easily interpreted and utilized by small-scale farmers without requiring extensive technical expertise.
We will expand the dataset, refine feature extraction techniques, and test real-time deployment on commercial farms as part of our next research phase. Integrating multi-view 2D imaging with predictive deep learning algorithms will be a key focus, ensuring that low-cost precision livestock solutions can be widely adopted without compromising accuracy. By advancing affordable, scalable AI solutions, our research contributes to the broader adoption of data-driven precision livestock farming, providing practical, technology-driven strategies for improved dairy farm management.
5. Conclusions
This study introduces an innovative approach to automated BCS classification by integrating 2D imaging and deep learning. The strategic evaluation of multiple camera perspectives sets this work apart from prior research, which often focused on single views or costly 3D systems. The findings demonstrate that the rear view is the most accurate for capturing key BCS features, confirming the feasibility of this cost-effective method for practical farm implementation.
By addressing the limitations of both manual scoring and expensive automated systems, this study paves the way for broader adoption of precision livestock monitoring, particularly in small and medium-sized dairy farms. Future research should focus on optimizing multi-view integration and enhancing model robustness to further increase classification accuracy. Future research should focus on expanding datasets, optimizing model architectures, and integrating complementary sensor technologies to further enhance the reliability and practicality of 2D imaging-based BCS assessment in diverse farm environments. Additionally, efforts should be directed toward making these systems more adaptable to small and medium-sized farms, ensuring that automated BCS monitoring can be easily implemented regardless of farm infrastructure. By integrating these advancements, automated BCS systems can contribute to improved herd health monitoring, enhanced productivity, and more sustainable dairy farming practices.
Author Contributions
Teun Kostermans and Reagan Lewis contributed to the conceptualization of the study; Reagan Lewis developed the methodology; Teun Kostermans was responsible for the software implementation and conducted the formal analysis; validation was carried out by Talha Laique and Marko Ocepek; investigation was undertaken by Marko Ocepek; resources were provided by Reagan Lewis and Teun Kostermans; data curation was performed by Jan Wilhelm Brovold, Reagan Lewis, and Teun Kostermans; the original draft was prepared by Reagan Lewis; review and editing were conducted by Marko Ocepek; visualization was handled by Marko Ocepek; and supervision was provided by Marko Ocepek. All authors have read and approved the final version of the manuscript for publication.
Funding
This research received no external funding.
Data Availability Statement
The data generated and analyzed during this study will be made available upon reasonable request.
Acknowledgments
The authors express their gratitude to the Center for Livestock Experiments (SHF) at the Norges Miljo-og Biovitenskaplige Universitet (NMBU), Norway, for their invaluable support in providing research facilities essential for the successful execution of this study. We also acknowledge the contributions of research staff and farm personnel who facilitated data collection and ensured the welfare of the animals involved in this study.
Conflicts of Interest
The authors declare no conflicts of interest.
Abbreviations
The following abbreviations are used in this manuscript:
| AI | Artificial Intelligence |
| AMS | Automated Milking System |
| AP | Average Precision |
| LD | Linear dichroism |
| BCS | Body Condition Score |
| Colab | Google Colaboratory |
| RFID | Radio-Frequency Identification |
| SD | Secure Digital (card) |
References
- Albornoz, R.I.; Giri, K.; Hannah, M.C.; Wales, W.J. An Improved Approach to Automated Measurement of Body Condition Score in Dairy Cows Using a Three-Dimensional Camera System. Animals 2021, 12, 72. [Google Scholar] [CrossRef] [PubMed]
- Biscarini, F.; Nicolazzi, E.L.; Stella, A.; Boettcher, P.J.; Gandini, G. Challenges and opportunities in genetic improvement of local livestock breeds. Front. Genet. 2015, 6, 33–33. [Google Scholar] [CrossRef] [PubMed]
- Bewley, J. M. (2008). Automated body condition scoring of dairy cattle: Technical and economic feasibility (Doctoral dissertation, Purdue University).
- Bewley, J. M. , Schutz, M. M., & Torres, A. H. (2008). An evaluation of producer assessment of dairy cow body condition score. Journal of Dairy Science, 91(5), p.1743-1752. [CrossRef]
- Das, S.; Shaji, A.; Nain, D.; Singha, S.; Karunakaran, M.; Baithalu, R.K. Precision technologies for the management of reproduction in dairy cows. Trop. Anim. Heal. Prod. 2023, 55, 1–10. [Google Scholar] [CrossRef] [PubMed]
- Halachmi, I., Klopčič, M., Polak, P., Roberts, D. J., & Bewley, J. M. (). Automatic assessment of dairy cow body condition score using 3D image analysis. Journal of Dairy Science, 2019, 96, 8047–8059. [CrossRef]
- Islam, A.; Lomax, S.; Doughty, A.; Islam, M.R.; Jay, O.; Thomson, P.; Clark, C. Automated Monitoring of Cattle Heat Stress and Its Mitigation. Front. Anim. Sci. 2021, 2. [Google Scholar] [CrossRef]
- Jocher, G. , Chaurasia, A., & Qiu, J. (2023). Ultralytics YOLOv8 (Version 8.0.0) [Software]. https://github.com/ultralytics/ultralytics.
- Krukowski, M. , McKague, K., & Valerio, A. Limitations of manual BCS evaluation in dairy farms: A systematic review. Applied Animal Behaviour Science, 2021; 241, 105378. [Google Scholar] [CrossRef]
- Lemmens, L.; Schodl, K.; Fuerst-Waltl, B.; Schwarzenbacher, H.; Egger-Danner, C.; Linke, K.; Suntinger, M.; Phelan, M.; Mayerhofer, M.; Steininger, F.; et al. The Combined Use of Automated Milking System and Sensor Data to Improve Detection of Mild Lameness in Dairy Cattle. Animals 2023, 13, 1180. [Google Scholar] [CrossRef] [PubMed]
- Li, X. , Lv, C., Wang, W., Li, G., Yang, L., & Yang, J. (2023). Generalized focal loss: Towards efficient representation learning for dense object detection. IEEE Transactions on Pattern Analysis and Machine Intelligence, 45(3), p.3139–3153. [CrossRef]
- Marginean, I. , Papp, Z., and Popescu, C. (2023). Milk Quality and Economic Sustainability in Dairy Farming: A Systematic Review of Performance Indicators. Sustainability, 15(5), p.1204. [CrossRef]
- Mottram, T. , & den Uijl, I. Integrating AI into dairy farming: A future perspective. Animal Science Journal 2022, 13671, 13671. [Google Scholar] [CrossRef]
- Mottram, T. T. F. , & den Uijl, I. (2022). Health and welfare monitoring of dairy cows. In M. I. R. Khan, & M. M. Jamal (Eds.), Digital Agritechnology: Applications and Future Prospects (pp. 113–142). Elsevier. [CrossRef]
- Neethirajan, S. Transforming the Adaptation Physiology of Farm Animals through Sensors. Animals 2020, 10, 1512. [Google Scholar] [CrossRef] [PubMed]
- Roche, J.R.; Friggens, N.C.; Kay, J.K.; Fisher, M.W.; Stafford, K.J.; Berry, D.P. Invited review: Body condition score and its association with dairy cow productivity, health, and welfare. J. Dairy Sci. 2009, 92, 5769–5801. [Google Scholar] [CrossRef] [PubMed]
- Shalloo, L.; Byrne, T.; Leso, L.; Ruelle, E.; Starsmore, K.; Geoghegan, A.; Werner, J.; O’leary, N. A review of precision technologies in pasture-based dairying systems. Ir. J. Agric. Food Res. 2021, 59, 279–291. [Google Scholar] [CrossRef]
- Siachos, N.; Lennox, M.; Anagnostopoulos, A.; Griffiths, B.; Neary, J.; Smith, R.; Oikonomou, G. Development and validation of a fully automated 2-dimensional imaging system generating body condition scores for dairy cows using machine learning. J. Dairy Sci. 2024, 107, 2499–2511. [Google Scholar] [CrossRef] [PubMed]
- Summerfield, G.I.; De Freitas, A.; van Marle-Koster, E.; Myburgh, H.C. Automated Cow Body Condition Scoring Using Multiple 3D Cameras and Convolutional Neural Networks. Sensors 2023, 23, 9051. [Google Scholar] [CrossRef] [PubMed]
- Tullo, E. , Finzi, A., & Guarino, M. (2019). Application of precision livestock farming technologies in dairy farms for monitoring animal welfare state: A review. Journal of Dairy Research, 86(4), p.341–349. [CrossRef]
- Vlaicu, P.A.; Gras, M.A.; Untea, A.E.; Lefter, N.A.; Rotar, M.C. Advancing Livestock Technology: Intelligent Systemization for Enhanced Productivity, Welfare, and Sustainability. Agriengineering 2024, 6, 1479–1496. [Google Scholar] [CrossRef]
- Van Marle-Koster, E. , Myburgh, J.G. (2023). Development of automated imaging systems for assessing body condition in dairy cows: A systematic review. Computers in Agriculture, 56(8), p.1123–1131. [CrossRef]
- Van Nuffel, A.; Zwertvaegher, I.; Van Weyenberg, S.; Pastell, M.; Thorup, V.M.; Bahr, C.; Sonck, B.; Saeys, W. Lameness Detection in Dairy Cows: Part 2. Use of Sensors to Automatically Register Changes in Locomotion or Behavior. Animals 2015, 5, 861–885. [Google Scholar] [CrossRef] [PubMed]
- Wurtz, K.; Camerlink, I.; D’eath, R.B.; Fernández, A.P.; Norton, T.; Steibel, J.; Siegford, J. Recording behaviour of indoor-housed farm animals automatically using machine vision technology: A systematic review. PLOS ONE 2019, 14, e0226669. [Google Scholar] [CrossRef] [PubMed]
- Yaseen, M. What is YOLOv8: An in-depth exploration of the internal features of the next-generation object detector. arXiv, 2024; arXiv:2408.15857. [Google Scholar] [CrossRef]
- Zhang, Y.; Zhang, Q.; Zhang, L.; Li, J.; Li, M.; Liu, Y.; Shi, Y. Progress of Machine Vision Technologies in Intelligent Dairy Farming. Appl. Sci. 2023, 13, 7052. [Google Scholar] [CrossRef]
- Zhao, K.; Zhang, M.; Shen, W.; Liu, X.; Ji, J.; Dai, B.; Zhang, R. Automatic body condition scoring for dairy cows based on efficient net and convex hull features of point clouds. Comput. Electron. Agric. 2022, 205. [Google Scholar] [CrossRef]
- Zheng, Z.; Wang, P.; Liu, W.; Li, J.; Ye, R.; Ren, D. Distance-IoU Loss: Faster and Better Learning for Bounding Box Regression. Proceedings of the AAAI Conference on Artificial Intelligence 2020, 34, 12993–13000. [Google Scholar] [CrossRef]
Figure 1.
Training losses of the back view model.
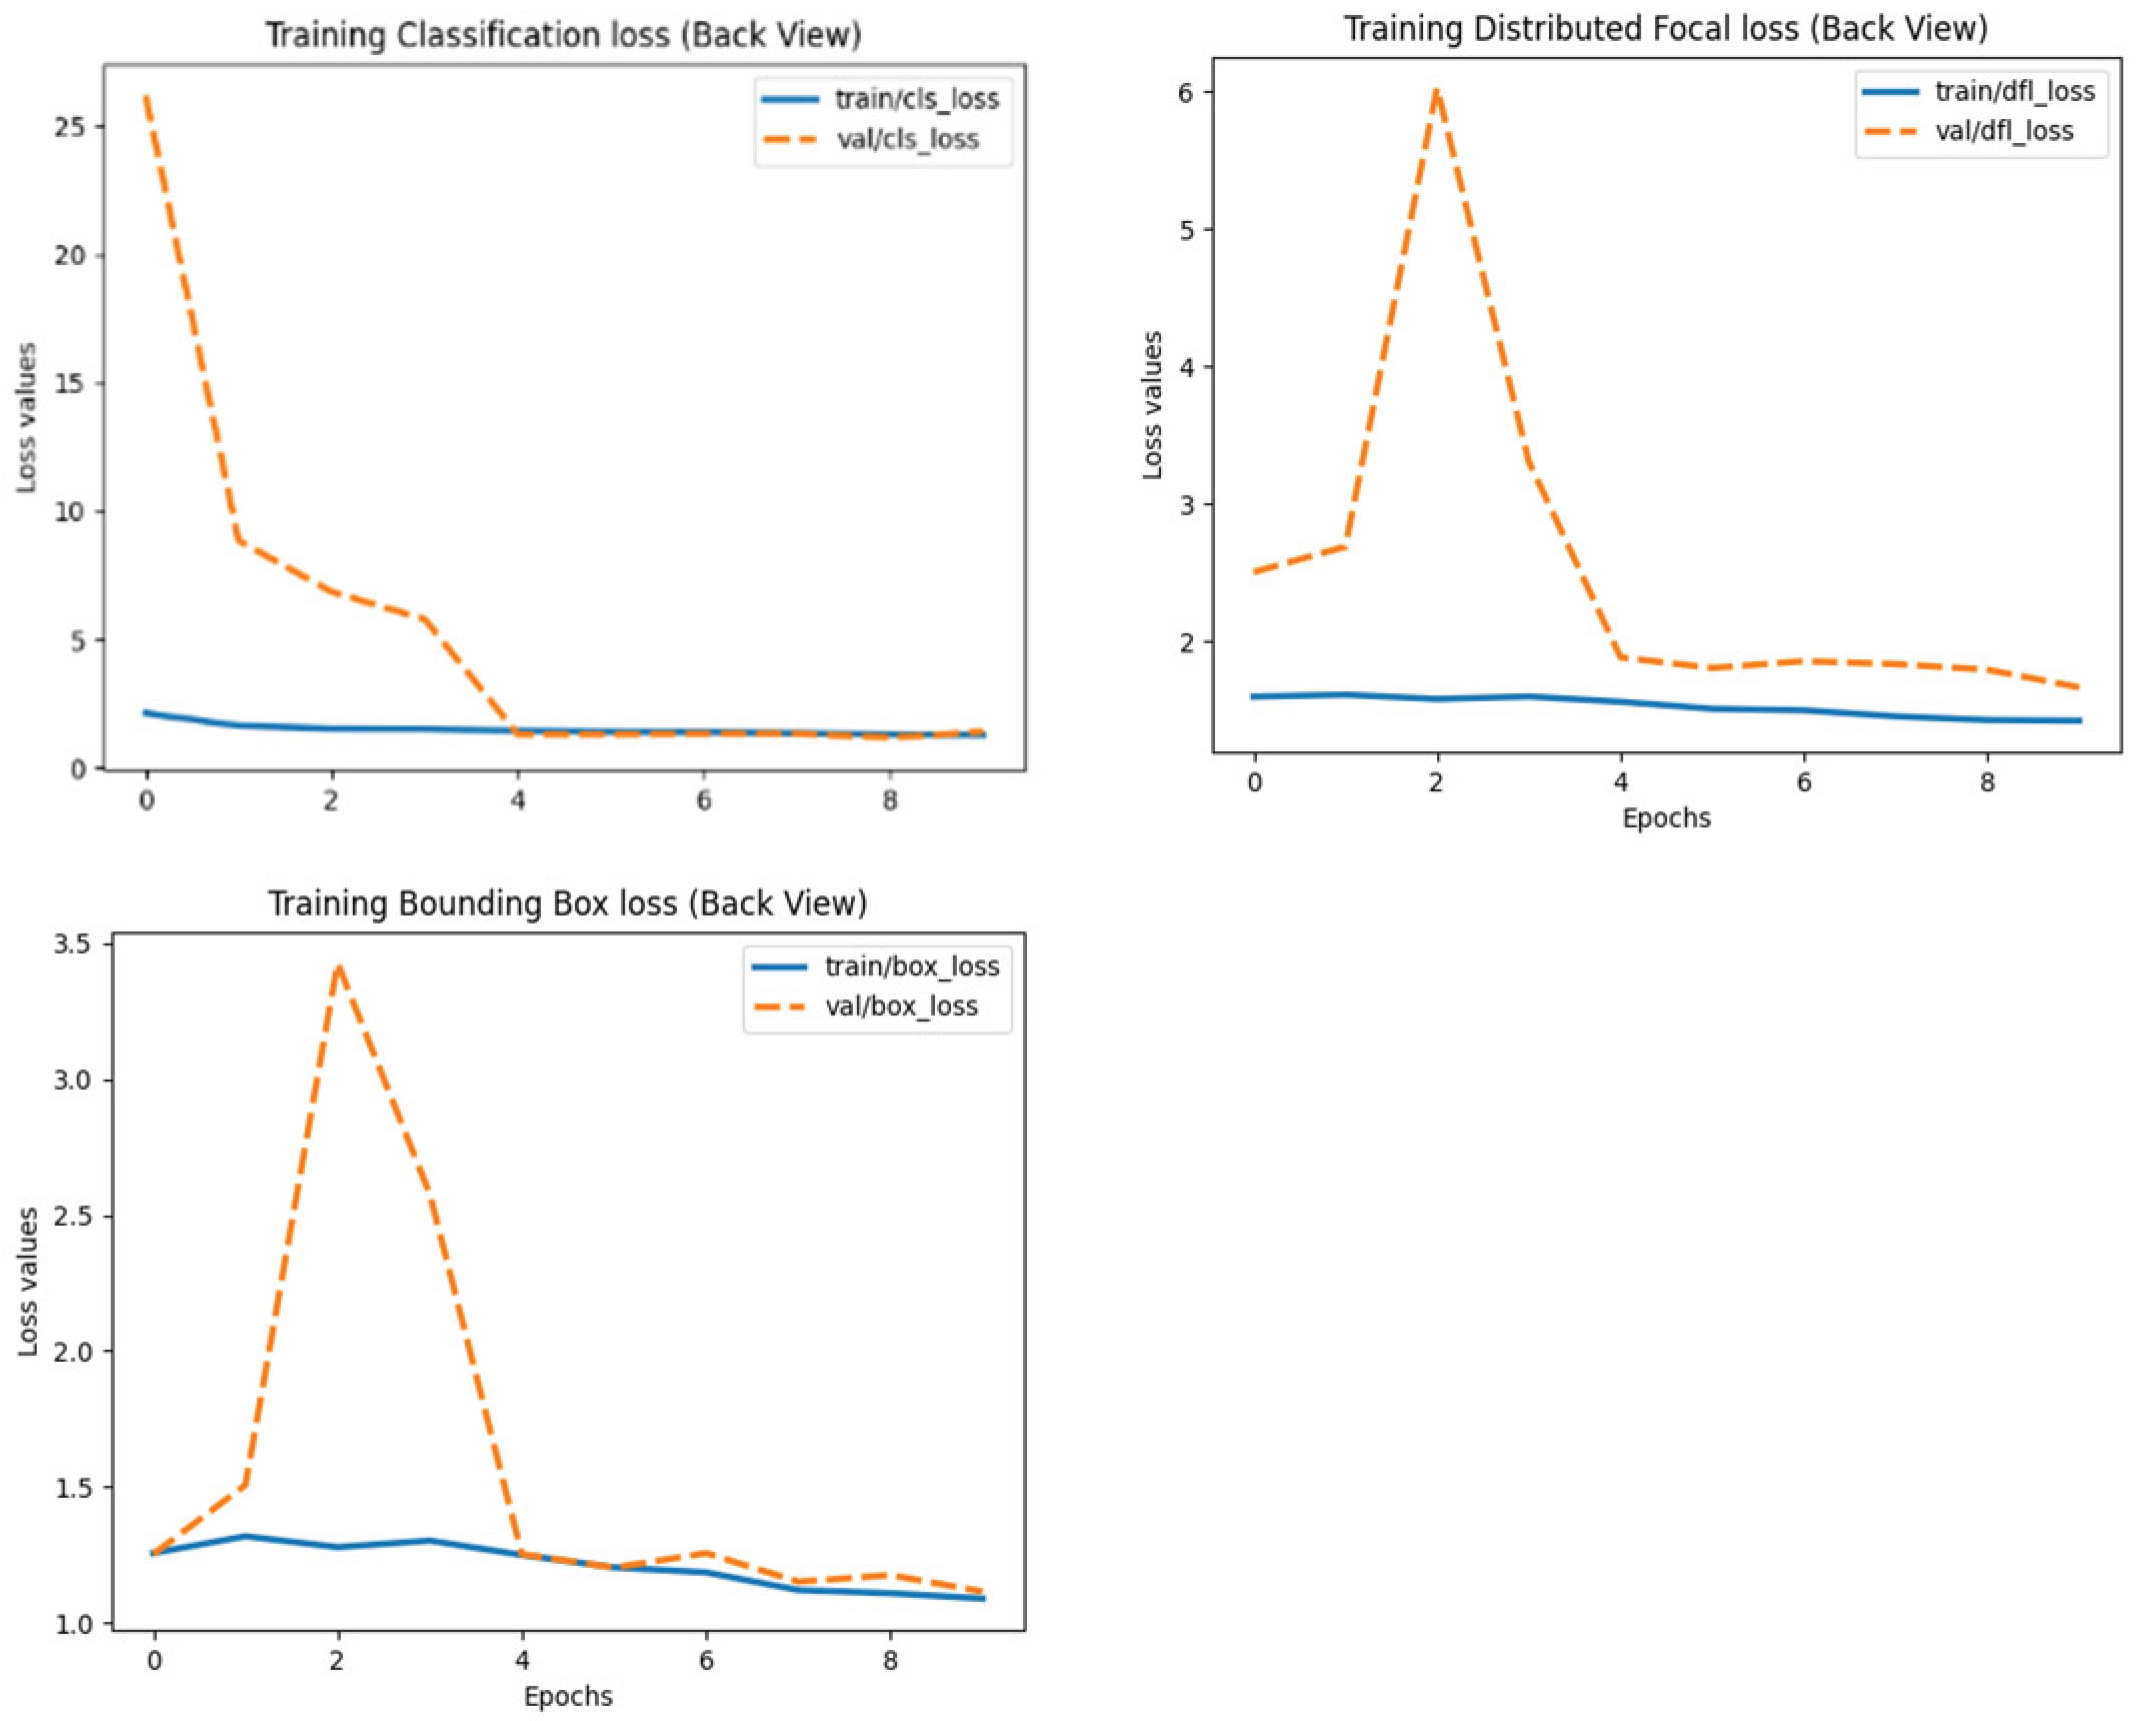
Figure 2.
Training losses of the front view model.
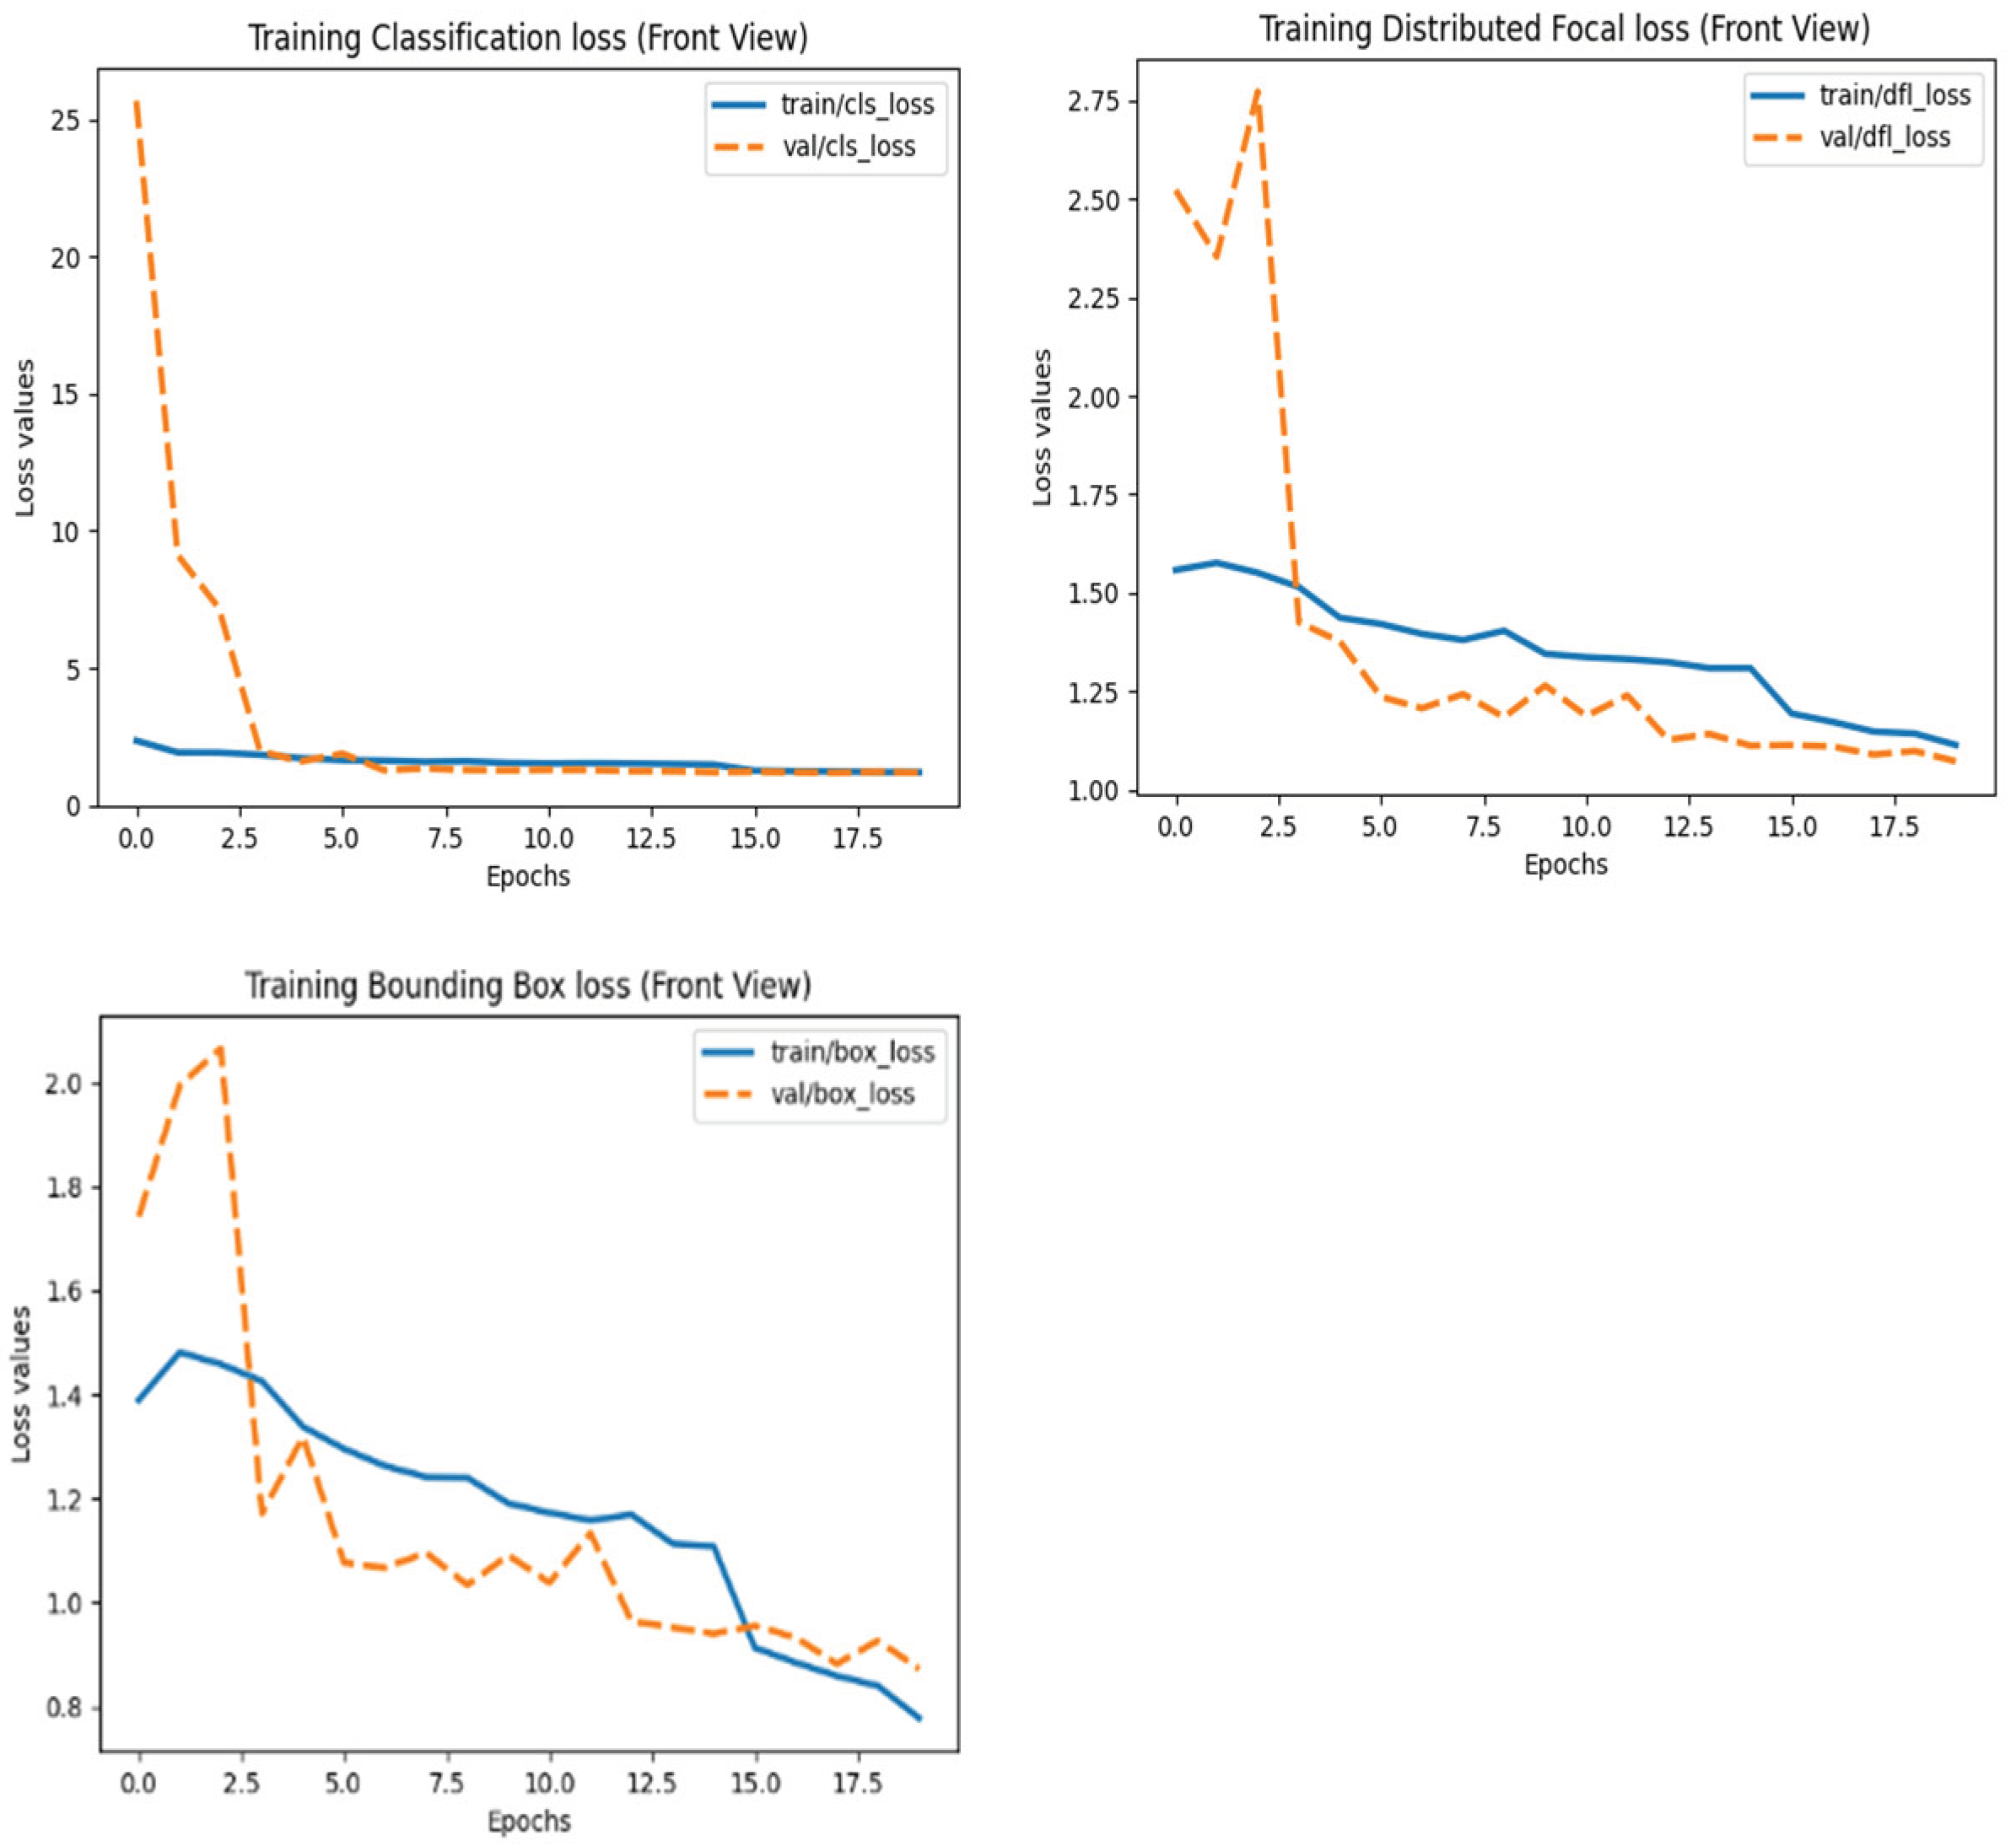
Figure 3.
Training losses of the top view model.
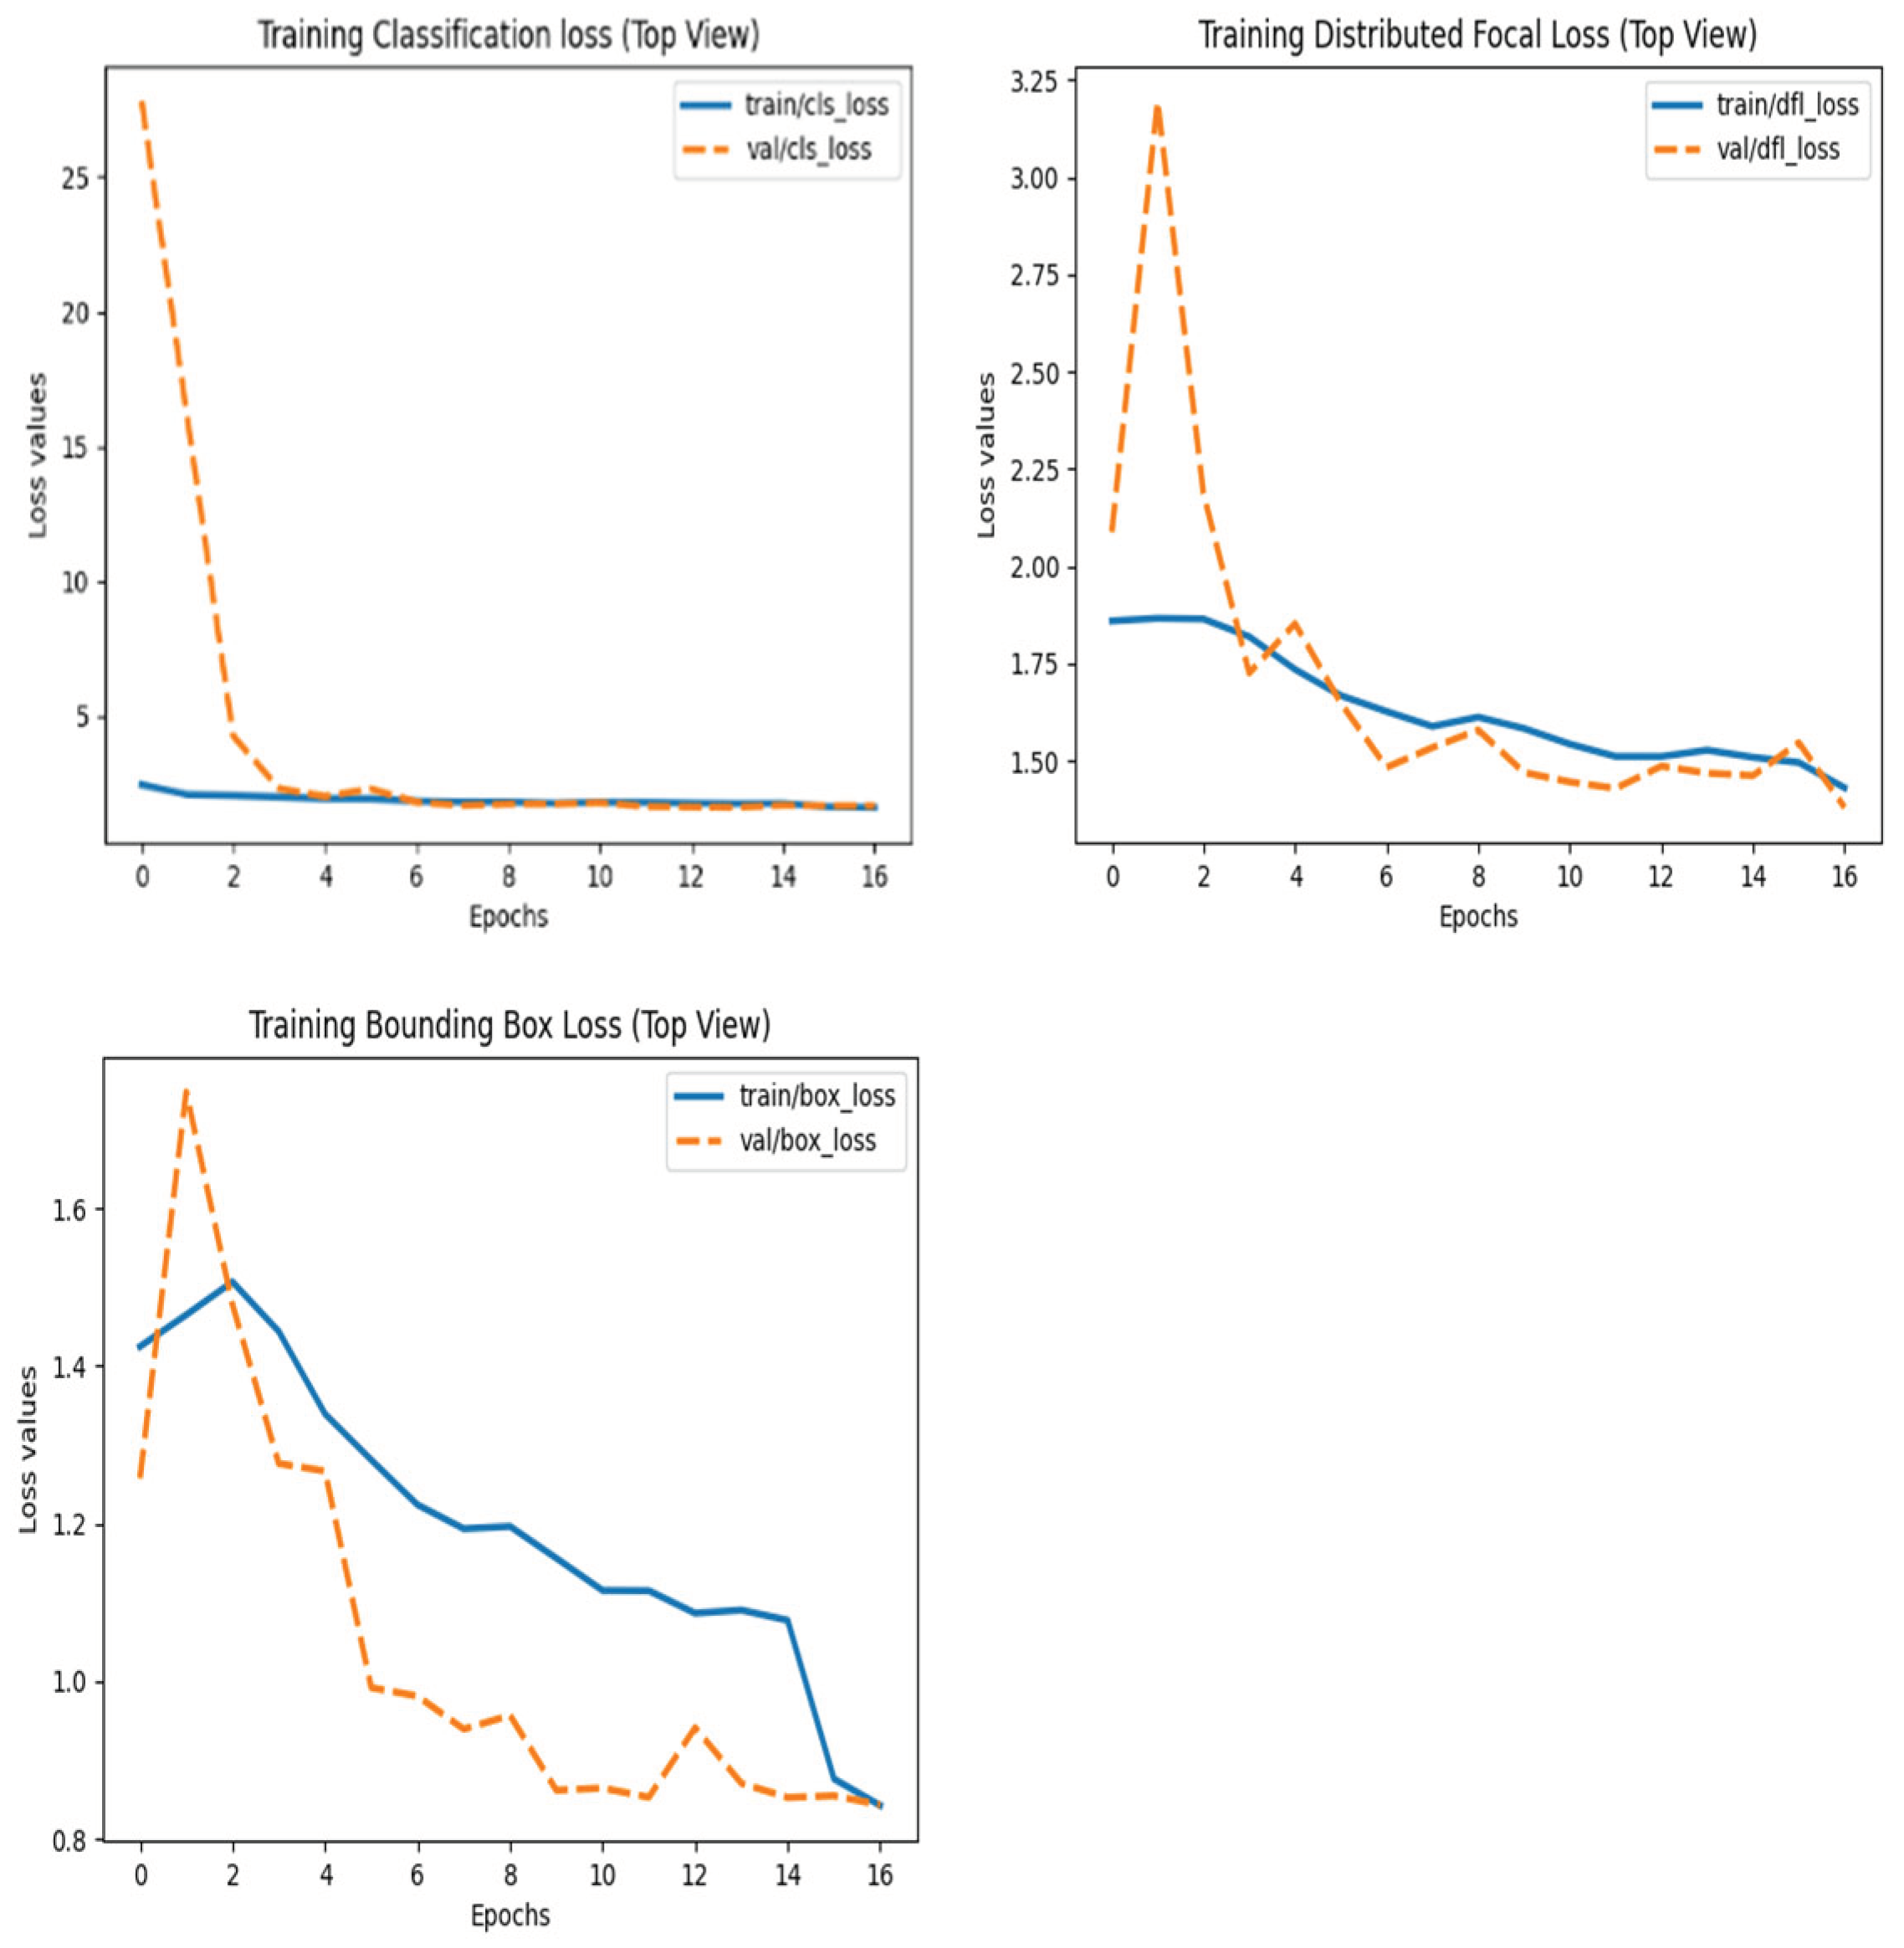
Figure 4.
Roboflow Annotations. (Top-left: Roboflow Project Initialization, Top-Right, Middle-Left, Middle-Right: SAM annotation tool, Bottom-Center: Augmentations).
Figure 4.
Roboflow Annotations. (Top-left: Roboflow Project Initialization, Top-Right, Middle-Left, Middle-Right: SAM annotation tool, Bottom-Center: Augmentations).
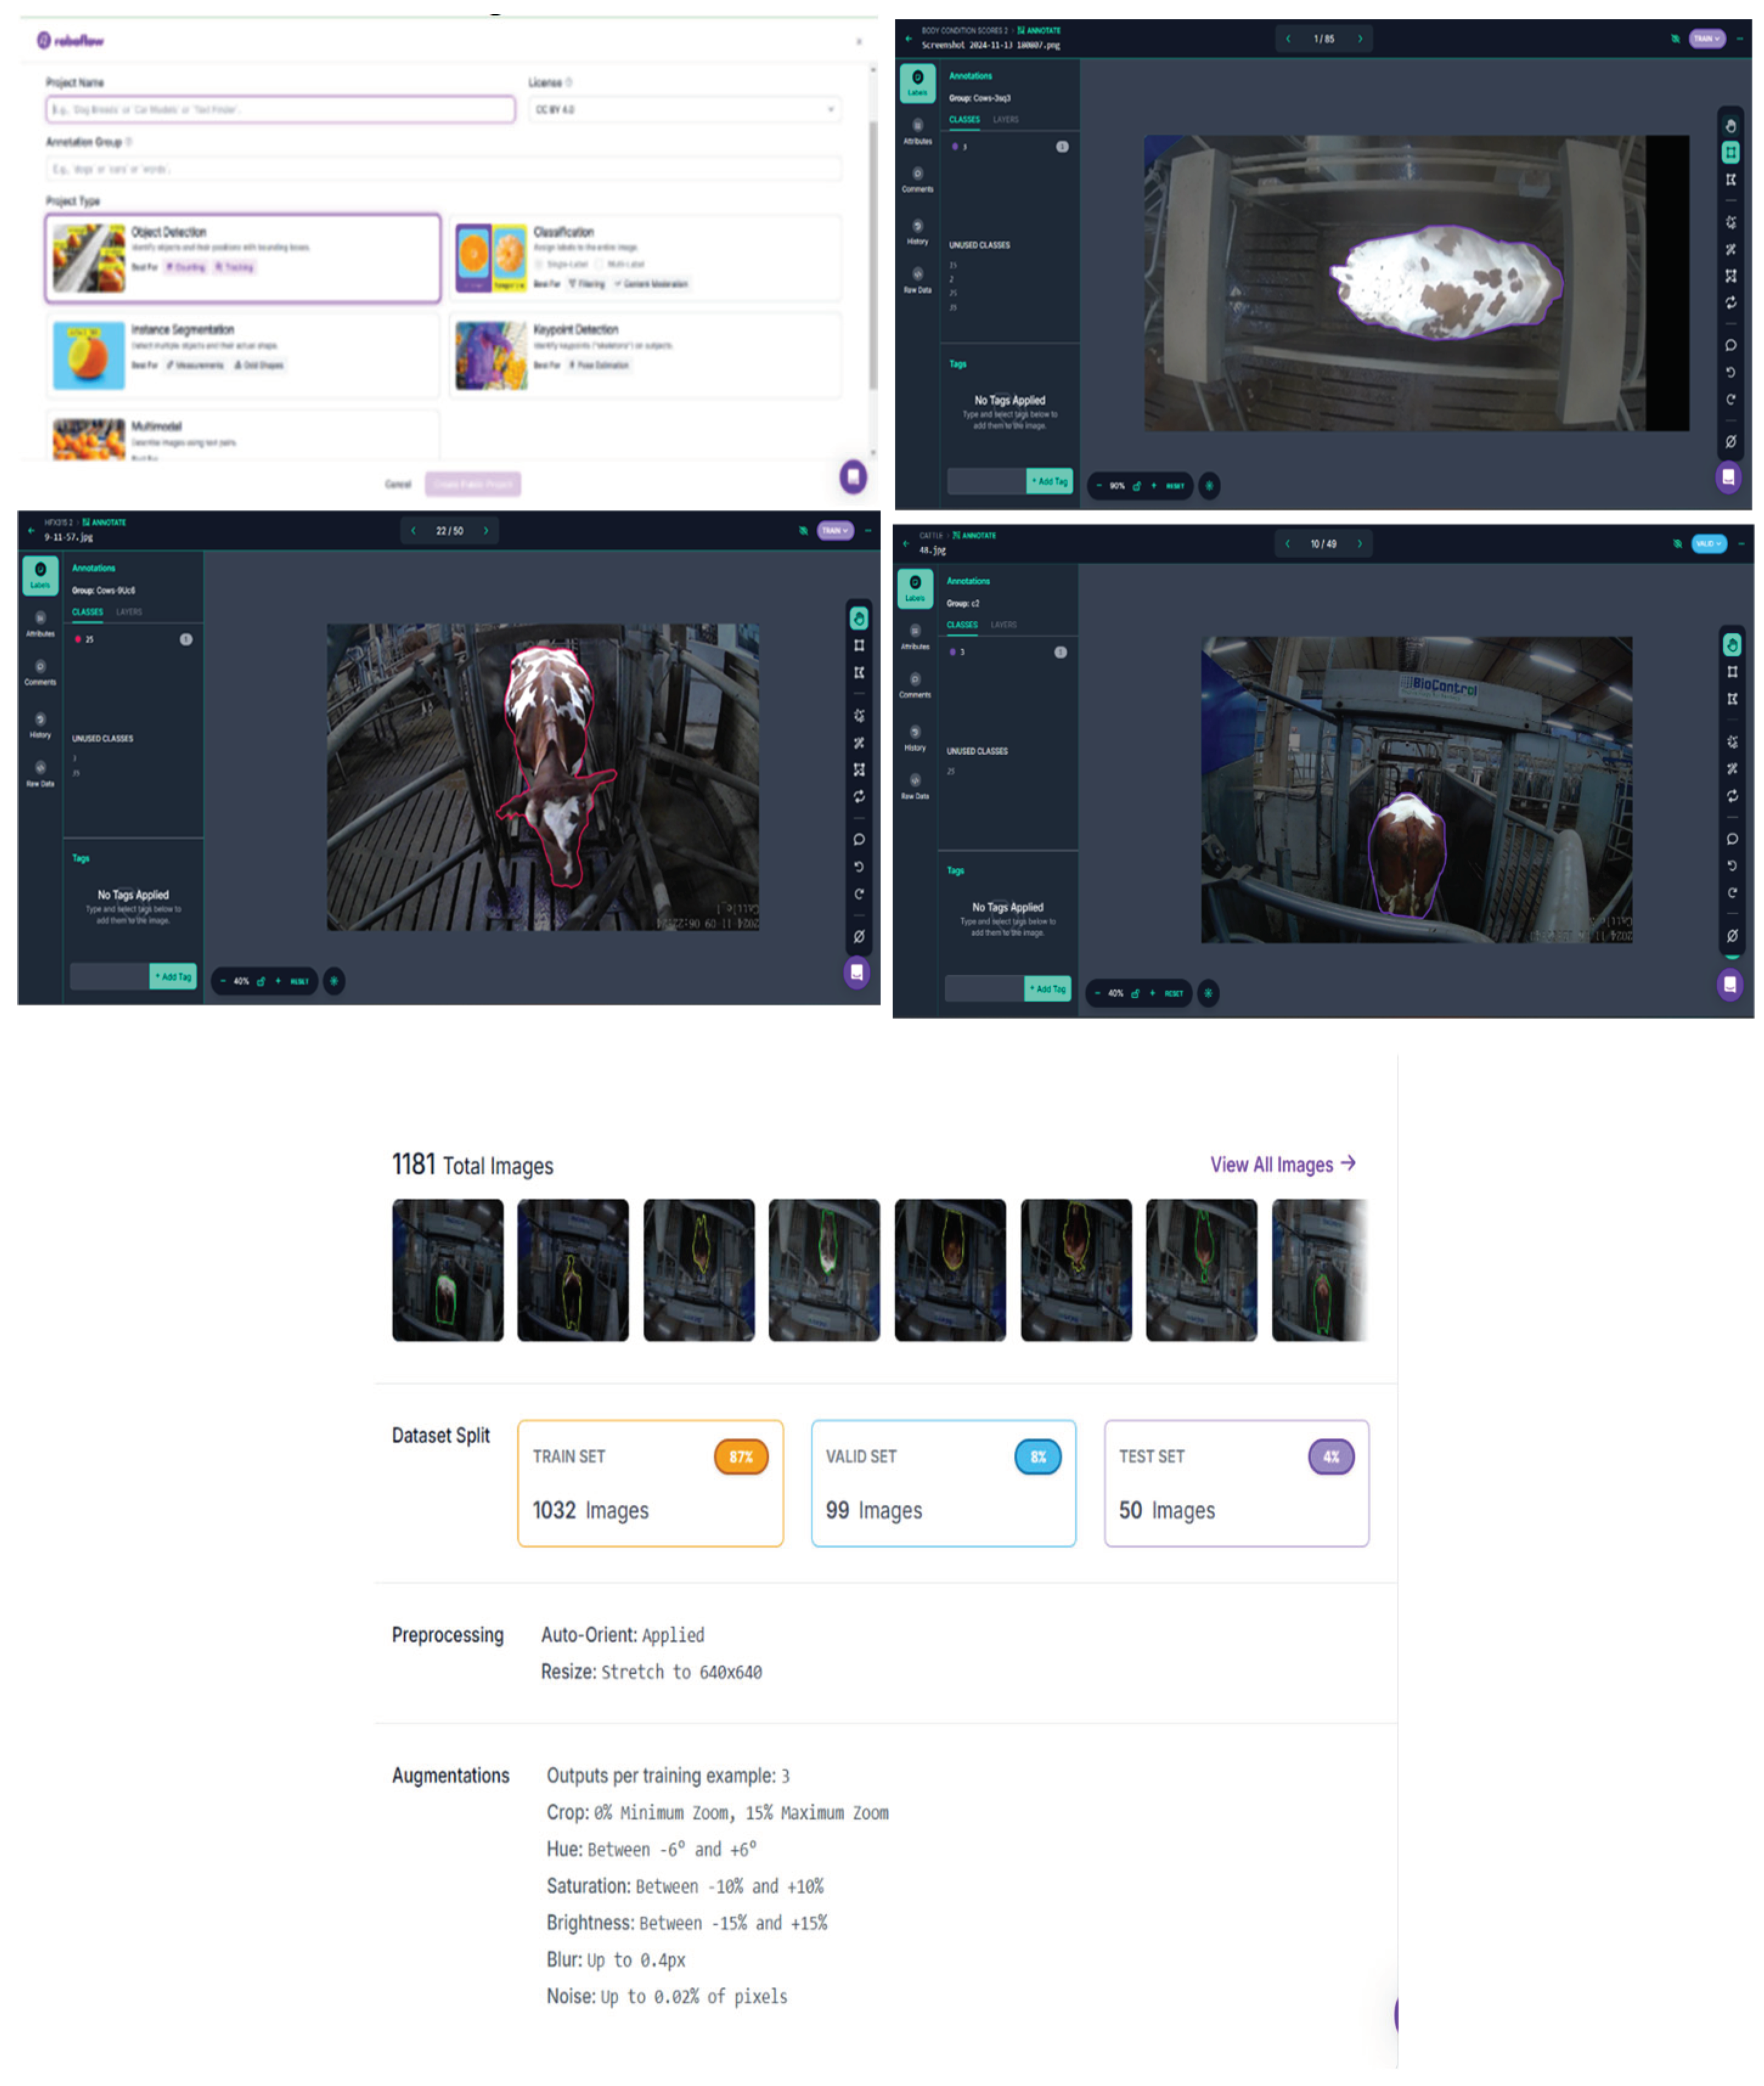
Figure 5.
Google Colab.
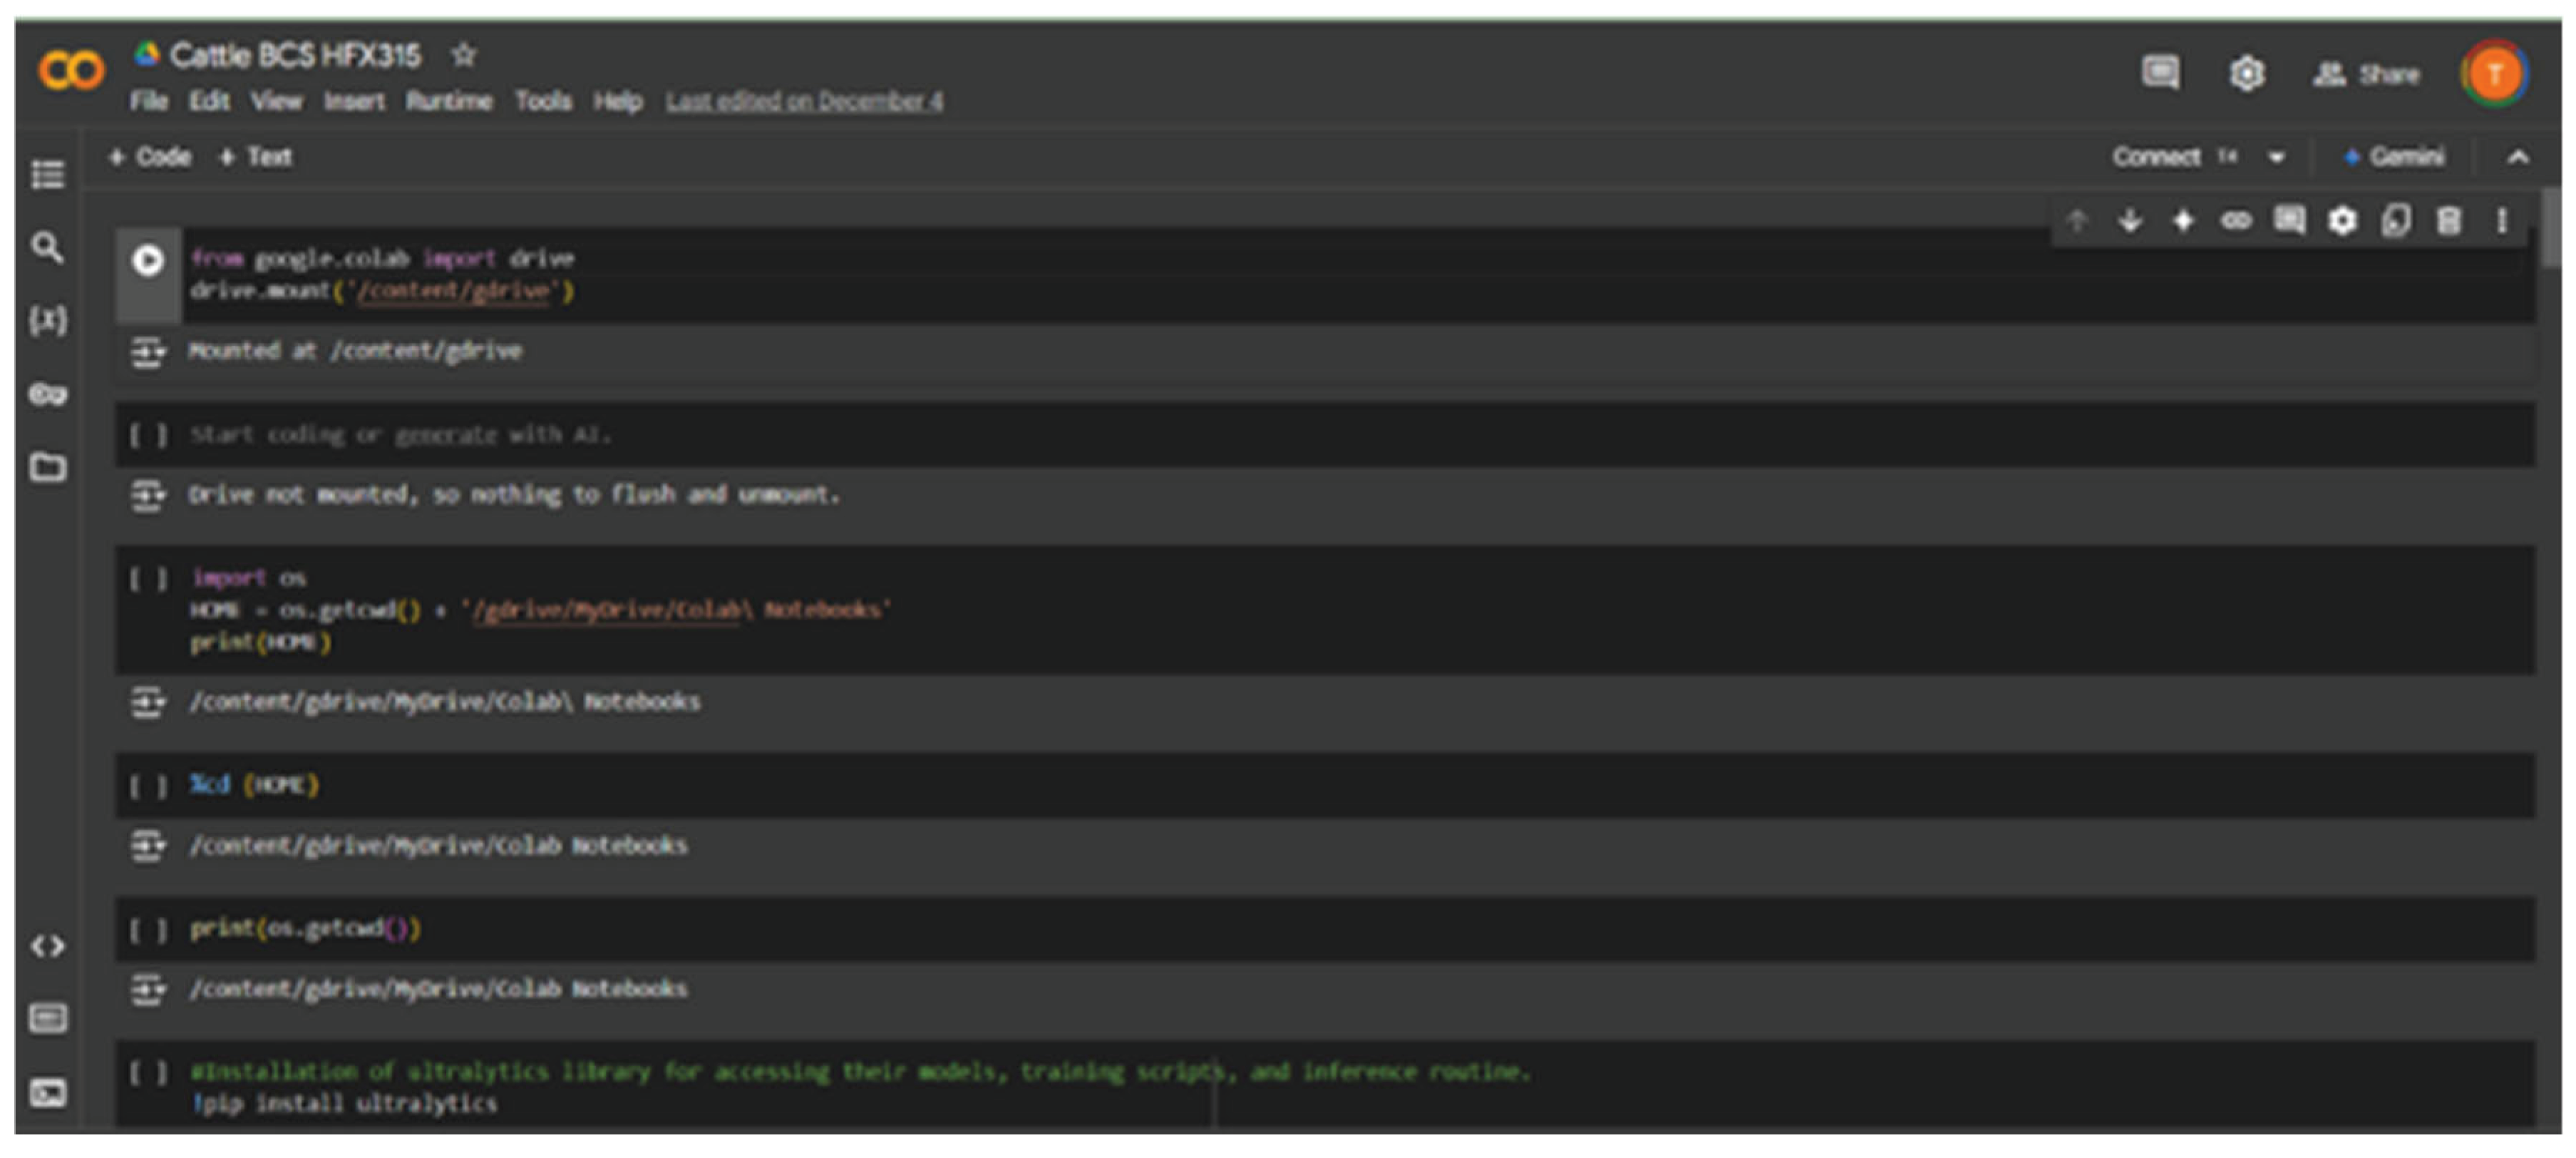
Figure 6.
Class Imbalance (left) and Adjusted Classes (right).
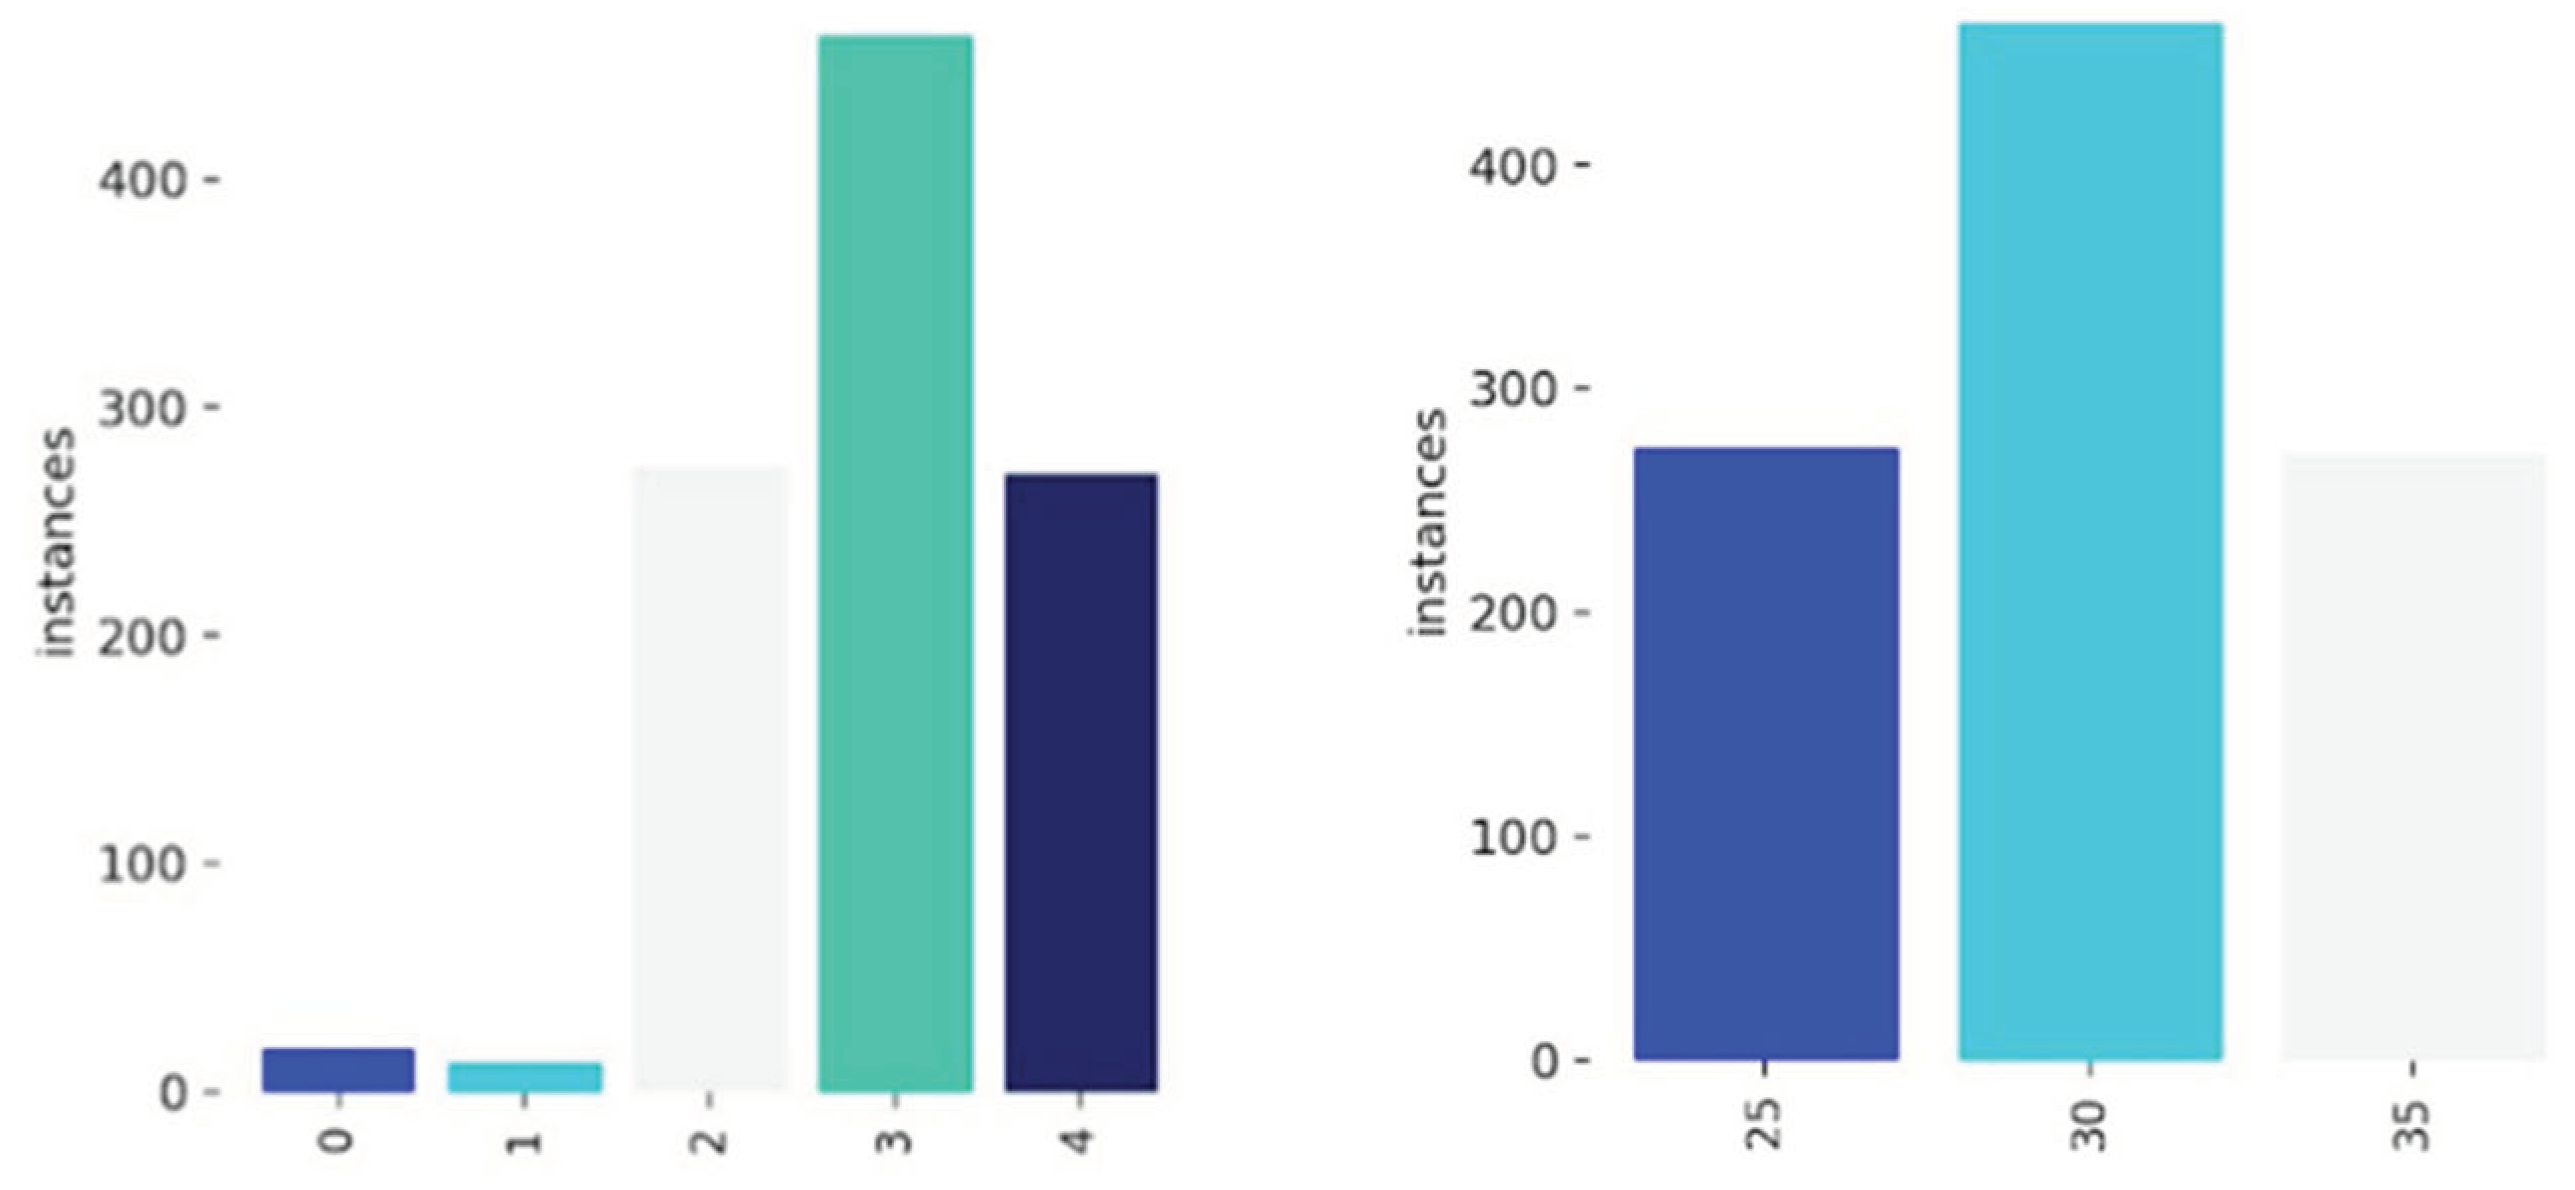
Figure 7.
Precision-Recall Curves (Top-Left: Front View, Top-Right: Top View, Middle-Left: Back View), Precision-Confidence Curves (Middle-Right: Front-View, Bottom-Left: Top View, Bottom-Right: Back View).
Figure 7.
Precision-Recall Curves (Top-Left: Front View, Top-Right: Top View, Middle-Left: Back View), Precision-Confidence Curves (Middle-Right: Front-View, Bottom-Left: Top View, Bottom-Right: Back View).
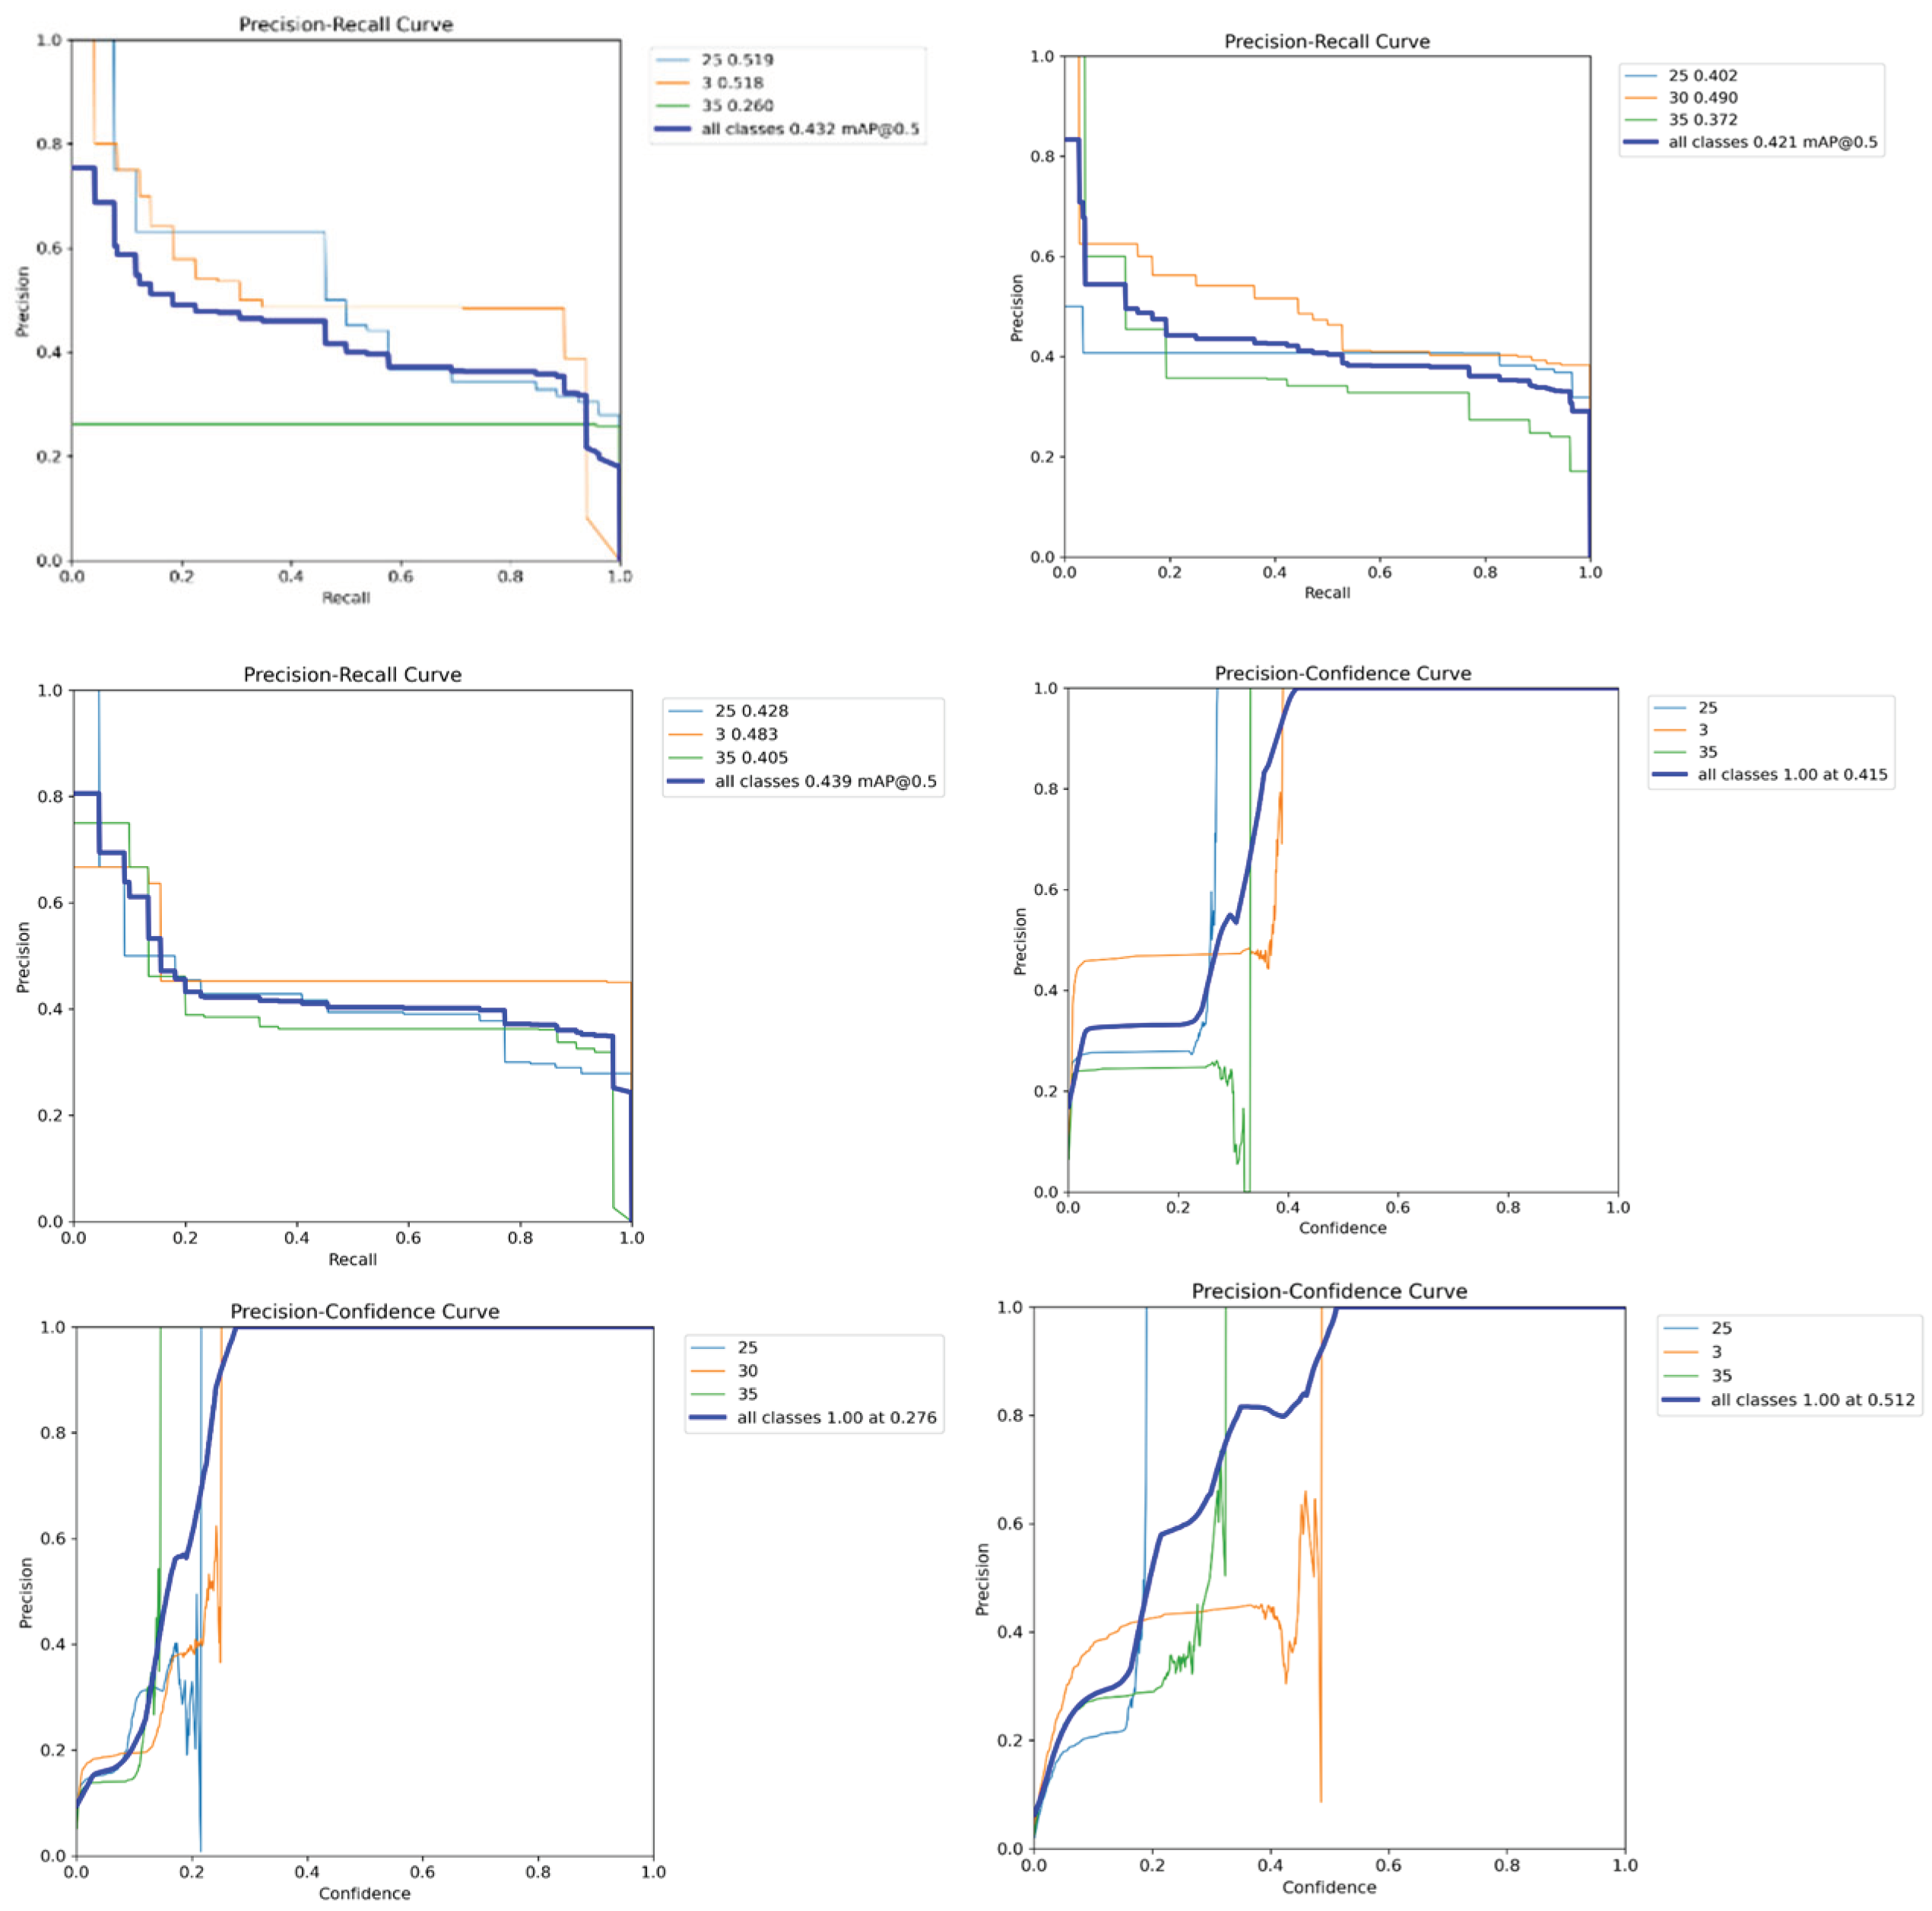
Figure 8.
Confusion Metrices (Top: Front View, Middle: Top View, Bottom: Back View).
Disclaimer/Publisher’s Note: The statements, opinions and data contained in all publications are solely those of the individual author(s) and contributor(s) and not of MDPI and/or the editor(s). MDPI and/or the editor(s) disclaim responsibility for any injury to people or property resulting from any ideas, methods, instructions or products referred to in the content. |
© 2025 by the authors. Licensee MDPI, Basel, Switzerland. This article is an open access article distributed under the terms and conditions of the Creative Commons Attribution (CC BY) license (http://creativecommons.org/licenses/by/4.0/).
Copyright: This open access article is published under a Creative Commons CC BY 4.0 license, which permit the free download, distribution, and reuse, provided that the author and preprint are cited in any reuse.


