
Submitted:
01 May 2025
Posted:
07 May 2025
You are already at the latest version
Abstract
Critical insights into brain function and dysfunction are provided by the electroencephalographic (EEG) power spectrum. Often mentioned are two main trends: bell-shaped (Gaussian) profiles usually seen in healthy development and U-shaped (parabolic) profiles more often noted in neurodevelopmental diseases like Autism Spectrum Disorder (ASD). This research investigates the mathematical foundations supporting these profiles and looks at the neurobiological mechanisms producing such spectral distributions, hence stressing their clinical relevance for diagnosis and intervention in ASD.
Keywords:
ASD
; U-shaped profile
; EEG
1. Introduction
Electroencephalography (EEG) provides a non-invasive insight into the brain's functional architecture by recording electrical activity across several frequency bands (Buzsáki, 2006). Conventional knowledge claims that optimal brain function is typified by a Gaussian distribution of spectral power, featuring a prominent alpha peak around 10 Hz at the centre. Atypical electroencephalogram (EEG) profiles, specifically U-shaped spectra marked by heightened theta and gamma activity and diminished alpha-beta power, have been recorded in persons with autism spectrum disorder (ASD) and other developmental disorders.
Mathematical modelling of these profiles offers a systematic framework for comprehending the neurological anomalies underlying autism spectrum disorder (ASD) and aids in the advancement of automated diagnostic and therapeutic interventions.
Electroencephalography (EEG) offers a non-invasive approach to investigate the brain's dynamic electrical activity and is extensively utilised in researching neurodevelopmental diseases. Increasing data indicates that individuals with Autism Spectrum Disorder (ASD) display a distinctive "U-shaped" power spectral profile in resting-state EEG recordings. This profile is characterised by elevated power in both low-frequency (delta, theta) and high-frequency (beta, gamma) bands, alongside a decrease in mid-frequency (alpha) activity.
This pattern deviates from the bell-shaped (Gaussian) distribution commonly seen in neurotypical individuals, where alpha power (centred around 8–12 Hz) predominates the spectrum, indicating a balanced excitation-inhibition dynamic and effective thalamocortical communication (Başar, 2012; Buzsáki, 2006).
Numerous meta-analytical and empirical investigations have validated the existence of U-shaped EEG power patterns in ASD. Wang et al. (2013) illustrated increased gamma band activity and diminished alpha coherence in children with ASD, underscoring dysregulated cortical excitability. A systematic analysis by Wang et al. (2023) in Translational Psychiatry corroborated elevated low- and high-frequency EEG power in ASD populations relative to typically developing controls, hence reinforcing the significance of U-shaped profiles as neurophysiological indicators.
Furthermore, these spectral anomalies are believed to indicate fundamental neurobiological dysfunctions, including GABAergic imbalance (Robertson et al., 2016), thalamocortical dysrhythmia (Llinás et al., 1999), and delayed cortical maturation (Tierney et al., 2012). These mechanisms interfere with oscillatory synchronisation and contribute to the perceptual and cognitive irregularities frequently identified in autism.
The recognition of this spectral pattern holds considerable significance for early diagnosis, tailored therapies, and the creation of machine learning algorithms proficient in identifying ASD-related brain signatures with elevated sensitivity and specificity.
2. Mathematical Models of EEG Power Spectra
2.1. Gaussian (Bell-Shaped) Model
The Gaussian distribution is mathematically expressed as:
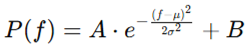 |
This formulation captures the natural, symmetric decay of power away from a central frequency (often alpha), reflecting homeostatic excitation-inhibition (E/I) balance and coherent thalamocortical interactions (Başar, 2012).
Figure 1.
Illustration of a Gaussian EEG power profile centered at 10 Hz.
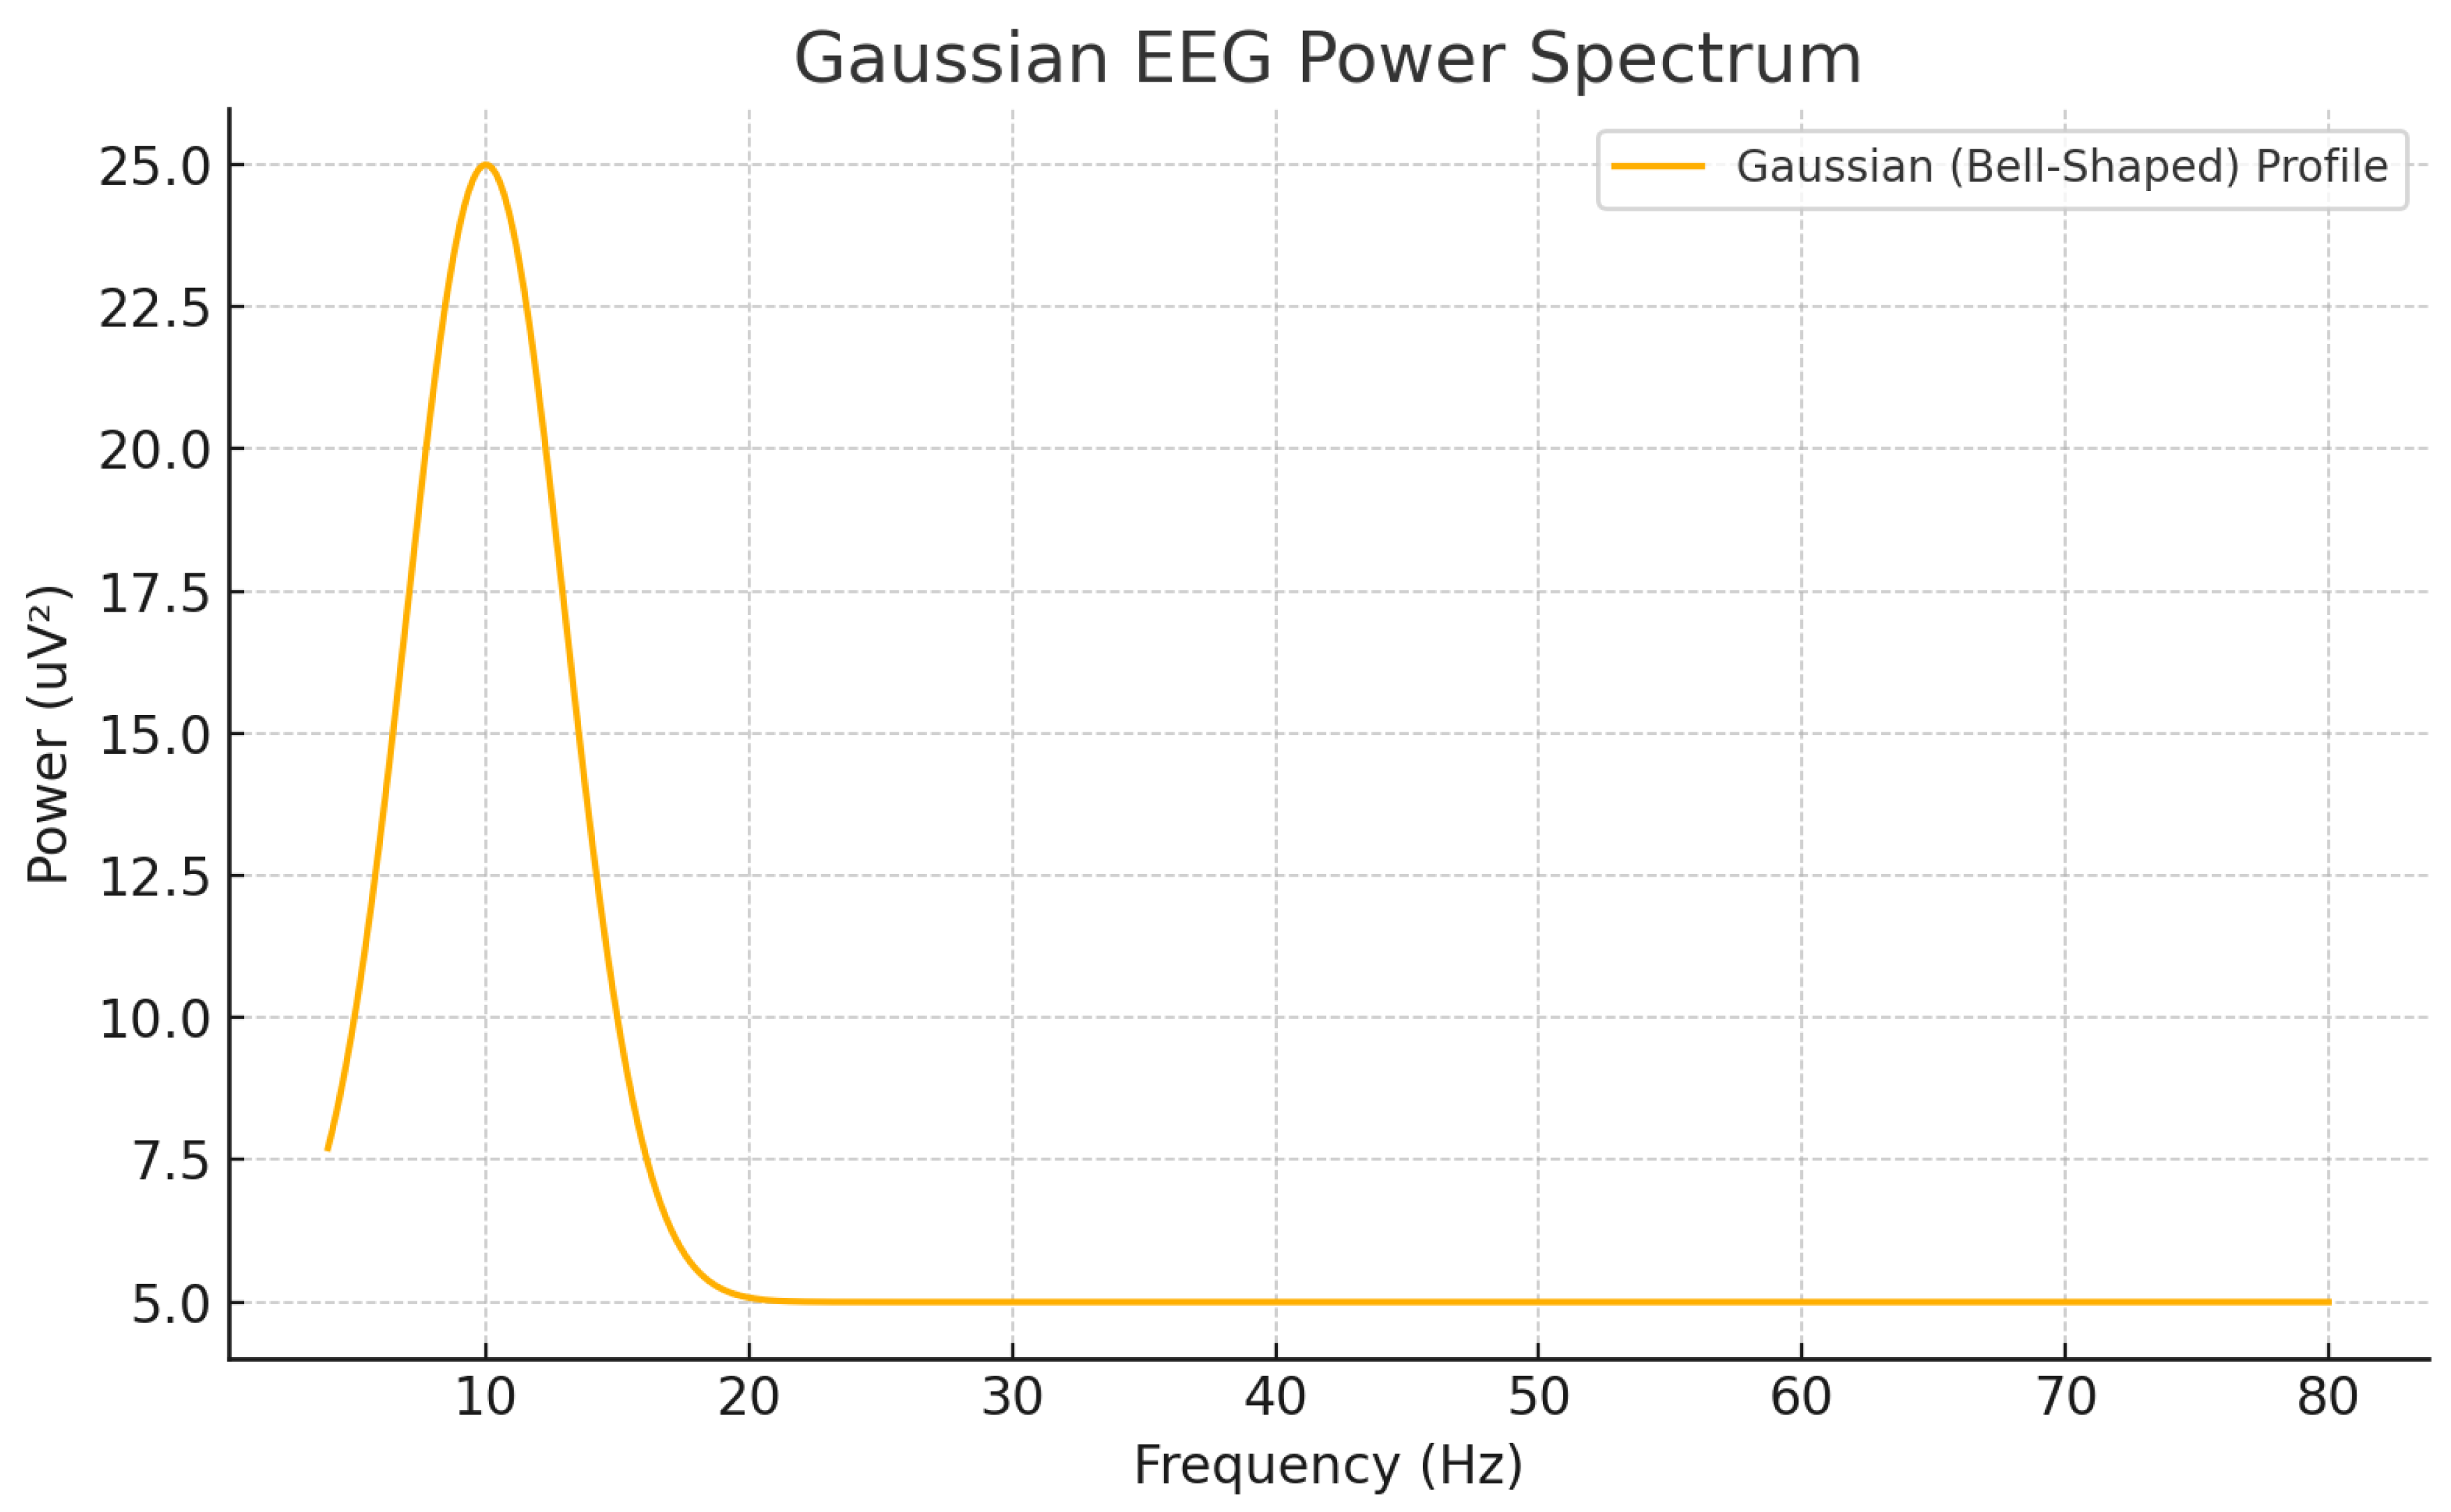
2.2. Parabolic (U-Shaped) Model
In contrast, the parabolic model representing U-shaped spectra is defined as:
 |
where f0f_0f0 represents the mid-frequency dip (typically 15–20 Hz). This model approximates EEG patterns with increased low (theta) and high (gamma) frequency power, and diminished mid-frequency (alpha-beta) power, commonly observed in ASD (Edgar et al., 2015).
Figure 2.
Representation of a U-shaped EEG power profile showing elevated theta and gamma bands.
3. Interpretations of Neurobiology
3.1. Healthy Neural Dynamics and Bell-Shaped Profile
Stable excitation-inhibition dynamics and synchronised thalamocortical oscillations produce Gaussian EEG patterns (Hughes & Crunelli, 2005). With alpha rhythms as major markers of cortical preparedness, they show effective sensory integration, attention, and cognitive control (Klimesch, 1999). U-Shaped Profile and Neural Dysregulation Linked to ASD. Several, interrelated neurobiological elements cause ASD to produce U-shaped EEG patterns:
3.2.1. Global Underconnectivity and Local Overconnectivity
Structural and functional research show too high local circuit strength but compromised long-range connection in ASD (Just et al., 2004), which causes unequal theta and gamma activity and alpha-beta mediated global integration suppression.
3.2.2. GABAergic Dysfunction and Cortical Disinhibition
Reduced GABAergic inhibition disturbs network synchronisation, hence favouring both slow (theta) and fast (gamma) oscillations at the expense of mid-frequency rhythms (Robertson et al., 2016).
3.2.3. Delays in Developmental Maturation
During brain maturation, alpha power naturally rises with age. Maintaining an early-stage EEG pattern dominated by theta activity, ASD has been linked to ongoing cortical development delays (Dickinson et al., 2018).
3.2.4. Defective Temporal Binding
The temporal binding of sensory information depends on gamma oscillations. Gamma irregularities connected to ASD show disorganised perceptual integration, which shows up as a chaotic, non-functional type of hyper-synchrony (Uhlhaas & Singer, 2012).
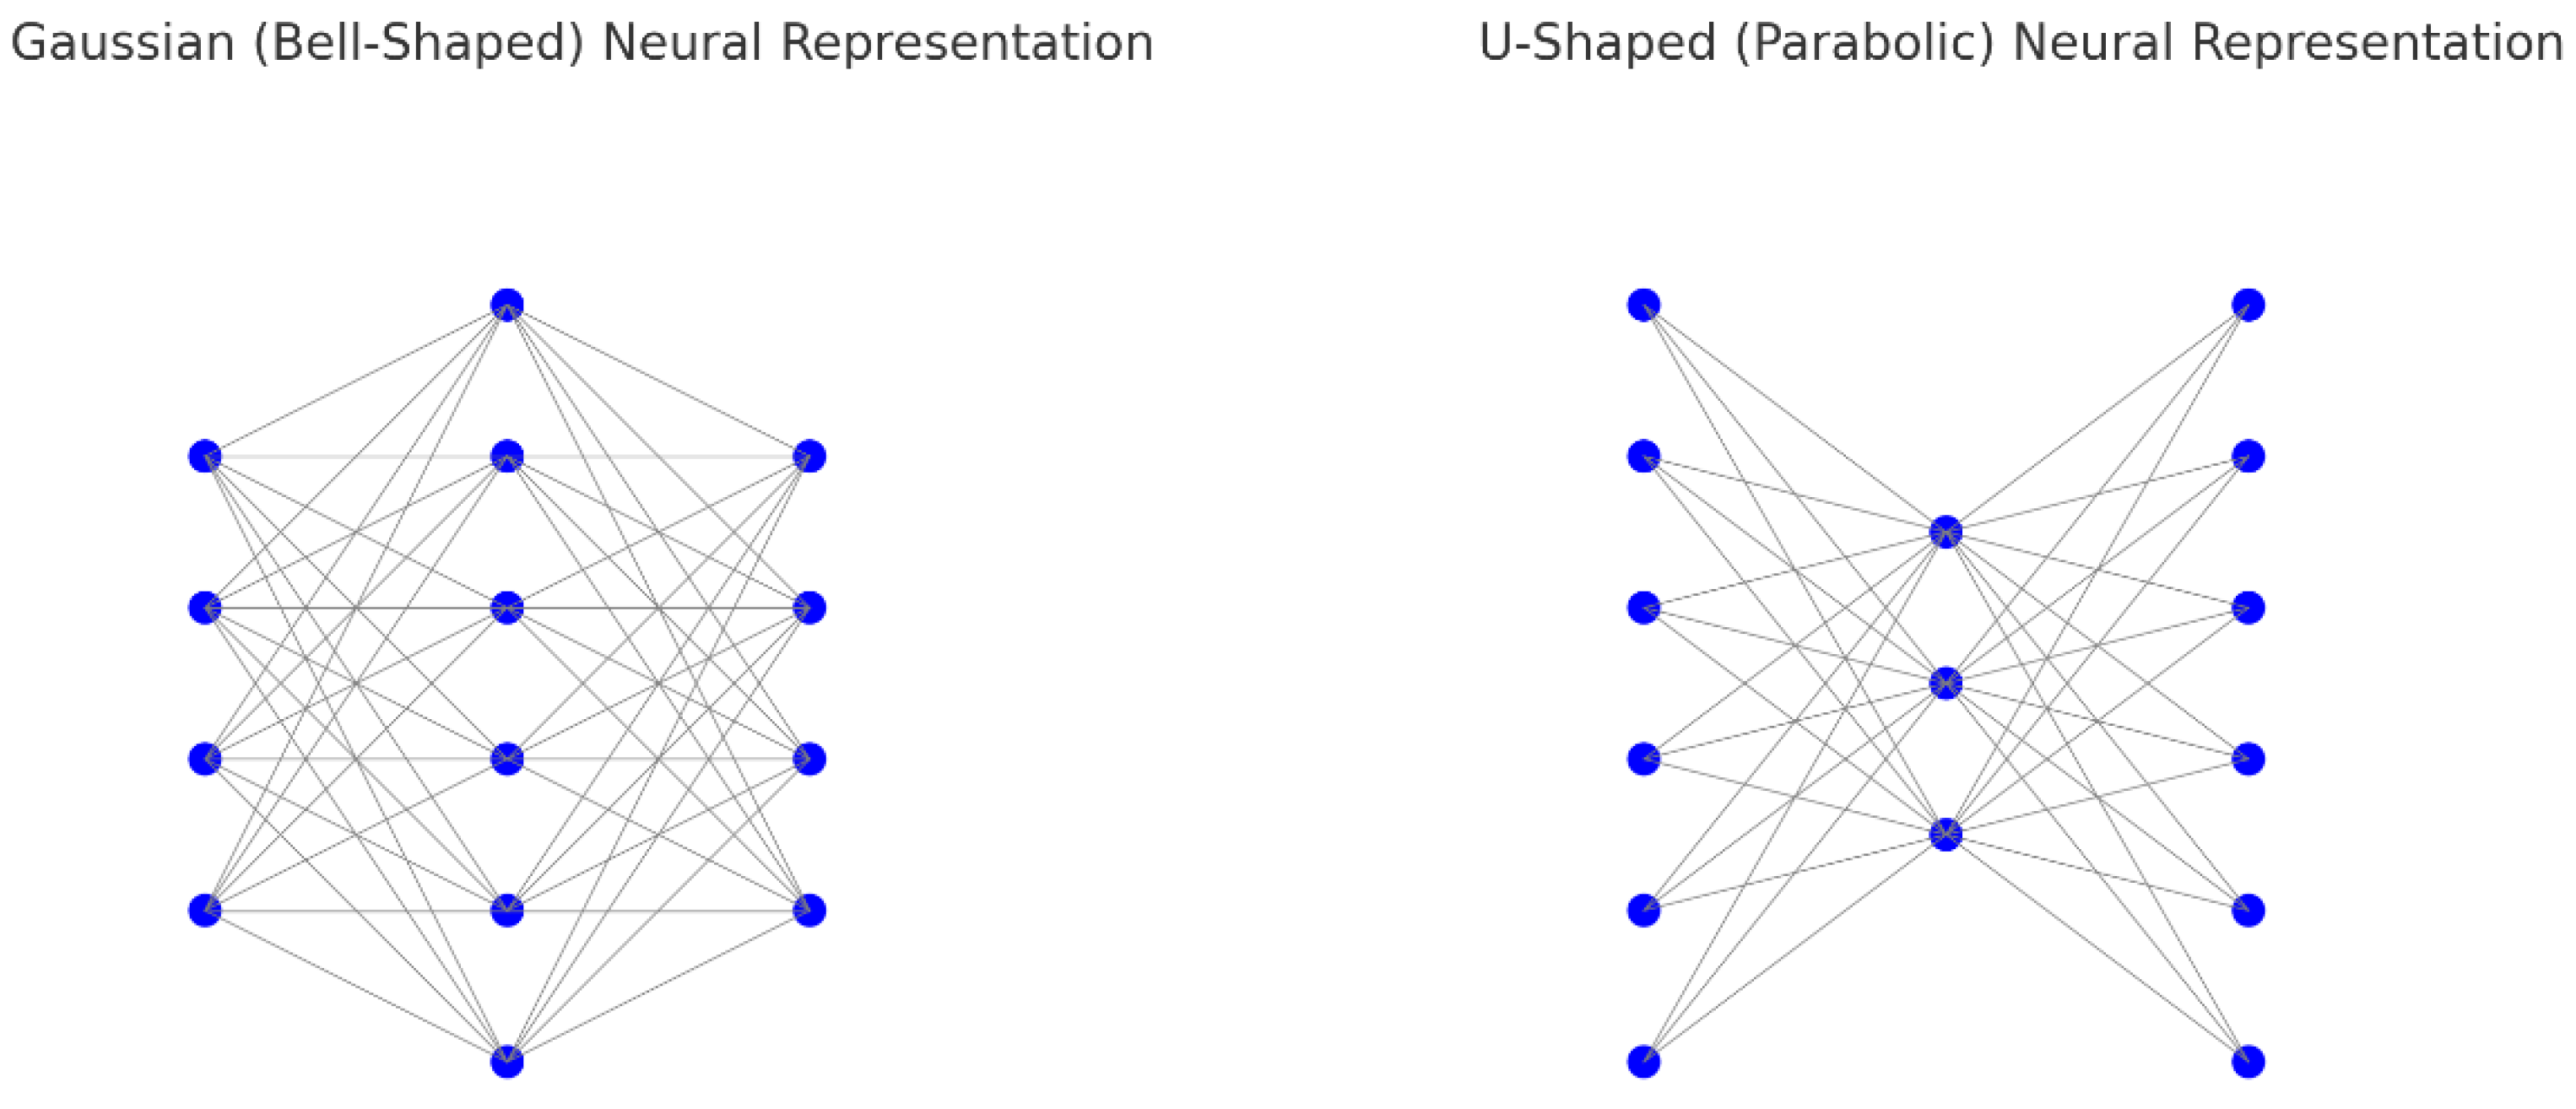
3.2.5. Interhemispheric and Thalamocortical Dysconnectivity
Growing data indicates that U-shaped EEG patterns in autism spectrum disorder might be caused by poor integration at both vertical and horizontal levels of brain communication. Through its reciprocal connections with the cortex, the thalamus, a crucial relay for sensory and cerebral information, plays a key role in generating and modifying alpha and beta oscillations. Thalamocortical dysrhythmia in ASD has been linked to a notable drop in mid-frequency activity, especially in alpha rhythms (Hughes & Crunelli, 2005).
A simultaneous decrease in interhemispheric connectivity—mostly mediated by the corpus callosum—both in structural volume and functional integrity characterises ASD (Just et al., 2004). This decreased integration hinders the synchronization of bilateral cortical areas, which usually sustain global oscillatory coherence, especially in the alpha and beta bands.
By contrast, local circuits—especially in limbic and sensorimotor areas—may show hyperconnectivity and disinhibition, which would lead to too high theta and gamma activity. The whole result is a "U-shaped" spectral profile: more activity at low and high frequencies but less synchrony in the middle range.
The U-shaped EEG pattern could therefore indicate a collapse of the thalamocortical-corpus callosal triad, compromising vertical (thalamo-cortical) and horizontal (interhemispheric) coordination throughout the brain.
Figure 3.
4. Implications for Clinical and Computational Work
There are a number of intriguing applications for the mathematical description of EEG profiles:
Gaussian models serve as normative baselines in the context of neurofeedback, cognitive training, and neurological examinations.
For the purpose of tracking the efficacy of therapy, subtyping, and diagnosing autism spectrum disorder (ASD), U-shaped models can be utilised as quantitative biomarkers.
The incorporation of these components into machine learning models has the potential to enhance the sensitivity and specificity of screening systems that are based on EEG.

Table 1.
Comparison of Gaussian vs. U-Shaped EEG Profiles in Biological and Clinical Contexts.
| Feature | Gaussian Profile | U-Shaped Profile |
|---|---|---|
| Biological Source | Balanced thalamocortical dynamics | Local overconnectivity, disinhibition |
| Frequency Center | Alpha (~10 Hz) peak | Elevated Theta (~4–8 Hz) and Gamma (~30–80 Hz) |
| Clinical Association | Healthy brain function | Autism Spectrum Disorder |
| Application | Neurofeedback, cognitive enhancement | Diagnostic biomarker, ASD research |
5. Discussion
Knowing the change from a bell-shaped to a U-shaped EEG pattern uncovers important new pathophysiology of ASD. It shows not just changed growth paths and neurotransmitter abnormalities but also broken connection patterns. Clinically, such EEG indicators could enable early detection and categorisation of ASD subgroups, hence providing chances for tailored treatments.
Future studies should concentrate on confirming the predictive potential of U-shaped profiles longitudinally, investigating treatments meant to restore normal spectral balance, and combining EEG biomarkers with genetic and behavioural data for thorough ASD phenotyping.
5.1. Biological Mechanisms Underlying the Gaussian-to-Parabolic Transition
The shift from a Gaussian (bell-shaped) EEG profile to a U-shaped (parabolic) profile in neurodevelopmental disorders like ASD is substantiated by numerous well-established biological mechanisms:
- Thalamocortical Dysrhythmia (TCD): Disrupted rhythmic transmission from the thalamus to the cortex reduces alpha wave generation while enhancing the prominence of theta and gamma frequency bands (Llinás et al., 1999; Hughes & Crunelli, 2005).
- Excitation-Inhibition Imbalance: A decrease in GABAergic inhibition leads to the attenuation of alpha/beta rhythms and an increase in theta/gamma activity (Rubenstein & Merzenich, 2003; Robertson et al., 2016).
- Interhemispheric Disconnectivity: Deterioration of corpus callosum integrity reduces mid-frequency synchronisation while permitting low and high frequency bands to become comparatively hyperactive (Just et al., 2004; Travers et al., 2012).
- Delayed Cortical Maturation: In normative development, alpha power grows with age. In ASD, there is a sustained alpha shortage and the emergence of immature spectral patterns (Tierney et al., 2012; Dickinson et al., 2018).
Figure 4.
Gaussian versus U-shaped EEG profiles of brains.
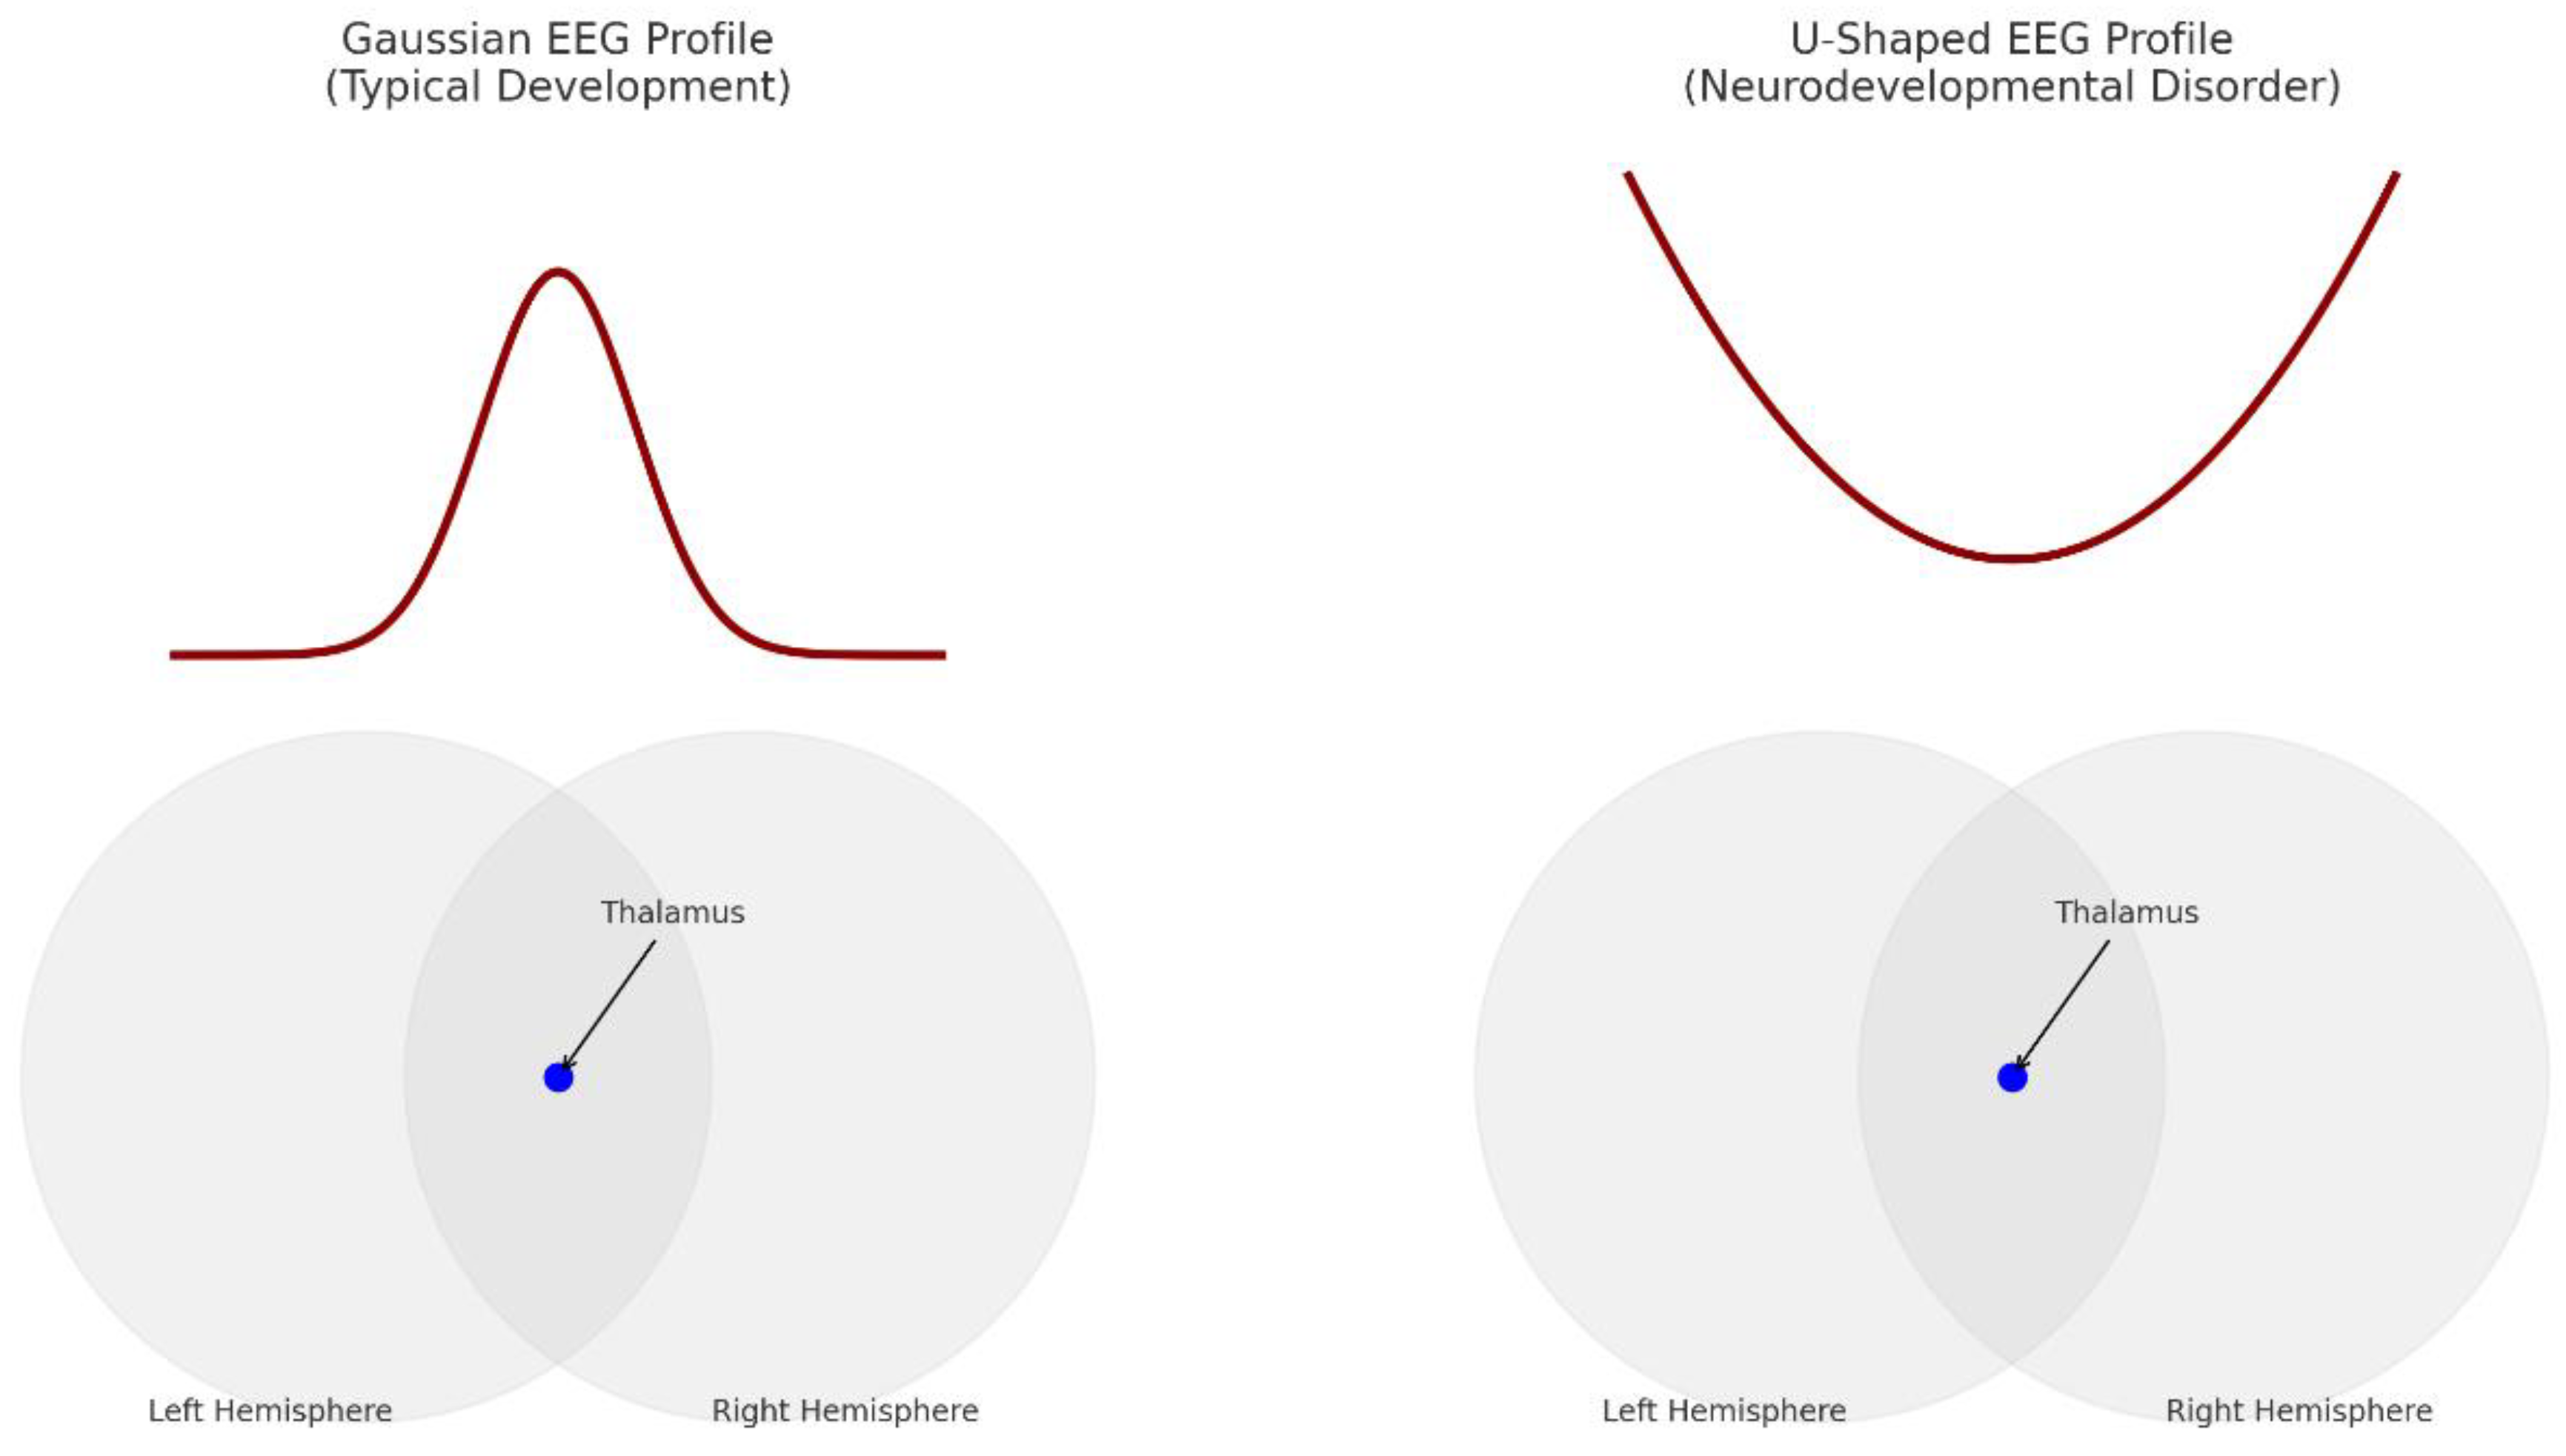
Table 2.
Neurobiological Mechanisms Underlying the Transition from Gaussian to U-Shaped EEG Power Profiles.
Table 2.
Neurobiological Mechanisms Underlying the Transition from Gaussian to U-Shaped EEG Power Profiles.
| Neurobiological Mechanism | Gaussian State | Parabolic (U-Shaped) State | EEG Spectral Manifestation |
|---|---|---|---|
| Thalamocortical Synchronization | Dominant alpha rhythm | Decreased alpha; increased theta and gamma activity | Mid-frequency ↓, Peripheral frequencies ↑ |
| GABAergic Inhibition (E/I Balance) | Balanced excitation/inhibition | Disinhibition → local circuit hyperactivity | Alpha/beta ↓, Gamma ↑ |
| Interhemispheric Connectivity | Intact corpus callosum links | Weakened callosal integration | Reduced mid-frequency coherence |
| Developmental Maturation | Alpha power increases with age | Impaired alpha development; immature oscillatory profile | No Gaussian peak formed |
Note. This table summarizes how specific neural circuit alterations can shift EEG power from a centrally organized Gaussian profile to a U-shaped distribution, particularly in neurodevelopmental disorders such as ASD and dyslexia.
7. Conclusions
Knowing the change from a bell-shaped to a U-shaped EEG pattern uncovers important new pathophysiology of ASD. It shows not just changed growth paths and neurotransmitter abnormalities but also broken connection patterns. Clinically, such EEG indicators could enable early detection and categorisation of ASD subgroups, hence providing chances for tailored treatments.
Future studies should concentrate on confirming the predictive potential of U-shaped profiles longitudinally, investigating treatments meant to restore normal spectral balance, and combining EEG biomarkers with genetic and behavioural data for thorough ASD phenotyping.
Recent advancements in neuroimmunology provide promising evidence that atypical EEG profiles—such as the U-shaped distribution frequently seen in ASD—may not be permanent, but instead indicate a reversible condition of neuroinflammatory imbalance. Chronic immunological dysregulation leads to microglial overactivation, which disrupts thalamocortical communication, impairs the excitation-inhibition balance, and amplifies low- and high-frequency oscillations. Experimental and clinical research indicate that restoring immunological homeostasis—via nutritional interventions, anti-inflammatory therapy, stress reduction, or regulation of the gut-brain axis—can normalise cortical rhythms and facilitate synaptic repair. In developing brains, characterised by significant neuroplasticity, immune regulation may not only prevent EEG degradation but also facilitate a return to Gaussian-like, healthy oscillatory patterns. These findings offer an optimistic perspective: what seems to be structural EEG dysfunction may, in part, be a dynamic and amenable process.
References
- Başar, E. (2012). Brain-Body-Mind in the Nebulous Cartesian System: A Holistic Approach by Oscillations. Springer.
- Buzsáki, G. (2006). Rhythms of the Brain. Oxford University Press.
- Dickinson, A., DiStefano, C., Senturk, D., & Jeste, S. S. (2018). Peak alpha frequency is a neural marker of cognitive function across the autism spectrum. European Journal of Neuroscience, 47(6), 643-651. [CrossRef]
- Edgar, J. C., Khan, S. Y., Blaskey, L., et al. (2015). Neuromagnetic Oscillations Predict Evoked-Response Latency Delays and Core Language Deficits in Autism Spectrum Disorders. Journal of Autism and Developmental Disorders, 45(2), 395-405. [CrossRef]
- Hughes, S. W., & Crunelli, V. (2005). Thalamic mechanisms of EEG alpha rhythms and their pathological implications. The Neuroscientist, 11(4), 357-372. [CrossRef]
- Just, M. A., Cherkassky, V. L., Keller, T. A., & Minshew, N. J. (2004). Cortical activation and synchronization during sentence comprehension in high-functioning autism: Evidence of underconnectivity. Brain, 127(8), 1811-1821. [CrossRef]
- Klimesch, W. (1999). EEG alpha and theta oscillations reflect cognitive and memory performance: a review and analysis. Brain Research Reviews, 29(2-3), 169-195. [CrossRef]
- Llinás, R. R., Ribary, U., Jeanmonod, D., Kronberg, E., & Mitra, P. P. (1999). Thalamocortical dysrhythmia: A neurological and neuropsychiatric syndrome characterized by magnetoencephalography. PNAS, 96(26), 15222-15227. [CrossRef]
- Orekhova, E. V., Stroganova, T. A., Nygren, G., et al. (2007). Excess of high frequency electroencephalogram oscillations in boys with autism. Biological Psychiatry, 62(9), 1022-1029. [CrossRef]
- Robertson, C. E., Ratai, E. M., & Kanwisher, N. (2016). Reduced GABAergic action in the autistic brain. Current Biology, 26(1), 80-85. [CrossRef]
- Rubenstein, J. L., & Merzenich, M. M. (2003). Model of autism: increased ratio of excitation/inhibition in key neural systems. Genes, Brain and Behavior, 2(5), 255–267. [CrossRef]
- Tierney, A. L., Gabard-Durnam, L., Vogel-Farley, V., Tager-Flusberg, H., & Nelson, C. A. (2012). Developmental trajectories of resting EEG power: An endophenotype of autism spectrum disorder. PloS One, 7(6), e39127. [CrossRef]
- Travers, B. G., Adluru, N., Ennis, C., et al. (2012). Diffusion tensor imaging in autism spectrum disorder: a review. Autism Research, 5(5), 289–313. [CrossRef]
- Uhlhaas, P. J., & Singer, W. (2012). Neuronal dynamics and neuropsychiatric disorders: Toward a translational paradigm for dysfunctional large-scale networks. Neuron, 75(6), 963-980. [CrossRef]
- Wang, J., Barstein, J., Ethridge, L. E., et al. (2013). Resting-state EEG abnormalities in autism spectrum disorders. Journal of Neurodevelopmental Disorders, 5(1), 24. [CrossRef]
- Wang, Y. et al. (2023). EEG alterations in autism spectrum disorder: A meta-analysis. Translational Psychiatry, 13, 153.
Disclaimer/Publisher’s Note: The statements, opinions and data contained in all publications are solely those of the individual author(s) and contributor(s) and not of MDPI and/or the editor(s). MDPI and/or the editor(s) disclaim responsibility for any injury to people or property resulting from any ideas, methods, instructions or products referred to in the content. |
© 2025 by the authors. Licensee MDPI, Basel, Switzerland. This article is an open access article distributed under the terms and conditions of the Creative Commons Attribution (CC BY) license (http://creativecommons.org/licenses/by/4.0/).
Copyright: This open access article is published under a Creative Commons CC BY 4.0 license, which permit the free download, distribution, and reuse, provided that the author and preprint are cited in any reuse.


