
Submitted:
22 April 2025
Posted:
06 May 2025
You are already at the latest version
Abstract
Herbal Melanin (HM) is a potent anticancer drug, biological effects and underlying molecular mechanisms was investigated, and the related signaling pathways, using human colon cell lines. To evaluate the impact of various concentrations of HM on cell migration, invasion and tumorigenicity, a real-time cell analyzer instrument and colony formation assays were employed, respectively. Angiogenesis-related protein array was also used and the levels of protein expression contributing to colony formation and extracellular proteolysis-driven cell migration and invasion, such as E-cadherin, N-cadherin and urokinase-type plasminogen activator receptor (uPAR) were monitored using Western blotting and RT-qPCR technologies. HM significantly decreased CRC cell motility, invasiveness and formation of colonies, associated with E-cadherin upregulation and N-cadherin downregulation. In addition, HM specifically inhibited uPAR expression levels, which were also decreased by the pharmacological mitogen-activated protein kinase (MEK) inhibitor UO126 and Jun N-terminal kinase (JNK) inhibitor SP600125, in both CRC cell lines. Addition of HM to cells pretreated with JNK and MEK inhibitors attenuated the blockade of JNK and ERK phosphorylation, alleviated HM-downregulated uPAR expression and HM-inhibited mCRC cell migration. In conclusion, our in vitro studies demonstrate that HM exhibits an inhibitory effect on CRC migration and invasiveness, associated with uPAR downregulation through JNK and ERK pathways.
Keywords:
colorectal cancer
; herbal melanin
; urokinase-type plasminogen activator receptor
; epithelial-mesenchymal transition
Introduction
Colorectal cancer (CRC) is the fourth most common cause of cancer-related deaths globally and a potentially fatal disease of the digestive tract [1]. Patient deaths are primarily caused by the relentless growth of CRC cells and their infiltration into the adjacent tissue or to distant organs, facilitated by metastasis, a multi-step process involving cancer cell motility and invasion. It has been reported that metastases occur in 25% of patients at the time of their initial diagnosis, and a comparable percentage of patients experience metastases as their disease progresses [2,3]. Excision is the treatment of choice for colon wall tumors (stages I and II) and adjuvant chemotherapy combined with surgery is the treatment of choice for about 73% of CRCs (stage III) with lymph node metastases [4]. Chemotherapy has increased patient survival rates more recently, but tumors that have spread via metastasis to distant locations are frequently incurable [5]. Therefore, in order to identify possible targets for early CRC diagnosis, recurrence, and metastasis, it is imperative that the molecular mechanisms underlying the occurrence, development, and progression of CRC be thoroughly investigated.
Numerous tissue remodeling-related proteins, such as the cell surface urokinase-type plasminogen activator receptor (uPAR), are involved in the growth and progression of tumors [6,7,8]. Tissue remodeling, inflammation, and numerous cancer types - brain cancer [9], gastric cancer [10,11], prostate cancer [12,13], bladder cancer [14,15], melanoma [16], breast cancer [17,18], and colon cancer [19] - all show increased expression levels of uPAR gene. Furthermore, invasive tumors also exhibit high expression of uPA [20]. A plethora of signals are mediated by uPAR and result in the stimulation of tumor-related glycolysis,, tumor cell proliferation, tumor microenvironment and angiogenesis (i.e., new blood vessel formation from pre-existent ones), and metastasis, contributing to tumor angiogenesis and subsequently tumor progression [21,22,23]. The interaction between uPA and uPAR has the potential to stimulate oncogene expression and cell mitosis, ultimately resulting in the tumor growth [24]. The CRISPR/Cas9 system-mediated uPAR gene knockout in cancer cells inhibits the growth, migration and invasion of cancer cells [25]. In CRC, PIK3CA and KRAS mutations delay the development of cancer hallmarks, but only when uPAR expression level on cell surface is reduced [26]. Targeting uPAR has become an emerging anticancer therapeutic strategy leading to the development of novel anticancer compounds, including peptide inhibitors, small inhibitors, bioengineered drugs, and natural products [27,28].
Melanin is a group of tyrosine-based natural pigments composed of indole polymers generically named as allomelanin, produced in the plants and as eumelanin, pheomelanin, and neuromelanin, produced in animals and microorganisms [29]. Animal melanin is biosynthesized in melanosomes, specialized organelles in skin cells and hair follicles called melanocytes [30]. Melanins and particularly, herbal melanin (HM), a dark pigment obtained from the seed coat of the Mediterranean plant Nigella sativa L., exhibit numerous protective activities, including antioxidant, anti-inflammatory, immuno-modulatory, hypoglycemic, and anti-tumorigenic [31]. Various in vitro anticancer activities of HM have been reported against hematological malignancies such as human acute monocytic leukemia [32] and solid tumors such as breast and colorectal cancer through decrease of cell growth by apoptosis induction and modulation of mitogen-activated protein kinase (MAPK) signaling through its main receptor toll-like receptor (TLR)4 [33,34]. Additionally, from cultured human monocytes and peripheral blood mononuclear cells (PBMCs), HM has been shown to modulate the cytokine production of vascular endothelial growth factor, a well-known pro-angiogenic growth factor, tumor necrosis factor-alpha, and interleukin-6 [35]. Therefore, here, we studied the potential HM effect on other angiogenesis-related proteins, such as uPAR, using CRC cell lines, HT29 as a model of colorectal adenocarcinoma and SW620, as a model of metastatic CRC (mCRC). The main cellular events responsible for cancer progression and tumorigenesis were explored, as well as the associated signaling pathways.
Materials and Methods
Cell Culture and Treatment
The human colorectal adenocarcinoma cell line HT29 (#HTB-38) and mCRC cell line SW620 (#CCL-227) purchased from American Type Culture Collection (ATCC, Manassas, VA, USA) were cultured in 10% heat-inactivated fetal bovine serum (HI-FBS, Thermo Fisher Scientific, Waltham, MA, USA), 100 μg/ml streptomycin, 100 IU/ml penicillin, and 2 mmol/l l-glutamine added to Dulbecco’s modified Eagle medium (DMEM, Invitrogen, Thermo Fisher Scientific). The cells were cultured in a 5% CO2-incubator at 37°C with a humidified air. Using enzymatic digestion with 0.05% trypsin/0.02% ethylenediaminetetraacetic acid (EDTA) and splitting the cells into 1:2 or 1:3 ratios, the cells were passaged every 2 to 3 days until confluence. Throughout the investigation, the cells were employed between passages 5 and 9.
HT29 and SW620 cells were exposed to various concentrations of HM, with or without the pharmacological Jun N-terminal kinase (JNK) inhibitor SP600125 (#S5567, Sigma-Aldrich, Saint Louis, MO, USA) or the pharmacological MAPK kinase (MEK) inhibitor UO126 (#662005, Sigma-Aldrich). From pilot studies, tested at serial concentrations (2.5 μM, 5 μM, 10 μM and 20 μM) of pharmacological inhibitors, the optimal concentration of SP600125 and UO126 was found to be 10 μM.
Clonogenic Assay
HT29 and metastatic SW620 CRC cells (500 per well) were cultured in 6-well plates. The next day, the cells were treated with HM (50, 100, and 200 µg/ml) for 24 hours of incubation. For 14 days, the frequency of medium replacement was every other day, duration required for the formation of colonies. After that, the cells were thoroughly rinsed with phosphate-buffered saline (PBS), fixed with 70% ethanol, and the colonies were stained with 0.5% crystal violet.
Cell Migration and Invasion Assays Using xCELLigence Real-Time Cell Analysis
To evaluate the HM effect on the ability of CRC cell motility and invasiveness over the time, the xCELLigence Real-time Cell Analyzer Dual Purpose (RTCA-DP) instrument was employed as advised by the manufacturer (ACEA Biosciences Inc., Santa Clara, CA, USA). For the cell motility assessment, a 16-well Cellular Invasion/Migration plate (#CIM-16, Roche Diagnostics GmbH, Mannheim, Germany) was used. The CIM-16 plate contained two chambers, the lower chamber was filled with complete medium (supplemented with 10% HI-FBS) and the upper chamber filled with serum-free medium to hydrate the membrane. The CIM-16 plates were placed on the RTCA-DP machine station after the incubation period, but before the cells were added. The baseline measurement step was carried out against the background signal produced by cell-free medium. Following a count of HT29 and SW620 cells, 12,000 cells were seeded into the upper chamber’s wells. The cell migration was calculated using the gold microelectrode plated on the underside of the upper chamber membrane to record changes in electrical impedance. The number of cells migrating to the membrane’s underside increases in direct proportion to the increase in impedance. The related RTCA software 1.2.1 (ACEA Biosciences Inc.) was utilized for plotting and calculating the cell index values. After that, for 200 hours, the cell index curves were recorded every 15 minutes to evaluate cell migration. Using the xCELLigence system and CIM-16 plate, the same protocol was applied for the cell invasion assay; however, the upper chamber was coated with Matrigel™, a reconstituted basement membrane (#356234, Becton Dickinson Biosciences, Franklin Lakes, NJ, USA).
Angiogenesis-Related Protein Array
CRC cell lysates were subjected to the Human Angiogenesis Antibody Array kit (#ab193655, Abcam, Cambridge, MA, USA) as per the recommendations of the manufacturer. Briefly, HT29 and metatatic SW620 CRC cells were lysed and the amount of proteins was estimated using bicinchoninic (BCA) protein assay on SmartSpec™ Plus spectrometer (Bio-Rad Laboratories, Hercules, CA, USA). The provided membranes conjugated with proteins were saturated with blocking buffer (#ab193655, Abcam) for 30 minutes at room temperature (RT). Following incubation, a volume equivalent to protein sample was added to half of the blocking buffer, and the mixture was then incubated for 1.5–5 hours at RT. After another 1.5–2-hours at RT, the membranes were washed and conjugated with a biotinylated antibody cocktail. After that, the membranes were washed and incubated for 2 hours at RT with streptavidin conjugated with horseradish peroxidase (HRP). The membranes were then incubated with detection buffer (#ab193655, Abcam), and a luminescent image analyzer (Amersham™ Imager 680, Agilent Technologies, Santa Clara, CA, USA) was used to detect the chemiluminescence signals (#ab193655, Abcam). The C-DiGit™ Blot Scanner (LI-COR Biosciences, Lincoln, NE, USA) was used to quantify the signal intensity, and LI-COR Image Studio™ software was used to take and process the images. Data quantification was performed using SigmaPlot.
Whole Cell Lysates and Western Blotting
Using the Bradford Protein assay kit (Bio-Rad laboratories), whole cell lysates were prepared in radioimmunoprecipitation assay (RIPA) lysis buffer (Boston Bio Products, Ashland, MA, USA). The protein concentration was then measured. Using the Bio-Rad Trans-Blot® Turbo™ transfer system, equal quantities of cell lysate proteins were loaded and electrophoresed on 4–20% Mini-Protean TGX precast gels (Bio-Rad Laboratories) before being transferred to a nitrocellulose transfer membrane (0.22 μm). Bio-Rad blotting grade blocker, 5% skimmed milk and PBS containing 0.1% Tween-20 (PBST) were used to block the membranes for 1 hour at RT. The membranes were then washed twice with PBST. The following primary antibodies were used to probe the membranes for an entire night at 4°C. They were directed against: E-cadherin (#ab231303, 1:1000 dilution, Abcam), N-cadherin (#ab211126, 1:1000 dilution, Abcam), uPAR (#MA5-23853, 1:1000 dilution, Invitrogen), phospho(p)JNK (#sc-517383, 1:1,000 dilution, Santa Cruz biotechnology, Dallas, TX, USA), phospho-extracellular signal-regulated kinase (pERK, #sc-377400, 1:1,000 dilution, Santa Cruz Biotechnology) and β-actin (#sc-47778, 1:1000 dilution, Santa Cruz Biotechnology). Subsequently, immunoreactivity was visualized by chemiluminescence detection using Clarity Western ECL Substrate (#1705061, Bio-Rad Laboratories) after exposing the probed membranes to goat anti-mouse IgG (H+L) secondary antibodies (#31430; 1:20000 dilution, Invitrogen). Images were captured with LI-COR C-DiGit™ Blot Scanner and analyzed using LI-COR Image Studio™ software.
RNA Extraction and Reverse-Transcription Polymerase Chain Reaction (RT-PCR)
After harvesting non-treated and treated HT29 and metastatic SW620 CRC cells, whole RNA was extracted using the Ambion® RecoverAll™ Total Nucleic Acid Isolation Kit (#AM1975, Invitrogen). Using an ultraviolet spectrophotometer, the A260/280 ratio (1.8-2.0) was measured to determine the purity of total RNA. RNAse-free DNA enzyme (#AM2224, Ambion®, Austin, TX, USA) was used to treat RNA samples in order to eliminate genomic DNA contamination. A set of commercially available High-Capacity complementary DNA (cDNA) Reverse Transcription kits (#4368814, Applied Biosystems, Thermo Fisher Scientific) was used to carry out the reverse transcription reaction. Using random hexamer primers, 2 μg of total RNA was converted to cDNA. The mixture was prepared as follows: 10 minutes at 25°C, 2 hours at 37°C, 5 minutes at 85°C on a PCR thermocycler Gene (Applied Biosystems) and kept at 4°C. A final concentration of 5 ng/μl of diluted cDNA served as a template for the PCR preparation process. PCR samples were generated using an iScript One-step RT-PCR kit with SYBR® Green (#1725120, Bio-Rad Laboratories) and visualized on a LightCycler® real-time PCR system (Roche Diagnostics, Basel, Switzerland). To determine the relative quantification of PCR products, the 2-ΔΔCT method was utilized. The levels of expression of E-cadherin, N-cadherin and uPAR genes were measured relative to the expression level of glyceraldehyde 3-phosphate dehydrogenase (GAPDH) gene. Table 1 lists the primer sequences that were used.
Statistical Analysis
The three separate experiments’ mean and standard deviation (SD) are displayed as the results. The one-way ANOVA statistical test was used to examine the difference between the control and treated groups, and the Student’s t-test was utilized for statistical analysis. The p-values that were below 0.05 were deemed statistically significant.
Results
HM decreases CRC cell motility, invasiveness and inhibits colony formation associated with differential effects on epithelial-mesenchymal transition (EMT) marker expression
After reporting the antiproliferative properties of HM in both CRC cell lines HT29 and SW620 (33), an evaluation of potential inhibitory activities of HM on CRC progression was worth investigating. Thus, tested at same concentrations (50, 100, and 200 μg/ml), HM effects were assessed on CRC cell migration and invasion using an automated cell analyzer. Compared to untreated cells, HM significantly decreased HT29 cell migration by 25% (p = 0.047) and 40% (p = 0.0038) at 50-100 and at 200 μg/ml, respectively (Figure 1A). Surprisingly, the migration rate of mCRC SW620 cells with a cell index of 0.5 was found to be a quarter slower than that of HT29 cells, displaying a cell index of 2.0 (Figure 1A). Unlike HT29 cells, HM significantly reduced SW620 cell migration by 90% (p < 0.001) and 70% (p = 0.004) at 50-100 and 200 μg/ml, respectively, compared to untreated cells (Figure 1A). Regarding cell invasion, the invasion rate of HT29 cells with a cell index of 3.5 was observed to be higher than that of SW620 cells, displaying a cell index of 1.5 (Figure 1B). Compared to untreated cells, HM drastically inhibited, in a dose-dependent manner, HT29 cell invasion (-26.4%, p = 0.042 at 50 μg/ml; -85.3%, p = 0.00041 at 100 μg/ml; -95%, p = 0.00003 at 200 μg/ml of HM) and SW620 (-53%, p = 0.0039 at 50 μg/ml; -68.75%, p = 0.0036 at 100 μg/ml; -95%, p = 0.000029 at 200 μg/ml of HM) cell invasion (Figure 1B). The tumorigenic potential of HM was evaluated using an assay for colony formation. Tested at the highest concentrations, HM significantly inhibited in a dose-dependent manner, the formation of colonies using HT29 (-55%, p = 0.0038 at 100 μg/ml; -88%, p = 0.00042 at 200 μg/ml of HM) and SW620 (-80%, p = 0.00029 at 100 μg/ml; 90%, p = 0.00001 at 200 μg/ml of HM) cells (Figure 1C). Epithelial-mesenchymal transition (EMT) protein markers such as epithelial E-cadherin and mesenchymal N-cadherin play a major role in the tumorigenic potential of cancer cells, therefore their expression levels were monitored in CRC cells treated with 100 μg/ml of HM, using Western blot technology. The E-cadherin expression level significantly increased in HT29 cells treated with HM (1.25-fold, p = 0.046) and HM-treated SW620 cells (1.35-fold, p = 0.045), while N-cadherin expression level decreased in HT29 cells treated with HM (0.7-fold, p = 0.039) and HM-treated SW620 cells (0.35-fold, p = 0.001), compared to the control, the untreated cells (Figure 1D). Using RT-qPCR assays, HM-induced E-cadherin upregulation and N-cadherin downregulation were also observed in regard with the expression level of the genes, compared to the control (Figure 1E).
HM Downregulates uPAR Expression Level Through JNK and ERK Pathways
CRC progression, including cell migration and invasion, mainly requires tissue microenvironment remodeling caused by various extracellular proteolysis-related mechanisms, including the uPAR/uPA system. Using a human angiogenesis antibody array for detection of 23 angiogenesis-related proteins, uPAR was the only protein visualized in the lysates of HT29 and SW620 cells after cell exposure in the presence or absence of HM tested at 100 μg/ml. Compared to the control, a significant decrease in uPAR expression level by 0.2-fold (p = 0.0009) and 0.15-fold (p = 0.000098) was noticed in HT29 and SW620 cells treated with HM, respectively (Figure 2A). Using Western blotting and RT-qPCR assays, HM significantly decreased uPAR protein (-40%, p=0.0042 for HT29; -60%, p=0.001 for SW620) and transcript (-30%, p=0.049 for HT29; -50%, p=0.0046 for SW620) expression levels in both CRC cell lines, compared to the control (Figure 2B,C).
To investigate the signaling pathways involved in HM-downregulated uPAR expression, two major oncogenic MAPK pathways, JNK and ERK, widely known to modulate uPAR expression and oncogenic functions [36,37], were studied. Compared to untreated cells, HM significantly increased JNK phosphorylation (2.0-fold, p < 0.01, Figure 3A) while decreased ERK phosphorylation (0.4-fold, p < 0.01, Figure 3B) in both CRC cell lines. Specific pharmacological inhibitors of JNK and MEK named SP600125 and UO126, respectively, were tested at the optimal concentration, determined by pilot studies for blocking the phosphorylation of JNK and ERK in both CRC cells. Compared to the significant reduction in JNK phosphorylation levels (~0.3-fold, p < 0.001, Figure 3A) and ERK (~0.4-fold, p < 0.01, Figure 3B) detected in HT29 and SW620 cells, HM significantly attenuated JNK and ERK phosphorylation blockade caused by both pharmacological inhibitors in the CRC cell lines (Figure 3). Regarding the uPAR protein expression level, JNK pharmacological inhibitor SP600125 significantly decreased uPAR (-0.45-fold, p < 0.001) to the same extent as HM tested at 100 μg/ml, compared to the control (Figure 4A). While UO126 (0.2-fold, p < 0.001) significantly inhibited uPAR to the same extent as HM in SW620 cells, a lesser decrease in uPAR expression level was observed after addition of UO126 (0.4-fold, p = 0.0049) than the level of uPAR detected in HM-treated HT29 cells (Figure 4B).
At the functional level, focusing on mCRC cell line SW620, real-time cell migration was recorded after cell exposure to SP600125 and UO126 with or without HM. Compared to the control, both SP600125 and UO126 significantly decreased by 20% (p < 0.05) SW620 cell migration (Figure 5). The strongest inhibition of SW620 cell migration caused by HM tested at 100 μg/ml was alleviated after cell pre-treatment with SP600125 and UO126 (Figure 5).
Discussion
The search for new anticancer natural products against CRC progression has attracted more and more intensive research interests [38,39]. Among them, HM that was extracted from the black seed coat of Nigella sativa L. exhibits multiple properties with promising beneficial effects in clinical practice, including its antiproliferative effects in colorectal adenocarcinoma and mCRC cell lines via induction of apoptosis, which minimizes inflammation and reduces side effects [33,34]. The main cellular events implicated in CRC progression includes cell migration and invasion driven by extracellular/cell surface proteolysis, involving the uPA/uPAR system [37]. Sustained uPAR expression has also been associated with tumor angiogenesis, a complex process contributing to tumor spread, drug resistance, and subsequently cancer recurrence. To combat the progression of CRC, the development of various drugs inhibiting or suppressing uPA/uPAR systems has emerged [27,28]. In the present study, HM suppressed uPAR expression, suggesting that HM is a potential uPAR inhibitor for the treatment of CRC among other natural products tested in clinical trials such as polyphenolic phytoalexin resveratrol [40,41]. The investigation of the signaling pathways involved in HM-downregulated uPAR expression revealed, by blocking the JNK and MEK pathways using their specific pharmacological inhibitors, an attenuation of HM-suppressed uPAR expression and HM-inhibited mCRC cell migration. Altogether, this current study demonstrated that HM could inhibit CRC progression by suppressing uPAR expression through JNK and ERK pathways, suggesting that HM is a promising uPAR inhibitor.
Having being extensively studied for its antiproliferative effects in CRC cell lines through apoptosis induction and MAPK signaling modulation via its main receptor TLR4 [33,34], it was crucial to evaluate HM effects on CRC progression. To assess the in vitro biological impact of HM on CRC progression, an automated cell analyzer system recording the migration and invasion of colon adenocarcinoma HT29 and metastatic SW620 CRC cell lines was employed. At the various concentrations tested (50, 100, and 200 μg/ml), HM inhibited both CRC progression-driven cellular events (i.e., migration and invasion) and reduced the colony formation assay, which was linked with an induction of epithelial EMT marker E-cadherin expression and a decrease in mesenchymal EMT marker N-cadherin expression levels. These HM antitumor effects described in this current study are consistent with anticancer drugs leading to drastic delay in cancer cell migration, invasion, and colony formation accompanied by reverse expression of EMT proteins, upregulating epithelial markers while decreasing mesenchymal markers [42,43]. Associated signaling pathways were also investigated and revealed the role of AMP-activated protein kinase (AMPK)/nuclear factor (NF)-B and transcriptional coactivator bearing PDZ-binding motif (TAZ) in the antitumor activities of natural anticancer drugs [42,43]. In addition to the activation of NF-B, a downstream effector of TLR4 and which has been demonstrated to mediate HM anti-inflammatory effects [44], these signaling pathways, particularly TAZ and AMPK, could also be investigated in antitumor effects of HM in CRC. Very little research activity has been conducted on HM; however, various types of melanins from different origins such as bacteria (i.e., Streptomyces glaucescens, Pseudomonas strains) and microneedle patches, have exhibited anticancer activities in HFB4 skin cancer cells and in mice bearing melanoma and breast carcinoma [45,46]. Furthermore, HM and natural melanins are oligomeric nano-aggregate polymers with interesting physical properties as photoreceptors and electron transfer agents, presenting photo-protective and radio-protective potentials, suggesting a promising beneficial impact of melanin for cancer prevention and treatment in clinical practice.
Cancer progression, which exhibits dramatic features changes, including high cell motility, surrounding tissue invasion, tumor microenvironment adaptation, survival in bloodstream, and chemoresistance, occurs mainly through extracellular/cellular proteolysis, principally mediated by the uPA/uPAR system [47]. Thus, uPAR becomes a crucial therapeutic anticancer target leading to the development of uPAR inhibitors, including engineered drugs, synthetic or even natural compounds [27,28]. In this current study, HM suppressed uPAR expression through ERK and JNK MAPK pathways in CRC cell lines HT29 and SW620. These MAPK pathways have been demonstrated to be involved in transcription factor activator protein 1 (AP1)-mediated uPAR gene expression in metastatic cancer [36,48]. A wide variety of natural anticancer compounds have emerged as suppressors of uPAR expression, such as resveratrol through ERK1/2 downstream effector of EGFR, docosahexaenoic acid (DHA) via heme oxygenase-1, and ursolic and oleanolic acids in a matrix metalloproteinase (MMP)-dependent pathway [49,50,51]. Recently, an albumin-based drug carrier targeting uPAR was reported to show promising anticancer progression in hepatoma H22-bearing mice [52]. Furthermore, it has been mentioned that melanin and melanin-functionalized nanoparticles exhibit beneficial anticancer properties with radioprotective effects [53]. Through this current study, the demonstration of suppression of uPAR gene expression by HM may open new avenues for the development of HM-based drug carriers targeting uPAR, which could improve the treatment modalities against CRC progression.
Conclusion
Anti-oncogenic HM added to CRC cells pretreated with JNK and MEK inhibitors attenuated the blockade of JNK and ERK phosphorylation, alleviated HM-downregulated uPAR expression, and HM-inhibited mCRC cell migration. Overall, our in vitro studies demonstrate that HM exhibits an inhibitory effect on CRC migration and invasiveness, associated with uPAR downregulation through JNK and ERK pathways, suggesting HM as a promising uPAR inhibitor against invasive cancer cells.
Acknowledgments
This work was supported by the Deanship of Scientific Research, King Saud University, for funding through the Vice Deanship of Scientific Research Chairs. We would like to extend our appreciation to Prof. Adil Haseeb, University of Khartoum, Sudan and Prof. Adila El-Obeid, Ahfad University, Sudan for providing Herbal Melanin.
Funding
This work was supported by the Deanship of Scientific Research, King Saud University, for funding through the Vice Deanship of Scientific Research Chairs.
Availability of Data and Materials
The data generated in the present study may be requested from the corresponding author and all materials described in the manuscript.
Author Contributions
M-HA, M-AV-M and AAZ conceptualized the idea, designed and performed the experiments, analyzed the data, and wrote the manuscript. SM-N, NSA, AZ, AOO and TT were involved in interpretation. All authors reviewed and approved the manuscript.
Ethical Approval and Consent to Participate
Not applicable.
Patient Consent for Publication
Not applicable.
Conflicts of Interest
The authors declare that the research was conducted in the absence of any commercial or financial relationships that could be construed as potential conflicts of interest.
References
- Sung H, Ferlay J, Siegel RL, et al. Global Cancer Statistics 2020: GLOBOCAN Estimates of Incidence and Mortality Worldwide for 36 Cancers in 185 Countries. CA Cancer J Clin 2021, 71:209-49. [CrossRef]
- Ferlay J, Colombet M, Soerjomataram I, et al. Estimating the global cancer incidence and mortality in 2018: GLOBOCAN sources and methods. Int J Cancer 2019, 144:1941-53. [CrossRef]
- Wang, N. Interpretation on the report of Global Cancer Statistics 2018. Journal of Multidisciplinary Cancer Management (Electronic Version) 2019, 5:87-98.
- Liu Z, Xu Y, Xu G, et al. Nomogram for predicting overall survival in colorectal cancer with distant metastasis. BMC Gastroenterol 2021, 21:103. [CrossRef]
- Guo K, Feng Y, Yuan L, et al. Risk factors and predictors of lymph nodes metastasis and distant metastasis in newly diagnosed T1 colorectal cancer. Cancer Med 2020, 9:5095-113. [CrossRef]
- Lv T, Wu X, Sun L, Hu Q, Wan Y, Wang L. et al. p53-R273H upregulates neuropilin-2 to promote cell mobility and tumor metastasis. Cell death & disease 2017, 8:e2995. [CrossRef]
- Hu L, Liang S, Chen H, Lv T, Wu J, Chen D. et al. DeltaNp63alpha is a common inhibitory target in oncogenic PI3K/Ras/Her2-induced cell motility and tumor metastasis. Proc Natl Acad Sci U S A 2017, 114:E3964–e73. [CrossRef]
- Lv T, Lv H, Fei J, Xie Y, Lian D, Hu J. et al. p53-R273H promotes cancer cell migration via upregulation of neuraminidase-1. Journal of Cancer 2020, 11:6874–82. [CrossRef]
- Mohanam S, Sawaya RE, Yamamoto M, Bruner JM, Nicholson GL, Rao JS. Proteolysis and invasiveness of brain tumors: role of urokinase-type plasminogen activator receptor. J Neurooncol 1994, 22:153–60. [CrossRef]
- Yonemura Y, Nojima N, Kawamura T, Ajisaka H, Taniguchi K, Fujimura T. et al. Correlation between expression of urokinase-type plasminogen activator receptor and metastasis in gastric carcinoma. Oncol Rep 1997, 4:1229–34. [CrossRef]
- Park JS, Park JH, Khoi PN, Joo YE, Jung YD. MSP-induced RON activation upregulates uPAR expression and cell invasiveness via MAPK, AP-1 and NF-κB signals in gastric cancer cells. Carcinogenesis 2011, 32:175–81. [CrossRef]
- Li Y, Cozzi PJ. Targeting uPA/uPAR in prostate cancer. Cancer Treat Rev 2007, 33:521–7.
- Ertongur S, Lang S, Mack B, Wosikowski K, Muehlenweg B, Gires O. Inhibition of the invasion capacity of carcinoma cells by WX-UK1, a novel synthetic inhibitor of the urokinase-type plasminogen activator system. Int J Cancer 2004 110:815–24.
- Hau AM, Leivo MZ, Gilder AS, Hu JJ, Gonias SL, Hansel DE. mTOR C2 activation is regulated by the urokinase receptor (uPAR) in bladder cancer. Cell Signal 2017, 29:96–106.
- Skovgaard D, Persson M, Brandt-Larsen M, Christensen C, Madsen J, Klausen TL. et al. Safety, Dosimetry, and Tumor Detection Ability of (68)Ga-NOTA-AE105: First-in-Human Study of a Novel Radioligand for uPAR PET Imaging. J Nucl Med 2017, 58:379–86.
- de Vries TJ, Quax PH, Denijn M, Verrijp KN, Verheijen JH, Verspaget HW. et al. Plasminogen activators, their inhibitors, and urokinase receptor emerge in late stages of melanocytic tumor progression. Am J Pathol 1994, 144:70–81.
- Del Vecchio S, Stoppelli MP, Carriero MV, Fonti R, Massa O, Li PY. et al. Human urokinase receptor concentration in malignant and benign breast tumors by in vitro quantitative autoradiography: comparison with urokinase levels. Cancer Res 1993, 53:3198–206.
- Huber MC, Mall R, Braselmann H, Feuchtinger A, Molatore S, Lindner K. et al. uPAR enhances malignant potential of triple-negative breast cancer by directly interacting with uPA and IGF1R. BMC Cancer 2016, 16:615. [CrossRef]
- Loosen SH, Tacke F, Püthe N, Binneboesel M, Wiltberger G, Alizai PH. et al. High baseline soluble urokinase plasminogen activator receptor (suPAR) serum levels indicate adverse outcome after resection of pancreatic adenocarcinoma. Carcinogenesis 2019 40:947–55. [CrossRef]
- Keer HN, Gaylis FD, Kozlowski JM, Kwaan HC, Bauer KD, Sinha AA. et al. Heterogeneity in plasminogen activator (PA) levels in human prostate cancer cell lines: increased PA activity correlates with biologically aggressive behavior. Prostate 1991, 18:201–14. [CrossRef]
- Tjwa M, Sidenius N, Moura R, Jansen S, Theunissen K, Andolfo A. et al. Membrane-anchored uPAR regulates the proliferation, marrow pool size, engraftment, and mobilization of mouse hematopoietic stem/progenitor cells. J Clin Invest 2009, 119:1008–18. [CrossRef]
- Laurenzana A, Chillà A, Luciani C, Peppicelli S, Biagioni A, Bianchini F. et al. uPA/uPAR system activation drives a glycolytic phenotype in melanoma cells. International journal of cancer 2017, 141:1190–200. [CrossRef]
- Laurenzana A, Fibbi G, Margheri F, Biagioni A, Luciani C, Del Rosso M. et al. Endothelial Progenitor Cells in Sprouting Angiogenesis: Proteases Pave the Way. Curr Mol Med 2015, 15:606–20. [CrossRef]
- Dass K, Ahmad A, Azmi AS, Sarkar SH, Sarkar FH. Evolving role of uPA/uPAR system in human cancers. Cancer Treat Rev 2008, 34:122–36. [CrossRef]
- Wang K, Xing ZH, Jiang QW, Yang Y, Huang JR, Yuan ML. et al. Targeting uPAR by CRISPR/Cas9 System Attenuates Cancer Malignancy and Multidrug Resistance. Frontiers in oncology 2019, 9:80. [CrossRef]
- Ahn SB, Mohamedali A, Pascovici D, Adhikari S, Sharma S, Nice EC. et al. Proteomics Reveals Cell-Surface Urokinase Plasminogen Activator Receptor Expression Impacts Most Hallmarks of Cancer. Proteomics 2019, 19:e1900026. [CrossRef]
- Maria Teresa Masucci, Michele Minopoli, Gioconda Di Carluccio et al. Therapeutic Strategies Targeting Urokinase and Its Receptor in Cancer. Cancers (Basel) 2022, Feb; 14(3): 498. [CrossRef]
- Xie S, Yang G, Wu J, Jiang L, Yuan C, Xu P, et al. In silico screening of natural products as uPAR inhibitors via multiple structure-based docking and molecular dynamic simulations. J Biomol Struct Dyn 2023, 18: 1-12. [CrossRef]
- El-Nagger NEA, Saber WIA. Natural melanin: Current trends, and future approaches, with especial reference to microbial source. Polymers 2022, 14(7): 1339.
- Alghamdi K, Alehaideb Z, Kumar A, Al-Eidi H, Alghamdi SS, Suliman R, et al. Stimulatory effects of Lycium shawii on human melanocyte proliferation, migration, and melanogenesis: In vitro and in silico studies. Front Pharmacol 2023, 14: 1169812. [CrossRef]
- ElObeid AS, Kama-Eldin A, Abdelhalim MAK, Haseeb AM. Pharmacological properties of melanin and its function in health. Basic Clin Pharmacol Toxicol 2017, 120(6): 515-522. [CrossRef]
- El-Obeid A, Alajmi H, Harbi M, Yahya WB, Al-Eidi H, Alaujan M, et al. Distinct anti-proliferative effects of herbal melanin on human acute monocytic leukemia THP-1 cells and embryonic kidney HEK293 cells. BMC Complement Med Ther 2020, 20(1): 154. [CrossRef]
- Omar Al-Obeed, Adila Salih El-Obeid, Sabine Matou-Nasri, Mansoor-Ali Vaali-Mohammed, et al. Herbal melanin inhibits colorectal cancer cell proliferation by altering redox balance, inducing apoptosis, and modulating MAPK signaling. Cancer Cell Int 2020, 20: 126. [CrossRef]
- Rajabathar JR, Al-Lohdan H, Arokiyaraj S, Mohammed F, Al-Dhayan DM, Faqihi NA, et al. Herbal melanin inhibits real-time cell proliferation, downregulates anti-apoptotic proteins and upregulates pro-apoptotic p53 expression in MDA-MB-231 and HCT-116 cancer cell lines. Medicina 2023, 59(12): 2061.
- El-Obeid A, Al-Harbi S, Al-Jomah N, Hassib A. Herbal melanin modulates tumor necrosis factor alpha (TNF-), interleukin 6 (IL-6) and vascular endothelial growth factor (VEGF) production. Phytomedicine 2006, 13(5): 324-333. [CrossRef]
- Sah DK, Khoi PN, Li S, Arjunan A, Jeong JU, Jung YD. Epigallocatechin-3-gallate prevents IL-1β-induced uPAR expression and invasiveness via the suppression of NF-B and AP-1 in human bladder cancer cells. Int J Mol Sci 2022, 23: 14008. [CrossRef]
- Ding Y, Niu W, Zheng X, Zhou C, Wang G, Fend Y, et al. Plasminogen activator, urokinase enhances the migration, invasion, and proliferation of colorectal cancer cells by activating the Src/ERK pathway. J Gastrointest Oncol 2022, 13(6): 3100-3111. [CrossRef]
- Huang XM, Yang ZJ, Xie Q, Zhang ZK, Zhang H, Ma JY. Natural product for treating colorectal cancer: A mechanistic review. Biomed Pharmacother 2019, 117: 109142. [CrossRef]
- Islam MR, Akash S, Rahman MM, Nowrin FT, Akter T, Shohag S, et al. Colon cancer and colorectal cancer: Prevention and treatment by potential natural products. Chem Biol Interact 2022, 368: 110170. [CrossRef]
- Honari M, Shafabakhsh R, Reiter RJ, Mirzaei H, Asemi Z. Resveratrol is a prominent agent for colorectal cancer prevention and treatment: focus on molecular mechanisms. Cancer Cell Int 2019, 19: 180. [CrossRef]
- Anwar MJ, Altaf A, Imran M, Amir M, Alsagaby SA, Al Abdulmonem W, et al. Anti-cancer perspectives of resveratrol: a comprehensive review. Food Agricultural Immunol 2023, 34: 1. [CrossRef]
- He J, Chen S, Yu T, Chen W, Huang J, Peng C, et al. Harmine suppresses breast cancer cell migration and invasion by regulating TAZ-mediated epithelial-mesenchymal transition. Am J Cancer Res 2022, 12(6): 2612-2626.
- Liang H, Chen Z, Yang R, Huang Q, Chen H, Chen W, et al. Methyl Gallate suppresses the migration, invasion, and epithelial-mesenchymal transition of hepatocellular carcinoma cells via the AMPK/NF/kB signaling pathway in vitro and in vivo. Front Pharmacol 2022, 13: 894285.
- Oberg F, Ahnfelt M, Ponten F, Westermark B, El-Obeid A. Herbal melanin activates TLR4/NF-kappaB signaling pathway. Phytomoedicine 2009, 16(5): 477-484. [CrossRef]
- El-Naggar NEA, Al-Ewasy SM. Bioproduction, characterization, anticancer and antioxidant activities of extracellular melanin pigment produced by newly isolated microbial cell factories Streptomyces glaucescens NEAE-H. Sci. Rep 2017, 7: 1-19.
- Ye Y, Wang C, Zhang X, Hu Q, Zhang Y, Liu Q, et al. A melanin-mediated cancer immunotherapy patch. Sci. Immunol 2017, 2: eaan5692. [CrossRef]
- Alamelu, G. Bharadwaj, Ryan W. Holloway, et al. Plasmin and Plasminogen System in the Tumor Microenvironment: Implications for Cancer Diagnosis, Prognosis, and Therapy. Cancers (Basel) 2021, Apr; 13(8): 1838. [CrossRef]
- Casalino L, Talotta F, Cimmino A, Verde P. The Fra-1/AP-1 oncoprotein: From the “undruggable” transcription factor to therapeutic targeting. Cancers (Basel) 2022, 14(6): 1480.
- Lian S, Li S, Sah DK, Kim NH, Lakshmanan VK, Jung YD. Suppression of urokinase-type plasminogen activator receptor by docosahexaenoic acid mediated by heme oxygenase-1 in 12-O-Tetradecanoyphorbol-13-acetate-induced human endothelial cells. Front. Pharmacol 2020, 11: 577302. [CrossRef]
- Piet M, Paduch R. Ursolic and oleanolic acids in combination therapy inhibit migration of colon cancer cells through down-regulation of the uPA/uPAR dependent MMPs pathway. Chem Biol Interact 2022, 368: 110202. [CrossRef]
- Uzawa K, Amelio AL, Kasamatsu A, Saito T, Kita A, Fukamachi M, et al. Resveratrol targets urokinase-type plasminogen activator receptor expression to overcome cetuximab-resistance in oral squamous cell carcinoma. Sci. Rep 2019, 9: 12179. [CrossRef]
- Li D, Liu S, Shan H, Conti P, Li Z. Urokinase plasminogen activator receptor (uPAR) targeted nuclear imaging and radionuclide therapy. Theranostics 2013, 3:507–15. [CrossRef]
- Iasmina Marcovici, Dorina Coricovac, et al. Melanin and Melanin-Functionalized Nanoparticles as Promising Tools in Cancer Research - A Review. Cancers (Basel) 2022, Apr; 14(7): 1838. [CrossRef]
Figure 1.
HM inhibits colony formation, cell motility and invasiveness in HT29 and SW620 cell lines. (A) In order to promote colony formation, HT29 and SW620 cells were incubated for 10-12 days at 37 °C alongside untreated HT29 and SW620 cells. Using a light microscope, the number of colonies was counted after applying crystal violet staining. xCELLigence RTCA-DP system was used to monitor real-time CRC cell migration (B) and invasion (C). (D) In HT29 and SW620 cell lines, HM increases the expression of E-cadherin and decreases N-cadherin. Whole cell lysates were subjected to immunoblotting using the designated antibodies directed against E-cadherin and N-cadherin. The bar graph shows the relative level of protein expression in relation to the loading control, β-actin. (E) A bar graph illustrating the relative levels of N-cadherin and E-cadherin mRNA expression in relation to GAPDH mRNA, the internal control . Results from three separate experiments (n = 3) are displayed in bar graphs as mean ± SD. When reporting *p < 0.05, **p < 0.01, ***p < 0.001, and ****p < 0.0001 vs. Control, the data were deemed significant.
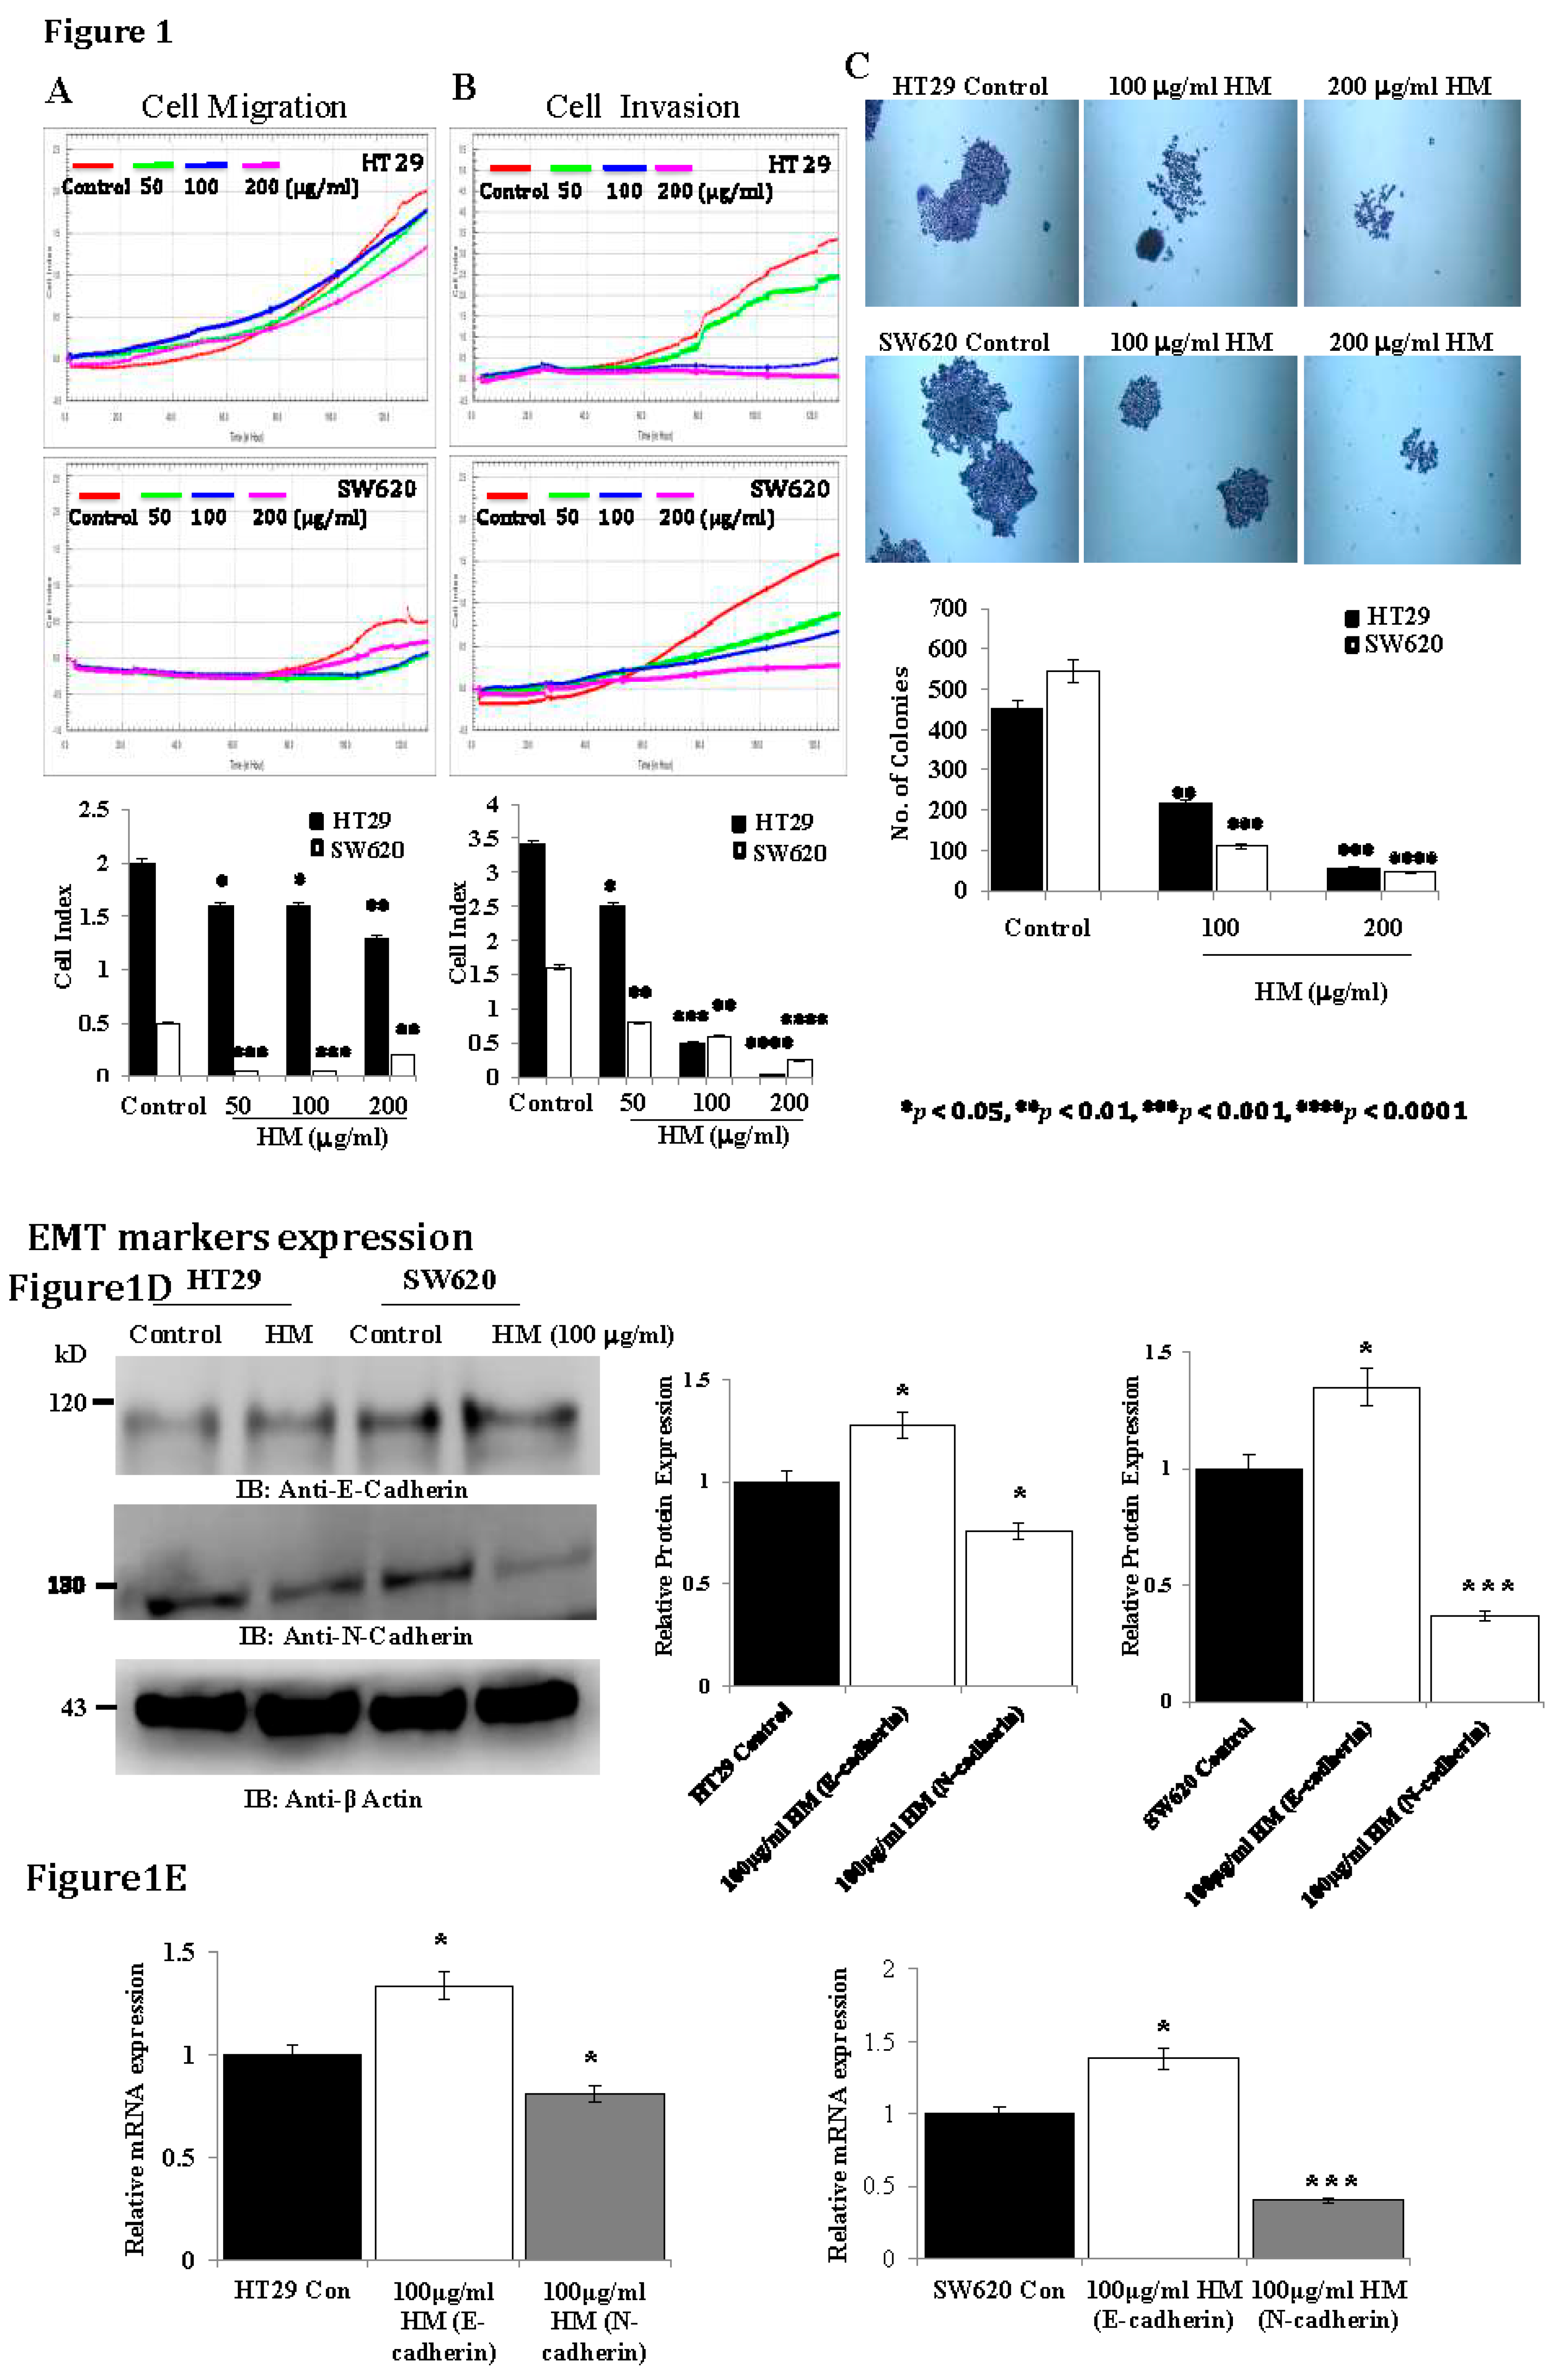
Figure 2.
(A) Analysis of Human Angiogenesis Antibody Array in HT29 and SW620 cell lysates after HM treatment. Whole HT29 and SW620 CRC cell lysates were subjected to immunoblotting against the 23 antibodies. In HT29 and SW620 cell lines, HM downregulates uPAR expression. Bar graphs showing the results expressed in single experiment (single membrane). (B) HT29 and SW620 whole cell lysates were subjected to immunoblotting against the designated antibody (i.e., uPAR). The bar graph indicates the relative level of protein expression in relation to the loading control β-actin. (C) Bar graph illustrating the relative level of uPAR mRNA expression in relation to GAPDH mRNA, the internal control. Results from three independent experiments (n = 3) are displayed in bar graphs as mean ± SD. When reporting *p < 0.05, **p < 0.01, ***p < 0.001, and **** p < 0.0001 vs. Control, the data were deemed significant.
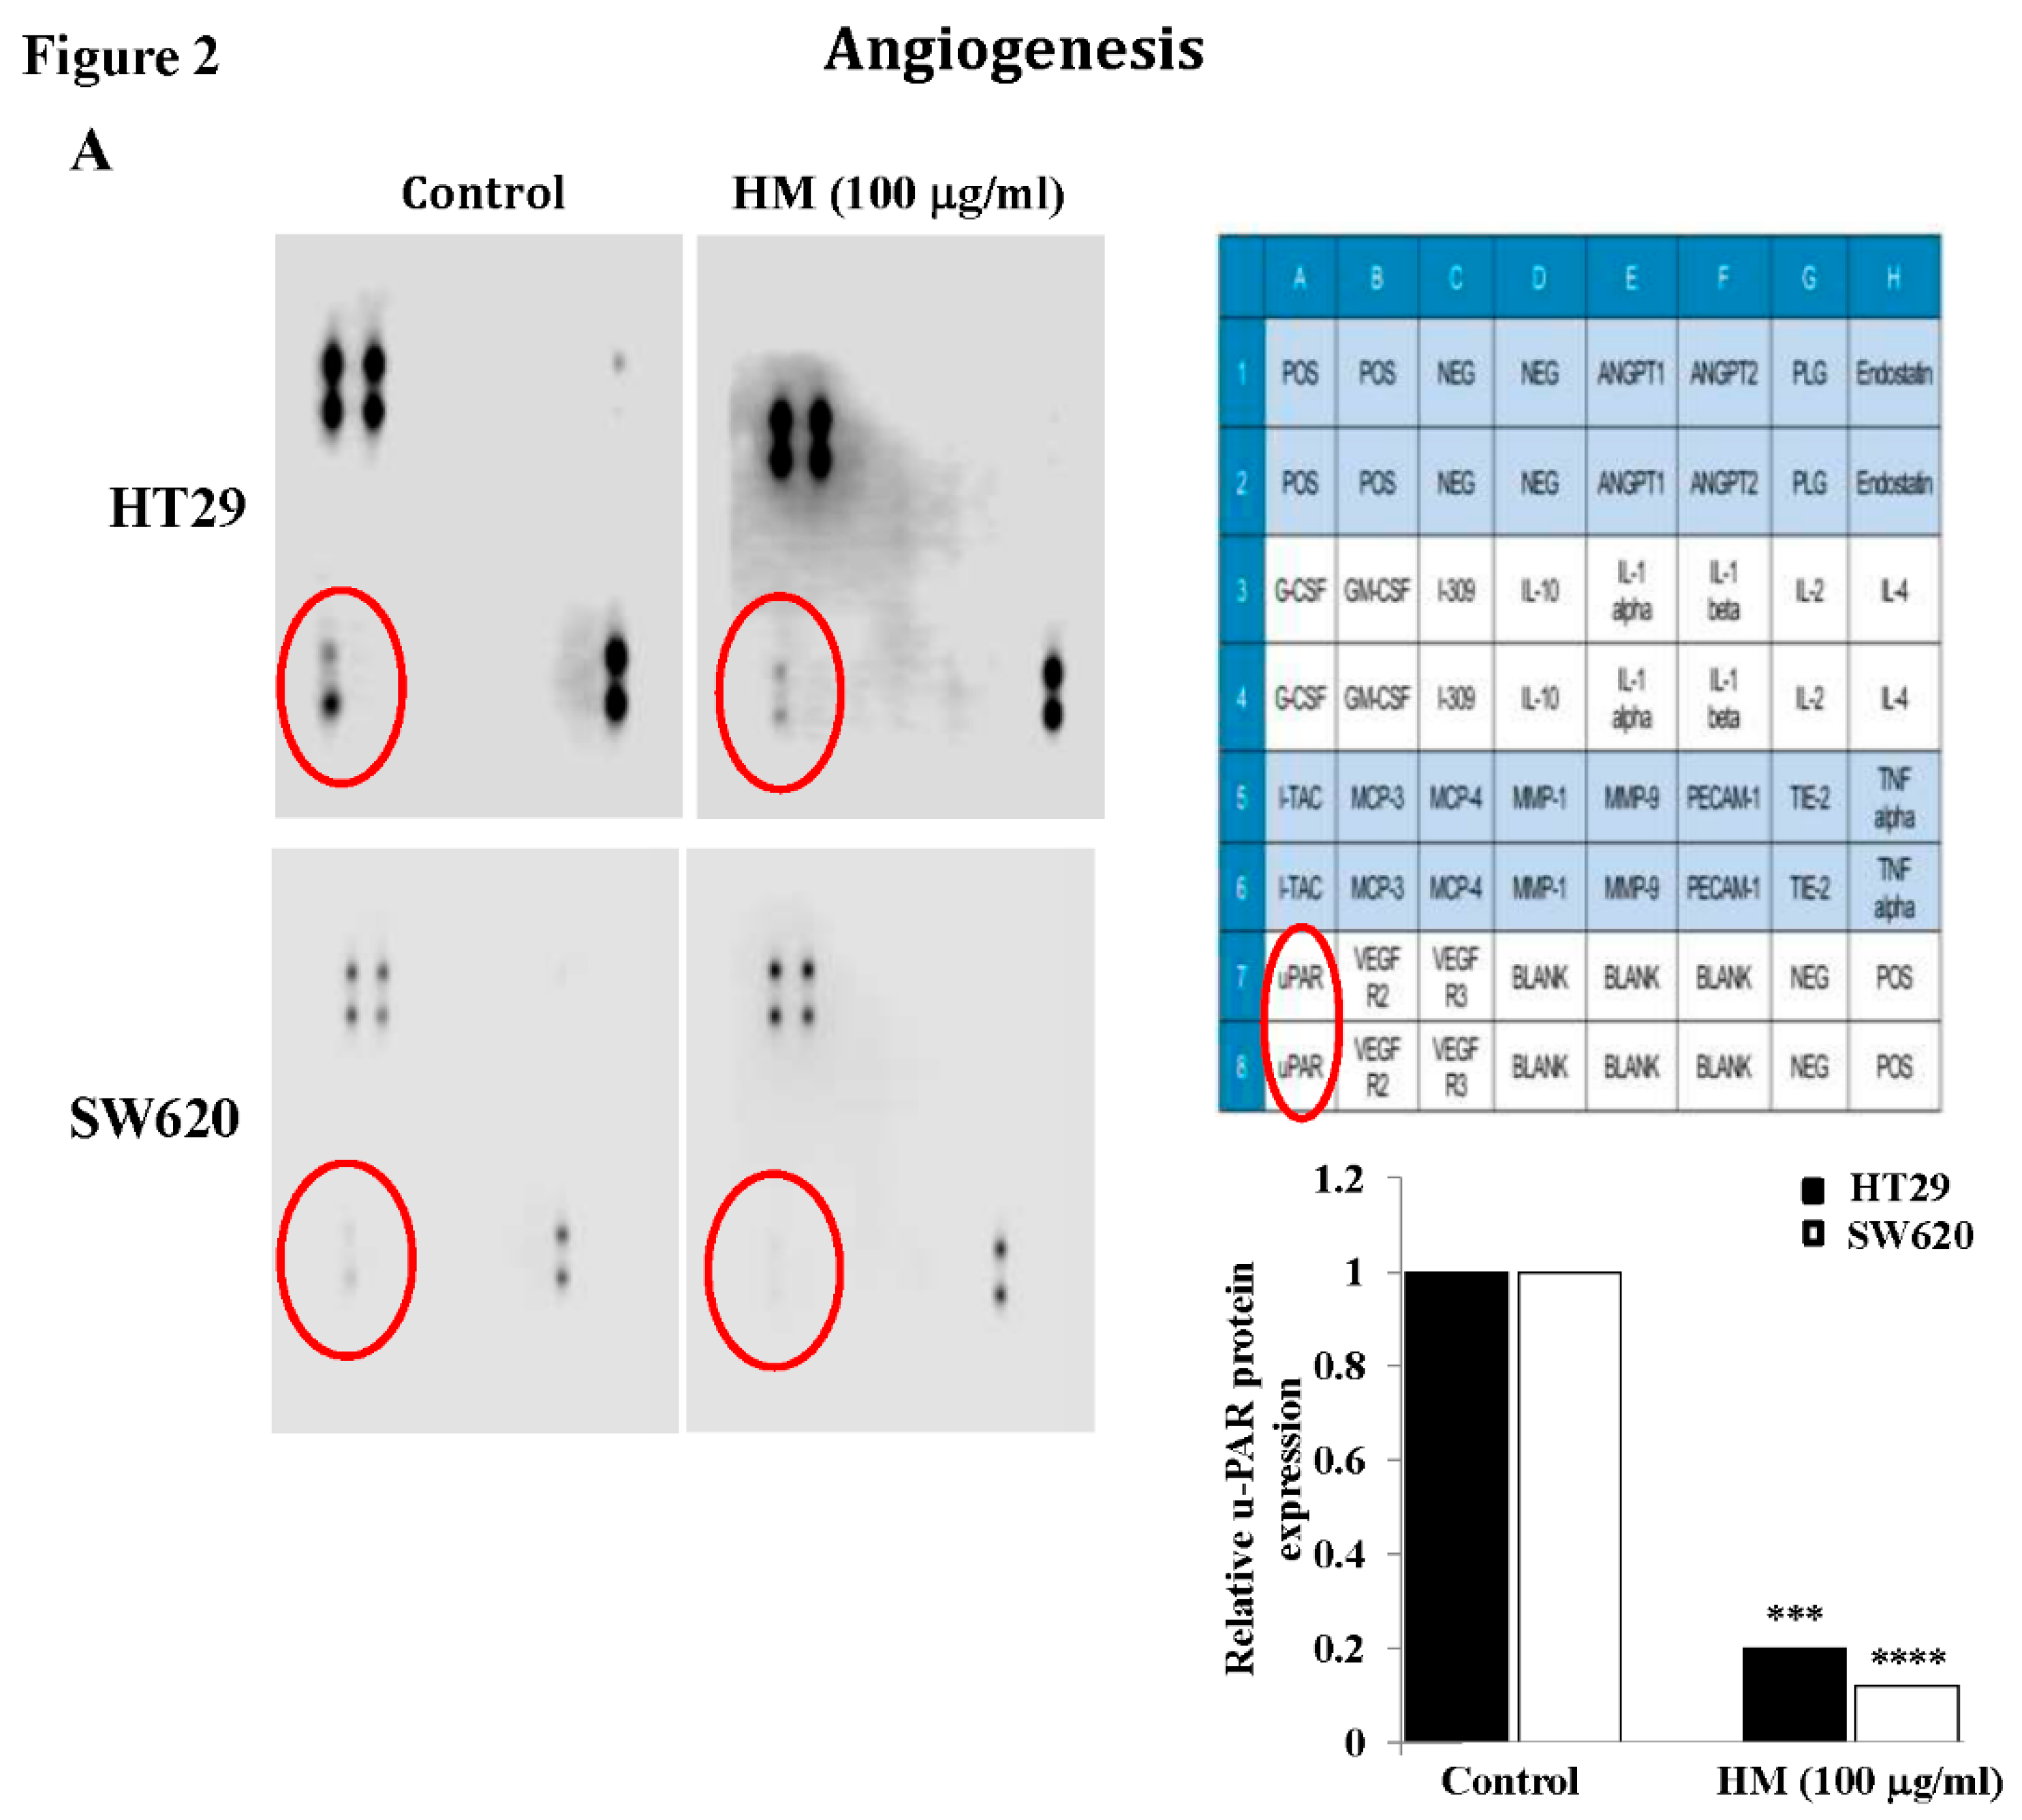
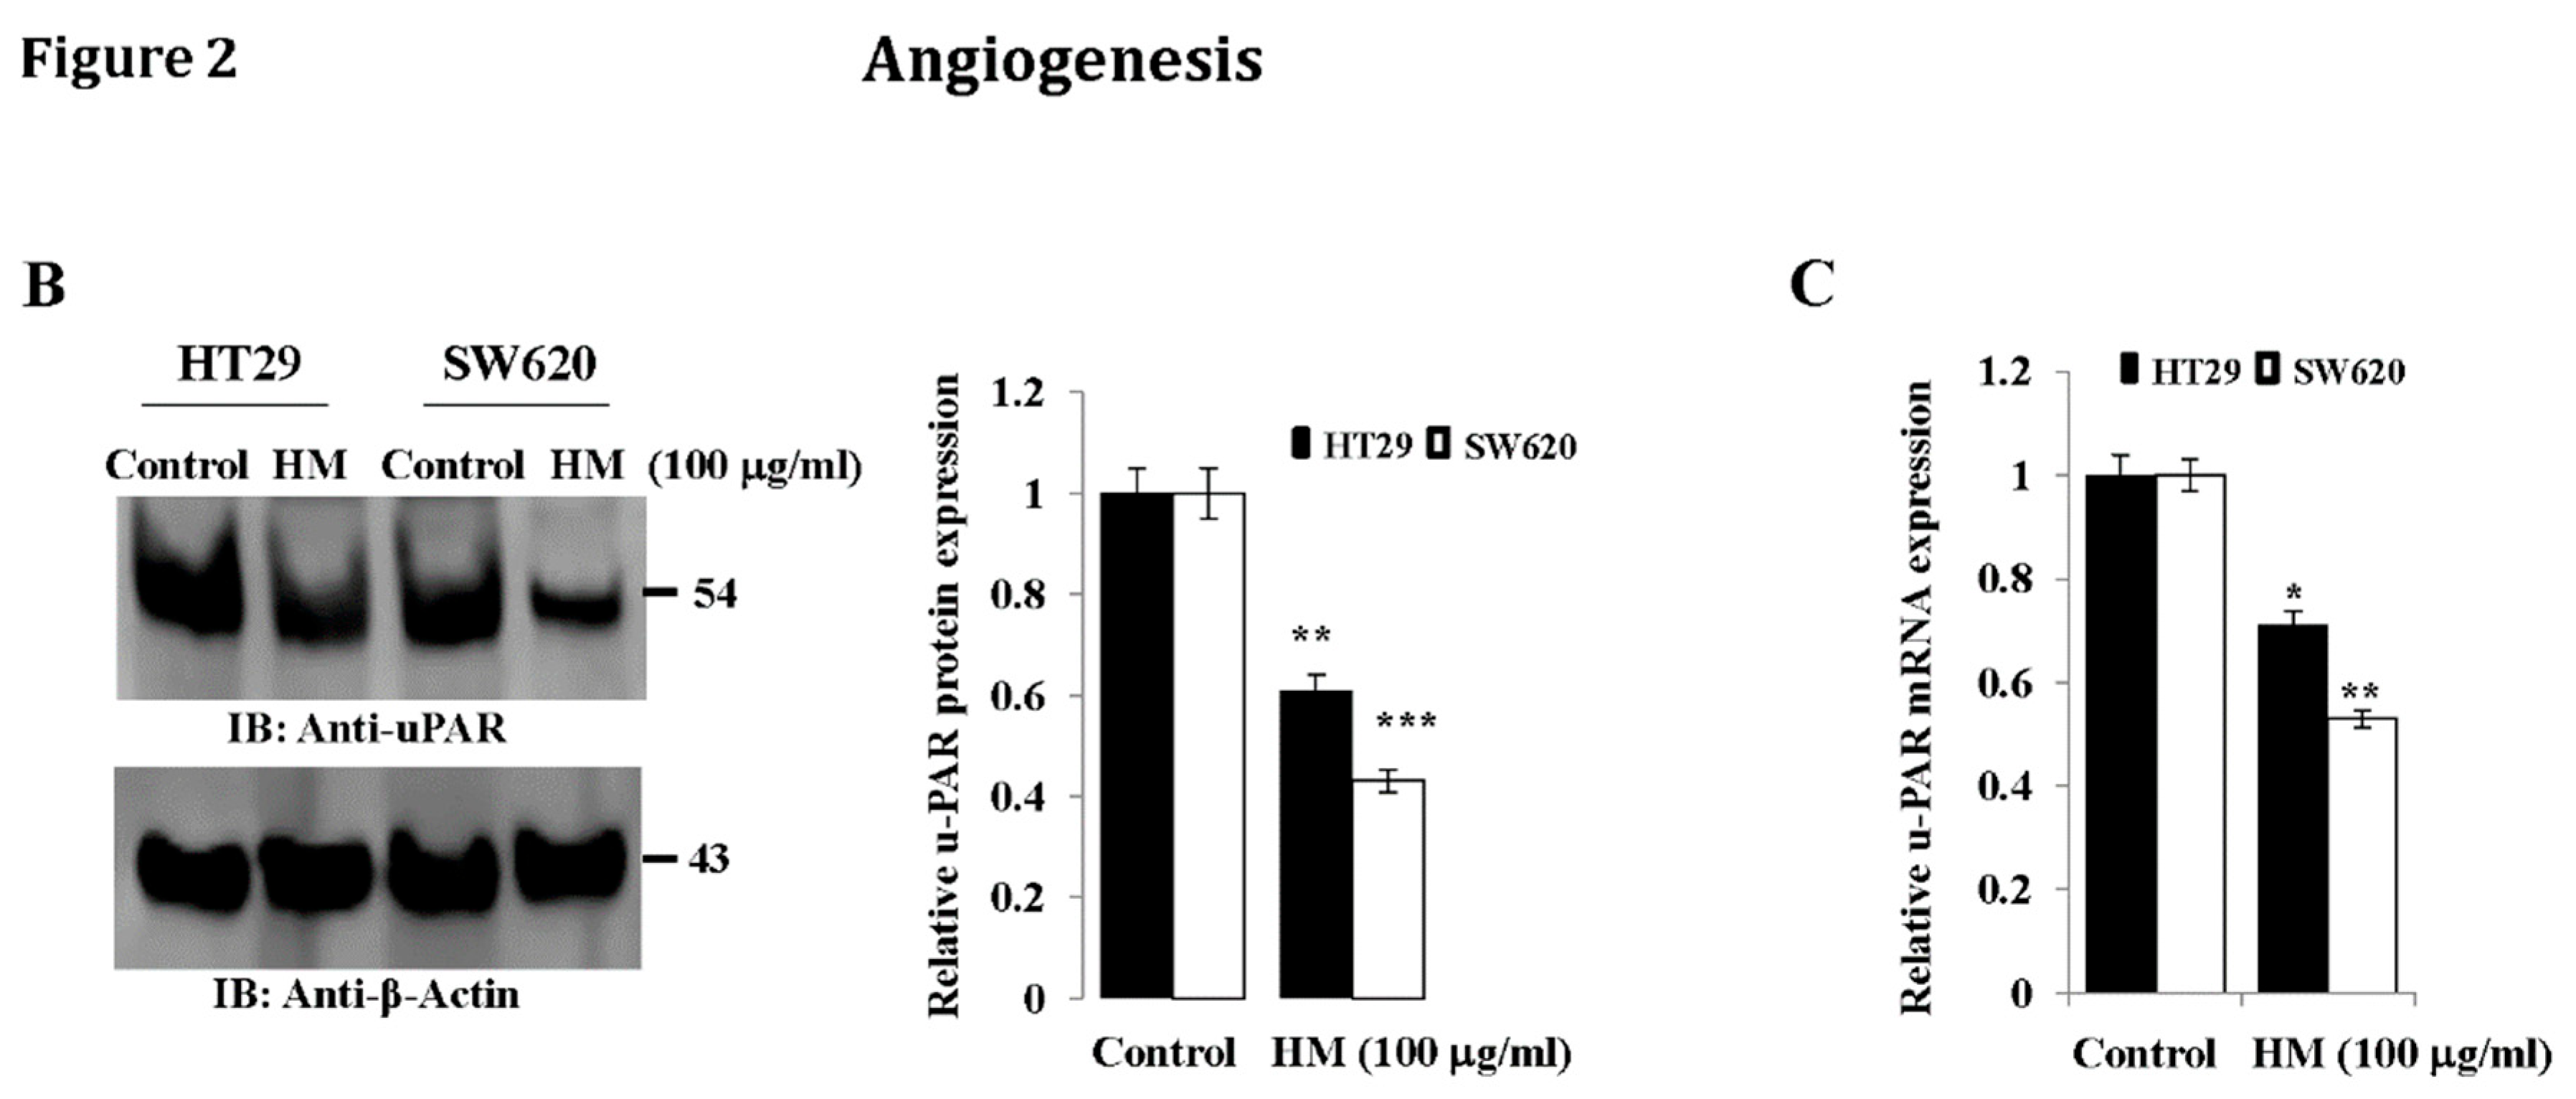
Figure 3.
uPAR expression level in HT29 and SW620 cells after HM treatment following pretreatment with JNK inhibitor SP600125 and MEK Inhibitor UO126. (A) HT29 and SW620 whole cell lysates with/without 10 μM JNK kinase inhibitor (+/- SP600125) were subjected to immunoblotting against the designated antibody (i.e., uPAR). (B) HT29 and SW620 whole cell lysates with/without 10 μM MEK inhibitor (+/- UO126) were subjected to immunoblotting against the indicated antibody (i.e., uPAR). The bar graph shows the relative level of protein expression in relation to the loading control β-actin. Results from three separate experiments (n = 3) are displayed in bar graphs as mean ± SD. When reporting *p < 0.05, **p < 0.01, ***p < 0.001, and **** p < 0.0001 vs. Control, the data were deemed significant.
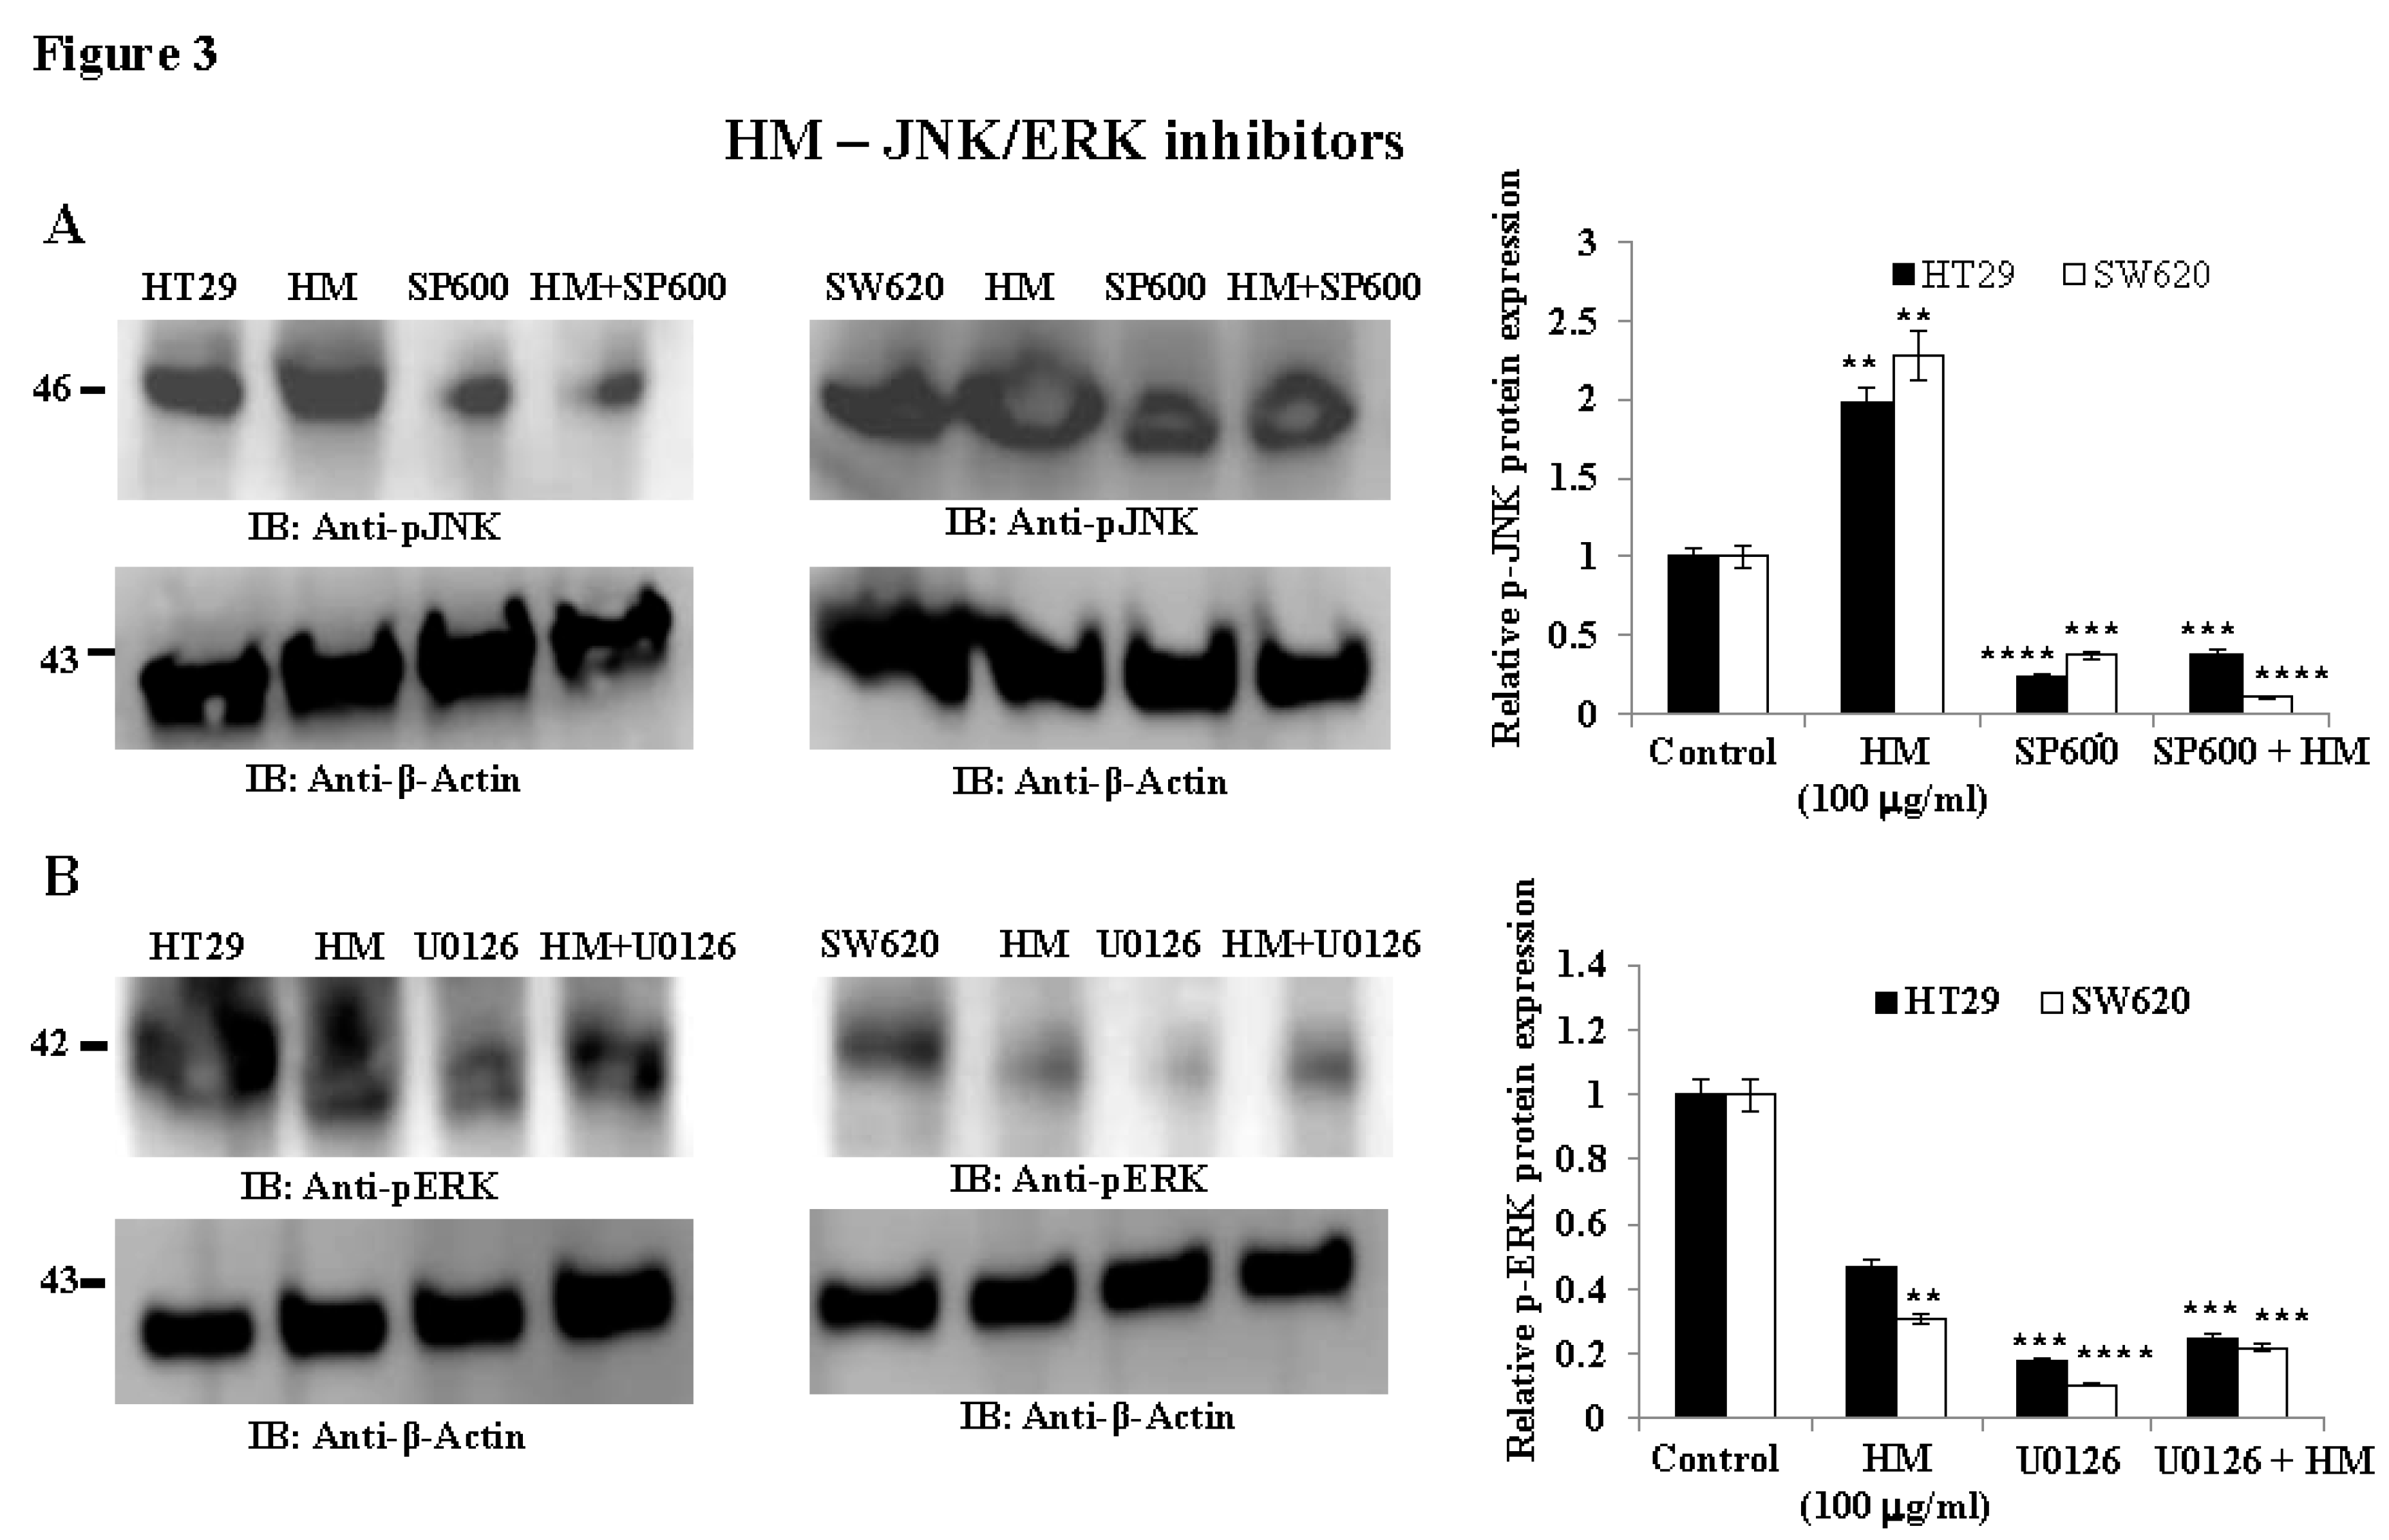
Figure 4.
pJNK and pERK expression levels in HT29 and SW620 cells after HM treatment following pretreatment with JNK inhibitor SP600125 and MEK Inhibitor UO126. (A) HT29 and SW620 whole cell lysates with/without 10 μM JNK kinase inhibitor (+/- SP600125) were subjected to immunoblotting against the designated antibody (i.e., p-JNK). (B) HT29 and SW620 whole cell lysates with/without 10 μM MEK inhibitor (+/- UO126) were subjected to immunoblotting against the designated antibody (i.e., p-ERK). Bar graph showing the relative level of protein expression in relation to the loading control β-actin. Results from three independent experiments (n = 3) are displayed in bar graphs as mean ± SD. When reporting *p < 0.05, **p < 0.01, ***p < 0.001, and ****p < 0.0001 vs. Control, the data were deemed significant.
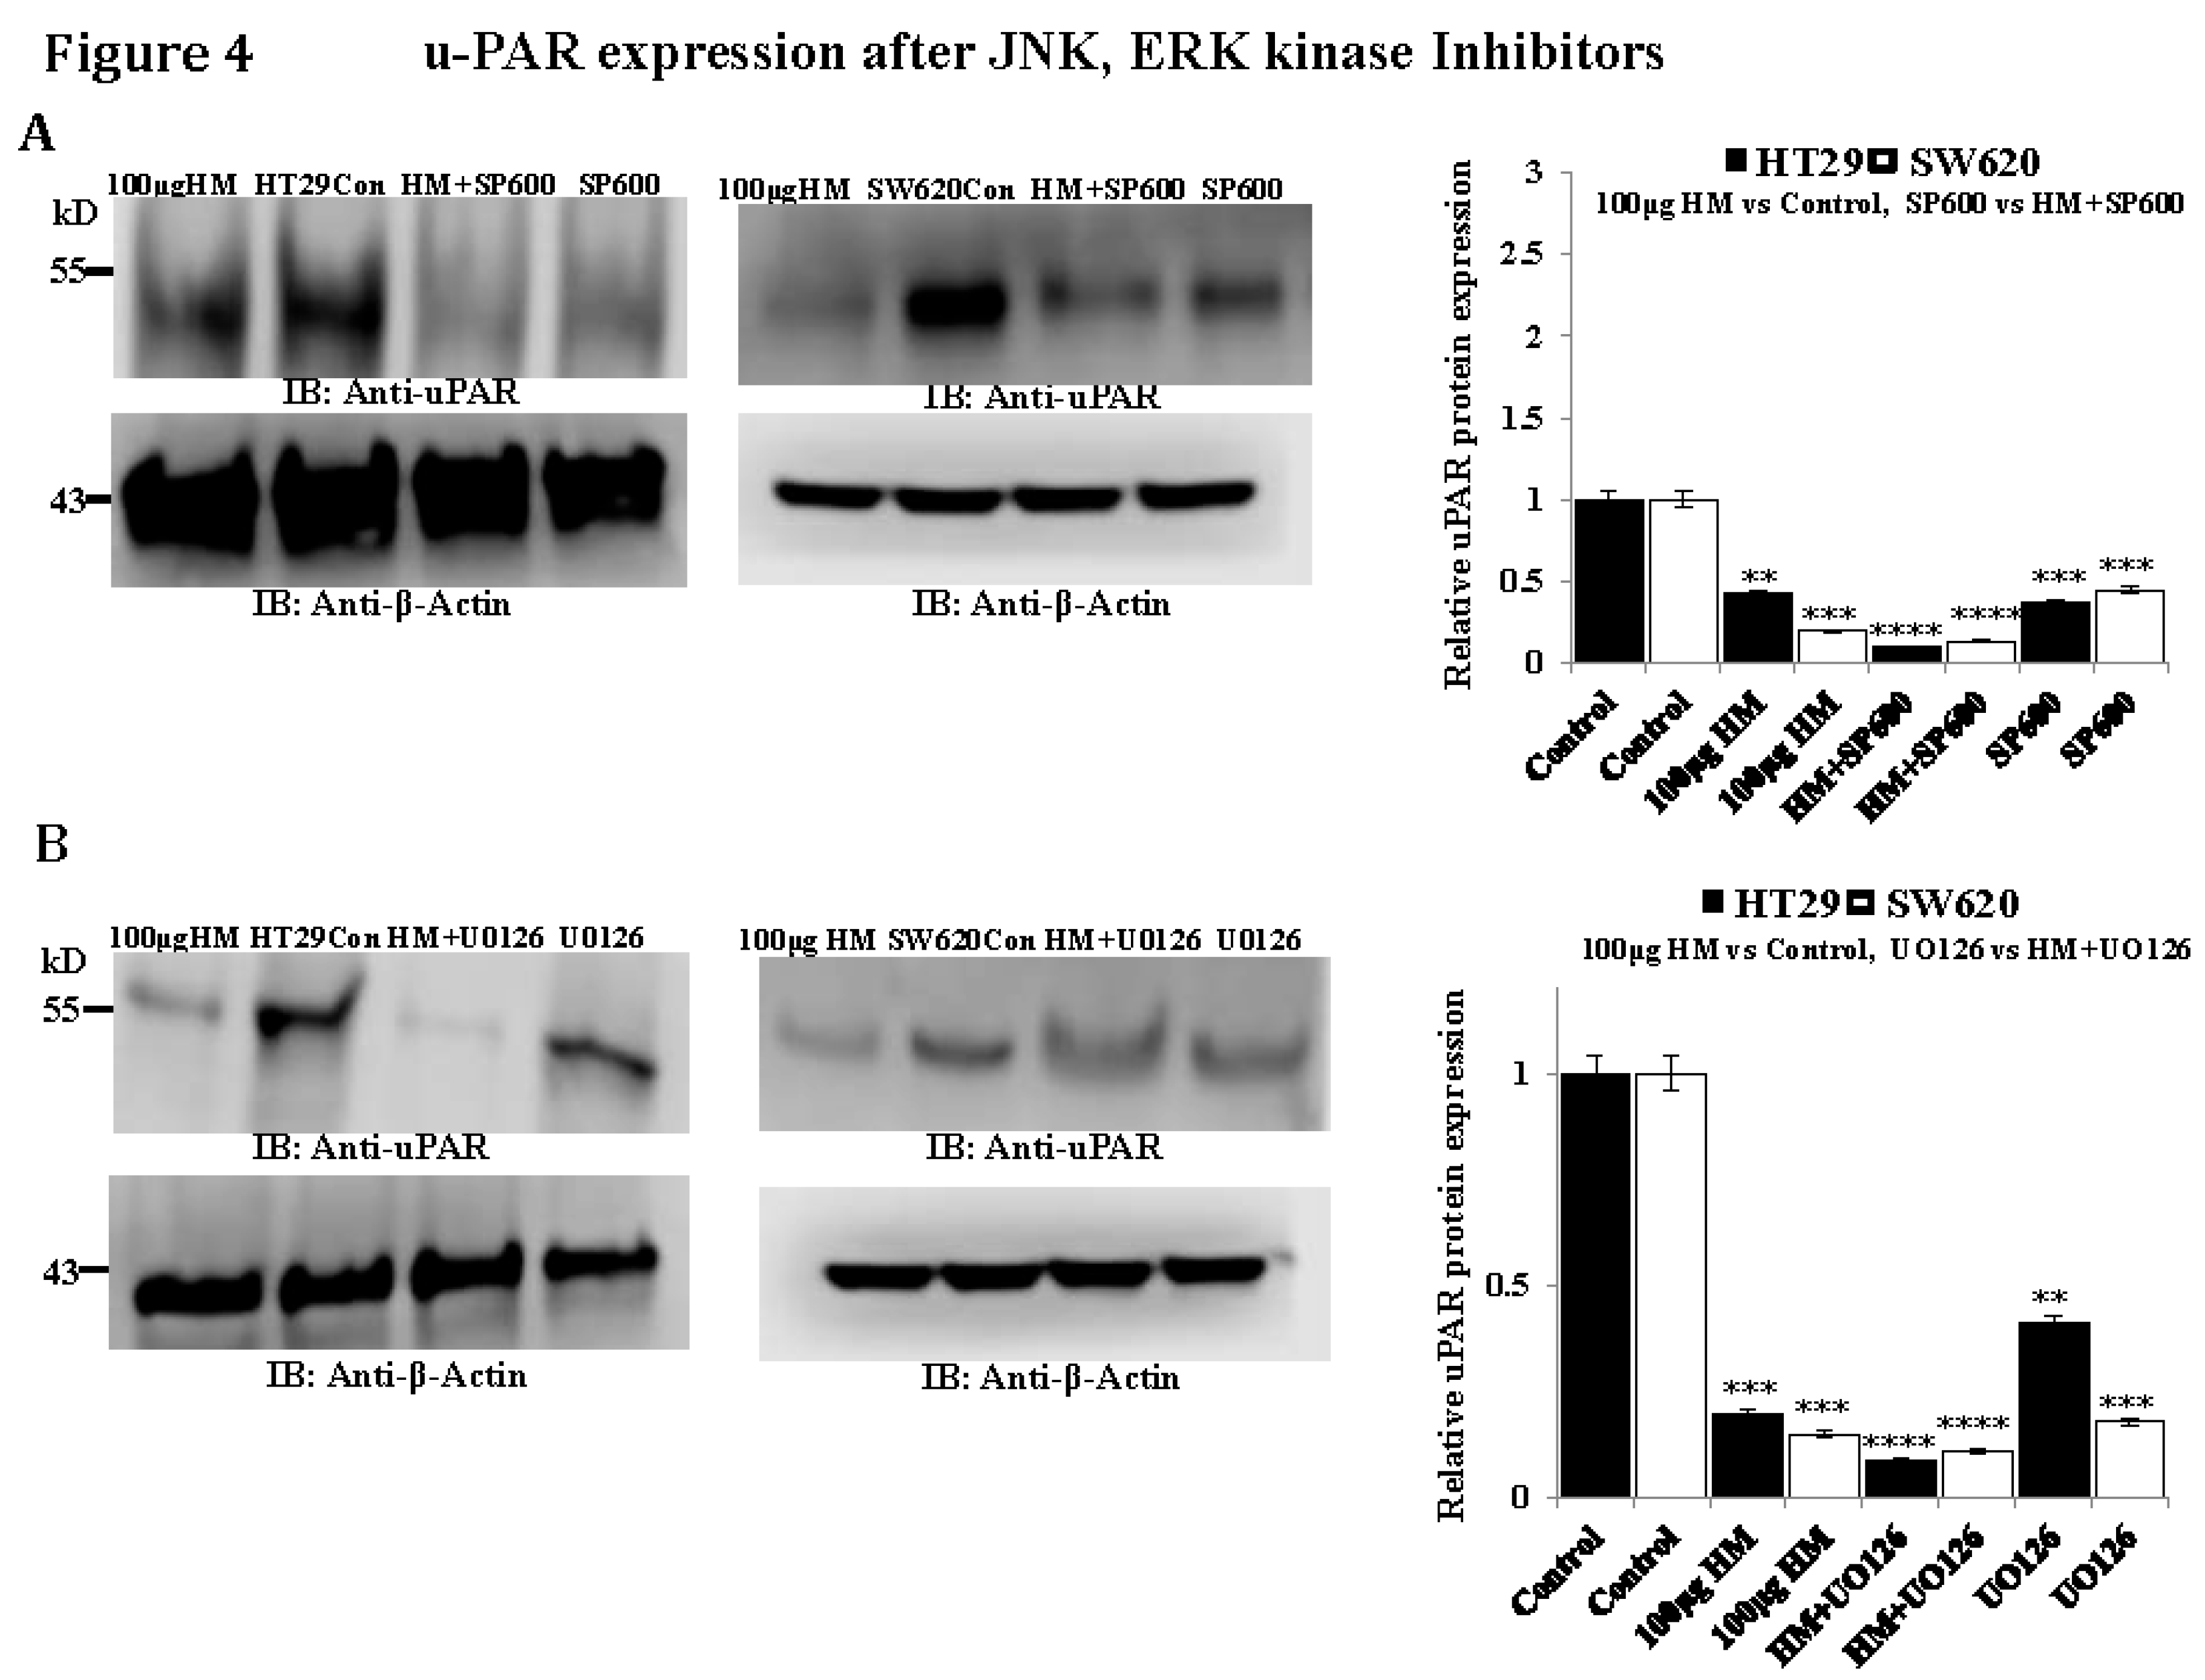
Figure 5.
JNK inhibitor SP600125 (A) and MEK inhibitor UO126 (B) attenuated HM-inhibited real-time SW620 cell migration. Data are presented as mean ± SD from three separate experiments (n = 3). When reporting *p < 0.05, **p < 0.01, ***p < 0.001, and ****p < 0.0001 vs. Control, the data were deemed significant.
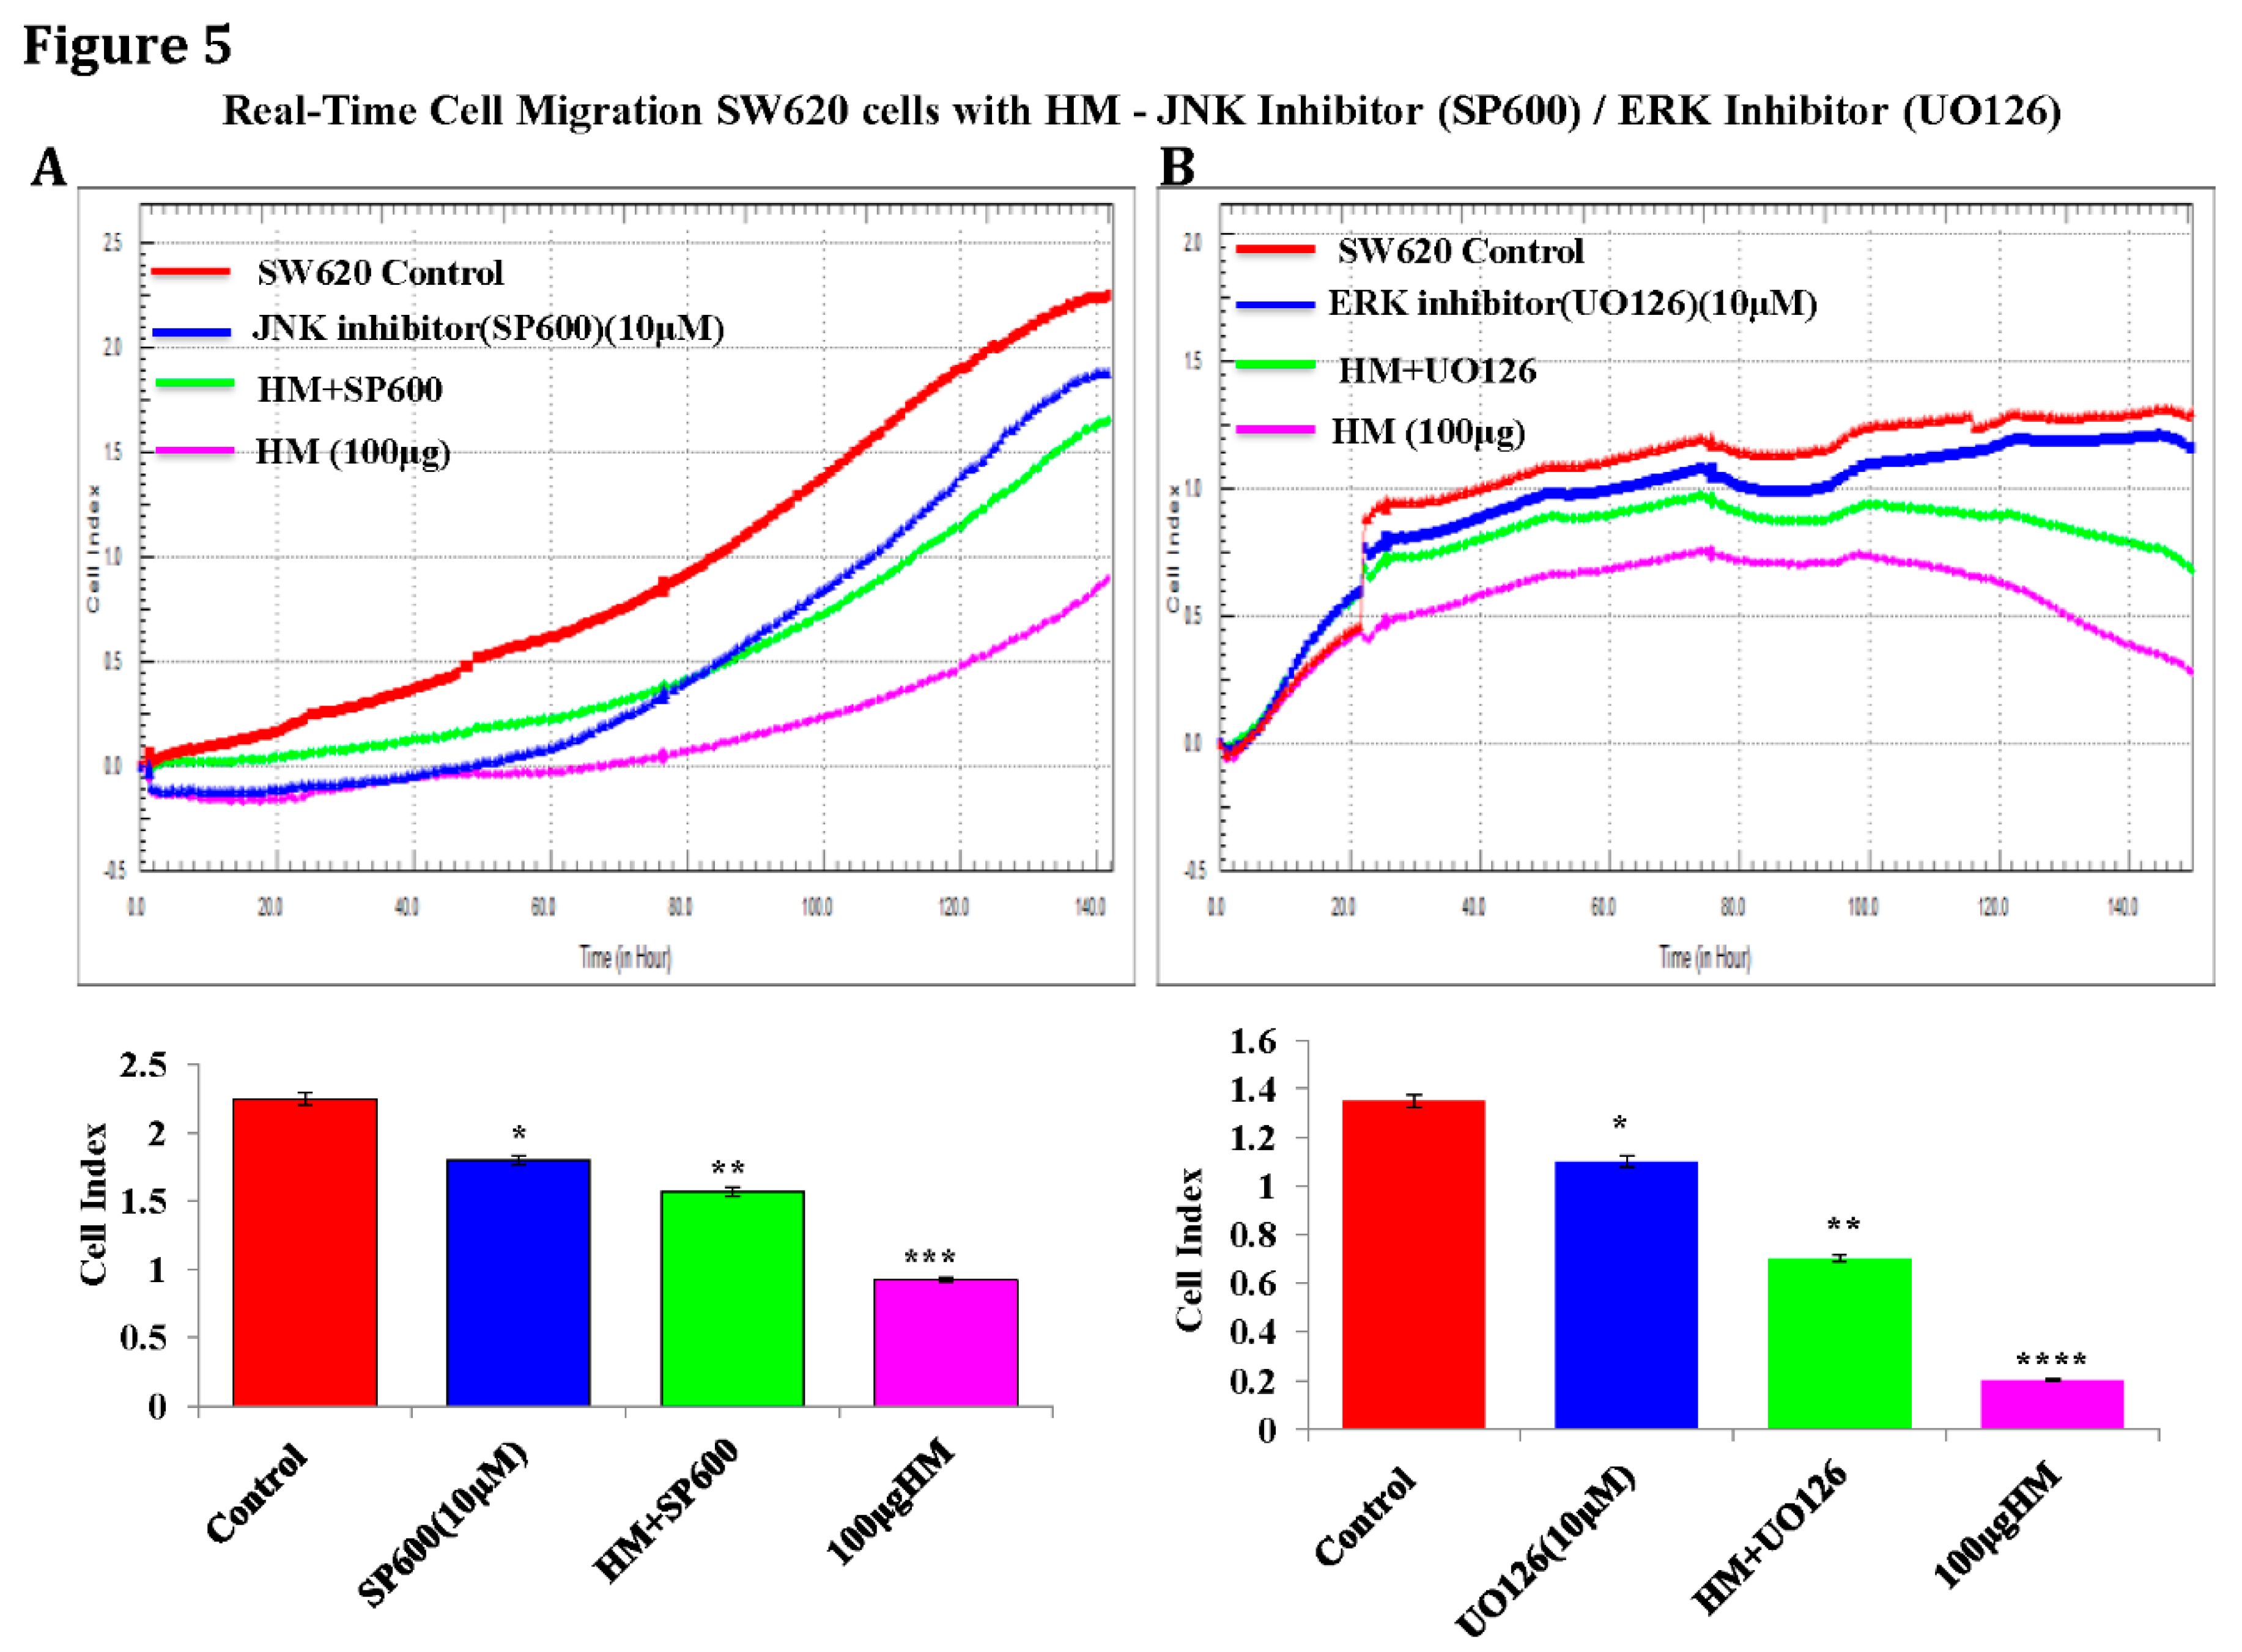

Table 1.
Primer sequences.
| Target genes | Primer sequences |
| E-cadherin N-cadherin uPAR GAPDH |
F: 5′ -ACCAGAATAAAGACCAAGTGACCA-3′ R: 5′- AGCAAGAGCAGCAGAATCAGAAT -3′ F: 5′-ATTGGACCATCACTCGGCTTA-3′ R: 5′-CACACTGGCAAACCTTCACG-3′ F: 5′-TGCAATGCCGCTATCCTACA-3′ R: 5′-TGGGCATCCGGGAAGACT-3′ F: 5′-AAGGTCGG AGTCAACGGATTTGGT-3′ R: 5′-ATGGCATGGACTGTGGTCATAGT-3′ |
Disclaimer/Publisher’s Note: The statements, opinions and data contained in all publications are solely those of the individual author(s) and contributor(s) and not of MDPI and/or the editor(s). MDPI and/or the editor(s) disclaim responsibility for any injury to people or property resulting from any ideas, methods, instructions or products referred to in the content. |
© 2025 by the authors. Licensee MDPI, Basel, Switzerland. This article is an open access article distributed under the terms and conditions of the Creative Commons Attribution (CC BY) license (http://creativecommons.org/licenses/by/4.0/).
Copyright: This open access article is published under a Creative Commons CC BY 4.0 license, which permit the free download, distribution, and reuse, provided that the author and preprint are cited in any reuse.


