Submitted:
06 May 2025
Posted:
06 May 2025
You are already at the latest version
Abstract
Alpha-1 antitrypsin deficiency (AATD) is a genetic disorder caused by mutations in the SERPINA1 gene, leading to reduced levels or impaired function of alpha-1 antitrypsin (AAT). This condition predominantly affects the lungs and liver. The Z allele, a specific mutation in the SERPINA1 gene, is the most severe form and results in the production of misfolded AAT proteins. The misfolded peptides accumulate in the endoplasmic reticulum (ER) of liver cells, triggering ER stress and activating the unfolded protein response (UPR), a cellular mechanism designed to restore ER homeostasis. Currently, there is limited knowledge regarding specific nutritional recommendations for patients with AATD. The liver is essential for regulating zinc homeostasis, with zinc widely recognized for its hepatoprotective properties. However, the effects of AATD on zinc metabolism remain poorly understood. Similarly, the potential benefits of zinc supplementation for individuals with AATD have not been thoroughly investigated. This study explored the relationship between AATD and zinc metabolism through a combination of in vitro experiments and in silico analyses. The expression of the mutant Z variant of ATT (ATZ) in cultured mouse hepatocytes was associated with decreased labile zinc levels in cells and dysregulation of zinc homeostasis genes. Analysis of two data series from the Gene Expression Omnibus (GEO) revealed that mice expressing ATZ (PiZ mice) exhibited significant differences in mRNA levels related to zinc homeostasis and UPR-associated genes when compared to wild-type mice. Bayesian network analysis of GEO data revealed novel gene-to-gene interactions among zinc transporters, as well as between zinc homeostasis, UPR, and other associated genes. These findings offer valuable insights into the role of zinc homeostasis genes in UPR processes linked to AATD.
Keywords:
Zinc
; Endoplasmic Reticulum
; Liver
; Alpha-1 Antitrypsin Deficiency
; Bayesian Networks
; Machine Learning
; Artificial Intelligence
1. Introduction
Alpha-1 antitrypsin deficiency (AATD) is inherited in an autosomal recessive disorder caused by mutations in the SERPINA1 gene (AAT). AATD can lead to damage in the lungs and liver, resulting in conditions such as emphysema and liver disease (1). Serpina1 is primarily synthesized in the liver and released into plasma, where it serves as a circulating protease inhibitor. The most commons mutations associated with AATD are the Z and the S alleles (1). The Z allele results in the substitution of glutamate for Lysine at amino acid position 342 (p. Glu324Lys) which alters the peptide folding (1), which affects its secretion causing severe deficiency in blood. The mutant SERPINA1 (AATZ) molecules undergo polymerization and aggregate within the endoplasmic reticulum (ER) of hepatocytes (2). This leads to ER stress and the formation of large intrahepatocyte globules, necrosis, fibrosis, and apoptosis (1).
Currently, there is a limited body of formal research examining the necessity of specific nutritional recommendations for patients with AATD (3). Additionally, studies investigating the effects of AATD on nutrient metabolism remain scarce. Ongoing research is shedding light on the role of iron in AATD pathology. Schaefer et al. (4) reported that patients with AATD, specifically those with the Z mutation, exhibit hepatic iron overload alongside reduced hepcidin levels compared to control patients. Additionally, other studies have shown that AATD enhances the expressivity of hemochromatosis (5,6),
The liver plays a critical role in zinc metabolism (7). Any dysfunction in the liver, such as in conditions like AATD, may disrupt zinc metabolism and contribute to imbalances in the body. Nonetheless, the impact of AATD on zinc metabolism and status remains undocumented. There is general agreement that zinc functions as a hepatoprotective nutrient via its role in mitigating inflammation, fibrosis, steatosis and apoptosis and stimulating autophagy (8-13). However, it is uncertain whether zinc supplementation offers any benefits to patients with AATD. Additionally, it is unclear whether poor zinc intake aggravates AATD driven pathology.
Interestingly, reports have indicated a connection between ER stress, early secretory pathway and zinc (14). Close to one-third of cellular proteins are targeted at the ER, where they undergo folding and post-translational modifications, such as glycosylation (15). Properly folded proteins are transported to the Golgi apparatus and other destinations, while misfolded ones may be targeted for degradation through the ER-associated degradation (ERAD) pathway. A significant proportion of the secretome requires zinc for its structural and catalytic functions. Additionally, chaperones require zinc for regulation and proper function (16). Strengthening the idea that zinc is essential for ER function, a study revealed that low zinc intake intensified ER stress induced by tunicamycin in the liver of mice (17).
Furthermore, loss-of-function studies of zinc transporters have highlighted the critical role of zinc in ER function. There are two families of zinc transporters in vertebrates (18). The transporters from the Slc39a gene family, in most cases, increase intracellular zinc levels by importing zinc into the cytoplasm from outside the cell or intracellular storage sites. With some exceptions, most Slc30a transporters help reduce intracellular zinc by exporting it out of the cell or sequestering it into specific organelles. Slc30a5 has been identified at both the Golgi apparatus and the endoplasmic reticulum (ER) (19), while Slc30a6 and Slc30a7 are localized exclusively at the Golgi apparatus. Notably, Slc30a5 and Slc30a6 have the ability to form functional heterodimers; however, the specific localization of these heterodimers remains poorly characterized (14, 20–22).
These transporters seem to be critical for zinc transport in early secretory pathway and cells lacking these transporters exhibit increased ER stress (23). Slc39a7 has been localized to the endoplasmic reticulum (ER), where it is believed to play a role in facilitating zinc release from this compartment (24). Supporting this proposed function in ER zinc transport, studies have demonstrated that the abrogation of this gene leads to zinc accumulation within the ER, resulting in ER stress in mesenchymal stem cells (25). Additionally, Kim et al. (26) demonstrated that Slc39a14 plays a vital role in mitigating excessive ER stress responses. Furthermore, their findings revealed that the expression of this transporter is upregulated by ER stress or unfolded protein response (UPR) transcription factors, specifically Atf4 and Atf6α.
Given the strong association between AATD and ER stress, it is plausible that AATD contributes to the dysregulation of iron homeostasis-related genes through ER stress-mediated mechanisms.
In this study, we sought to explore how the Z mutation affects zinc metabolism and its broader implications for genetic regulation. Specifically, we focused on the co-regulation of genes involved in zinc homeostasis, UPR, and other pathways, aiming to uncover potential interactions and underlying mechanisms. To achieve this, we utilized Bayesian network (BN) analysis, which is particularly well-suited for studying the co-regulation of many genes because it can handle complex, high-dimensional datasets while incorporating uncertainty
2. Materials and Methods
2.1. Cell Culture
Mouse hepatocytes (Hepa-1-6) with constitutive expression the human Sepina1 (AAT) wild type allele (MM) and the mutant Z allele (ZZ) were kindly donated by Dr. Jeffery Tekman (25). The cells expressing the mutant allele exhibit increased retention of mutant Z protein in the ER and abnormal basal autophagy (27). Cells were cultured in DMEN medium containing 10% FBS and antibiotic antimycotic. Cell culture procedures were approved by the Institutional Biosafety Committee of Florida International University.
2.2. Labile Zinc Measurement
To test the effect of zinc depletion, adequacy, and excess, cells were seeded in 96 well plates (20 x104 cells per well) and treated 24 h later with either the zinc chelator TPEN (5 μM) (N,N,N',N'-Tetrakis(2-pyridylmethyl)ethylenediamine), vehicle alone (DMSO), or vehicle plus zinc (40 μM) (ZnSO4) for 24h. Thereafter, cells were incubated with the cell-permeable zinc-fluorophore NBD-TPEA (Sigma-Aldrich) as described before (13). Labile zinc was quantified using a Biotek FLx800 plate reader (excitation 485 nm/emission 528 nm). Values were normalized to Hoechst fluorescence.
2.3. mRNA Quantitation by RT-PCR
Total RNA was Isolated from cells utilizing the kit RNeasy plus kitRNA (Qiagen), which allows genomic DNA removal. Quantitative PCR (qPCR) was performed using ABScript II One Step SYBR Green RT-qPCR kit (ABclonal). The master mix qPath (Thermofisher) was also employed for the measurement of mRNA expression of Slc39a4 and Mt1.
The following set of primers were utilized for qPCR using SYBR Green: Mt2: 5’- GCC TGC AAA TGC AAA CAA TGC-3' and 5’- AGC TGC ACT TGT CGG AAG C-3'; Slc39a8: 5’- ATC TGC CCC GCG ATC TTA C-3' and 5’- CCC CAG ACT TCG GAA AGA CT-3'; r18s: 5’- GTAACCCGTTGAACCCCATT-3' and 5’- CCATCCAATCGGTAGTAGCG-3'. Slc39a14: predesigned primers Quantitec (Qiagen). Mouse Slc39a4 and Mt1 mRNA expression was measured using TaqPath 1-step RT-qPCR mix CG (Thermofisher). The primers used for Slc39a4: 5”- CTCTGCAGCTGGCACCAA-3' and 5’- CACCAAGTCTGAACGAGAGCTTT-3' and the FRET probe (5’ FAM; 3” BHQ1) sequence was: 5’- CAATCTCCGACAGTCCAAACAGACCCAT-3' (R) as previously reported (28). Mouse Mt1 mRNA expression was measured using the predesigned primer and probe Mm496660.g1 (Thermofisher). Values were normalized by r18s.
2.4. Western Blot Analysis
Soluble and insoluble fractions of cells were obtained by lysing cells in lysing buffer (50 mM Tris and 2% Triton X-100) containing protease inhibitors (Haltprotease inhibitor cocktail; Pierce, Rockford, IL). Lysates were briefly sonicated. Cellular protein content was determined with a micro-BCA protein assay kit (Pierce, Rockford, IL). Aliquots of homogenates were diluted with 5× Laemmli sample buffer and resolved on 4–12% polyacrylamide gels (Genscript,Piscataway, NJ). Proteins were transferred onto nitrocellulose membranes using the eBlot® protein transfer system (Genscript, Piscataway, NJ). The detection of AAT was achieved using the monoclonal antibody CPTC-SERPINA1-1 (DSHB Hybridoma). β-Tubulin was used as a loading control (Cat #5346; Cell signaling).
2.5. GEO data analysis
We downloaded raw count data from the GEO dataset GSE141593 containing RNA-seq data from livers from five 6-week-old male PiZ (overexpressing human Z mutant allele) mice and five C57BL/6 (wild type) mice (29). We used the GEOQuery package (30) in R (4.4.3). Gene expression counts were filtered for low expression by removing genes whose expression counts were less than 10 in five or more samples. To select genes for input to the BN analysis, differential expression analysis was performed on the raw count data using R package DESeq2 (31), and genes with an ‘apleglm’ shrunken log2 fold change greater than 2 (absolute lg fold change) as well as zinc-related genes of interest were selected, for a total of 215 genes. Counts for the entire dataset were first normalized using DESeq2's Ratio of Medians method, standardized to Z scores, and finally discretized into 3 categories: low expression (z < -1, denoted as 1), no change in expression (-1 ≤ z ≤ 1, denoted as 0), and high expression (z > 1, denoted as 2).The transcriptomic data of the GEO dataset GSE93115 (32) was employed only for gene expression comparison with GSE141593. GSE93115 contained microarray data (Affymetrix Mouse 430A 2.0 array). This dataset contains data from liver samples from three 6-week-old male PiZ mice and three C57BL/6 (wild type) mice. The log2 fold change and p values for comparison between PiZ mice and wildtype were obtained by using GEO2R (available online).
2.6. Bayesian Networks Analysis
A BN is a directed acyclic graph in which each arc is interpreted as a direct influence between a parent node and a child node, relative to the other nodes in the network (33). Figure 1 shows the structure of a BN that illustrates hypothetical gene-gene interactions in response to stress. The nodes in Figure 1 (depicted as ovals) represent random variables, and each node is associated with a set of possible states. As an example, the 'Stress' node can take on the states 'Yes' or 'No' to indicate the presence or absence of stress exposure in the sample. Likewise, the 'Gene1' node can have states such as 'High,' 'no change,' or 'low,' representing the gene's expression level. Figure 1's arcs show direct variable relationships. Arc direction indicates parent-child status: for example, 'Stress' is a direct parent of Gene1 and Gene2, and Gene3 is a direct child of Gene2. A set of probabilities that parameterize the structure of BN. In general, for each variable, there is a conditional probability of that variable given the states of its parents. Thus, the probability associated with a set of variables in Gene3 is P(Gene3 | Gene1, Gene2). That is, we give the probability distribution over the values of a set of variables in Gene3 conditioned on each of the possible values of a set of variables in Gene1 and Gene2. For variables that have no parents in the network, a prior probability is specified. The Markov condition (33) specifies the conditional independence relationships that are represented by a BN network: Let X and Y be variables. Suppose that Y is neither a direct nor an indirect child of X. Then X is independent of Y, conditioned on any state of the direct parent of X.
BN analysis was conducted using the scoring metric Bayesian Dirichlet equivalence (BDe) (34) and BANJO (BN Inference with Java Objects) (35) that iteratively modified the network structure to maximize the BDe score was used to uncover gene-gene interactions from PiZ and wild type datasets, helping to elucidate gene-gene interactions in PiZ nutation. First, three independent searches were carried out with Banjo’s simulated annealing algorithm, each running for 2 hours. The highest-performing structure from these searches (based on normalized log likelihood scores) was used as the starting point for the next round of three independent searches, now set to run for 4 hours each. The best structure from this second set was then compared to the best structure from the initial round by assessing the normalized scores. If the improvement was no greater than 15%, the search was concluded. Otherwise, the best structure from this recent round became the initial structure for a subsequent search, which had double the runtime.
A Markov Blanket (MB) in BN refers to the set of nodes that shield a particular node from the rest of the network, meaning the node is conditionally independent of all other nodes given its MB. The first-degree MB of a node includes its parents, children, and the parents of its children. The second-degree MB of a node is composed of its first-degree MB along with the first-degree MB of each member within its first-degree MB.
Following the BDe search method described earlier, we first searched for the optimal BN using the 215 genes identified in the GEO data analysis section. From this initial optimal BN, we then focused on the second-degree MB of PiZ and incorporating genes of interest to arrive at a set of 92 genes. Finally, we applied the BDe search method again to determine the final best BN for these 92 genes. In this final best BN, we focused specifically on genes within the first-degree MB of PiZ in a BN, denoted as MB(PiZ), We then extended our analysis to genes in the second-degree MB of PiZ, denoted as MB(MB(PiZ)).
To investigate potential gene interactions under PiZ and wild-type conditions, we performed an in-depth analysis of all possible gene expression state combinations for the eight genes selected from MB(PiZ). These eight genes were identified based on their expression profiles and existing background knowledge. We determined the minimal set of genes necessary and identified the most probable two and three gene combinations for each condition. This method enabled us to uncover potentially novel gene-gene interactions.
2.7. Statistical analysis
Data are presented as means ± standard error (SE). Two-Way ANOVA was used followed by the post hoc test Student-Newman-Keuls. Student's T test was also utilized. Statistical significance was set at p< 0.05.
3. Results
3.1. Expression of AAT
The hepatocytes expressing the Z mutant allele of AAT exhibited accumulation of aggregates (~80 kDa) and AAT (Figure 2). Two bands were observed for AAT.
3.2. Labile Zinc
Hepatocytes overexpressing the human Z mutant allele exhibited lower labile zinc levels as compared to wild type cells (p<0.05), under zinc deficiency (TPEN) and adequacy conditions (Figure 3). However, no significant difference was observed between these cells when they were cultured in medium with elevated content of zinc.
3.3. Expression of zinc transporters and Mt1 and Mt2 in hepatocytes
The expression of the zinc transporter Slc39a4 mRNA was significantly increased (p<0.05) in cells expressing the mutant Z allele as compared with the wild type cells (Figure 4). On the other hand, the expression of the Z allele was associated with decreased mRNA expression of the zinc transporter Slc39a8 as well as lower Mt1 and Mt2 expression. Lastly, the mRNA levels of Slc39a14 were not affected by the mutation.
3.4. Gene expression of genes involved in zinc homeostasis and UPR in liver samples of PiZ and wild type mice (GEO).
The expression of zinc transporters, metallothioneins, and the transcription factor MTF1 (metal Regulatory Transcription Factor 1) was analyzed in two independent GEO data series (NCBI) carried out using PiZ and wild type mice of the same age and gender (6-week-old male). Mt1 and Mt2 mRNA levels were consistently upregulated in the two studies. The mRNA expression of six zinc transporters was significantly affected by the expression of the human Z allele (PiZ mice) in at least one study. Interestingly, we observed that the expression of Slc39a7 mRNA was higher in PiZ mice, as compared to wild type in the two studies. However, the expression of Slc39a1, Slc39a3, Slc39a4, and Slc39a11 was increased only in one study. On the other hand, the expression of Slc39a8 and Slc30a9 was significantly lower in PiZ mice in one study (Table 1). As for the expression of UPR genes (Table 2), the expression of the UPR associated genes: Atf3, Atf4, Derl3, Trib3, Ddit3, and Ddit4 was significantly upregulated in the two series. However, the expression of Sdf2l1 and Bhlha15 was significantly upregulated only in GSE141593.
3.5. Bayesian Networks analysis
Utilizing the RNA-seq data from GSE141593 (WT vs. PiZ mice n=5 each group) we developed a network focused on zinc transporters, Mt1, Mt2, and MTF1 (zinc homeostasis genes) as well as on UPR associated genes. The cutoff point for gene inclusion in the analysis was lg2fc 2(absolute value (plus and minus)). The zinc homeostasis and UPR genes (included in Table 1 and Table 2) that did not reach lg2fc were added to the analysis as genes of interest. This probabilistic type of analysis does not fully establish causality or direction. However, it determines co-regulation or inhibition and provides potential direction.
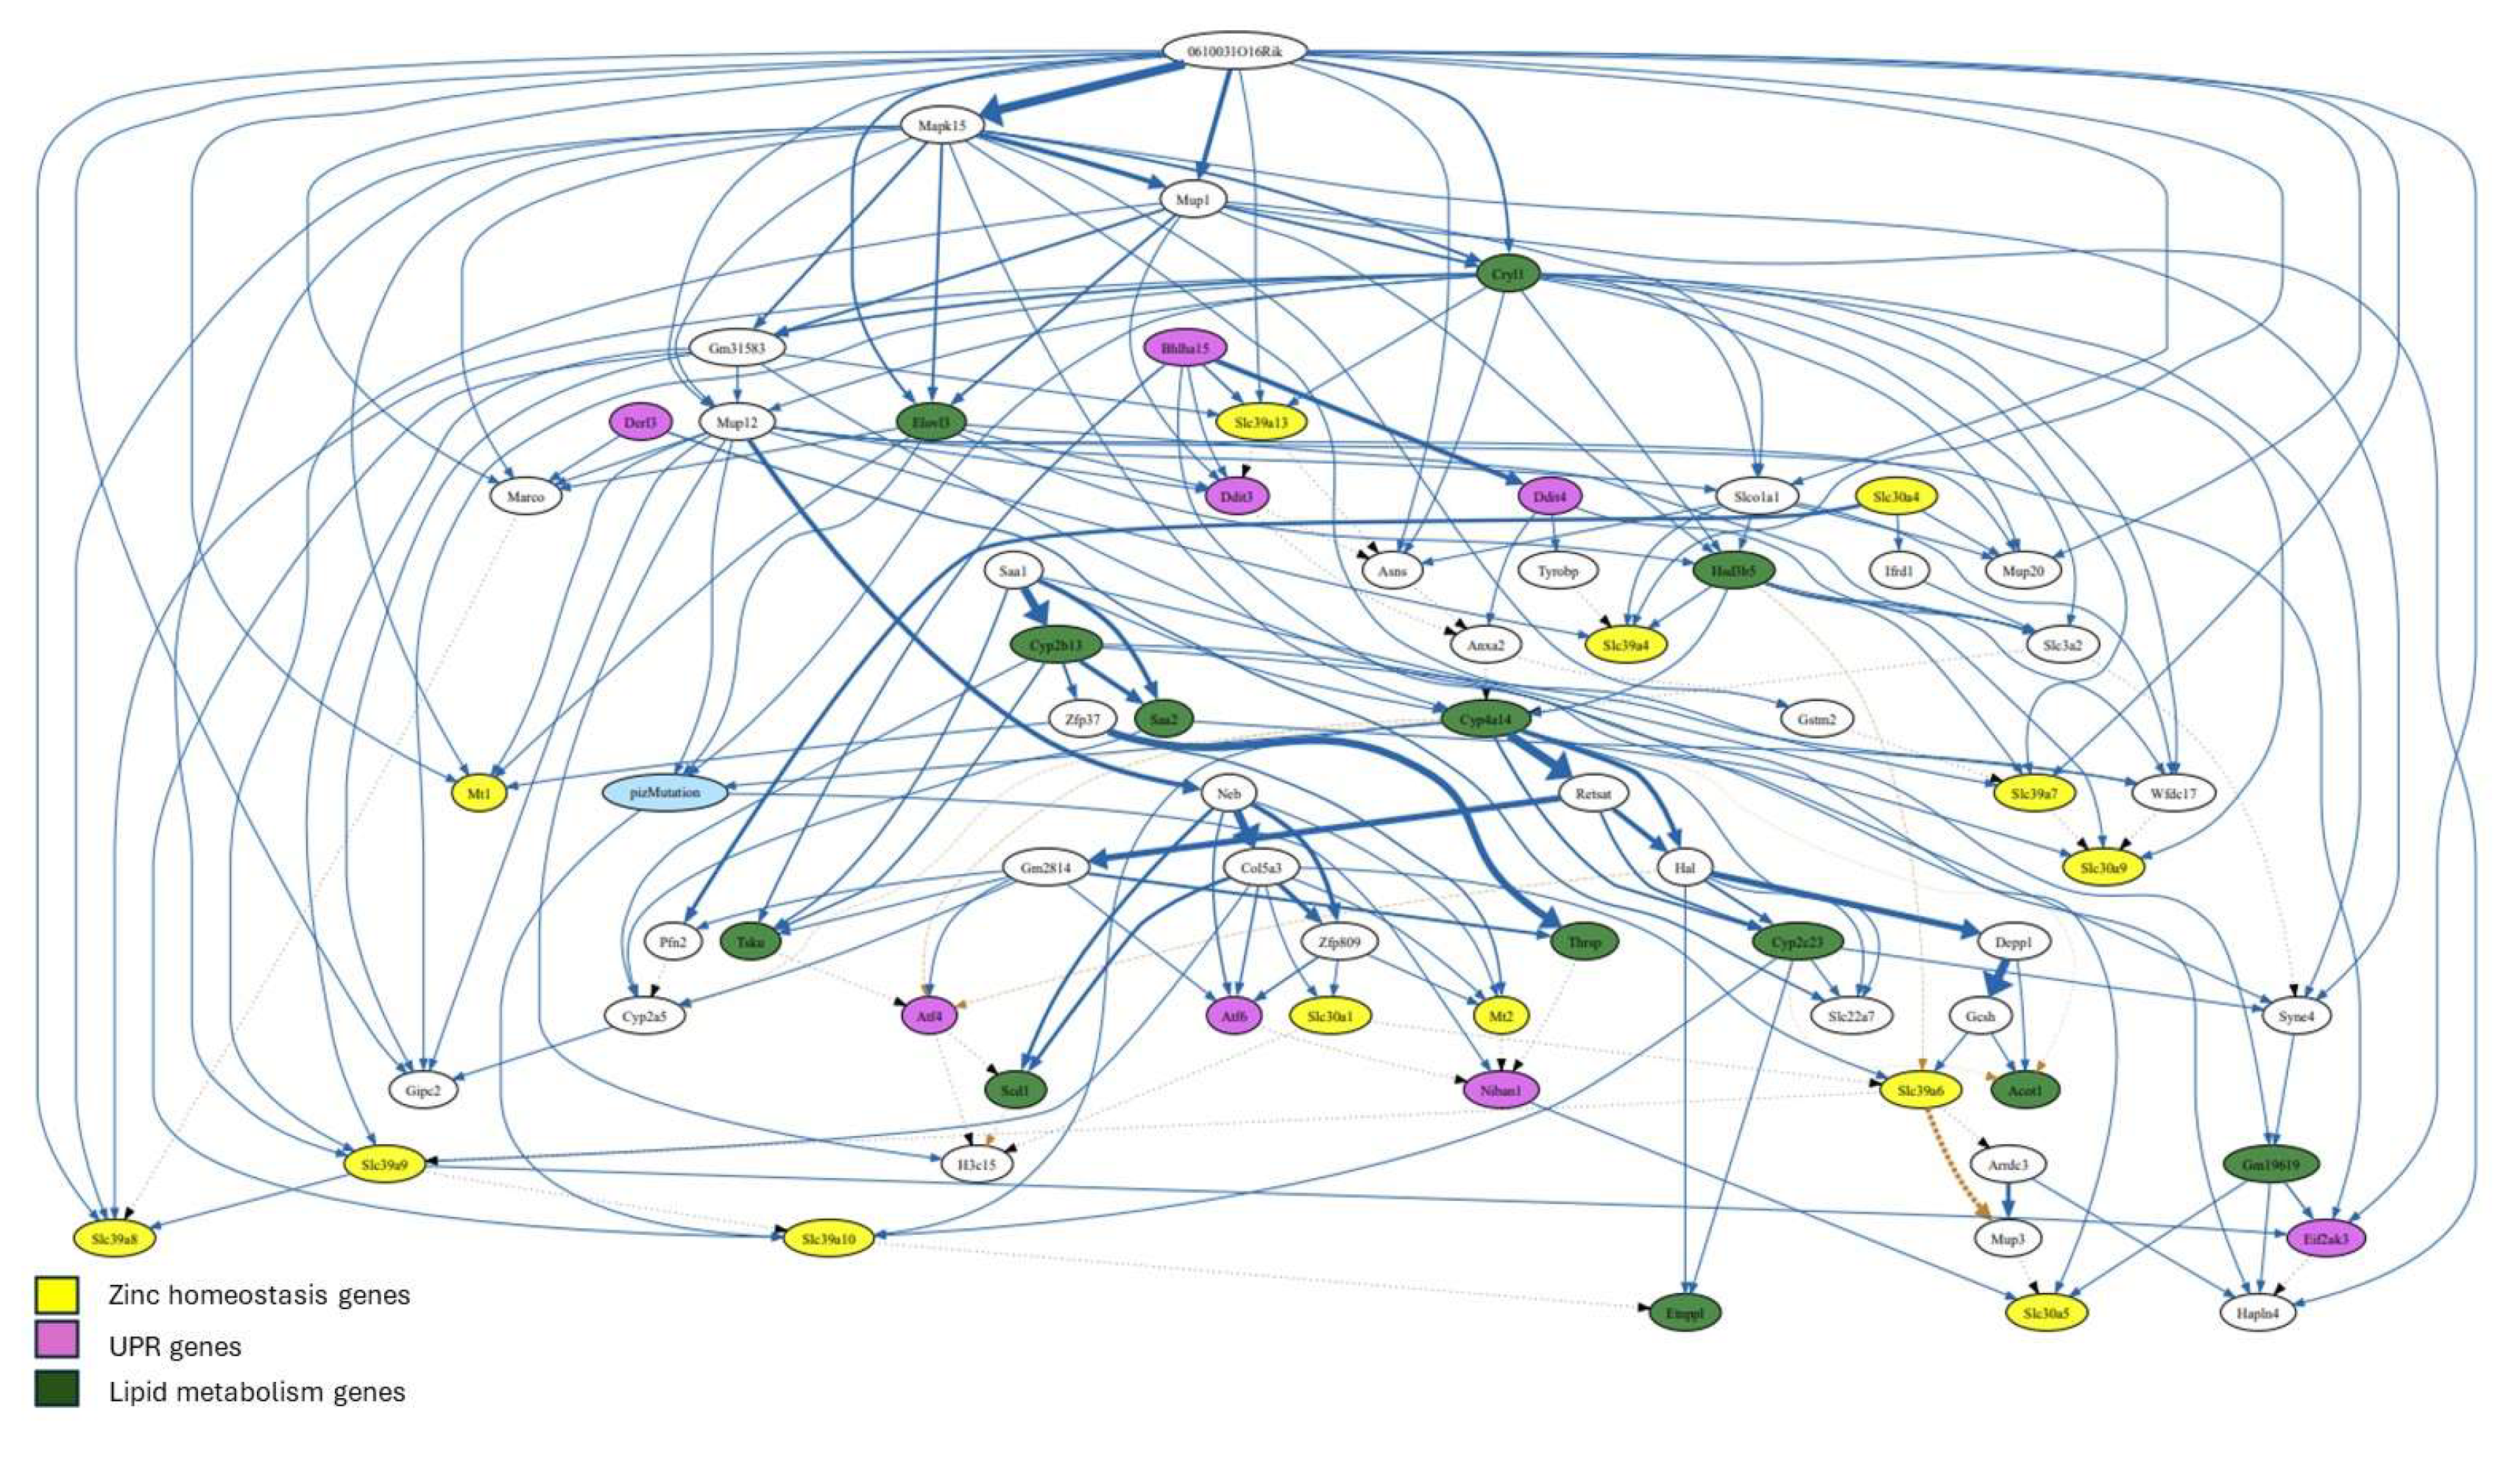
The BN structure that best fits the data revealed a second-degree MB of PiZ, defined as MB(MB(PiZ)) earlier, consisting of 68 genes (Figure 4), while the first-degree MB of PiZ comprised 12 genes (Figure 5).
The first-degree MB of PiZ shows the genes (nodes) that are in close association with the PiZ mutation. Specifically, the MB pf PiZ consists of PiZ’s parents, children, and the co-parents (nodes that share a child with the PiZ mutation) (Figure 5). Genes associated with zinc homeostasis (Mt2, Slc39a9, and Slc39a10) (18), UPR (Atf6 and Niban1) (36), and lipid metabolism (Elovl3, Thrsp, Cyp2c23, Cyp4a14, and Cryl1 (37-41) were identified within the first-degree MB. Mup12 and Gm31583 were part of the first-degree MB; however, their biological roles are not well defined. MUP12, or Major Urinary Protein 12, is a protein-coding gene found in mice. This gene belongs to the lipocalin family, which is involved in transporting small hydrophobic molecules like pheromone (42).
The first-degree Markov blanket (MB) of PiZ reveals that the PiZ mutation is directly linked to Slc39a10, which, in turn, is associated with Slc39a9 through an inhibitory interaction. Mt2, Atf6 and Thrsp are not directly connected to the PiZ mutation but have an inhibitory interaction with Niban1 (Figure 5).
The combinations of 2 and 3 genes “status” with maximum probabilities associated with PiZ mutation within the first-degree MB of PiZ were determined (Table 3). The expression of the UPR gene Niban1 was found to be “high” when in combination with the genes Elovl3 and Mt2 or Cyp4a14 and Thrsp “under no change” status.
The second-degree MB of PiZ extends beyond the first-degree MB of PiZ by including nodes that are two steps away from the target node (PiZ). This MB contains a total of thirteen genes associated with zinc homeostasis and lipid metabolism. However, at total eight UPR genes were identified within this network (Figure 4). The network shows significant connections between some of these three types of genes as well as with genes involved in other biological processes. The diagram suggests that the expression of Slc39a13 is positively regulated by the UPR associated genes Bhlha15 and Ddit3. A similar interaction was found between Slc30a5, Bhlha15, and Niban1. Additionally, Slc39a9 is connected to Slc39a6, Slc39a8, Slc39a10, and the UPR associated gene Eif2ak3.
Slc39a7 was found to be connected to Slc30a9, Mapk15, The long non-coding RNA (lncRNA) 0610031O16Rik, Gstm2, Cryl1, and Hsd3b5.
Lastly, 0610031O16Rik was at the top of the network and exhibited connections (as positive regulator) with multiple genes, including Mapk15, Mt1, Slc39a7, Slc39a8, and Eif2ak3. The analysis indicated a connection with strong significancy (ticker line) between 0610031O16Rik and Mapk15.
Figure 4.
Second-degree Markov blanket of PiZ. The significancy of connection between genes is proportional to the thickness of the lines. In addition, dotted lines indicate inhibition. .
Figure 4.
Second-degree Markov blanket of PiZ. The significancy of connection between genes is proportional to the thickness of the lines. In addition, dotted lines indicate inhibition. .
3.6. GeNIe Simulations.
We carried out simulations utilizing GeNIe(Bayes Fusion LLC) in which we artificially modified the expression of Slc39a7 as well as the mutation conditions: PiZ and wild type (Figure 1S). We observed that, under PiZ mutation (simulated 100%) (Figure 1SB), and simulated high expression (100%) of Slc39a7, there was an important increase in the expression of the UPR associated genes Atf4, Ddit3, Bhha15, Eif2ak3, and Niban1, and the zinc homeostasis gene Slc39a13. However, the expression of Slc30a5 and Slc30a9 decreased. On the other hand, when the condition was set to “wild type” 100% and “high Slc39a7” (Figure 1SC), the expression of most UPR associated genes, Slc39a13, and Slc30a5 become mostly “no change” or low in the case of Eif2ak3. Interestedly, the expression of Slc39a9 decreased while Slc39a8 and Slc39a10 increased. However, the expression of Slc30a9 remained low.
4. Discussion
To our knowledge, this is the first study that investigates the effect AATD in zinc metabolism. Additionally, this is the first study to use BN analysis to evaluate the co-regulatory relationship between zinc homeostasis, UPR genes, and other genes using a murine model of AATD. The studies with the hepatocytes indicated that overexpression of the mutant Z version of AAT had detrimental effect on labile zinc in cells under zinc deficiency and zinc adequate conditions. This suggests that the Z mutation may be detrimental to hepatocytes zinc status. Interestingly, the mutation did not significantly affect labile zinc in cells exposed to excess zinc. Perhaps, zinc supplementation could help compensate for the negative effects of AATD on zinc status. Inasmuch as intracellular distribution of labile zinc was not examined, it is unknown whether the mutation affected the intracellular localization of labile zinc. Furthermore, it is uncertain whether the total zinc concentration of zinc is affected by the mutation.
Of importance, the overexpression of the Z allele was also associated with dysregulation of several zinc transporters in cultured hepatocytes and in liver in mice (GEO dataseries). However, it is important to note that the dysregulation of these genes was not entirely consistent, and some results showed divergence.
It is not clear why the “in vitro study” and the studies in mice produced different results. Hormonal and immune factors and systemic interactions could play a role. Metallothioneins are known to be upregulated by glucocorticoids and by inflammation (43,44), which could influence their expression in liver in mice.
Additionally, it is important to mention that the wild type used in the “in vitro” hepatocyte study overexpresses the human MM variant (considered wild type) of AAT, whereas the wild-type mice, serving as controls for the PiZ mice, do not express human AAT. On the other hand, the techniques employed to obtain the transcriptomic data of the two data series are different, which may have contributed to the differences observed between these two studies. GSE93115 contains data originated from cDNA microarray analysis and GSE141593 data originated from RNA-seq analysis.
The BN analysis helped identify novel interactions (MB) between zinc transporters, UPR associated genes, other genes and PiZ mutation in liver in mice.
The first-degree Markov blanket (MB) of PiZ revealed a close relationship between the PiZ mutation and Slc39a10, Slc39a9, and Mt2. Alterations in the expression of these genes could influence zinc levels within specific cellular compartments, triggering signals that initiate intracellular responses.
Slc39a9 has been identified at the trans-Golgi network, plasma membrane, mitochondria, and nucleus (45,46). This transporter is thought to contribute to zinc homeostasis within the secretory pathway (45). In contrast, Slc39a10 is localized at the plasma membrane of hepatocytes, and its expression is negatively regulated by zinc levels (47.) The first-degree MB of PiZ also shows an inhibitory interaction between Slc39a9 and Slc39a10 (Figure 5). Perhaps, Slc39a9’s zinc transport activity has a negative impact on the expression of Slc39a10.
The second-degree MB of PiZ included provided additional information regarding the interactions among genes. Slc39a7 is located at ER and its upregulation is expected to decrease zinc content at ER, which increases ER stress. Noteworthy, Slc39a7 was found to be consistently upregulated in both mice studies (Table 1).
The GenNIE simulations allowed us to investigate the effect of artificial upregulation/downregulation of a particular gene on the expression of other genes. Interestingly, when Slc39a7 expression was set to high 100% (Figure 1SB), there was an increased expression of key UPR linked genes, under PiZ but not under wild-type condition (Figure 1SC). This suggests that Slc39a7 upregulation could be part of the UPR response associated with the Z mutation (Figure 6). Supporting the notion that this gene is involved in the unfolded protein response (UPR), its expression was shown to be upregulated in 293T cells following exposure to the ER stress inducers tunicamycin and thapsigargin (48).
Interestingly, the expression of Slc30a5 and Slc30a9 appears to be inversely regulated with Slc39a7, suggesting a negative correlation in their regulatory dynamics (Figure 1SB). However, only the expression of Slc30a5 returned to mostly “no-change” under the “wild type” condition (Figure 1SC). This suggests that the coregulation between Slc39a7 and Slc30a9 appears to function independently of the PiZ/mutation status.
Given the location of Slc30a5 the downregulation of this transporter is expected to decrease levels of zinc within ER and Golgi apparatus (Figure 6). Slc30a9 has been identified at the mitochondria, ER, and nucleus (48,49). Deng et al. (49) highlighted the critical role of this transporter in facilitating zinc export from mitochondria in both C. elegans and human cells. Their study revealed that the absence of Slc30a9 led to increased zinc accumulation within mitochondria, resulting in mitochondrial swelling and impaired metabolic function. This is not surprising because excess zinc can cause an increase of Reactive oxygen species (ROS) and loss of mitochondrial membrane potential (50). The role of Slc30a9 at ER remains unexplored. Nevertheless, data from GSE167299 revealed that the expression of this gene was significantly downregulated (p < 0.05) in the liver of mice following tunicamycin treatment (51). This suggests that the downregulation of this gene may play a role in the unfolded protein response (UPR).
The simulation also showed coregulation between Slc39a7 and Slc39a13 (Figure 1S). However, this coregulation was enhanced by the presence of 100% PiZ mutation. Slc39a13 has been identified at the Golgi apparatus (52). Its upregulation is expected to facilitate zinc transport out of the Golgi, which, alongside the downregulation of Slc30a5, could lead to significant zinc depletion in the early secretory pathway (Figure 6). However, it is important to note the conflicting evidence regarding the role of Slc39a13. Jeong et al. (52) suggested that this transporter serves as an exporter of zinc from intracellular vesicles for utilization in the ER.
The coregulation of Slc39a7 with Slc30a5, Slc30a9, and Slc39a13 may indicate a crosstalk mechanism between the endoplasmic reticulum (ER) and mitochondria. During ER stress, the increased release of zinc from the ER and other compartments, coupled with a reduced export of this metal from mitochondria, could contribute to increased ROS production and apoptosis (Figure 6).
5. Conclusions
BNs offer distinct advantages over traditional statistics and bioinformatics in discovering gene-gene and gene-environment interactions. In this study, through the use of this approach we were able to obtain insight into potential new regulatory mechanisms particularly involving zinc homeostasis and UPR linked genes, without the use of laboratory experiments.
A critical limitation of focusing solely on mRNA expression for BN analysis, particularly of transcription factors and enzymes, is that it does not necessarily reflect their activity which may depend on phosphorylation status or other post-translational modifications.
However, as AI becomes more sophisticated, it would be possible to incorporate more variables into the probabilistic prediction which will make possible the development of more realistic simulations of cells behavior.
Author Contributions
Conceptualization, J.P.L. and C.Y.; methodology, J.P.L., C.Y., and S.G.; software, C.Y. and S.G.; validation, J.P.L, C.Y. and S.G.; formal analysis, J.P.L, C.Y., M.A.B., and S.G.; investigation, J.P.L, C.Y., R.V. and S.G.; resources J.P.L, C.Y., and M.A.B; data curation, J.P.L, C.Y. and S.G.; writing—original draft preparation, J.P.L and C.Y.; writing—review and editing, J.P.L, C.Y., S.G. and M.A.B.; visualization, .; supervision, J.P.L. and C.Y.; project administration, J.P.L. and C.Y.; funding acquisition, N/A. All authors have read and agreed to the published version of the manuscript.
Funding
This research received no external funding.
Institutional Review Board Statement
Cell culture procedures were approved by the Institutional Biosafety Committee of Florida International University.
Data Availability Statement
The original contributions presented in this study are included in the article/supplementary material. Further inquiries can be directed to the corresponding author(s).
Conflicts of Interest
The authors declare no conflicts of interest.
Abbreviations
The following abbreviations are used in this manuscript:
| UPR | Unfolded protein response |
| MB | Markov Blanket |
| ER | Endoplasmic reticulum |
| ROS | Reactive oxygen species |
| BN | Bayesian Network |
| ERAD | ER-associated degradation |
| AAT | Alpha-1 antitrypsin |
| AATD | Alpha-1 antitrypsin |
| ATZ | Alpha-1 antitrypsin mutant Z |
| PiZ | Alpha-1 antitrypsin mutant Z |
| AI | Artificial Intelligence |
References
- Seixas S, Marques PI. Known Mutations at the Cause of Alpha-1 Antitrypsin Deficiency an Updated Overview of SERPINA1 Variation Spectrum. Appl Clin Genet. 2021 Mar 22;14:173-194. PMID: 33790624; PMCID: PMC7997584. [CrossRef]
- Teckman JH, Perlmutter DH. The endoplasmic reticulum degradation pathway for mutant secretory proteins alpha1-antitrypsin Z and S is distinct from that for an unassembled membrane protein. J Biol Chem. 1996 May 31;271(22):13215-20. PMID: 8662752. [CrossRef]
- Rondanelli M, Gasparri C, Razza C, Ferraris C, Perna S, Ferrarotti I, Corsico AG. Practical dietary advices for subjects with alpha-1 antitrypsin deficiency. Biomed Pharmacother. 2023 Jul;163:114753. Epub 2023 Apr 27. PMID: 37119738. [CrossRef]
- Schaefer B, Haschka D, Finkenstedt A, Petersen BS, Theurl I, Henninger B, Janecke AR, Wang CY, Lin HY, Veits L, Vogel W, Weiss G, Franke A, Zoller H. Impaired hepcidin expression in alpha-1-antitrypsin deficiency associated with iron overload and progressive liver disease. Hum Mol Genet. 2015 Nov 1;24(21):6254-63. Epub 2015 Aug 26. PMID: 26310624; PMCID: PMC4599680. [CrossRef]
- Elzouki AN, Hultcrantz R, Stål P, Befrits R, Eriksson S. Increased PiZ gene frequency for alpha 1 antitrypsin in patients with genetic haemochromatosis. Gut. 1995 Jun;36(6):922-6. PMID: 7615285; PMCID: PMC1382634. [CrossRef]
- Rabinovitz M, Gavaler JS, Kelly RH, Van Thiel DH. Association between heterozygous alpha 1-antitrypsin deficiency and genetic hemochromatosis. Hepatology. 1992 Jul;16(1):145-8. PMID: 1618466. [CrossRef]
- Cousins RJ. Regulatory aspects of zinc metabolism in liver and intestine. Nutr Rev. 1979 Apr;37(4):97-103. PMID: 503370. [CrossRef]
- Stamoulis I, Kouraklis G, Theocharis S. Zinc and the liver: an active interaction. Dig Dis Sci. 2007 Jul;52(7):1595-612. PMID: 17415640. [CrossRef]
- Qi Y, Zhang Z, Liu S, Aluo Z, Zhang L, Yu L, Li Y, Song Z, Zhou L. Zinc Supplementation Alleviates Lipid and Glucose Metabolic Disorders Induced by a High-Fat Diet. J Agric Food Chem. 2020 May 6;68(18):5189-5200. PMID: 32290656. [CrossRef]
- Zhou Z, Liu J, Song Z, McClain CJ, Kang YJ. Zinc supplementation inhibits hepatic apoptosis in mice subjected to a long-term ethanol exposure. Exp Biol Med (Maywood). 2008 May;233(5):540-8. PMID: 18375824; PMCID: PMC5895093. [CrossRef]
- Zhong W, Zhao Y, Sun X, Song Z, McClain CJ, Zhou Z. Dietary zinc deficiency exaggerates ethanol-induced liver injury in mice: involvement of intrahepatic and extrahepatic factors. PLoS One. 2013 Oct 14;8(10):e76522. PMID: 24155903; PMCID: PMC3796541. [CrossRef]
- Szuster-Ciesielska A, Plewka K, Daniluk J, Kandefer-Szerszeń M. Zinc supplementation attenuates ethanol- and acetaldehyde-induced liver stellate cell activation by inhibiting reactive oxygen species (ROS) production and by influencing intracellular signaling. Biochem Pharmacol. 2009 Aug 1;78(3):301-14. PMID: 19376089. [CrossRef]
- Liuzzi JP, Narayanan V, Doan H, Yoo C. Effect of zinc intake on hepatic autophagy during acute alcohol intoxication. Biometals. 2018 Apr;31(2):217-232. PMID: 29392448; PMCID: PMC5866217. [CrossRef]
- Kambe T, Matsunaga M, Takeda TA. Understanding the Contribution of Zinc Transporters in the Function of the Early Secretory Pathway. Int J Mol Sci. 2017 Oct 19;18(10):2179. PMID: 29048339; PMCID: PMC5666860. [CrossRef]
- Vembar SS, Brodsky JL. One step at a time: endoplasmic reticulum-associated degradation. Nat Rev Mol Cell Biol. 2008 Dec;9(12):944-57. PMID: 19002207; PMCID: PMC2654601. [CrossRef]
- Solovyov A, Gilbert HF. Zinc-dependent dimerization of the folding catalyst, protein disulfide isomerase. Protein Sci. 2004 Jul;13(7):1902-7. PMID: 15169950; PMCID: PMC2279941. [CrossRef]
- Kim MH, Aydemir TB, Cousins RJ. Dietary Zinc Regulates Apoptosis through the Phosphorylated Eukaryotic Initiation Factor 2α/Activating Transcription Factor-4/C/EBP-Homologous Protein Pathway during Pharmacologically Induced Endoplasmic Reticulum Stress in Livers of Mice. J Nutr. 2016 Nov;146(11):2180-2186. PMID: 27605406; PMCID: PMC5086795. [CrossRef]
- Cousins RJ, Liuzzi JP, Lichten LA. Mammalian zinc transport, trafficking, and signals. J Biol Chem. 2006 Aug 25;281(34):24085-9. PMID: 16793761. [CrossRef]
- Thornton JK, Taylor KM, Ford D, Valentine RA. Differential subcellular localization of the splice variants of the zinc transporter ZnT5 is dictated by the different C-terminal regions. PLoS One. 2011;6(8):e23878. PMID: 21887337; PMCID: PMC3161073. [CrossRef]
- Huang L, Kirschke CP, Gitschier J. Functional characterization of a novel mammalian zinc transporter, ZnT6. J Biol Chem. 2002 Jul 19;277(29):26389-95. PMID: 11997387. [CrossRef]
- Kirschke CP, Huang L. ZnT7, a novel mammalian zinc transporter, accumulates zinc in the Golgi apparatus. J Biol Chem. 2003 Feb 7;278(6):4096-102. PMID: 12446736. [CrossRef]
- Fukunaka A, Suzuki T, Kurokawa Y, Yamazaki T, Fujiwara N, Ishihara K, Migaki H, Okumura K, Masuda S, Yamaguchi-Iwai Y, Nagao M, Kambe T. Demonstration and characterization of the heterodimerization of ZnT5 and ZnT6 in the early secretory pathway. J Biol Chem. 2009 Nov 6;284(45):30798-806. PMID: 19759014; PMCID: PMC2781478. [CrossRef]
- Ishihara K, Yamazaki T, Ishida Y, Suzuki T, Oda K, Nagao M, Yamaguchi-Iwai Y, Kambe T. Zinc transport complexes contribute to the homeostatic maintenance of secretory pathway function in vertebrate cells. J Biol Chem. 2006 Jun 30;281(26):17743-50. PMID: 16636052. [CrossRef]
- Taylor KM, Morgan HE, Johnson A, Nicholson RI. Structure-function analysis of HKE4, a member of the new LIV-1 subfamily of zinc transporters. Biochem J. 2004 Jan 1;377(Pt 1):131-9. PMID: 14525538; PMCID: PMC1223853. [CrossRef]
- Bin BH, Bhin J, Seo J, Kim SY, Lee E, Park K, Choi DH, Takagishi T, Hara T, Hwang D, Koseki H, Asada Y, Shimoda S, Mishima K, Fukada T. Requirement of Zinc Transporter SLC39A7/ZIP7 for Dermal Development to Fine-Tune Endoplasmic Reticulum Function by Regulating Protein Disulfide Isomerase. J Invest Dermatol. 2017 Aug;137(8):1682-1691. PMID: 28545780. [CrossRef]
- Kim MH, Aydemir TB, Kim J, Cousins RJ. Hepatic ZIP14-mediated zinc transport is required for adaptation to endoplasmic reticulum stress. Proc Natl Acad Sci U S A. 2017 Jul 18;114(29):E5805-E5814. PMID: 28673968; PMCID: PMC5530682. [CrossRef]
- Teckman JH, Perlmutter DH. Retention of mutant alpha(1)-antitrypsin Z in endoplasmic reticulum is associated with an autophagic response. Am J Physiol Gastrointest Liver Physiol. 2000 Nov;279(5):G961-74. PMID: 11052993. [CrossRef]
- Liuzzi JP, Bobo JA, Lichten LA, Samuelson DA, Cousins RJ. Responsive transporter genes within the murine intestinal-pancreatic axis form a basis of zinc homeostasis. Proc Natl Acad Sci U S A. 2004 Oct 5;101(40):14355-60. PMID: 15381762; PMCID: PMC521973. [CrossRef]
- Attanasio S, Ferriero R, Gernoux G, De Cegli R, Carissimo A, Nusco E, Campione S, Teckman J, Mueller C, Piccolo P, Brunetti-Pierri N. CHOP and c-JUN up-regulate the mutant Z α1-antitrypsin, exacerbating its aggregation and liver proteotoxicity. J Biol Chem. 2020 Sep 18;295(38):13213-13223. PMID: 32723872; PMCID: PMC7504927. [CrossRef]
- Davis, S. and P.S. Meltzer, GEOquery: a bridge between the Gene Expression Omnibus (GEO) and BioConductor. Bioinformatics, 2007. 23(14): p. 1846-1847. PMID: 17496320. [CrossRef]
- Love, M.I., W. Huber, and S. Anders, Moderated estimation of fold change and dispersion for RNA-seq data with DESeq2. Genome biology, 2014. 15: p. 1-21. PMID: 25516281; PMCID: PMC4302049. [CrossRef]
- Pastore N, Attanasio S, Granese B, Castello R, Teckman J, Wilson AA, Ballabio A, Brunetti-Pierri N. Activation of the c-Jun N-terminal kinase pathway aggravates proteotoxicity of hepatic mutant Z alpha1-antitrypsin. Hepatology. 2017 Jun;65(6):1865-1874. PMID: 28073160; PMCID: PMC5485069. [CrossRef]
- Pearl, J., Probabilistic Reasoning in Intelligent Systems. Representation and Reasoning, ed. R.J. Brachman. 1988, San Mateo, CA: Morgan Kaufmann. ISBN: 978-1-55860-479-7.
- Heckerman, D. A Bayesian approach to learning causal networks. 1995. San Francisco, CA: Morgan Kaufmann.
- Hartemink, A.J. and H. Berger, Banjo is licensed from Duke University. Copyright© 2005-2008 by Alexander J. Hartemink. All rights reserved. 2005.
- Tsukumo Y, Tomida A, Kitahara O, Nakamura Y, Asada S, Mori K, Tsuruo T. Nucleobindin 1 controls the unfolded protein response by inhibiting ATF6 activation. J Biol Chem. 2007 Oct 5;282(40):29264-72. PMID: 17686766. [CrossRef]
- Qin Z, Wang P, Chen W, Wang JR, Ma X, Zhang H, Zhang WJ, Wei C. Hepatic ELOVL3 is dispensable for lipid metabolism in mice. Biochem Biophys Res Commun. 2023 May 28;658:128-135. PMID: 37030067. [CrossRef]
- Kuemmerle NB, Kinlaw WB. THRSP (thyroid hormone responsive). Atlas Genet Cytogenet Oncol Haematol. 2011 Jun;15(6):480-482. PMID: 24174994; PMCID: PMC3809912.
- Sarparast M, Dattmore D, Alan J, Lee KSS. Cytochrome P450 Metabolism of Polyunsaturated Fatty Acids and Neurodegeneration. Nutrients. 2020 Nov 16;12(11):3523. PMID: 33207662; PMCID: PMC7696575. [CrossRef]
- Zhang X, Li S, Zhou Y, Su W, Ruan X, Wang B, Zheng F, Warner M, Gustafsson JÅ, Guan Y. Ablation of cytochrome P450 omega-hydroxylase 4A14 gene attenuates hepatic steatosis and fibrosis. Proc Natl Acad Sci U S A. 2017 Mar 21;114(12):3181-3185. Epub 2017 Mar 7. Erratum in: Proc Natl Acad Sci U S A. 2023 Oct 17;120(42):e2315591120. PMID: 28270609; PMCID: PMC5373383. [CrossRef]
- Feng L, Ding G, Zhou Y, Zhu H, Jiang H. Downregulation of Crystallin Lambda 1 is a New Independent Prognostic Marker in Clear Cell Renal Cell Carcinoma. Pharmgenomics Pers Med. 2022 Oct 10;15:857-866. PMID: 36246497; PMCID: PMC9563328. [CrossRef]
- Real MVF, Colvin MS, Sheehan MJ, Moeller AH. Major urinary protein (Mup) gene family deletion drives sex-specific alterations on the house mouse gut microbiota. bioRxiv [Preprint]. 2023 Aug 1:2023.08.01.551491. PMID: 37577672; PMCID: PMC10418228. [CrossRef]
- Quaife C, Hammer RE, Mottet NK, Palmiter RD. Glucocorticoid regulation of metallothionein during murine development. Dev Biol. 1986 Dec;118(2):549-55. PMID: 3792622. [CrossRef]
- Dai H, Wang L, Li L, Huang Z, Ye L. Metallothionein 1: A New Spotlight on Inflammatory Diseases. Front Immunol. 2021 Nov 5;12:739918. PMID: 34804020; PMCID: PMC8602684. [CrossRef]
- Matsuura W, Yamazaki T, Yamaguchi-Iwai Y, Masuda S, Nagao M, Andrews GK, Kambe T. SLC39A9 (ZIP9) regulates zinc homeostasis in the secretory pathway: characterization of the ZIP subfamily I protein in vertebrate cells. Biosci Biotechnol Biochem. 2009 May;73(5):1142-8. PMID: 19420709. [CrossRef]
- Thomas P, Pang Y, Dong J, Berg AH. Identification and characterization of membrane androgen receptors in the ZIP9 zinc transporter subfamily: II. Role of human ZIP9 in testosterone-induced prostate and breast cancer cell apoptosis. Endocrinology. 2014 Nov;155(11):4250-65. PMID: 25014355; PMCID: PMC4197988. [CrossRef]
- Lichten LA, Ryu MS, Guo L, Embury J, Cousins RJ. MTF-1-mediated repression of the zinc transporter Zip10 is alleviated by zinc restriction. PLoS One. 2011;6(6):e21526. PMID: 21738690; PMCID: PMC3124522. [CrossRef]
- Ohashi W, Kimura S, Iwanaga T, Furusawa Y, Irié T, Izumi H, Watanabe T, Hijikata A, Hara T, Ohara O, Koseki H, Sato T, Robine S, Mori H, Hattori Y, Watarai H, Mishima K, Ohno H, Hase K, Fukada T. Zinc Transporter SLC39A7/ZIP7 Promotes Intestinal Epithelial Self-Renewal by Resolving ER Stress. PLoS Genet. 2016 Oct 13;12(10):e1006349. PMID: 27736879; PMCID: PMC5065117. [CrossRef]
- Deng H, Qiao X, Xie T, Fu W, Li H, Zhao Y, Guo M, Feng Y, Chen L, Zhao Y, Miao L, Chen C, Shen K, Wang X. SLC-30A9 is required for Zn2+ homeostasis, Zn2+ mobilization, and mitochondrial health. Proc Natl Acad Sci U S A. 2021 Aug 31;118(35):e2023909118. PMID: 34433664; PMCID: PMC8536367. [CrossRef]
- Liu HY, Gale JR, Reynolds IJ, Weiss JH, Aizenman E. The Multifaceted Roles of Zinc in Neuronal Mitochondrial Dysfunction. Biomedicines. 2021 Apr 29;9(5):489. PMID: 33946782; PMCID: PMC8145363. [CrossRef]
- Shui G, Yang X, Yang X, Qiang G, Liew CW, Du G. Integration of Metabolomics and Transcriptomics Reveals Ketone Body and Lipid Metabolism Disturbance Related to ER Stress in the Liver. J Proteome Res. 2021 Aug 6;20(8):3875-3888. PMID: 34270263. [CrossRef]
- Fukada T, Civic N, Furuichi T, Shimoda S, Mishima K, Higashiyama H, Idaira Y, Asada Y, Kitamura H, Yamasaki S, Hojyo S, Nakayama M, Ohara O, Koseki H, Dos Santos HG, Bonafe L, Ha-Vinh R, Zankl A, Unger S, Kraenzlin ME, Beckmann JS, Saito I, Rivolta C, Ikegawa S, Superti-Furga A, Hirano T. The zinc transporter SLC39A13/ZIP13 is required for connective tissue development; its involvement in BMP/TGF-beta signaling pathways. PLoS One. 2008;3(11):e3642. PMID: 18985159; PMCID: PMC2575416. [CrossRef]
- Jeong J, Walker JM, Wang F, Park JG, Palmer AE, Giunta C, Rohrbach M, Steinmann B, Eide DJ. Promotion of vesicular zinc efflux by ZIP13 and its implications for spondylocheiro dysplastic Ehlers-Danlos syndrome. Proc Natl Acad Sci U S A. 2012 Dec 18;109(51):E3530-8. PMID: 23213233; PMCID: PMC3529093. [CrossRef]
Figure 1.
Diagram illustrating hypothetical gene-gene interactions in response to stress.
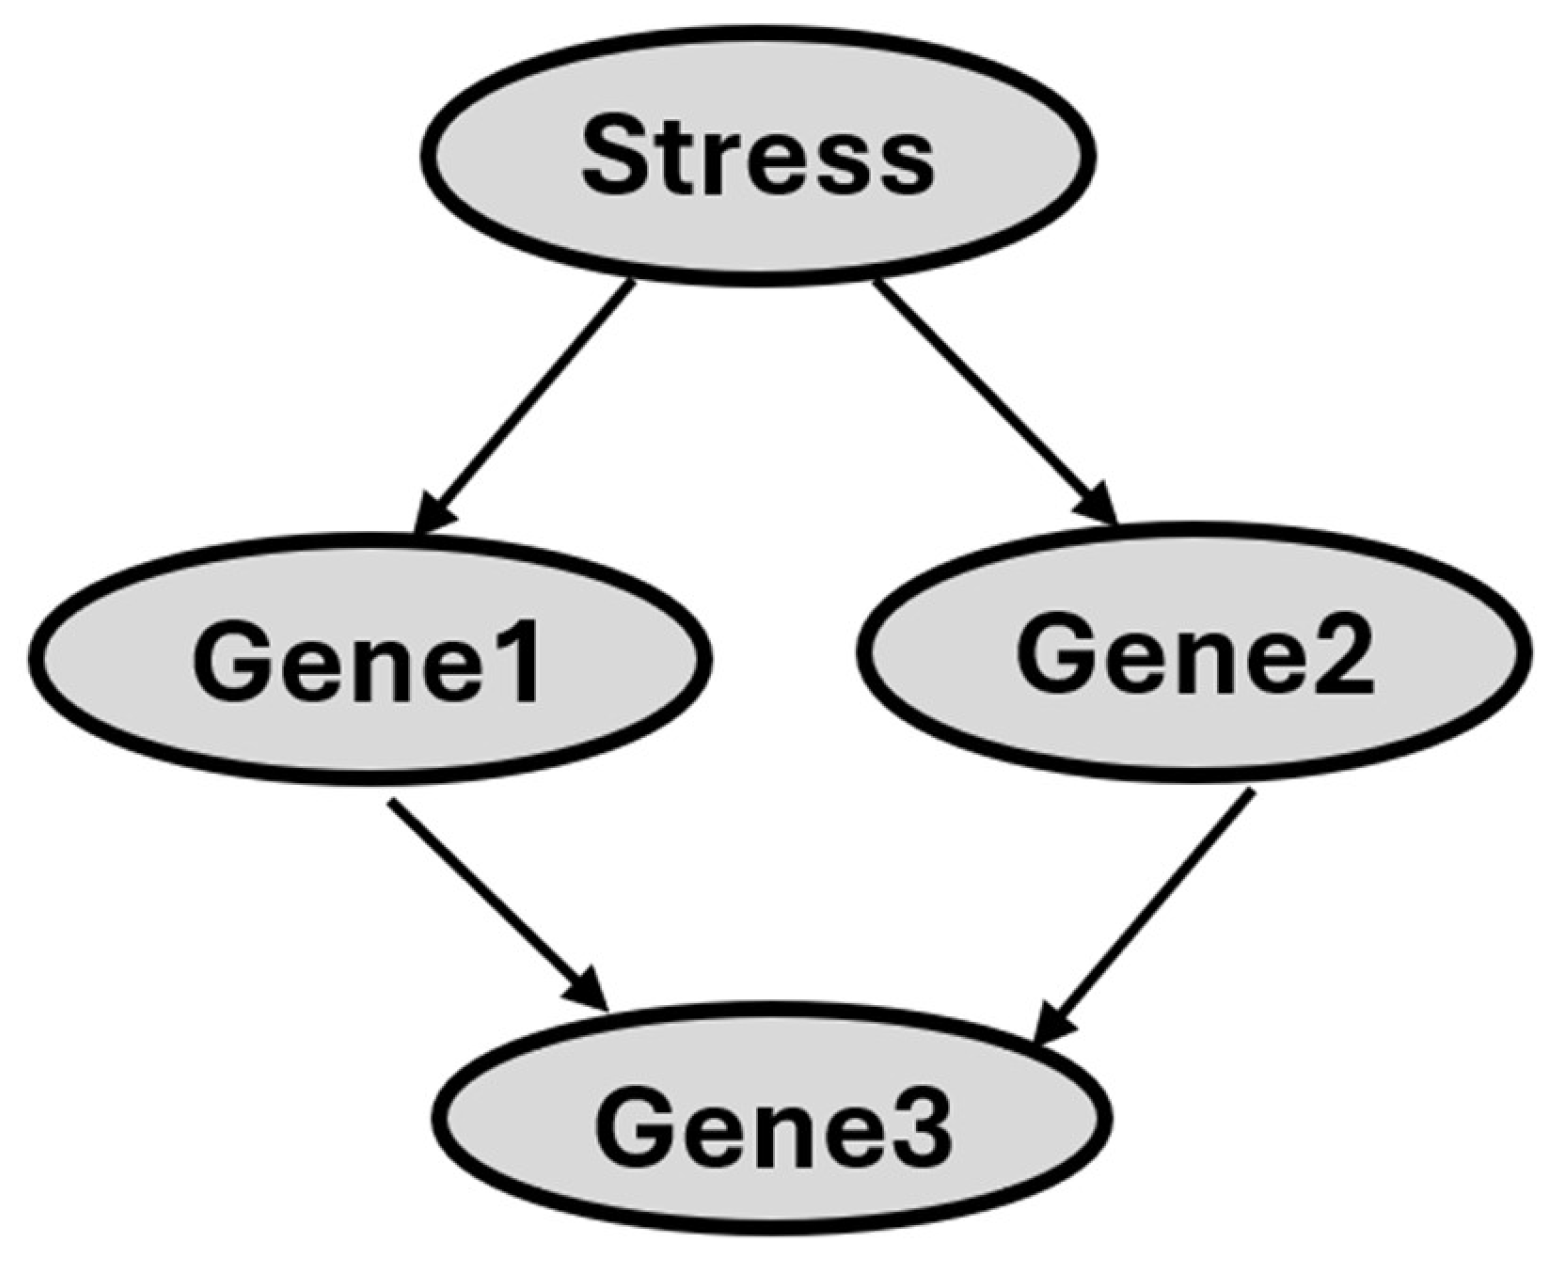
Figure 2.
Representative Western Blot showing AAT expression in Hepa 1-6 expressing either human wild type (WT) AAT or Z mutant AAT.
Figure 2.
Representative Western Blot showing AAT expression in Hepa 1-6 expressing either human wild type (WT) AAT or Z mutant AAT.
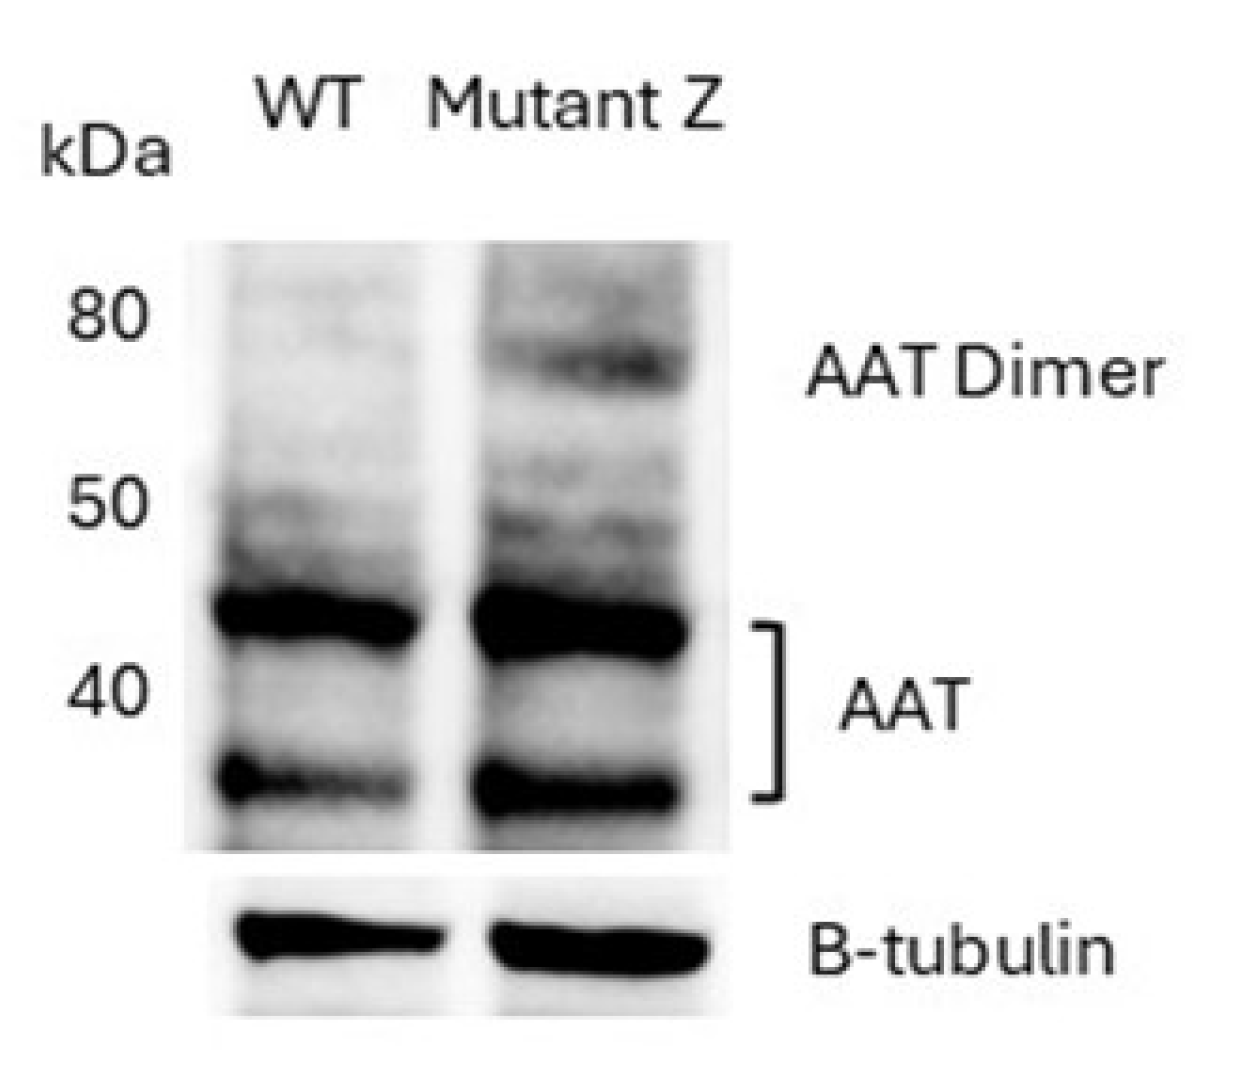
Figure 3.
Effect of human ATT (wild type (WT) or mutant Z (ATZ)) overexpression on labile zinc. Cells overexpressing mutant Z (ATZ) exhibit lower labile zinc levels. Cells were treated with TPEN (5 μM), vehicle alone (DMSO), or vehicle plus zinc (40 μM; Excess Zn) (ZnSO4) for 24h. Different superscript letters indicate statistical significance p<0.05. Values are average ±1 S.D. Two-Way ANOVA interaction: cell type vs. zinc levels (p>0.05).
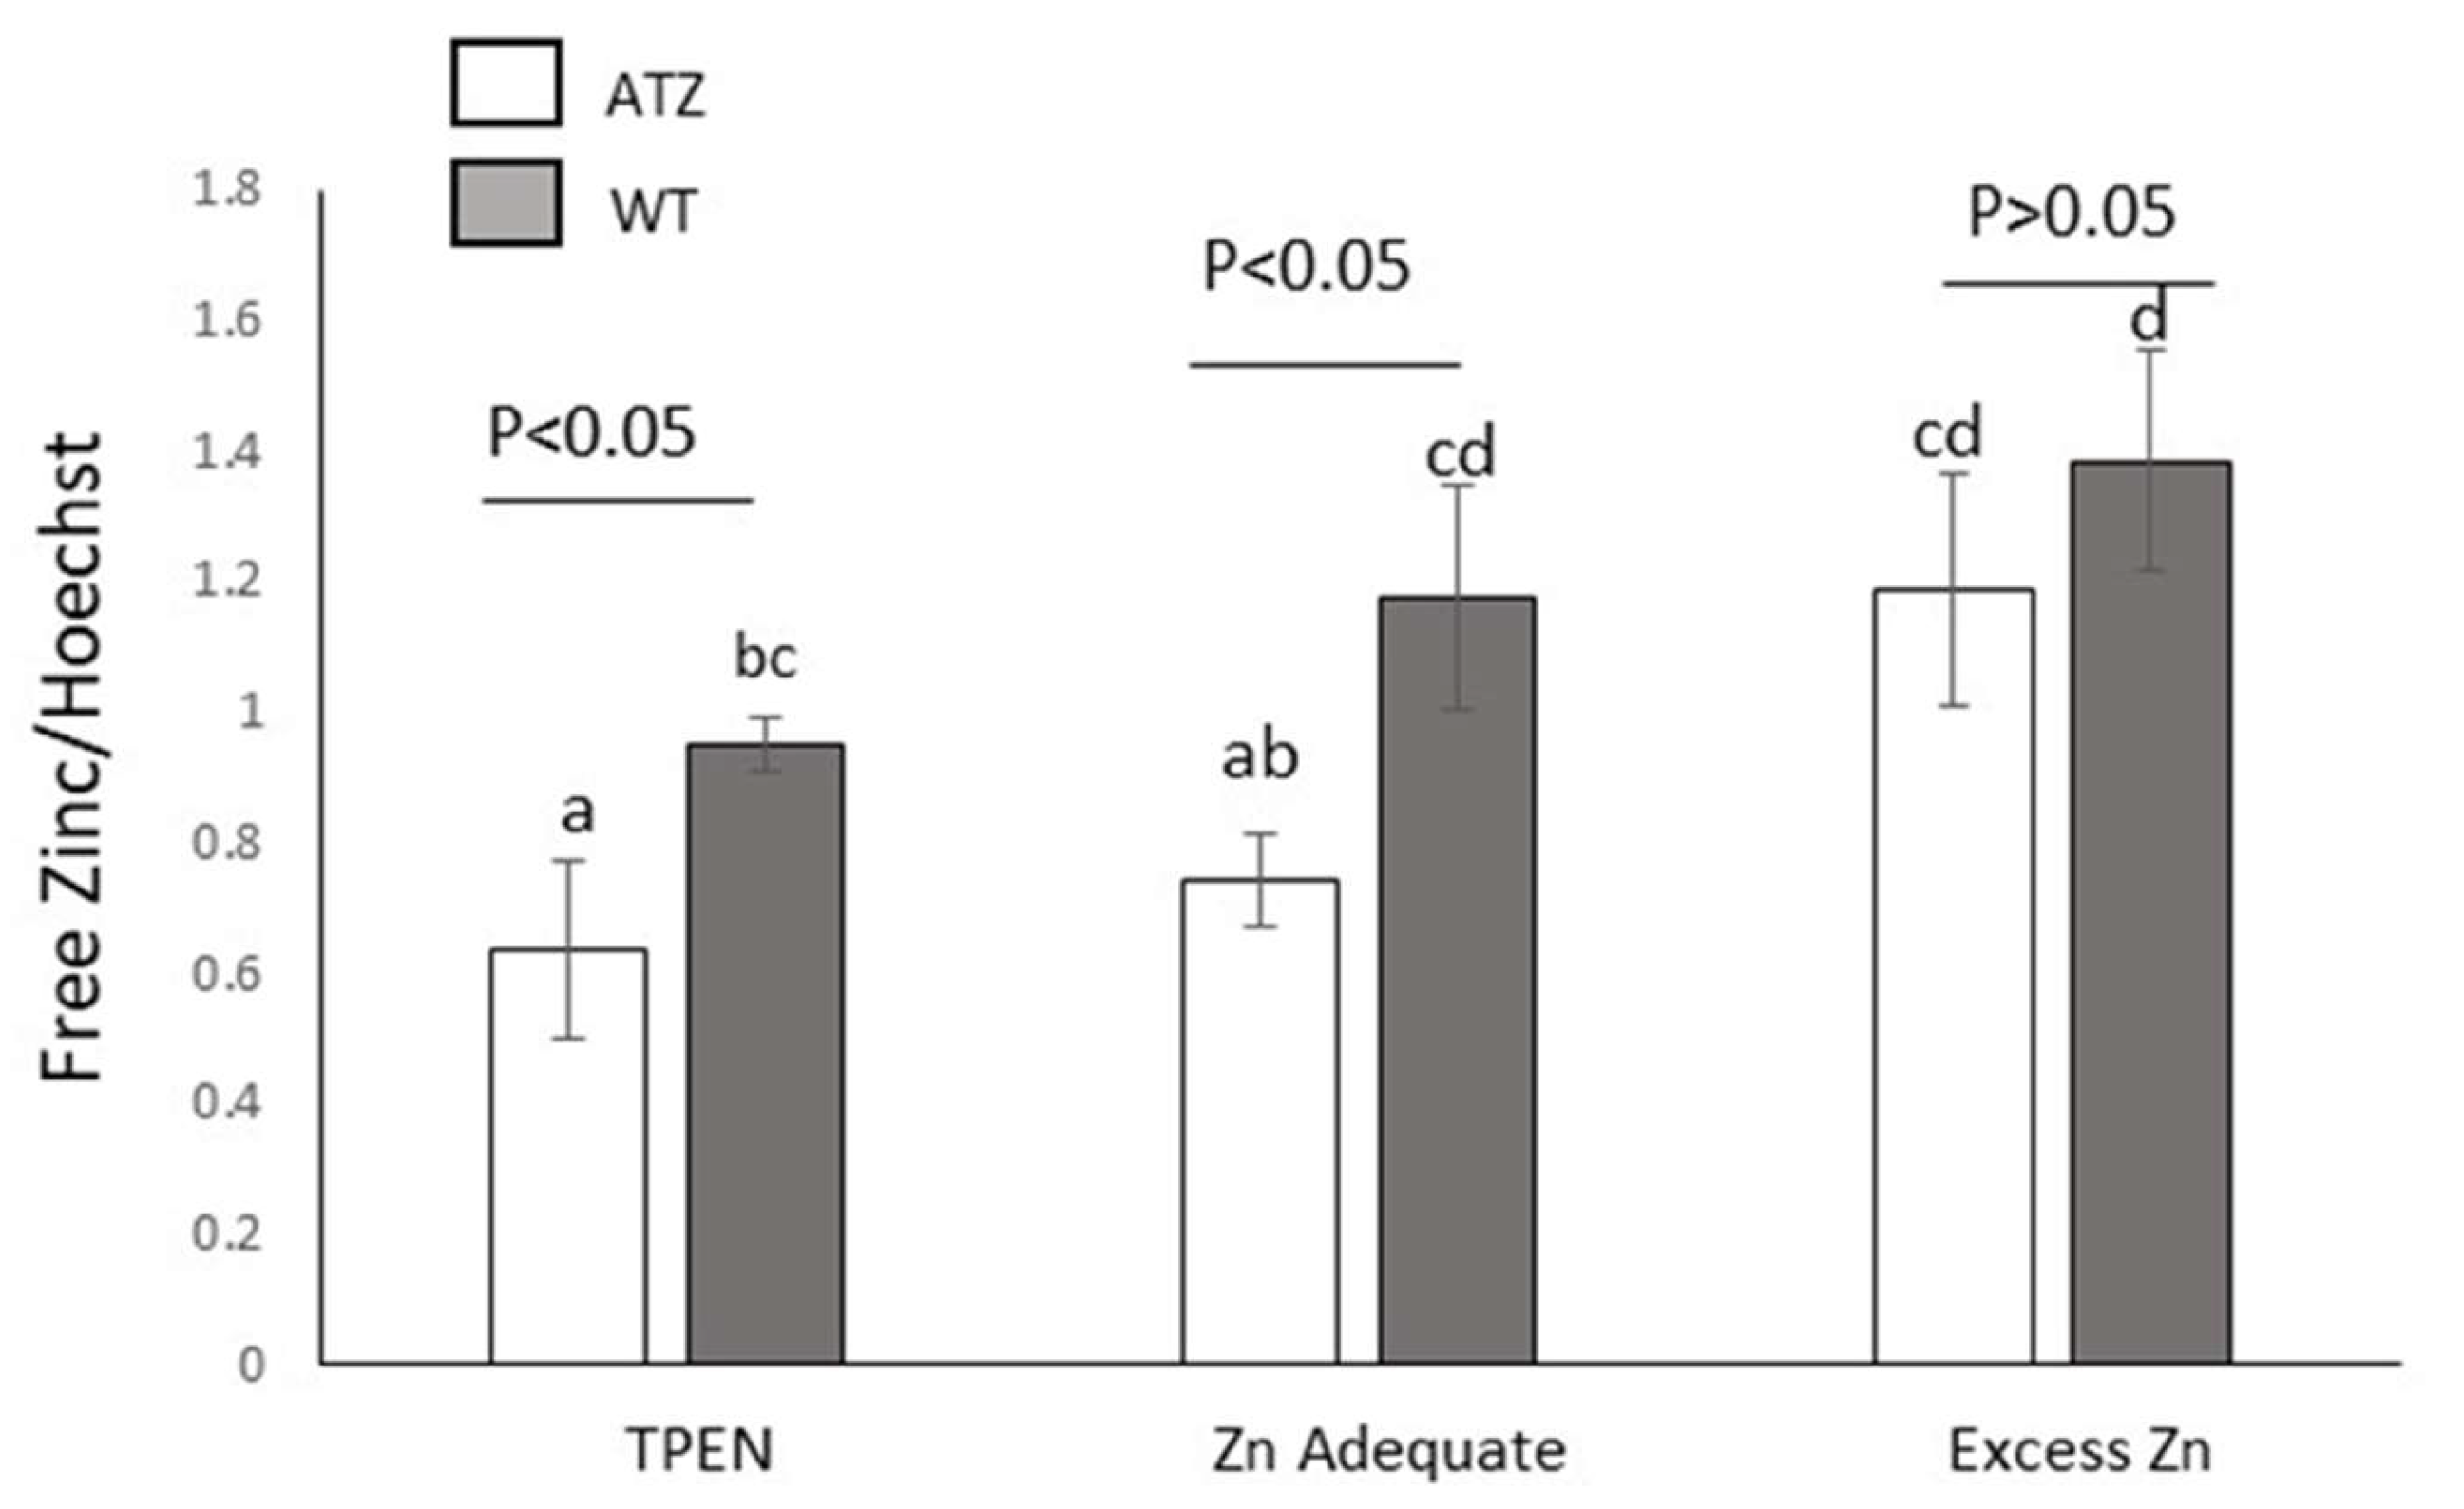
Figure 4.
Differential expression of zinc transporters and Mt1 and Mt2 in Hepa 1-6 cells expressing either wild type wild type (AAT) or mutant Z (ATZ). Values are Lg2 of fold change (ATZ/AAT). *p<0.05; ** p<0.001 Student’s T test (two tails). # p<0.05 Student’s T test (one tail).
Figure 4.
Differential expression of zinc transporters and Mt1 and Mt2 in Hepa 1-6 cells expressing either wild type wild type (AAT) or mutant Z (ATZ). Values are Lg2 of fold change (ATZ/AAT). *p<0.05; ** p<0.001 Student’s T test (two tails). # p<0.05 Student’s T test (one tail).
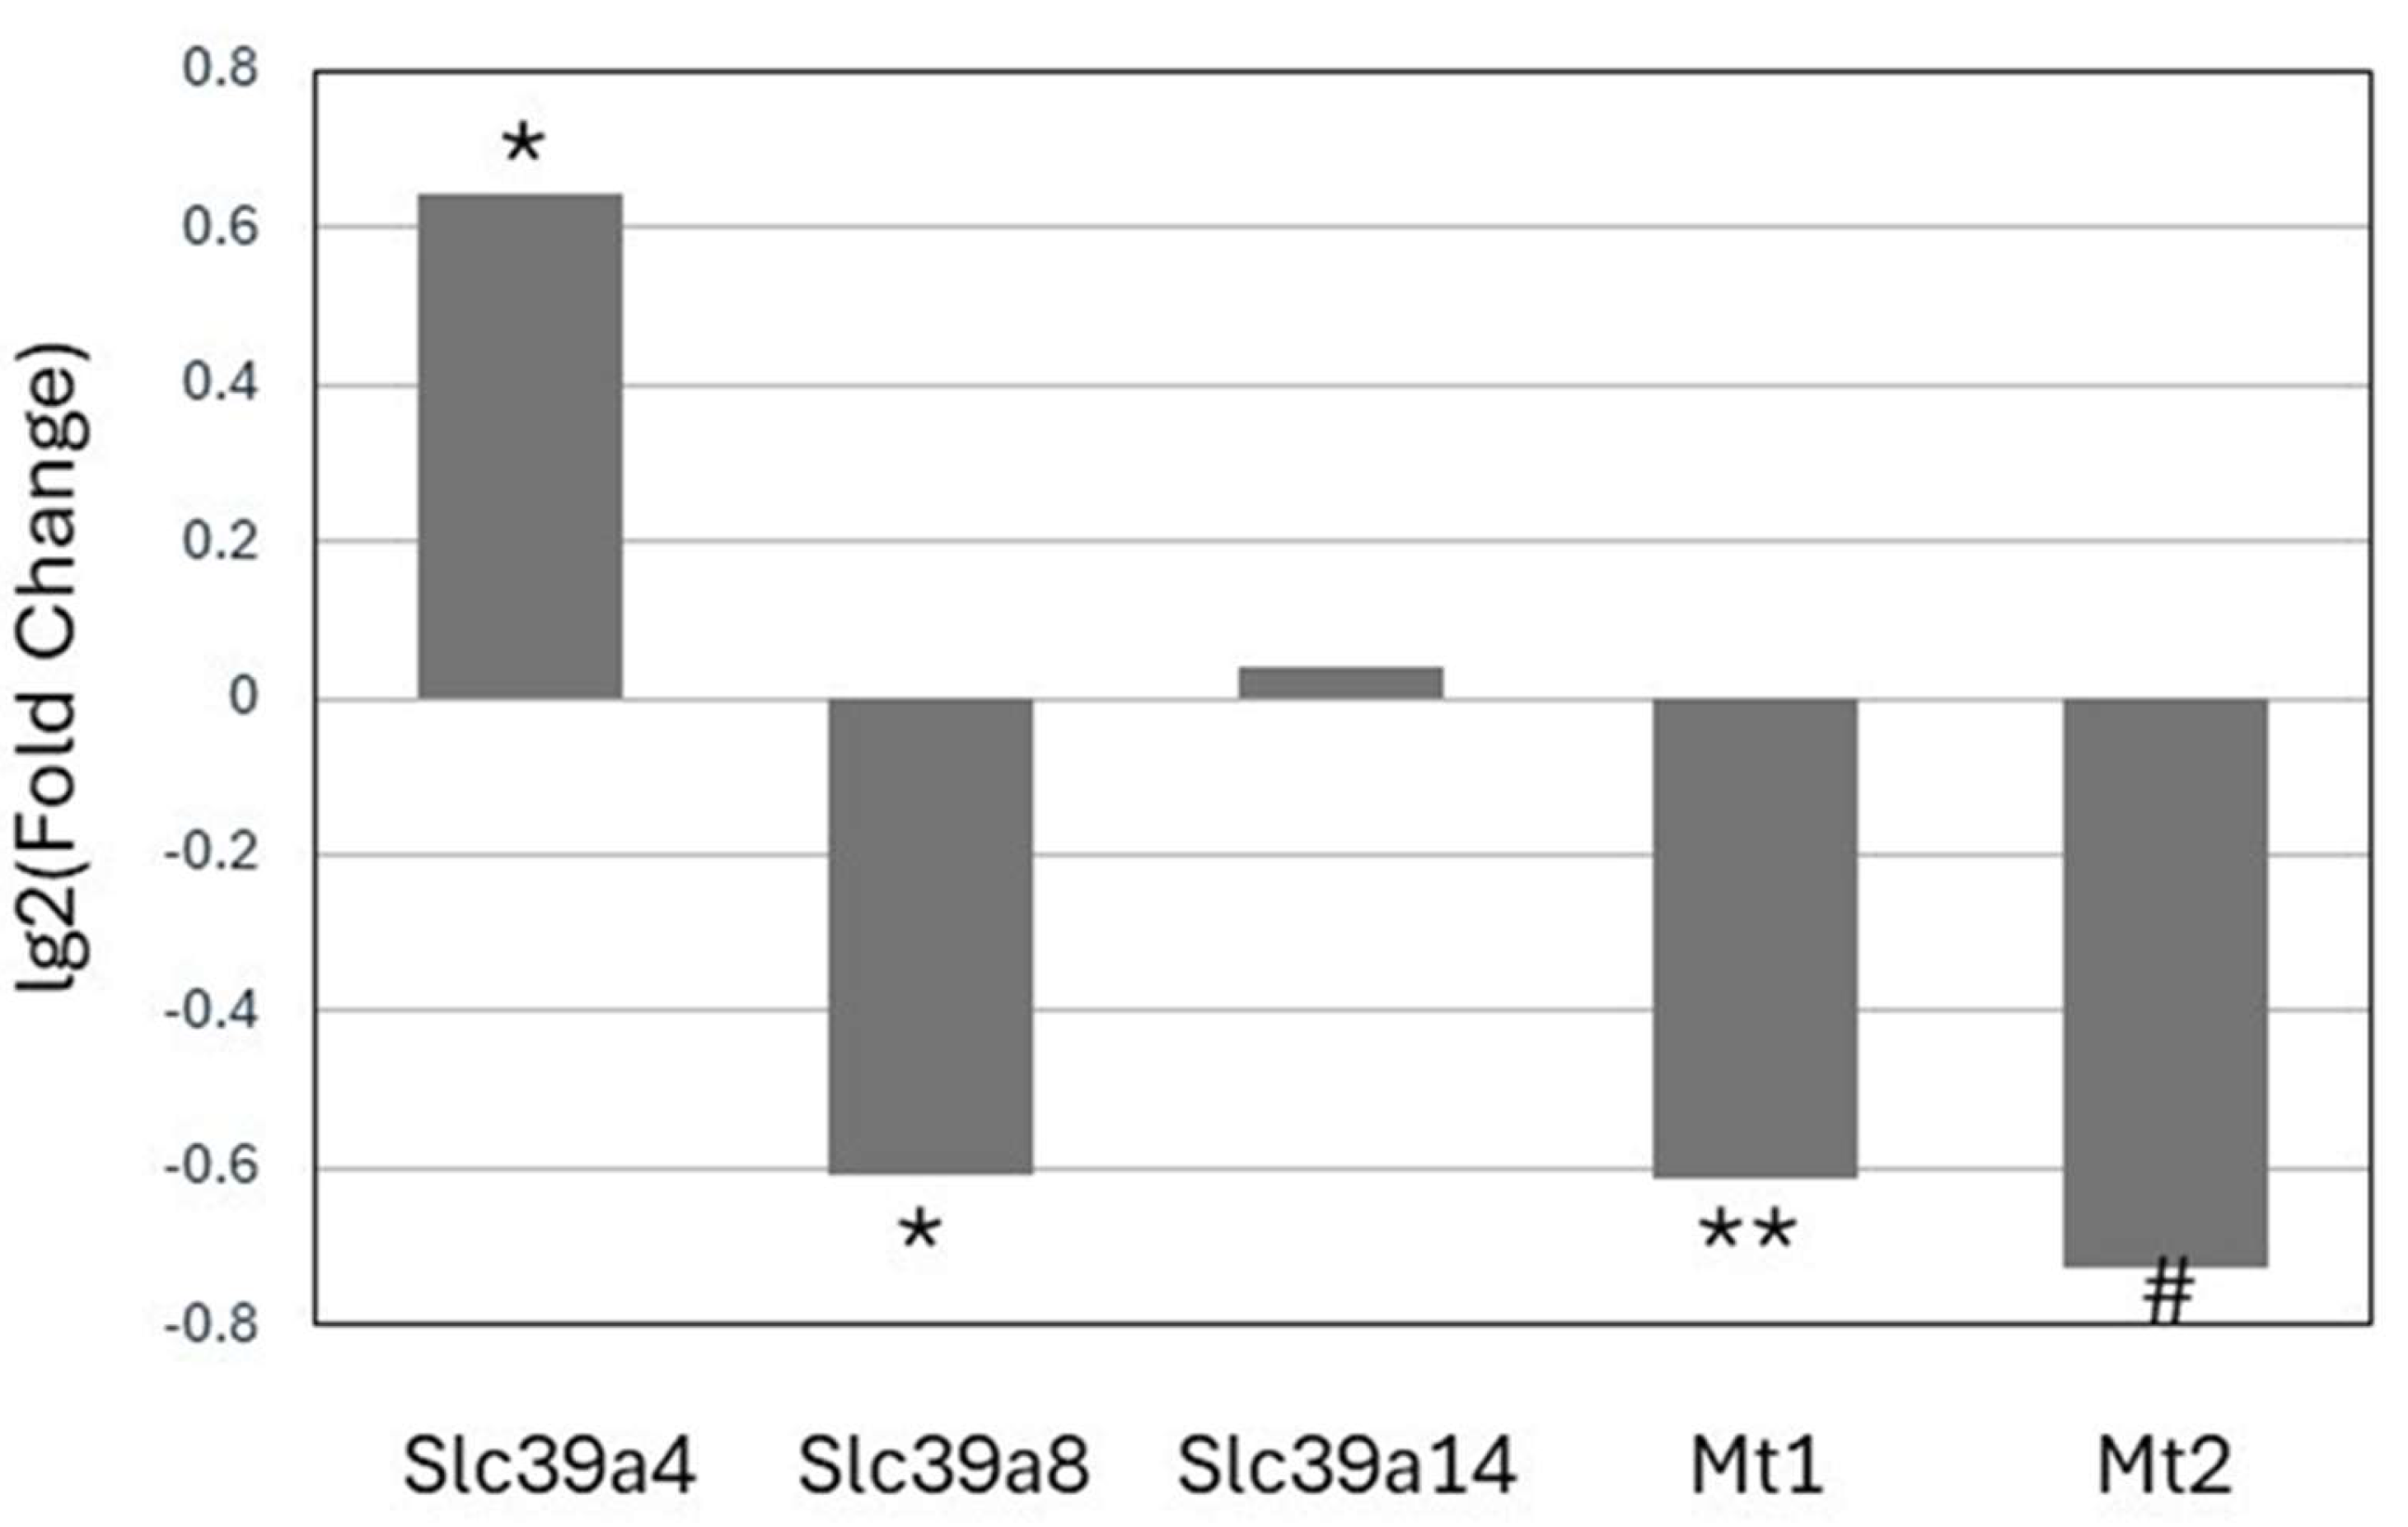
Figure 5.
First-degree Markov Blanket of PiZ. The significancy of connection between genes is proportional to the thickness of the lines. In addition, dotted lines indicate inhibition. .
Figure 5.
First-degree Markov Blanket of PiZ. The significancy of connection between genes is proportional to the thickness of the lines. In addition, dotted lines indicate inhibition. .
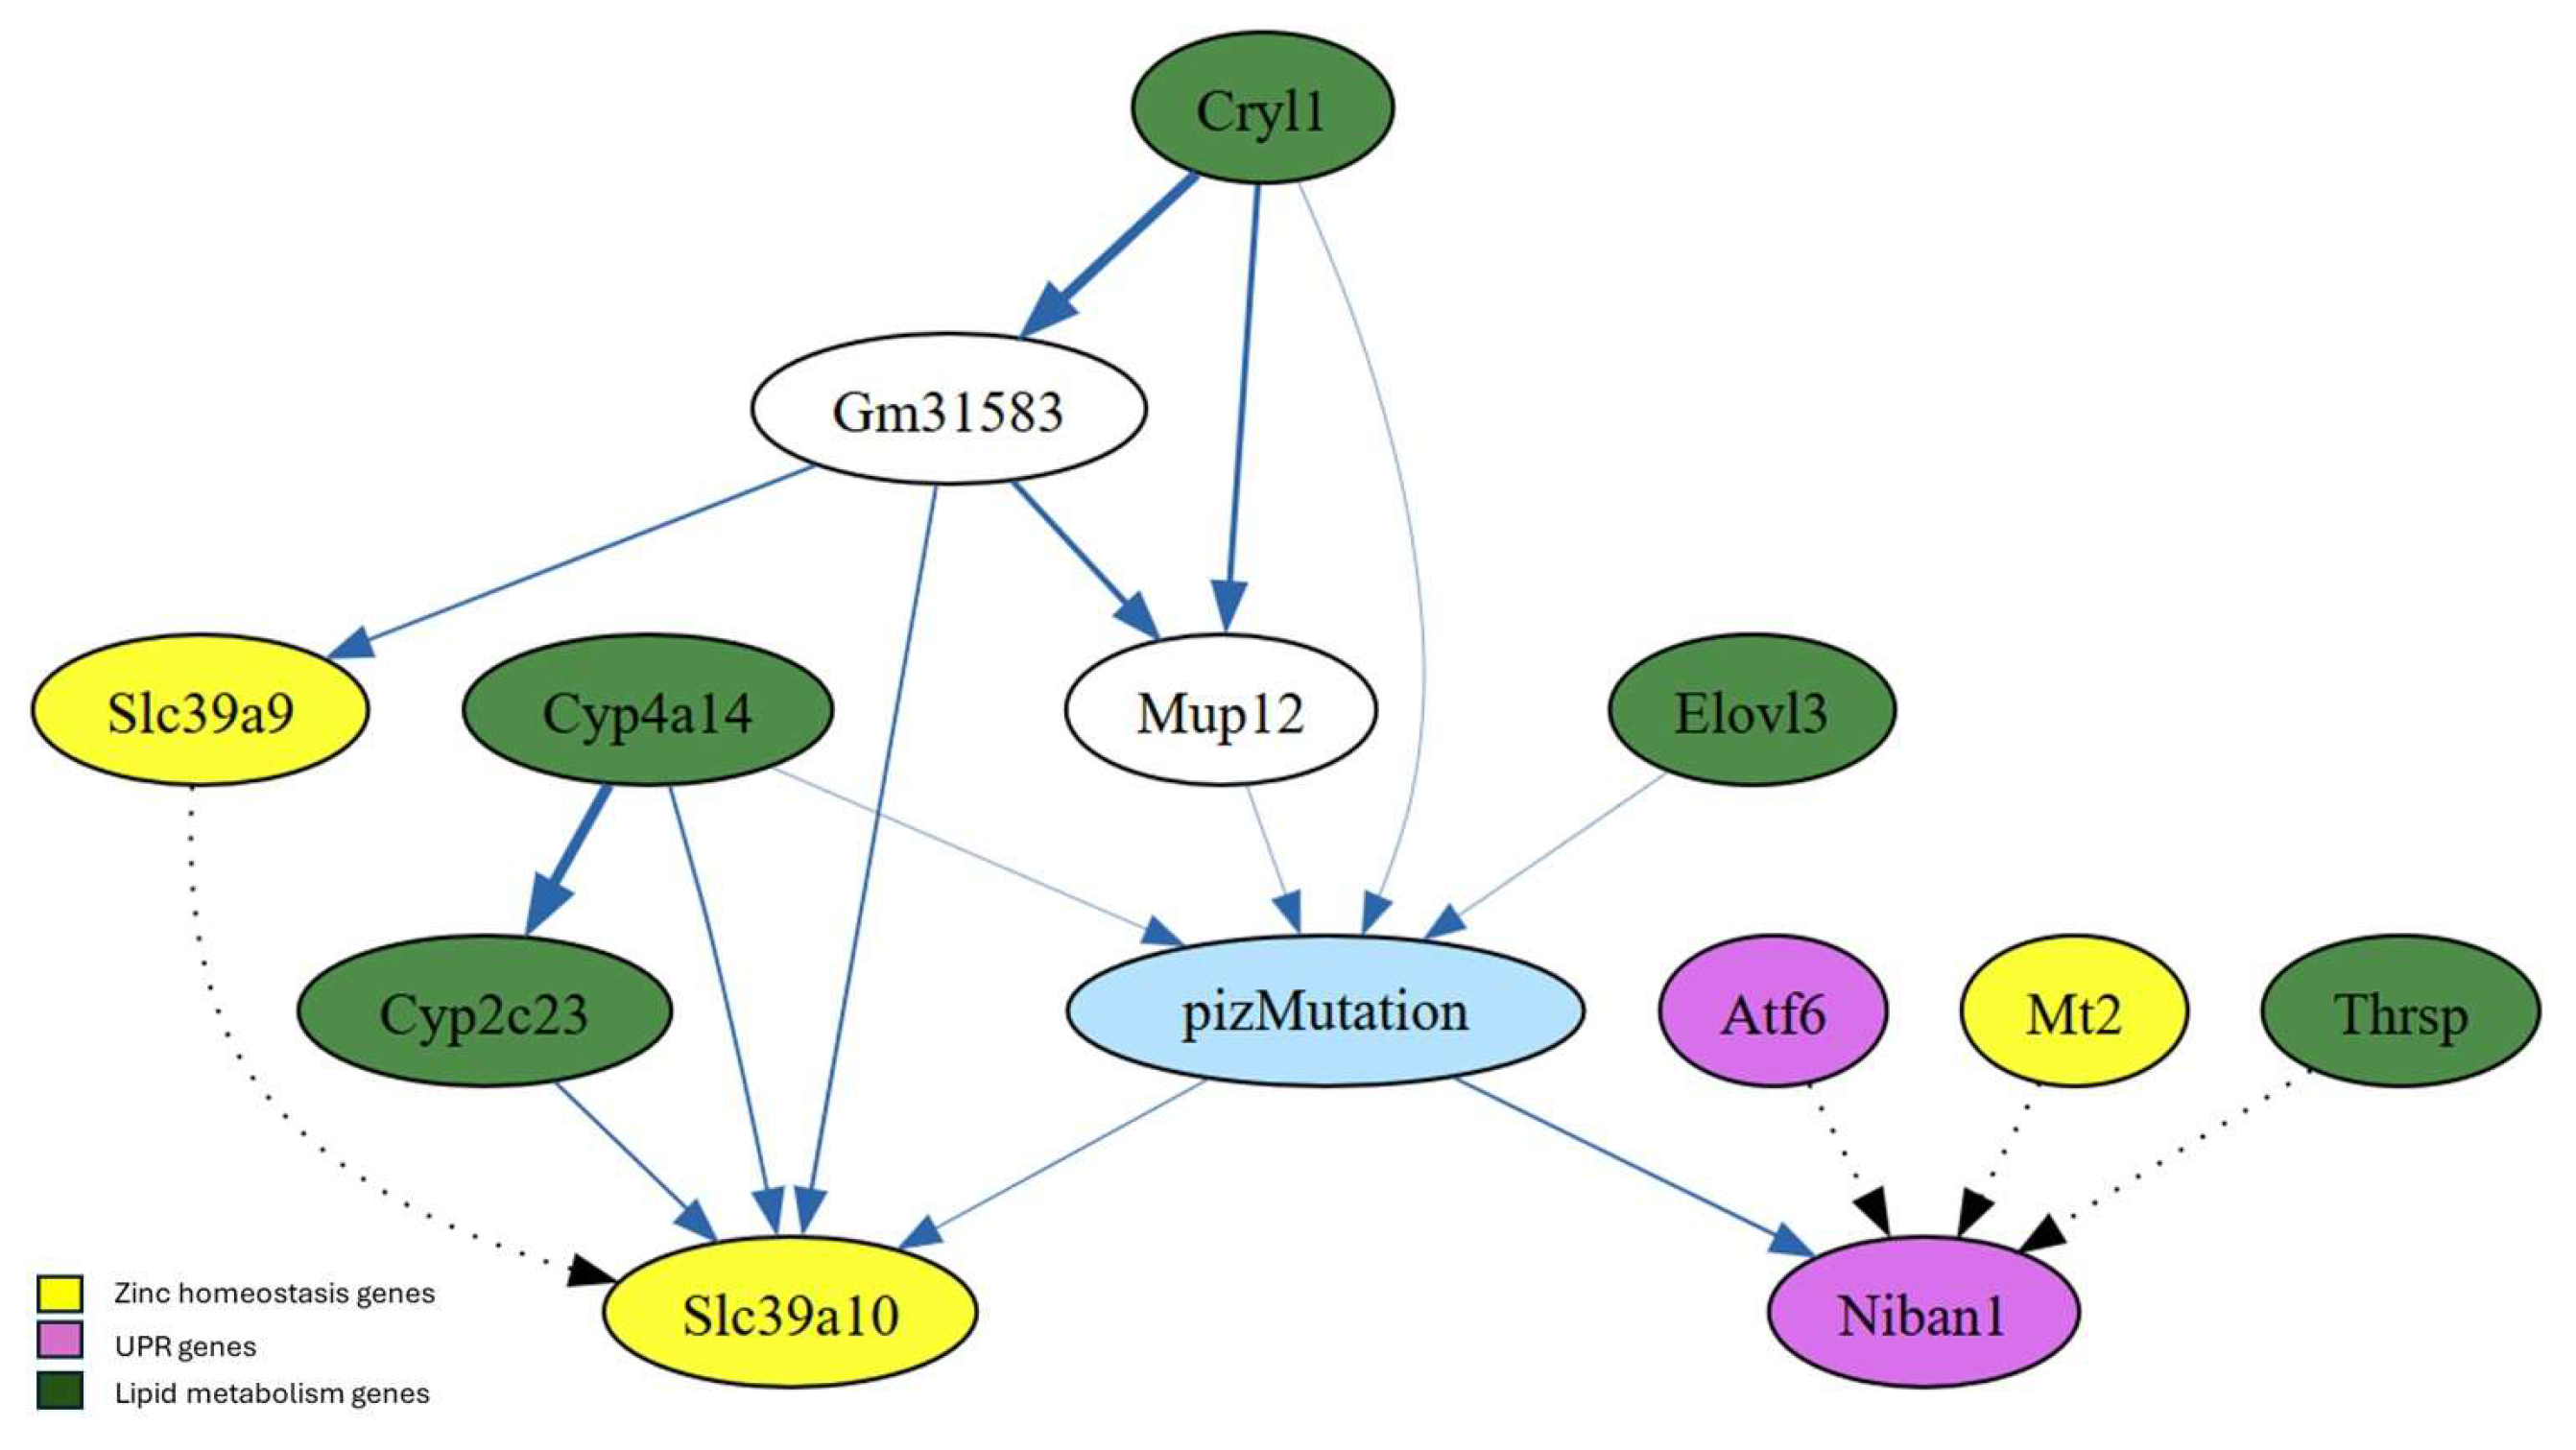
Figure 6.
Diagram representing GeNIe simulation when Slc39a7 is set a to high expression under 100% PiZ mutation. Zinc content at ER and Golgi apparatus is decreased which enhances ER stress. Downregulation of Slc30a9 at mitochondria may lead to mitochondrial stress. Created with Biorender (Biorender.com).
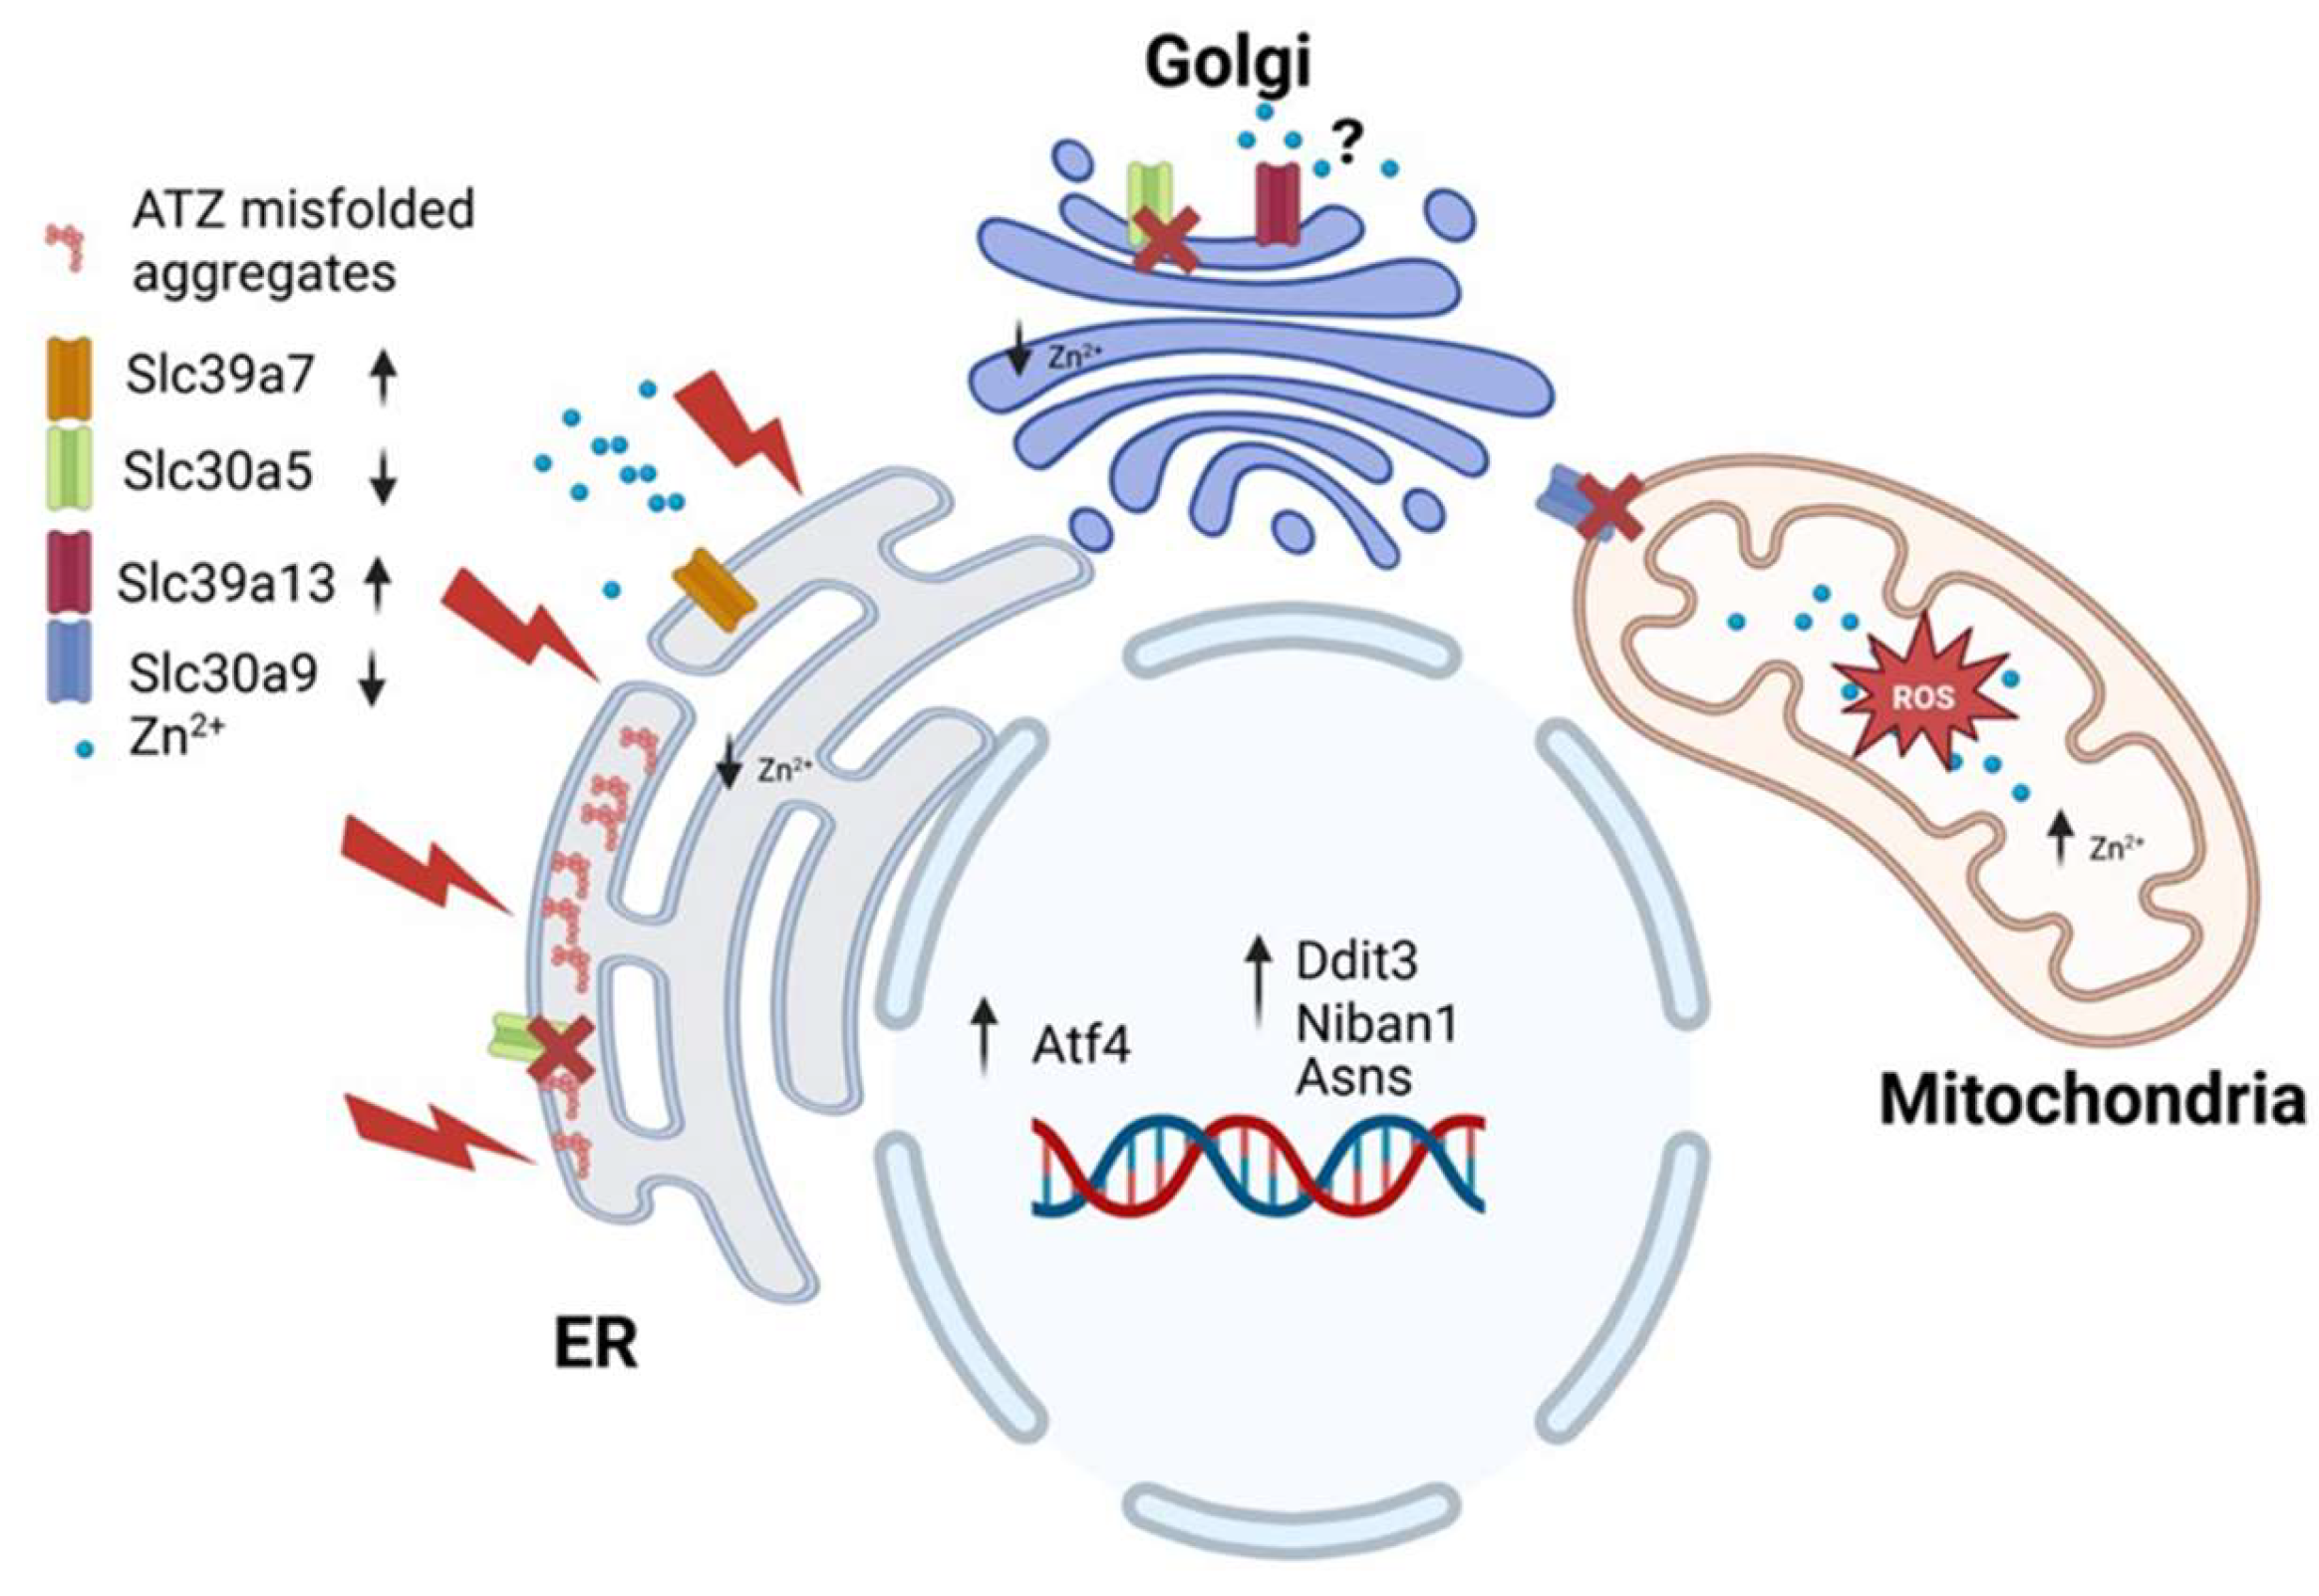

Table 1.
Differential expression of zinc homeostasis gene in liver in mice.
|
GSE93115 lg2fc |
GSE141593 lg2fc |
|
| Mt1 | 3.4* | 1.7* |
| Mt2 | 3.5* | 3.6** |
| Mtf1 | -0.23 | 0.4 |
| Slc39a1 | -0.5* | 0.3 |
| Slc39a3 | 0.6* | -0.1 |
| Slc39a4 | 0.3 | 1.8** |
| Slc39a6 | 0.3 | 0.02 |
| Slc39a7 | 0.6* | 1.3** |
| Slc39a8 | -0.6* | -0.7 |
| Slc39a9 | 0.5 | -0.3 |
| Slc39a10 | NF | 0.3 |
| Slc39a11 | 0.3 | 1.4** |
| Sl39a13 | 0.4 | 0.7 |
| Slc39a14 | 0.3 | -0.1 |
| Slc30a1 | -0.4 | 0.1 |
| Slc30a4 | -0.1 | 0.4 |
| Slc30a5 | -0.3 | -0.02 |
| Slc30a6 | -0.4 | 0.1 |
| Slc30a7 | -0.02 | 0.3 |
| Slc30a9 | -0.5* | -0.3 |
Data originated from GSE93115 (n=3) (30) and GSE141593 (n=5) (28). Values are Lg2 of fold change of mice expressing mutant ATZ/ATT (PiZ/WT). *p<0.05; ** p<0.001. NF=not found.
Table 2.
Differential expression of genes associated with UPR in liver in wild type and PiZ mice.
|
GSE93115 Lg2fc |
GSE141593 Lg2fc |
|
| Atf3 | 5.3** | 3.5** |
| Atf4 | 0.9* | 0.8** |
| Atf6 | -0.5 | 0.1 |
| Ern1 (IRE1) | 0.3 | 0.4 |
| Sdf2l1 | 0.34 | 2.9** |
| Xbp1 | -0.9* | -0.1 |
| Eif2ak3 (Perk) | 0.3 | 0.6 |
| Derl3 | 1.8* | 5.7** |
| Trib3 | 3.8** | 3.0** |
| Ddit3 (Chop) | 3.7** | 3.0** |
| Ddit4 | 0.5* | 4.9** |
| Bhlha15 (Mist1) | 0.3 | 6.7** |
| Niban1(Fam129a) | 1.05* | 2.3** |
Data originated from GSE93115 (n=3) (30) and GSE141593 (n=5) (27). Values are Lg2 of fold change of mice expressing mutant ATZ/ATT (PiZ/WT). (PiZ/WT). *p<0.05; ** p<0.001. .
Table 3.
Conditional Probabilities of Nodes in First-degree Markov Blanket.
| Condition | |
| PiZ | Cyp4a14[0], Elovl3[0] |
| PiZ | Elovl3[0], Mt2[0] ,Niban1[2] |
| PiZ | Atf6[0] ,Cyp4a14[0] ,Elovl3[0] |
| PiZ | Cyp4a14[0] ,Niban1[2] ,Thrsp [0] |
Combinations of 2 and 3 genes with top probabilities. 0= no change; 1= low expression; 2= high expression. Data generated from GSE141593 (n=5 Wild type and PiZ mice).
Disclaimer/Publisher’s Note: The statements, opinions and data contained in all publications are solely those of the individual author(s) and contributor(s) and not of MDPI and/or the editor(s). MDPI and/or the editor(s) disclaim responsibility for any injury to people or property resulting from any ideas, methods, instructions or products referred to in the content. |
© 2025 by the authors. Licensee MDPI, Basel, Switzerland. This article is an open access article distributed under the terms and conditions of the Creative Commons Attribution (CC BY) license (http://creativecommons.org/licenses/by/4.0/).
Copyright: This open access article is published under a Creative Commons CC BY 4.0 license, which permit the free download, distribution, and reuse, provided that the author and preprint are cited in any reuse.


