
Submitted:
04 May 2025
Posted:
05 May 2025
You are already at the latest version
Abstract
Sea level rise (SLR) and coastal flooding are critical climate‐induced impacts affecting coastal regions, further compounded by rapid urbanization and climate change. In Saudi Arabia, although over 3100 km2 of coastal areas are situated at 1 m elevation, little is known about the expected SLR, and its impacts remain uncertain. This study aims to address this knowledge gap by forecasting SLR‐susceptible zones in the Dammam Metropolitan Area (DMA) and proposing necessary adaptation measures. The study utilized satellite imagery and GIS data to compare DMAʹs coastal shoreline in 2014 and 2022, simulate SLR scenarios, and identify potential flood zones based on Intergovernmental Panel on Climate Change (IPCC) projections. The results indicate that at 0.6 m SLR, 21 km2 of Half‐Moon residential district could experience flooding, while at 1.1 m SLR, 83 km2 of DMA’s total land area could be susceptible to SLR and coastal flooding. The socioeconomic and environmental implications of SLR include flood risks, threats to public health, and infrastructure damage. Therefore, adaptation strategies, such as constructing dikes, seawalls, and accommodations are recommended for SLR‐susceptible zones. The study concludes by advocating for policies that restrict coastal reclamation and related climate change‐induced activities to mitigate the forecasted impacts of SLR and coastal flooding in the study area. These findings provide valuable insights into the potential impacts of SLR on Saudi Arabia’s coastal regions and inform the development of effective adaptation measures to mitigate these impacts.
Keywords:
adaption strategies
; climate change
; coastal flooding
; DMA
; flood risk
; SLR
1. Introduction
Over the last century, anthropogenic emissions of greenhouse gases (GHGs) have contributed significantly to global warming, leading to the detrimental effects of SLR and coastal flooding caused by thermal expansion of the oceans, variations in terrestrial storage, and melting of glaciers [1]. More than 90% of the heat produced by GHGs is absorbed by the oceans, resulting in thermal expansion that accounts for about 50% of the SLR recorded in the last 25 years [2]. Despite the ambitious target set by the Paris Agreement to limit global warming below 2°C, human-induced warming of the globe continues to drive increases in air and ocean temperatures, as well as widespread melting of glaciers and snow, which contribute to SLR and coastal flooding worldwide [3,4,5]. Projections suggest that substantial flooding may occur due to anticipated SLR [6], with potential levels reaching around 1 meter under a 4°C warming scenario by the end of the century [7]. Consequently, SLR is expected to persist, posing a critical threat to low-lying coastal communities.
Coastal communities are particularly vulnerable to the compounded impacts of SLR, including floods, land degradation, storm surges, and erosion. SLR also leads to increased salinity of drinking water and submergence in low-lying coastal regions [8,9]. Several global [10,11,12,13,14,15,16,17,18,19,20] and local studies [21,22,23,24,25] have investigated the human, socioeconomic and physical impacts of floods. For example, several lives and property are lost due to the devastating hurricanes in the USA, such as Hurricane Harvey in Louisiana and Texas in 2017, Hurricane Matthew in Florida in 2016, Hurricane Katrina in Louisiana in 2015, and Hurricane Sandy in New Jersey in 2012 [26]. Additionally, projected increases in ocean acidification and water temperatures will adversely affect coastal ecosystems, leading to the degradation and destruction of seagrass beds, salt marshes, and mangrove forests, thereby compromising their ecological services such as carbon sequestration, coastal protection, and fisheries [27,28,29,30,31,32,33,34].
The Arabian/Persian Gulf has experienced a significant rise in seawater temperature over the last 40 years, resulting in increased SLR along its shores [35]. Saudi Arabia is a country that faces numerous challenges related to climate change, including flash floods. In the 2018 Global Climate Risk Index, Saudi Arabia was ranked 84th [36]. Its coastal cities, Dammam and Jeddah, are frequently subjected to devastating floods, causing loss of life, property damage, and economic losses. For example, the worst flood in the DMA in 2017 resulted in extensive destruction of infrastructure, schools, and homes, leading to severe traffic congestion, accidents, and property damage [21]. Similarly, the coastal city of Jeddah experienced a catastrophic flood in 2019, resulting in 122 fatalities and displacing 3,861 individuals [37].
Several studies have investigated the impacts of SLR on coastal infrastructure and land uses. Hereher [38] investigated the change in sea surface temperature rise (SST) in the Arabian/Persian Gulf due to global warming. The study revealed a rise in SST of 0.7°C per decade on the western side of the Arabian Peninsula, posing a significant threat of SLR to coastal areas of Saudi Arabia, the United Arab Emirates, and Bahrain. Abdrabo and Hassan [39] proposed an integrated framework to assess the SLR hazard in 18 coastal urban areas along the Nile Delta. The study identified 11 out of the 18 regions as vulnerable to inundation under different SLR scenarios. The study developed a resilience index based on five important aspects: socioeconomic, institutional, environmental, physical, and climate change hazards. El-Nahry and Doluschitz [40] investigated the impacts of climate change on the Nile Delta coastal zone. Similarly, Natesan and Parthasarathy [41] analyzed the potential impacts of SLR along the Kanyakumari coastal region in Tamilnadu, India.
Coastal zones also face growing hazards due to land reclamation projects and population movement to these areas, emphasizing the urgent need for developing and implementing adaptation measures to address SLR and coastal flooding. However, there is a research gap regarding the forecasting of SLR and its impacts in Saudi Arabia, particularly in the low-lying coastal areas of the Eastern Region. These areas encompass critical infrastructure for the petroleum industry, commercial activities, power generation, desalination plants, and adjacent residential areas. To safeguard against potential SLR and coastal flooding in the future, it is crucial to thoroughly investigate and simulate the potential impacts in the region.
Therefore, this study aims to fill this research gap by characterizing vulnerable land uses and infrastructure in the coastal areas of the Eastern Region under different SLR scenarios and recommending appropriate measures to mitigate future hazards. The study objectives are: 1) to characterize the vulnerable land uses and infrastructure in the coastal areas of the Eastern Region under different SLR scenarios, and 2) to recommend suitable adaptation measures to mitigate future impacts. The study's findings will provide valuable insights to the municipality regarding the potential impacts of SLR on the coastal areas of the Eastern Region in Saudi Arabia and inform the development of effective adaptation measures to mitigate these impacts.
2. Materials and Methods
2.1. Study Setting
The DMA is situated in the Eastern Province of Saudi Arabia, approximately 380 kilometers from the capital city, Riyadh. It encompasses Dammam, Dhahran, and Khobar cities. Dammam City serves as the capital of the Eastern Province and houses most of the regional administrative institutions. Khobar City is the commercial hub of the province, while Dhahran City is a center for technological and scientific advancements, particularly in the petroleum industry, hosting the head office of Saudi Arabian Oil Company [42]. Figure 1 illustrates the map of the DMA, which is one of the largest and most significant metropolitan areas in Saudi Arabia. Due to the oil boom and the availability of high-income jobs, DMA experienced significant internal and external migration between 1973 and 1983 [43]. Consequently, the projected population of DMA in 2040 is estimated to be between 3.25 and 3.62 million people [43]. Its total land area is 380,000 hectares, accommodating a population of 1.8 million people, with over 50% residing in Dammam [43].
To better understand the relationship between climate conditions and sea-level rise, it is important to consider that rising temperatures and changing precipitation patterns are key factors driving sea-level rise. In the case of the DMA, these changing climate conditions impact sea-level rise in various ways. The DMA experiences two distinct seasons: summer and winter. The summer season, spanning from April to August, is characterized by hot and humid weather with temperatures exceeding 40°C. On the other hand, the winter season, occurring from November to March, brings cold temperatures as low as 8°C and sporadic rainfall periods [44]. Based on climate data from NASA, the temperature curve of DMA can be divided into three main phases: wobbling, stable, and increasing. The temperature fluctuated irregularly during the first two decades, between 1981 and 2000, without any specific patterns. The rate of temperature increase during this period was approximately 5.09%. From 2000 to 2010, the historical data indicates stable temperatures, with an average of 27.78°C, and a minor temperature-increasing rate of about 0.068%. The last phase, from 2010 to 2020, shows a general increase in temperatures, as depicted in Figure 2. Over the 40-year period from 1981 to 2020, the overall rate of temperature increase was 6.78%. Historical data suggests an annual temperature increase of 0.15% [42].
Therefore, rising temperatures, changing precipitation patterns and the melting of glaciers and ice sheets are significant drivers of sea-level rise. As temperatures increase, ocean water expands, leading to rising sea levels. Additionally, the melting of glaciers and ice sheets contributes to sea-level rise by adding more water to the ocean. Changing precipitation patterns can also contribute to sea-level rise by increasing the volume of water flowing into the ocean through rivers and other waterways. The impacts of sea-level rise are particularly pronounced in coastal areas. As sea levels continue to rise, coastal regions face inundation, resulting in the degradation and loss of coastal ecosystems and the displacement of communities residing along the coast. This, in turn, can have implications for the distribution and abundance of marine species and disrupt local economies dependent on fishing and tourism. Rising sea levels can also lead to more frequent and severe flooding, especially in low-lying areas, causing damage to infrastructure and disrupting daily life. In summary, the relationship between climate conditions and sea-level rise highlights the urgent need to address climate change and reduce greenhouse gas emissions. Without action, sea-level rise will continue to have significant impacts on coastal communities and ecosystems worldwide.Top of Form
One of the most significant impacts of climate change is extreme weather events, such as the variability in precipitation patterns, which directly or indirectly affects regional water resources, supplied or recharged by rainwater. Similarly, flash floods have devastating consequences, frequently resulting in damage to the ecosystem and human socioeconomic activities [45]. For instance, the DMA has recently experienced severe floods caused by heavy rainfall that inundated road networks, schools, offices, and homes, particularly in low-lying coastal areas. These incidents have had a profound impact on people's lives, disrupting their daily routines [9]. To assess the average annual rainfall patterns in the DMA over a 40-year period from 1981 to 2020 data obtained from NASA's global precipitation measurement using satellite-based remote sensing (Figure 3). The data underwent processing, analysis, scaling, and validation using statistical methods, and were compared with available ground-based observations. The data indicates a decreasing trend in annual rainfall since 1980, with the highest rainfall intensity recorded in 1982 at 16 mm. Nevertheless, extreme precipitation events still occur and cause flooding disasters. This data is crucial for understanding rainfall patterns in the region and can be utilized for various purposes, such as water resource management, agriculture, and disaster risk reduction. It can also aid in assessing the potential impacts of climate change on rainfall patterns, enabling the development of effective adaptation strategies.
Similarly, observational data plays a vital role in comprehending rainfall patterns over time and identifying trends and anomalies. Consequently, an analysis of observational data from the 40-year period was conducted to understand rainfall climatology patterns and the frequency of extreme rainfall events in the DMA. The analysis results indicate that the highest rainfall amounts occur between November and March, while the lowest amounts occur from April to October. This information can be utilized to develop models and simulations that predict future rainfall behavior, informing decision-making processes for managing SLR and flood risks.
Therefore, precipitation can contribute to flooding disasters in various ways, particularly in low-lying coastal areas already vulnerable to sea-level rise. Under sea-level rise scenarios, higher sea levels can lead to increased frequency and severity of flooding events, especially during high tide and storm surge events. Additionally, higher sea levels can result in more frequent and extensive inundation of low-lying areas, intensifying the risk of flooding hazards. When combined with heavy rainfall events, the potential for flooding disasters significantly rises. In the case of the Dammam coastal area, heavy rainfall events can worsen flooding hazards, particularly in areas lacking proper drainage systems or adequate flood protection measures.
In recent years, the DMA has undergone several land reclamation projects along its coastal zones. Unfortunately, these projects exacerbate the impact of SLR caused by global warming. Reclaiming land towards the Gulf not only pollutes the coastal areas but also harms the ecosystem. In a study conducted by Maghrebi et al. [46], the environmental risks associated with metal pollution in the region were assessed, providing baseline data for future studies. The study revealed significant variations in metal concentrations over time and between different locations along the coastline. Higher concentrations of lead and cadmium were found in sediments collected from stations closer to industrial and urban areas. Additionally, metal concentrations tended to be higher during winter, likely due to increased runoff from land-based sources during the rainy season. Since 1955, approximately 14,000 hectares of coastal land in the DMA have been reclaimed, resulting in the destruction of marine animals, economic impacts, the inundation of wetlands and coral reefs, and SLR [47]. Consequently, SLR affects the ecosystem, population, socioeconomic factors, and infrastructure along the eastern coast of Saudi Arabia. As SLR, coastal ecosystems such as wetlands, mangroves, and coral reefs are inundated, leading to degradation and loss. Coastal wetlands, for example, play a vital role as habitats for various plant and animal species and act as natural barriers against storm surges and coastal flooding. However, as they are submerged due to rising sea levels, their ability to fulfill these functions diminishes or is completely lost.
Furthermore, SLR can result in changes in water temperature and salinity, impacting the distribution and abundance of marine species. Certain fish and shellfish species may be compelled to migrate to other areas as the water temperature and salinity in their current location change, thereby disrupting local ecosystems. Additionally, SLR can have adverse effects on socioeconomic factors and coastal infrastructure. Coastal communities may encounter increased flooding and damage to infrastructure such as roads, buildings, and ports. The loss of coastal ecosystems can also significantly impact industries like fishing and tourism, which rely on healthy and diverse marine ecosystems. In summary, the impacts of SLR on coastal ecosystems and their associated socioeconomic factors are intricate and multifaceted. They are influenced by various factors, including the rate and magnitude of SLR, the vulnerability of the local ecosystem and infrastructure, and the adaptive capacity of local communities.
2.2. Data Collection and Analysis
The data collection for the present study involved a desktop study of relevant secondary documents focusing on the research objectives. Firstly, Google Scholar was used to search for key literature such as journal articles, books, and conference papers using expressions like climate change, SLR, adaptation measures, coastal flooding, and land reclamation. These resources were collected and reviewed to understand key concepts and factors, establish context and research gaps, and inform the study design. Secondly, published reports, technical reports, newspaper articles, websites of international organizations, and relevant public agencies were thoroughly explored to gather information on local and global climate change challenges and adaptation strategies.
The data analysis consisted of two sections: a) content analysis of the collected qualitative data and descriptive statistics (percentages) of the quantitative data, with results presented in charts and a table; and b) spatial simulations of areas susceptible to SLR based on SLR scenarios of 0.6m and 1.1m. The content analysis followed a three-step iterative procedure [48]. The collected resources were organized using the search expression mentioned earlier, and themes related to climate change challenges and adaptation strategies were developed. Each document was thoroughly searched to validate the emerging themes and explore recent perspectives. Finally, the themes from individual documents were synthesized and harmonized.
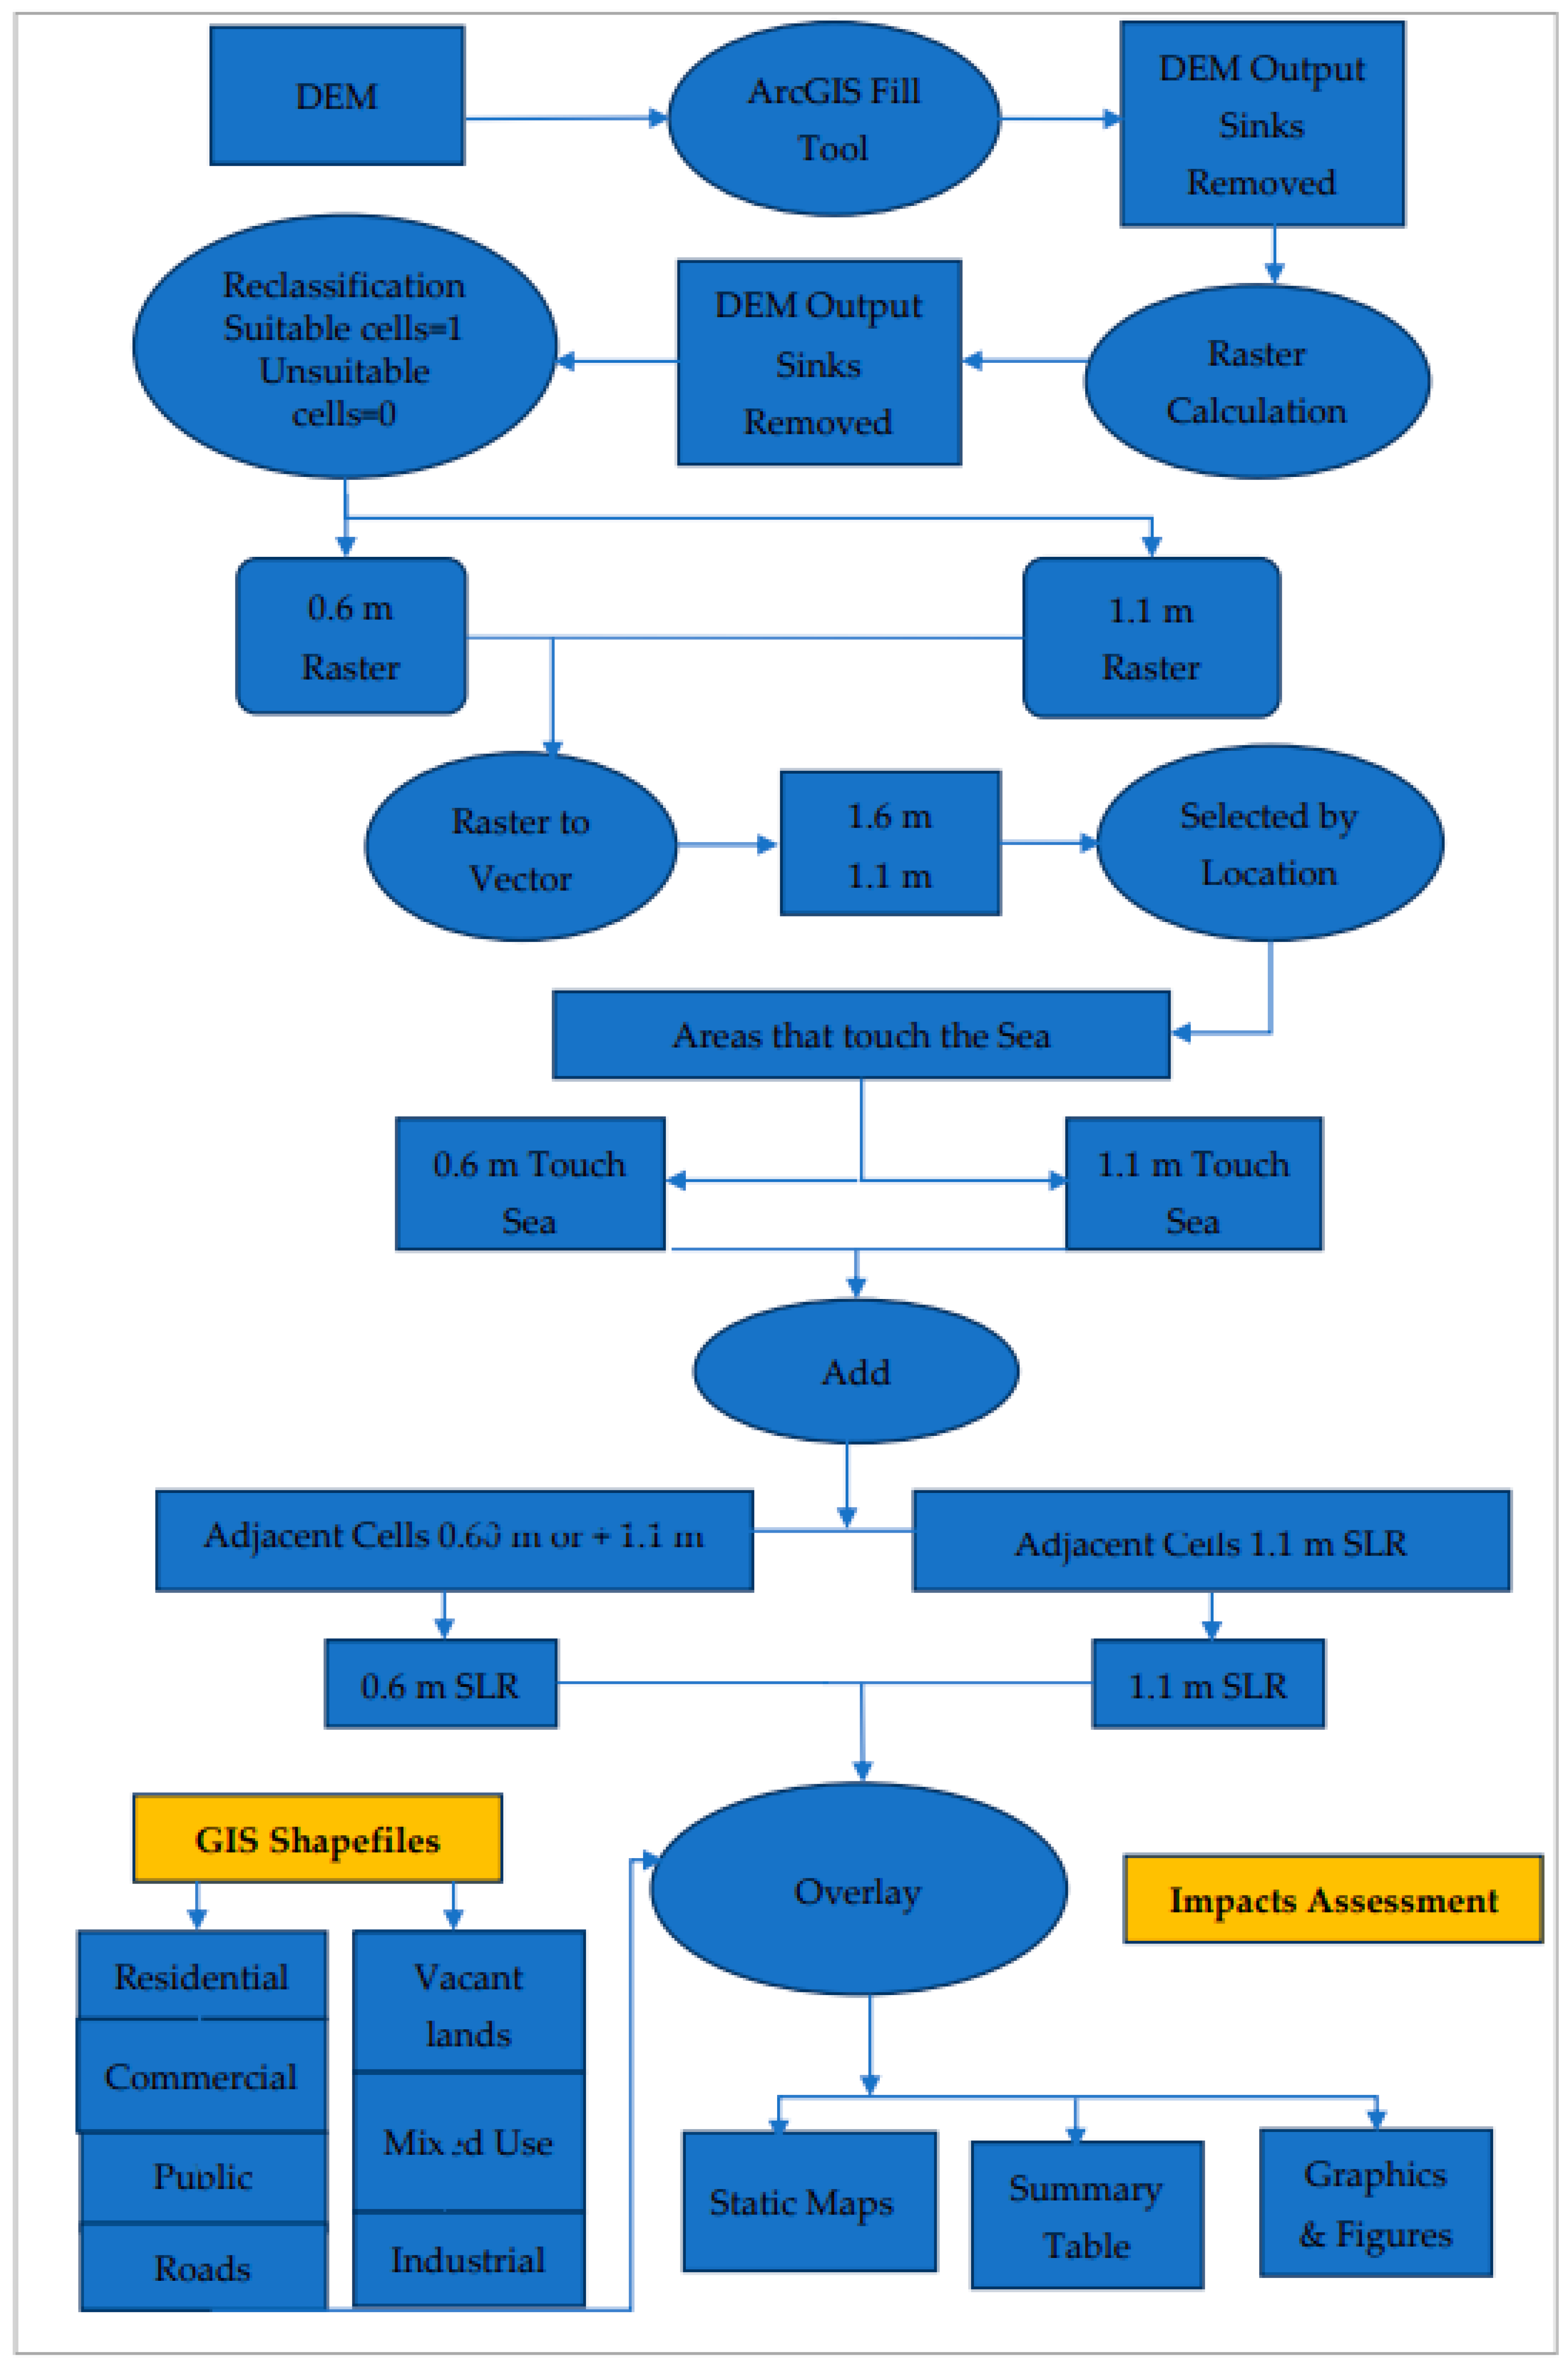
For spatial data analysis, Digital Elevation Model (DEM) data with a 30-meter spatial resolution for the study area were obtained from the United States Geological Survey. ArcGIS geoprocessing tools were used to extract, categorize, and overlay spatial data for analyzing and highlighting SLR-susceptible zones based on the two SLR scenarios. High-resolution satellite imagery from Google Maps (Figure 5) was also obtained [49]. The methodological flow chart in Figure 5 illustrates the spatial simulation of inundated zones resulting from the two SLR scenarios. The following steps provide a detailed analysis of the SLR simulations used in the study:
- a)
- Processing the DEM: The DEM generated had sinks with negative values. To ensure reliable results, the sinks were eliminated using the fill tool in ArcGIS, converting cells with negative values into meaningful altitudes.
- b)
- Raster calculation and reclassification: Map algebraic expressions were used to extract cells of interest using the raster calculator in ArcGIS. New rasters were produced based on elevations from 0.6 to 1.1 meters. These rasters were crucial for simulating the inundated susceptible zones. Reclassification was performed to categorize cells with 0 values as No-Data, while cells with 1 value were included in the simulation. This process was replicated for both rasters.
- c)
- Vectorization and SLR scenarios: The reclassified rasters were vectorized for easy manipulation and analysis. The newly created vectors were selected based on their location using the Select by Location function in ArcGIS, specifically zones touching the sea boundary. This process was repeated for vectors, assigning the 0.6-meter vector to the 0.6-meter SLR scenario and selecting the 1.1-meter zones touching the sea boundary plus the 0.6-meter SLR for the 1.1-meter SLR scenario.
- d)
- Spatial analysis of susceptible zones: After delineating the inundated susceptible zones, the impact of the simulated SLR scenarios was assessed by overlaying the inundation layer on existing land uses. The assessment included residential and commercial land uses, road networks, public facilities, future development land uses, multiple usage land uses, and industrial land use, as shown in Figure 6. The affected zones were summarized using inferential and descriptive statistics and discussed.
Figure 5.
The methodological flowchart for SLR forecasting (Source: Authors).
3. Results and Discussion
3.1. Effects of Land Reclamation in DMA
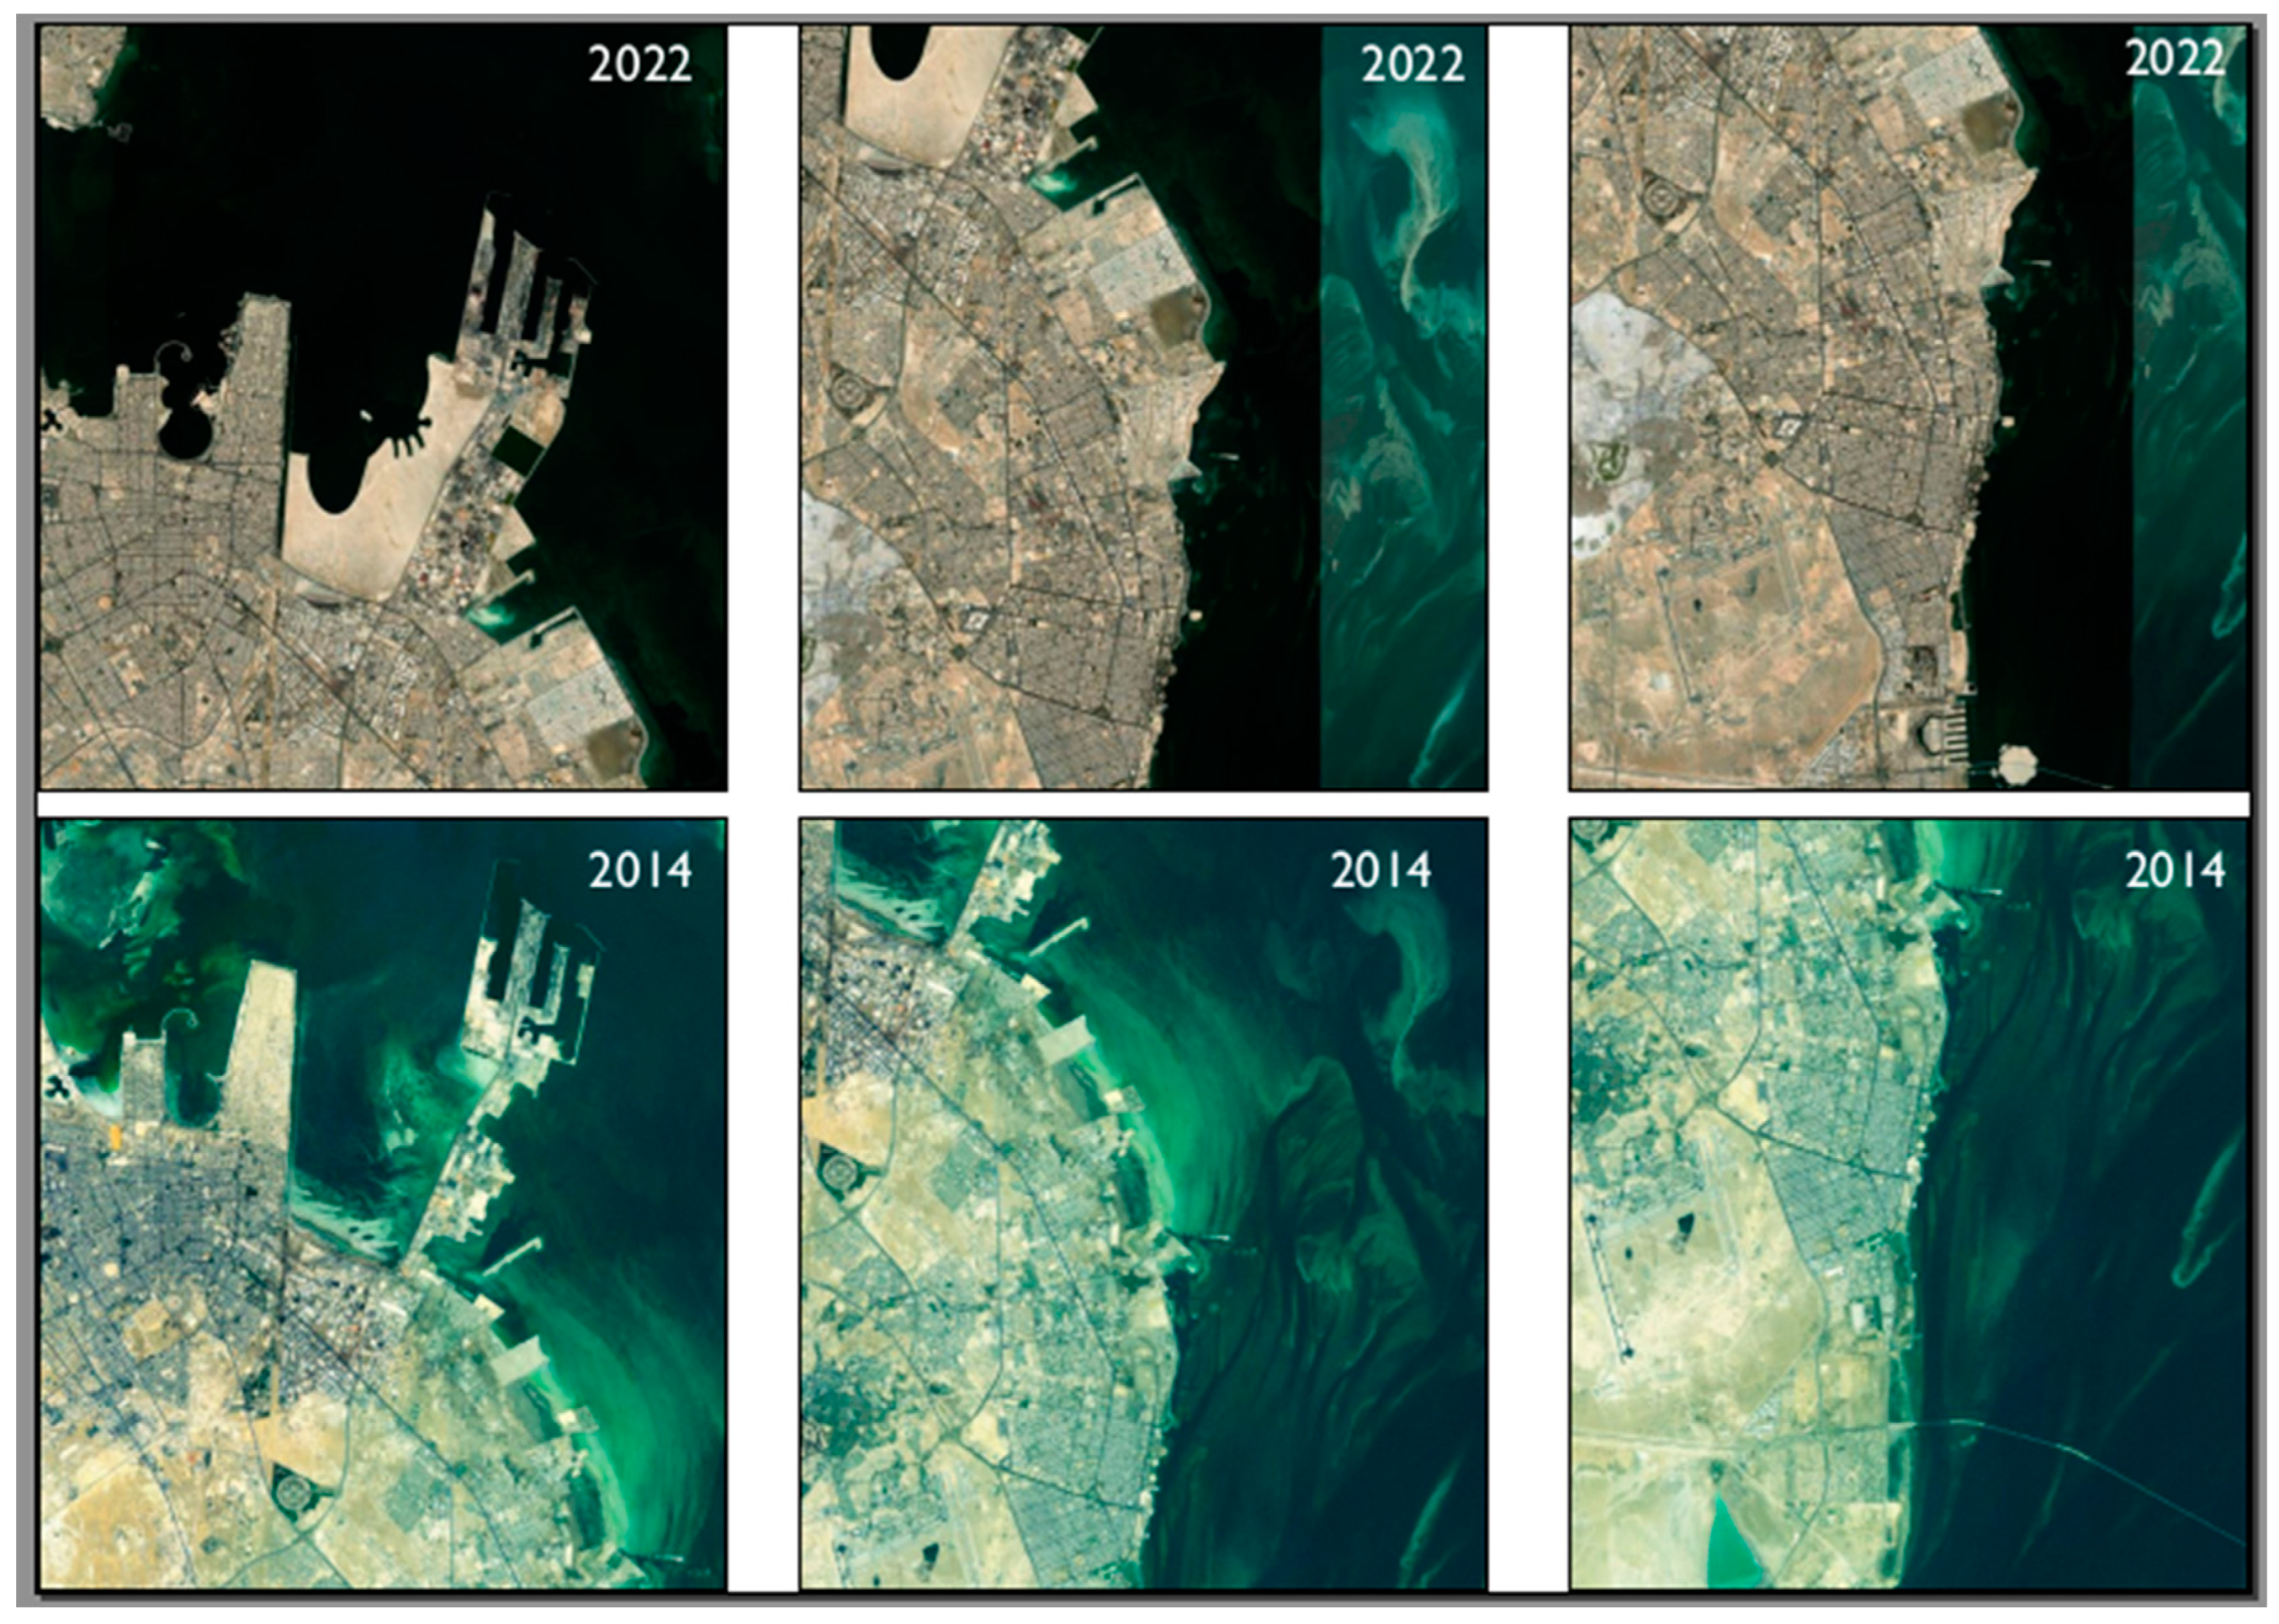
Over the past few decades, the DMA has undergone significant changes in land cover and land use, partly due to land reclamation. These changes have profound implications for the environment and society, particularly concerning the potential impact on SLR. Land reclamation plays a substantial role in contributing to SLR by disrupting the natural balance between land and water. The creation of new land through reclamation displaces water and increases the exposed land area along the coast, thereby altering local hydrology and elevating the risks of flooding and coastal erosion. Consequently, the utilization of satellite-based data has become increasingly crucial in assessing and managing land resources in the DMA.
The availability of high-resolution satellite imagery and advanced image processing techniques has enabled more precise and detailed evaluations of land cover and land use changes in the region, including the impact of land reclamation on SLR. Therefore, this study utilizes satellite imagery from 2014 and 2022 to analyze the effects of land reclamation on land cover and land use in the DMA and its potential consequences for SLR. The analysis aims to enhance our understanding of the spatial and temporal dynamics in the region and their implications for environmental and social sustainability. By leveraging satellite-based data, we can develop effective strategies for sustainable land use planning and management in the DMA while considering the potential implications for SLR. Figure 6 visually demonstrates the transformation of the DMA through land reclamation using satellite imagery from 2014 and 2022.Bottom of Form
Figure 5.
Satellite images showing the before and after reclamation of DMA costal line (Source: Google Earth).
Figure 5.
Satellite images showing the before and after reclamation of DMA costal line (Source: Google Earth).
3.2. SLR Simulation
The low-lying elevation of DMA's coastal zones, coupled with historical land reclamation activities, makes them highly vulnerable to the extensive threats posed by SLR above the Average Sea Level (ASL). Therefore, integrating climate change and coastal management is crucial for developing sustainable adaptation strategies and improving planning and decision-making processes. Simulating SLR susceptible zones using two scenarios: 0.6 meters and 1.1 meters could support urban planners in formulating appropriate land use adaptation strategies. This study’s simulations identify land uses within the threatened zones, which include heritage sites, vacant land, industrial areas, agricultural lands, public facilities and services, commercial areas, community services, and residential areas. Figure 7 shows the land use map of DMA, illustrating the size of the affected area at 1.1 m SLR scenario.
The simulation results for scenario one, with SLR at 0.6 meters, indicate that 21 square kilometers out of 25.86 square kilometers of the residential area are prone to submersion and inundation. These affected lands are primarily located in the Half-Moon Beach District, where all the lands are below the 0.6-meter sea level elevation. Considering the minimal extent of the impacted land use in scenario one and the associated costs of implementing adaptation strategies, it is deemed infeasible as the losses and casualties do not justify the required expenditure. Similarly, scenario two, simulated at 1.1 meters of SLR, reveals a devastating impact on the city. Approximately 83 square kilometers, accounting for 19.28% of the total area, would be underwater.
Due to the significant extent of land use and infrastructure affected by a 1.1m SLR, the affected coastal areas in DMA have been divided into four main zones, as summarized in Table 1. However, it is worth noting that the specific location of Western Dammam, being far from the study area's shoreline, will not be affected by a 1.1m SLR in terms of land use and infrastructure.
Table 1 reveals that Khobar Municipality is the most severely impacted by the 1.1m SLR scenario, with 18.71 km2 (28.85%) of residential areas, 6.23 km2 (26.6%) of public facilities, and 10.2 km (20.74%) of road infrastructure being affected. Dammam East follows closely behind, with likely inundated areas of 9.65 km2 (26.6%) for residential buildings, 4.44 km2 (64.58%) for public facilities, and 3.39 km (13.13%) for road infrastructure. Affected districts in Khobar Municipality include Al Sadafah, Al Bahar, Alkurnaish, Al Sahil, Al Khour, Al Hamra, Al Kawthar, Al Aqiq, Al Shifa, Al Tahliyah, Al Sufun, Al Buhairah, Al Sawari, Al Sheraa, Al Amwaj, Al Lulu, and Al Murjan districts. Similarly, affected residential districts in Dammam Eastern Municipality include Al Nasim, Al-Nawras, Al Fanar, Al Saif, Al Khalidiyah Ash Shamaliyah, and Ash Shati Al-Sharqi districts. These findings align with Malik and Abdalla [50], who reported 113 affected residential buildings in a simulation of 1.0m SLR. Additionally, 5.47 km2 out of the total 17.26 km2 of vacant lands in Khobar Municipality will be impacted by the 1.1m SLR scenario, underscoring the critical need for adaptation strategies in these areas.
In terms of road infrastructure, the 1.1m SLR scenario will affect a total length of 10.2 km out of the 49.2 km of roads. These findings are consistent with AlQahtany et al. [51] and Hereher [38], who reported flood-susceptible zones in the southern and northern parts of DMA due to their low-lying elevations. Similar results were observed in global studies. For instance, a study along the Mexican Gulf using a 1.2m SLR projected that 27% of major roads would be flooded [52]. Another study in Washington DC, US, simulated a 0.59m SLR and found that 15 km of roads were underwater [53]. In California, US, a simulation of a 1.4m SLR scenario revealed the inundation of 1600 miles of roads and 180 miles of Highway [54].
Concerning commercial land uses, the impact of SLR is minimal, with Dammam East being the only municipality affected. Out of the total 22.86 km2 of commercial land uses, 7.67 km2 (33.56%) would be submerged in Dammam East, while Khobar Municipality would experience a distant impact of 1.63 km2 (9.32%). In Khobar Municipality, 4.23 km2 out of the total 25.86 km2 of residential buildings in the West Aziziyah and Half-Moon Bay districts are likely to be submerged in a 1.1m SLR scenario. In Dhahran Municipality, the impact of a 1.1m SLR on land use and infrastructure is minimal. However, the simulation for a 0.6m SLR scenario reveals a larger affected area of 21 km2 out of the total 25.86 km2 of residential land, primarily impacting the Half-Moon Bay district and lands below the 0.6m sea level elevation. Therefore, it is crucial for local authorities to consider these potential impacts when planning and developing mitigation and adaptation strategies to minimize risks and protect affected communities. In Dammam Central, the 1.1m modeling scenario primarily affects residential land uses, with 1.04 km2 out of the total 10.46 km2 of residential neighborhoods being submerged, as shown in Table 1.
Also, there are several major land uses and infrastructure that are significantly affected by the 1.1m SLR modeling scenario in DMA. These include King Faisal Road, King Abdul Aziz Port, and Imam Abdulrahman Bin Faisal University. For instance, King Faisal Road, situated in Dammam Eastern, is submerged in the 1.1m SLR modeling scenario, resulting in the flooding of a 3.60 km stretch of the road. Figure 8 illustrates the specific sections of the road that are affected, along with other access roads that experience inundation. King Faisal Road is home to several important sites, such as King Abdulaziz Port, Dhahran International Exhibition Center, Institute of Technical Studies for the Naval Forces, Imam Abdulrahman Bin Faisal University, and other notable locations. The modeling scenario depicted in Figure 8 indicates that King Faisal Road is situated in flood-prone areas under the 1.1m modeling scenario. Therefore, it is imperative to propose an adaptation strategy to safeguard the road and the surrounding facilities.
The present study adopts urban adaptation strategies recommended by Lee [55] and Azevedo de Almeida [56]. One of the recommended strategies is the construction of hard protection measures, such as dikes and seawalls. The primary advantage of this strategy is its ability to protect critical infrastructure and facilities that would be challenging to relocate. The second strategy is accommodation, as suggested by Azevedo de Almeida [56]. In the accommodation strategy, roads and structures susceptible to SLR are elevated to mitigate the impacts of the rising sea levels. This strategy has both advantages and disadvantages. Elevating a structure or road does not change its susceptibility to flooding, but it significantly reduces the destructive consequences of flooding. As a result, preventing the damage through proactive measures is more cost-effective than repairing the aftermath [57].
Another significant land use that is projected to be affected is Imam Abdulrahman Bin Faisal University, which is one of the oldest universities in the Eastern Province of Saudi Arabia and a leading institution in the field of medicine. The 1.1m SLR modeling scenario indicates that approximately 1.76 km2 of the university area is at risk of being submerged (Figure 9). This finding is not unexpected considering that the university site is located on reclaimed land from the Arabian Gulf. It aligns with a study conducted by Xu et al. [58], which identified coastal reclamation as a major contributing factor to flood occurrence. To protect this important and sensitive land use, the current study recommends implementing hard protection measures as adaptation strategies. These strategies aim to safeguard critical infrastructure and facilities that are challenging to move or relocate, thus ensuring effective flood protection.
Lastly, the 1.1 m SLR modeling scenario revealed that a total area of 4.32 km2 of King Abdul Aziz Port would be affected by forecasted flooding (Figure 10). King Abdul Aziz Port, also known as Dammam Port, is a port in Eastern Dammam. It is the largest port in the Arabian Gulf and the third largest and third busiest port in the Middle East and North African region, after the Jeddah Islamic Port. King Abdul Aziz Port is a major export center for the oil industry, and a key distribution center for major non-coastal cities in the country, particularly the capital cities of provinces, such as Riyadh which is linked to Dammam by a railway line.
The port is part of the Maritime Silk Road, which connects the Chinese coast to the south via the southern tip of India to Mombasa, then through the Red Sea via the Suez Canal to the Mediterranean, then to the Upper Adriatic region to Trieste, the northern Italian hub with rail connections to Central Europe, Eastern Europe, and the North Sea. Also, the adaptation strategy recommended for this forecasted disaster is the construction of dykes and seawalls to protect water overflow into the city and important, relevant facilities. Figure 11 shows the overall affected zones in DMA at 1.1 m SLR modeling scenario.
4. Conclusions
This study has presented the projected impacts of SLR on various land uses and infrastructure systems in the coastal areas of DMA, highlighting the adverse effects on urban sustainability. It has also recommended appropriate adaptation strategies to mitigate these unsustainable impacts. The study's contributions include identifying the affected land uses and infrastructure systems and proposing suitable sustainable adaptation strategies to address SLR impacts.
The primary impact of SLR on DMA's coastal areas is coastal flooding, which will damage multiple land uses and infrastructure systems. The study simulated two SLR scenarios, 0.6 m and 1.1 m, and found that 21 km2 out of 25.86 km2 of the Half-Moon residential buildings and a total land area of 83 km2 in DMA are susceptible to SLR and coastal flooding under these scenarios.
To address the risks associated with SLR, appropriate adaptation strategies were identified from the literature review and recommended in this study. These strategies aim to protect and accommodate vulnerable land uses and infrastructure systems. Furthermore, the forecasted impacts of coastal flooding and the recommended adaptation strategies can be applied to other geographic locations. Therefore, the findings of this study will inform policymakers about the projected impacts of SLR and the benefits of implementing recommended adaptation strategies for urban sustainability in DMA, ensuring the protection of land uses and infrastructure systems within SLR-prone areas.
One major limitation of this study is the absence of RADARSAT satellite imagery, which could have facilitated the comparison of real-time flood events in the study area with the simulated SLR scenario. RADARSAT imagery provides microwave images that can penetrate cloud cover and capture actual flood events. Future studies should consider incorporating this imagery to address this limitation. Additionally, the consequences of land reclamation on triggering SLR in DMA should be assessed, and residents' perceptions should be investigated to understand their preferences regarding SLR adaptation strategies. Furthermore, future studies can explore innovative and sustainable adaptation strategies such as coastal renewable energy, green infrastructure, and enhanced coastal management practices.
Author Contributions
Conceptualization, A.A.K., F.S.A., and U.L.D; methodology, U.L.D, A.A., and F.S.A.M; software, A.A., F.S.A.M., and U.L.D; formal analysis, A.A.K., F.S.A., U.L.D, A.A., and F.S.A.M.; investigation, A.A., N.A., I.R.A., and F.S.A.M.; resources, N.A, A.A., and F.S.A.M.; data curation, A.A. and F.S.A.M.; writing—original draft preparation, N.A., A.A., U.L.D, and F.S.A.M.; writing—review and editing, U.L.D, and A.A.K.; visualization, U.L.D. and A.A.K.; supervision, A.A.K., F.S.A., and U.L.D.; project administration, A.A.K., F.S.A., M.S.A, and U.L.D.; funding acquisition, A.A.K., F.S.A., M.S.A and U.L.D.
Funding
This research received no external funding.
Conflicts of Interest
The authors declare no conflict of interest.
References
- Griggs, G.; Reguero, B.G. Coastal adaptation to climate change and sea-level rise. Water2021, 13(16), 2151.
- Nunez C. Sea level rise explained: Oceans are rising around the world, causing dangerous flooding. Why is this happening, and what can we do to stem the tide? National Geography.2019. Available online: https://www.nationalgeographic.com/environment/article/sea-level-rise-1 (access 17 August 2021).
- Nicholls, R.J.; Cazenave, A. Sea-level rise and its impact on coastal ones. Science2010, 328(5985), 1517-1520.
- Abubakar, I.R.; Dano, U.L. Sustainable urban planning strategies for mitigating climate change in Saudi Arabia. Envi., Dev. and Sust2020, 22, 5129–5152.
- Balogun, A.L.; Adebisi, N.; Abubakar, I.R.; Dano, U.L.; Tella, A. Digitalization for transformative urbanization, climate change adaptation, and sustainable farming in Africa: trend, opportunities, and challenges. J. of Integr.Envtal Sciences2022, 1-21. [CrossRef]
- Tella, A.; Balogun, A.L. Ensemble fuzzy MCDM for spatial assessment of flood susceptibility in Ibadan, Nigeria. Nat. Hazards2020, 104(3), 2277-2306.
- IPCC. Climate change 2014: synthesis report. Contribution of working groups I, II and III to the fifth assessment report of the intergovernmental panel on climate change.2014.
- De Almeida, B.A.; Mostafavi, A. Resilience of Infrastructure Systems to Sea-Level Rise in Coastal Areas: Impacts, Adaptation Measures, and Implementation Challenges. Sustainability2016, 8, 1115.
- Antonioli, F.; De Falco, G.; Lo Presti, V.; Moretti, L.; Scardino, G.; Anzidei, M.; Mastronuzzi, G. Relative sea-level rise and potential submersion risk for 2100 on 16 coastal plains of the Mediterranean Sea. Water2020, 12(8), 2173.
- Balogun, A.; Quan, S.; Pradhan, B.; Dano, U.; Yekeen, S. An improved flood susceptibility model for assessing the correlation of flood hazard and property prices using geospatial technology and fuzzy-ANP. J. of Envi. Informatics, 2020, . [CrossRef]
- Dano, U.L.; Balogun, A.L.; Matori, A.N.; Wan Yusouf, K.; Abubakar, I.R.; Mohamed, S.; et al. Flood susceptibility mapping using GIS-based analytic network process: A case study of Perlis, Malaysia. Water2019, 11(3), 615.
- Chitsaz, N.; Banihabib, M.E. Comparison of different multi criteria decision-making models in prioritizing flood management alternatives. Water Res. Mangt2015, 29(8), 2503-2525.
- Fernandez, D. S.; Lutz, M. A. Urban flood hazard zoning in Tucumán Province, Argentina, using GIS and multicriteria decision analysis. Engrg. Geology2010, 111(1-4), 90-98.
- Kjeldsen, T.R. Modelling the impact of urbanization on flood frequency relationships in the UK. Hydro. Research2010, 41(5), 391-405.
- Lawal, D.U.; Matori, A.N.; Yusof, K. W.; Hashim, A.M.; Aminu, M.; Sabri, S.; Mokhtar, M.R. M. Flood susceptibility modeling: A geo-spatial technology multi-criteria decision analysis approach. Res. J. of Appl. Sci., Energy and Tech.2014, 7(22), 4638–4644.
- Lawal, D.U.; Matori, A.N.; Yusuf, K.W.; Hashim, A.M.; Balogun, A.L. Analysis of the flood extent extraction model and the natural flood influencing factors: A GIS-based and remote sensing analysis. In IOP conference series: earth and environmental science, Kuching, Sarawak, Malaysia, (26-29 February 2014) (Vol. 18, No. 1, p. 012059). IOP Publishing.
- Lawal, D.U.; Matori, A.N.; Hashim, A.M.; Wan Yusof, K.; Chandio, I.A. Detecting flood susceptible areas using GIS-based analytic hierarchy process. In 2012 International Conference on Future Environment and Energy IPCBEE, Singapore, 2012 (Vol. 28, pp. 1–5) IACSIT Press.
- Matori, A. N.; Lawal, D. U. Flood disaster forecasting: A GIS-based group analytic hierarchy process approach. Applied Mechanics and Materials, 567, 717-723. 2014.
- Lawal, D.U.; Matori, A.N. Spatial analytic hierarchy process model for flood forecasting: An integrated approach. In IOP conference series: Earth and environmental science, 2014 (Vol. 20, no. 1, p. 012029). IOP Publishing.
- Wang, Y.; Li, Z.; Tang, Z.; Zeng, G. A GIS-based spatial multi-criteria approach for flood risk assessment in the Dongting Lake Region, Hunan, Central China. Water Res. Mangt2011, 25(13), 3465-3484.
- Dano, U.L. An AHP-based assessment of flood triggering factors to enhance resiliency in Dammam, Saudi Arabia. GeoJournal 2022, 87 (3), 1945–1960.
- Dawod, G.M.; Mirza, M.N.;Al-Ghamdi, K.A. GIS-based estimation of flood hazard impacts on road network in Makkah city, Saudi Arabia. Envi. Earth Sci2012, 67(8), 2205-2215.
- Dano, U.L. Flash flood impact assessment in Jeddah City: An analytic hierarchy process approach. Hydro 2020, 7(1), 10.
- Youssef, A.M.; Sefry, S.A.; Pradhan, B.; Alfadail, E.A. Analysis on causes of flash flood in Jeddah city (Kingdom of Saudi Arabia) of 2009 and 2011 using multi-sensor remote sensing data and GIS. Geom., Nat. Haz. and Risk2016, 7(3), 1018-1042.
- Ledraa, T.A.; Al-Ghamdi, A.M. Planning and Management Issues and Challenges of Flash Flooding Disasters in Saudi Arabia: The Case of Riyadh City. J. Archit. Plan 2020, 32, 155-171.
- Radwan, F.; Alazba, A.A.; Mossad, A. Flood risk assessment and mapping using AHP in arid and semiarid regions. Acta Geophy 2019, 67(1), 215-229.
- Martínez, M.L.; Intralawan, A.; Vázquez, G.; Pérez-Maqueo, O.; Sutton, P.; Landgrave, R. The coasts of our world: Ecological, economic and social importance. Ecol. Econ2007, 63, 254–272.
- Barbier, E.B.; Hacker, S.D.; Kennedy, C.; Koch, E.W.; Stier, A.C.; Silliman, B.R. The value of estuarine and coastal ecosystem services. Ecol. Monogr2011, 81, 169–193.
- Sasmito, S.D.; Murdiyarso, D.; Friess, D.A.; Kurnianto, S. Can mangroves keep pace with contemporary sea level rise? A global data review. Wetl. Ecol. Manag2015, 24, 263–278.
- Beck, M.W.; Losada, I.J.; Menéndez, P.; Reguero, B.G.; Díaz-Simal, P.; Fernández, F. The global flood protection savings provided by coral reefs. Nat. Commun2018, 9.
- Menéndez, P.; Losada, I.J.; Torres-Ortega, S.; Narayan, S.; Beck, M.W. The Global Flood Protection Benefits of Mangroves. Sci. Rep2020, 10, 4404.
- Zu Ermgassen, P.S.E.; Mukherjee, N.; Worthington, T.A.; Acosta, A.; Rocha Araujo, A.R.D.; Beitl, C.M.; Castellanos-Galindo, G.A.; Cunha-Lignon, M.; Dahdouh-Guebas, F.; Diele, K.; et al. Fishers who rely on mangroves: Modelling and mapping the global intensity of mangrove-associated fisheries. Estuar. Coast. Shelf Sci2020, 248, 107159.
- Duarte, C.M.; Agusti, S.; Barbier, E.; Britten, G.L.; Castilla, J.C.; Gattuso, J.-P.; Fulweiler, R.W.; Hughes, T.P.; Knowlton, N.; Lovelock, C.E.; et al. Rebuilding marine life. Nature2020, 580, 39–51.
- Reguero, B.G.; Storlazzi, C.D.; Gibbs, A.E.; Shope, J.B.; Cole, A.D.; Cumming, K.A.; Beck, M.W. The value of US coral reefs for flood risk reduction. Nat. Sustain2021, 1–11.
- Karbassi, A. R., Maghrebi, M., Lak, R., Noori, R., &Sadrinasab, M. Application of sediment cores in reconstruction of long-term temperature and metal contents at the northern region of the Persian Gulf. Desert 2019, 24(1), 109-118.
- Eckstein, V.;Kunzel, L.; Schafer. The Global Climate Risk Index 2018. 2018. Available online: htt ps://www.germanwatch.org/en/node/14987 (accessed 23 April 2020).
- Al-Maamary, H. M.; Kazem, H.A.; Chaichan, M.T. Climate change: the game changer in the Gulf Cooperation Council region. Renew. and Sust. Energy Rev 2017, 76, 555-576.
- Hereher, M. E. Assessment of climate change impacts on sea surface temperatures and sea level rise—The Arabian Gulf. Climate 2020, 8(4), 50.
- Abdrabo, M. A.; Hassaan, M. A. Assessment of Policy-Research Interaction on Climate Change Adaptation Action: Inundation by Sea Level Rise in the Nile Delta. J. of Geosci. and Envi. Protection2020, 8(10), 314.
- El-Nahry, A. H.;Doluschitz, R. Climate change and its impacts on the coastal zone of the Nile Delta, Egypt. Envtal Earth Sci2010, 59(7), 1497-1506.
- Natesan, U.; Parthasarathy, A. The potential impacts of sea level rise along the coastal zone of Kanyakumari District in Tamilnadu, India. J. of Coastal Conserv2010, 14(3), 207-214.
- Alhowaish, A. K. Eighty years of urban growth and socioeconomic trends in Dammam Metropolitan Area, Saudi Arabia. Habitat International2015, 50, 90-98.
- Abou-Korin, A. A.; Al-Shihri, F. S. (). Rapid urbanization and sustainability in Saudi Arabia: the case of Dammam metropolitan area. J. of Sustain. Devt2015, 8(9), 52.
- Local Weather. Dammam Climate History.n.d. Available online: http://www.myweather2.com/City-Town/Saudi-Arabia/Dammam/climate-profile.aspx (accessed 5 January 2020).
- Atif, R.M.; Almazroui, M.; Saeed, S.; Abid, M.A., Islam, M.N.; Ismail, M. Extreme precipitation events over Saudi Arabia during the wet season and their associated teleconnections. Atmosph. Research2020, 231, 104655.
- Maghrebi, M., Karbassi, A., Lak, R., Noori, R., &Sadrinasab, M. Temporal metal concentration in coastal sediment at the north region of Persian Gulf. Marine pollution bulletin2018, 135, 880-888.
- UN-Habitat.Dammam CPI Profile 2016.Saudi Future Cities Programme, 2016.Available online: htt ps://www.futuresaudicities.org/wp-content/uploads/2017/08/Damman.pdf (accessed 16 August 2022).
- Yin, R.K. Qualitative Research From Start to Finish. Guilford Press, New York.2010.
- Google Map, 2022, https://www.google.com/maps/@26.3764116,50.1804495,30977m/data=!3m1!1e3 (accessed on October 26, 2022).
- Malik, A.; Abdalla, R. Geospatial modeling of the impact of sea level rise on coastal communities: application of Richmond, British Columbia, Canada. Modeling Earth Syst. and Envi2016, 2(3), 1-17.
- AlQahtany, A.M.; Dano, U.L.; Elhadi Abdalla, E.M.; Mohammed, W.E.; Abubakar, I.R.; Al-Gehlani, W.A.G.; Alshammari, M. S. Land Reclamation in a Coastal Metropolis of Saudi Arabia: Environmental Sustainability Implications. Water2022, 14(16), 2546.
- Chinowsky, P.S.; Price, J.C.; Neumann, J.E. Assessment of climate change adaptation costs for the US road network. Glob. Environ. Chang2013, 23, 764–773.
- Titus, J.G.; Anderson, K. E. Coastal sensitivity to sea-level rise: A focus on the Mid-Atlantic region (Vol. 4). Climate Change Science Program. 2009.
- Heberger, M. The Impacts of Sea Level Rise on the San Francisco Bay; California Energy Commission: Sacramento,CA, USA, 2012.
- Lee, Y. Coastal planning strategies for adaptation to sea level rise: A case study of Mokpo, Korea. J. of Building Constr. and Planning Res2014,1, 74-81.
- Azevedo de Almeida, B.;Mostafavi, A. Resilience of infrastructure systems to sea-level rise in coastal areas: Impacts, adaptation measures, and implementation challenges. Sustainability2016, 8(11), 1115.
- Byravan, S.; Rajan, S.C. Sea level rise and climate change exiles: A possible solution. Bull. At. Sci2015, 71, 21–28.
- Xu, L.; Ding, S.; Nitivattananon, V.;Tang, J. Long-Term Dynamic of Land Reclamation and Its Impact on Coastal Flooding: A Case Study in Xiamen, China. Land2021, 10(8), 866.
Figure 1.
Map of Saudi Arabia showing the Eastern Province and the location of DMA along the Arabian/Persian Gulf (Source: Authors).
Figure 1.
Map of Saudi Arabia showing the Eastern Province and the location of DMA along the Arabian/Persian Gulf (Source: Authors).
Figure 2.
Historical average temperature for DMA, 1981-2020 (Source: Authors).
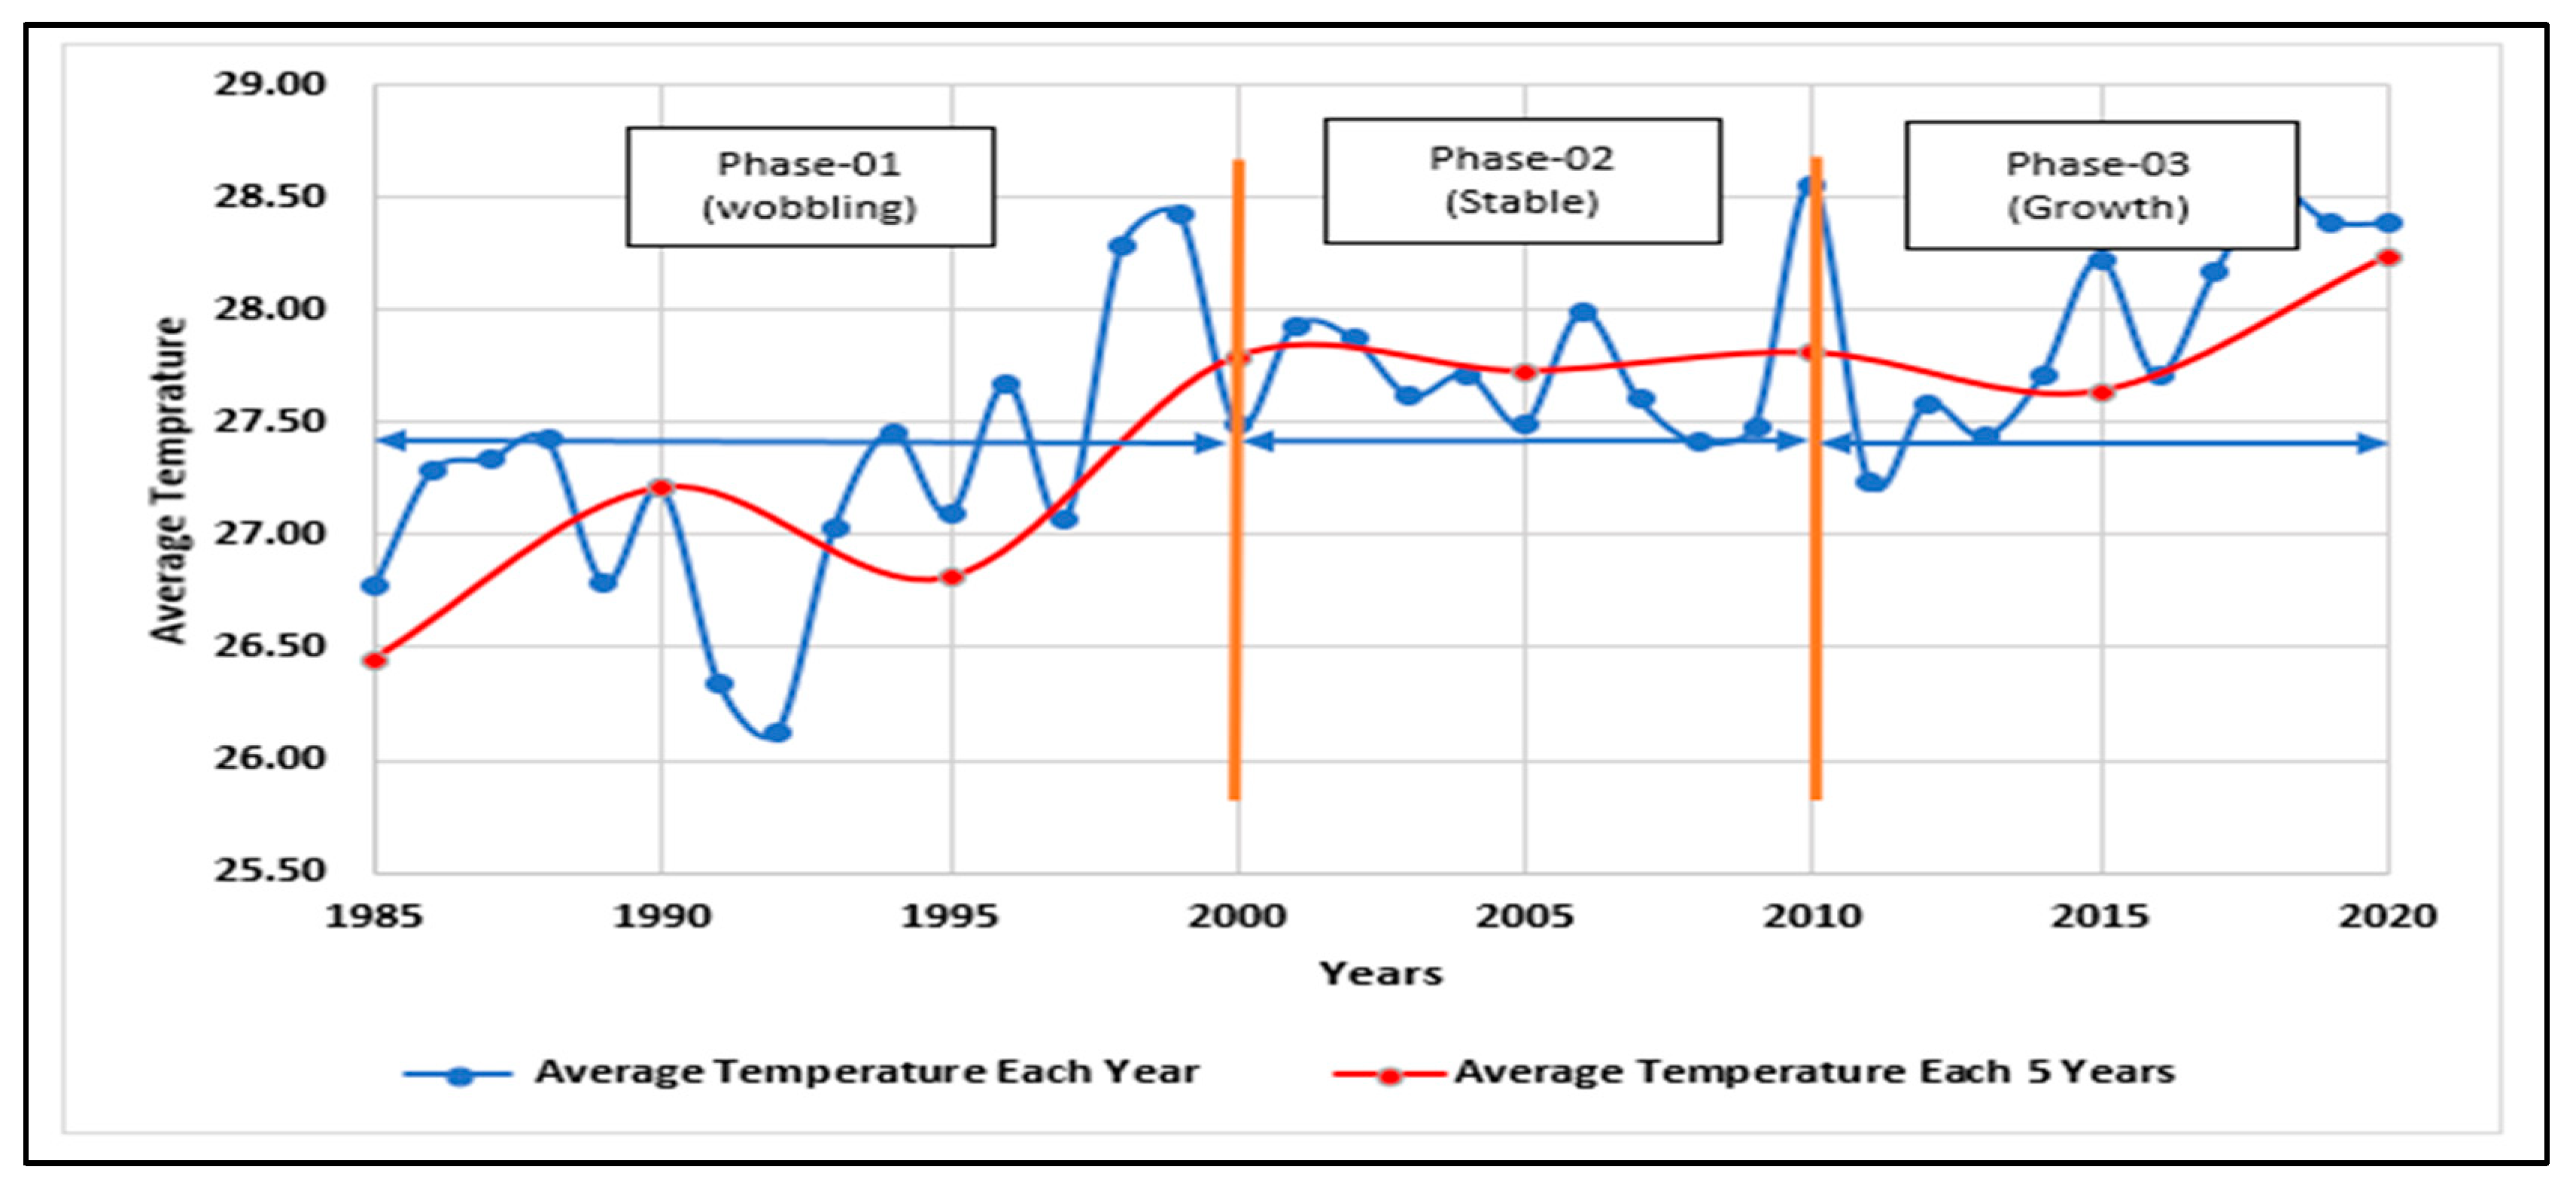
Figure 3.
Average annual rainfall (mm) for DMA from 1981-2020.
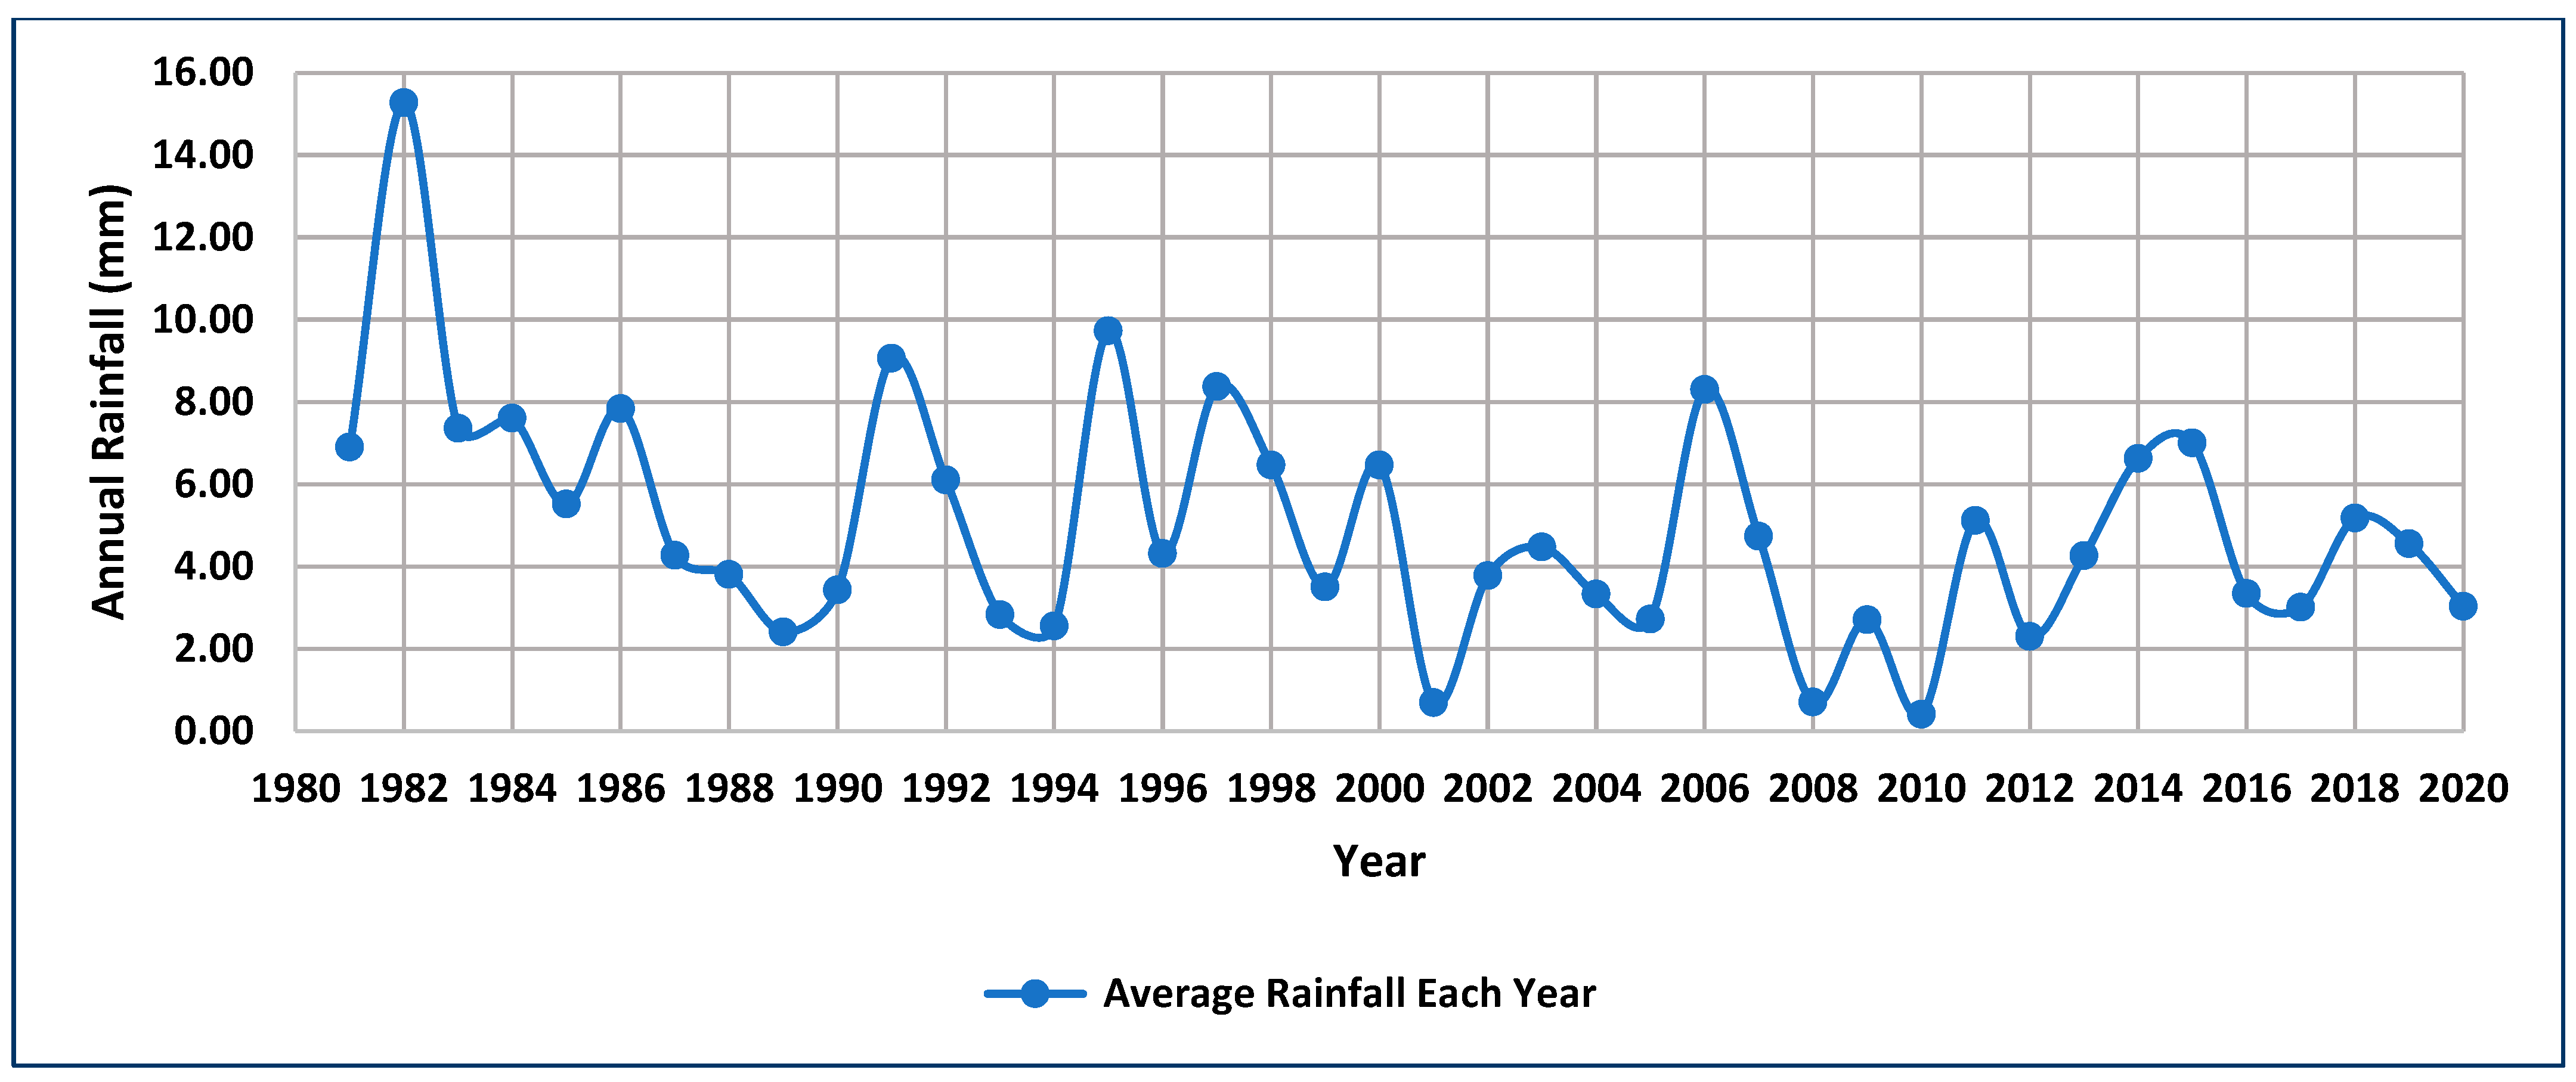
Figure 7.
Land use map of DMA highlighting the size of the affected area at 1.1 m SLR scenario.
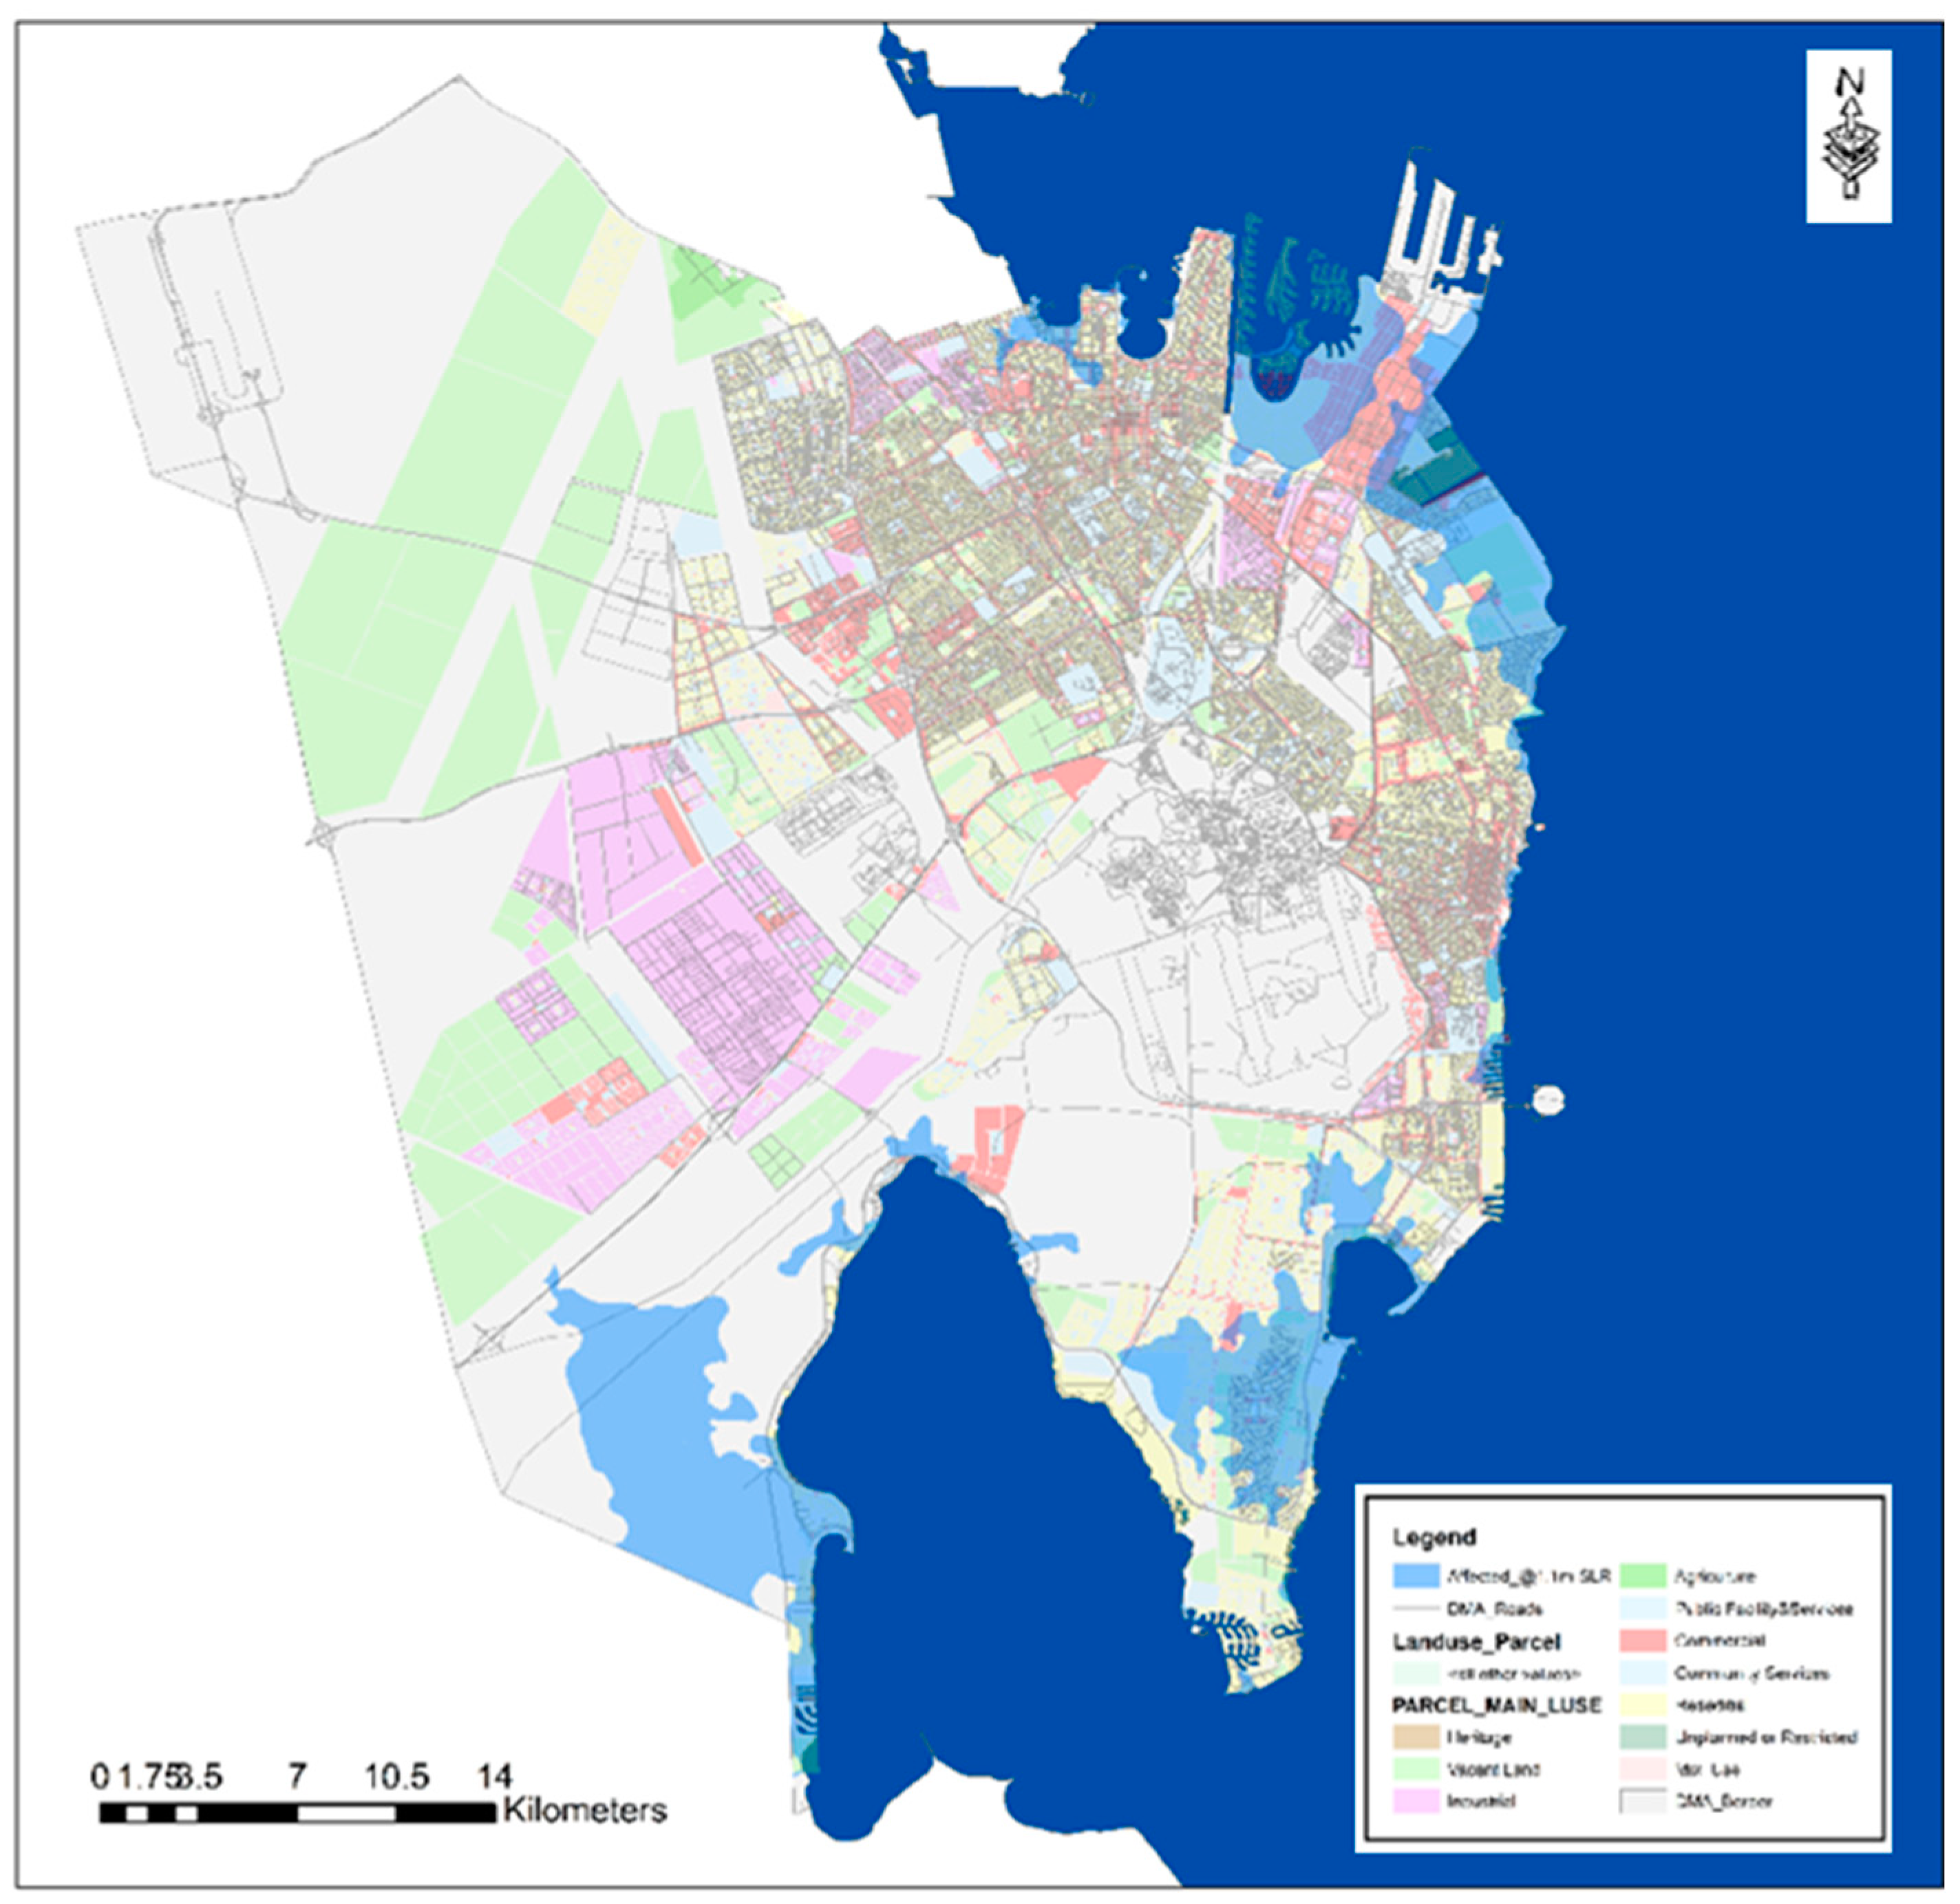
Figure 8.
Map of Dammam city seaside showing the affected areas along King Faisal Road at 1.1 m SLR modeling scenario.
Figure 8.
Map of Dammam city seaside showing the affected areas along King Faisal Road at 1.1 m SLR modeling scenario.
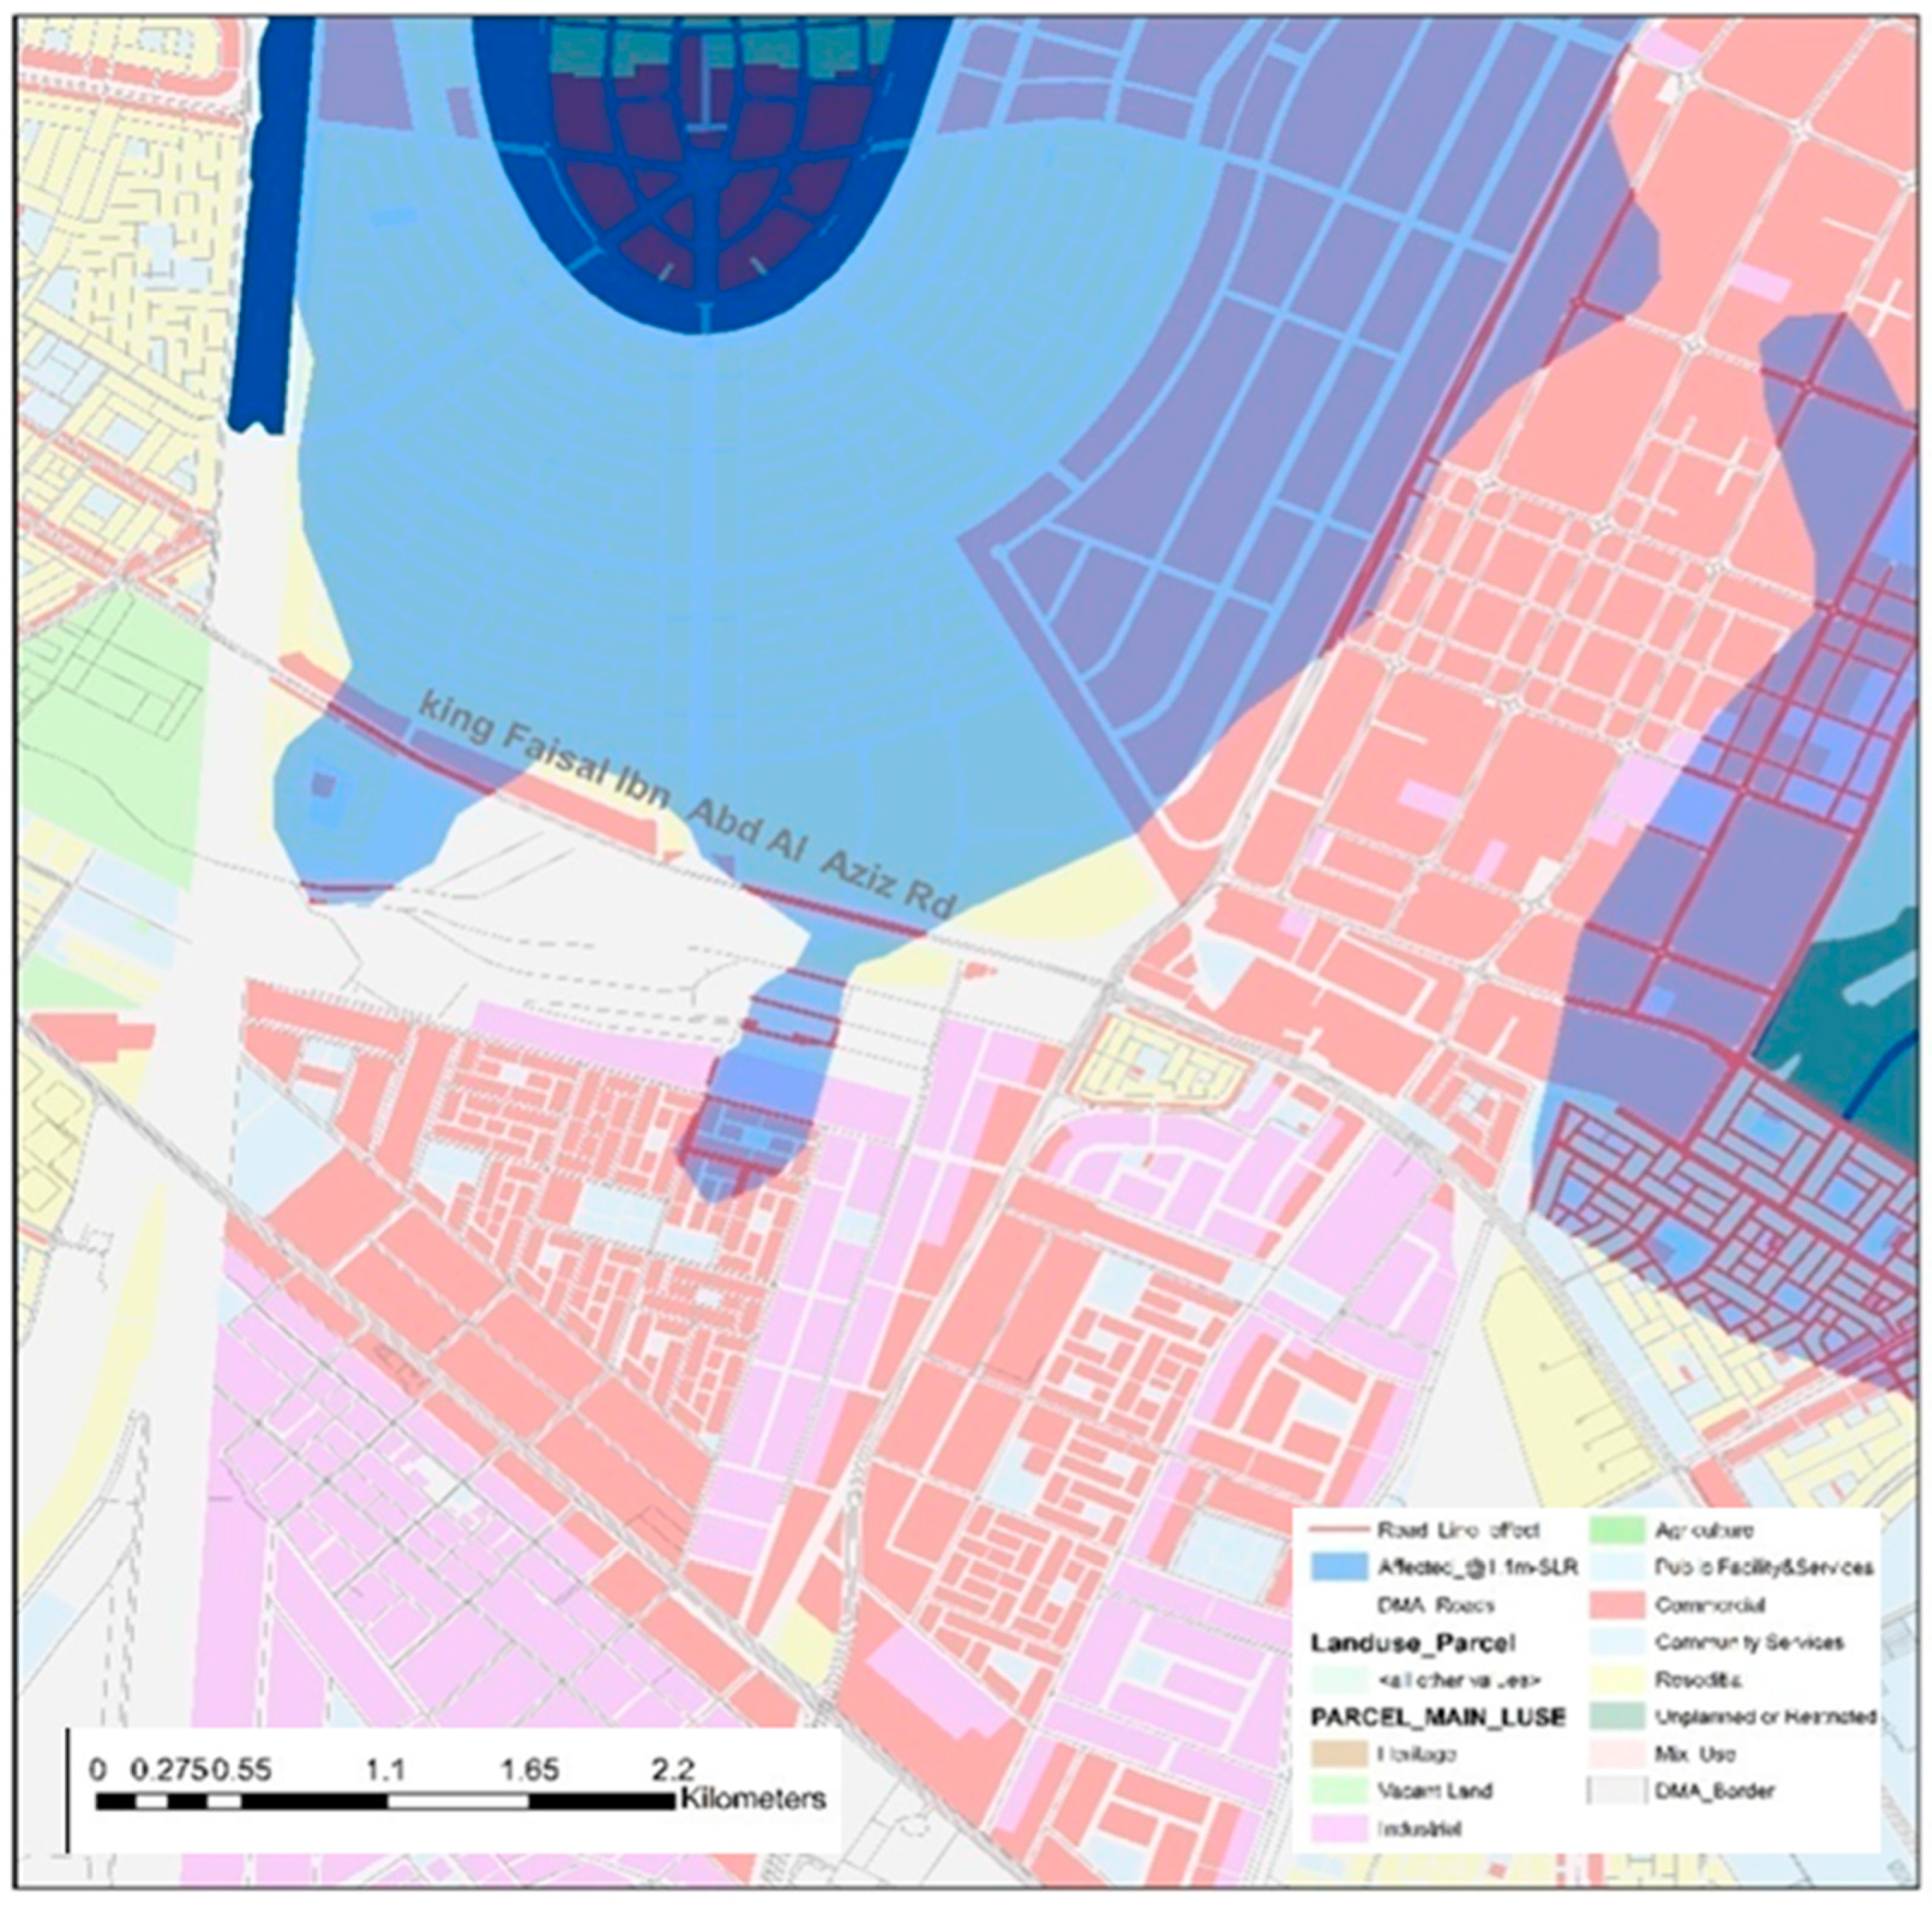
Figure 9.
Map of DMA seaside showing affected parts of various land-uses including IAU Campus at 1.1m SLR modeling scenario.
Figure 9.
Map of DMA seaside showing affected parts of various land-uses including IAU Campus at 1.1m SLR modeling scenario.
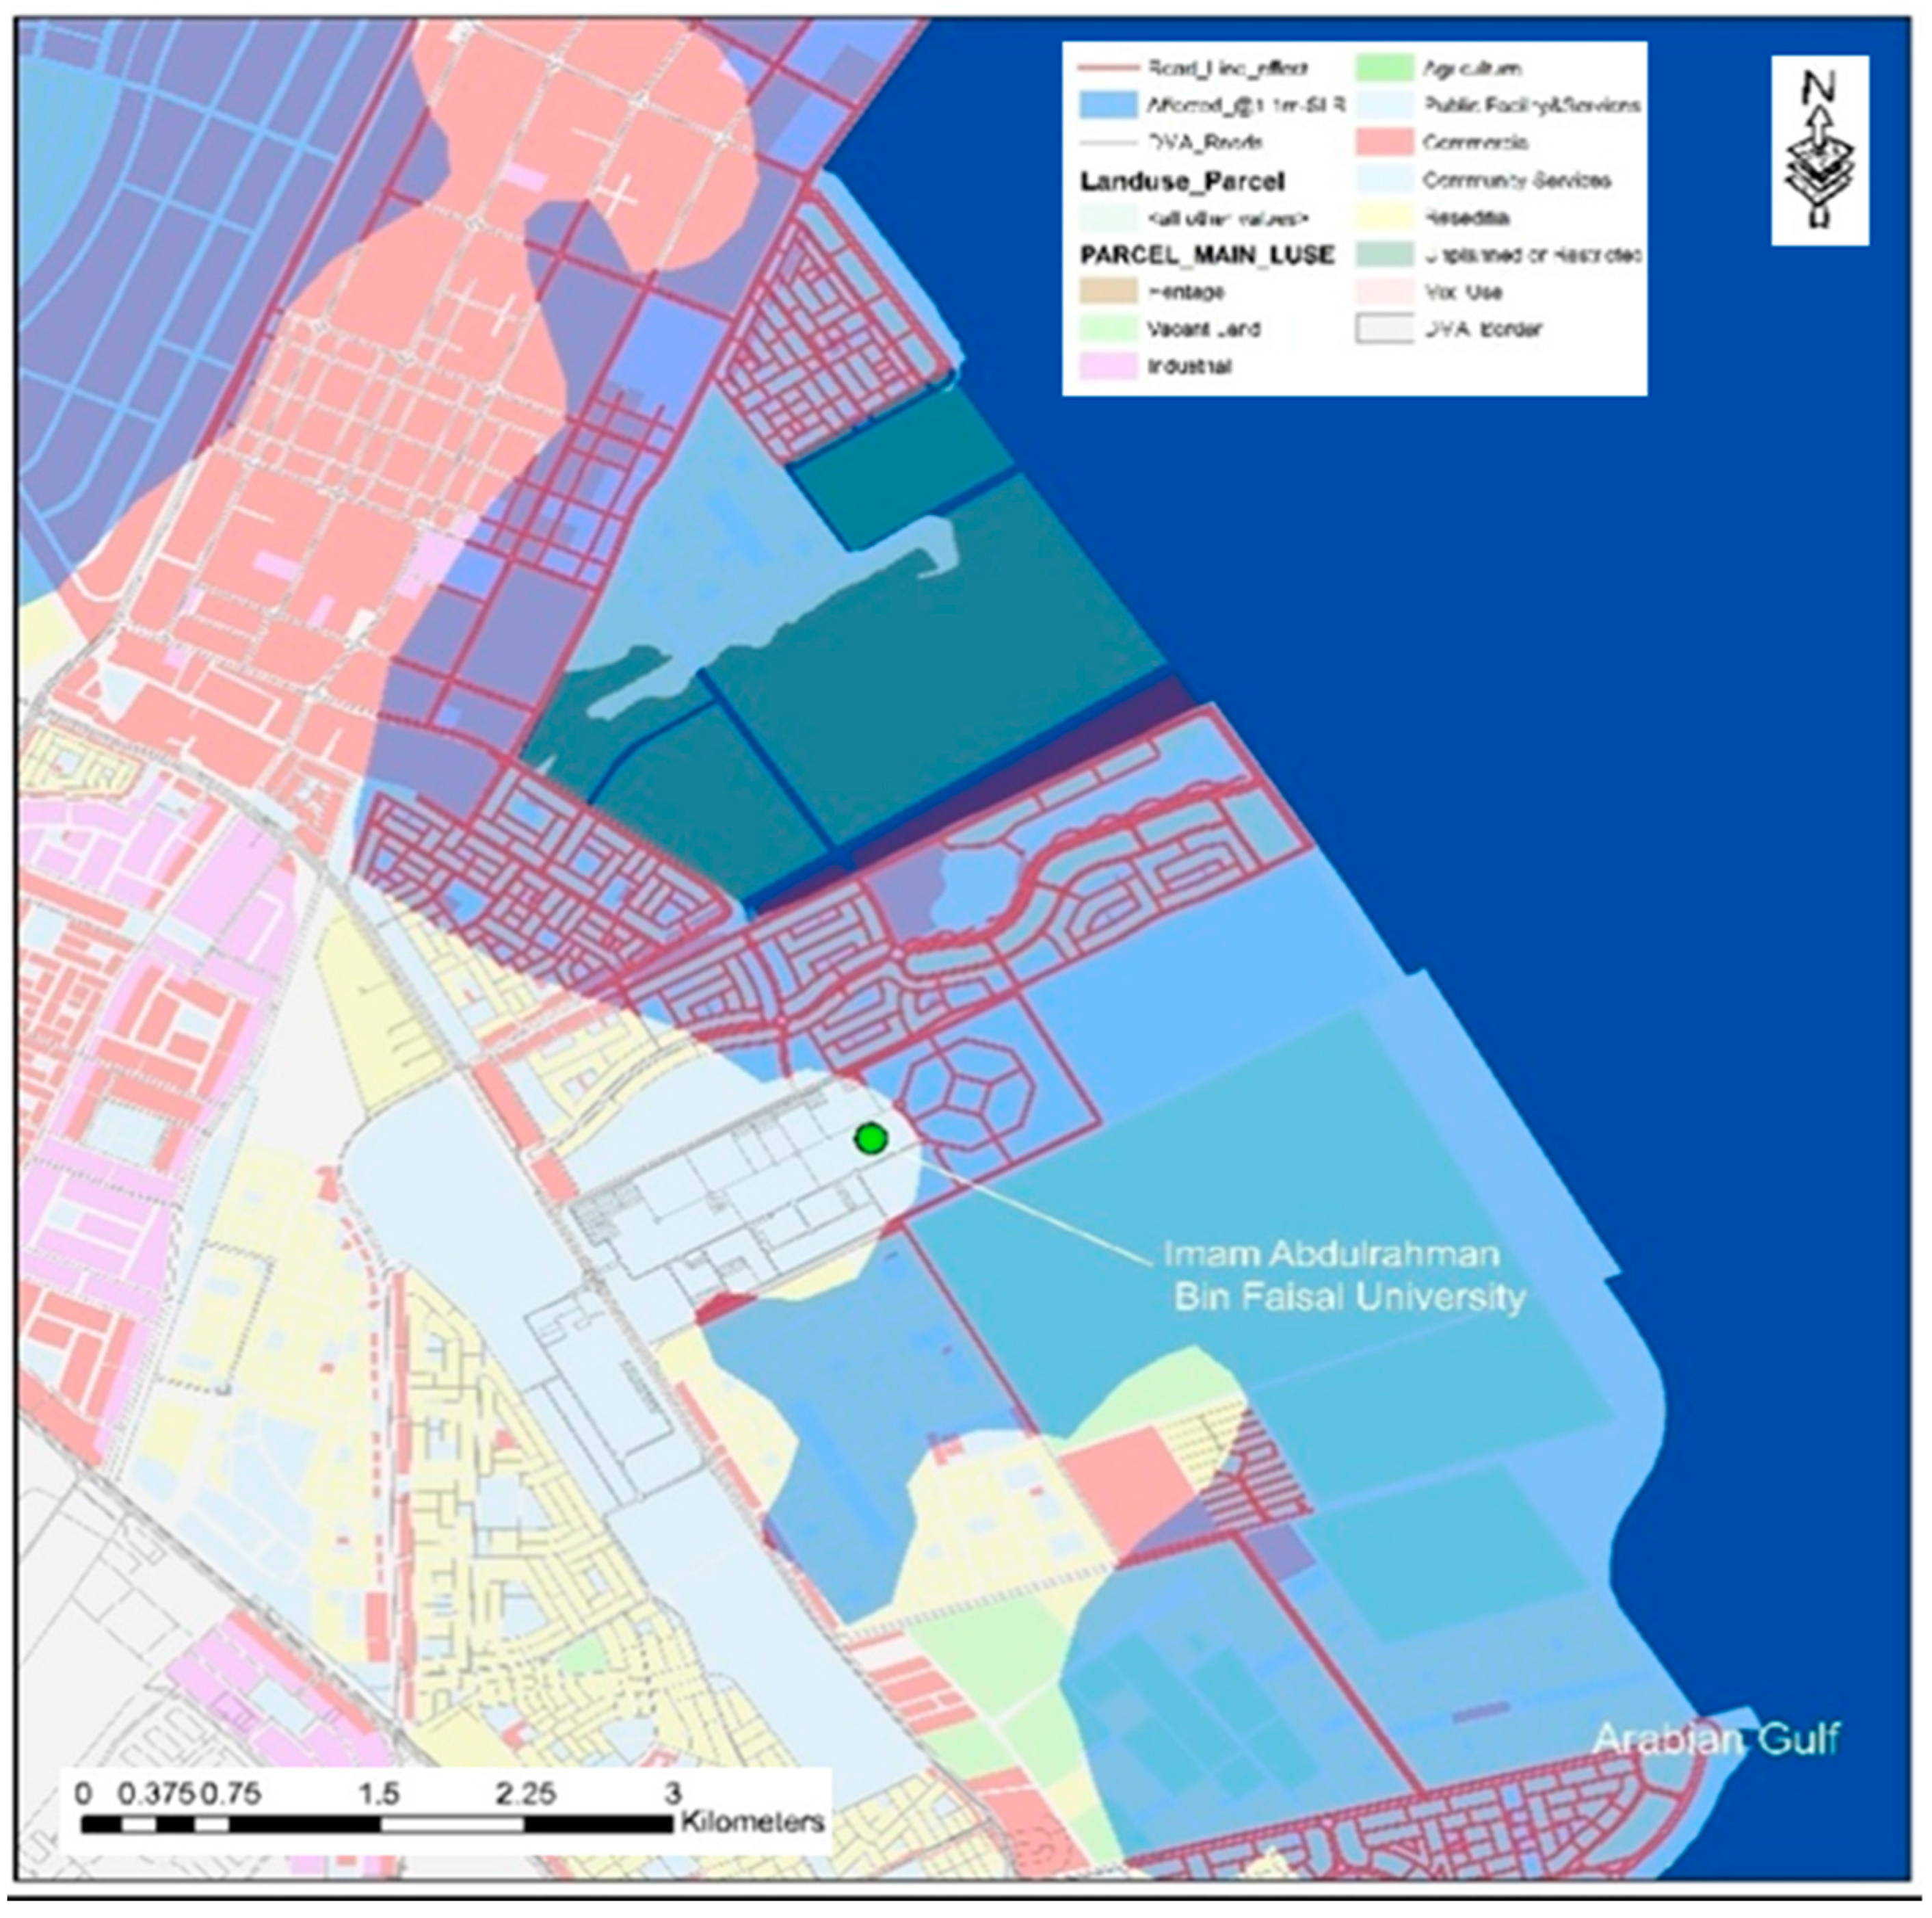
Figure 10.
Map of DMA seaside showing the affected sections of King Abdulaziz Seaport at 1.1 m SLR modeling scenario.
Figure 10.
Map of DMA seaside showing the affected sections of King Abdulaziz Seaport at 1.1 m SLR modeling scenario.
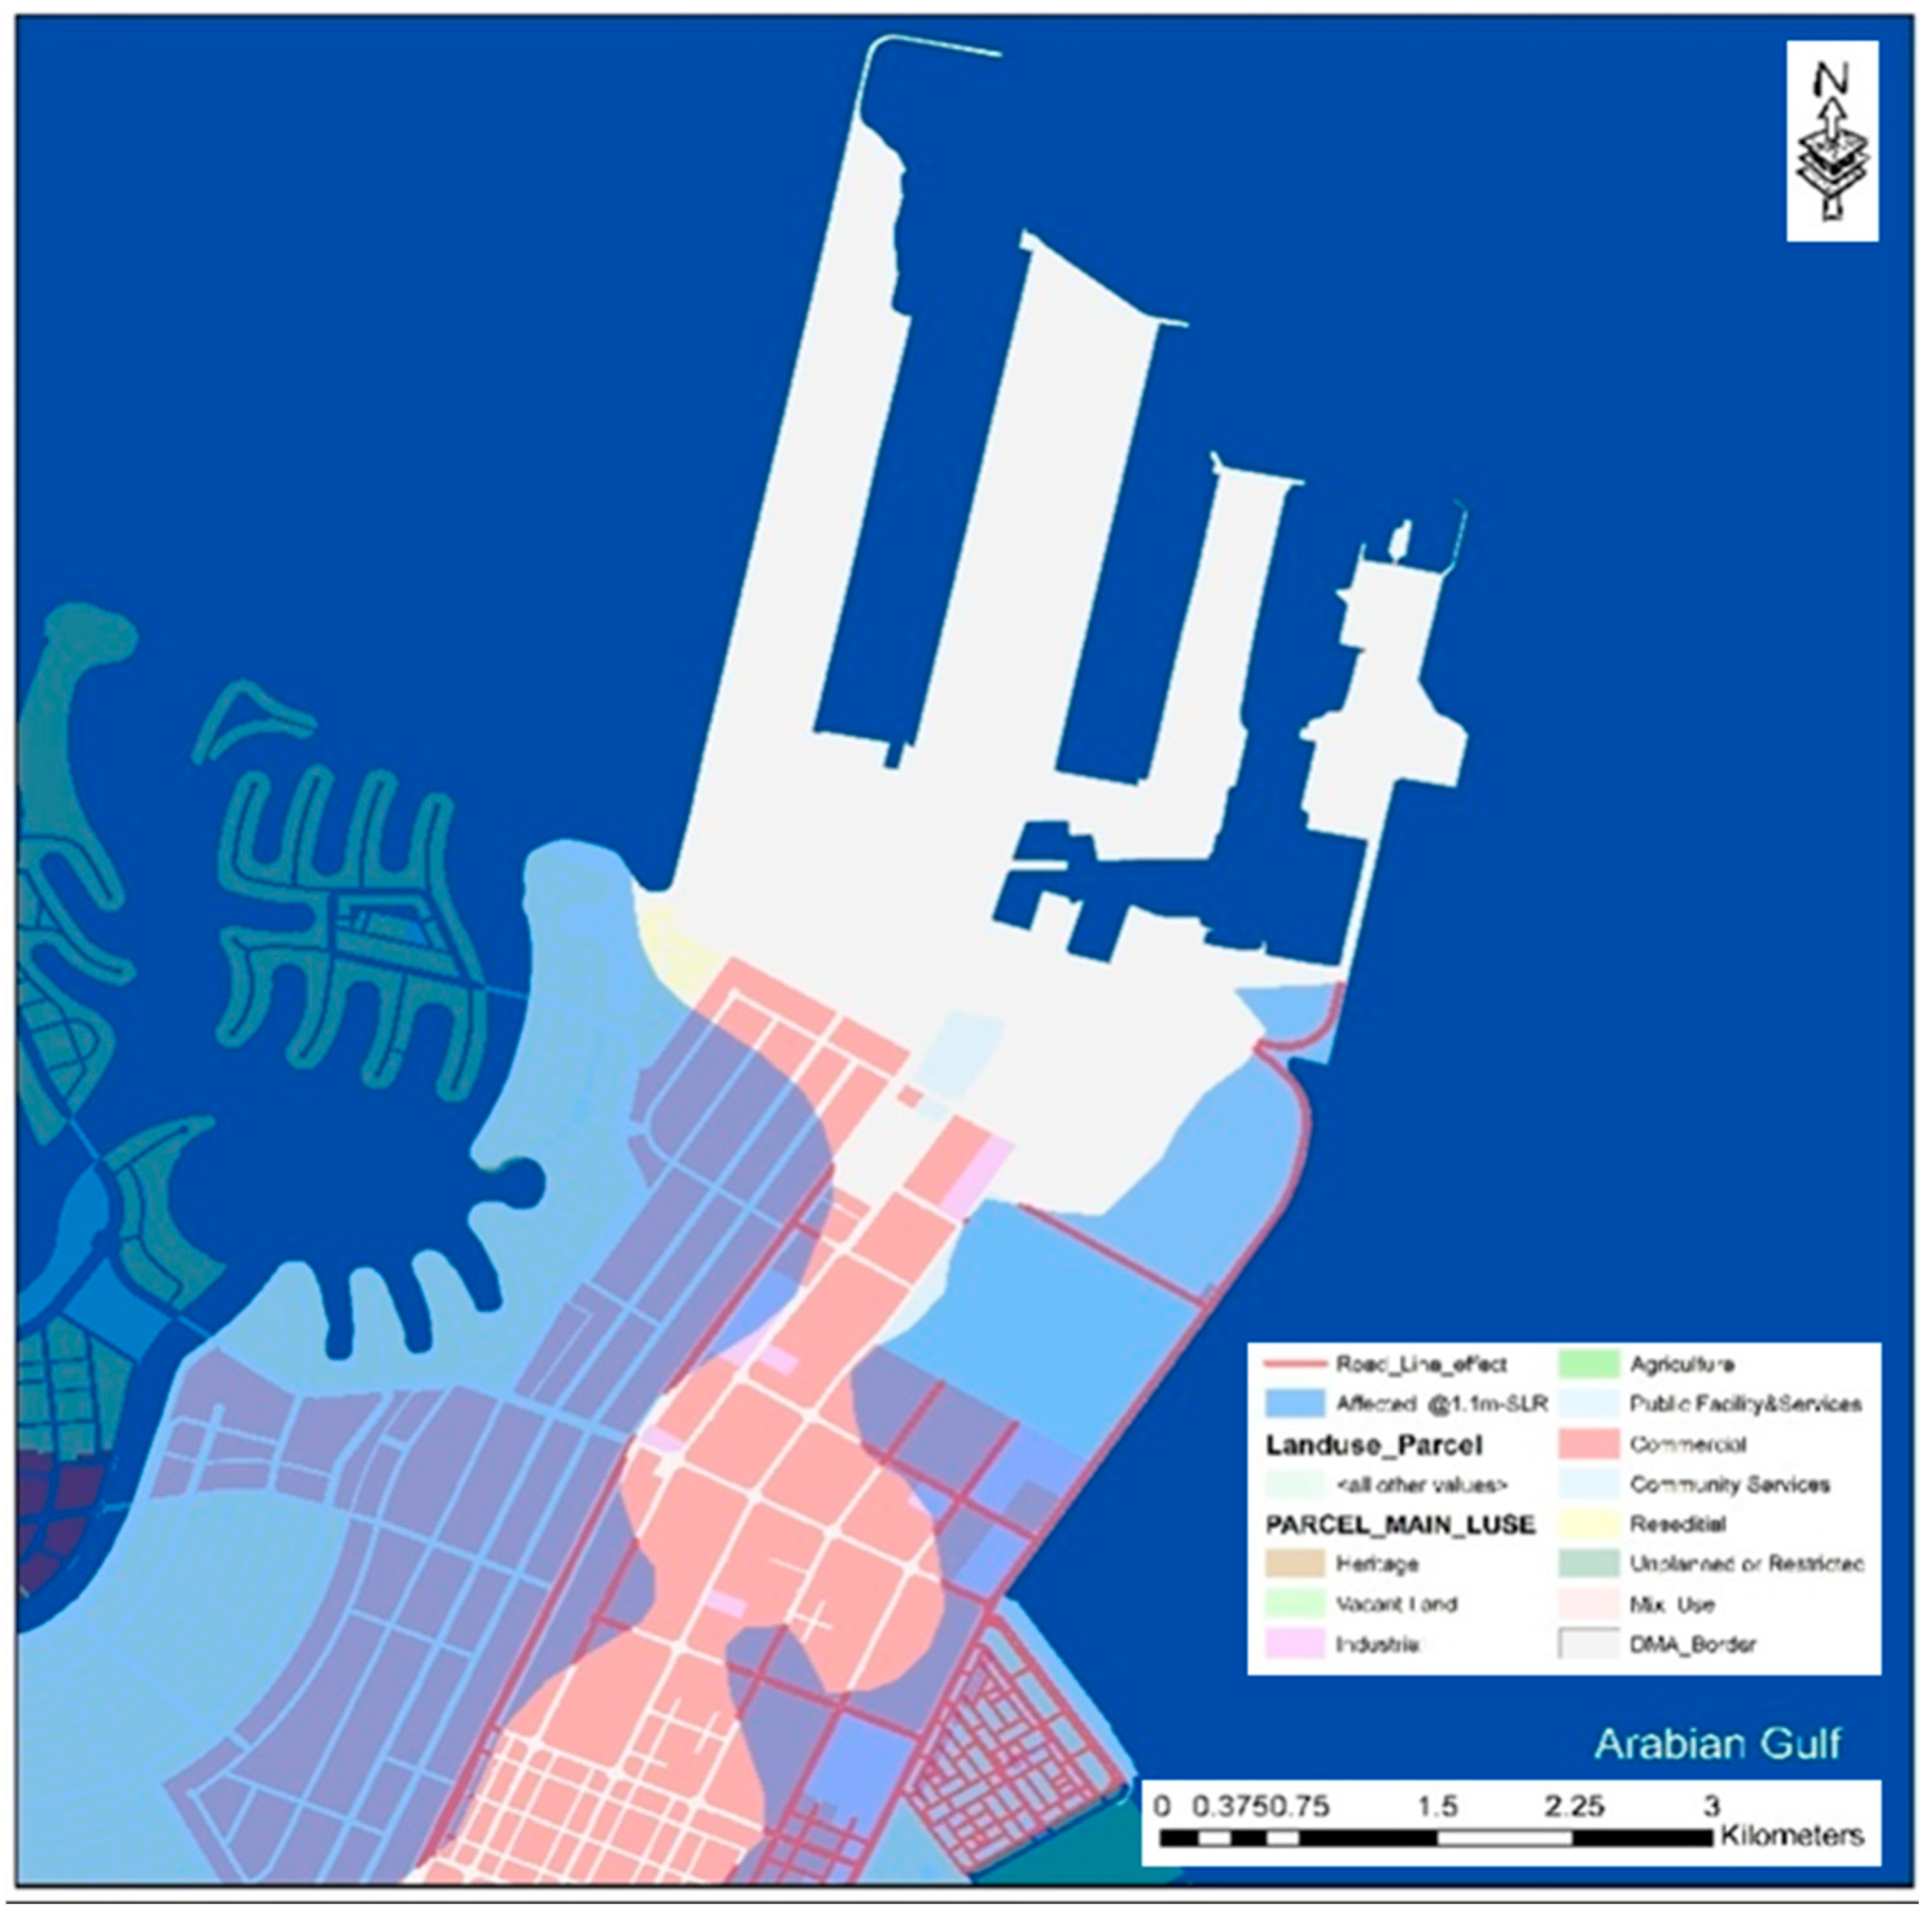
Figure 11.
The overall affected zones by 1.1 m SLR scenario in DMA.
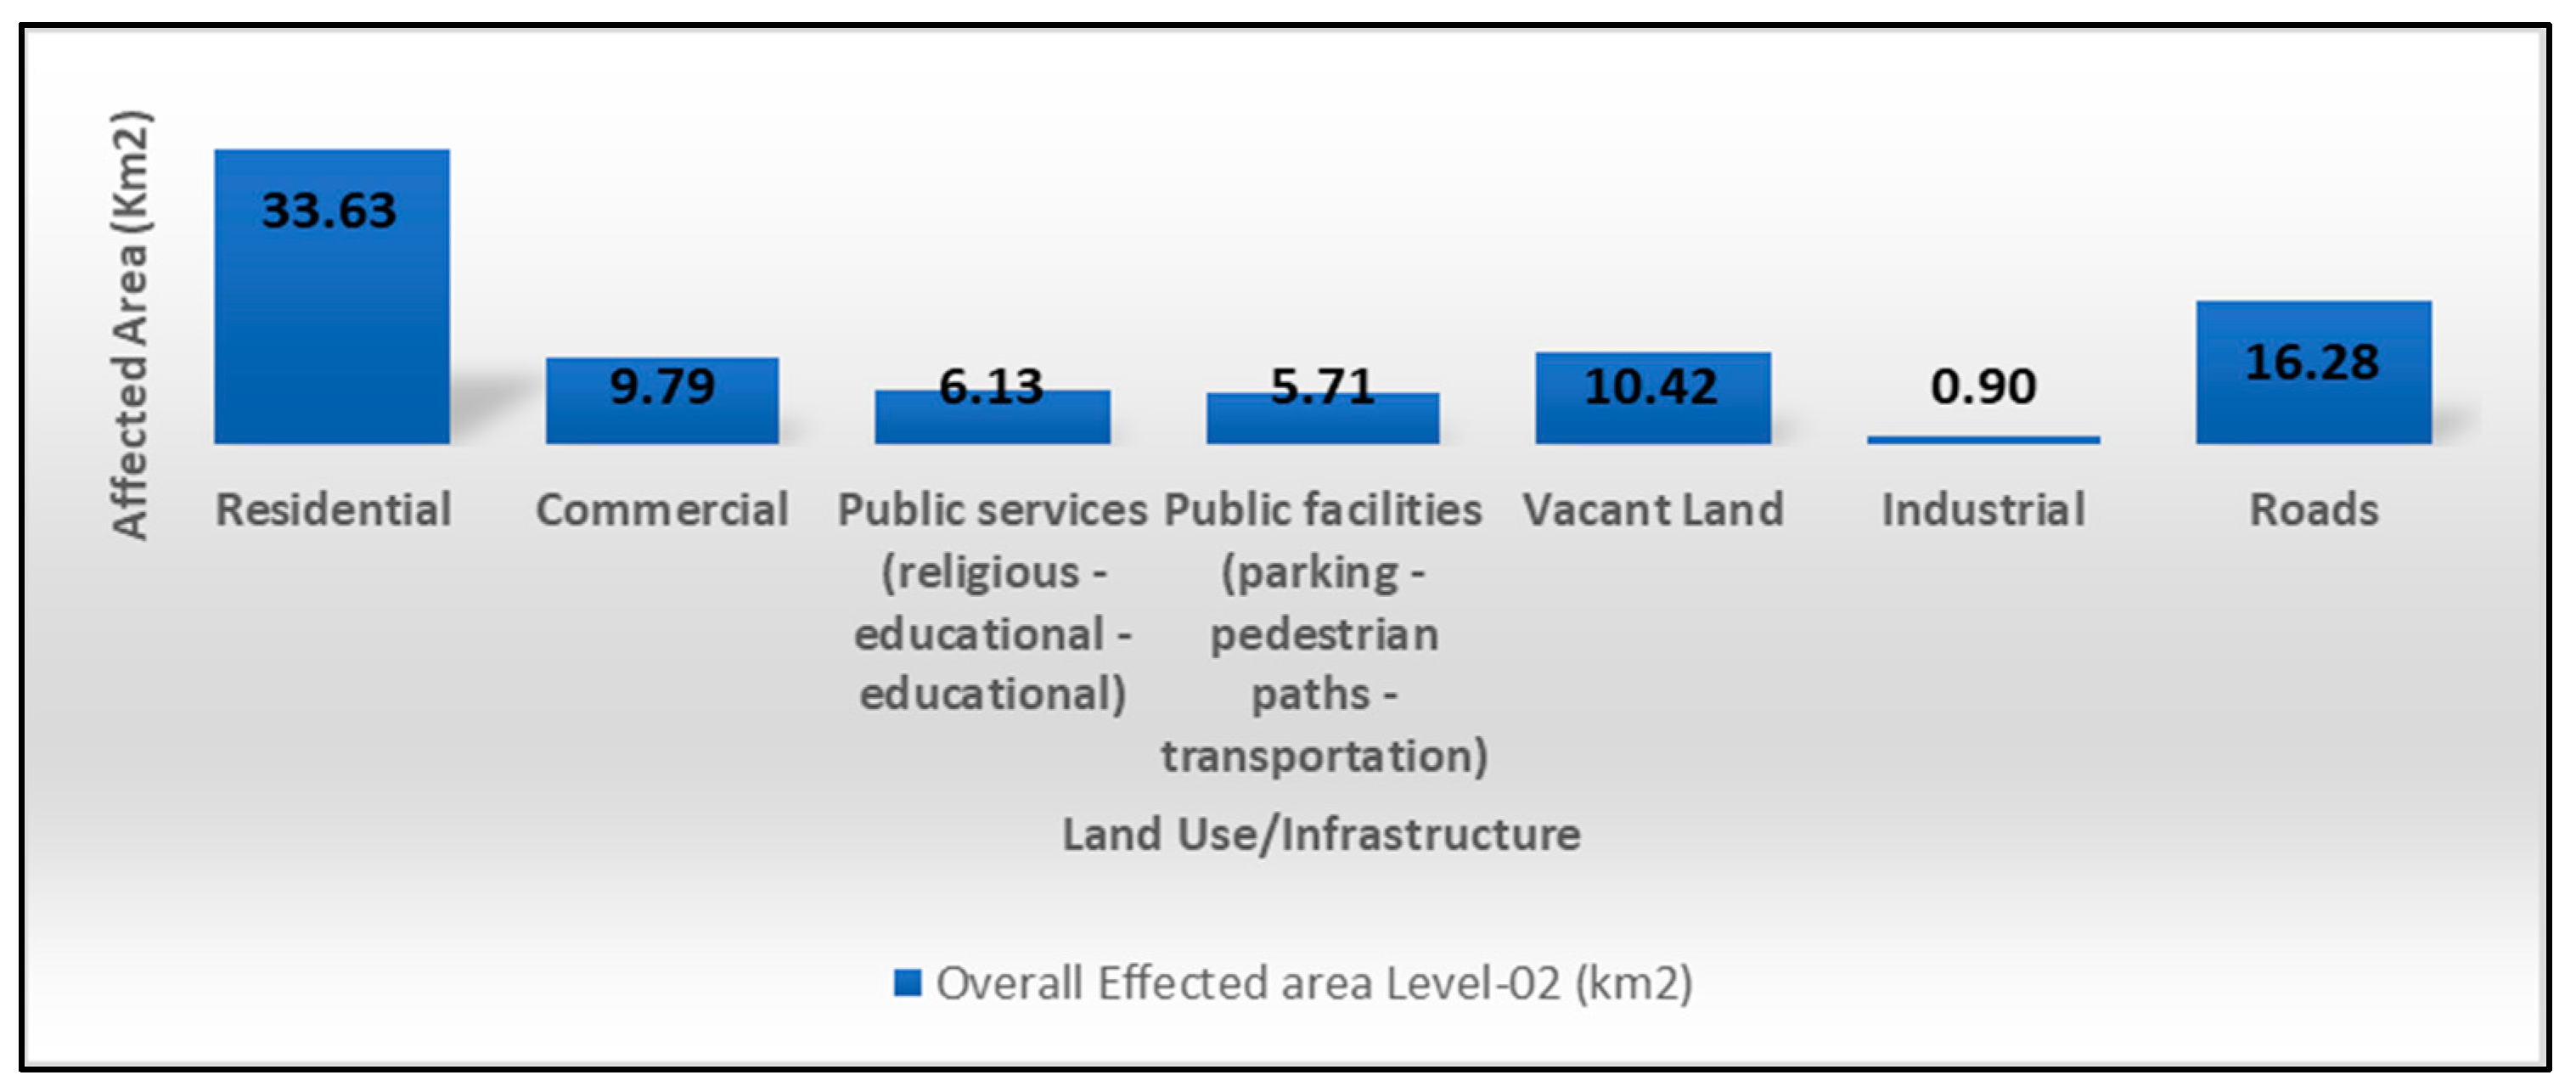

Table 1.
Impacts of 1.1 m SLR scenario on the land uses and infrastructure systems in DMA.
| Land Use/Infrastructure | Khobar | Dhahran | Dammam East | Dammam Central | ||||
| Total area | Affected area | Total area | Affected area | Total area | Affected area | Total area | Affected area | |
| Residential (km2) | 72.39 | 18.71 (25.85%) | 25.86 | 4.23 (16.35%) | 36.47 | 9.65 (26.47%) | 10.46 | 1.04 (9.91%) |
| Commercial (km2) | 17.45 | 1.63 (9.32%) | 8.59 | 0.13 (1.55%) | 22.86 | 7.67 (33.56%) | 6.53 | 0.36 (5.51%) |
| Public Facility and services: religious, educational, health, parking, ports (km2) | 23.42 | 6.23 (26.60%) | 10.72 | 0.74 (6.90%) | 23.80 | 4.18 (17.56%) | 5.87 | 0.69 (11.75%) |
| Vacant Land (km2) | 17.26 | 5.47 (31.72%) | 14.54 | 0.46 (3.14%) | 6.88 | 4.44 (64.58%) | 0.76 | 0.05 (6.04%) |
| Mied use: Residential and Commercial land (km2) | 1.48 | 0.00 (0.00%) | 9.42 | 0.00 (0.00%) | 0.00 | 0.00 (0.00%) | 0.00 | 0.00 (0.00%) |
| Industrial Area (km2) | 0.02 | 0.00 (0.00%) | 0.03 | 0.00 (0.00%) | 5.94 | 0.90 (0.00%) | 1.79 | 0.00 (0.00%) |
| Roads (km) | 49.20 | 10.20 (20.74%) | 21.31 | 1.78 (8.37%) | 25.84 | 3.39 (13.13%) | 11.62 | 0.90 (7.75%) |
Disclaimer/Publisher’s Note: The statements, opinions and data contained in all publications are solely those of the individual author(s) and contributor(s) and not of MDPI and/or the editor(s). MDPI and/or the editor(s) disclaim responsibility for any injury to people or property resulting from any ideas, methods, instructions or products referred to in the content. |
© 2025 by the authors. Licensee MDPI, Basel, Switzerland. This article is an open access article distributed under the terms and conditions of the Creative Commons Attribution (CC BY) license (http://creativecommons.org/licenses/by/4.0/).
Copyright: This open access article is published under a Creative Commons CC BY 4.0 license, which permit the free download, distribution, and reuse, provided that the author and preprint are cited in any reuse.


