
Submitted:
30 April 2025
Posted:
02 May 2025
You are already at the latest version
Abstract
Background: The gut microbiota influences metabolism, immunity, and aging, and diet shapes microbiota composition. The Dietary Index for Gut Microbiota (DI-GM) quantifies dietary quality favoring microbial diversity; however, its relationship with mortality remains unclear. Objective: We assessed associations of DI-GM with all-cause and cardiovascular disease (CVD) mortality, and evaluated phenotypic age as a potential mediator. Methods: We included 40,314 adults aged ≥20 years from the U.S. National Health and Nutrition Examination Survey (NHANES) cycles 1999–2018, with mortality follow-up through linkage to the National Death Index up to December 31, 2019. DI-GM scores were derived from dietary recalls, and phenotypic age was computed from blood biomarkers. Cox regression and mediation analyses were performed to assess associations and mediating effects.Results: Over a median follow-up of 115 months, 6,156 all-cause and 1,933 CVD deaths occurred. Compared to participants in the lowest quartile (Q1, scores 0–2), those in the highest quartile (Q4, scores ≥5) showed reduced risks of all-cause (HR: 0.84; 95% CI: 0.73–0.97) and CVD mortality (HR: 0.76; 95% CI: 0.57–1.02). Each 1-score increment was associated with lower all-cause (HR: 0.97; 95% CI: 0.94–0.99) and CVD mortality (HR: 0.94; 95% CI: 0.90–0.99). Phenotypic age mediated 31.9% and 13.4% of these associations, respectively. Conclusions: Greater adherence to a gut microbiota–supportive dietary pattern, as measured by the DI-GM, was associated with reduced risks of all-cause and CVD mortality. These associations were partially mediated by phenotypic age, suggesting that biological aging may be an important pathway linking diet to longevity and cardiovascular health. Our findings highlight the potential of microbiota-targeted dietary strategies for promoting healthy aging in the general population.
Keywords:
gut microbiota
; dietary quality
; phenotypic age
; mortality
; cardiovascular disease
; NHANES
1. Introduction
Population aging and the global surge in chronic noncommunicable diseases present significant public health challenges. According to projections from the Global Burden of Disease study, annual deaths worldwide are expected to rise from 60.1 million in 2022 to 90.7 million by 2050, driven largely by aging populations and lifestyle-related risk factors, particularly diet[1,2] Cardiovascular disease (CVD) remains the leading cause of death globally, strongly influenced by modifiable dietary behaviors[3]. Therefore, understanding dietary strategies that effectively mitigate aging-related mortality risks is essential.
Emerging evidence underscores the gut microbiota as a crucial intermediary linking dietary habits to chronic health outcomes[4,5,6,7]. The gut microbiota contributes to metabolic homeostasis[8], immune regulation[9], and systemic inflammation[10], thereby affecting cardiovascular[11], metabolic[12], and neurocognitive health[13]. Microbial dysbiosis, characterized by reduced microbial diversity and altered composition, has been associated with increased inflammation, impaired immune responses, and elevated risks of chronic diseases and mortality[12,14].
To quantify dietary impacts on gut microbiota health, Kase et al. recently proposed the dietary index for gut microbiota (DI-GM), a literature-derived dietary quality score incorporating foods and nutrients specifically associated with beneficial microbial diversity, such as fiber-rich foods, fermented dairy, and plant-based nutrients, along with reduced intake of red and processed meats and refined carbohydrates[15]. Higher DI-GM scores have been linked to favorable outcomes including reduced risks of depression, stroke, and type 2 diabetes[16,17,18]. However, whether adherence to a microbiota-supportive diet, as measured by the DI-GM, predicts long-term mortality has not yet been evaluated.
Biological aging, distinct from chronological age, refers to the progressive decline in physiological function and resilience over time. Among the various proposed biomarkers—such as telomere length, multi-omics-based clocks, and composite scores—phenotypic age has emerged as a validated and clinically practical indicator of biological aging[19,20]. Derived from routine blood biomarkers, it has shown strong predictive value for morbidity and mortality across diverse populations[21]. Moreover, recent evidence suggests that dietary factors may influence phenotypic aging trajectories, potentially through gut microbiota-mediated mechanisms[22,23,24,25].
Given this background, we hypothesized that greater adherence to DI-GM would be associated with reduced risks of all-cause and CVD mortality, and that these associations could be partially explained by reduced biological aging as indicated by lower phenotypic age. Clarifying this association could inform dietary guidelines and interventions aimed at promoting longevity and cardiovascular health. To address this hypothesis, we analyzed data from the National Health and Nutrition Examination Survey (NHANES) 1999–2018, a large, nationally representative cohort of U.S. adults, with long-term mortality follow-up through 2019.
2. Materials and Methods
2.1. Study Design and Population
This prospective cohort study was based on data from NHANES, a nationally representative, cross-sectional survey conducted by the National Center for Health Statistics (NCHS) using a stratified, multistage sampling strategy[26,27]. Although NHANES is cross-sectional in nature, mortality outcomes were obtained via linkage to the National Death Index, enabling longitudinal follow-up. Baseline data were collected from 1999 to 2018, and mortality follow-up was available through December 31, 2019. Adults aged ≥20 years who completed the Mobile Examination Center visit and provided dietary data were eligible for inclusion. We excluded participants with missing mortality data (n = 138), missing dietary data to calculate DI-GM scores (n = 6,292), or missing covariates (n = 8,337), yielding a final analytic sample of 40,314 participants. For mediation analyses involving phenotypic age, biomarkers were only available in the 1999–2010 and 2015–2018 cycles, resulting in a subsample of 29,581 participants after similar exclusions. Participant selection is illustrated in Figure S1 and Figure S2.
This study was reported in accordance with the Strengthening the Reporting of Observational Studies in Epidemiology (STROBE) guidelines[28].
2.2. Mortality Ascertainment
Mortality status and cause of death were determined through linkage to the National Death Index, with follow-up through December 31, 2019. All-cause mortality was defined as death from any cause. Cardiovascular mortality was defined based on ICD-10 codes I00–I09, I11, I13, I20–I25, I26–I28, I29–I51, and I60–I69[29,30,31] . Follow-up time was calculated from the date of the Mobile Examination Center visit to death or the end of follow-up.
2.3. Assessment of DI-GM
Dietary intake was assessed via in-person 24-hour recalls. Although two recalls were available for NHANES cycles from 2003 onward, we used only the first-day recall for all cycles to ensure consistency. The DI-GM was calculated according to the method described by Kase et al., incorporating 14 components[15]. The 10 microbiota-beneficial components were avocado, broccoli, chickpeas, coffee, cranberries, fermented dairy products, dietary fiber, nuts, seeds, and green tea (not assessed specifically in NHANES dietary recalls). The 4 microbiota-detrimental components included red meat, processed meat, refined grains, and high-fat foods (≥40% energy from fat). For each component, participants received 1 point for beneficial foods if consumption exceeded the sex-specific median, and 1 point for detrimental foods if intake was below the median. Scores were summed to yield a total DI-GM score ranging from 0 to 13, with higher scores indicating greater adherence to a gut microbiota–supportive diet. Participants were categorized into quartiles (Q1–Q4) based on their DI-GM scores[16,18,21].
2.4. Assessment of Phenotypic Age
Phenotypic age was estimated using Levine et al.’s algorithm, which incorporates chronological age and nine blood-based biomarkers: albumin, creatinine, glucose, C-reactive protein (CRP), lymphocyte percentage, mean cell volume, red cell distribution width, alkaline phosphatase, and white blood cell count[32] . Blood samples were collected after ≥8 hours of fasting and processed under standardized protocols[21,33,34,35].
The formula for phenotypic age is as follows:s
2.5. Assessment of Covariates
Covariates were selected based on prior literature and included demographic, socioeconomic, behavioral, and clinical factors[36,37,38,39,40,41,42,43]. Age was treated continuously and categorized (20–39, 40–64, ≥65 years) for stratified analyses. Race/ethnicity was dichotomized into Non-Hispanic White versus others. Marital status was grouped into living with a partner (married/cohabitating) and living alone (single/divorced/widowed)[30]. Education level was classified as less than high school, high school or equivalent, and above high school. PIR, indicating household income relative to poverty thresholds, was categorized into low (≤1.30), medium (1.31–3.50), and high (>3.50)[17]. Smoking status was defined as never, former, or current based on lifetime smoking of ≥100 cigarettes[29,44]. Alcohol intake was similarly categorized as never, former, and current drinkers based on historical drinking patterns[45]. Physical activity was assessed by weekly minutes spent on walking and physical tasks[46,47]. BMI was classified as normal (<25 kg/m²), overweight (25–29.9 kg/m²), or obese (≥30 kg/m²)[41]. Self-reported history of CVD included physician diagnosis of congestive heart failure, coronary heart disease, angina, myocardial infarction, or stroke. Metabolic syndrome diagnosis followed the 2005 Adult Treatment Panel III criteria[36,37].
2.6. Statistical Analysis
All analyses accounted for the complex sampling design using NHANES survey weights and design variables[48]. Cox proportional hazards models estimated hazard ratios (HRs) and 95% confidence intervals (CIs) for mortality outcomes. DI-GM scores were analyzed continuously and categorically, with linear trends assessed using median scores. Three models progressively adjusted for demographic, behavioral, and clinical covariates. Restricted cubic spline (RCS) models (knots at 10th, 50th, 90th percentiles) evaluated potential nonlinearity. Subgroup analyses assessed interactions stratified by demographic, behavioral and clinical factors. Mediation analyses quantified the indirect effect of phenotypic age using quasi-Bayesian Monte Carlo simulations (1,000 iterations)[33]. Sensitivity analyses included: (1) excluding deaths within 2 years of follow-up, (2) excluding participants with baseline cancer, and (3) applying multiple imputation (5 datasets) for missing covariates using chained equations. Analyses were performed using R (v4.2.3; packages: “survey,” “mediation,” “mice”) and Free Statistics software (v1.9.2). Two-sided P < 0.05 indicated statistical significance.
2.7. Ethics Approval
NHANES protocols were approved by the NCHS Research Ethics Review Board. Written informed consent was obtained from all participants. This analysis used publicly available, anonymized data, exempting it from additional ethical review.
3. Results
3.1. Participant Characteristics
Baseline characteristics of the final analytic sample (n = 40,314) are summarized by DI-GM categories in Table 1. Participants with higher DI-GM scores were generally older, female, non-Hispanic White, married or cohabiting, better educated, and had higher income levels. They also exhibited lower BMI, greater physical activity, a higher likelihood of current alcohol use and being never smokers, and a lower prevalence of metabolic syndrome.
3.2. DI-GM and Risk of Mortality
Over a median follow-up of 9.58 years, there were 6,156 all-cause deaths and 1,933 deaths attributed to CVD. When DI-GM was modeled as a continuous variable, each 1-score increase in DI-GM was associated with a 3% reduction in all-cause mortality risk (HR: 0.97; 95% CI: 0.94–0.99; p = 0.01) and a 6% reduction in CVD mortality risk (HR: 0.94; 95% CI: 0.90–0.99; p = 0.014) after full adjustment. In categorical analyses, participants in the highest quartile of DI-GM (Q4) experienced a 16% lower risk of all-cause mortality compared to those in the lowest quartile (Q1) (HR: 0.84; 95% CI: 0.73–0.97; p-trend = 0.024). The highest quartile (Q4) also showed a lower risk of CVD mortality compared to the lowest quartile (Q1), although the confidence interval included unity (HR: 0.76; 95% CI: 0.57–1.02; p-trend = 0.060) (Table 2).
RCS analyses indicated linear inverse dose–response relationships between DI-GM and both outcomes (p for non-linearity = 0.739 for all-cause mortality; p = 0.893 for CVD mortality), supporting the robustness of these associations across the full range of DI-GM scores (Figure S3).
3.3. Effect Modification and Subgroup Analyses
Age significantly modified associations with all-cause mortality (interaction P = 0.021) and CVD mortality (interaction P = 0.007). Specifically, inverse associations per 1-score increase in DI-GM were observed for all-cause mortality among younger (20–39 years; HR: 0.86; 95% CI: 0.77–0.97) and older adults (≥65 years; HR: 0.96; 95% CI: 0.93–0.99), but not among middle-aged participants (40–64 years; HR: 0.98; 95% CI: 0.93–1.02). For CVD mortality, an inverse association was significant only among participants aged 40–64 years (HR: 0.90; 95% CI: 0.82–0.97).
Sex interaction was significant for all-cause mortality ( Pinteraction = 0.046), with associations stronger in males (HR: 0.95; 95% CI: 0.91–0.98) compared to females (HR: 0.98; 95% CI: 0.95–1.01).
BMI interaction was observed for CVD mortality (Pinteraction = 0.042), with inverse associations among normal-weight (BMI <25 kg/m²; HR: 0.90; 95% CI: 0.83–0.97) and overweight individuals (BMI 25–29.9 kg/m²; HR: 0.89; 95% CI: 0.83–0.97), but not among those with obesity (BMI ≥30 kg/m²; HR: 1.01; 95% CI: 0.95–1.08).
Smoking status interaction was significant for CVD mortality (Pinteraction = 0.044), with a significant inverse association observed only in never smokers (HR: 0.92; 95% CI: 0.87–0.98). The associations in former (HR: 0.98; 95% CI: 0.92–1.04) and current smokers (HR: 0.89; 95% CI: 0.79–1.00) were not statistically significant.
No significant interactions were found for race/ethnicity, alcohol consumption, CVD history, or metabolic syndrome with either mortality outcome.
3.4. Phenotypic Age as a Mediating Pathway
Phenotypic age partially mediated the associations between DI-GM and both all-cause and CVD mortality. Specifically, phenotypic age mediated approximately 32% (95% CI: 21–61%; P < 0.001) of the association between DI-GM and all-cause mortality, and about 13% (95% CI: 7–44%; P = 0.006) of the association with CVD mortality (Figure 3).
Descriptive characteristics of the mediation analysis subsample (n = 29,581) are presented in Table S3, with baseline patterns broadly consistent with the main analytic sample.
4. Discussion
In this nationally representative cohort of U.S. adults, we found that greater adherence to DI-GM was significantly associated with reduced risks of both all-cause and CVD mortality. This inverse association persisted across multiple analytic approaches, including subgroup and sensitivity analyses, and was further supported by mediation analyses highlighting phenotypic age as a potential biological pathway linking DI-GM to mortality outcomes. Our findings suggest a gut microbiota–supportive dietary pattern could be important for promoting longevity and cardiovascular health.
4.1. DI-GM and Risk of Mortality
To our knowledge, this is the first study investigating the association between DI-GM adherence and long-term mortality in a nationally representative U.S. population. Consistent with previous research linking gut microbiota diversity and composition to chronic disease outcomes and longevity[14,49], our study demonstrated that higher DI-GM scores were independently associated with lower risks of mortality. These results extend earlier evidence, such as associations reported for specific gut microbial taxa and fermented dairy intake with cardiovascular health outcomes[50], by emphasizing the holistic dietary approach targeting gut microbiota health.
Our age-stratified analysis revealed nuanced associations by age group. Specifically, DI-GM showed significant inverse associations with all-cause mortality in both younger (20–39 years) and older adults (≥65 years), but a less pronounced relationship in middle-aged adults (40–64 years). Conversely, the protective association for CVD mortality was most evident among middle-aged individuals. These differential patterns might reflect varying sensitivity to dietary influences on aging-related processes at distinct life stages: dietary patterns may shape early-life trajectories in young adults and modulate cumulative aging-related risk among older adults. The notable association with CVD mortality observed in middle-aged individuals might represent a critical intervention window for cardiovascular prevention.
4.2. Biological Aging as a Potential Mechanism
Our mediation analyses suggest that phenotypic age, a validated biomarker of biological aging, partially mediates the association between DI-GM and mortality outcomes. Specifically, phenotypic age explained approximately 32% and 13% of the associations with all-cause and CVD mortality, respectively. These findings indicate that dietary influences on biological aging pathways may be a critical mechanism underlying the observed health benefits of gut microbiota–supportive diets.
The stronger mediating role observed for all-cause mortality underscores that biological aging may impact multiple health domains beyond cardiovascular pathways. This aligns with previous findings showing gut microbiota composition changes with age and metabolic health, influencing aging-related processes such as systemic inflammation and immune function[22,25,51,52]. Given the established predictive ability of phenotypic age for adverse health outcomes independently of chronological age[21,53], our results provide further evidence supporting the hypothesis that diet and gut microbiota interactions significantly affect aging trajectories.
4.3. Strengths and Limitations
Key strengths of our study include a nationally representative sample of U.S. adults with extended follow-up, allowing broad generalizability of our findings. The robust analytical framework we employed, including sensitivity tests, subgroup analyses, and mediation analyses, further enhances the reliability and interpretability of our results. Additionally, our investigation into phenotypic age provides valuable insights into potential biological pathways linking diet to health outcomes, enriching current nutritional epidemiology literature.
Nevertheless, certain limitations exist. First, due to the observational nature of the study, we cannot establish causality. Second, dietary intake was assessed via a single 24-hour recall, possibly not fully capturing participants’ habitual dietary patterns. Finally, although we adjusted extensively for multiple confounders, residual confounding remains possible. Future longitudinal studies with repeated dietary assessments and microbiome analyses are warranted to confirm and expand upon our findings.
4.4. Public Health Implications and Future Research
Our findings have important implications for dietary recommendations and public health strategies aimed at reducing mortality risk and promoting longevity. Encouraging dietary patterns that emphasize intake of fiber-rich foods (e.g., broccoli, chickpeas), fermented dairy, nuts, and reduced intake of processed meats and refined grains may represent practical strategies for chronic disease prevention and longevity through gut microbiota modulation.
Future research should validate these observational findings in different demographic and clinical populations, preferably through prospective cohort studies with repeated dietary assessments to better capture habitual dietary patterns. Further investigation using longitudinal gut microbiome assessments and mechanistic studies could elucidate specific microbial pathways linking diet to aging and mortality. Randomized controlled trials investigating interventions designed to modulate the gut microbiome and biological aging could provide causal evidence and practical dietary guidance. Additionally, refining the DI-GM and examining individual dietary components may enhance its application in precision nutrition and targeted dietary interventions.
5. Conclusions
In this nationally representative cohort of U.S. adults, greater adherence to DI-GM was associated with significantly reduced risks of all-cause and cardiovascular mortality. Phenotypic age partially mediated these relationships, indicating biological aging as a potential underlying mechanism. These findings highlight the importance of dietary modulation of gut microbiota for promoting longevity and cardiovascular health. Future intervention trials and mechanistic studies are warranted to establish causality and optimize dietary strategies for healthy aging.
Supplementary Materials
The following supporting information can be downloaded at the website of this paper posted on Preprints.org. Figure S1: Participant flowchart for the main analytic sample; Figure S2: Participant flowchart for mediation analysis subsample; Figure S3: Dose–response association between DI-GM and mortality; Table S1: Sensitivity analyses between DI-GM and all-cause mortality; Table S2: Sensitivity analyses between DI-GM and CVD mortality; Table S3: Baseline characteristics of participants by DI-GM score categories for mediation analysis subsample.
Author Contributions
Conceptualization, L.-Y.Z. and Y.-M.C.; methodology, Z.-Y.L.; validation, M.W.; formal analysis, L.-Y.Z. and Y.-M.C.; investigation, Y.-Q.X.; resources, Y.-X.Y.; data curation, J.-Q.L.; writing—original draft preparation, L.-Y.Z.; writing—review and editing, Y.-M.C.; visualization, S.-Y.H.; supervision, H.-L.Z. All authors have read and agreed to the published version of the manuscript.
Funding
This research received no external funding.
Institutional Review Board Statement
The study was conducted in accordance with the Declaration of Helsinki, and approved by the Institutional Review Board of the National Centre for Health Statistics.
Informed Consent Statement
Informed consent was obtained from all subjects before enrollment.
Data Availability Statement
All NHANES data for this study are publicly available and can be accessed here: https://wwwn.cdc.gov/nchs/nhanes.
Acknowledgments
The authors sincerely thank all participants and staff of the NHANES for their valuable contributions. The authors also extend their gratitude to Dr. Jie Liu for his generous technical support.
Conflicts of Interest
The authors declare no conflicts of interest.
Abbreviations
The following abbreviations are used in this manuscript:
BMI: body mass index; CI: confidence interval; CRP: C-reactive protein; CVD: cardiovascular disease; DI-GM: dietary Index for gut microbiota; HR: hazard ratio; NCHS: National Center for Health Statistics; NHANES: National Health and Nutrition Examination Survey; PIR: poverty-income ratio; RCS: restricted cubic spline; SE: standard error
References
- Vollset, S.E.; Ababneh, H.S.; Abate, Y.H.; Abbafati, C.; Abbasgholizadeh, R.; Abbasian, M.; Abbastabar, H.; Abd Al Magied, A.H.A.; Abd ElHafeez, S.; Abdelkader, A.; et al. Burden of disease scenarios for 204 countries and territories, 2022–2050: A forecasting analysis for the global burden of disease study 2021. The Lancet 2024, 403, 2204–2256. [Google Scholar] [CrossRef] [PubMed]
- Afshin, A.; Sur, P.J.; Fay, K.A.; Cornaby, L.; Ferrara, G.; Salama, J.S.; Mullany, E.C.; Abate, K.H.; Abbafati, C.; Abebe, Z.; et al. Health effects of dietary risks in 195 countries, 1990–2017: a systematic analysis for the Global Burden of Disease Study 2017. The Lancet 2019, 393, 1958–1972. [Google Scholar] [CrossRef] [PubMed]
- Le Goff, D.; Aerts, N.; Odorico, M.; Guillou-Landreat, M.; Perraud, G.; Bastiaens, H.; Musinguzi, G.; Le Reste, J.-Y.; Barais, M. Practical dietary interventions to prevent cardiovascular disease suitable for implementation in primary care: An ADAPTE-guided systematic review of international clinical guidelines. International Journal of Behavioral Nutrition and Physical Activity 2023, 20, 93. [Google Scholar] [CrossRef]
- Rothschild, D.; Weissbrod, O.; Barkan, E.; Kurilshikov, A.; Korem, T.; Zeevi, D.; Costea, P.I.; Godneva, A.; Kalka, I.N.; Bar, N.; et al. Environment dominates over host genetics in shaping human gut microbiota. Nature 2018, 555, 210–215. [Google Scholar] [CrossRef]
- Wastyk, H.C.; Fragiadakis, G.K.; Perelman, D.; Dahan, D.; Merrill, B.D.; Yu, F.B.; Topf, M.; Gonzalez, C.G.; Treuren, W.V.; Han, S.; et al. Gut-microbiota-targeted diets modulate human immune status. Cell 2021. [Google Scholar] [CrossRef]
- Valdes, A.M.; Walter, J.; Segal, E.; Spector, T.D. Role of the gut microbiota in nutrition and health. Bmj-british Medical Journal. [CrossRef]
- Ross, F.C.; Patangia, D.; Grimaud, G.; Lavelle, A.; Dempsey, E.M.; Ross, R.P.; Stanton, C. The interplay between diet and the gut microbiome: Implications for health and disease. Nat. Rev. Microbiol. 2024, 22, 671–686. [Google Scholar] [CrossRef] [PubMed]
- At, V.; Sj, M.; Jm, W.; Mt, J.; Wk, M.; Jj, K.; L, J.; Mg, B.; Sp, S.; Ml, C.; et al. The gut microbiota regulates white adipose tissue inflammation and obesity via a family of microRNAs. PubMed 2019. [Google Scholar]
- Farini, A.; Tripodi, L.; Villa, C.; Strati, F.; Facoetti, A.; Baselli, G.; Troisi, J.; Landolfi, A.; Lonati, C.; Molinaro, D.; et al. Microbiota dysbiosis influences immune system and muscle pathophysiology of dystrophin-deficient mice. EMBO Molecular Medicine 2023, 15, e16244. [Google Scholar] [CrossRef]
- Xu, K.; Gao, X.; Xia, G.; Chen, M.; Zeng, N.; Wang, S.; You, C.; Tian, X.; Di, H.; Tang, W.; et al. Rapid gut dysbiosis induced by stroke exacerbates brain infarction in turn. Gut, 2020. [Google Scholar] [CrossRef]
- Shi, B.; Li,Haoyu; and He, X. Advancing lifelong precision medicine for cardiovascular diseases through gut microbiota modulation. Gut Microbes 2024, 16, 2323237. [Google Scholar] [CrossRef]
- Fan, Y.; Pedersen, O. Gut microbiota in human metabolic health and disease. Nature Reviews Microbiology 2021, 19, 55–71. [Google Scholar] [CrossRef]
- C, C.; J, L.; Y, X.; X, L.; R, J.; J, H.; B, M.; Tr, S.; A, A.; K, Y. Gut microbiota regulate alzheimer’s disease pathologies and cognitive disorders via PUFA-associated neuroinflammation. PubMed.
- Salosensaari, A.; Laitinen, V.; Havulinna, A.S.; Meric, G.; Cheng, S.; Perola, M.; Valsta, L.; Alfthan, G.; Inouye, M.; Watrous, J.D.; et al. Taxonomic signatures of cause-specific mortality risk in human gut microbiome. Nat. Commun. 2021, 12, 2671. [Google Scholar] [CrossRef] [PubMed]
- Kase, B.E.; Liese, A.D.; Zhang, J.; Murphy, E.A.; Zhao, L.; Steck, S.E. The development and evaluation of a literature-based dietary index for gut microbiota. Nutrients 2024, 16, 1045. [Google Scholar] [CrossRef]
- Wu, Z.; Gong, C.; Wang, B. The relationship between dietary index for gut microbiota and diabetes. Sci. Rep. 2025, 15, 6234. [Google Scholar] [CrossRef] [PubMed]
- Zhang, X.; Yang, Q.; Huang, J.; Lin, H.; Luo, N.; Tang, H. Association of the newly proposed dietary index for gut microbiota and depression: The mediation effect of phenotypic age and body mass index. Eur Arch Psychiatry Clin Neurosci 2024. [Google Scholar] [CrossRef]
- Liu, J.; Huang, S. Dietary index for gut microbiota is associated with stroke among US adults. Food Funct. 2025, 16, 1458–1468. [Google Scholar] [CrossRef]
- Waziry, R. Cross-tissue comparison of aging biology measures as novel biomarkers for healthy aging. Innov. Aging 2023, 7, 449–450. [Google Scholar] [CrossRef]
- Waziry, R.; Gu, Y.; Boehme, A.K.; Williams, O.A. Measures of aging biology in saliva and blood as novel biomarkers for stroke and heart disease in older adults. Neurology 2023, 101, e2355–e2363. [Google Scholar] [CrossRef]
- Liu, Z.; Kuo, P.-L.; Horvath, S.; Crimmins, E.; Ferrucci, L.; Levine, M. A new aging measure captures morbidity and mortality risk across diverse subpopulations from NHANES IV: A cohort study. PLoS Med. 2018, 15, e1002718. [Google Scholar] [CrossRef]
- Xiao, Y.; Feng, Y.; Zhao, J.; Chen, W.; Lu, W. Achieving healthy aging through gut microbiota-directed dietary intervention: Focusing on microbial biomarkers and host mechanisms. J. Adv. Res. 2025, 68, 179–200. [Google Scholar] [CrossRef]
- Chen, Y.; Zheng, X.; Wang, Y.; Liu, C.; Shi, J.; Liu, T.; Lin, S.; Xie, H.; Zhang, H.; Liu, X.; et al. Association between dietary quality and accelerated aging: A cross-sectional study of two cohorts. Food Funct 2024, 15, 7837–7848. [Google Scholar] [CrossRef]
- Zhang, R.; Wu, M.; Zhang, W.; Liu, X.; Pu, J.; Wei, T.; Zhu, Z.; Tang, Z.; Wei, N.; Liu, B.; et al. Association between life’s essential 8 and biological ageing among US adults. J Transl Med 2023, 21, 622. [Google Scholar] [CrossRef]
- Ling, Z.; Liu,Xia; Cheng,Yiwen; Yan,Xiumei; and Wu, S. Gut microbiota and aging. Critical Reviews in Food Science and Nutrition 2022, 62, 3509–3534. [Google Scholar] [CrossRef] [PubMed]
- Zipf, G.; Chiappa, M.; Porter, K.S.; Ostchega, Y.; Lewis, B.G.; Dostal, J. National health and nutrition examination survey: Plan and operations, 1999-2010. Vital Health Stat., 1 Programs Collect. Proced.
- Groenke, B.R.; Daline, I.H.; Nixdorf, D.R. SUNCT/SUNA: Case series presenting in an orofacial pain clinic. Cephalalgia: Int. J. Headache 2021, 41, 665–676. [Google Scholar] [CrossRef] [PubMed]
- E, von E.; Dg, A.; M, E.; Sj, P.; Pc, G.; Jp, V. The strengthening the reporting of observational studies in epidemiology (STROBE) statement: Guidelines for reporting observational studies. PubMed.
- Bao, W.; Liu, B.; Rong, S.; Dai, S.Y.; Trasande, L.; Lehmler, H.-J. Association between bisphenol a exposure and risk of all-cause and cause-specific mortality in US adults. JAMA Netw Open 2020, 3, e2011620. [Google Scholar] [CrossRef]
- Liu, H.; Zhang, S.; Gong, Z.; Zhao, W.; Lin, X.; Liu, Y.; Wang, S.; Yu, S.; Dong, Z. Association between migraine and cardiovascular disease mortality: A prospective population-based cohort study. Headache: J. Head Face Pain 2023, 63, 1109–1118. [Google Scholar] [CrossRef] [PubMed]
- Gao, Y.; Wang, Y.; Zhang, D.; Wu, T.; Li, Q. The Relationship Between Dietary Inflammatory Index and All-Cause, Cardiovascular Disease-Related, and Cancer-Related Mortality. J Multidiscip Healthc 2023, 16, 2543–2556. [Google Scholar] [CrossRef]
- Levine, M.E.; Lu, A.T.; Quach, A.; Chen, B.H.; Assimes, T.L.; Bandinelli, S.; Hou, L.; Baccarelli, A.A.; Stewart, J.D.; Li, Y.; et al. An epigenetic biomarker of aging for lifespan and healthspan. Aging (Milano) 2018, 10, 573–591. [Google Scholar] [CrossRef]
- L, C.; Y, Z.; F, L.; H, C.; T, T.; P, Y.; Y, T. Biological aging mediates the associations between urinary metals and osteoarthritis among U.S. adults. BMC medicine 2022, 20. [Google Scholar] [CrossRef]
- Klemera, P.; Doubal, S. A new approach to the concept and computation of biological age. Mech. Ageing Dev. 2006, 127, 240–248. [Google Scholar] [CrossRef]
- You, Y.; Chen, Y.; Wang, X.; Wei, M.; Zhang, Q.; Cao, Q. Accelerometer-measured physical activity patterns are associated with phenotypic age: Isotemporal substitution effects. Heliyon 2023, 9, e19158. [Google Scholar] [CrossRef]
- Alberti, K.G.M.M.; Eckel, R.H.; Grundy, S.M.; Zimmet, P.Z.; Cleeman, J.I.; Donato, K.A.; Fruchart, J.-C.; James, W.P.T.; Loria, C.M.; Smith, S.C.; et al. Harmonizing the metabolic syndrome: A joint interim statement of the international diabetes federation task force on epidemiology and prevention; national heart, lung, and blood institute; American heart association; world heart federation; international atherosclerosis society; and international association for the study of obesity. Circulation 2009, 120, 1640–1645. [Google Scholar] [CrossRef] [PubMed]
- Gibson, T.M.; Ehrhardt, M.J.; Ness, K.K. Obesity and metabolic syndrome among adult survivors of childhood leukemia. Curr Treat Options Oncol 2016, 17, 17. [Google Scholar] [CrossRef]
- Kwok, C.S.; Gulati, M.; Michos, E.D.; Potts, J.; Wu, P.; Watson, L.; Loke, Y.K.; Mallen, C.; Mamas, M.A. Dietary components and risk of cardiovascular disease and all-cause mortality: A review of evidence from meta-analyses. Eur. J. Prev. Cardiol. 2019, 26, 1415–1429. [Google Scholar] [CrossRef]
- Zheng, Y.; Li, Y.; Satija, A.; Pan, A.; Sotos-Prieto, M.; Rimm, E.; Willett, W.C.; Hu, F.B. Association of changes in red meat consumption with total and cause specific mortality among US women and men: Two prospective cohort studies. BMJ 2019, 365, l2110. [Google Scholar] [CrossRef]
- Dehghan, M.; Mente, A.; Zhang, X.; Swaminathan, S.; Li, W.; Mohan, V.; Iqbal, R.; Kumar, R.; Wentzel-Viljoen, E.; Rosengren, A.; et al. Associations of fats and carbohydrate intake with cardiovascular disease and mortality in 18 countries from five continents (PURE): A prospective cohort study. Lancet 2017, 390, 2050–2062. [Google Scholar] [CrossRef]
- Shan, Z.; Wang, F.; Li, Y.; Baden, M.Y.; Bhupathiraju, S.N.; Wang, D.D.; Sun, Q.; Rexrode, K.M.; Rimm, E.B.; Qi, L.; et al. Healthy eating patterns and risk of total and cause-specific mortality. JAMA Intern. Med. 2023, 183, 142. [Google Scholar] [CrossRef]
- Yu, J.; Chen, Y.; Li, D.; Zhang, L.; Zhang, Y.; Zhang, J.; Zhu, J.; Li, Z.; Fu, H.; Guan, D.; et al. Specific macronutrient clusters associated with lower mortality risk: Evidence from NHANES 1999–2018. J. Adv. Res. 2025, S2090123225001171. [Google Scholar] [CrossRef] [PubMed]
- Chen, Y.; Gao, Y.; Chen, Y.; Wang, Z.; Xu, H.; Hu, F.; Cai, Y. Association between dietary patterns and all-cause mortality in the Chinese old: Analysis of the chinese longitudinal healthy longevity survey cohort. Nutrients 2024, 16, 1605. [Google Scholar] [CrossRef] [PubMed]
- Liu, H.; Wang, L.; Chen, C.; Dong, Z.; Yu, S. Association between dietary niacin intake and migraine among american adults: national health and nutrition examination survey. Nutrients 2022, 14, 3052. [Google Scholar] [CrossRef]
- Rattan, P.; Penrice, D.D.; Ahn, J.C.; Ferrer, A.; Patnaik, M.; Shah, V.H.; Kamath, P.S.; Mangaonkar, A.A.; Simonetto, D.A. Inverse Association of Telomere Length With Liver Disease and Mortality in the US Population. Hepatol. Commun. 2022, 6, 399–410. [Google Scholar] [CrossRef]
- Yun, L.; Vanderloo, L.M.; Berry, T.R.; Latimer-Cheung, A.E.; O’Reilly, N.; Rhodes, R.E.; Spence, J.C.; Tremblay, M.S.; Faulkner, G. Political Orientation and Public Attributions for the Causes and Solutions of Physical Inactivity in Canada: Implications for Policy Support. Front. Public Health 2019, 7, 153. [Google Scholar] [CrossRef]
- Tang, H.; Zhang, X.; Luo, N.; Huang, J.; Zhu, Y. Association of Dietary Live Microbes and Nondietary Prebiotic/Probiotic Intake With Cognitive Function in Older Adults: Evidence From NHANES. J. Gerontol. A. Biol. Sci. Med. Sci. 2024, 79, glad175. [Google Scholar] [CrossRef]
- Johnson, C.L.; Paulose-Ram, R.; Ogden, C.L.; Carroll, M.D.; Kruszon-Moran, D.; Dohrmann, S.M.; Curtin, L.R. National health and nutrition examination survey: Analytic guidelines, 1999-2010. Vital Health Stat. 2. 2013, 1–24. [Google Scholar]
- Pu, Y.; Sun, Z.; Zhang, H.; Huang, Q.; Wang, Z.; Mei, Z.; Wang, P.; Kong, M.; Yang, W.; Lin, C.; et al. Gut microbial features and circulating metabolomic signatures of frailty in older adults. Nat. Aging 2024, 4, 1249–1262. [Google Scholar] [CrossRef] [PubMed]
- Zhang, K.; Chen, X.; Zhang, L.; Deng, Z. Fermented dairy foods intake and risk of cardiovascular diseases: A meta-analysis of cohort studies. Crit Rev Food Sci Nutr 2020, 60, 1189–1194. [Google Scholar] [CrossRef]
- Hou, K.; Wu, Z.-X.; Chen, X.-Y.; Wang, J.-Q.; Zhang, D.; Xiao, C.; Zhu, D.; Koya, J.B.; Wei, L.; Li, J.; et al. Microbiota in health and diseases. Signal Transduct Target Ther 2022, 7, 135. [Google Scholar] [CrossRef] [PubMed]
- Wang, J.; Qie, J.; Zhu, D.; Zhang, X.; Zhang, Q.; Xu, Y.; Wang, Y.; Mi, K.; Pei, Y.; Liu, Y.; et al. The landscape in the gut microbiome of long-lived families reveals new insights on longevity and aging - relevant neural and immune function. Gut Microbes 2022, 14, 2107288. [Google Scholar] [CrossRef]
- Li, X.; Cao, X.; Zhang, J.; Fu, J.; Mohedaner, M.; Danzengzhuoga, N.; Sun, X.; Yang, G.; Yang, Z.; Kuo, C.-L.; et al. Accelerated aging mediates the associations of unhealthy lifestyles with cardiovascular disease, cancer, and mortality. J Am Geriatr Soc 2024, 72, 181–193. [Google Scholar] [CrossRef]
Figure 1.
Stratified associations between DI-GM and all-cause mortality. Stratified Cox models were adjusted for all covariates (age, sex, race/ethnicity, marital status, education, income, survey cycle, smoking, alcohol use, physical activity, BMI, CVD history, and metabolic syndrome), except for the stratification variable. Squares represent HRs; horizontal lines, 95% CIs; diamonds, overall estimates. Abbreviations: BMI, body mass index; CI, confidence interval; CVD, cardiovascular disease; DI-GM, dietary index for gut microbiota; HR, hazard ratio.
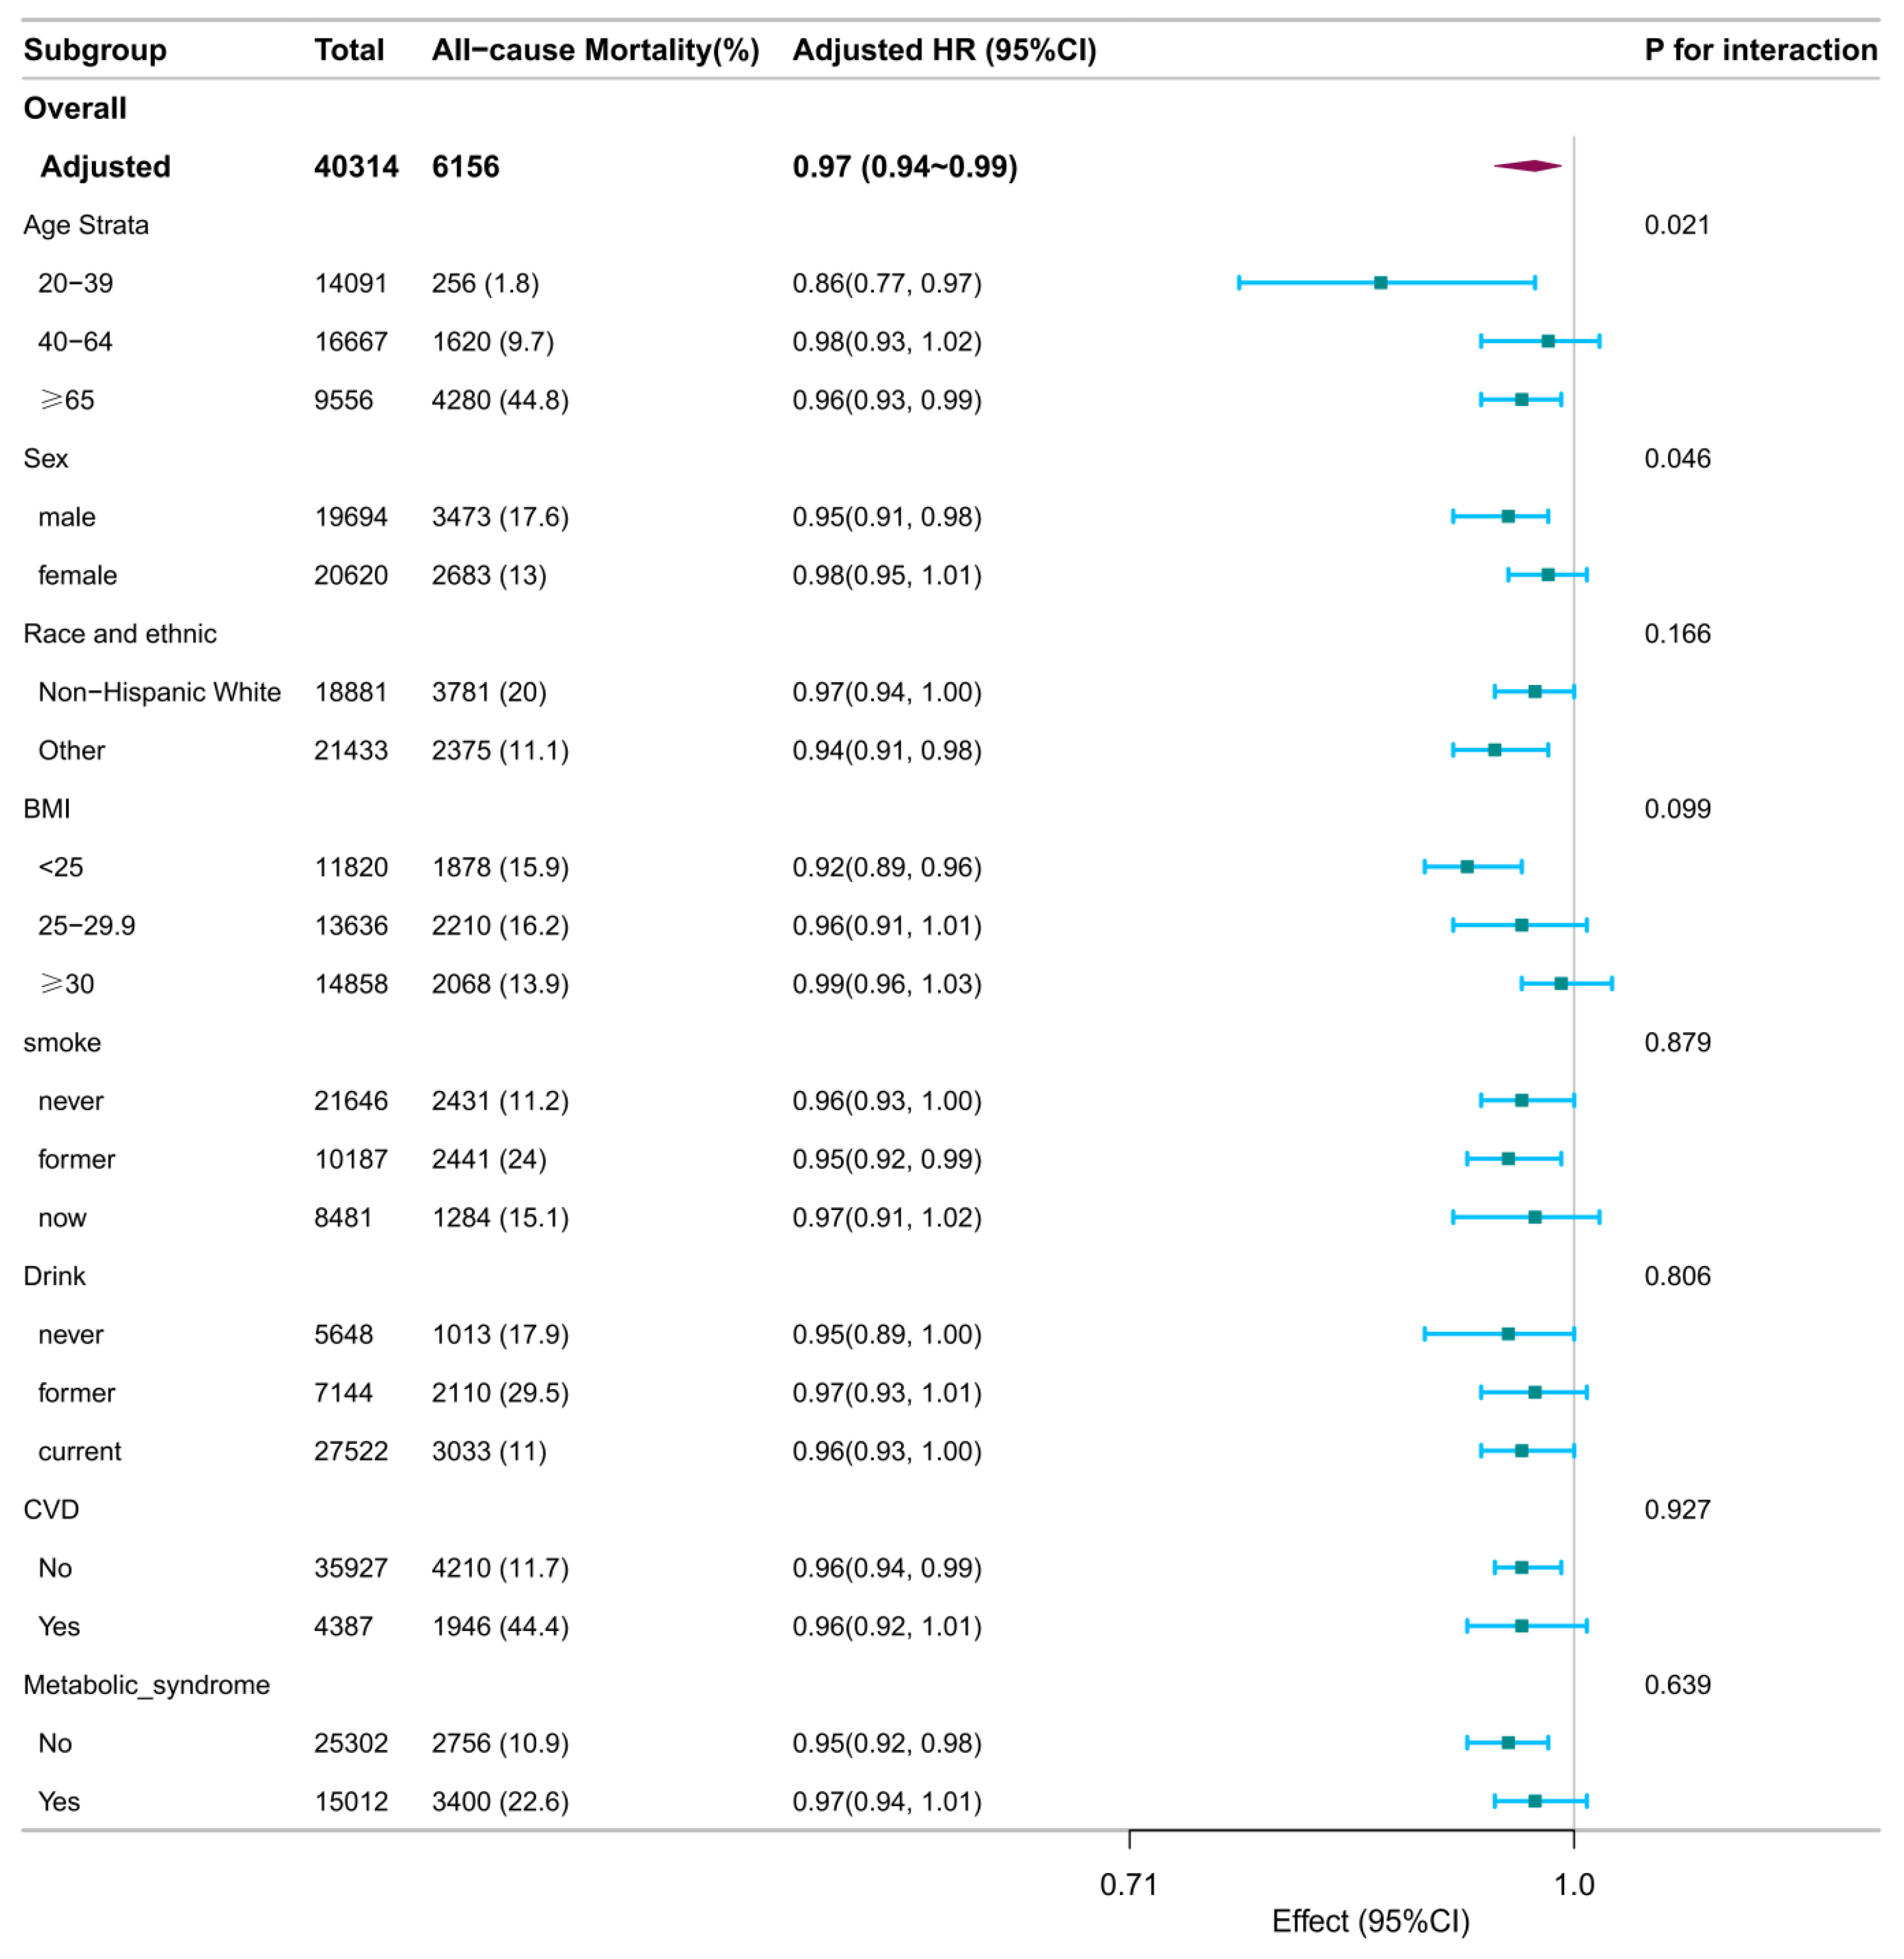
Figure 2.
Stratified associations between DI-GM and CVD mortality. Stratified Cox models were adjusted for all covariates (age, sex, race/ethnicity, marital status, education, income, survey cycle, smoking, alcohol use, physical activity, BMI, CVD history, and metabolic syndrome), except for the stratification variable. Squares represent HRs; horizontal lines, 95% CIs; diamonds, overall estimates. Abbreviations: BMI, body mass index; CI, confidence interval; CVD, cardiovascular disease; DI-GM, dietary index for gut microbiota; HR, hazard ratio.
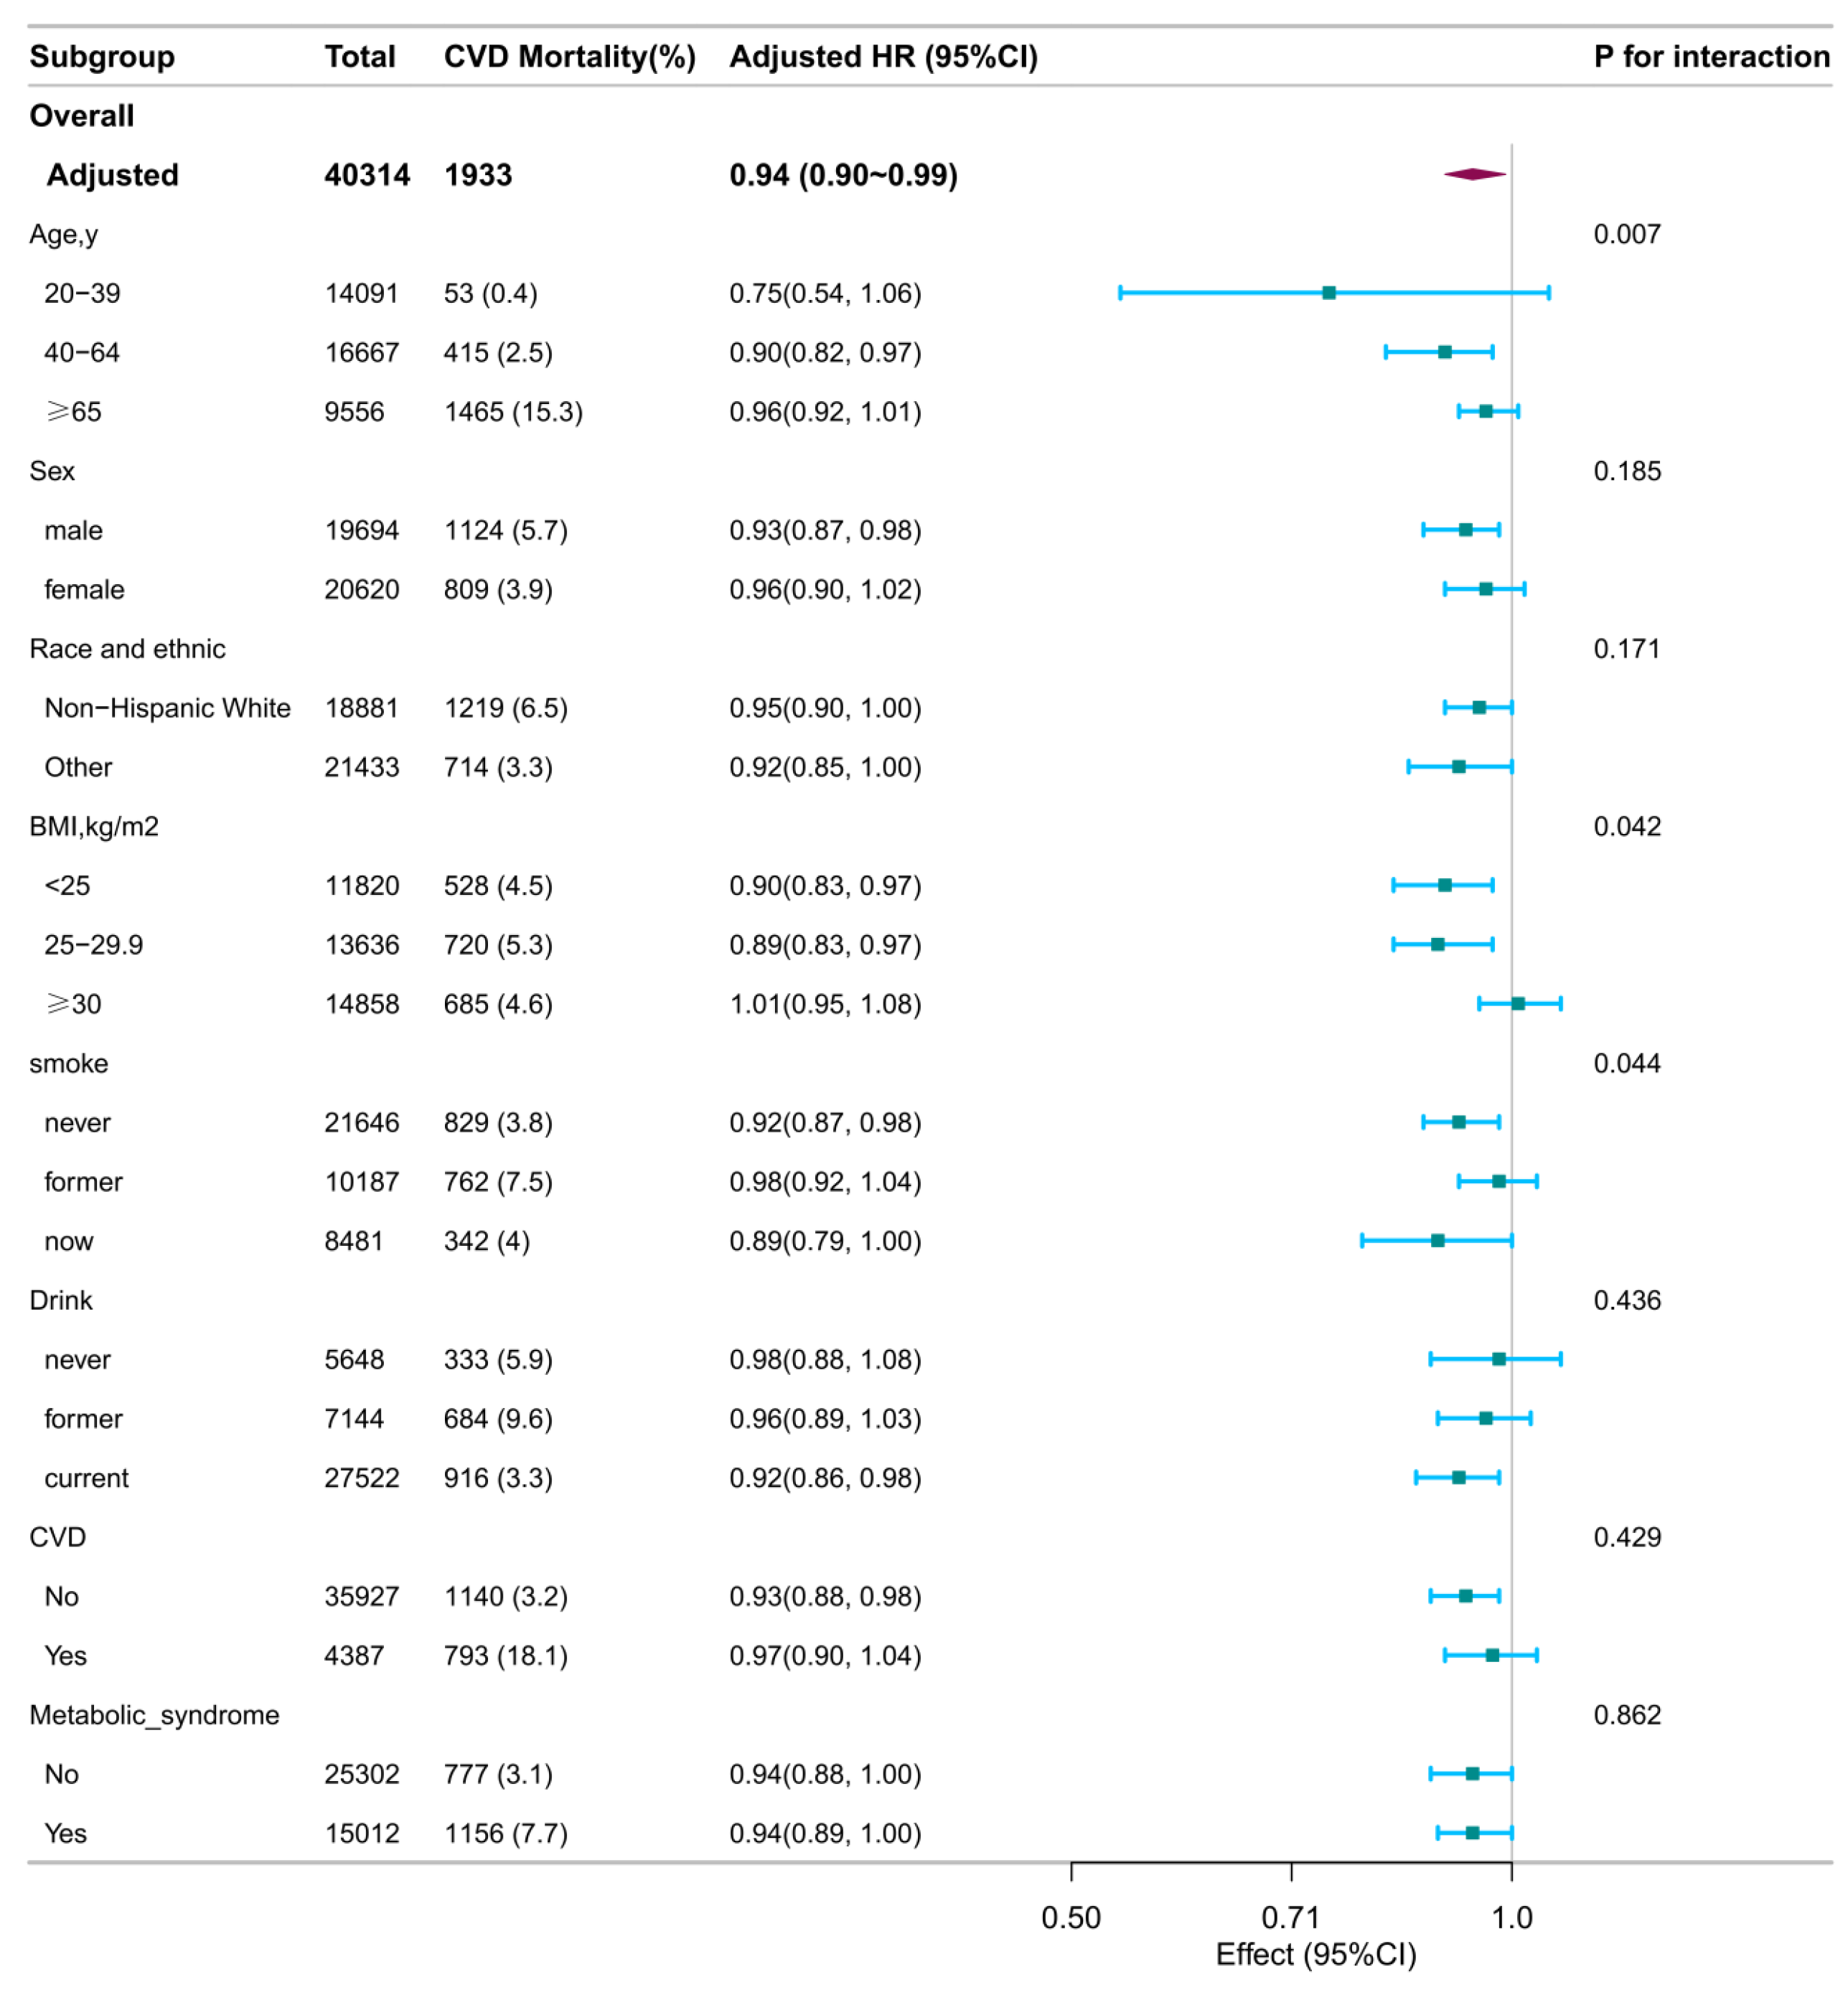
Figure 3.
Figure 3. Mediation effect of phenotypic age on the association between DI-GM and mortality outcomes. Adjusted for all covariates (age, sex, race/ethnicity, marital status, education, income, survey cycle, smoking, alcohol use, physical activity, BMI, CVD history, and metabolic syndrome). Arrows represent direct and indirect paths in the mediation framework. Abbreviations: CI, confidence interval; DI-GM, dietary index for gut microbiota; HR, hazard ratio.
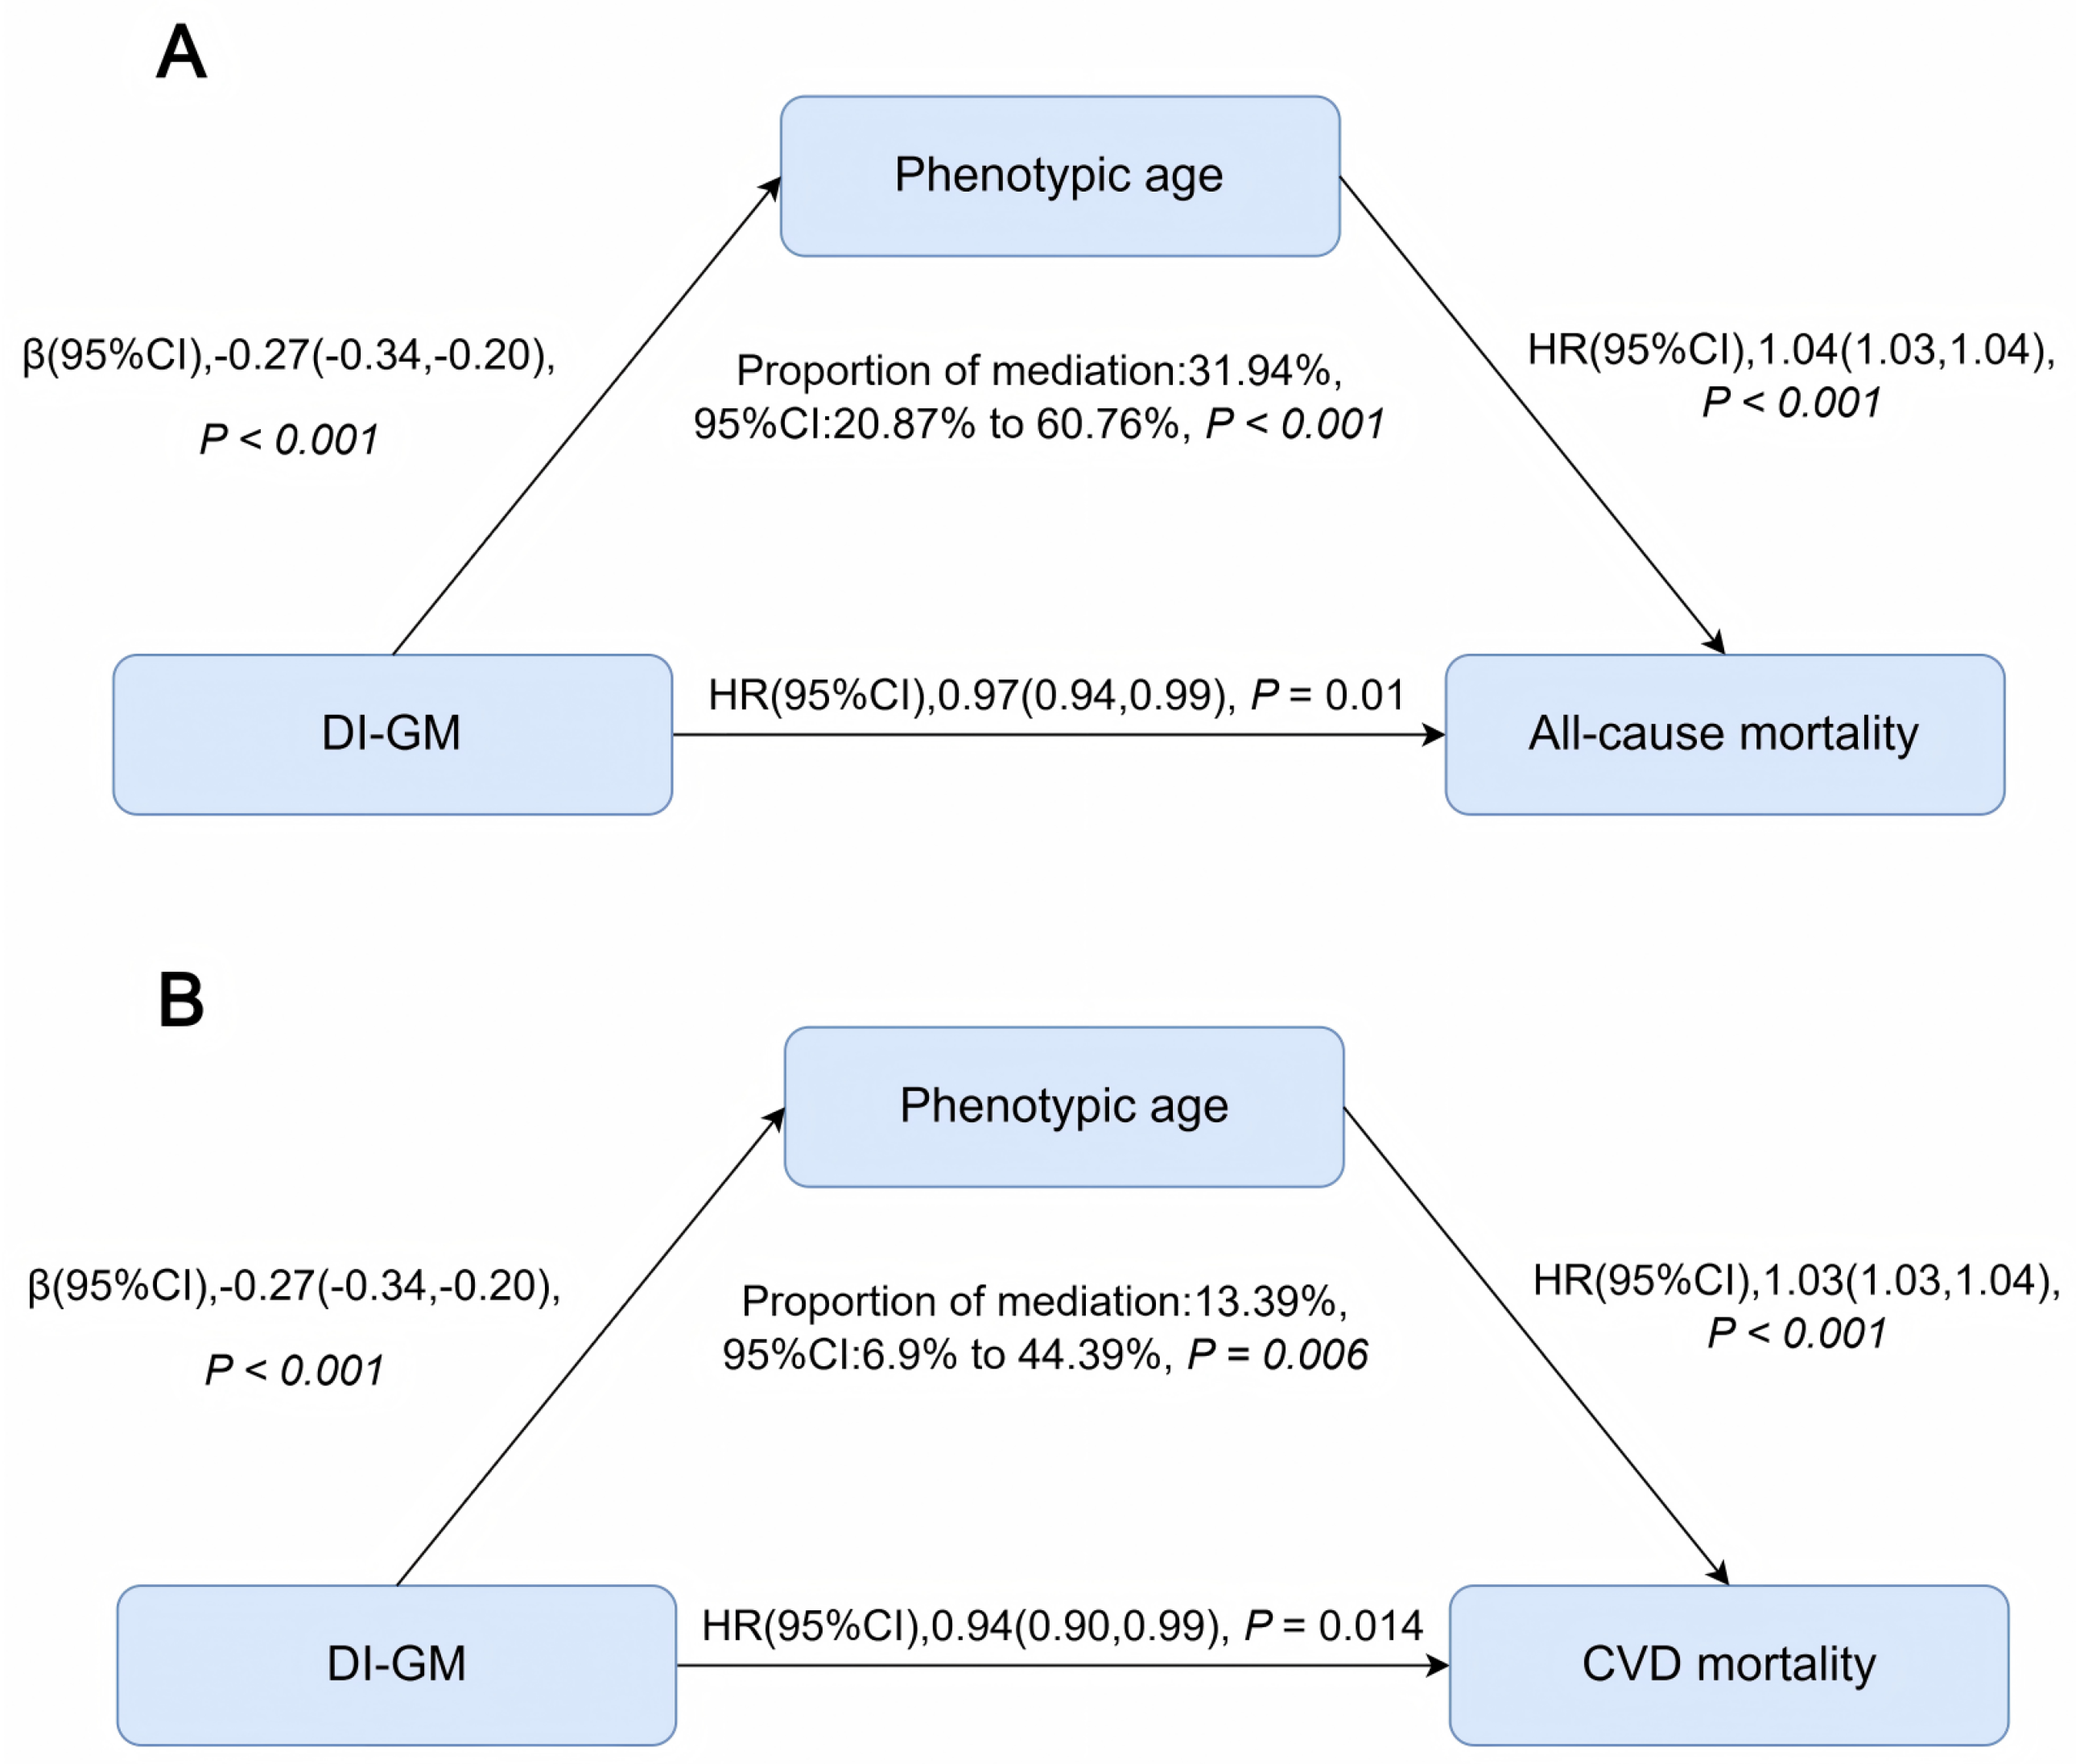

Table 1.
Baseline characteristics of participants by DI-GM score categories in NHANES 1999–20181.
| Characteristics | Total | DI-GM2 | P value | |||
|---|---|---|---|---|---|---|
| Q1 | Q2 | Q3 | Q4 | |||
| N | 184,946,720 | 14,969,328 | 30,112,913 | 46,481,402 | 93,383,078 | |
| Mean (SE) | 4.57 (0.02) | 1.81 (0.01) | 3.00 (0.00) | 4.00 (0.00) | 5.81 (0.01) | <0.001 |
| Age (year) | 46.90 (0.21) | 42.46 (0.48) | 43.26 (0.30) | 45.47 (0.25) | 49.49 (0.26) | <0.001 |
| Sex, n (%) | <0.001 | |||||
| male | 19,694 (48.49%) | 1,718 (50.04%) | 3,560 (51.61%) | 5,287 (50.61%) | 9,129 (46.18%) | |
| female | 20,620 (51.51%) | 1,771 (49.96%) | 3,440 (48.39%) | 5,149 (49.39%) | 10,260 (53.82%) | |
| Race, n (%) | <0.001 | |||||
| Non-Hispanic White | 18,881 (70.29%) | 1,413 (63.17%) | 2,909 (63.89%) | 4,696 (67.94%) | 9,863 (74.67%) | |
| Other | 21,433 (29.71%) | 2,076 (36.83%) | 4,091 (36.11%) | 5,740 (32.06%) | 9,526 (25.33%) | |
| Marital status, n (%) | <0.001 | |||||
| Married or living with a partner | 24,571 (63.14%) | 2,015 (60.40%) | 4,034 (58.94%) | 6,289 (61.73%) | 12,233 (65.63%) | |
| Living alone | 15,743 (36.86%) | 1,474 (39.60%) | 2,966 (41.06%) | 4,147 (38.27%) | 7,156 (34.37%) | |
| PIR, n (%) | <0.001 | |||||
| ≤1.30 | 12,109 (21.31%) | 1,246 (27.12%) | 2,475 (27.28%) | 3,411 (24.45%) | 4,977 (16.90%) | |
| 1.30-3.50 | 15,358 (35.25%) | 1,355 (37.15%) | 2,762 (37.08%) | 4,030 (36.78%) | 7,211 (33.60%) | |
| >3.50 | 12,847 (43.43%) | 888 (35.73%) | 1,763 (35.63%) | 2,995 (38.77%) | 7,201 (49.51%) | |
| Educational level, n (%) | <0.001 | |||||
| Less than high school | 10,173 (15.89%) | 970 (20.13%) | 1,998 (19.76%) | 2,858 (18.24%) | 4,347 (12.80%) | |
| High school or equivalent | 9,354 (24.01%) | 965 (30.12%) | 1,870 (29.23%) | 2,601 (26.37%) | 3,918 (20.17%) | |
| Above high school | 20,787 (60.10%) | 1,554 (49.75%) | 3,132 (51.01%) | 4,977 (55.40%) | 11,124 (67.03%) | |
| Smoking status, n (%) | <0.001 | |||||
| never | 21,646 (53.33%) | 1,874 (52.53%) | 3,644 (52.31%) | 5,487 (51.91%) | 10,641 (54.50%) | |
| former | 10,187 (25.09%) | 736 (20.82%) | 1,541 (20.95%) | 2,452 (22.97%) | 5,458 (28.17%) | |
| current | 8,481 (21.58%) | 879 (26.65%) | 1,815 (26.74%) | 2,497 (25.12%) | 3,290 (17.33%) | |
| Alcohol use, n (%) | 0.036 | |||||
| never | 5,648 (11.12%) | 484 (12.38%) | 930 (11.39%) | 1,508 (11.65%) | 2,726 (10.57%) | |
| former | 7,144 (14.37%) | 648 (15.12%) | 1,249 (15.13%) | 1,846 (14.39%) | 3,401 (14.00%) | |
| current | 27,522 (74.50%) | 2,357 (72.50%) | 4,821 (73.48%) | 7,082 (73.96%) | 13,262 (75.43%) | |
| Physical activity, minutes per week | 180.00 (15.75, 660.00) | 126.00 (0.00, 600.00) | 141.75 (0.00, 660.00) | 157.50 (7.88, 708.75) | 200.00 (31.50, 660.00) | <0.001 |
| BMI (kg/m2) | 28.81 (0.07) | 30.26 (0.20) | 29.65 (0.13) | 28.95 (0.10) | 28.25 (0.08) | <0.001 |
| CVD, n (%) | 0.035 | |||||
| No | 35,927 (91.27%) | 3,132 (90.67%) | 6,325 (91.92%) | 9,320 (91.84%) | 17,150 (90.86%) | |
| Yes | 4,387 (8.73%) | 357 (9.33%) | 675 (8.08%) | 1,116 (8.16%) | 2,239 (9.14%) | |
| Metabolic syndrome, n (%) | 0.400 | |||||
| No | 25,302 (66.17%) | 2,229 (65.32%) | 4,543 (67.12%) | 6,668 (66.69%) | 11,862 (65.75%) | |
| Yes | 15,012 (33.83%) | 1,260 (34.68%) | 2,457 (32.88%) | 3,768 (33.31%) | 7,527 (34.25%) | |
Abbreviations: DI-GM, dietary Index for gut microbiota; NHANES, National Health and Nutrition Examination Survey; PIR, poverty income ratio; BMI, body mass index; CVD, cardiovascular disease; SE, standard error; Q, quartile. 1Continuous variables are presented as weighted mean (standard error) or median (interquartile range), whereas categorical variables are presented as actual frequency (weighted percentage). N represents weighted counts to reflect the population distribution, while n represents unweighted counts from the actual sample size. 2Range of DI-GM scores: Q1, 0-2 score; Q2, 3 score; Q3, 4 score; Q4, 5-11 score.
Table 2.
Association between DI-GM and all-cause and CVD mortality among U.S. adults, NHANES 1999–2018.
Table 2.
Association between DI-GM and all-cause and CVD mortality among U.S. adults, NHANES 1999–2018.
| DI-GM | DI-GM group1 | ||||||||
|---|---|---|---|---|---|---|---|---|---|
| Q1 | Q2 | Q3 | Q4 | ||||||
| Deaths,no./ total no. |
Person-year | HR(95%CI) | P value | Reference | HR(95%CI) | HR(95%CI) | HR(95%CI) | Trend test | |
| CVD mortality | |||||||||
| Model 12 | 1933/40314 | 396,995.167 | 0.92(0.88, 0.96) | <0.001 | 1.00 | 0.81(0.59, 1.11) | 0.82(0.63, 1.07) | 0.71(0.53,0.94) | 0.008 |
| Model 23 | 1933/40314 | 396,995.167 | 0.94(0.89, 0.98) | 0.004 | 1.00 | 0.80(0.58, 1.10) | 0.83(0.64, 1.08) | 0.73(0.55,0.98) | 0.032 |
| Model 34 | 1933/40314 | 396,995.167 | 0.94(0.90, 0.99) | 0.014 | 1.00 | 0.83(0.61, 1.13) | 0.86(0.66, 1.12) | 0.76(0.57,1.02) | 0.060 |
| All-cause mortality | |||||||||
| Model 12 | 6156/40314 | 396,995.167 | 0.95(0.92, 0.97) | <0.001 | 1.00 | 0.88(0.74,1.03) | 0.90(0.78,1.04) | 0.79(0.69,0.92) | <0.001 |
| Model 23 | 6156/40314 | 396,995.167 | 0.96(0.94, 0.99) | <0.003 | 1.00 | 0.86(0.73,1.02) | 0.90(0.78,1.04) | 0.82(0.71,0.95) | 0.011 |
| Model 34 | 6156/40314 | 396,995.167 | 0.97(0.94, 0.99) | 0.01 | 1.00 | 0.87(0.74,1.03) | 0.92(0.79,1.06) | 0.84(0.73,0.97) | 0.024 |
Abbreviations: DI-GM, dietary index for gut microbiota; CVD, cardiovascular disease; NHANES, National Health and Nutrition Examination Survey; HR, hazard ratio; CI, confidence interval; PIR, poverty income ratio; BMI, body mass index; Q, quartile. 1Range of DI-GM scores: Q1, 0-2 score; Q2, 3 score; Q3, 4 score; Q4, 5-11 score. 2Model 1: adjusted for age, sex, marital status, race/ethnicity, education, PIR, and survey cycle. 3Model 2: additionally adjusted for smoking status, alcohol use, and physical activity. 4Model 3: further adjusted for BMI, history of CVD, and metabolic syndrome.
Disclaimer/Publisher’s Note: The statements, opinions and data contained in all publications are solely those of the individual author(s) and contributor(s) and not of MDPI and/or the editor(s). MDPI and/or the editor(s) disclaim responsibility for any injury to people or property resulting from any ideas, methods, instructions or products referred to in the content. |
© 2025 by the authors. Licensee MDPI, Basel, Switzerland. This article is an open access article distributed under the terms and conditions of the Creative Commons Attribution (CC BY) license (http://creativecommons.org/licenses/by/4.0/).
Copyright: This open access article is published under a Creative Commons CC BY 4.0 license, which permit the free download, distribution, and reuse, provided that the author and preprint are cited in any reuse.


