
Submitted:
26 November 2024
Posted:
27 November 2024
You are already at the latest version
Abstract
Noncommunicable diseases, particularly cardiovascular disease (CVD), represent a significant global public health challenge, with unhealthy diets as a major risk factor. This study investigates the association between adherence to the Planetary Health Diet proposed by the EAT-Lancet Commission and CVD risk. Methods: Utilizing data from the Seguimiento Universidad de Na-varra (SUN) cohort, which included 18,656 participants (mean age 38 years, 61% women), we as-sessed dietary intake using a validated food frequency questionnaire and the Planetary Health Diet Index to evaluate adherence (range 0-42). CVD was defined as new-onset stroke, myocardial in-farction, or CVD death. Results: After a median follow-up time of 11.5 years, 220 cases of CVD were identified. Higher adherence to the Planetary Health Diet revealed no statistically significant reduction in CVD risk associated with the diet. Cox proportional hazard models indicated a trend towards lower CVD risk in the highest adherence quartile, but this did not reach significance (HR 0.77, 95% CI 0.51-1.18, p-trend = 0.127). Sensitivity analyses corroborated these results. Discrep-ancies in previous studies highlight the complexity of dietary assessments and underscore the need for standardized scoring systems. Conclusions: In a large Spanish cohort, adherence to the Plan-etary Health Diet showed no significant reduction in CVD risk. Further research is needed to reach a consensus on the operational definition of the Planetary Health Diet and to clarify the rela-tionship between diet and CVD risk.
Keywords:
Planetary Health Diet
; cardiovascular disease
; EAT-Lancet diet
1. Introduction
The major global public health issue is noncommunicable disease (NCD) [1], and the major contributor to the climate change crisis is the modern global food system [2]. Approximately, 19.1 million deaths were attributed to cardiovascular disease (CVD) in the world [3]. Particularly in Spain, CVD is the leading cause of death from NCD [4]. Unhealthy diets are one of the main risk factors for CVD [5], which not only impact human health but also planetary health [6]. It is well known that unhealthy diets rich in fats, sugars, red meat, and salt have negative health effects and contribute to the development of chronic diseases [7]. On the contrary, some dietary patterns, such as healthy plant-based diets (PBD) are significantly associated with a lower incidence of NCD especially CVD [8,9]. Thus, PBD has been proven excellent for the regulation of blood lipid levels, oxidative stress, inflammation, and hyperglycemia [10] becoming a major public health priority in response to world food insecurity, health, and environment [11].
In 2019, the EAT-Lancet Commission on “Healthy Diets from Sustainable Food Systems” created a sustainable reference diet that provides a set of recommendations for feeding the entire world population within planetary boundaries [1,12]. The EAT-Lancet diet or Planetary Health Diet is based on an intake of 2,500 kcal per day [12] and classifies foods into two groups: those with emphasized consumption (vegetables, fruits, unsaturated oils, legumes, whole grains, nuts, and fish) and those with limited consumption (beef and lamb, pork, poultry, eggs, dairy and dairy products, potatoes, and added sugars). By adhering to these guidelines, the Planetary Health Diet could potentially prevent 11 million deaths annually among the global adult population (19% to 24% of total deaths) and offer health benefits such as a decreased risk of CVD [12,13]. The main reason may be that this diet demands an overall increase of 100% in the intake of healthy foods and a reduction of more than 50% in the intake of unhealthy foods, which would also contribute to lowering greenhouse gas emissions, as well as reducing land and water usage [14].
Recognizing its potential impact, several studies have used several indexes to assess adherence to the diet proposed by the EAT-Lancet Commission and its association with CVD risk [1,2,11,15,16,17,18,19,20,21,22,23,24]. However, the evidence is scarce and limited with discrepancies in the main findings across these studies. Some have identified a significant association between greater adherence to the Planetary Health Diet and a lower risk of CVD [2,15,16,17,18,19,20,21,22,24], whereas others have found no statistically significant association [1,11,23].
Therefore, we aimed to investigate the association between adherence to the Planetary Health Diet and the risk of CVD in the Seguimiento Universidad de Navarra (SUN) project aiming to address these discrepancies. This study is particularly noteworthy as it is the first to be conducted in the adult population of Spain.
2. Materials and Methods
2.1. Study Design and Participants
The SUN project is a dynamic, multi-purpose, and prospective Mediterranean cohort of university graduates in Spain since December 1999 (http://medpreventiva.es/MvbqgK) with a retention rate of 91.22%. Participants completed a baseline self-administered questionnaire (Q0) that consisted of 554 items to collect information about sociodemographic, lifestyle, medical history, and dietary variables. Questionnaires are sent via post or email. Additional details of design and methodology can be found elsewhere [25].
For this study, a total of 23,133 participants who had completed the Q0 by September 2022 were included. Among them, 22,899 participants were eligible for the analysis of incident CVD, ensuring that they were able to complete at least the first follow-up questionnaire. We excluded 352 participants with pre-existing CVD, as well as 2,095 participants who fell outside Willet’s predefined limits (<800 kcal/d or >4,200 kcal/d for men and <500 kcal/d or >3,500 kcal/d for women) [26] and 1,796 participants without follow-up. As a result, 18,656 participants were included in our final analysis (Figure 1).
2.2. Dietary Assessment
Baseline dietary data and after 10 years of follow-up were assessed using a self-administered food frequency questionnaire (FFQ), which has been validated previously, and its reproducibility for most foods and nutrients is considered good [27,28]. The FFQ includes 136 items divided into 9 food categories: dairy products, eggs, meat, and fish, vegetables, fruits, legumes and cereals, oils and fats, pastries, beverages, and miscellaneous items. Participants indicated how often they consumed each food over the past year, specifying portion sizes with options ranging from "never or almost never" to "more than six times a day." Spanish food composition tables were utilized to determine dietary intake, considering the daily consumption of each food and its nutrient composition [29,30]. An ad hoc computer system was employed to calculate the daily intake of each food by multiplying the typical serving size by the frequency of consumption.
2.3. Planetary Health Diet Assessment
For this analysis, we selected the Planetary Health Diet Index developed by Stubbendorf and Col. [13] which has been adapted for the Spanish population (Table S1). This index defines target intakes and reference ranges and includes 14 food groups that are divided into “emphasized intake” and “limited intake”, based on previous descriptions of the Eat-Lancet Commission [12]. The emphasized foods are vegetables, fruits, unsaturated oils, legumes, nuts, whole grains, and fish, while the limited foods include beef and lamb, pork, poultry, eggs, dairy, potatoes, and added sugars. The score on the index for each item varies from 0 to 3 points depending on the amount consumed (g/d). For limited-intake foods, an inverse scoring system is used: 0 points indicate low adherence to the target for that item, while 3 points reflect high adherence. The total possible score of the index ranges from 0 to 42 points.
2.4. Assessment of Other Dietary Variables
We used two predefined indices to assess adherence to the Mediterranean pattern, which is primarily characterized by a high intake of plant-based foods such as olive oil, vegetables, legumes, fruits, nuts, whole grains, and fish as animal-based sources, as well as a moderate consumption of red wine, a low intake of lean meat and dairy products, and a very low or no consumption of red and processed meat. We utilized the well-known Mediterranean Diet Score (MDS) developed by Trichopoulou et al. [31] with a total score range from 0 to 9 points. Additionally, we applied the 14-point Mediterranean Diet Adherence Screening (MEDAS) [32] used in the Prevención con Dieta Mediterránea (PREDIMED) trial, which includes items that are critical to an accurate assessment of the adherence to the traditional Mediterranean diet (MedDiet). Higher scores indicate greater adherence to the MedDiet.
2.5. Ascertainment of CVD
This study focused on CVD as the primary outcome and used self-reported questionnaires every two years to collect data. CVD events included myocardial infarction, CVD death, and stroke; all cases validated through medical records. When a participant reported a CVD event, medical documentation was requested, and a team of cardiologists, unaware of the participants' diets, evaluated the event. A non-fatal stroke was defined as a sudden neurological deficit lasting more than 24 hours. Myocardial infarction diagnoses were based on universal criteria [33], and deaths were confirmed through certificates, medical records, and records linked to the National Institute of Statistics. Additionally, the National Death Index was consulted annually to identify participants who may have died in the cohort.
2.6. Co-Variables Evaluation
The additional covariates including sociodemographic information, anthropometric measurements, health habits, dietary intake, and lifestyle were gathered in the baseline Q0. The validity of the anthropometric information provided by the participants themselves (weight and height) has been previously analyzed in a subsample of the SUN cohort [34]. BMI was estimated by dividing weight by height squared (kg/m2) and distributed into tertiles. Participants with chronic disease were recognized if they had a prior diagnosis or had received treatment with medications for managing the disease.
2.7. Statistical Analyses
Participants were categorized into the following quartiles (Q) according to their adherence to the Planetary Health Diet Index: Q1 or lowest adherence from 7 to 18 points; Q2 and Q3 or medium adherence from 19 to 21 and 22 to 23 respectively; and Q4 or highest overall adherence from 24 to 37 points. We calculated proportions for categorical variables and means along with standard deviations (SD) for quantitative variables. To assess the relationship between the Planetary Health Diet Index quartiles and the incidence of CVD, we employed Cox proportional hazard regression models. Hazard ratios (HR) were determined along with their 95% confidence intervals (CI) for each quartile, using the first quartile (Q1) as the reference category. An HR greater than 1 indicates a higher risk of CVD, while an HR less than 1 suggests a lower likelihood of developing CVD. Based on existing evidence and previous findings of the SUN cohort [35,36], three multivariable-adjusted models were fitted and age was used as a time variable in all Cox models. We adjusted our models as follows: model 1 was adjusted for sex, and stratified by age (deciles) and by year entering the cohort; model 2 was additionally adjusted for total energy intake (kcal/d, continuous), educational level (years of higher education, continuous), smoking (never, current, and former smoker), accumulated smoking habit (pack-years, continuous), alcohol intake (g/d, continuous), physical activity (metabolic equivalent-h/week, continuous), snacking between meals (yes/no), body mass index (BMI [kg/m2, linear and quadratic terms, continuous]), time spent sitting (hours/week, continuous), watching television (h/d, continuous) and following a special diet at baseline (yes/no); lastly, model 3 was additionally adjusted for family history of CVD (yes/no), and any diagnosis of diabetes (yes/no), hypertension (yes/no), hypercholesterolemia (yes/no), dyslipidemia (yes/no), depression (yes/no), and cancer (yes/no). Linear trend tests were used through quartiles, assigning the median value of each quartile, and treating the resulting variables as continuous. To reduce the impact of dietary variation, we employed repeated measurements using cumulative average dietary information from the components of the Planetary Health Diet, along with a full repetition of the FFQ after 10 years of follow-up. In analyzing the repeated measures, we calculated the mean between the baseline FFQ and the 10-year FFQ (i.e., cumulative average exposure) to provide a more accurate representation of the diet based on this dietary index. To further assess the relationship between dietary patterns, the two-by-two correlation coefficients between the Planetary Health Diet and the Mediterranean Diet (using the MEDAS and MDS indices) were calculated. The following sensitivity analyses and subgroup analyses were additionally performed to assess the robustness of our findings: (a) selection by sex, only men or women participants, (b) only participants < 45 years or ≥ 45 years, (c) censoring participants at > 50 years, (d) only health professionals or only non-health professionals participants, (e) exclusion of participants with hypercholesterolemia and prevalent hypertension, (f) using different predefined energy intake limits (5th percentile and 95th percentile), (g) exclusion of participants with prevalent cancer, (h) exclusion of participants who followed a special diet at baseline, (i) exclusion of participants with ≥ 30 items missing in the FFQ, and (j) exclusion of participants with early CVD (≤ 2 years). Statistical analyses were performed using STATA software (STATA version 14·1, StataCorp, College Station, TX, USA). All p values presented are two-tailed and statistical significance was set at the conventional cut-off of p <0·05.
3. Results
3.1. Characteristics of the Participants
A total of 18,656 participants were followed for a mean time of 11.5 years. During this period, 220 cases of prevalent CVD were identified, which included 95 cases of nonfatal acute myocardial infarction, 78 cases of nonfatal strokes, and 47 cardiovascular-related deaths. Table 1 shows the baseline socio-demographic characteristics of the participants categorized by quartiles of the Planetary Health Diet Index. Participants in the SUN cohort scored between 7 and 37 points on the Planetary Health Diet Index (score 0–42 points), with a mean score of 20.6 points (SD 3.4). The average age of the participants was 38 years (SD 12.1), and the mean baseline BMI was 23.5 kg/m² (SD 3.5). Approximately 61% of the participants were women. Participants in the highest quartile of adherence to this diet (Q4) were more likely to have been former smokers, had accumulated more pack-years of smoking, were more physically active, followed a special diet, consumed supplements, had healthier dietary habits (higher MedDiet adherence and provegetarian scores), and had a higher prevalence of diseases. On the contrary, participants in Q1 were more likely to be single, to have never smoked, had more weight gain, and were more likely to snack between meals.
Participants who adhered more closely (Q4) to the Planetary Health Diet Index exhibited a higher consumption of vegetables, fruits, unsaturated oils, olive oil, legumes, nuts, whole grains, fish, had higher carbohydrate and fiber intake, and a healthier fat profile. While participants in Q1 had a higher consumption of foods recommended for limited consumption, such as beef, lamb, pork, poultry, eggs, dairy, potatoes, added sugars, and fast food. In terms of energy and nutrients, Q1 participants had the highest energy and fat intake, cholesterol consumption, and saturated fat (Table 2).
3.2. Association Between Planetary Health Diet and CVD
Table 3 presents the results of the multivariate Cox regression analysis examining the association between adherence to the Planetary Health Diet Index and CVD risk. In the SUN cohort, the number of CVD cases across the quartiles of adherence to the diet were as follows: Q1 had 53 cases, Q2 78 cases, Q3 44 cases, and Q4 45 cases. The person-years calculated, representing the time at risk for participants, varied from 62,598 in Q1 to 41,549 in Q4, and mortality rates per 1,000 person-years increased from Q1 (0.84) to Q4 (1.08). The analysis utilized three statistical models (Model 1, Model 2, and Model 3) to assess the relationship between diet adherence quartiles and CVD outcomes. The key findings from Model 3, which adjusted for various factors such as family history of CVD and prevalent conditions like diabetes, hypertension, and hypercholesterolemia (well-established CVD risk factors), showed no statistically significant association between adherence to the Planetary Health Diet and CVD risk. In comparison to the reference category (Q1), all point estimates appear to be protective (Model 3 Q2 HR 0.98, 95% CI 0.68-1.40; Q3 HR 0.74, 95% CI 0.49-1.12; Q4 HR 0.98, 95% CI 0.68-1.40); however, the p-for-trend value was 0.127, indicating that there was no significant linear trend across the quartiles regarding CVD risk.
To update the dietary analysis, we used time-dependent Cox regression models with repeated dietary measurements based on cumulative average data after 10 years of follow-up. Although the fully adjusted model showed an inverse relationship between the Planetary Health Diet Index and CVD risk, they were not statistically significant. The hazard ratios were 1.18 (95% CI 0.82–1.70) for updated dietary information, and 0.82 (95% CI 0.55–1.23) when comparing participants in the highest versus lowest quartile in fully adjusted models (Table 3).
3.3. Correlation Between Planetary Health Diet and Mediterranean Diet
Our research explored the correlation between Planetary Health Diet and MedDiet diet measured by the MEDAS and MDS, and the correlation was of 0.47 and of 0.52 respectively.
3.4. Sensitivity Analyses
Multiple sensitivity analyses were performed to corroborate our findings (Table 4). Overall, the results did not substantially change in any scenario or sub-group, observing 18,656 between the Planetary Health Diet Index and the incidence of CVD.
4. Discussion
The findings from the SUN cohort offer valuable insights into the relationship between adherence to the Planetary Health Diet and the risk of CVD among a cohort of Spanish university graduates. Despite the theoretical advantages of this dietary approach, particularly its capacity to mitigate CVD risk as noted in previous research, the results of this cohort analysis reveal no statistically significant association.
However, the non-significant associations found in this study do not undermine the well-known role of PBD in CVD, and in particular the MedDiet [37]. In fact, numerous studies have demonstrated a significant association between PBD and a reduced risk of CVD [8,9,38,39]. This dietary pattern, which emphasizes the consumption of fruits, vegetables, whole grains, legumes, nuts, and seeds while minimizing or excluding animal products, is rich in essential nutrients, fiber, and antioxidants, which collectively contribute to optimal cardiovascular health. Evidence has shown that PBD can improve lipid profiles, lower blood pressure, reduce inflammation, and enhance glycemic control, all of which are crucial factors in preventing CVD [40]. The Planetary Health Diet, proposed by the EAT-Lancet Commission, is a sustainable eating plan designed to promote human health while minimizing environmental impact by focusing on plant-based foods [12]. The diet aims to balance nutritional needs with the preservation of natural resources. It also enhances nutrition and cardiovascular health by reducing processed foods, red meat, and unhealthy fats [22]. The improved health outcomes of the Planetary Health Diet are partly attributed to the nutrient-dense and bioactive compounds such as flavonoids and polyphenols, which also provide heart-protective benefits [41]. These bioactive compounds from fruits, vegetables, nuts, and whole grains have antioxidants, anti-inflammatory phytochemicals, and fiber, which help regulate glucose and LDL-cholesterol levels [42,43]. The diet's low SFA content helps reduce the risk of atherosclerosis [44], while its high potassium levels aid in better blood pressure management [12]. In this study, participants with a higher adherence to the Planetary Health Diet Index consumed a healthier diet, including greater amounts of vegetables, fruits, unsaturated oils, olive oil, legumes, nuts, cereals, whole grains, fish, and fiber; nonetheless, the findings were not statistically significant and these results were consistent in sensitivity analyses. It has to be taken into consideration that the Planetary Health Diet Index does not sufficiently assess adherence to MedDiet, which is well-known for its health benefits. In fact, in our study the correlation between both dietary patterns was moderate. Therefore, individuals may still benefit from the MedDiet. Another potential reason for not observing an association could be the minimal differences in dietary intake between the quartiles being compared. The consumption of MUFA was quite similar in both the lowest quartile (Q1) and the highest quartile (Q4), as was the intake of PUFA. Additionally, the percentage of total fat intake showed little variation across quartiles. Since these food components are known to be related to CVD, this lack of significant variation in key dietary components may have contributed to the absence of a clear association in the study findings.
Previous investigations examining the link between the Planetary Health Diet and CVD has found either inverse or no significant associations. In line with our study, the NutriNet-Santé cohort, a Mediterranean cohort with 786 cases of CVD events with 12 years follow-up found no association between the EAT-Lancet diet (range -162 to 332 points) and CVD [1]. Also, the analyses of the UK Biobank cohort showed no association between the EAT-Lancet diet (range 0-11 points) and CVD [23]. Lazarova et al. [11] did not find an association between adherence to the Planetary Health Diet and all-cause stroke. On the other hand, certain studies have found a beneficial association between the Planetary Health Diet or EAT-Lancet diet and CVD [2,15,16,17,18,20,21,24]. The EPIC-Oxford cohort and the EPIC-Netherlands cohort found a lower risk of ischaemic heart disease, CVD, and coronary heart disease with higher adherence to the diet compared with the lowest adherence [18,21]. Particularly, in British adults, it is noteworthy that better adherence to the EAT-Lancet diet (range 0-14 points) was associated with a 28% risk reduction of ischaemic heart disease [21] while in the Dutch population, the risk reduction was 14% [18] in line with the findings from the UK Biobank cohort study [16]. Studies conducted within the UK Biobank cohort utilized a Planetary Health Diet score, which encompassed 14 dietary components categorized into three groups: adequacy, optimal, and moderation components; the score had a total range of 0 to 130 points [16,22]. In the study conducted by Zhang et al. [15], the EAT-Lancet diet index (range 0-42 points) was evaluated using only a single dietary assessment at baseline, without being updated throughout the extended follow-up period. Such different results could be partially attributed to the absence of a standardized, universal operational definition of the EAT-Lancet diet and the variety of scores and methodologies to measure adherence to this novel dietary pattern [45].
It must be highlighted that our study distinguishes itself from previous research in several significant ways. First, studies typically employed at least two 24-hour dietary assessments alongside a touchscreen FFQ. In the SUN cohort, dietary information was collected through a validated self-reported FFQ. Second, the scoring method for the Planetary Health Diet in previous studies differed considerably from our approach. For instance, Sotos-Prieto et al. [16] used a continuous scoring system that enabled them to capture variations relative to reference dietary levels, whereas our method scored the consumption of food groups dichotomously, which may limit our ability to detect associations effectively.
Variations in cohort characteristics, follow-up duration, sample size, and food group definitions or food questionnaires likely contribute to the discrepancies in study results [23]. Without a standardized and universally accepted score, it is unavoidable that researchers interpret and implement the Planetary Health Diet in varying ways.
Strengths and Limitations
Several limitations of this study should be acknowledged. First, our participants were highly educated, which may result in findings that are not fully representative of the general population. Nevertheless, the applicability of the results should be grounded in biological mechanisms rather than statistical representation. Second, the FFQ was self-reported, which may lead to measurement errors. However, the FFQ remains a widely recognized tool in nutritional epidemiology for evaluating dietary habits and has been validated multiple times [28,46]. Third, despite adjusting our models for conventional CVD risk factors, residual confounding couldn´t be entirely ruled out. Fourth, we were unable to independently assess the relationship between Planetary Health Diet Index and fatal or non-fatal myocardial infarction, stroke and deaths from CVD due to the small number of cases in our cohort, which limited component-specific analyses for the composite CVD outcome. Lastly, the Planetary Health Diet Index has yet to undergo formal validation. However, this index is based on the best scientific evidence and it was previously used in other studies [13].
The strengths of this study include its large sample size, extended follow-up period, high retention rate (> 91%) and the use of repeated dietary measurements after 10 years of follow-up. The Cardiovascular events were confirmed blindly through medical records, reducing the risk of misclassification bias. Additionally, the study was able to account for a wide range of potential confounders. Extensive sensitivity analyses and confirmation of deaths through the Spanish National Death Index further strengthen the study's reliability.
5. Conclusions
In a large cohort of Spanish adults, greater adherence to a Planetary Dietary Pattern, as recommended by the EAT-Lancet Commission to promote both human health and environmental sustainability, documented no significant associations with a reduced risk of CVD. This diet, while promising in its approach, does not adequately measure adherence to the MedDiet, a well-established dietary pattern known for its health benefits, particularly in reducing CVD risk. This suggests that individuals may still benefit from adhering to the MedDiet, which emphasizes a balanced intake of plant-based foods, and healthy fats. Further research may be necessary to clarify the relationship between the newer dietary framework, the Planetary Health Diet, and CVD risk.
Supplementary Materials
The following supporting information can be downloaded at: www.mdpi.com/xxx/s1, Figure S1: Criteria for the Planetary Health Diet Index created to evaluate the adherence to the Planetary Health Diet in the SUN project.
Author Contributions
Conceptualization, IZ, KGC and SS.; methodology, IZ and SS; software, KGC and IZ; validation, MAMG, MBR and IZ; formal analysis, KGC; investigation, KGC.; resources, KGC and SS; data curation, IZ; writing—original draft preparation, KGC.; writing—review and editing, KGC, IZ, and SS; supervision, MAMG and MBR. All authors have read and agreed to the published version of the manuscript.
Funding
This project was supported by the Instituto de Salud Carlos III and European Regional Development Fund (FEDER) (RD 06/0045, CIBER-OBN, Grants PI10/02658, PI10/02293, PI13/00615, PI14/01668, PI14/01798, PI14/01764, PI17/01795, PI20/00564, PI23/01332 and G03/140), PNSD (2020/021), the Navarra Regional Government (45/2011, 122/2014, 41/2016), and the University of Navarra.
Institutional Review Board Statement
The study was conducted in accordance with the Declaration of Helsinki, approved by the Ethics Committee of the University of Navarra (approval code 010830), and registered on clinicaltrials.gov as NCT02669602.
Informed Consent Statement
Informed consent was obtained from all subjects involved in the study.
Data Availability Statement
Information and data from this study are available on request from SUN Scientific Committee sun@unav.es.
Acknowledgments
This project was supported by the Instituto de Salud Carlos III and European Regional Development Fund (FEDER) (RD 06/0045, CIBER-OBN, Grants PI10/02658, PI10/02293, PI13/00615, PI14/01668, PI14/01798, PI14/01764, PI17/01795, PI20/00564, PI23/01332 and G03/140), the Navarra Regional Government (45/2011, 122/2014, 41/2016), the National Plan on Drugs (2020 / 021), and the University of Navarra. In addition, we also would like to thank the members of the Department of Nutrition of the Harvard School of Public Health (Willett WC., Hu FB., and Ascherio A.) and all participants of the SUN project for their continued cooperation and participation. Special thanks go to all the members of the SUN project for material support, administrative and technical.
Conflicts of Interest
The authors declare no conflicts of interest.
Appendix A

Table A1.
Criteria for the Planetary Health Diet Index created to evaluate the adherence to the Planetary Health Diet in the SUN project.
Table A1.
Criteria for the Planetary Health Diet Index created to evaluate the adherence to the Planetary Health Diet in the SUN project.
| Food components Planetary Health Diet Index1 | Target intake (reference interval)2 | 3 points | 2 points | 1 point | 0 points | Scoring criteria | |
|---|---|---|---|---|---|---|---|
| Emphasized intake | Vegetables | 300 (200-600) | >300 | 200-300 | 100-200 | <100 | Positive score: 3 points = intake above the target 2 points = lower limit of the reference interval up to the target intake 1 point = 50%-100% of the lower limit of the reference interval 0 points <50% of the lower limit of the reference interval |
| Fruits | 200 (100-300) | >200 | 100-200 | 50-100 | <50 | ||
| Unsaturated oils | 40 (20-80) | >40 | 20-40 | 10-20 | <10 | ||
| Legumes | 75 (0-150) | >75 | 37.5-75 | 18.75-37.5 | <18.75 | Positive score, adjusted3: 3 points = intake above the target 2 points = 50%-100% of the target intake 1 point = 25%-50% of the target intake 0 points = <25% of the target intake |
|
| Nuts | 50 (0-100) | >50 | 25-50 | 12.5-25 | <12.5 | ||
| Whole grains | 232 | >232 | 116-232 | 58-116 | <58 | ||
| Fish | 28 (0-100) | >28 | 14-28 | 7-14 | <7 | ||
| Limited intake | Beef and lamb | 7 (0-14) | <7 | 7-14 | 14-28 | >28 | Inverse score: 3 points = intake below the target 2 points = between the target intake and the upper limit of the reference interval 1 point = 100%-200% of the upper limit of the reference interval 0 points >= 200% of the upper limit of the reference interval |
| Pork | 7 (0-14) | <7 | 7-14 | 14-28 | >28 | ||
| Poultry | 29 (0-58) | <29 | 29-58 | 58-116 | >116 | ||
| Eggs | 13 (0-25) | <13 | 13-25 | 25-50 | >50 | ||
| Dairy | 250 (0-500) | <250 | 250-500 | 500-1000 | >1000 | ||
| Potatoes | 50 (0-100) | <50 | 50-100 | 100-200 | >200 | ||
| Added sugar4 | 31 (0-31) | <31 | 31-62 | 62-124 | >124 | ||
|
1Food components are based on the Planetary Health Diet as grams per day [12]. 2Target and reference values from the EAT-Lancet diet [12] based on an energy intake of 2500 kcal/day, expressed in grams. 3The initial criteria of the positive score were not feasible, since the lower limit of the reference interval was 0. 4Since the upper limit of the reference Interval and target were identical, we used an upper reference interval of target intake x2 (62 g) [13]. | |||||||
References
- Berthy, F.; Brunin, J.; Allès, B.; Fezeu, LK.; Touvier, M.; Hercberg, S. Association between adherence to the EAT-Lancet diet and risk of cancer and cardiovascular outcomes in the prospective NutriNet-Sante cohort. Am J Clin Nutr 2022, 116, 980–991. [Google Scholar] [CrossRef] [PubMed]
- Sawicki, CM.; Ramesh, G.; Bui, L.; Nair, NK.; Hu, FB.; Rimm, EB. Planetary health diet and cardiovascular disease: Results from three large prospective cohort studies in the USA. Lancet 2024. [Google Scholar] [CrossRef] [PubMed]
- Tsao, CW.; Aday, AW.; Almarzooq, ZI.; Alonso, A.; Beaton, AZ.; Bittencourt, MS. Heart Disease and Stroke Statistics-2022 Update: A Report from the American Heart Association. Circulation 2022, 145, E153–639. [Google Scholar] [PubMed]
- World Health Organization. Spain-Overview of the distribution of causes of total deaths grouped by category. 2021. Available online: https://platform.who.int/mortality/countries/country-details/MDB/spain.
- Arnett, DK.; Blumenthal, RS.; Albert, MA.; Buroker, AB.; Goldberger, ZD.; Hahn, EJ. 2019 ACC/AHA Guideline on the Primary Prevention of Cardiovascular Disease: A Report of the American College of Cardiology/American Heart Association Task Force on Clinical Practice Guidelines. Circulation 2019, 140, e596–646. [Google Scholar] [CrossRef]
- Tilman, D.; Clark, M. Global diets link environmental sustainability and human health. Nature 2014, 515, 518–522. [Google Scholar] [CrossRef]
- Murray CJL.; Aravkin AY. Global burden of 87 risk factors in 204 countries and territories, 1990–2019: A systematic analysis for the Global Burden of Disease Study 2019. The Lancet 2020, 396, 1223–1249. [CrossRef]
- Kim, H.; Caulfield, LE.; Garcia-Larsen, V.; Steffen, LM.; Coresh, J.; Rebholz, CM. Plant-Based Diets Are Associated With a Lower Risk of Incident Cardiovascular Disease, Cardiovascular Disease Mortality, and All-Cause Mortality in a General Population of Middle-Aged Adults. J Am Heart Assoc 2019, 8. [Google Scholar] [CrossRef]
- Heianza, Y.; Zhou, T.; Sun, D.; Hu, FB.; Qi, L. Healthful plant-based dietary patterns, genetic risk of obesity, and cardiovascular risk in the UK biobank study. Clin Nutr 2021, 40, 4694–4701. [Google Scholar] [CrossRef]
- Aune, D. Plant Foods, Antioxidant Biomarkers, and the Risk of Cardiovascular Disease, Cancer, and Mortality: A Review of the Evidence. Adv Nutr 2019, 10, S404–21. [Google Scholar] [CrossRef]
- Lazarova S, V.; Sutherland, JM. Adherence to emerging plant-based dietary patterns and its association with cardiovascular disease risk in a nationally representative sample of Canadian adults. Am J Clin Nutr 2022, 116, 57–73. [Google Scholar] [CrossRef]
- Willett, W.; Rockström, J.; Loken, B.; Springmann, M.; Lang, T.; Vermeulen, S. Food in the Anthropocene: The EAT–Lancet Commission on healthy diets from sustainable food systems. Lancet 2019, 393, 447–492. [Google Scholar] [CrossRef] [PubMed]
- Stubbendorff, A.; Sonestedt, E.; Ramne, S.; Drake, I.; Hallström, E.; Ericson, U. Development of an EAT-Lancet index and its relation to mortality in a Swedish population. Am J Clin Nutr 2022, 115, 705–716. [Google Scholar] [CrossRef] [PubMed]
- Springmann, M.; Spajic, L.; Clark, MA.; Poore, J.; Herforth, A.; Webb, P. The healthiness and sustainability of national and global food based dietary guidelines: Modelling study. The BMJ 2020, 370. [Google Scholar] [CrossRef] [PubMed]
- Zhang, S.; Marken, I.; Stubbendorff, A.; Ericson, U.; Qi, L.; Sonestedt, E. The EAT-Lancet Diet Index, Plasma Proteins, and Risk of Heart Failure in a Population-Based Cohort. JACC Heart Fail 2024, 12, 1197–1208. [Google Scholar] [CrossRef]
- Sotos-Prieto, M.; Ortolá, R. Association between planetary health diet and cardiovascular disease: A prospective study from the UK Biobank. Eur J Prev Cardiol 2024. [Google Scholar] [CrossRef]
- Ataei-Kachouei, A.; Mohammadifard, N. Adherence to EAT-Lancet reference diet and risk of premature coronary artery diseases: A multi-center case-control study. Eur J Nutr 2024. [Google Scholar] [CrossRef]
- Colizzi, C.; Harbers, MC.; Vellinga, RE.; Monique, WM.; Boer, JM.; Biesbroek, S. Adherence to the EAT-Lancet Healthy Reference Diet in Relation to Risk of Cardiovascular Events and Environmental Impact: Results From the EPIC-NL Cohort. J Am Heart Assoc 2023, 12. [Google Scholar] [CrossRef]
- Cacau, LT.; Benseñor, IM. Adherence to the EAT-Lancet sustainable reference diet and cardiometabolic risk profile: Cross-sectional results from the ELSA-Brasil cohort study. Eur J Nutr 2023, 62, 807–817. [Google Scholar] [CrossRef]
- Zhang, S.; Dukuzimana, J.; Stubbendorff, A.; Ericson, U.; Borné, Y.; Sonestedt, E. Adherence to the EAT-Lancet diet and risk of coronary events in the Malmö Diet and Cancer cohort study. Am J Clin Nutr 2023, 117, 903–909. [Google Scholar] [CrossRef]
- Knuppel, A.; Papier, K.; Key, TJ.; Travis, RC. EAT-Lancet score and major health outcomes: The EPIC-Oxford study. Lancet 2019, 394, 213–214. [Google Scholar] [CrossRef]
- Ye, YX.; Chen, JX. Adherence to a planetary health diet, genetic susceptibility, and incident cardiovascular disease: A prospective cohort study from the UK Biobank. Am J Clinical Nutr 2024, 120, 648–655. [Google Scholar] [CrossRef] [PubMed]
- Karavasiloglou, N.; Thompson, AS.; Pestoni, G.; Knuppel, A.; Papier, K.; Cassidy, A. Adherence to the EAT-Lancet reference diet is associated with a reduced risk of incident cancer and all-cause mortality in UK adults. One Earth 2023, 6, 1726–1734. [Google Scholar] [CrossRef] [PubMed]
- Cacau, LT.; Hanley-Cook, GT. Relative validity of the Planetary Health Diet Index by comparison with usual nutrient intakes, plasma food consumption biomarkers, and adherence to the Mediterranean diet among European adolescents: The HELENA study. Eur J Nutr 2023. [Google Scholar] [CrossRef] [PubMed]
- Seguí-Gómez, M.; de la Fuente, C. Cohort profile: The “Seguimiento Universidad de Navarra” (SUN) study. Int J Epidemiol 2006, 35, 1417–1422. [Google Scholar] [CrossRef]
- Willet, WC. Nutritional epidemiology. 3rd ed. NewYork, NY: Oxford University Press, 2013. [Google Scholar]
- Fernández-Ballart, JD.; Piñol, JL.; Zazpe, I.; Corella, D.; Carrasco, P.; Toledo, E. Relative validity of a semi-quantitative food-frequency questionnaire in an elderly Mediterranean population of Spain. Br J Nutr 2010, 103, 1808–1816. [Google Scholar] [CrossRef]
- Martin-moreno, JM.; Boyle, P.; Gorgojo, L.; Maisonneuve, P.; Fernandez-rodriguez, JC.; Salvini, S. Development and validation of a food frequency questionnaire in Spain. Int J Epidemiol 1993, 22, 512–519. [Google Scholar] [CrossRef]
- Mataix Verdu, J. Tabla de Composición de Alimentos Españoles (Spanish Food Composition Tables). 4th ed. Granada: Universidad de Granada 2003.
- Moreiras, O.; Carbajal, Á.; Cabrera, L.; Cuadrado, C. Tablas de Composición de Alimentos (Food Composition Tables). 9th ed. Pirámide, Madrid 2005.
- Trichopoulou, A. Adherence to a Mediterranean diet and survival in a Greek population. Vascular Medicine 2004, 9, 145–146. [Google Scholar] [CrossRef]
- Schröder, H.; Fitó, M.; Estruch, R.; Martínez-González, MA.; Corella, D.; Salas-Salvadó, J. A Short screener is valid for assessing mediterranean diet adherence among older spanish men and women. J Nutr 2011, 141, 1140–1145. [Google Scholar] [CrossRef]
- Thygesen, K.; Alpert, JS.; Jaffe, AS.; Simoons, ML.; Chaitman, BR.; White, HD. Third universal definition of myocardial infarction. Eur Heart J 2012, 33, 2551–2567. [Google Scholar] [CrossRef]
- Bes-Rastrollo, M.; Pérez Valdivieso, JR.; Sánchez-Villegas, A.; Alonso, Á.; Martínez-González, MA. Validación del peso e índice de masa corporal auto-declarados de los participantes de una cohorte de graduados universitarios. [Validation of self-reported weight and body mass index in a cohort of university graduates]. Rev Esp Obes 2005, 3, 352–358. [Google Scholar]
- Vanegas, P.; Zazpe, I.; Santiago, S.; Fernandez-Lazaro, CI.; de la O, V. ; Martínez-González MÁ. Macronutrient quality index and cardiovascular disease risk in the Seguimiento Universidad de Navarra (SUN) cohort. Eur J Nutr, 2022; 61, 3517–3530. [Google Scholar]
- de la O, V.; Zazpe, I.; Goni, L.; Santiago, S.; Martín-Calvo, N.; Bes-Rastrollo, M. A score appraising Paleolithic diet and the risk of cardiovascular disease in a Mediterranean prospective cohort. Eur J Nutr 2022, 61, 957–971. [Google Scholar] [CrossRef] [PubMed]
- Quek, J.; Lim, G.; Lim, WH.; Ng, CH.; So, WZ.; Toh, J. The Association of Plant-Based Diet With Cardiovascular Disease and Mortality: A Meta-Analysis and Systematic Review of Prospect Cohort Studies. Front Cardiovasc Med 2021, 8. [Google Scholar] [CrossRef] [PubMed]
- Gan, ZH.; Cheong, HC.; Tu, YK.; Kuo, PH. Association between plant-based dietary patterns and risk of cardiovascular disease: A systematic review and meta-analysis of prospective cohort studies. Nutrients MDPI 2021, 13. [Google Scholar] [CrossRef] [PubMed]
- Salehin, S.; Rasmussen, P.; Mai, S.; Mushtaq, M.; Agarwal, M.; Hasan, SM. Plant Based Diet and Its Effect on Cardiovascular Disease. Int J Environ Res Public Health MDPI 2023, 20. [Google Scholar] [CrossRef] [PubMed]
- Kent, G.; Kehoe, L.; Flynn, A.; Walton, J. Plant-based diets: A review of the definitions and nutritional role in the adult diet. Proc Nutr Soc 2022, 62–74. [Google Scholar] [CrossRef]
- Rana, A.; Samtiya, M.; Dhewa, T.; Mishra, V.; Aluko, RE. Health benefits of polyphenols: A concise review. J Food Biochem 2022, 46. [Google Scholar] [CrossRef]
- Trautwein, EA.; McKay, S. The role of specific components of a plant-based diet in management of dyslipidemia and the impact on cardiovascular risk. Nutrients MDPI 2020, 12, 1–21. [Google Scholar] [CrossRef]
- Estruch, R.; Ros, E.; Salas-Salvadó, J.; Covas, MI.; Corella, D.; Arós, F. Primary Prevention of Cardiovascular Disease with a Mediterranean Diet Supplemented with Extra-Virgin Olive Oil or Nuts. New Engl J Med 2018, 378. [Google Scholar] [CrossRef]
- Iqbal, I.; Wilairatana, P.; Saqib, F.; Nasir, B.; Wahid, M.; Latif, MF. Plant Polyphenols and Their Potential Benefits on Cardiovascular Health: A Review. Molecules MDPI) 2023, 28. [Google Scholar] [CrossRef]
- Alexandropoulou, I.; Goulis, DG.; Merou, T.; Vassilakou, T.; Bogdanos, DP.; Grammatikopoulou, MG. Basics of Sustainable Diets and Tools for Assessing Dietary Sustainability: A Primer for Researchers and Policy Actors. Healthcare, 2022; 10. [Google Scholar]
- De La Fuente-Arrillaga, C.; Vzquez Ruiz, Z.; Bes-Rastrollo, M.; Sampson, L.; Martinez- González, MA. Reproducibility of an FFQ validated in Spain. Public Health Nutr 2010, 1364–1372. [Google Scholar] [CrossRef]
- Martínez-González, MA.; Sánchez-Tainta, A.; Corella, D.; Salas-Salvadó, J.; Ros, E.; Arós, F. A provegetarian food pattern and reduction in total mortality in the Prevención con Dieta Mediterránea (PREDIMED) study. Am J Clin Nutr 2014. [Google Scholar] [CrossRef]
Figure 1.
Flowchart depicting the selection of participants in the SUN project (1999-2022) included in the present analyses.
Figure 1.
Flowchart depicting the selection of participants in the SUN project (1999-2022) included in the present analyses.
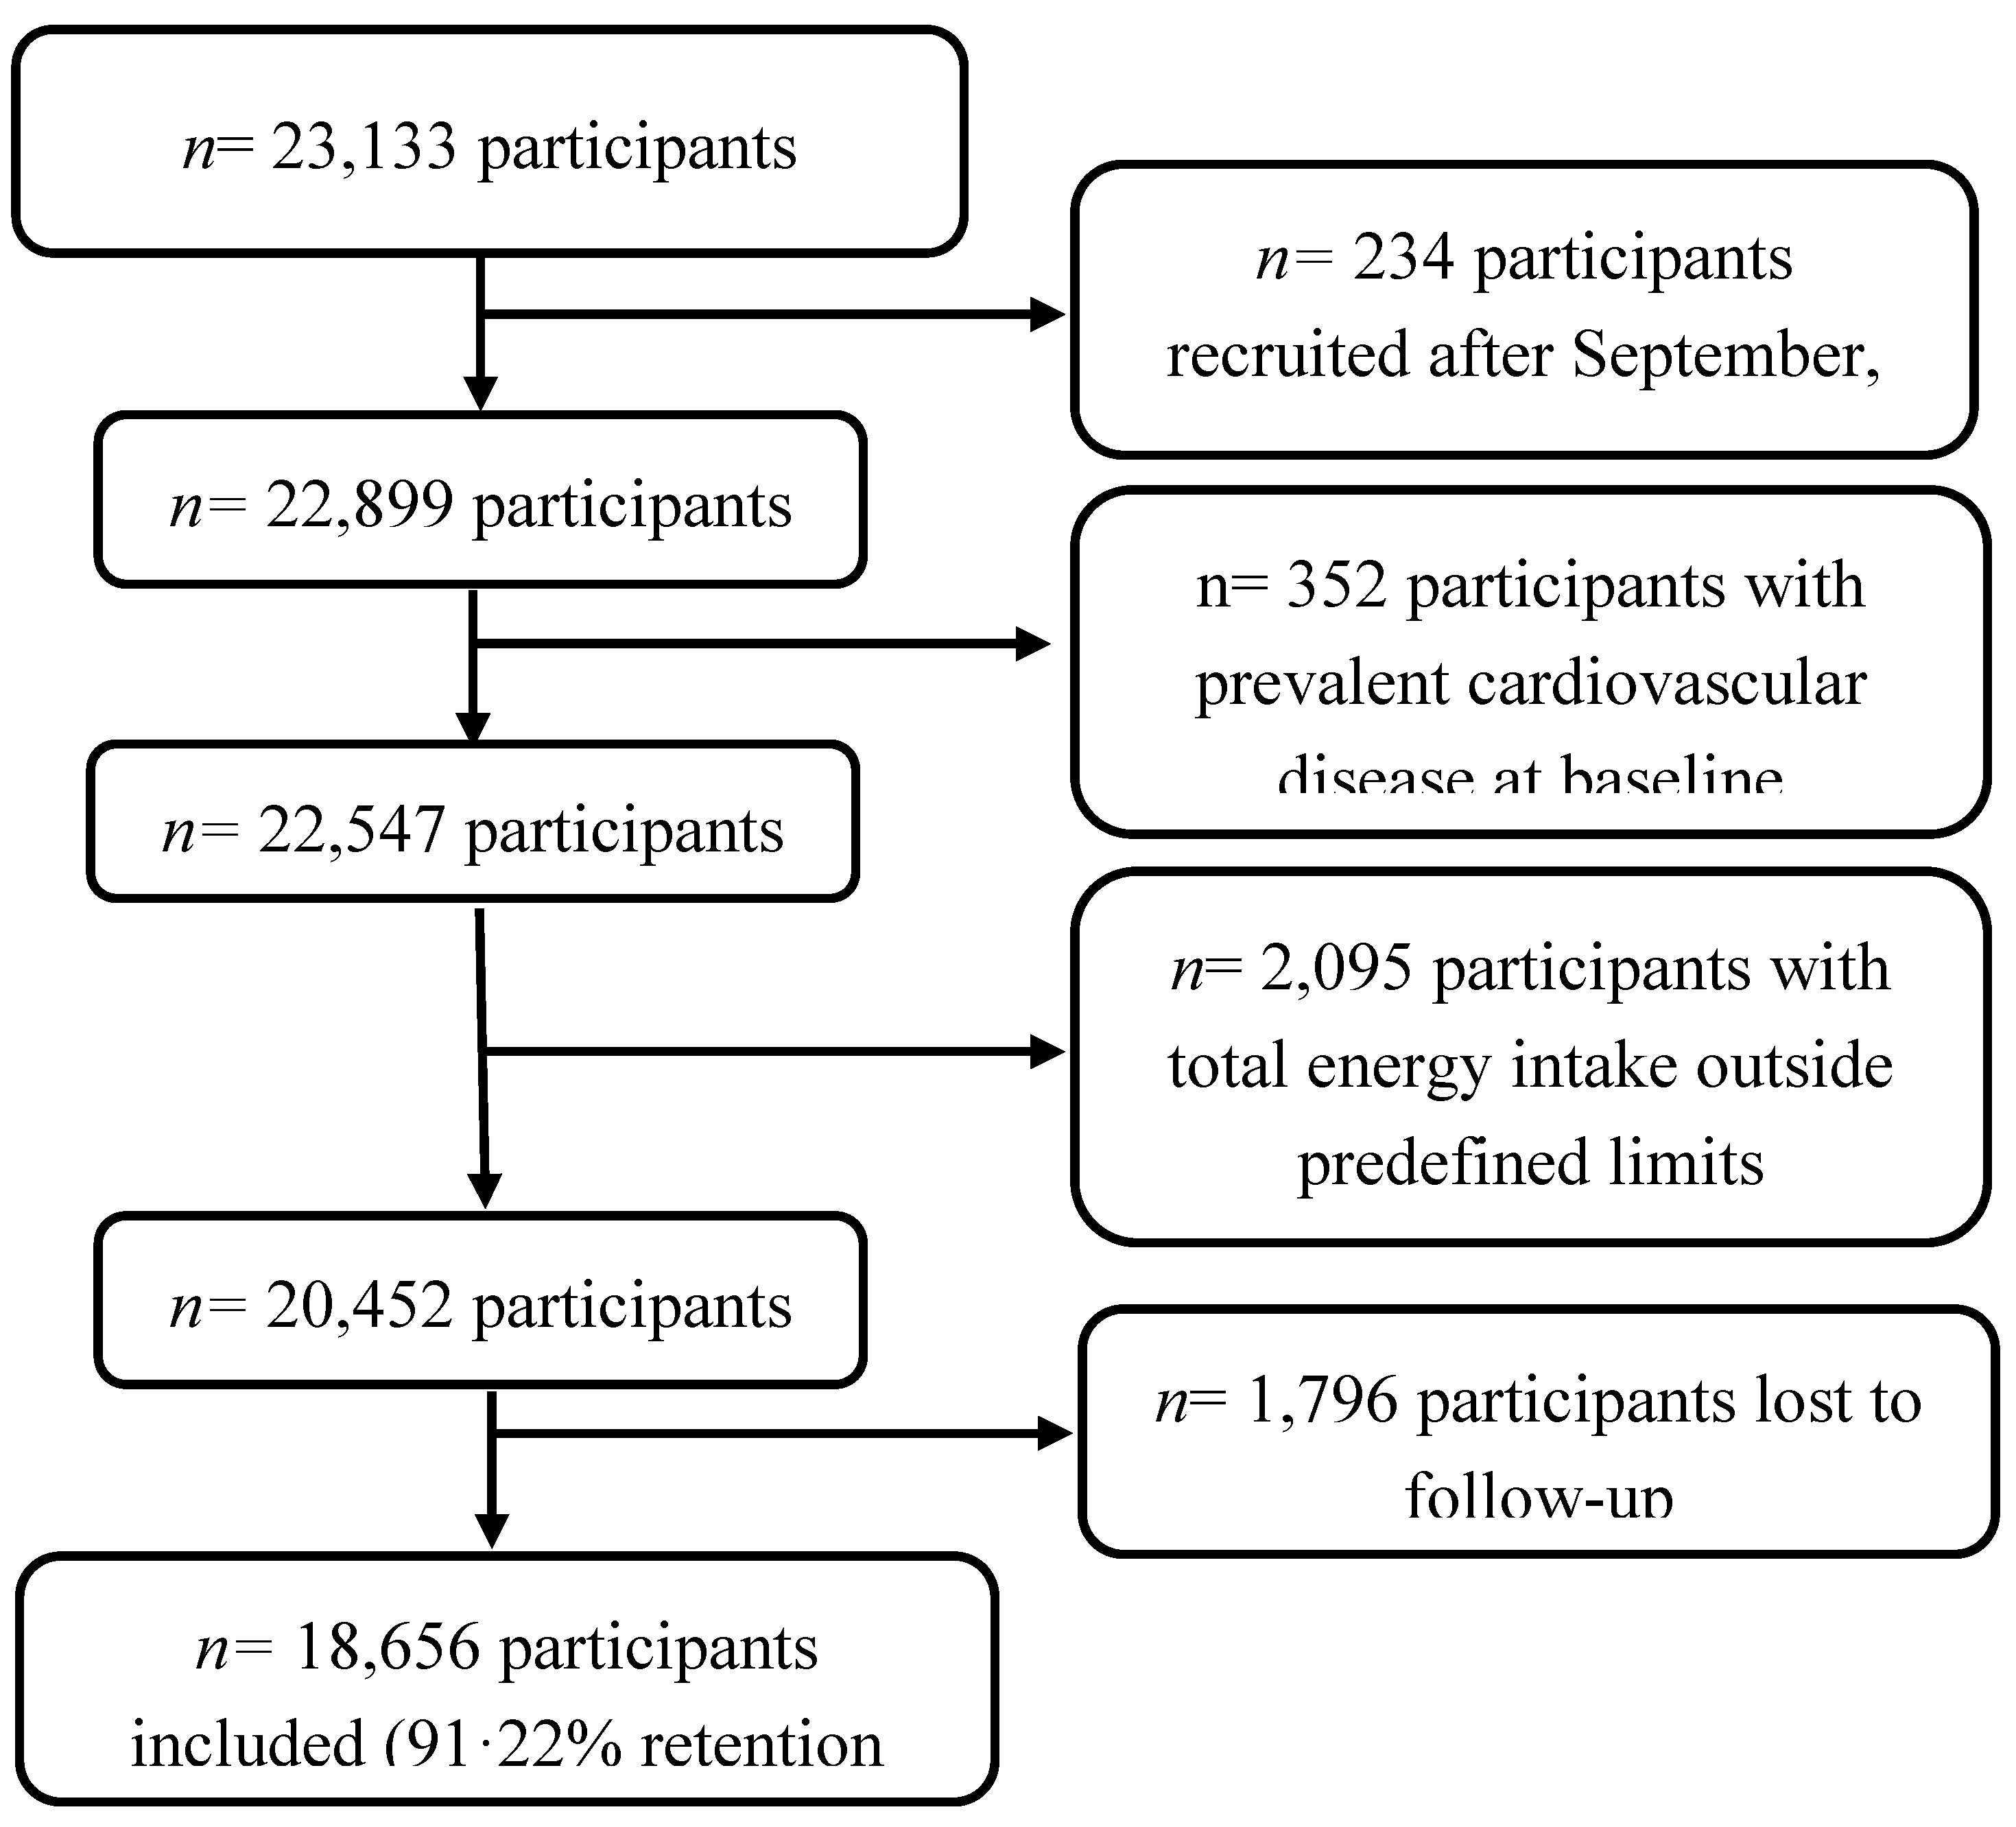
Table 1.
Baseline characteristics of participants according to quartiles of the adherence to the Planetary Health Diet in the SUN project1.
Table 1.
Baseline characteristics of participants according to quartiles of the adherence to the Planetary Health Diet in the SUN project1.
| Q1 | Q2 | Q3 | Q4 | |
|---|---|---|---|---|
| n (frequency) | 4,758 | 6,895 | 3,706 | 3,297 |
| Planetary Health Diet range | 7-18 | 19-21 | 22-23 | 24-37 |
| Planetary Health Diet median | 17 | 20 | 22 | 24 |
| Age | 38.2 (12.4) | 38 (12.1) | 38.1 (12.2) | 38 (12.3) |
| Marital status (%) | ||||
| Single | 50.4 | 45.1 | 40.2 | 38.7 |
| Married | 45.2 | 49.7 | 54.3 | 53.3 |
| Other | 4.6 | 5.2 | 5.5 | 1.0 |
| Smoking (%) | ||||
| Never | 51.9 | 50.1 | 46.3 | 46.2 |
| Current smoker | 23.7 | 22.4 | 21.7 | 18.3 |
| Former smoker | 24.4 | 27.5 | 32.0 | 35.5 |
| Cumulative smoking habit (pack-years) | 5.4 (9.3) | 5.7 (9.4) | 6.6 (10.2) | 7.2 (10.8) |
| Years of university | 5.1 (1.5) | 5.0 (1.5) | 5.1 (1.5) | 5.1 (1.5) |
| Physical activity (METs/h/week) | 20.1 (22.2) | 21.5 (22.3) | 22.5 (23.8) | 24.2 (24.2) |
| BMI (kg/m2) | 23.6 (3.4) | 23.5 (3.5) | 23.7 (3.7) | 23.5 (3.5) |
| Time spent sitting (h/d) | 5.5 (2.0) | 5.3 (2.1) | 5.2 (2.0) | 5.1 (2.1) |
| Watching television (h/d) | 1.6 (1.2) | 1.6 (1.2) | 1.6 (1.2) | 1.5 (1.2) |
| Weight gain of > 3 kg in the last 5 years (%) | 34.5 | 30.1 | 29.7 | 24.4 |
| Snacking between meals (%) | 37.4 | 33.7 | 30.5 | 29.4 |
| Follow-up of special diet (%) | 5.7 | 7.2 | 8.7 | 13.4 |
| Supplements consumption (%) | 17.5 | 18.1 | 18.6 | 22.4 |
| Prevalent diseases (%) | ||||
| Diabetes | 1.0 | 1.5 | 1.9 | 3.3 |
| Hypertension | 8.5 | 9.8 | 12.5 | 12.6 |
| Dyslipemia | 5.8 | 6.0 | 7.4 | 8.1 |
| Depression | 10.6 | 11.1 | 11.5 | 13.8 |
| Cancer | 2.2 | 2.4 | 2.8 | 3.7 |
| Trichopoulou MDS [31], (range, 0-9) | 3.0 (1.5) | 4.1 (1.6) | 4.8 (1.6) | 5.6 (1.5) |
| MEDAS [32], (range, 0-14) | 4.9 (1.6) | 5.9 (1.6) | 6.4 (1.7) | 7.3 (1.8) |
| Provegetarian score [47], (range, 12-60) | 32.2 (4.3) | 35.4 (4.0) | 37.8 (3.9) | 40.8 (4.2) |
1Values are expressed in Means (SD) or Percentages. METs metabolic equivalents, BMI body mass index, MDS Mediterranean Diet Score, MEDAS Mediterranean Diet Adherence Screener.
Table 2.
Dietary baseline characteristics according to quartiles of the Planetary Health Diet among participants in the SUN cohort.
Table 2.
Dietary baseline characteristics according to quartiles of the Planetary Health Diet among participants in the SUN cohort.
| Q1 | Q2 | Q3 | Q4 | |
|---|---|---|---|---|
| n (frequency) | 4,758 | 6,895 | 3,706 | 3,297 |
| Planetary Health Diet range | 7-18 | 19-21 | 22-23 | 24-37 |
| Food (g/d) | ||||
| Vegetables | 394.7 (268.9) | 528.9 (314.3) | 583.9 (335.8) | 667.1 (415.3) |
| Fruits | 171.9 (164.6) | 276.5 (219.2) | 347.4 (267.6) | 412.2 (316.6) |
| Unsaturated oils1 | 17.6 (13.6) | 22.3 (15.6) | 25.2 (16.7) | 28.2 (18.3) |
| Olive oil | 13.3 (11.7) | 17.9 (14.0) | 21.1 (15.5) | 24.4 (17.1) |
| Legumes | 18.8 (13.7) | 22.1 (15.8) | 24.1 (17.7) | 28.8 (25.4) |
| Nuts | 4.6 (6.1) | 6.0 (8.6) | 7.8 (11.7) | 14.6 (19.8) |
| Cereals | 97.0 (70.7) | 100.2 (71.0) | 101.8 (70.4) | 110.8 (78.6) |
| Whole grains | 5.4 (15.0) | 9.9 (24.1) | 15.3 (33.2) | 29.0 (49.0) |
| Fish | 84.3 (55.1) | 97.9 (55.5) | 104.8 (58.7) | 111.4 (73.6) |
| Beef and lamb | 62.8 (33.8) | 56.6 (33.0) | 52.0 (34.3) | 37.9 (34.9) |
| Pork | 81.9 (43.8) | 75.5 (41.9) | 67.0 (41.0) | 52.1 (41.1) |
| Poultry | 51.9 (37.6) | 43.8 (33.0) | 36.2 (29.6) | 29.8 (29.9) |
| Eggs | 28.0 (17.6) | 24.7 (14.6) | 21.0 (15.2) | 15.6 (12.3) |
| Dairy | 506.7 (284) | 431.0 (249) | 381.0 (242.6) | 328.5 (229.7) |
| Potatoes | 69.7 (51.8) | 54.3 (43.5) | 44.2 (38.0) | 37.0 (33.1) |
| Added sugars | 58.3 (30.3) | 45.7 (24.9) | 37.8 (22.4) | 30.9 (21.0) |
| Fast food2 | 28.1 (23.3) | 22.7 (19.8) | 18.7 (19.2) | 15.3 (17.6) |
| Energy and nutrients | ||||
| Energy (kcal/d) | 2434 (651) | 2352 (610) | 2277 (582) | 2248 (586) |
| Carbohydrates (% TEI) | 42.7 (7.1) | 43.1 (7.0) | 43.5 (7.5) | 45.1 (8.6) |
| Fiber (g/d) | 17.7 (7.3) | 21.8 (8.3) | 24.3 (9.5) | 29.2 (12.1) |
| Proteins (% TEI) | 18.5 (3.5) | 18.5 (3.3) | 18.3 (3.1) | 17.5 (3.4) |
| Fats (% TEI) | 36.9 (6.0) | 36.4 (6.3) | 36.1 (6.8) | 35.2 (7.7) |
| MUFAs | 15.4 (3.1) | 15.7 (3.6) | 16.0 (4.0) | 16.2 (4.5) |
| PUFAs | 5.3 (1.6) | 5.1 (1.5) | 5.1 (1.6) | 5.2 (1.7) |
| n-3 fatty acids (g/d) | 2.5 (1.3) | 2.6 (1.2) | 2.5 (1.1) | 2.6 (1.2) |
| n-6 fatty acids (g/d) | 20.0 (13.6) | 18.0 (11.8) | 16.7 (10.89 | 15.6 (11.3) |
| SFAs | 13.8 (3.1) | 12.8 (3.0) | 12.0 (2.9) | 10.6 (3.1) |
| TFAs | 0.4 (0.2) | 0.4 (0.2) | 0.3 (0.2) | 0.3 (0.2) |
| Cholesterol (mg/d) | 473.4 (155.7) | 432.4 (142.4) | 388.1 (128.7) | 325.4 (126.9) |
| Alcohol (g/d) | 6.3 (10.2) | 6.7 (10.3) | 6.9 (10.0) | (9.6) |
1Including olive oil. 2Including hamburgers, pizza and sausages. % TEI total energy intake, PUFA polyunsaturated fatty acids, MUFA monounsaturated fatty acids, SFA saturated fatty acids, TFA trans fatty acids, n-6 fatty acids omega 6 fatty acids, n-3 fatty acids omega-3 fatty acids.
Table 3.
Hazard ratios (HR) and 95% confidence intervals (CI) for the association between Planetary Health Diet and the risk of cardiovascular disease at baseline and after 10 years of follow-up in 18,656 participants in the SUN cohort.
Table 3.
Hazard ratios (HR) and 95% confidence intervals (CI) for the association between Planetary Health Diet and the risk of cardiovascular disease at baseline and after 10 years of follow-up in 18,656 participants in the SUN cohort.
| Q1 | Q2 | Q3 | Q4 | p for trend | |
|---|---|---|---|---|---|
| n | 4,758 | 6,895 | 3,706 | 3,297 | |
| PHD range | 7-18 | 19-21 | 22-23 | 24-37 | |
| CVD | 53 | 78 | 44 | 45 | |
| Person-years | 62597.7 | 89631.6 | 48404.5 | 41548.6 | |
| Mortality rate/1000 person years | 0·84 | 0.87 | 0.91 | 1.08 | |
| Model 1 | 1 (Ref.) | 0.98 (0.69-1.40) | 0.75 (0.50-1.13) | 0.74 (0.49-1.12) | 0.081 |
| Model 2 | 1 (Ref.) | 0.97 (0.68-1.39) | 0.76 (0.50-1.15) | 0.78 (0.52-1.19) | 0.150 |
| Model 3 | 1 (Ref.) | 0.98 (0.68-1.40) | 0.74 (0.49-1.12) | 0.77 (0.51-1.18) | 0.127 |
| Cumulative Diet Average1 | |||||
| Planetary Health Diet range | 7-19 | 19.5-21 | 21.5-23 | 23.5-36.5 | |
| CVD cases | 61 | 63 | 49 | 47 | |
| Person-years | 77681.8 | 66065.4 | 54292.8 | 54140.7 | |
| Mortality rate/1000 person years | 0.79 | 0.95 | 0.90 | 1.04 | |
| Model 3 | 1 (Ref.) | 1.18 (0.82-1.70) | 0.88 (0.60-1.31) | 0.82 (0.55-1.23) | 0.229 |
|
1Reapeted measures: cumulative average information of the Planetary Health Diet Index at baseline and after 10 years of follow-up. Ref. reference. Model 1: adjusted for sex, and stratified by age (deciles) and by year entering the cohort. Model 2: additionally adjusted for total energy intake (kcal/d, continuous), educational level (years of higher education, continuous), smoking (never, current, and former smoker), accumulated smoking habit (pack-years, continuous), alcohol intake (g/d, continuous), physical activity (metabolic equivalent-h/week, continuous), snacking between meals (yes/no), body mass index (BMI [kg/m2, linear and quadratic terms, continuous]), time spent sitting (hours/week, continuous), watching television (h/d, continuous) and following a special diet at baseline (yes/no). Model 3: additionally adjusted for family history of CVD (yes/no), and any diagnosis of diabetes (yes/no), hypertension (yes/no), hypercholesterolemia (yes/no), dyslipidemia (yes/no), depression (yes/no), and cancer (yes/no). | |||||
Table 4.
Hazard ratios (HR) and 95% confidence intervals (CI) for the association between Planetary Health Diet and the risk of cardiovascular disease in the SUN cohort. Quartile 4 vs Quartile 1.
Table 4.
Hazard ratios (HR) and 95% confidence intervals (CI) for the association between Planetary Health Diet and the risk of cardiovascular disease in the SUN cohort. Quartile 4 vs Quartile 1.
| N | CVD events | HR (95%CI) | p for trend | |
|---|---|---|---|---|
| Main analyses | ||||
| Main analyses | 18,656 | 220 | 0.77 (0.51-1.18) | 0.127 |
| Sensitivity analyses | ||||
| Only men | 11,312 | 45 | 0.68 (0.24-1.92) | 0.450 |
| Only women | 7,344 | 175 | 0.75 (0.47-1.21) | 0.151 |
| Only <45 years | 13,234 | 41 | 0.86 (0.30-2.47) | 0.680 |
| Only ≥45 years | 5,422 | 179 | 0.80 (0.50-1.27) | 0.170 |
| Only health professionals | 11,980 | 134 | 0.75 (0.44-1.28) | 0.676 |
| Only non-health professionals | 6,676 | 86 | 0.71 (0.36-1.44) | 0.312 |
| Excluding hypertension or hypercholesterolemia at baseline | 14,278 | 86 | 0.81 (0.41-1.57) | 0.420 |
| Energy limits: percentiles 5-95 at baseline | 18,517 | 206 | 0.70 (0.45-1.09) | 0.071 |
| Excluding participants with cancer at baseline | 18,163 | 211 | 0.77 (0.50-1.17) | 0.110 |
| Excluding participants with special diet at baseline | 17,129 | 192 | 0.75 (0.48-1.18) | 0.910 |
| Excluding participants with 30 or more missing values in FFQ | 17,453 | 182 | 0.79 (0.50-1.25) | 0.133 |
| Excluding early cases (first 2 years) | 18,628 | 192 | 0.76 (0.49-1.19) | 0.910 |
| Adjusted for sex, and stratified by age (deciles) and by year entering the cohort, total energy intake (kcal/d, continuous), educational level (years of higher education, continuous), smoking (never, current, and former smoker), accumulated smoking habit (pack-years, continuous), alcohol intake (g/d, continuous), physical activity (metabolic equivalent-h/week, continuous), snacking between meals (yes/no), body mass index (BMI [kg/m2, linear and quadratic terms, continuous]), time spent sitting (hours/week, continuous), watching television (h/d, continuous) and following a special diet at baseline (yes/no), family history of CVD (yes/no), and any diagnosis of diabetes (yes/no), hypertension (yes/no), hypercholesterolemia (yes/no), dyslipidemia (yes/no), depression (yes/no), and cancer (yes/no). | ||||
Disclaimer/Publisher’s Note: The statements, opinions and data contained in all publications are solely those of the individual author(s) and contributor(s) and not of MDPI and/or the editor(s). MDPI and/or the editor(s) disclaim responsibility for any injury to people or property resulting from any ideas, methods, instructions or products referred to in the content. |
© 2024 by the authors. Licensee MDPI, Basel, Switzerland. This article is an open access article distributed under the terms and conditions of the Creative Commons Attribution (CC BY) license (https://creativecommons.org/licenses/by/4.0/).
Copyright: This open access article is published under a Creative Commons CC BY 4.0 license, which permit the free download, distribution, and reuse, provided that the author and preprint are cited in any reuse.


