
Submitted:
18 February 2025
Posted:
19 February 2025
You are already at the latest version
Abstract
Previous research examining the effects of omnivorous and plant-based diets on cardiovascular diseases (CVD) outcomes has produced inconsistent findings, and the importance of diet quality is overlooked. Our study aimed to develop a novel heart-protective diet index to assess the association of a high-quality plant-based diet with CVD incidence and mortality. This study included 192,274 participants in the UK Biobank without CVD at baseline who completed a 24-hour recall Oxford WebQ questionnaire. Using the Oxford WebQ questionnaire, we developed and validated a novel heart-protective diet score (HPDS) based on 22 food groups. Cox proportional hazard models were used to study the associations between HPDS and outcomes. During a median follow-up of 12.3 years, 20,692 CVD events and 1,131 CVD deaths were observed. After adjusting for demographics, Townsend deprivation index, lifestyle, and history of chronic diseases, participants in the top HPDS quartile were at lower risk, compared to those in the bottom quartile, of overall CVD (HR: 0.92 [95%CI: 0.88,0.95]), IHD (HR: 0.88 [95%CI: 0.83,0.93]), MI (HR: 0.82 [95%CI: 0.74,0.90]), and HF (HR: 0.86 [95%CI: 0.78,0.95]). Adherence to a healthy plant-based heart-protective diet rich in non-starchy vegetables, fruits, wholegrains, and fish, is associated with a reduced cardiovascular disease incidence and mortality.
Keywords:
Cardiovascular diseases
; Diet quality
; Incidence
; Mortality
; Plant-based diet
Lay Summaries
Adopting a plant-based heart-protective diet with fish and seafood is associated with a lower risk of cardiovascular disease, ischemic heart disease ad myocardial infarction.
Further studies are needed to evaluate the effect of a plant-based heart-protective diet on cardiovascular health in diverse ethnic populations to validate our findings and enhance their generalizability.
Introduction
Despite significant progress in the management of cardiovascular diseases (CVDs), they remain the leading cause of disease burden and mortality globally[1]. A key contributing factor to the heightened risk of CVDs is a poor-quality diet. In contrast, adherence to heart-healthy dietary patterns has consistently demonstrated a positive impact on cardiovascular health[2,3]. These patterns emphasize the consumption of a wide variety of vegetables, fruits, minimally processed whole grains, healthy protein sources (primarily plant-based, fish, and low-fat dairy products), and liquid plant oils. Additionally, they discourage the intake of red meat, highly processed foods that are rich in empty calories and unhealthy fats, added salt and sugars, and alcohol[2-4].
Previous research examining the effects of omnivorous and plant-based diets on CVD outcomes has produced inconsistent findings. Some studies have suggested that incorporating fish into a plant-based diet, as seen in the pesco-vegetarian diet, may provide protection against CVD outcomes[5,6]. However, conflicting results have indicated no significant difference or even an elevated risk of CVD among pesco-vegetarians and lacto-ovo-vegetarians, respectively[7,8].
Several studies failed to take into account the importance of diet quality, which is a critical factor to influence cardiometabolic health. Individuals adhering to "unhealthy" plant-based diets that prioritize refined grains, high-sodium preserved vegetables, deep-fried foods, and sweetened beverages have an elevated CVD risk and mortality[9,10]. Moreover, certain prospective studies relied on dietary questionnaires with only four questions to determine participants' vegetarian status and classify them into various diet groups. To address this research gap, a thorough evaluation of diet quality is warranted.
Diet quality indices are commonly used by researchers in observational studies to assess the quality of plant-based diets [10,11]. Marchese et al.[12] recently reviewed 35 plant-based diet quality indices, of which 19, 9 and 5 indices were developed based on food frequency questionnaire (FFQ), semi-FFQ and 24hr recall, respectively. To allow a thorough evaluation of diet quality, detailed dietary data is needed to reflect individuals’ adherence to a plant-based diet. Previously validated plant-based diet index[9,13] (hPDI and uPDI) only evaluates the quality of plant-based food items but assigns all animal food items negative scores. Only three indices (Comprehensive Diet Quality Index (cDQI) [14], Diet Quality Index Associated to the Digital Food Guide (DQI-DFG) [15], and Global Diet Quality Score (GDQS) [16]) consider healthiness of both animal-based and plant-based foods. However, discrepancies in categorization of food groups among these scores are identified in red meats, eggs, processed meats, full-fat dairy products, tubers and roots, refined carbohydrates and sugars and sweets. Yet, none of these scores fully reflect the diet recommended by American Heart Association (AHA), the Australian Heart Foundation (AHF) and European Society of Cardiology (ESC)/ European Atherosclerosis Society (EAS) guidelines[17-19]for the prevention and management of CVD.
To overcome some of these limitations, we developed and validated a novel healthy plant-based heart-protective diet score (HPDS) that considered 22 different food groups to evaluate the overall quality of the diet and explore whether adherence to this diet could potentially lower the risk of cardiovascular events among individuals in the UK Biobank (UKBB) population.
Methods
Study Population
The UK Biobank is an extensive prospective cohort study conducted within the general population, which enrolled over 500,000 individuals aged 40-69 years from 2006 to 2010[20].
A detailed description of dietary data collection and the Oxford WebQ[21] can be found in supplementary methods. In the present study, we used data collected by the Oxford WebQ (24-hour dietary measurement). We included participants (n=192,274) who: (i) had completed at least one Oxford WebQ between 2009 and 2012, and (ii) had relevant clinical records and death registry data available to measure our outcomes of interest (described below). Individuals excluded from our study are described in the supplement and Table S4.
We calculated the “heart-protective diet score at baseline” and the “averaged heart-protective diet score” based on repeated measurements and found a moderate correlation (Pearson correlation coefficient=0.53; p-value <0.001) between them. Sensitivity analyses were further conducted using 24hr recall data from the first three occasions and results were almost identical to the findings generated from the single 24hr recall (Table S1-S3). Therefore, for participants who completed the dietary measurement multiple times, we used the earliest data to maximize the follow-up duration.
Measurement of Dietary Intake and Development of the Plant-Based Heart-Protective Diet Scores
Diet quality is essential in cardiovascular prevention and management, which has been emphasised by multiple international CVD clinical guidelines, including ESC/EAS[17-19], American College of Cardiology (ACC)/AHA, and AHF[22]. These guidelines consistently recommend a predominately healthy plant-based diet, rich in a diverse range of vegetables, fruits, whole grains, nuts, healthy protein sources (such as legumes and fish), while they discourage the consumption of red meats, sweets, added sugars and added salt. To assess the effect of adherence to such diet on cardiovascular outcomes, a thorough evaluation of diet quality is warranted.
Diet quality indices are commonly used by researchers to assess the quality of plant-based diets[10,11]. Both FFQ and 24hr recall are commonly used dietary assessment approaches. However, as highlighted by Nutritools and Dietary Assessment Guidelines[23], short FFQs are not reliable for evaluating total diet. To allow a thorough evaluation , detailed dietary data is needed to reflect individuals’ adherence to a plant-based diet. Table S5 and supplementary methods summarize the current main plant-based diet quality indices utilizing data from 24hr recall, and explain the rationale of development of a novel heart-protective diet score.
To address the current research gaps in plant-based diets and cardiovascular events, a new score designed specifically for cardiovascular health incorporating current guidelines recommendations is warranted. We therefore developed a "heart-protective diet score" (HPDS) based on a previously validated plant-based diet index[9,13]. Our HPDS additionally assesses the healthiness of animal-based foods following the most updated dietary recommendations in the management of cardiovascular health with strong evidence base. These include 2021 ACC/AHA, AHF, ESC/EAS guidelines and the Global Burden of Disease Nutrition and Chronic Disease Expert Group[22]. This scoring system was developed based on existing evidence[24,25] regarding the associations between specific foods and nutrients and their impact on cardiometabolic outcomes. The HPDS emphasizes the consumption of a diverse range of vegetables, fruits, whole grains, nuts, healthy protein sources (such as legumes and fish), while it discourages the consumption of red meats, sweets, added sugars and added salt. Alcoholic beverages are not included in the HPDS given mixed evidence of their associations related to different health outcomes. To derive the HPDS, we categorized the food and drink items into 22 food groups (Table 1) and ranked consumption into quintiles. A detailed description of the calculation of HPDS, as well as the validity and reliability (including construct validity, criterion validity, reliability and content validity) were evaluated and described in the supplementary materials.
Cardiovascular Disease Incidence and Death
The primary outcomes included the CVD incidence and mortality. We defined CVD outcomes based on the earliest diagnosis recorded according to the International Classification of Disease 10th revision (ICD10) (see Table S10) for the following conditions: i) ischemic heart disease (IHD), ii) myocardial infarction (MI), iii) stroke, iv) heart failure, and v) arrhythmia and conduction disorders including atrial fibrillation. To ascertain these diagnoses, we obtained data from linked sources including hospital admissions, primary care records, death registries and self-reported codes (Table S10) [26-29]. Furthermore, we incorporated diagnoses for MI, stroke, and IHD obtained from the Electronic Health Records (EHRs) maintained by General Practitioners in primary care[30]. Participants were followed up from the date of their initial assessment (March 2006 to October 2010), until the date of outcome diagnosis, date of death, date of loss to follow-up, or the end of follow-up (31 December 2021), whichever came first.
Cardiometabolic Outcomes
Secondary outcomes included incidence of CVD risk factors: i) overweight/obesity; ii) hypertension; iii) hyperlipidaemia; and iv) hyperglycaemia or type II diabetes mellitus (T2DM). Similar to the primary outcomes, the diagnoses for these conditions were obtained using the same methods as described earlier, and self-reported disease status supplemented hypertension and T2DM (Table S10)[28,31-34]. Moreover, diagnoses for hypertension and T2DM were also extracted from the EHRs[30]. We excluded participants who had prevalent cases of overweight and obesity (n=3,799), hypertension (n=42,788), hyperglycemia or T2DM (n=3,535), and hyperlipidemia (n=189) at the time of recruitment. We then calculated person-years as previously described for the primary outcomes.
Statistical Analysis
Characteristics of the cohort within quartiles of HPDS were reported for continuous (mean (standard deviation [SD])) and categorical variables (%). Cox proportional hazard regression models, with age at recruitment as the underlying timescale, were implemented to estimate hazard ratios (HRs) and 95% confidence intervals (CIs) for the associations between HPDS in quartiles with primary and secondary outcomes. Linear trend was tested keeping HPDS in the model as a continuous variable. To account for confounding, the model was adjusted for variables associated with both diet consumption and CVD risk, including sex, ethnicity, sociodemographic factors, lifestyle (e.g., physical activity, smoking habits), history of hyperglycaemia/T2DM diagnosis and history of cancer diagnosis. A thorough description of covariates can be found in the supplementary methods. Potential multicollinearity of covariates was tested, and the highest correlation is 0.33 between education and income. Therefore, multicollinearity is not a concern. The proportional hazard assumption was checked by tests based on Schoenfeld residuals, and stratification factors were applied to confounders not respecting the assumption, i.e., p<0.05. To provide information of the impact of each food group on CVD incidence and mortality, we further implemented the same Cox model considering each food group as a variable in the model. Sensitivity analyses were performed excluding self-reported diagnoses. As secondary analyses, we examined whether sex and Townsend deprivation index (TDI) modified the association between HPDS and primary/secondary outcomes using multiplicative interaction terms. For significant interactions, subgroup analyses were conducted stratifying by sex and TDI median value. To account for multiple testing, we applied a False Discovery Rate (FDR) of 0.05 with Benjamini-Hochberg adjustment. Missing data for confounding variables were imputed using multiple imputations with predictive mean matching method on ten datasets. Rubin’s rule was used to aggregate the results and obtain HRs with 95%CIs. RStudio 2022.02.2+485 was used for all analyses.
Results
Sociodemographic and Dietary Characteristics of Participants
A total of 192,274 participants (mean age: 56.3±7.9 years, 43.3% males) were included (Table 2; Figure S1). During a median follow-up period of 12.3 years (interquartile range: 11.7, 13.2), we documented 20,692 (10.8%) incident cases of CVD (Figure 1: 11241 IHD, 3452 MI, 3103 stroke, 3189 HF and 8913 AF) with an average age at diagnosis of 67.5±7.4 years. 1131 participants (0.59%) died from CVD (Figure 2: 513 IHD, 292 MI, 351 stroke, 141 HF). Table 2 shows participants’ characteristics for quartiles of HPDS. The calculated HPDS had a normal distribution (Figure S2), with a mean value of 2.78±7.60 (ranging from -30.00 to 36.92). Individuals with higher HPDS were older, more likely to be female, non-current smokers, physically active, had a higher likelihood of having a university degree, higher income, and were more likely to take dietary supplements, demonstrating the construct validity of HPDS in differentiating populations by sociodemographic characteristics.
Table 3 shows food groups and nutrient intake by quartiles of HPDS. Compared to Q1, individuals with the highest HPDS consumed more non-starchy vegetables, fruits, wholegrains, legumes and beans, uncoated fish and seafood, and tea & other low-calorie drinks, resulting in a lower intake of energy (-200kcal/d), total fat (-10g/d), saturated fat (-8g/d) and sodium (-310mg/d, 15% lower), and a higher intake of dietary fibre (+8g/d), vitamins (vitamin C, folate, beta carotene, vitamin E, and vitamin B12) and minerals (potassium, magnesium, and iron). These results illustrate the construct validity of HPDS that HPDS is positively correlated with the intake of key health-promoting nutrients and food groups. In contrast, individuals with the lowest HPDS consumed more refined grains and cereals, meat, poultry & processed meat, and sweets, desserts, cookies & pastries.
Higher Healthy Plant-Based Diet Score Is Associated with Lower Cardiovascular Diseases Incidence and Mortality
The pooled results from the Cox proportional hazard models are presented in Figure 1, Figure 2, Table S10, and Table S10. Individuals in the highest HPDS quartile (Q4) experienced a lower CVD incidence (Figure 1; HR=0.92 [95%CI:0.88,0.95]; p-value for linear trend <0.001). Specifically, compared to Q1, the highest HPDS was associated with an 18% decreased risk of MI incidence (HR=0.82 [95%CI:0.74 0.90]; p-value for linear trend <0.001), a 14% decreased risk of HF incidence (HR=0.86 [95%CI:0.78,0.95]; p-value for linear trend=0.003), and a 12% decreased risk of IHD incidence (HR=0.88 [95%CI:0.83,0.93]; p-value for linear trend <0.001). These findings demonstrated the criterion validity of our HPDS.
A stronger protective association was observed for individuals in the highest HPDS quartile (Q4) compared to Q1 for CVD mortality outcomes. This included a 28% decreased risk in overall CVD mortality (Figure 2; HR=0.72 [95%CI:0.61,0.86]; p-value for linear trend=0.003), a 49% decreased risk in HF mortality (HR=0.51 [95%CI:0.30,0.85]; p-value for linear trend=0.066), a 35% decreased risk in MI mortality (HR=0.65 [95%CI:0.46,0.91]; p-value for linear trend=0.070), and a 32% decreased risk in IHD mortality (HR=0.68 [95%CI:0.52,0.89]; p-value for linear trend =0.009).
Higher Healthy Plant-Based Diet Score Is Associated with Lower Incidence of Cardiometabolic Abnormalities
Comparing individuals in the highest HPDS quartile (Q4) to Q1, we observed statistically significant protective associations with cardiometabolic health (Figure 3, Table S11). Specifically, individuals in the highest HPDS quartile (Q4) had a 21% lower risk of being overweight and obese (HR=0.79 [95%CI:0.75,0.84]; p-value for linear trend <0.001). They also had a 14% lower risk of developing hyperlipidemia (HR=0.86 [95%CI:0.77,0.96]; p-value for linear trend=0.001) as well as hyperglycemia and T2DM (HR=0.86 [95%CI:0.81,0.92]; p-value for linear trend <0.001). Additionally, there was a 7% lower risk of developing hypertension (HR=0.93 [95%CI:0.89,0.97]; p-value for linear trend <0.001). These findings suggest that individuals in the highest HPDS quartile have a significantly reduced risk of experiencing cardiometabolic abnormalities compared to those in the lowest quartile.
Moderation Effects of Sex and Townsend Deprivation Index, and Sensitivity Analyses
In our analysis, we identified statistically significant statistical multiplicative interactions (p<0.05 after multiple testing correction) between HPDS and sex, as well as between HPDS and the TDI, for various cardiometabolic outcomes and atrial fibrillation incidence. When stratifying the data by sex (Figure S3; Table S12), we observed a stronger protective association for females with higher HPDS values compared to males across several outcomes. Females had a 27% lower risk of overweight and obesity incidence compared to a 10% lower risk in males. Similarly, females had a 27% lower risk of hyperglycemia and T2DM incidence, while no statistically significant effect was observed in males. These results suggest that a healthy plant-based diet may have a more pronounced beneficial impact on these outcomes for females. When stratifying the analysis by the median value of the Townsend deprivation index (2.6) (Figure S4; Table S12), we found that higher HPDS values had a slightly stronger protective association with overweight/obesity and hypertension diagnoses in the less deprived subgroup. Conversely, higher HPDS values showed a higher protective association with hyperglycemia and T2DM diagnosis in the more deprived subgroup. Furthermore, sensitivity analyses comparing outcomes with and without self-reported diagnoses (Figure S5; Table S13) yielded consistent findings, indicating the robustness of our results. Finally, in Table S14 we reported the associations between each of the 22 food groups with CVD incidence and mortality.
Discussion
Previous validated plant-based diet indexes only evaluate the healthiness of plant-based foods but assigned negative score to animal-based foods. To the best of our knowledge, only three indexes include the evaluation of animal-based foods, but their categorization did not fully reflect the clinical guidelines and recommendations by the AHA, HF and ESC/EAS. To address this and evaluate the effect of following the recommended diet in the risk of developing cardiovascular outcomes, we have developed and validated a novel plant-based diet index, which utilizes detailed dietary data and assigns positive scores to fish and seafood, eggs and reduced fat dairy products. In this large cohort study of middle-aged and older adults, a higher adherence to a healthy plant-based heart-protective diet rich in non-starchy vegetables, fruits, whole grains, legumes, and fish was associated with a reduced risk of CVD and lower mortality rates. Those who closely followed this dietary pattern had a 49% lower risk of mortality from heart failure, along with a 32-35% lower risk of mortality from IHD and MI. Additionally, the healthy plant-based diet score was linked to a lower incidence of overweight, hyperlipidemia, hypertension, and hyperglycemia. These findings underscore the potential benefits of adopting a healthy plant-based diet in reducing the risk of CVDs, mortality, and improving overall cardiometabolic health.
Our study demonstrates that a higher adherence to our healthy plant-based diet score leads to a greater reduction in cardiovascular morbidity and mortality compared to previous studies focusing solely on vegetarian and vegan diets[9,35-37]. While vegetarian and vegan diets have shown positive associations with cardiovascular health, the comprehensive nature of our HPDS, which includes a diverse range of plant foods with fish and seafood while limiting processed foods, refined carbohydrates, and unhealthy fats, appears to have even more pronounced effects on cardiovascular and metabolic health. By considering the individual components of the diet and integrating them into a simplified scoring system, the combined impact becomes more evident.
Compared to the Mediterranean diet, which typically includes both refined and whole grains, moderate alcohol intake, and discourages dairy products and potatoes[38], our HPDS highlights the significant impact of a healthy plant-based diet that prioritizes minimally processed foods. Notably, a recent UK Biobank study using the Mediterranean diet score reported only a small 7% reduction in the risk of stroke and no significant effect on MI[39]. In that study, both refined and whole grain cereals were included in the Mediterranean diet score, while discouraging eggs and all dairy products regardless of fat content. Red meats, poultry, organ meats, and processed meats were discouraged but not excluded. In contrast, our HPDS score, aligned with the clinical recommendations, emphasizes the consumption of fish and seafood, eggs, low-fat dairy products, and minimally processed plant-based foods including whole grains and legumes, while excluding red meats, poultry, and processed meat.
Our study found that individuals with the highest HPDS, indicating lower intake of saturated and partially hydrogenated fats, had a reduced risk of CVD events, aligning with previous research linking animal and ultra-processed food consumption, as well as saturated and trans-fat intake, to the development of IHD[40,41]. The highest HPDS, characterized by a rich dietary fiber and sterols content, lower energy density, and favorable nutrient profile, positively impacted serum cholesterol levels, glycemic control, body weight, and other cardiometabolic markers[42-44]. Increased fish consumption in the highest HPDS provided beneficial long-chain omega-3 fatty acids associated with a reduced risk of IHD[45,46]. The differences in protein sources between the lowest and highest HPDS further supported these findings, with plant-based proteins associated with a lower risk of obesity and T2DM compared to animal protein rich in branched-chain amino acids[47]. Additionally, the higher intake of potassium, magnesium, folate, beta-carotene, vitamin C, E, and B12, coupled with lower sodium intake without compromising zinc intake, may further promote cardiometabolic health. This underscores the importance of overall diet quality in promoting cardiovascular health, beyond just focusing on fish consumption or excluding meats.
In our study, we did not find a significant effect of a healthy plant-based diet on stroke incidence or mortality, which is consistent with previous findings[5-7,48]. Tong et al.[6] reported a 43% higher risk of hemorrhagic stroke among vegetarians, even after adjusting for cardiometabolic risk factors. This association could potentially be attributed to the relatively low levels of LDL-cholesterol among the vegetarian participants in Tong's[6] and other prospective studies[45,49]. It is hypothesized that low LDL-cholesterol concentrations may contribute to the necrosis of smooth muscle cells in the arterial wall's medial layer, resulting in impaired endothelium and increased susceptibility to microaneurysms, ultimately increasing the risk of hemorrhage[45].
Our study has significant strengths, including the use a large prospective cohort study with extensive data collection and long-term follow-up. We developed and validated a novel diet index, the Heart-Protective Diet Score, based on the clinical guidelines, which comprehensively evaluates diet quality. The use of detailed and accurate 24-hour dietary data minimized misclassification of diet types, setting our study apart from other UK Biobank studies[5-7,50]. Our outcome assessment methods were robust, including medical record linkage and sensitivity analyses. Notably, the baseline cardiometabolic profiles were comparable across different HPDS quartiles, reducing potential confounding from cardiovascular risk factors. However, there are limitations to consider, such as the predominantly Caucasian study population, which may limit generalizability to other ethnic groups. Also, the use of a single 24-hour recall inevitably results in the measurement error of long-term intake and intra-individual variations. However, to address this, we calculated the HPDS at baseline and the “averaged heart-protective diet score” based on repeated measurements and found a moderate correlation between them. We conducted further sensitivity analyses and confirmed the results generated from multiple 24hr recalls were almost identical to findings from the single 24hr recall. This finding is supported by another study [51]demonstrating good agreement for all foods intakes in the UK Biobank cohort who completed 24-hour recall more than once, with a substantial agreement for fish, meat, vegetable and fruit intakes after 4 years. In addition, as an observational study, we cannot establish causality, and there is a possibility of residual confounding from both dietary and non-dietary factors. Nevertheless, we have adjusted our analysis for several potential confounders related to lifestyle and health-conscious behaviors which may have influenced the observed cardiovascular outcomes.
Conclusions
In summary, findings from this large prospective cohort study revealed a robust link between adherence to a healthy diet score based on the 2021 AHA/ACC guidelines and a substantial decrease in cardiovascular mortality and morbidity, particularly for HF and IHD. These findings emphasize the significance of overall dietary quality in relation to cardiometabolic health, rather than focusing exclusively on specific diet types. Further research in diverse ethnic populations is necessary to validate our findings and enhance their generalizability.
Supplementary Materials
The following supporting information can be downloaded at the website of this paper posted on Preprints.org.
Author Contributions Statement
TW, AN, LB, and LF conceived and designed the study; TW designed and developed the heart-protective score; TW, AN, TF, and LF designed the analysis; TW and AN analysed the data; TW, AN, LF and WW drafted the manuscript; LF, WW, KL, LB, SC, CK, AA and TF supervised the study. All authors contributed to critical revision to the manuscript. TW and AN are the guarantors. The corresponding author attests that all listed authors meet authorship criteria and that no others meeting the criteria have been omitted.
Funding/Support
Authors are supported by grants from the Australian NHMRC Investigator Grant, Australian Youth and Health Foundation and Philip Bushell Foundation.
Role of the Funders/Sponsors
The Australian NHMRC Investigator Grant, Australian Youth and Health Foundation and Philip Bushell Foundation had no role in the design and conduct of the study; collection, management, analysis, and interpretation of the data; preparation, review, or approval of the manuscript; and decision to submit the manuscript for publication.
Competing interests
All authors have completed and submitted the ICMJE Form for Disclosure of Potential Conflicts of Interest, and none were reported.
Ethical approval
UK Biobank received ethical approval from the research ethics committee (reference 13/NW/0382). This study complies with the Declaration of Helsinki. All individuals had provided written informed consent to participate in the study.
Data Availability Statement
We have our data ready to be accessed upon reasonable requests and please note the UK Biobank study requires investigators to register in the project to access the data which are not publicly available. The cardiovascular outcomes and dietary UK Biobank data are available on application to the UK Biobank. This research has been conducted using the UK Biobank Resource under Application 62594. R scripts for analyses can be accessed via the online repository (https://github.com/sylviawt/HPDS_UKBB. DOI: 10.5281/zenodo.8115595). The manuscript’s guarantors (TW and AN) affirm that the manuscript is an honest, accurate, and transparent account of the study being reported; that no important aspects of the study have been omitted; and that any discrepancies from the study as planned (and, if relevant, registered) have been explained.
Dissemination to participants and related patient and public communities
All authors will work with their home institutions to leverage their unique dissemination platforms including social media communication and organizational websites.
Disclosures
The authors have reported that they have no relationships relevant to the contents of this paper to disclose. All authors have completed and submitted the ICMJE Form for Disclosure of Potential Conflicts of Interest, and none were reported.
A short tweet summarizing this paper
We created a novel heart-protective diet index and followed 192274 UK adults free of CVD for a median of 12.3 years. Following a healthy plant-based diet reduced incidence of cardiovascular disease, ischaemic heart disease and myocardial infarction by 8%, 12%, and 18%, respectively. #CVD, #PlantBased.
Acknowledgments
This research has been conducted using the UK Biobank Resource under application number 62594.
Abbreviations
| AF | atrial fibrillation |
| BMI | body mass index |
| CVD | cardiovascular disease |
| HF | heart failure |
| HPDS | heart-protective diet score |
| IHD | ischemic heart disease |
| MI | myocardial infarction |
References
- Timmis, A.; Vardas, P.; Townsend, N.; Torbica, A.; Katus, H.; De Smedt, D.; Gale, C.P.; Maggioni, A.P.; Petersen, S.E.; Huculeci, R.; et al. European Society of Cardiology: cardiovascular disease statistics 2021. Eur. Hear. J. 2022, 43, 716–799. [CrossRef]
- Lichtenstein AH, Appel LJ, Vadiveloo M, Hu FB, Kris-Etherton PM, Rebholz CM, Sacks FM, Thorndike AN, Van Horn L, Wylie-Rosett J. 2021 Dietary Guidance to Improve Cardiovascular Health: A Scientific Statement From the American Heart Association. Circulation 2021;144(23):e472-e487.
- Tosti, V.; Bertozzi, B.; Fontana, L. Health Benefits of the Mediterranean Diet: Metabolic and Molecular Mechanisms. J. Gerontol. Ser. A 2018, 73, 318–326. [CrossRef]
- Lloyd-Jones DM, Hong Y, Labarthe D, Mozaffarian D, Appel LJ, Van Horn L, Greenlund K, Daniels S, Nichol G, Tomaselli GF, Arnett DK, Fonarow GC, Ho PM, Lauer MS, Masoudi FA, Robertson RM, Roger V, Schwamm LH, Sorlie P, Yancy CW, Rosamond WD. Defining and setting national goals for cardiovascular health promotion and disease reduction: the American Heart Association's strategic Impact Goal through 2020 and beyond. Circulation 2010;121(4):586-613.
- Petermann-Rocha, F.; Parra-Soto, S.; Gray, S.; Anderson, J.; Welsh, P.; Gill, J.; Sattar, N.; Ho, F.K.; Celis-Morales, C.; Pell, J.P. Vegetarians, fish, poultry, and meat-eaters: who has higher risk of cardiovascular disease incidence and mortality? A prospective study from UK Biobank. Eur. Hear. J. 2021, 42, 1136–1143. [CrossRef]
- Tong, T.Y.N.; Appleby, P.N.; Bradbury, K.E.; Perez-Cornago, A.; Travis, R.C.; Clarke, R.; Key, T.J. Risks of ischaemic heart disease and stroke in meat eaters, fish eaters, and vegetarians over 18 years of follow-up: results from the prospective EPIC-Oxford study. BMJ 2019, 366, l4897. [CrossRef]
- Appleby PN, Crowe FL, Bradbury KE, Travis RC, Key TJ. Mortality in vegetarians and comparable nonvegetarians in the United Kingdom. Am J Clin Nutr 2016;103(1):218-30.
- Key, T.J.; Appleby, P.N.; Spencer, E.A.; Travis, R.C.; Roddam, A.W.; Allen, N.E. Mortality in British vegetarians: results from the European Prospective Investigation into Cancer and Nutrition (EPIC-Oxford). Am. J. Clin. Nutr. 2009, 89, 1613S–1619S. [CrossRef]
- Satija, A.; Bhupathiraju, S.N.; Spiegelman, D.; Chiuve, S.E.; Manson, J.E.; Willett, W.; Rexrode, K.M.; Rimm, E.B.; Hu, F.B. Healthful and Unhealthful Plant-Based Diets and the Risk of Coronary Heart Disease in U.S. Adults. Circ. 2017, 70, 411–422. [CrossRef]
- Satija, A.; Bhupathiraju, S.N.; Rimm, E.B.; Spiegelman, D.; Chiuve, S.E.; Borgi, L.; Willett, W.C.; Manson, J.E.; Sun, Q.; Hu, F.B. Plant-Based Dietary Patterns and Incidence of Type 2 Diabetes in US Men and Women: Results from Three Prospective Cohort Studies. PLOS Med. 2016, 13, e1002039. [CrossRef]
- Bycroft, C.; Freeman, C.; Petkova, D.; Band, G.; Elliott, L.T.; Sharp, K.; Motyer, A.; Vukcevic, D.; Delaneau, O.; O’connell, J.; et al. The UK Biobank resource with deep phenotyping and genomic data. Nature 2018, 562, 203–209. [CrossRef]
- Liu, B.; Young, H.; Crowe, F.L.; Benson, V.S.; A Spencer, E.; Key, T.J.; Appleby, P.N.; Beral, V. Development and evaluation of the Oxford WebQ, a low-cost, web-based method for assessment of previous 24 h dietary intakes in large-scale prospective studies. Public Health Nutr 2011, 14, 1998–2005. [CrossRef]
- Bradbury, K.E.; Young, H.J.; Guo, W.; Key, T.J. Dietary assessment in UK Biobank: an evaluation of the performance of the touchscreen dietary questionnaire. J. Nutr. Sci. 2018, 7, e6. [CrossRef]
- A Martínez-González, M.; Sánchez-Tainta, A.; Corella, D.; Salas-Salvadó, J.; Ros, E.; Arós, F.; Gómez-Gracia, E.; Fiol, M.; Lamuela-Raventós, R.M.; Schröder, H.; et al. A provegetarian food pattern and reduction in total mortality in the Prevención con Dieta Mediterránea (PREDIMED) study. Am. J. Clin. Nutr. 2014, 100, 320S–328S. [CrossRef]
- Marchese, L.E.; McNaughton, S.A.; Hendrie, G.A.; Wingrove, K.; Dickinson, K.M.; Livingstone, K.M. A scoping review of approaches used to develop plant-based diet quality indices. Curr. Dev. Nutr. 2023, 7, 100061. [CrossRef]
- Nutritools. Strengths and Weaknesses of Dietary Assessment Tools (DATs). https://www.nutritools.org/strengths-and-weaknesses.
- Keaver, L.; Ruan, M.; Chen, F.; Du, M.; Ding, C.; Wang, J.; Shan, Z.; Liu, J.; Zhang, F.F. Plant- and animal-based diet quality and mortality among US adults: a cohort study. Br. J. Nutr. 2020, 125, 1405–1415. [CrossRef]
- Caivano, S.; Colugnati, F.A.B.; Domene, S.M.Á. Diet Quality Index associated with Digital Food Guide: update and validation. Cad. de Saude publica 2019, 35, e00043419. [CrossRef]
- Bromage, S.; Batis, C.; Bhupathiraju, S.N.; Fawzi, W.W.; Fung, T.T.; Li, Y.; Deitchler, M.; Angulo, E.; Birk, N.; Castellanos-Gutiérrez, A.; et al. Development and Validation of a Novel Food-Based Global Diet Quality Score (GDQS). J. Nutr. 2021, 151, 75S–92S. [CrossRef]
- American Heart Association Inc. Available online: http://www.heart.org/ (accessed on May 2020).
- Mach F, Baigent C, Catapano AL, Koskinas KC, Casula M, Badimon L, Chapman MJ, De Backer GG, Delgado V, Ference BA, Graham IM, Halliday A, Landmesser U, Mihaylova B, Pedersen TR, Riccardi G, Richter DJ, Sabatine MS, Taskinen M-R, Tokgozoglu L, Wiklund O, Group ESD. 2019 ESC/EAS Guidelines for the management of dyslipidaemias: lipid modification to reduce cardiovascular risk: The Task Force for the management of dyslipidaemias of the European Society of Cardiology (ESC) and European Atherosclerosis Society (EAS). European Heart Journal 2019;41(1):111-188.
- Heart Foundation. Nutrition Position Statements. https://www.heartfoundation.org.au/bundles/for-professionals/nutrition-position-statements.
- Satija, A.; Bhupathiraju, S.N.; Rimm, E.B.; Spiegelman, D.; Chiuve, S.E.; Borgi, L.; Willett, W.C.; Manson, J.E.; Sun, Q.; Hu, F.B. Plant-Based Dietary Patterns and Incidence of Type 2 Diabetes in US Men and Women: Results from Three Prospective Cohort Studies. PLOS Med. 2016, 13, e1002039. [CrossRef]
- Micha, R.; Shulkin, M.L.; Peñalvo, J.L.; Khatibzadeh, S.; Singh, G.M.; Rao, M.; Fahimi, S.; Powles, J.; Mozaffarian, D. Etiologic effects and optimal intakes of foods and nutrients for risk of cardiovascular diseases and diabetes: Systematic reviews and meta-analyses from the Nutrition and Chronic Diseases Expert Group (NutriCoDE). PLOS ONE 2017, 12, e0175149. [CrossRef]
- Whelton PK, Carey RM, Aronow WS, Casey DE, Collins KJ, Himmelfarb CD, DePalma SM, Gidding S, Jamerson KA, Jones DW, MacLaughlin EJ, Muntner P, Ovbiagele B, Smith SC, Spencer CC, Stafford RS, Taler SJ, Thomas RJ, Williams KA, Williamson JD, Wright JT. 2017 ACC/AHA/AAPA/ABC/ACPM/AGS/APhA/ASH/ASPC/NMA/PCNA Guideline for the Prevention, Detection, Evaluation, and Management of High Blood Pressure in Adults: A Report of the American College of Cardiology/American Heart Association Task Force on Clinical Practice Guidelines. Hypertension 2018;71(6):e13-e115.
- Grundy, S.M.; Stone, N.J.; Bailey, A.L.; Beam, C.; Birtcher, K.K.; Blumenthal, R.S.; Braun, L.T.; de Ferranti, S.; Faiella-Tommasino, J.; Forman, D.E.; et al. 2018 AHA/ACC/AACVPR/AAPA/ABC/ACPM/ADA/AGS/APhA/ASPC/NLA/PCNA Guideline on the Management of Blood Cholesterol: Executive Summary: A Report of the American College of Cardiology/American Heart Association Task Force on Clinical Practice Guidelines. Circulation 2019, 139, E1046–E1081. [CrossRef]
- NHS. The Eatwell Guide. https://www.nhs.uk/live-well/eat-well/food-guidelines-and-food-labels/the-eatwell-guide/ (29th Nov 2022; date last accessed).
- Tan, M.S.; Cheung, H.C.; McAuley, E.; Ross, L.J.; MacLaughlin, H.L. Quality and validity of diet quality indices for use in Australian contexts: a systematic review. Br. J. Nutr. 2021, 128, 2021–2045. [CrossRef]
- Chamoli, R.; Jain, M.; Tyagi, G. Reliability and Validity of the Diet Quality Index for 7–9-year-old Indian Children. Pediatr. Gastroenterol. Hepatol. Nutr. 2019, 22, 554–564. [CrossRef]
- Bolland, M.J.; Barber, A.; Doughty, R.N.; Grey, A.; Gamble, G.; Reid, I.R. Differences between self-reported and verified adverse cardiovascular events in a randomised clinical trial. BMJ Open 2013, 3, e002334. [CrossRef]
- Machón, M.; Arriola, L.; Larrañaga, N.; Amiano, P.; Moreno-Iribas, C.; Agudo, A.; Ardanaz, E.; Barricarte, A.; Buckland, G.; Chirlaque, M.; et al. Validity of self-reported prevalent cases of stroke and acute myocardial infarction in the Spanish cohort of the EPIC study. J. Epidemiology Community Heal. 2012, 67, 71–75. [CrossRef]
- Okura, Y.; Urban, L.H.; Mahoney, D.W.; Jacobsen, S.J.; Rodeheffer, R.J. Agreement between self-report questionnaires and medical record data was substantial for diabetes, hypertension, myocardial infarction and stroke but not for heart failure. J. Clin. Epidemiology 2004, 57, 1096–1103. [CrossRef]
- Eliassen, B.-M.; Melhus, M.; Tell, G.S.; Borch, K.B.; Braaten, T.; Broderstad, A.R.; Graff-Iversen, S. Validity of self-reported myocardial infarction and stroke in regions with Sami and Norwegian populations: the SAMINOR 1 Survey and the CVDNOR project. BMJ Open 2016, 6, e012717. [CrossRef]
- Darke, P.; Cassidy, S.; Catt, M.; Taylor, R.; Missier, P.; Bacardit, J. Curating a longitudinal research resource using linked primary care EHR data—a UK Biobank case study. J. Am. Med Informatics Assoc. 2021, 29, 546–552. [CrossRef]
- Pastorino, S.; Richards, M.; Hardy, R.; Abington, J.; Wills, A.; Kuh, D.; Pierce, M. Validation of self-reported diagnosis of diabetes in the 1946 British birth cohort. Prim. Care Diabetes 2014, 9, 397–400. [CrossRef]
- Schneider, A.L.C.; Pankow, J.S.; Heiss, G.; Selvin, E. Validity and Reliability of Self-reported Diabetes in the Atherosclerosis Risk in Communities Study. Am. J. Epidemiology 2012, 176, 738–743. [CrossRef]
- Jackson, J.M.R.; DeFor, T.A.; Crain, A.L.; Kerby, T.J.M.; Strayer, L.S.M.; Lewis, C.E.M.; Whitlock, E.P.; Williams, S.B.; Vitolins, M.Z.D.; Rodabough, R.J.; et al. Validity of diabetes self-reports in the Women’s Health Initiative. Menopause 2014, 21, 861–868. [CrossRef]
- Moradpour, F.; Piri, N.; Dehghanbanadaki, H.; Moradi, G.; Fotouk-Kiai, M.; Moradi, Y. Socio-demographic correlates of diabetes self-reporting validity: a study on the adult Kurdish population. BMC Endocr. Disord. 2022, 22, 1–10. [CrossRef]
- Chen, H.; Shen, J.; Xuan, J.; Zhu, A.; Ji, J.S.; Liu, X.; Cao, Y.; Zong, G.; Zeng, Y.; Wang, X.; et al. Plant-based dietary patterns in relation to mortality among older adults in China. Nat. Aging 2022, 2, 224–230. [CrossRef]
- Kim, J.; Kim, H.; Giovannucci, E.L. Plant-based diet quality and the risk of total and disease-specific mortality: A population-based prospective study. Clin. Nutr. 2021, 40, 5718–5725. [CrossRef]
- Heianza, Y.; Zhou, T.; Sun, D.; Hu, F.B.; Qi, L. Healthful plant-based dietary patterns, genetic risk of obesity, and cardiovascular risk in the UK biobank study. Clin. Nutr. 2021, 40, 4694–4701. [CrossRef]
- Martínez-González, M.A.; Gea, A.; Ruiz-Canela, M. The Mediterranean Diet and Cardiovascular Health. Circ. Res. 2019, 124, 779–798. [CrossRef]
- Livingstone, K.M.; Abbott, G.; Bowe, S.J.; Ward, J.; Milte, C.; A McNaughton, S. Diet quality indices, genetic risk and risk of cardiovascular disease and mortality: a longitudinal analysis of 77 004 UK Biobank participants. BMJ Open 2021, 11, e045362. [CrossRef]
- Sacks, F.M.; Lichtenstein, A.H.; Wu, J.H.Y.; Appel, L.J.; Creager, M.A.; Kris-Etherton, P.M.; Miller, M.; Rimm, E.B.; Rudel, L.L.; Robinson, J.G.; et al. Dietary Fats and Cardiovascular Disease: A Presidential Advisory From the American Heart Association. Circulation 2017, 136, e1–e23. [CrossRef]
- Mensink, R.P.; Zock, P.L.; Kester, A.D.; Katan, M.B. Effects of dietary fatty acids and carbohydrates on the ratio of serum total to HDL cholesterol and on serum lipids and apolipoproteins: a meta-analysis of 60 controlled trials. Am. J. Clin. Nutr. 2003, 77, 1146–1155. [CrossRef]
- AbuMweis, S.S.; Barake, R.; Jones, P. Plant sterols/stanols as cholesterol lowering agents: a meta-analysis of randomized controlled trials. Food Nutr. Res. 2008, 52. [CrossRef]
- Theuwissen, E.; Mensink, R.P. Water-soluble dietary fibers and cardiovascular disease. Physiol. Behav. 2008, 94, 285–292. [CrossRef]
- Müller, M.; Canfora, E.E.; Blaak, E.E. Gastrointestinal Transit Time, Glucose Homeostasis and Metabolic Health: Modulation by Dietary Fibers. Nutrients 2018, 10, 275. [CrossRef]
- Bjerregaard, L.J.; Joensen, A.M.; Dethlefsen, C.; Jensen, M.K.; Johnsen, S.P.; Tjønneland, A.; Rasmussen, L.H.; Overvad, K.; Schmidt, E.B. Fish intake and acute coronary syndrome. Eur. Hear. J. 2009, 31, 29–34. [CrossRef]
- Strøm M, Halldorsson TI, Mortensen EL, Torp-Pedersen C, Olsen SF. Fish, n-3 fatty acids, and cardiovascular diseases in women of reproductive age: A prospective study in a large national cohort. Hypertension 2012;59(1):36-43.
- Karusheva, Y.; Koessler, T.; Strassburger, K.; Markgraf, D.; Mastrototaro, L.; Jelenik, T.; Simon, M.-C.; Pesta, D.; Zaharia, O.-P.; Bódis, K.; et al. Short-term dietary reduction of branched-chain amino acids reduces meal-induced insulin secretion and modifies microbiome composition in type 2 diabetes: a randomized controlled crossover trial. Am. J. Clin. Nutr. 2019, 110, 1098–1107. [CrossRef]
- Theuwissen, E.; Mensink, R.P. Water-soluble dietary fibers and cardiovascular disease. Physiol. Behav. 2008, 94, 285–292. [CrossRef]
- Müller, M.; Canfora, E.E.; Blaak, E.E. Gastrointestinal Transit Time, Glucose Homeostasis and Metabolic Health: Modulation by Dietary Fibers. Nutrients 2018, 10, 275. [CrossRef]
- Matsumoto, C.; Yoruk, A.; Wang, L.; Gaziano, J.M.; Sesso, H.D. Fish and omega-3 fatty acid consumption and risk of hypertension. J. Hypertens. 2019, 37, 1223–1229. [CrossRef]
Figure 1.
Association between quartiles of heart-protective diet score and risk of incident cardiovascular diseases (n=192,274). Data presented as adjusted hazard ratio [95% confidence interval]. Q1 was used as the reference group. Cox proportional hazard models were adjusted by age (timescale), sex, ethnicity, Townsend deprivation index, average house income, education level, dietary supplement use, history of cancer diagnosis, history of hyperglycemia/type 2 diabetes diagnosis, physical activity level, sitting, sleep quality, smoke habits. CVD, Cardiovascular Disease; IHD, Ischemic Heart Disease; MI, Myocardial Infarction; HF, Heart Failure; AF, Atrial Fibrillation; HR, Hazard Ratio. Adjusted p-values were obtained using Benjamini-Hochberg procedure.
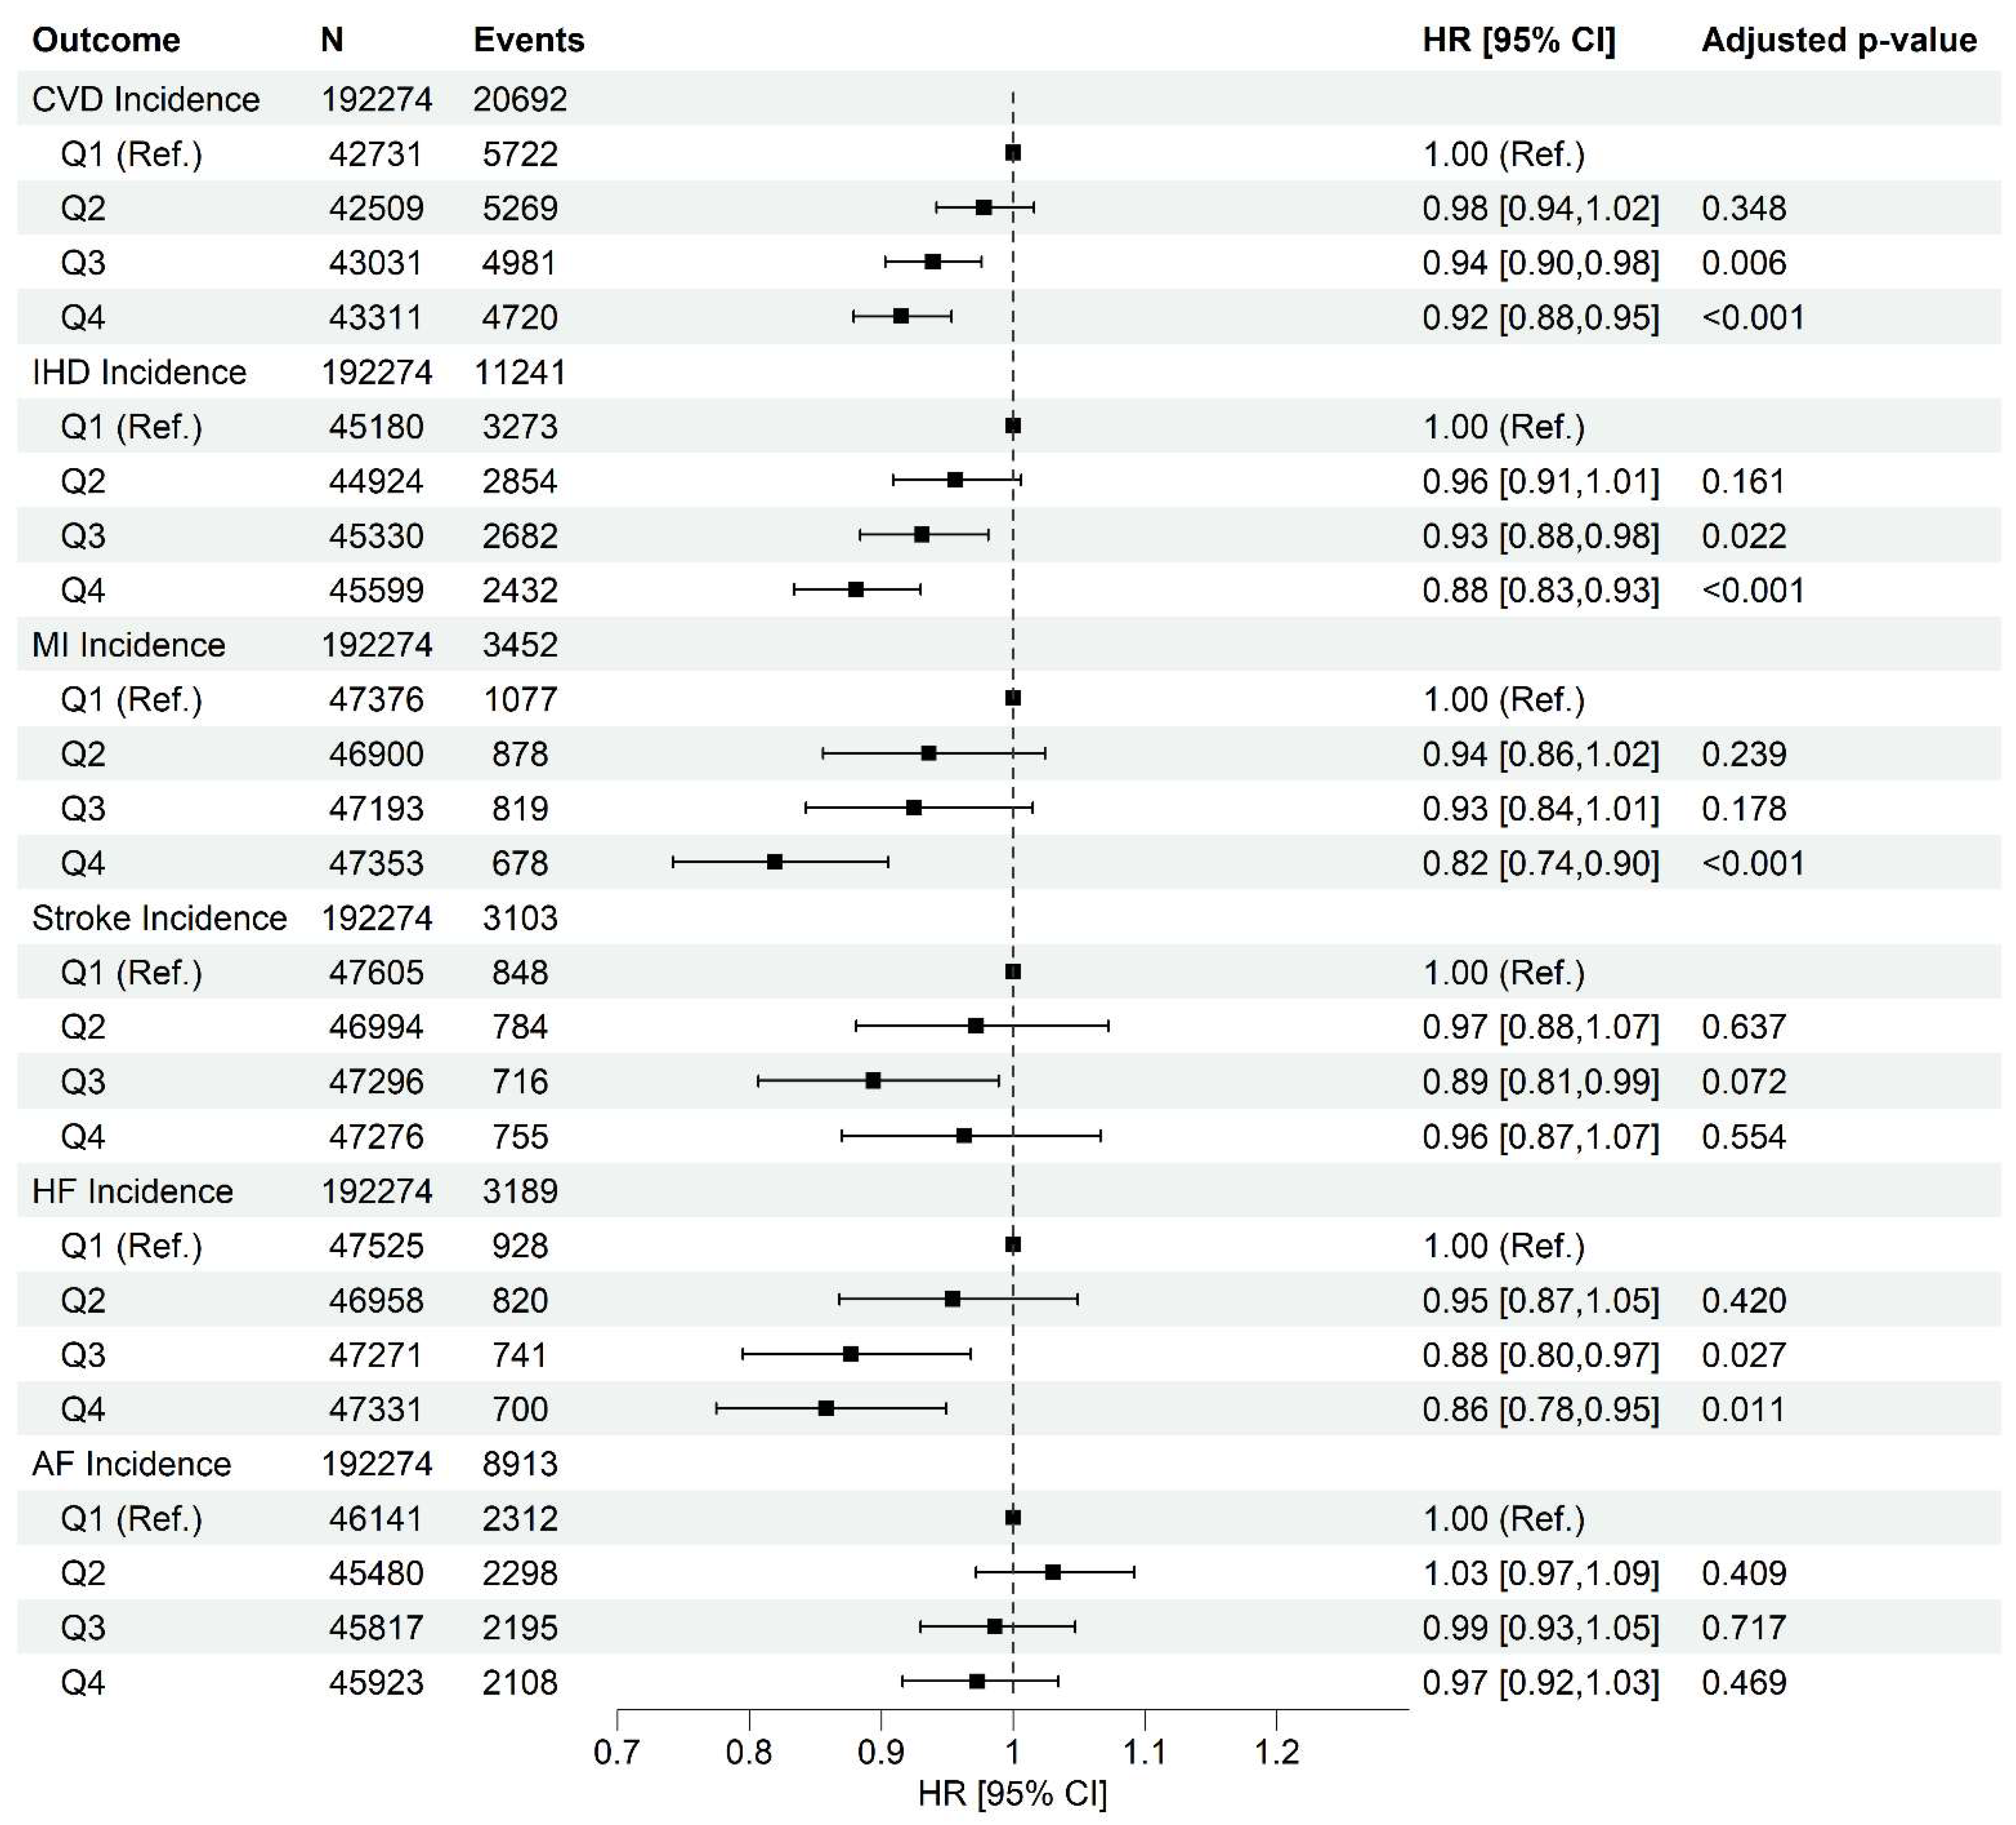
Figure 2.
Association between quartiles of heart-protective diet score and risk of cardiovascular mortality. Data presented as adjusted hazard ratio [95% confidence interval]. Q1 was used as the reference group. Cox proportional hazard models were adjusted by age (timescale), sex, ethnicity, Townsend deprivation index, average house income, education level, dietary supplement use, history of cancer diagnosis, history of hyperglycemia/type 2 diabetes diagnosis, physical activity level, sitting, sleep quality, smoke habits. CVD, Cardiovascular Disease; IHD, Ischemic Heart Disease; MI, Myocardial Infarction; HF, Heart Failure; HR, Hazard Ratio. Adjusted p-values were obtained using Benjamini-Hochberg procedure.
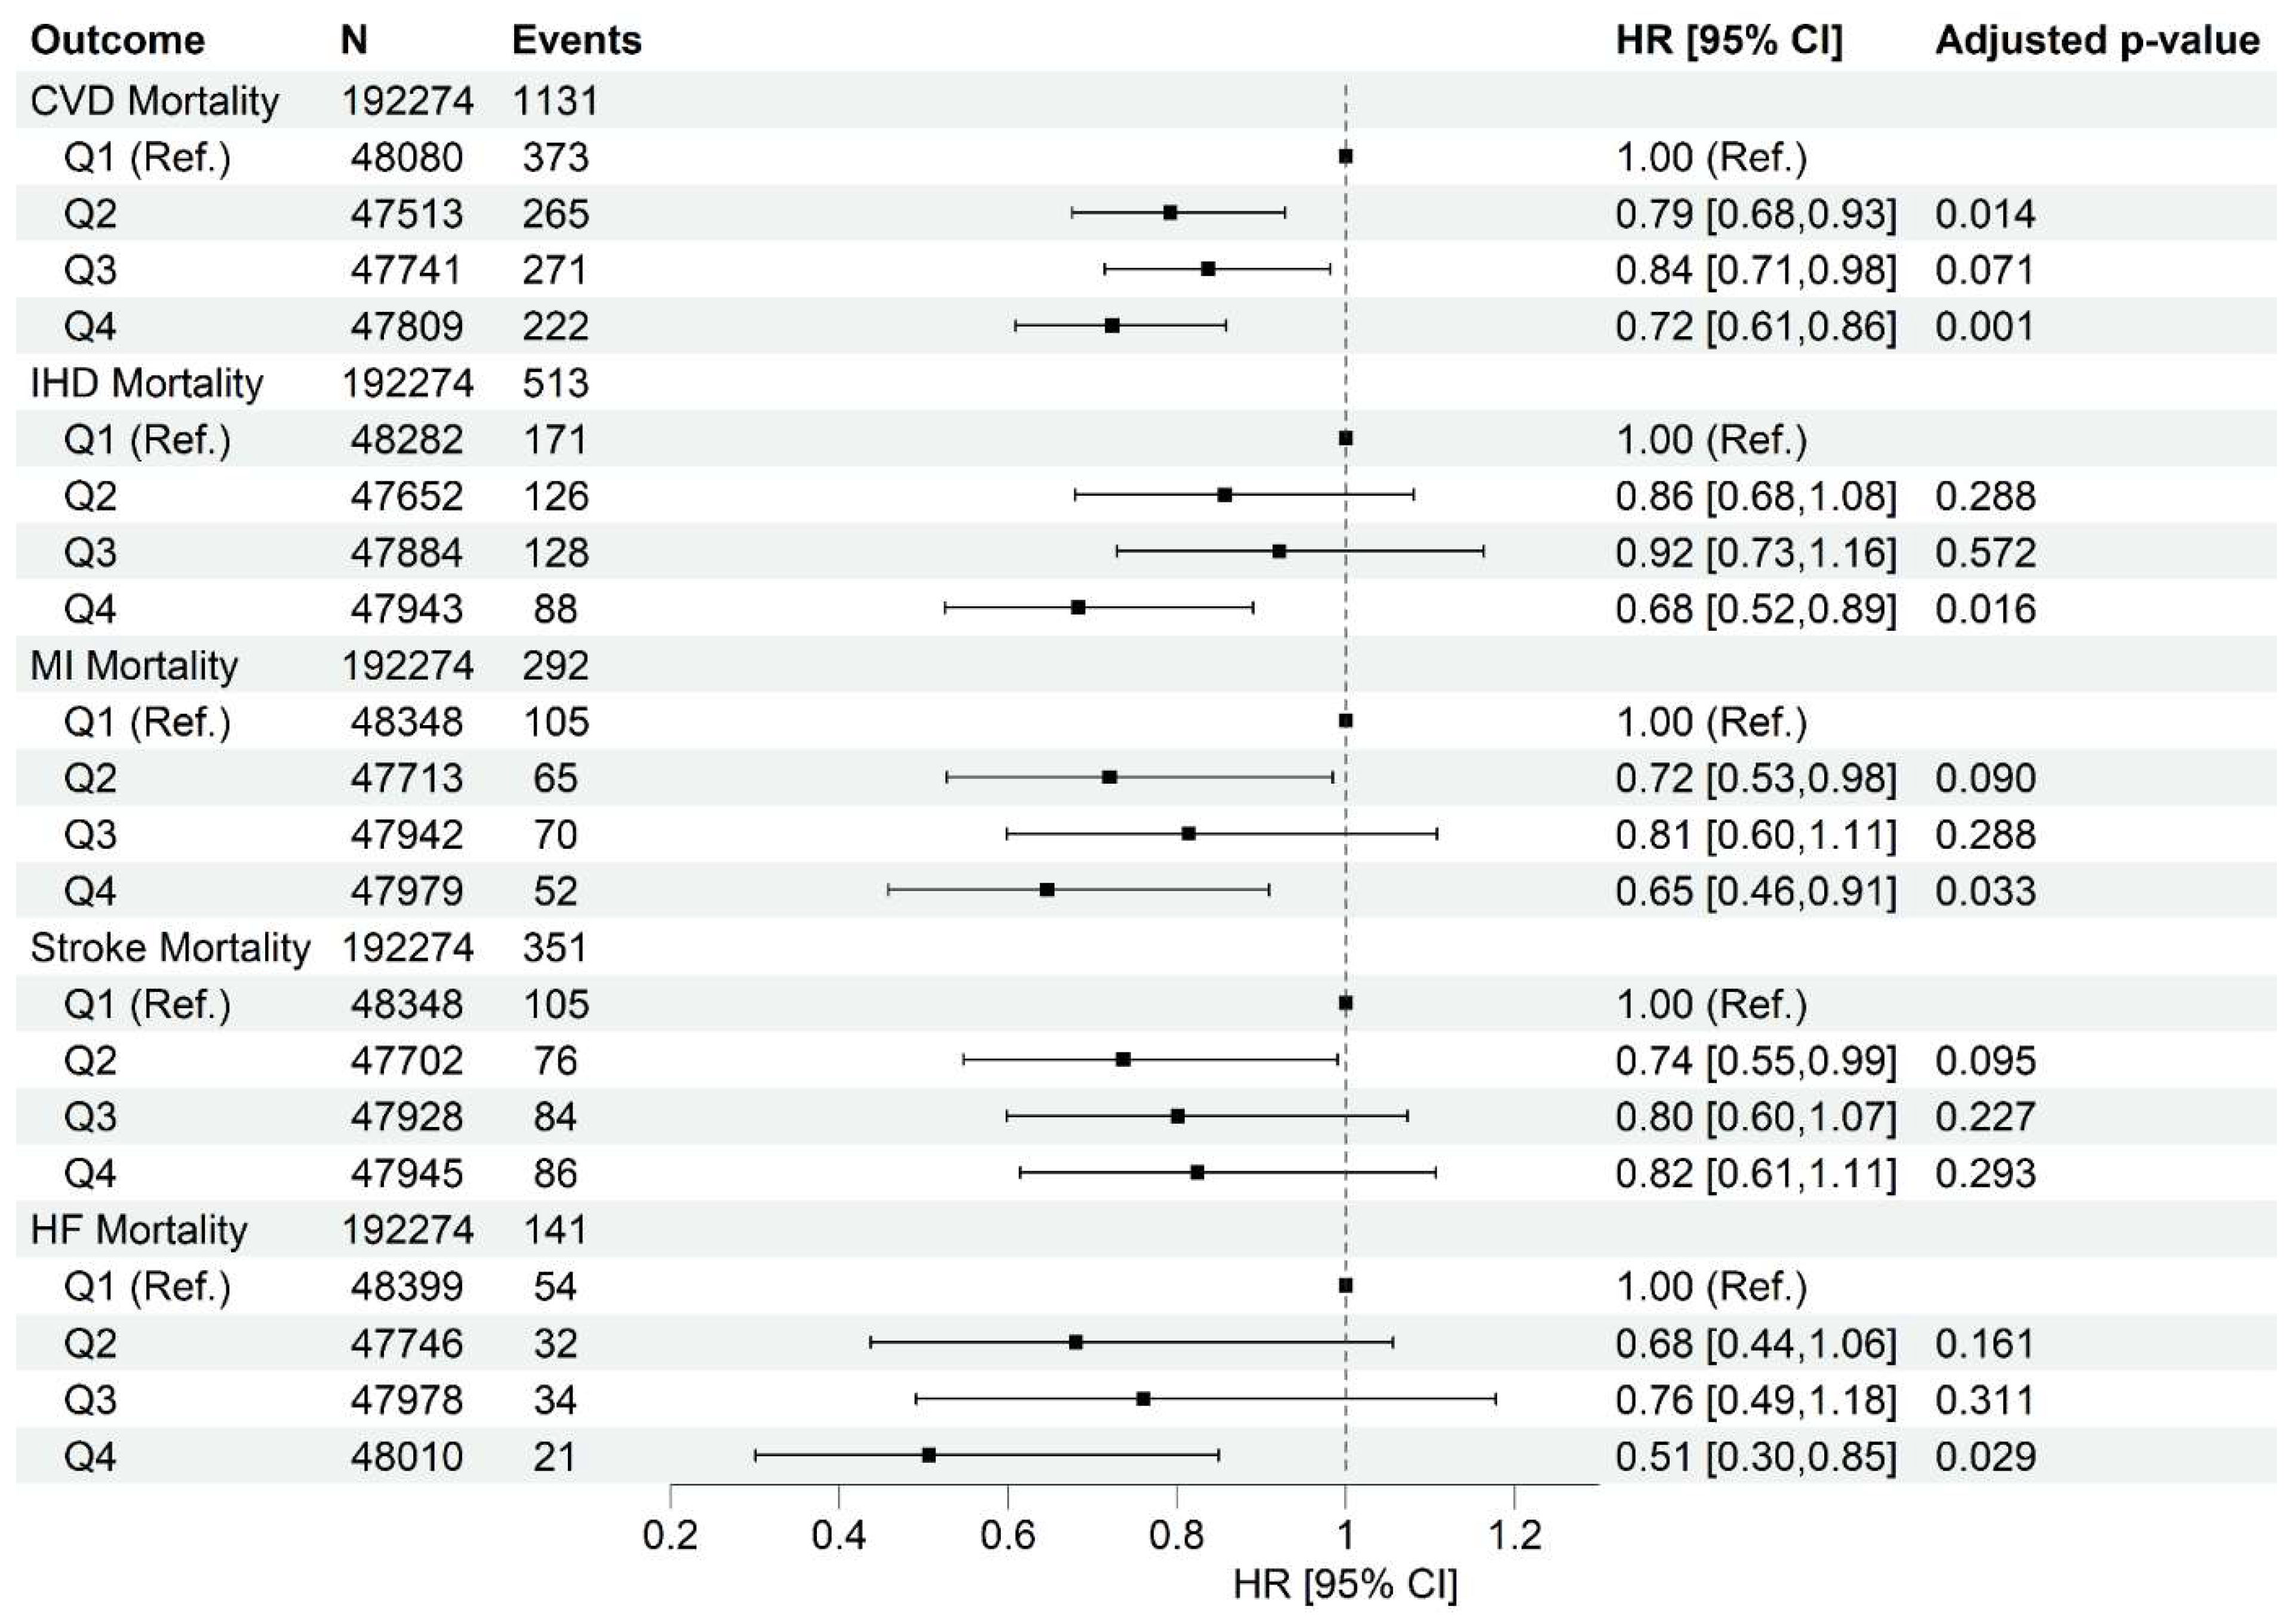
Figure 3.
Association between quartiles of heart-protective diet score and risk of cardiometabolic abnormalities. Data presented as adjusted hazard ratio [95% confidence interval]. Q1 was used as the reference group. Cox proportional hazard models were adjusted by age (timescale), sex, ethnicity, Townsend deprivation index, average house income, education level, dietary supplement use, history of cancer diagnosis, history of hyperglycemia/type 2 diabetes diagnosis, physical activity level, sitting, sleep quality, smoke habits. HR, Hazard Ratio. Adjusted p-values were obtained using Benjamini-Hochberg procedure.
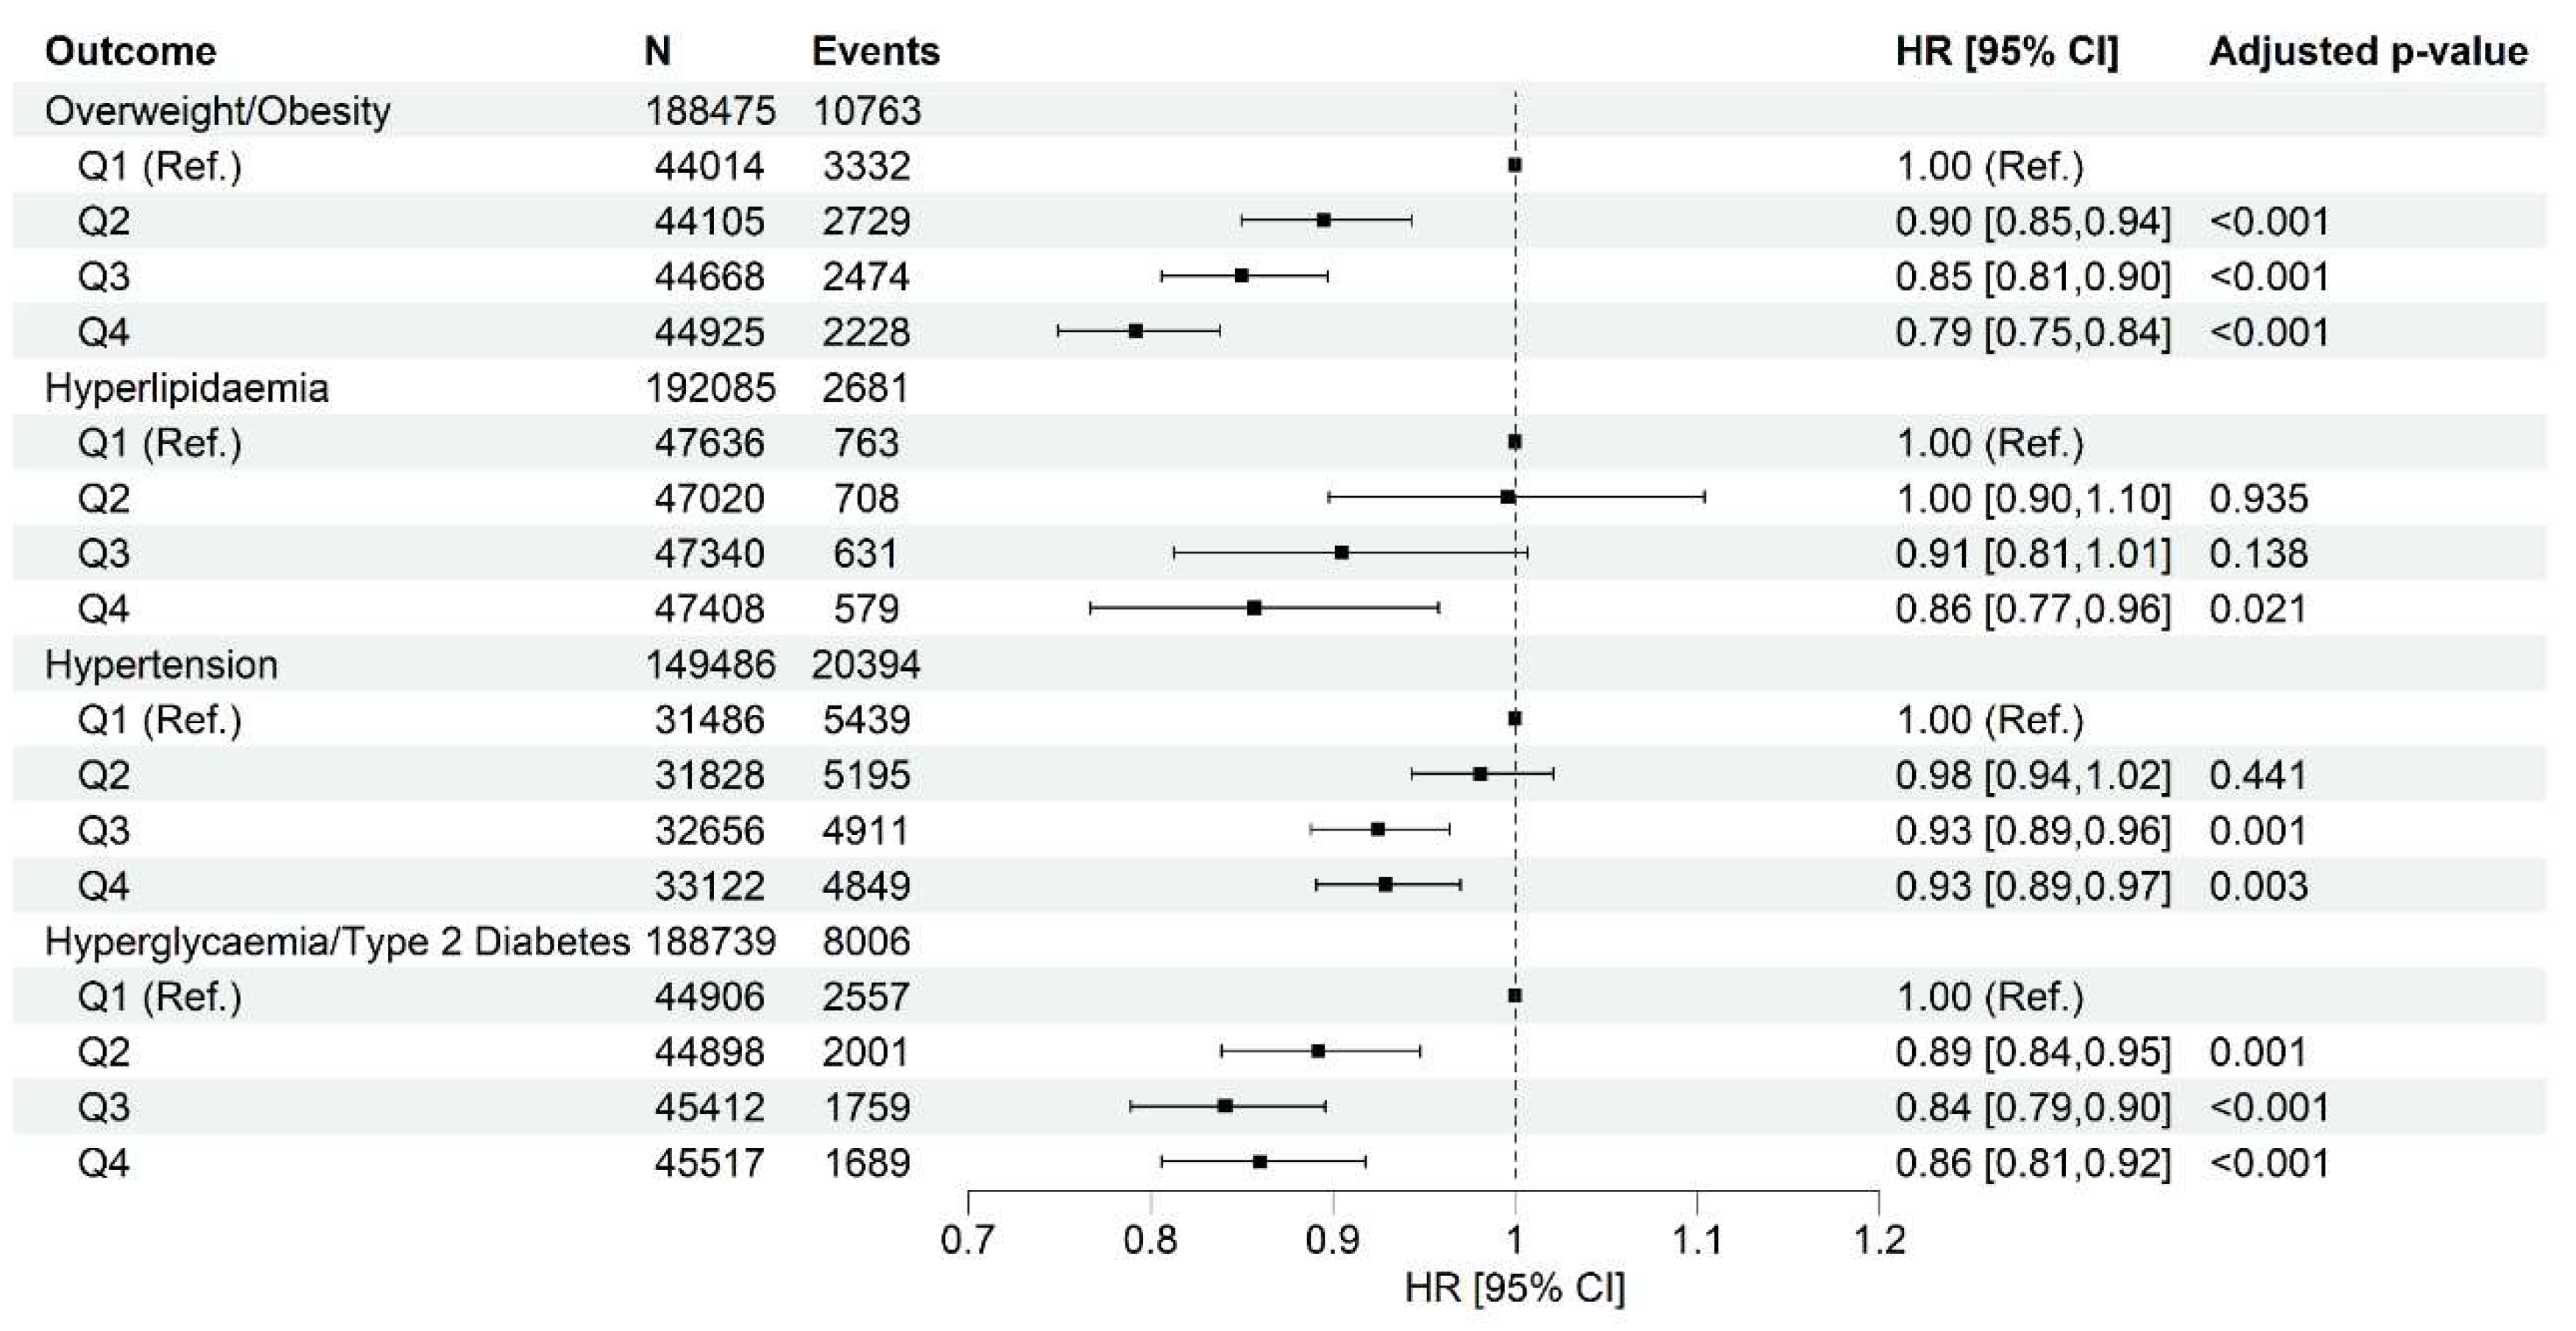

Table 1.
Food items in the 22 food groups.
| FOOD GROUPS | FOOD ITEMS | SCORING |
|---|---|---|
| Wholegrains (14 items) | Porridge, muesli, oat crunch, bran cereal, non-white bread (flour types, brown, wholemeal, other type), seeded or other bread, crispbread, whole-wheat cereal, other cereal, oatcakes, wholemeal pasta, brown rice, couscous, other cooked grains (such as bulgur). | + |
| Fruits (20 items) | Avocado, mixed fruit, apple, banana, berries, cherries, grapefruit, grapes, mango, melon, orange, orange-like small fruits (such as satsuma), peach/nectarine, pear, pineapple, plum, other fruits, stewed/cooked fruit, prunes, other dried fruit | + |
| Non-starchy Vegetables (26 items) | Mixed vegetables, vegetable pieces, coleslaw, side salad, beetroot, broccoli, cabbage/kale, carrots, cauliflower, celery, courgette, cucumber, garlic, leeks, lettuce, mushrooms, onion, parsnip, sweet peppers, spinach, sprouts, fresh tomatoes, cooked or tinned tomatoes, turnip/swede, watercress, other vegetable intake | + |
| Starchy Vegetables (3 items) | Butternut squash, sweetcorn, sweet potato | + |
| Nuts & Seeds (5 items) | Unsalted peanuts, unsalted nuts, seeds, salted peanuts, salted nuts | + |
| Legumes & Beans, Other Vegetarian Protein Alternatives (9 items) | Beans (baked beans), other beans or lentils (pulses), broad beans, green beans, peas, vegetarian sausages/burgers, tofu, quorn, other vegetarian alternative | + |
| Uncoated Fish & Seafood (7 items) | Tinned tuna, oily fish, white fish, prawns, lobster/crab, shellfish, other fish intake | + |
| Eggs (5 items) | Whole eggs, omelettes or scrambled egg, eggs in sandwiches, scotch egg, other egg dishes | + |
| (Reduced-fat and/or No Added Sugar) Milk & Dairy Products (4 items) | Milk, low fat hard cheese, low fat cheese spread, cottage cheese | + |
| Tea, Coffee & Other Low-calorie Drinks (11 items) | Instant coffee, filtered coffee, cappuccino, latte, espresso, other coffee drinks, standard tea, rooibos tea, green tea, herbal tea, other tea | + |
| Homemade soup (1 item) | Homemade soup | + |
| Refined grains & cereals, including discretionary choices (12 items) | Sweetened cereal, plain cereal, white sliced bread, white bread, white bap, white bread roll, naan bread, garlic bread, white pasta, white rice, pancake, snackpot | - |
| Potatoes (4 items) | Fried potatoes, boiled/baked potatoes, mashed potatoes, crisps (e.g., potato chips) | - |
| Meat, Poultry & Processed Meat (10 items) | Sausage, beef, pork, lamb, crumbed or deep-fried poultry, poultry, bacon, ham, liver, other meat intake | - |
| Coated Fish & Seafood (2 items) | Breaded fish, battered fish | - |
| (Full-fat and/or Added Sugar) Milk & Dairy Products (10 items) | Flavored milk, yogurt, hard cheese, soft cheese, blue cheese, cheese spread, feta cheese, mozzarella cheese, goat's cheese, other cheese | - |
| Processed Soup (2 items) | Powdered/instant soup intake, canned soup intake | - |
| Sugar, Sweets & Desserts, Cookies & Pastries (23 items) | Intake of sugar added to coffee/tea/cereal, ice-cream, milk-based pudding, other milk-based pudding, soya dessert, fruitcake, cake, doughnuts, sponge pudding, cheesecake, other dessert, chocolate bar, white chocolate, milk chocolate, dark chocolate, chocolate-covered raisin, chocolate sweet, diet sweets, chocolate-covered biscuits, chocolate biscuits, sweet biscuits, cereal bar, other sweets | - |
| Savoury Snacks (2 items) | Savoury or cheesy biscuits, other savoury snack | - |
| Sugary Drinks including Juices & Sugar-sweetened Beverages (3 items) | Low-calorie hot chocolate, hot chocolate, other non-alcoholic drink | - |
| Artificial sweetener (1 item) | Artificial sweetener added to coffee/tea/cereal | - |
| Unhealthy Fat (with/without Carbohydrates) (2 items) | Butter/margarine on bread/crackers (spreadable, low fat, normal fat, or unknown type), number of bread slices/baps/bread rolls/crackers/crispbreads/oatcakes/other bread types with butter/margarine | - |
Table 2.
Characteristics of participants based on quartile categories of heart-protective diet score.
Table 2.
Characteristics of participants based on quartile categories of heart-protective diet score.
| Q1 (n=48453) | Q2 (n=47778) | Q3 (n=48012) | Q4 (n=48031) | |
|---|---|---|---|---|
| Heart-protective diet score | -6.8 (3.6) | 0.3 (1.5) | 5.2 (1.5) | 12.5 (3.8) |
| Age at recruitment, year | 55.3 (8.2) | 56.1 (8.0) | 56.7 (7.8) | 57.0 (7.6) |
| Sex, male | 26619 [54.9] | 21435 [44.9] | 18965 [39.5] | 16283 [33.9] |
| Ethnicity, White | 46212 [95.4] | 45654 [95.6] | 45977 [95.8] | 45877 [95.5] |
| Smoking status | ||||
| Never | 26818 [55.3] | 27386 [57.3] | 28022 [58.4] | 28192 [58.7] |
| Former | 16313 [33.7] | 16460 [34.5] | 16710 [34.8] | 17000 [35.4] |
| Current | 5195 [10.7] | 3806 [8.0] | 3176 [6.6] | 2724 [5.7] |
| Missing | 127 [0.3] | 126 [0.3] | 104 [0.2] | 115 [0.2] |
| Townsend deprivation index | -1.5 (3.0) | -1.7 (2.9) | -1.7 (2.8) | -1.6 (2.9) |
| College or university degree, Y | 16714 [34.5] | 20026 [41.9] | 22205 [46.2] | 24424 [50.9] |
| Average total household income before tax | ||||
| < £18000 | 7119 [14.7] | 6302 [13.2] | 5923 [12.3] | 6017 [12.5] |
| £18000-30999 | 10740 [22.2] | 10239 [21.4] | 10220 [21.3] | 10192 [21.2] |
| £31000- £51999 | 12937 [26.7] | 12195 [25.5] | 12374 [25.8] | 12173 [25.3] |
| £52000-100000 | 10168 [21] | 10913 [22.8] | 11097 [23.1] | 11091 [23.1] |
| > £100000 | 2521 [5.2] | 3270 [6.8] | 3397 [7.1] | 3624 [7.5] |
| Physical activity score | ||||
| Low | 5965 [12.3] | 5437 [11.4] | 4660 [9.7] | 3910 [8.1] |
| Moderate | 19019 [39.3] | 19082 [39.9] | 19205 [40.0] | 18453 [38.4] |
| High | 14387 [29.7] | 14756 [30.9] | 15917 [33.2] | 18126 [37.7] |
| Sitting score (hours/day) | 5.2 (2.5) | 4.8 (2.3) | 4.6 (2.2) | 4.3 (2.2) |
| Sleep score [range: 0-5] | 3.6 (1.0) | 3.7 (1.0) | 3.7 (1.0) | 3.8 (1.0) |
| Dietary supplement use, yes | 22261 (45.9) | 24244 (50.7) | 25842 (53.8) | 27855 (58.0) |
| BMI, kg/m2 | 27.5 (4.8) | 27.0 (4.6) | 26.6 (4.4) | 26.2 (4.5) |
| SBP, mmHg | 137.1 (17.9) | 136.6 (18.3) | 136.5 (18.4) | 136.1 (18.6) |
| DBP, mmHg | 82.6 (10.0) | 82.0 (10.0) | 81.6 (10.0) | 81.2 (10.0) |
| TC, mmol/L | 5.7 (1.1) | 5.8 (1.1) | 5.8 (1.1) | 5.8 (1.1) |
| LDL-C, mmol/L | 3.6 (0.8) | 3.6 (0.8) | 3.6 (0.8) | 3.6 (0.8) |
| HDL-C, mmol/L | 1.4 (0.4) | 1.5 (0.4) | 1.5 (0.4) | 1.6 (0.4) |
| Triglycerides, mmol/L | 1.8 (1.1) | 1.7 (1.0) | 1.6 (1.0) | 1.6 (0.9) |
| HbA1c (mmol/mol) | 35.6 (6.1) | 35.4 (5.9) | 35.3 (5.8) | 35.3 (5.5) |
Data are expressed as mean (SD) for continuous variables, N [%] for categorical variables. BMI, Body Mass Index; DBP, Diastolic Blood Pressure; HbA1c, glycated haemoglobin; HDL-C, high-density lipoprotein cholesterol; LDL-C, low-density lipoprotein cholesterol; SBP, Systolic Blood Pressure; TC, total cholesterol.
Table 3.
Food groups and nutrient intake based on quartile categories of heart-protective diet scores.
Table 3.
Food groups and nutrient intake based on quartile categories of heart-protective diet scores.
| Quartiles | Q1 (n=48453) | Q2 (n=47778) | Q3 (n=48012) | Q4 (n=48031) |
| Heart-protective diet score | -6.8 (3.6) | 0.3 (1.5) | 5.2 (1.5) | 12.5 (3.8) |
| Food groups intake (grams/week) | ||||
| Wholegrains (1 serve: 60g) | 76.2 (98.8) | 116.2 (107.5) | 142.9 (110) | 176.6 (117.1) |
| Fruits (1 serve: 80g) | 70.6 (100.9) | 120.9 (127.7) | 174.4 (145.5) | 262.7 (173.6) |
| Non-starchy Vegetables (1 serve: 80g) |
102.7 (132.8) | 156.6 (162.9) | 211.1 (185) | 311.3 (228.7) |
| Starchy Vegetables (1 serve: 75g) |
1.2 (8.7) | 2.5 (13) | 4.4 (17.2) | 10.7 (27.7) |
| Nuts & Seeds (1 serve: 30g) | 1.9 (8.2) | 3.2 (11.2) | 4.8 (13.6) | 9.3 (19.5) |
| Legumes & Beans, Other Vegetarian Protein Alternatives (1 serve: 80g) | 15 (34.7) | 23.7 (43.8) | 32.8 (50.6) | 54.7 (66.1) |
| Uncoated Fish & Seafood (1 serve: 140g) |
14 (46.6) | 27.8 (63.2) | 43 (76.6) | 72.7 (95.5) |
| Eggs (1 serve: 120g) | 23.6 (59.9) | 29.8 (67.4) | 34.5 (72.1) | 47.7 (84.7) |
| (Reduced-fat and/or No Added Sugar) Milk & Dairy Products (1 serve: 250ml) | 17.2 (76.3) | 23.5 (85.2) | 32.5 (100.0) | 52.8 (127.8) |
| Tea, Coffee & Other Low-calorie Drinks (1 serve: 250ml) |
345.2 (476.6) | 506.2 (517.4) | 611.1 (525) | 781.8 (548.8) |
| Homemade soup (1 serve: 250ml) |
8.6 (48.1) | 16.8 (66.8) | 25.9 (83.6) | 46.5 (112.1) |
| Refined grains & cereals, including discretionary choices (1 serve: 60g) | 114.6 (101.5) | 60.7 (76.1) | 39.5 (60.1) | 23.5 (43.7) |
| Potatoes (1 serve: 75g) | 66.4 (64.5) | 55.3 (56.5) | 49 (52.0) | 39 (45.9) |
| Meat, Poultry & Processed Meat (1 serve: 70g) | 109.6 (91.7) | 85.9 (79.7) | 70.4 (71.4) | 49.1 (62.9) |
| Coated Fish & Seafood (1 serve: 140g) |
5.6 (24.1) | 3.9 (18.9) | 2.7 (15.7) | 1.4 (11.0) |
| (Full-fat and/or Added Sugar) Milk & Dairy Products (1 serve: 250ml) | 329.4 (302.7) | 296.2 (288.1) | 285.1 (282) | 268.8 (267.2) |
| Processed Soup (1 serve: 250ml) |
27.1 (82.4) | 20.3 (70.9) | 16.4 (63.9) | 11.3 (53.1) |
| Sugar, Sweets & Desserts, Cookies & Pastries (1 serve: 40g) |
80.4 (79.5) | 52.4 (63.6) | 38.5 (54.1) | 24.5 (42) |
| Savoury Snacks (1 serve: 30g) |
2.2 (9.1) | 1.4 (6.9) | 1.1 (5.9) | 0.8 (4.9) |
| Sugary Drinks including Juices & Sugar-sweetened Beverages (1 serve: 150ml) |
21.1 (70.1) | 14.6 (56.3) | 12.3 (50.7) | 9.0 (44.5) |
| Artificial sweeteners (1 serve: 4g) |
1.4 (3.7) | 0.9 (2.9) | 0.6 (2.4) | 0.4 (1.9) |
| Unhealthy Fat (with/without Carbohydrates) (1 serve: 10g) |
6.3 (11) | 4.2 (9.1) | 3.1 (7.9) | 2.0 (6.7) |
| Daily nutrient intake | ||||
| Total energy intake, kcal/d | 2187.3 (631.4) | 2016.4 (604.0) | 1970.7 (580.6) | 1991.6 (578.6) |
| Total protein, g/d | 81.6 (28.0) | 78.4 (26.3) | 78.4 (25.3) | 81.9 (26.2) |
| Total fat, g/d | 79.4 (31.0) | 71.2 (29.8) | 68.5 (29.1) | 68.8 (30.2) |
| Saturated fatty acids, g/d | 31.2 (13.8) | 27.1 (12.6) | 25.0 (12.0) | 23.0 (11.6) |
| Monounsaturated fatty acids, g/d | 28.7 (11.8) | 25.6 (11.5) | 24.7 (11.4) | 25.3 (12.3) |
| n-3 fatty acids, g/d | 1.8 (0.9) | 1.8 (1.0) | 1.9 (1.1) | 2.3 (1.4) |
| n-6 fatty acids, g/d | 10.8 (5.3) | 10.3 (5.4) | 10.5 (5.7) | 11.7 (6.5) |
| Total carbohydrate, g/d | 269.7 (85.4) | 247.6 (81.9) | 244.1 (80.0) | 249.3 (80.6) |
| Total sugars, g/d | 125.1 (54.1) | 119.4 (50.9) | 122.3 (50.2) | 132.1 (52.2) |
| Dietary fibre, g/d | 14.6 (5.9) | 16.3 (6.3) | 18.3 (6.5) | 22.3 (7.7) |
| Alcohol, g/d | 18.0 (26.2) | 17.7 (24.9) | 16.5 (23.1) | 14.42 (21.4) |
| Vitamin C, mg/d | 96.8 (71.1) | 115.7 (77.9) | 134.8 (83.4) | 169.8 (97.5) |
| Vitamin E, mg/d | 10.5 (5.0) | 10.17 (4.9) | 10.65 (4.9) | 12.3 (5.2) |
| Vitamin B12, ug/d | 5.7 (3.7) | 5.80 (3.7) | 6.1 (3.8) | 6.9 (4.2) |
| Folate, ug/d | 277.0 (107.3) | 292.7 (110.0) | 315.5 (110.4) | 364.1 (122.7) |
| Beta carotene, ug/d | 1727.4 (2089.6) | 2239.4 (2445.7) | 2760.2 (2724.9) | 3937.7 (3566.4) |
| Iron, mg/d | 11.7 (4.0) | 11.8 (4.0) | 12.2 (4.0) | 13.5 (4.3) |
| Zinc, mg/d | 9.8 (4.0) | 9.5 (3.7) | 9.5 (3.5) | 9.8 (3.5) |
| Magnesium, mg/d | 299.9 (90.3) | 313.3 (92.5) | 333.8 (93.5) | 379.5 (106.4) |
| Iodine, ug/d | 203.8 (109.3) | 201.9 (111.5) | 207.9 (119.6) | 224.2 (135.7) |
| Sodium, mg/d | 2158.5 (912.8) | 1895.3 (845.3) | 1814.8 (810.0) | 1843.1 (820.2) |
| Potassium, mg/d | 3342.3 (1099.5) | 3478.5 (1100.8) | 3686.0 (1088.8) | 4128.9 (1157.0) |
Data are expressed as mean (SD).
Disclaimer/Publisher’s Note: The statements, opinions and data contained in all publications are solely those of the individual author(s) and contributor(s) and not of MDPI and/or the editor(s). MDPI and/or the editor(s) disclaim responsibility for any injury to people or property resulting from any ideas, methods, instructions or products referred to in the content. |
© 2025 by the authors. Licensee MDPI, Basel, Switzerland. This article is an open access article distributed under the terms and conditions of the Creative Commons Attribution (CC BY) license (http://creativecommons.org/licenses/by/4.0/).
Copyright: This open access article is published under a Creative Commons CC BY 4.0 license, which permit the free download, distribution, and reuse, provided that the author and preprint are cited in any reuse.


