Submitted:
30 April 2025
Posted:
30 April 2025
You are already at the latest version
Abstract
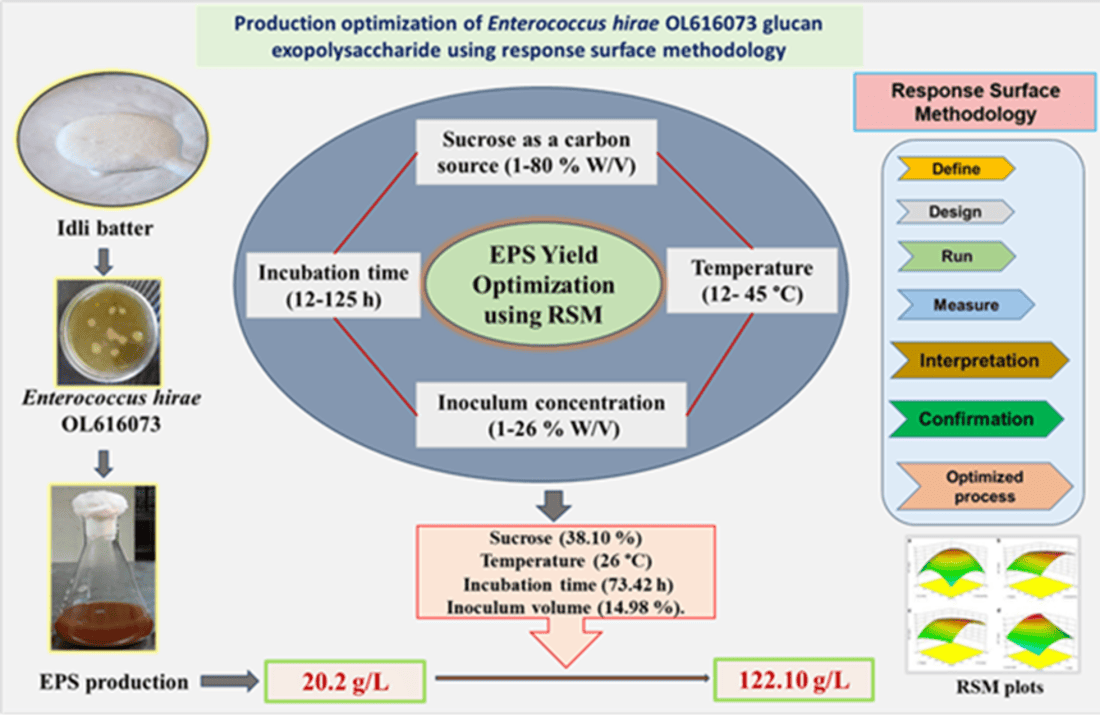
The diverse functional properties of microbial exopolysaccharides (EPS) have garnered significant interest in research and industrial applications. In this context, the present study focuses on the production of glucan EPS produced by Enterococcus hirae OL616073. The biosynthesis of EPS is a complex process and is influenced by multiple physicochemical and environmental parameters. This study systematically investigates the key factors affecting EPS and biomass production, including variations in sucrose as carbon source, incubation time, temperature, and inoculum concentrations were optimized under static conditions for enhancing glucan production in submerged fermentation. A central composite design with the response surface methodology (RSM) was used to screen the effects. Four independent variables, namely, sucrose, time, temperature, and inoculum percentage at various levels, on the outcome of glucan and biomass yield as dependent variables. The experimental data was examined by implementing an analysis of variance (ANOVA) and polynomial regression model. Variables through the validation process by the quadratic model suggested by the RSM model were found to be significant (p< 0.05) for both glucan and biomass. The optimized condition yields 122.10 g/L of glucan and 6.27 g/L of biomass while maintaining the sucrose (38.10 %), incubation time (73.42 h), temperature (26 °C), and inoculum volume (14.98 %). In this experimental model, glucan production was increased by 6-fold over non-optimized conditions. Consequently, optimization could be important for scale-up and commercial viability for further applications in food, pharmaceutical, and other biotechnological applications.
Keywords:
Enterococcus hirae OL616073
; Exopolysaccharide
; Optimization
; Glucan
; Biomass
; Response surface methodology (RSM)
1. Introduction
Exopolysaccharides (EPS) with potential applications are gaining prominence in the food and pharmaceutical industry as natural biopolymers. In recent years, there has been increased interest and demand for natural biopolymers including EPS, in view of their functionality, health-beneficial properties, and industrial applications. Many different EPS from bacterial origin have been shown to have various techno-functional properties based on their structure and sugar composition [1]. EPS functions as gelling, texturizing, and emulsifying agents, additionally serves as a viscosity enhancer in yoghurts by interacting with milk proteins to prevent syneresis [2]. EPS has been associated with diverse health beneficial properties including modulation of an immune response [3], functioning as nano-drug carriers [4], exhibiting antiviral [5], and antitumor activities [6]. EPS from many bacterial strains like Lactobacillus plantarum RJF4 [7] , Lactobacillus plantarum YW32 [8] and Lactobacillus plantarum 70810 [9] have revealed the potential for precisely inhibiting cancer cell lines while being non-toxic to normal cells. However, the EPS commercial production process is scarce on account of low efficiency of synthesis and the high technology involved [10]. There is dire demand to investigate ways to increase the possibility of producing these compounds on an industrial basis while modifying the fermentation conditions and figuring out affordable substrates [11]. Consequently, statistical optimization design has been adopted as the method of choice for industrial-scale exploration [12].
Recently, our group has reported a glucan, which is a homopolymer of glucose containing α-(1 → 6) and α-(1 → 3) linked glycosidic linkages. The polymer is extracted from Enterococcus hirae OL616073 with a spherical porous structure [13]. The glucan yield from this strain was 20.2 (g/L) under unoptimized conditions. Due to potential functionalities, this EPS can have potential applications as a hydrocolloid in the food and pharmaceutical industry. Global hydrocolloid growth rate has reached 11.4 US$ billion by 2023 from 8.8 US$ billion in 2018 [14]. In view of this, optimization of the various factors was here done on the laboratory scale. Earlier studies indicate that various factors such as, sugar as carbon source [15], incubation temperature [16], fermentation time [17], and inoculum concentrations [18] play a significant role in EPS yield. A substantial amount of saccharides in the fermentation media further triggers the production process [19] [20]. We have used response surface methodology (RSM) for multifactorial optimization of EPS yield to increase its scalability and applicability in various sectors.
2. Materials and Methods
2.1. Microorganism and Culture Maintenance
Enterococcus hirae OL616073, a bacterial strain producing glucan was early isolated from idli batter (Kavitake et al., 2024). It was characterized to the strain level and submitted at NCBI Gene bank with the submission ID OL616073. Stock cultures for long time preservation were cultured in MRS (de Man, Rogosa and Sharpe) broth with 20% v/v glycerol and stored at (- 40 °C). The culture was transferred in a fresh broth of MRS for activation and cultivated at 30 °C for 24 h.
2.2. Growth Profile and Glucan Synthesis
Batch fermentation was carried in a 250 mL Erlenmeyer flask, when seed culture of 1% (v/v) was transferred to 100 mL of production medium, supplemented with 2% sucrose in MRS broth maintained at 30 °C under static conditions for 96 h in triplicates. After that, 1 mL aliquots were drawn out at specific times for the glucan production (g/L), cell growth (OD 600 nm) by spectrophotometer and cell number log CFU/mL estimated by spread plate technique at particular serial dilution on MRS agar were predicted during the entire fermentation time. All data are the mean values based on triplicate experiments.
2.3. Inoculum Preparation
A single colony of the Enterococcus hirae OL616073 strain was inoculated for seed preparation in 100 mL MRS broth contained in 250 mL flask and incubated at 30 °C under static conditions for 14 h. The selection of various inoculum concentrations (v/v) was chosen on the basis of count of bacterial cell density as log N CFU/mL in respective concentrations. The density of the tested bacterium inoculum is obtained from spontaneous growth of bacteria measured by log units.
2.4. Preliminary Screening of Parameters Using One-Factor-at-a-Time (OFAT) Method
Preliminary screening for EPS production was carried out by a one-factor-at-a-time (OFAT) pattern detecting the influence of independent variables such as concentrations of sucrose, cultivation time, temperature, and inoculum on glucan yield (g/L) and biomass production (Data not shown) using Enterococcus hirae OL616073. Batch fermentations were carried out, in 125 mL Erlenmeyer flasks with 50 mL fermentation media under the static conditions.
2.5. Extraction, Purification and Quantification of Glucan
For glucan isolation process adopted by [21] was followed with minor modifications. Briefly, under static conditions Enterococcus hirae Ol616073 isolate was grown in MRS broth supplemented with sucrose and grown for 72 h. The formed cell suspension was inactived by heating in water bath for 10 min at 100 °C and centrifuged at 12000 ×g for 15 min to make cell free supernatant by removing the cell pellet. Subsequently, for protein removal 2 % (w/v) of TCA (Trichloroacetic acid) was poured to final concentration of cell free broth. Thereafter, proteins precipitated were separated by centrifugation process for 30 min at 12000× g in cooling centrifuge at 4 °C. For glucan precipitation, chilled ethanol stored overnight was added at 1:3 ratio to cell-free broth (CFB) for precipitation of EPS and was allowed to stand overnight. The crude glucan was obtained as precipitate and harvested by centrifugation for 20 min at 19200 ×g. The obtained glucan was redissolved in Milli-Q water for dialysis while and placed in a dialysis bag (12-14 kDa) maintained at 4 °C for 48 h with Milli-Q water. Afterward, dialyzed portions were lyophilized using a freeze dryer (ilshinBioBase Co.Ltd. made in Korea) and collected as glucan powder.
The amount of glucan precipitated as the total carbohydrate content was estimated by the Phenol-sulphuric acid method [22] with slight modifications using glucose as standard. The presence of a golden color was spotted after adding 0.5 mL of 5 % phenol solution (5 g crystals of phenol to make 100 mL with d.H20) and 2.5 mL of 96 % sulphuric acid (H2SO4) to a sample volume of 1 mL. Following 10 min of standing at room temperature, the samples were vortexed for 30 sec. Later, sample tubes were transferred to a water bath maintained at 30 °C for a duration of 25-30 min. Subsequently, sample absorbances were read in a spectrophotometer at a wavelength of 490 nm. The control possesses all reagents except the sample. The obtained absorbance results were compared with the standard curve of glucose by substituting absorbance values in an equation to determine the total sugar content.
2.6. Estimation of Biomass (Cell Dry Weight)
The cell biomass was estimated with slight modifications as stated by [23]. Briefly, the fermented broth was centrifuged at 10,000g for 30 min to remove the cell biomass gets settled in the bottom of the tube. Before being dried at 80 °C to constant weight, biomass is washed with Milli-Q water to calculate the dry biomass. The weight is expressed in g/L of dry weight.
2.7. Optimization of Glucan Production and Cell Biomass Using RSM
Response surface methodology is well-known technique to optimize the production or growth conditions. The experimental runs were obtained using the central composite design rotatable according to four independent variables: sucrose concentration, time, temperature, and inoculum concentration. The levels and range of each variable under investigation are described in Table 1. The experimental plan of 30 runs was carried out in triplicates and the average value of glucan and biomass production (g/L) of each trial was determined as the dependent variable (Y). Unless otherwise stated, the cultivation was carried out using 250 mL flasks under static conditions.
The determination of statistical parameters like an analysis of variance (ANOVA), regression coefficient, and three-dimensional graphs were created by using trial version 13 of Design-Expert software (Stat-Ease Inc., Minneapolis, USA). The experimental data was applied to second order polynomial equation to demonstrate the impact of independent variables on glucan and biomass as shown in the equation
where, Y is response EPS yield and biomass production, is constant coefficient fitted at the center point of design (0,0,0,0), is a linear coefficient, is squared coefficient (quadratic coefficient), represents interaction coefficient (cross-product regression coefficient) while as is coded for independent variables chosen during experimentation.
2.8. Statistical Analysis
The statistical analysis was performed using statistical Design Expert, version 13 software (Stat Ease Inc. Minneapolis USA). Response surface using central composite rotatable design was model was evaluated by F value, where P < 0.05 indicates significant terms. ANOVA was used to confirm the significance of the involved variables for the proposed model. The reliability of the polynomial representation equations was predicted using the coefficient of determination (R2), predicted R2, and adjusted R2.
3. Results and Discussions
3.1. Growth Profile and Glucan Production
In order to determine the pattern of glucan yield and dynamics of optical density by Enterococcus hirae OL616073, the growth profile is presented in Figure 1 (A). The varying time series was followed at a set temperature of 30 °C and supplemented with sucrose (2 %) in MRS broth under static conditions. Glucan production and cell growth were simultaneously studied concerning fermentation time. The yield of glucan was 1.35 g/L at 8 h which was increased to 5.54 g/L at 72 h being maximal in a stationary growth phase. Further, prolonged fermentation time showed a slow decline of glucan production till 96 h with little variation in the production process. In Figure 1 (B), glucan yield and the log CFU/mL increased till 72 h. However, bacterial growth and glucan yield were partially associated beyond 72 h when yield starts to decline.
Monitoring the fermentation pattern of Enterococcus hirae OL616073 over time allows to observe the growth kinetics. Advancement of fermentation time brings more yield of glucan, the maximum being observed at 72 hours, further increase causes a decline in production. Our findings concur with [24], they studied a similar pattern in Paenibacillus polymyxa SQR-21. The glucan yield starts to appear during the logarithmic phase and continues until the stationary phase. Further, prolonging the fermentation time beyond 72 h production showed a slight dip that may be ascribed to activation of various glycohydrolases or utilization of glucan as substrate. Similar reports were corroborated by [25] and [26] respectively. However, little or no effect on EPS was observed further when the cell growth increased likewise mentioned by Velasco et al. (2006). Shortage of carbon sources [28] and activation of enzyme system are believed to be responsible for reduced EPS yield [25]. Earlier studies also clarified that late growth stages can trigger the cell lysis and eventually degradation of EPS involving enzymes [29]. Moreover, the influence of growth on EPS production process is still arguable.
3.2. Variables Affecting Glucan Produced by Enterococcus hirae OL616073
3.2.1. One Factor at a Time (OFAT) Optimization
The influence of key factors such as sucrose concentrations, time, temperature, and inoculum concentration on glucan biosynthesis was studied. Enterococcus hirae OL616073 metabolized the sucrose in the fermentation broth and glucan yield increased significantly till 40 % (w/v) (Data not shown). Further, an increment in sucrose (%) cause decreased glucan yield which can be due to substrate level inhibition and probable osmotic shock of the bacterium under higher concentrations of sucrose. Sugars are used by lactic acid bacteria (LAB) to produce polysaccharides through the involvement of enzymes referred to as housekeeping enzymes [30]. Sucrose was found as an important carbon source and outperformed other sugars like lactose, glucose, fructose, maltose, and xylose in EPS production [31]. Sucrose stimulated the enzymes in Aureobasidium pullulans responsible for pullulan synthesis [32]. Production of dextran EPS from Leuconostoc sp. was directly correlated with dextransucrase under sucrose concentration [33]. Similarly, presence of the levS gene in the genome of Fructilactobacillus sanfranciscensis is associated with its capability to utilize sucrose as the only carbon source for levan production [34]. Therefore, influence of changing sucrose levels on EPS production is dependent upon the specific microorganism, sucrose concentrations, and activation of the enzyme system. Maximum EPS production (2.9 g/mL) was reported from B. licheniformis WSF-1 at 25 % (w/v) sucrose [31]. The presence of appropriate types and quantities of carbon sources can trigger the expression of EPS biosynthetic genes, production of the enzymatic system, and induce the bacterial cells for subsequent enhanced exopolysaccharide harvest [35]. The findings indicated that the utilization of sucrose as a carbon source led to the highest production of EPS. Housekeeping enzymes are key machinery for the conversion of sugars to polysaccharides. Though, homopolysaccharide synthesis (like glucans synthesis) is simple and facilitated by glucansucrase enzymes with sucrose as a sugar donor. However, heteropolysaccharide production is complex involving the genes [30] [36]. The yield of levan as reported by earlier studies from A. nectaris diminishes as the sucrose concentration increases, dropping from 2.5 g/L at 12 % of sucrose to 1.5 g/L when the sucrose concentration was raised to 27 % [37]. On the other hand, Zymomonas mobilis can actively grow and ferment in batch cultures with sucrose concentrations up to 46% (w/v) [38]. Higher sucrose concentrations inhibit levan yield in Gram-negative bacteria but do not impact Gram-positive bacteria [15].
Incubation time in a microbial cultivation process has significant effects on the production process of EPS and biomass. The optimal glucan yield from Enterococcus hirae OL616073 was found at an incubation time of 72 h. Extending the incubation time often allows for a more gradual, controlled growth, and offers more time for metabolic activities leading to synthesis of desired product. Prolonging the duration of cultivation time can be a viable strategy, particularly when facing financial limitations associated with other variables. Nonetheless, further glucan yield showed a slight decline beyond 72 h of incubation. This decline may be due to polymer breakdown by the EPS producing microorganism [39] [40]. Furthermore, since extended incubation could also possibly cause a buildup of metabolic wastes, nutrient depletion, and changes in the surrounding environment, all of which can cause cell death or prevent the synthesis of EPS. Therefore, optimizing the incubation time is crucial to achieving maximum EPS production while maintaining microbial viability and product quality. Similarly, the highest EPS production was documented at 72 h for Bacillus subtilis [41]. In contrast, submerged culture of Fusarium solani SD5 produces maximum yield on 14th day [42]. Therefore, RSM intensified the glucan yield while testing the variables. It proved to be a powerful statistical technique, quite convenient and less time-consuming to augment the glucan productivity.
The analyses revealed that the optimal temperature for EPS synthesis by the Enterococcus hirae OL616073 was 26 °C, which were consistent with reports of [43]. The lower incubation temperature of 25 °C and 30 °C yields more glucan as compared to temperature of 37 °C. Lower incubation temperature encourages slow growth rate of Enterococcus hirae OL616073, and enhances the logarithmic and stationary phase, which results in increased glucan yield. The lower temperature causes increased EPS yield in mesophilic strains known for EPS production. Under suboptimal temperatures release of more isoprenoid lipid carrier precursor molecules for EPS biosynthesis and also increased enzyme activity might be contributors to enhanced glucan production [44] Similarly, Wongsuphachat & Maneerat (2010) reported that incubation temperature below optimum triggers greater EPS yield. Depending upon the individual strain the efficiency of the EPS synthesis varies for instance, a temperature of 20 °C triggers efficient EPS production by the strains of Lb. paracasei CIDCA 83123 , Lactobacillus paracasei CIDCA 8339, and Lactobacillus paracasei CIDCA 83124 [18]. On the other hand, reports of improved EPS yield also exist at higher temperatures as high as 37°C and 45°C for the strains of Lactobacillus rhamnosus E/N and Lactobacillus delbruekii subsp. bulgaricus respectively [46],[47]. Consequently, the exploration of ambient incubation temperature could be deemed practical and cost-effective.
The production of EPS was significantly influenced by the percentage of inoculum and is considered as crucial biological parameter. The inoculum percent (% v/v) was related to log CFU/mL as presented in Figure 1 (C) for Enterococcus hirae OL616073. The inoculum percentage of 15 % (v/v) of 12 h grown culture provides optimum yield for glucan. Further, increased concentrations have little effect on glucan yield. The higher inoculum concentrations could cause quick depletion of media components affecting cell survival and lower concentrations were thought insufficient to start microbial growth [48]. The earlier findings suggested that an inoculum size of 5–10% was suitable for mycelial growth and enhanced EPS production as compared to (2.5 % to 15%) [49]. On the other side, the researchers demonstrated that the efficiency of EPS synthesis in a mutated strain of Lactobacillus acidophilus bacteria is not influenced by the concentration of inoculum [18]. Excessive inoculation quantities can lead to a rapid saturation of the strain, entering the decay phase and undergoing bacterial autolysis, all of which have a detrimental effect on glucan yield [50]. However, the influence of inoculum size varied between species and even between strains of the same species.
3.3. RSM (Central Composite Design) for Glucan and Biomass Production
The outcome of medium variables on glucan yield and cell biomass was studied. This was the first time that selected variables viz. sucrose, incubation time, incubation temperature, and culture inoculum were optimized for glucan and biomass production by Enterococcus hirae OL616073. Sucrose concentrations, time, temperature, and inoculum showed significant effects on glucan and biomass production in OFAT which were further screened by central composite design. A total 30 experiments were generated by a Design expert to evaluate glucan and biomass in (g/L) as responses depicted in Table 2. The results derived were further analyzed for analysis of variance (ANOVA) and p values tabulated in (Table 3). The model suggested a quadratic model with high significance (p ≤ 0.001) and the lack of fit was non-significant. The coefficient of determination R2 = 0.99 indicated that 99 % of variability can be explained by the model. Similarly, reasonable agreement existed between predicted R2= 0.97 and adjusted R2=0.98 as only a difference of 0.2 appears as shown in Table 4. All the independent variables have a significant effect (p< 0.05) on the glucan yield. Thus, a model can be easily navigated for any combination of values in the design space. Adequate precision of 42.06 a measure of the signal-to-noise ratio is desirable. Hence, this model proved reliable and can predict the quantity of glucan adequately. The polynomial equation derived from the experimental factors and interaction thereof is shown below:
where, E is glucan yield (g/L), A is sucrose (%), B is time (h), and C is temperature (°C) and D is inoculum (%) of four coded independent variables.
This model suggested that glucan production depends on the linear and quadratic terms of four selected variables. The three-dimensional response surface plots (3D plots) presented in Figure 2 (a-f) indicate the glucan for different levels of tested variables. Such plots provide an enormous quota of combinations of two tested variables while, the other two being fixed at central values.
Glucan yield achieved was 125.56 g/L once all parameters were fixed at their central points. The maximum glucan (125.56 g/L) was acquired when sucrose concentration of (405g/L), time (68.5 h), temperature (28.5 °C), and inoculum of (135 mL/L) were maintained as presented in Table 2. The response surface plots from the data clearly showed the significance of variables and their mutual interaction. Similarly, glucan from Leuconostoc dextranicum NRRL B-1146 was influenced by the sucrose and the released enzyme glucansucrase in fermentation broth [51]. Therefore, glucan secreted from Enterococcus hirae OL616073 by our method was surpassing the previous reports of EPS production. Thus, demonstrated remarkable proficiency of Enterococcus hirae OL616073 as a glucan producer. In light of dearth of comparable studies in the existing literature with same independent variables, studies of similar focus using RSM methodologies have been used for drawing out the comparisons. According to earlier reports from Enterococcus strains, EPS yield varies between 2.07- 2.68 g/L at 40% (400 g/L) of sucrose, temperature 37 °C for 48 h [52]. The dextran yield of 50.56 (g/L) from Leuconostoc pseudomesenteroides JF17 was reported under optimized conditions of 18% (w/v) sucrose, 20 °C temperature and pH 7.3 [53].
Another, reported strain Lactobacillus sakei L3 yields a maximum 69.65 g/L dextran EPS at an initial pH of 6.87, 12.78% sucrose, and 3.15% inoculation volume [51]. Nonetheless, a lower yield of α-D-glucan from Bacillus velezensis RSDM1 was documented as 1.96 g/L under a combination of 6 % sucrose, 2 % peptone at 30 °C [54]. RSM optimizes fermentation parameters, determining optimal conditions mathematically to maximize EPS production. Its ability to analyze variable interactions could make it a valuable tool for the EPS production process across industries.
The influence of medium variables on biomass yield by Enterococcus hirae OL616073 was analyzed. The CCRD design and levels of each variable at thirty experimental runs for the biomass yield dry weight (g/L DW) as a response are presented in Table 2. The analysis of variance and fit statistics for the biomass production tabulated in Table 5 and Table 6 represents the model as significant (p ≤ 0.001) and the coefficient of determination (R2) was 0.9842 which means less than 2 % of the variability was not explained by the model. There was also a logical concord between predicted R2 and adjusted R2 that further acknowledges the significance of this model. The three-dimensional response surface plots (3D plots) presented in Figure 3 (g-l) indicate the interaction of variables for biomass production at different levels.
Moreover, the following second-order polynomial equation was derived with the design expert software to predict the biomass.
where, B is biomass yield (g/L), A is sucrose (%), B is time (h), and C is temperature (°C) and D is inoculum (%) of four coded independent variables.
Investigating bacterial biomass, particularly that of lactic acid bacteria, is crucial due to its widespread significance in fermentation, probiotics, and metabolite production. Production of glucan along with bacterial biomass could be a greener process without environmental issues. The optimum biomass from Enterococcus hirae OL616073 was 6.27 g/L at 37.91 % sucrose, inoculum of 14.98 % for 73 h at 26 °C as depicted in Table 7. However, scarce reports are available showing the effect of variables on bacterial biomass. Bacillus amyloliquefaciens BPRGS supplemented with 5 % sucrose at a temperature of 37 °C produced an optimum biomass of 15 g/L at 96 h which further declined drastically [55]. As a matter of fact, the cell biomass yield could be influenced by growth conditions provided for each individual strain [56]. Earlier reports from Acinetobacter nectaris showed a decrease in biomass from 3 to 2 g/L at 12 % and 18 % of sucrose concentrations respectively. Nonetheless, sucrose concentration has an insignificant effect on Bacillus atrophaeus biomass production [15]. Accordingly, the type of microorganisms involved and the system parameters have an impact on the biomass growth rate [57].
To determine the validity of the statistical model, predicted and actual values was confirmed, as listed in Table 7 to assess both glucan EPS and cell biomass production. The highest 122.10 g/L of glucan EPS was close to the predicted value of 119.17 g/L. similarly, the cell biomass was closely aligned to the predicted value, affirming the validity of the response and indicating the reliability of the model. Vasough et al. (2021) also reported that EPS production from Enterococcus spp. reveals the compliance between actual and predicted values [52]. According to Gu et al. (2017), increased cell biomass was correlated with EPS production [58]. In the earlier RSM reports, EPS yield was noted to be influenced by sucrose, inoculum volume and pH from Lactobacillus sakei L3 [51].
4. Economical Significance of Glucan EPS Optimization
Microbial EPS represent a versatile class of biomolecules with wide-ranging applications across food, pharmaceutical, agricultural, environmental, and health sectors, contributing to advancements in various industries and addressing key challenges in sustainability and human well-being. Hence, it is crucial to optimize their production processes for ensuring cost-effectiveness, quality, and sustainability in these industries. Optimization of microbial EPS production holds significant economic implications across industries. By refining production processes, including fermentation conditions, substrate selection, and strain engineering, manufacturers can enhance EPS yield, purity, and consistency while minimizing production costs. The optimization leads to increased efficiency in EPS manufacturing, reducing resource consumption and waste generation, thus improving overall production scalability and profitability. Moreover, a streamlined production pipeline ensures a stable and reliable supply of EPS for diverse applications with fostering innovation and competitiveness in these industries.
Ultimately, the EPS production optimisation encourages sustainable practices by optimising resource utilisation and minimizing environmental impact, in addition to motivating economic growth by opening up new market opportunities. Rising environmental awareness, growing pharmaceutical and healthcare sectors, and growing demand for functional food components are all driving significant growth in the Indian polysaccharide market. Microbial EPS have a lot of potential in this context because of numerous potentials and benefits. India can improve product quality, address major health and environmental concerns, and take advantage of growing market trends by utilising microbial EPS in food formulations, pharmaceutical formulations, agricultural practices, environmental remediation, and healthcare items. Furthermore, by encouraging innovation in biotechnology and associated industries, optimising microbial EPS production processes can support domestic manufacturing capabilities, lessen reliance on imports, and promote economic development.
5. Conclusion
The compositions of media employ a significant influence on both biomass and glucan EPS yield by Enterococcus hirae OL616073 during submerged fermentation. The findings of the study underscore the importance of sucrose concentration, time, temperature, and inoculum percentage as pivotal variables for optimization. Leveraging a Central Composite Rotatable Design (CCRD) based Response Surface Methodology (RSM) model, the research not only assessed but also forecasted the optimal conditions, resulting in a remarkable enhancement in glucan production from 20.2 g/L to 122.10 g/L. This achievement, to the best of our knowledge, represents one of the highest reported yields of glucan by a wild-type strain at the lab scale. However, these findings are based on experiments conducted at the laboratory scale, and thus, extrapolating these results to industrial settings may encounter challenges due to scale-up complexities, environmental variations, and downstream processing strategies. Nonetheless, these findings lay a robust foundation for scaling up glucan production and exploring its commercial potential across various sectors, including food, pharmaceuticals, and environmental applications. Future research endeavors should aim to address the identified limitations and pave the way for practical applications of glucan in diverse industries.
Authors contribution
Irshad Ahmad Shah: Design of the study, experimentation, original draft writing, review, and editing. Swati Tiwari: Writing, review, and editing. Palanisamy Bruntha Devi: Writing, review, and editing. Digambar Kavitake: Conceptualization, writing, review, and editing. Prathapkumar Halady Shetty: Conceptualization, design of the study, review, editing, and supervision.
Declaration of competing interest
The authors declare that they have no known competing financial interests or personal relationships that could have appeared to influence the work reported in this paper.
Acknowledgement
This work is a part of the research grant funded by the Indian Council of Medical Research (ICMR) Ad-hoc grant (Project Code No. 2019-8200 NCD-II). Authors Irshad Ahmad Shah, Digambar Kavitake, P. Bruntha Devi and Swati Tiwari are grateful to ICMR for Project assistant (Project code No. 2019-8200 NCD-II), the SERB - National Post-Doctoral Fellowship (SERB-NPDF) (PDF/2021/000551), DST WISE KIRAN Scheme (DST/ WOS-A/LS -259/2019 (G) and ICMR- Senior Research Fellowship (ICMR-SRF- 3/1/2/287/2021-Nut) respectively for the financial assistance.
References
- Vinothini, G.; Latha, S.; Arulmozhi, M.; Dhanasekaran, D. Statistical Optimization, Physio-Chemical and Bio-Functional Attributes of a Novel Exopolysaccharide from Probiotic Streptomyces Griseorubens GD5. Int. J. Biol. Macromol. 2019, 134, 575–587. [Google Scholar] [CrossRef] [PubMed]
- Korcz, E.; Varga, L. Exopolysaccharides from Lactic Acid Bacteria: Techno-Functional Application in the Food Industry. Trends Food Sci. Technol. 2021, 110, 375–384. [Google Scholar] [CrossRef]
- Ale, E.C.; Irazoqui, J.M.; Ale, A.; Peralta, G.H.; Puntillo, M.; Burns, P.; Correa Olivar, G.; Cazenave, J.; Bergamini, C. V; Amadio, A.F. Protective Role of Limosilactobacillus Fermentum Lf2 and Its Exopolysaccharides (EPS) in a TNBS-Induced Chronic Colitis Mouse Model. Fermentation 2024, 10, 77. [Google Scholar] [CrossRef]
- Asgher, M.; Qamar, S.A.; Iqbal, H.M.N. Microbial Exopolysaccharide-Based Nano-Carriers with Unique Multi-Functionalities for Biomedical Sectors. Biologia (Bratisl). 2021, 76, 673–685. [Google Scholar] [CrossRef]
- Kavitake, D.; Tiwari, S.; Shah, I.A.; Devi, P.B.; Delattre, C.; Reddy, G.B.; Shetty, P.H. Antipathogenic Potentials of Exopolysaccharides Produced by Lactic Acid Bacteria and Their Food and Health Applications. Food Control 2023, 109850. [Google Scholar] [CrossRef]
- Hamidi, M.; Mirzaei, R.; Delattre, C.; Khanaki, K.; Pierre, G.; Gardarin, C.; Petit, E.; Karimitabar, F.; Faezi, S. Characterization of a New Exopolysaccharide Produced by Halorubrum Sp. TBZ112 and Evaluation of Its Anti-Proliferative Effect on Gastric Cancer Cells. 3 Biotech 2019, 9, 1–8. [Google Scholar] [CrossRef]
- Dilna, S.V.; Surya, H.; Aswathy, R.G.; Varsha, K.K.; Sakthikumar, D.N.; Pandey, A.; Nampoothiri, K.M. Characterization of an Exopolysaccharide with Potential Health-Benefit Properties from a Probiotic Lactobacillus Plantarum RJF4. LWT - Food Sci. Technol. 2015, 64, 1179–1186. [Google Scholar] [CrossRef]
- Wang, J.; Zhao, X.; Yang, Y.; Zhao, A.; Yang, Z. Characterization and Bioactivities of an Exopolysaccharide Produced by Lactobacillus Plantarum YW32. Int. J. Biol. Macromol. 2015, 74, 119–126. [Google Scholar] [CrossRef]
- Wang, K.; Li, W.; Rui, X.; Chen, X.; Jiang, M.; Dong, M. Characterization of a Novel Exopolysaccharide with Antitumor Activity from Lactobacillus Plantarum 70810. Int. J. Biol. Macromol. 2014, 63, 133–139. [Google Scholar] [CrossRef]
- Freitas, F.; Torres, C.A. V; Reis, M.A.M. Engineering Aspects of Microbial Exopolysaccharide Production. Bioresour. Technol. 2017, 245, 1674–1683. [Google Scholar] [CrossRef]
- Gan, L.; Huang, X.; He, Z.; He, T. Exopolysaccharide Production by Salt-Tolerant Bacteria: Recent Advances, Current Challenges, and Future Prospects. Int. J. Biol. Macromol. 2024, 130731. [Google Scholar] [CrossRef] [PubMed]
- Elmansy, E.A.; Elkady, E.M.; Asker, M.S.; Abdallah, N.A.; Khalil, B.E.; Amer, S. k Improved Production of Lactiplantibacillus Plantarum RO30 Exopolysaccharide (REPS) by Optimization of Process Parameters through Statistical Experimental Designs. BMC Microbiol. 2023, 23, 361. [Google Scholar] [CrossRef] [PubMed]
- Kavitake, D.; Tiwari, S.; Devi, P.B.; Shah, I.A.; Reddy, G.B.; Shetty, P.H. Production, Purification, and Functional Characterization of Glucan Exopolysaccharide Produced by Enterococcus Hirae Strain OL616073 of Fermented Food Origin. Int. J. Biol. Macromol. 2024, 129105. [Google Scholar] [CrossRef]
- Koko, M.Y.F.; Hassanin, H.A.M.; Qi, B.; Han, L.; Lu, K.; Rokayya, S.; Harimana, Y.; Zhang, S.; Li, Y. Hydrocolloids as Promising Additives for Food Formulation Consolidation: A Short Review. Food Rev. Int. 2023, 39, 1433–1439. [Google Scholar] [CrossRef]
- González-Garcinuño, Á.; Tabernero, A.; Sánchez-Álvarez, J.M.; Galán, M.A.; Martin Del Valle, E.M. Effect of Bacteria Type and Sucrose Concentration on Levan Yield and Its Molecular Weight. Microb. Cell Fact. 2017, 16, 91. [Google Scholar] [CrossRef]
- Rabha, B.; Nadra, R.-S.; Ahmed, B. Effect of Some Fermentation Substrates and Growth Temperature on Exopolysaccharide Production by Streptococcus Thermophilus BN1. Int. J. Biosci. Biochem. Bioinforma. 2012, 2, 44–47. [Google Scholar] [CrossRef]
- Amiri, S.; Mokarram, R.R.; Khiabani, M.S.; Bari, M.R.; Khaledabad, M.A. Exopolysaccharides Production by Lactobacillus Acidophilus LA5 and Bifidobacterium Animalis Subsp. Lactis BB12: Optimization of Fermentation Variables and Characterization of Structure and Bioactivities. Int. J. Biol. Macromol.
- Oleksy-Sobczak, M.; Klewicka, E.; Piekarska-Radzik, L. Exopolysaccharides Production by Lactobacillus Rhamnosus Strains – Optimization of Synthesis and Extraction Conditions. LWT 2020, 122, 109055. [Google Scholar] [CrossRef]
- Badel, S.; Bernardi, T.; Michaud, P. New Perspectives for Lactobacilli Exopolysaccharides. Biotechnol. Adv. 2011, 29, 54–66. [Google Scholar] [CrossRef]
- Madhuri, K. V; Prabhakar, K.V. Microbial Exopolysaccharides: Biosynthesis and Potential Applications. Orient. J. Chem. 2014, 30, 1401. [Google Scholar] [CrossRef]
- Kavitake, D.; Devi, P.B.; Singh, S.P.; Shetty, P.H. Characterization of a Novel Galactan Produced by Weissella Confusa KR780676 from an Acidic Fermented Food. Int. J. Biol. Macromol. 2016, 86, 681–689. [Google Scholar] [CrossRef]
- Dubois, M.; Gilles, K.A.; Hamilton, J.K.; Rebers, P.A.; Smith, F. Colorimetric Method for Determination of Sugars and Related Substances. Anal. Chem. 1956, 28, 350–356. [Google Scholar] [CrossRef]
- Ezhil, I.; Belur, P.D.; Saidutta, M.B. Production Optimization of a New Exopolysaccharide from Bacillus Methylotrophicus and Its Characterization. Int. J. Biotechnol. Biochem. 2015, 11, 21–39. [Google Scholar]
- Raza, W.; Makeen, K.; Wang, Y.; Xu, Y.; Qirong, S. Optimization, Purification, Characterization and Antioxidant Activity of an Extracellular Polysaccharide Produced by Paenibacillus Polymyxa SQR-21. Bioresour. Technol. 2011, 102, 6095–6103. [Google Scholar] [CrossRef]
- Pham, P.L.; Dupont, I.; Roy, D.; Lapointe, G.; Cerning, J. Production of Exopolysaccharide by Lactobacillus Rhamnosus R and Analysis of Its Enzymatic Degradation during Prolonged Fermentation. Appl. Environ. Microbiol. 2000, 66, 2302–2310. [Google Scholar] [CrossRef] [PubMed]
- Baruah, R.; Maina, N.H.; Katina, K.; Juvonen, R.; Goyal, A. International Journal of Food Microbiology Functional Food Applications of Dextran from Weissella Cibaria RBA12 from Pummelo ( Citrus Maxima ). Int. J. Food Microbiol. 2017, 242, 124–131. [Google Scholar] [CrossRef]
- Velasco, S.; Årsköld, E.; Paese, M.; Grage, H.; Irastorza, A.; Rådström, P.; Van Niel, E.W.J. Environmental Factors Influencing Growth of and Exopolysaccharide Formation by Pediococcus Parvulus 2.6. Int. J. Food Microbiol. 2006, 111, 252–258. [Google Scholar] [CrossRef]
- Gamar, L.; Blondeau, K.; Simonet, J. Physiological Approach to Extracellular Polysaccharide Production by Lactobacillus Rhamnosus Strain C83. J. Appl. Microbiol. 1997, 83, 281–287. [Google Scholar] [CrossRef]
- Castellane, T.C.L.; Campanharo, J.C.; Colnago, L.A.; Coutinho, I.D.; Lopes, É.M.; Lemos, M.V.F.; de Macedo Lemos, E.G. Characterization of New Exopolysaccharide Production by Rhizobium Tropici during Growth on Hydrocarbon Substrate. Int. J. Biol. Macromol. 2017, 96, 361–369. [Google Scholar] [CrossRef]
- Welman, A.D.; Maddox, I.S. Exopolysaccharides from Lactic Acid Bacteria: Perspectives and Challenges. Trends Biotechnol. 2003, 21, 269–274. [Google Scholar] [CrossRef]
- Jenny Angel, S.; Vidyadharani, G.; Santhosh, S.; Dhandapani, R. Optimization and Characterisation of Thermo Stable Exopolysaccharide Produced from Bacillus Licheniformis WSF-1 Strain. J. Polym. Environ. 2018, 26, 3824–3833. [Google Scholar] [CrossRef]
- An, C.; Ma, S.; Chang, F.; Xue, W. Efficient Production of Pullulan by Aureobasidium Pullulans Grown on Mixtures of Potato Starch Hydrolysate and Sucrose. Brazilian J. Microbiol. 2017, 48, 180–185. [Google Scholar] [CrossRef] [PubMed]
- Sawale, S.D.; Lele, S.S. Statistical Optimization of Media for Dextran Production by Leuconostoc Sp., Isolated from Fermented Idli Batter. Food Sci. Biotechnol. 2010, 19, 471–478. [Google Scholar] [CrossRef]
- Rogalski, E.; Ehrmann, M.A.; Vogel, R.F. Intraspecies Diversity and Genome-Phenotype-Associations in Fructilactobacillus Sanfranciscensis. Microbiol. Res. 2021, 243, 126625. [Google Scholar] [CrossRef]
- Zhang, Y.; Dai, X.; Jin, H.; Man, C.; Jiang, Y. The Effect of Optimized Carbon Source on the Synthesis and Composition of Exopolysaccharides Produced by Lactobacillus Paracasei. J. Dairy Sci. 2021, 104, 4023–4032. [Google Scholar] [CrossRef] [PubMed]
- Nguyen, P.-T.; Nguyen, T.-T.; Bui, D.-C.; Hong, P.-T.; Hoang, Q.-K.; Nguyen, H.-T. Exopolysaccharide Production by Lactic Acid Bacteria: The Manipulation of Environmental Stresses for Industrial Applications. AIMS Microbiol. 2020, 6, 451. [Google Scholar] [CrossRef]
- de Oliveira, M.R.; da Silva, R.S.S.F.; Buzato, J.B.; Celligoi, M.A.P.C. Study of Levan Production by Zymomonas Mobilis Using Regional Low-Cost Carbohydrate Sources. Biochem. Eng. J. 2007, 37, 177–183. [Google Scholar] [CrossRef]
- Doelle, H.W.; Greenfield, P.F. Fermentation Pattern of Zymomonas Mobilis at High Sucrose Concentrations. Appl. Microbiol. Biotechnol. 1985, 22, 411–415. [Google Scholar] [CrossRef]
- Chauhan, A.; Kanwar, S.S. Optimization of Exopolysaccharide Production by Response Surface Methodology from Enterococcus Faecium Isolated from the Fermented Foods of Western Himalaya. Int. J. Sci. Res. Biol. Sci. 2019, 6, 1–11. [Google Scholar] [CrossRef]
- Zanzan, M.; Ezzaky, Y.; Achemchem, F.; Elmoslih, A.; Hamadi, F.; Hasnaoui, A.; Ali, M.A. Optimisation of Thermostable Exopolysaccharide Production from Enterococcus Mundtii A2 Isolated from Camel Milk and Its Structural Characterisation. Int. Dairy J. 2023, 147, 105718. [Google Scholar] [CrossRef]
- Razack, S.A.; Velayutham, V.; Thangavelu, V. Influence of Various Parameters on Exopolysaccharide Production from Bacillus Subtilis. Int. J. ChemTech Res. 2013, 5, 2221–2228. [Google Scholar]
- Liu, J.; Wang, X.; Pu, H.; Liu, S.; Kan, J.; Jin, C. Recent Advances in Endophytic Exopolysaccharides: Production, Structural Characterization, Physiological Role and Biological Activity. Carbohydr. Polym. 2017, 157, 1113–1124. [Google Scholar] [CrossRef] [PubMed]
- Borah, D.; Nainamalai, S.; Gopalakrishnan, S.; Rout, J.; Alharbi, N.S.; Alharbi, S.A.; Nooruddin, T. Biolubricant Potential of Exopolysaccharides from the Cyanobacterium Cyanothece Epiphytica. Appl. Microbiol. Biotechnol. 2018, 102, 3635–3647. [Google Scholar] [CrossRef]
- Bengoa, A.A.; Llamas, M.G.; Iraporda, C.; Dueñas, M.T.; Abraham, A.G.; Garrote, G.L. Impact of Growth Temperature on Exopolysaccharide Production and Probiotic Properties of Lactobacillus Paracasei Strains Isolated from Kefir Grains. Food Microbiol. 2018, 69, 212–218. [Google Scholar] [CrossRef] [PubMed]
- Wongsuphachat, W.; Maneerat, S. Optimization of Exopolysaccharides Production by Weissella Confusa NH 02 Isolated from Thai Fermented Sausages. Songklanakarin J. Sci. Technol. 2010, 32. [Google Scholar]
- Polak-Berecka, M.; Waśko, A.; Kubik-Komar, A. Optimization of Culture Conditions for Exopolysaccharide Production by a Probiotic Strain of Lactobacillus Rhamnosus E/N. Polish J. Microbiol. 2014, 63, 253. [Google Scholar] [CrossRef]
- Aslim, B.; Yüksekdag˘, Z.N.; Beyatli, Y.; Mercan, N. Exopolysaccharide Production by Lactobacillus Delbruckii Subsp. Bulgaricus and Streptococcus Thermophilus Strains under Different Growth Conditions. World J. Microbiol. Biotechnol. 2005, 21, 673–677. [Google Scholar] [CrossRef]
- Arous, F.; Azabou, S.; Jaouani, A.; Zouari-Mechichi, H.; Nasri, M.; Mechichi, T. Biosynthesis of Single-Cell Biomass from Olive Mill Wastewater by Newly Isolated Yeasts. Environ. Sci. Pollut. Res. 2016, 23, 6783–6792. [Google Scholar] [CrossRef]
- Chen, W.; Zhao, Z.; Chen, S.-F.; Li, Y.-Q. Optimization for the Production of Exopolysaccharide from Fomes Fomentarius in Submerged Culture and Its Antitumor Effect in Vitro. Bioresour. Technol. 2008, 99, 3187–3194. [Google Scholar] [CrossRef]
- Zhang, R.; Zhou, Z.; Ma, Y.; Du, K.; Sun, M.; Zhang, H.; Tu, H.; Jiang, X.; Lu, J.; Tu, L. Production of the Exopolysaccharide from Lactiplantibacillus Plantarum YT013 under Different Growth Conditions: Optimum Parameters and Mathematical Analysis. Int. J. Food Prop. 2023, 26, 1941–1952. [Google Scholar] [CrossRef]
- Wang, B.; Song, Q.; Zhao, F.; Han, Y.; Zhou, Z. Production Optimization, Partial Characterization and Properties of an Exopolysaccharide from Lactobacillus Sakei L3. Int. J. Biol. Macromol. 2019, 141, 21–28. [Google Scholar] [CrossRef]
- Rahnama Vosough, P.; Habibi Najafi, M.B.; Edalatian Dovom, M.R.; Javadmanesh, A.; Mayo, B. Evaluation of Antioxidant, Antibacterial and Cytotoxicity Activities of Exopolysaccharide from Enterococcus Strains Isolated from Traditional Iranian Kishk. J. Food Meas. Charact. 2021, 15, 5221–5230. [Google Scholar] [CrossRef]
- Farinazzo, F.S.; Fernandes, M.T.C.; Mauro, C.S.I.; Garcia, S. Statistical Optimization of Exopolysaccharide Production by Leuconostoc Pseudomesenteroides JF17 from Native Atlantic Forest Juçara Fruit. Prep. Biochem. Biotechnol. 2022, 52, 245–252. [Google Scholar] [CrossRef] [PubMed]
- Derdak, R.; Sakoui, S.; Pop, O.L.; Vodnar, D.C.; Addoum, B.; Teleky, B.-E.; Elemer, S.; Elmakssoudi, A.; Suharoschi, R.; Soukri, A. Optimisation and Characterization of α-D-Glucan Produced by Bacillus Velezensis RSDM1 and Evaluation of Its Protective Effect on Oxidative Stress in Tetrahymena Thermophila Induced by H2O2. Int. J. Biol. Macromol. 2022, 222, 3229–3242. [Google Scholar] [CrossRef] [PubMed]
- Rao, B.P.; Sudharsan, K.; Sekaran, R.; Mandal, A.B. Characterization of Exopolysaccharide from Bacillus Amyloliquefaciens BPRGS for Its Bioflocculant Activity. Int. J. Sci. Eng. Res 2013, 4, 1696–1704. [Google Scholar]
- Niknezhad, S.V.; Morowvat, M.H.; Najafpour Darzi, G.; Iraji, A.; Ghasemi, Y. Exopolysaccharide from Pantoea Sp. BCCS 001 GH Isolated from Nectarine Fruit: Production in Submerged Culture and Preliminary Physicochemical Characterizations. Food Sci. Biotechnol. 2018, 27, 1735–1746. [Google Scholar] [CrossRef]
- Laspidou, C.S.; Rittmann, B.E. A Unified Theory for Extracellular Polymeric Substances, Soluble Microbial Products, and Active and Inert Biomass. Water Res. 2002, 36, 2711–2720. [Google Scholar] [CrossRef]
- Gu, D.; Jiao, Y.; Wu, J.; Liu, Z.; Chen, Q. Optimization of EPS Production and Characterization by a Halophilic Bacterium, Kocuria Rosea ZJUQH from Chaka Salt Lake with Response Surface Methodology. Molecules 2017, 22, 814. [Google Scholar] [CrossRef]
Figure 1.
Growth profile of Enterococcus hirae OL616073 and glucan production. Profile of incubation time versus glucan and optical density of Enterococcus hirae OL616073 in sucrose-supplemented medium (2%) maintained at 30°C under static conditions (A); Effect of incubation time on glucan production and log N (cfu/mL) by Enterococcus hirae OL616073 (B); Culture optimization of Enterococcus hirae OL616073 OL616073 strain (C).
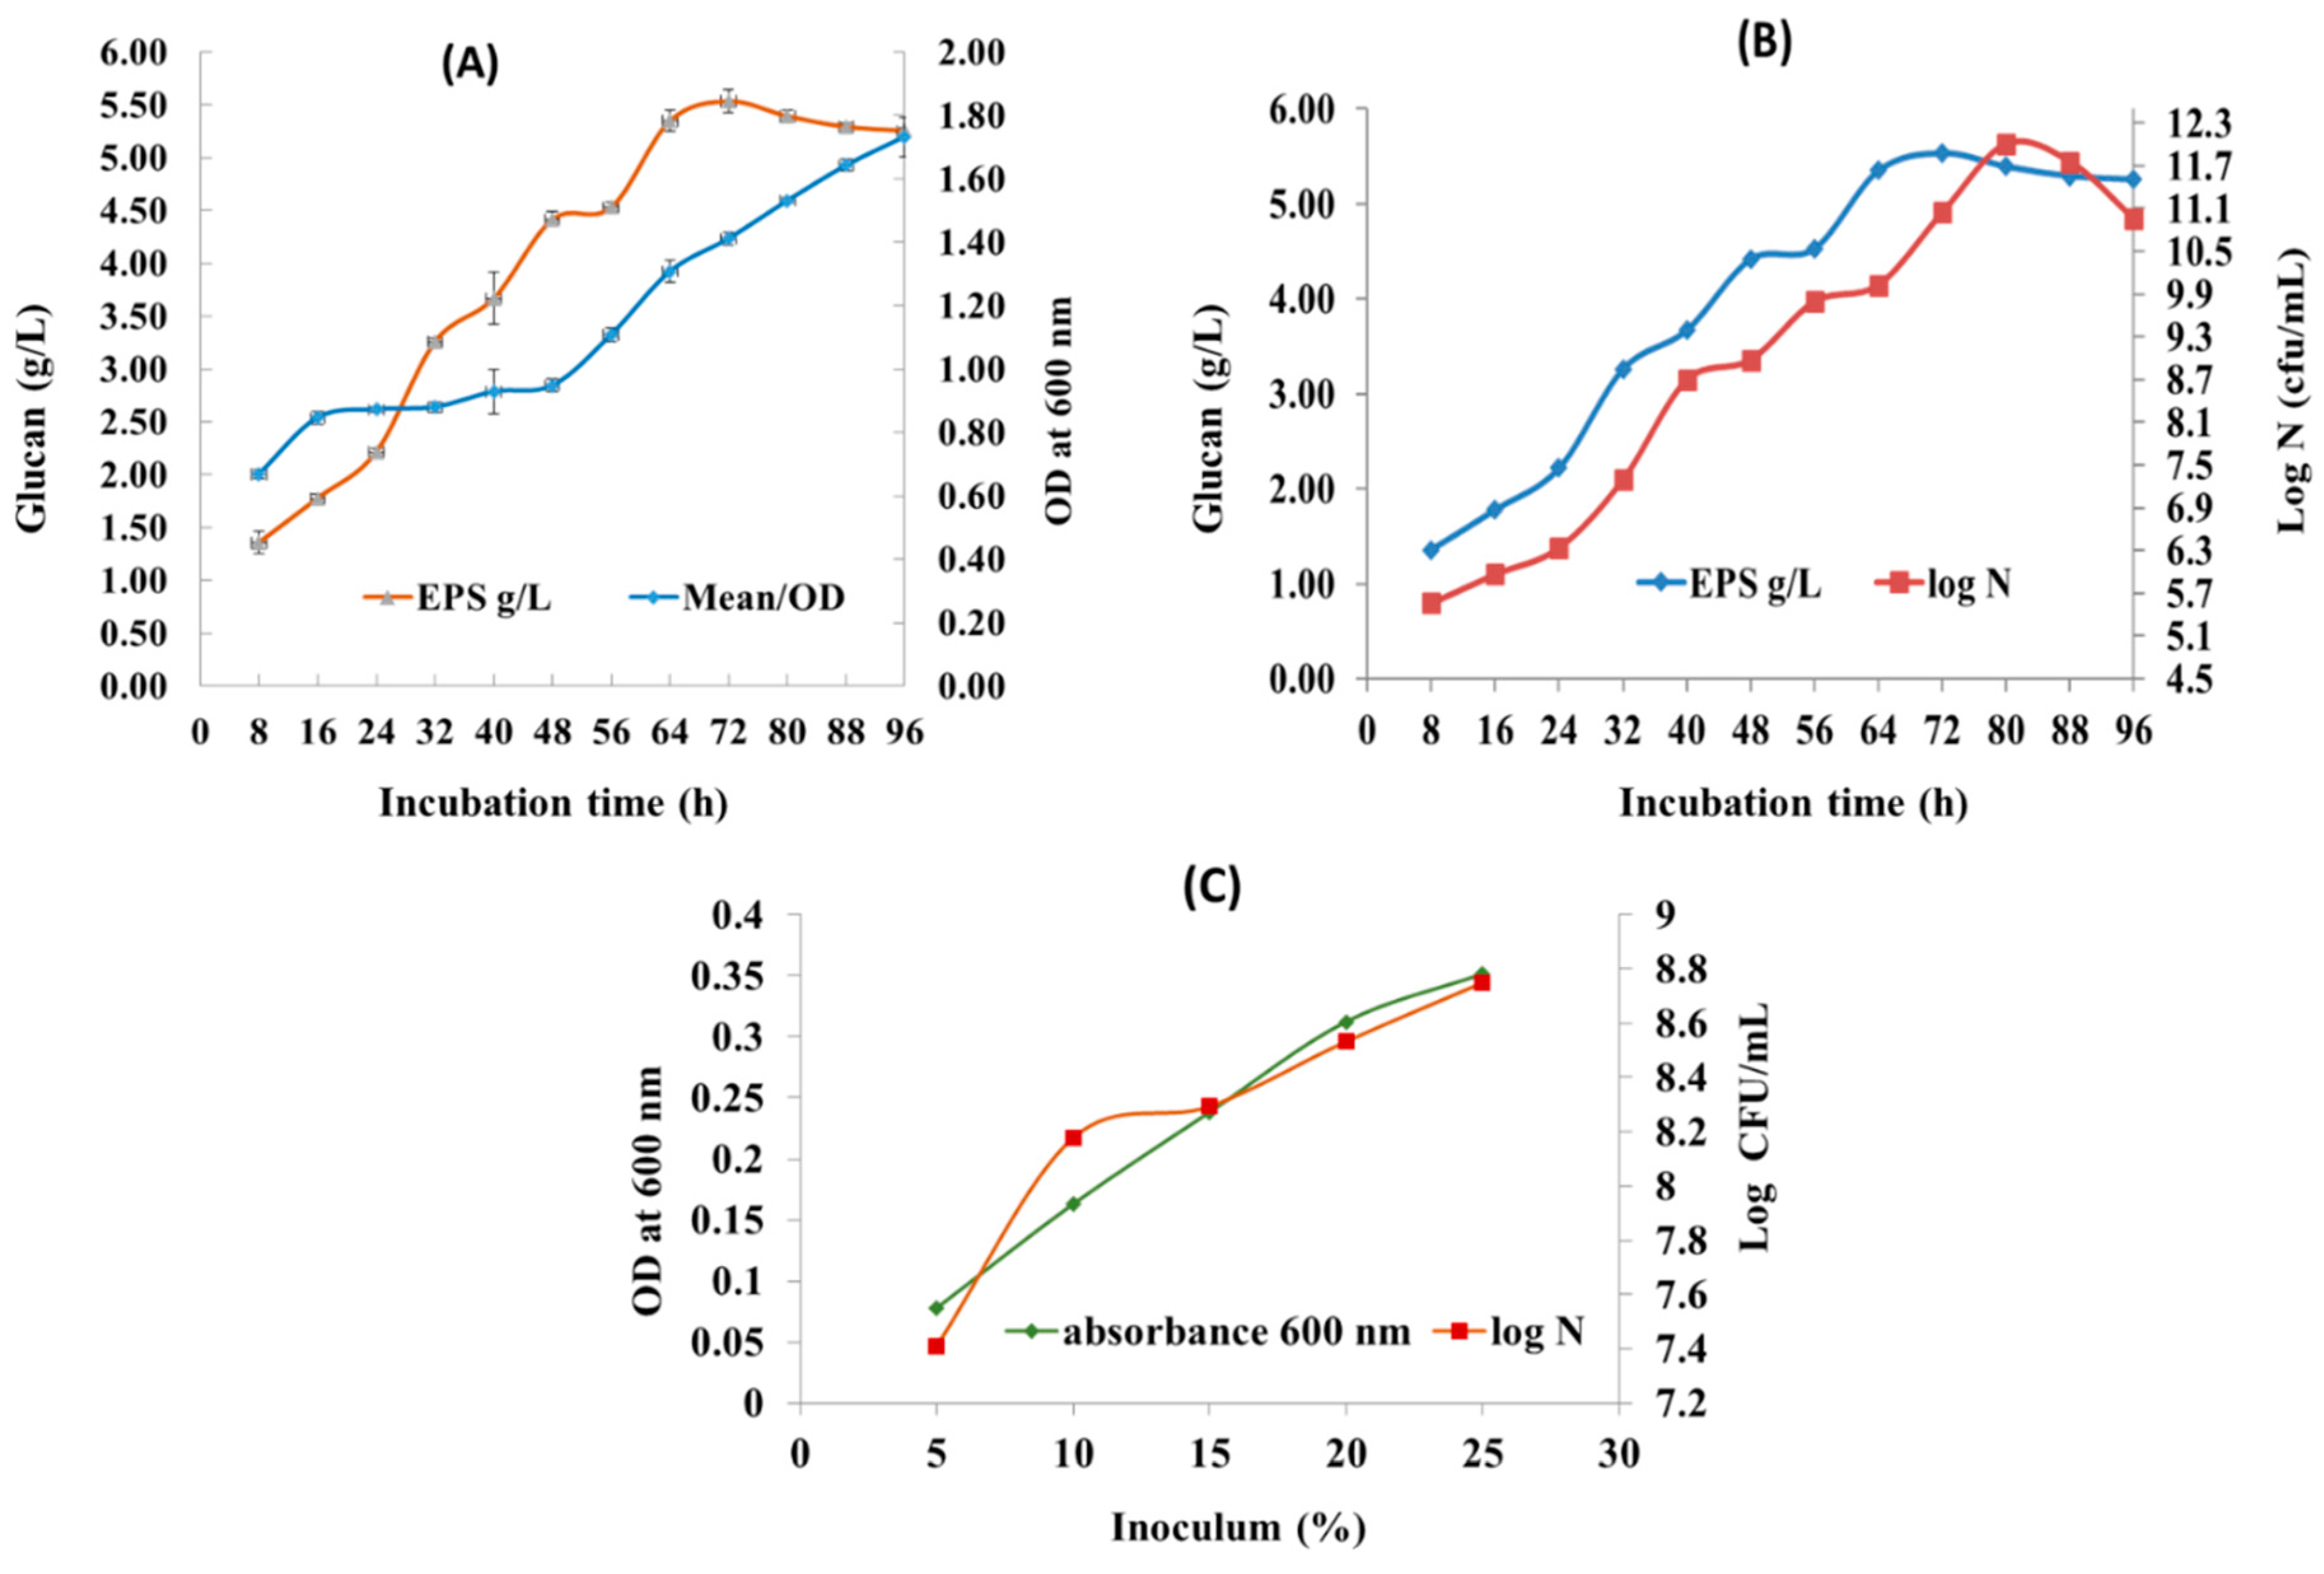
Figure 2.
Response surface curve (3D plot) of glucan production from Enterococcus hirae OL616073 showing the interaction between (a) Sucrose concentration and time,(b) Sucrose concentration and temperature, (c) sucrose concentration and inoculum concentration,(d) Time and temperature, (e) Time and inoculum, (f) Temperature and inoculum.
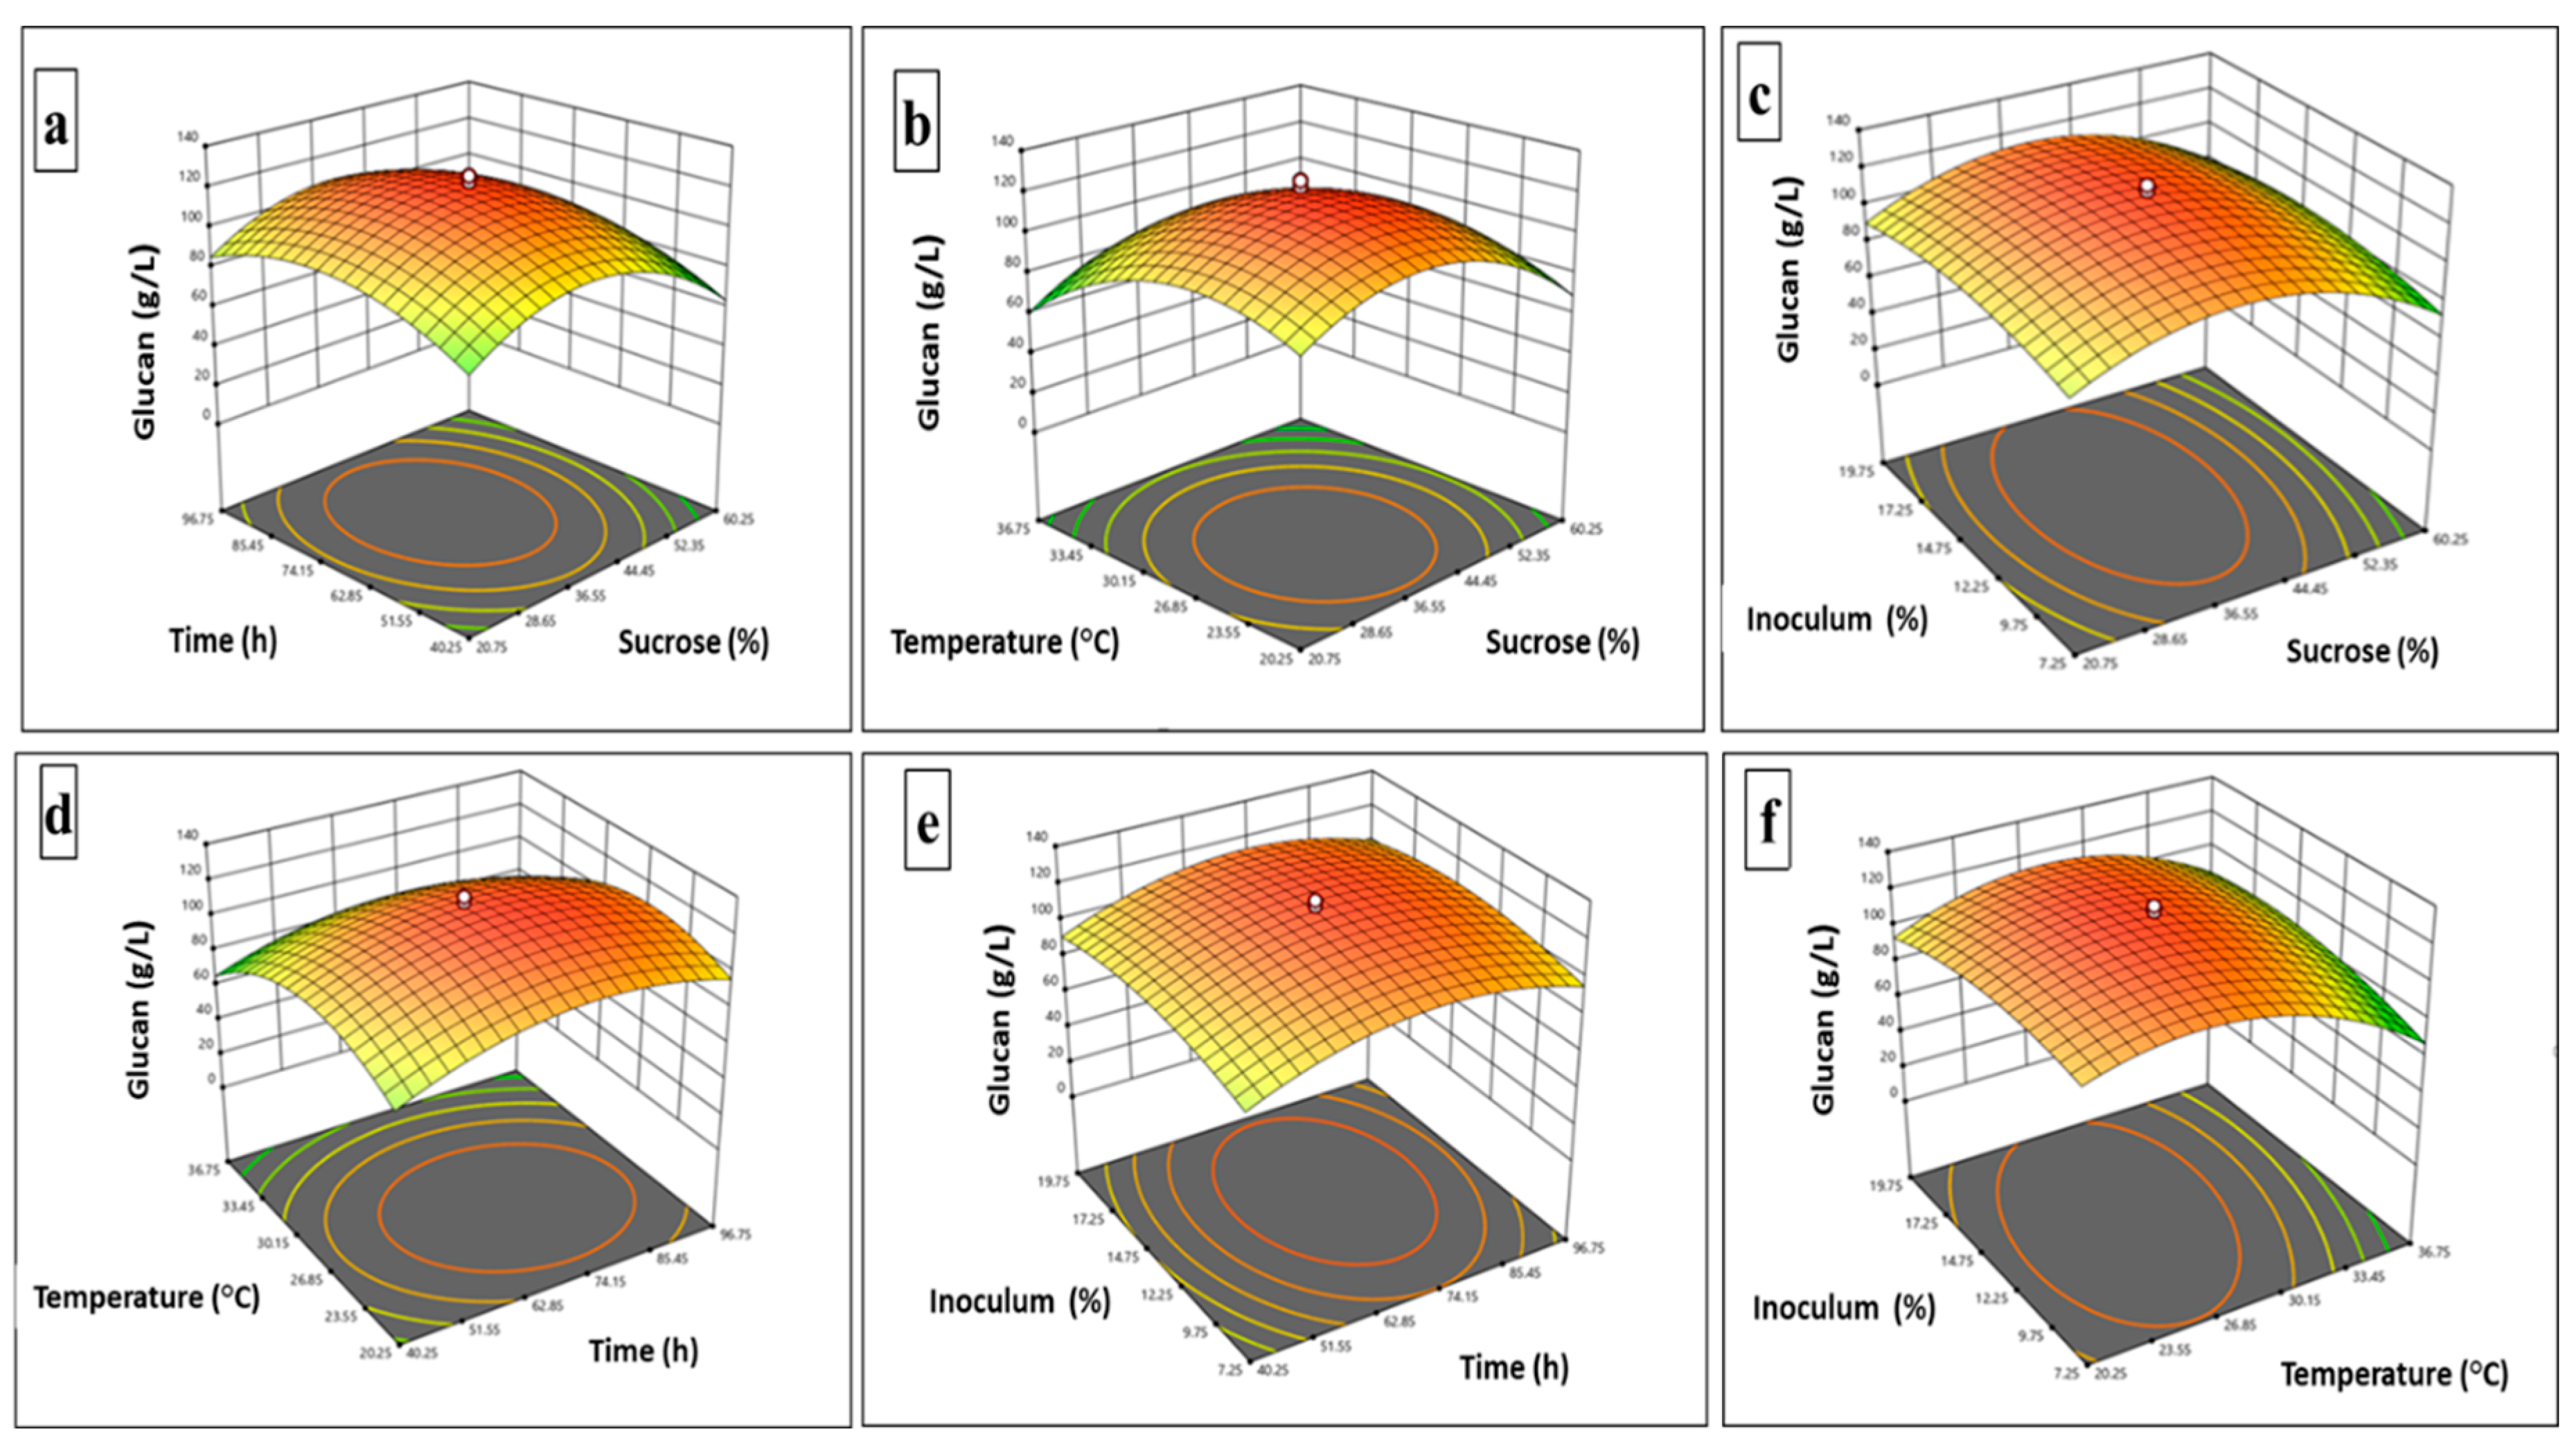
Figure 3.
Response surface curve (3D plot) of biomass production from Enterococcus hirae OL616073 Showing the interaction between (g) Sucrose concentration and time,(h) Sucrose concentration and temperature, (i) sucrose concentration and inoculum concentration,(j) Time and temperature, (k) Time and inoculum, (l) Temperature and inoculum.
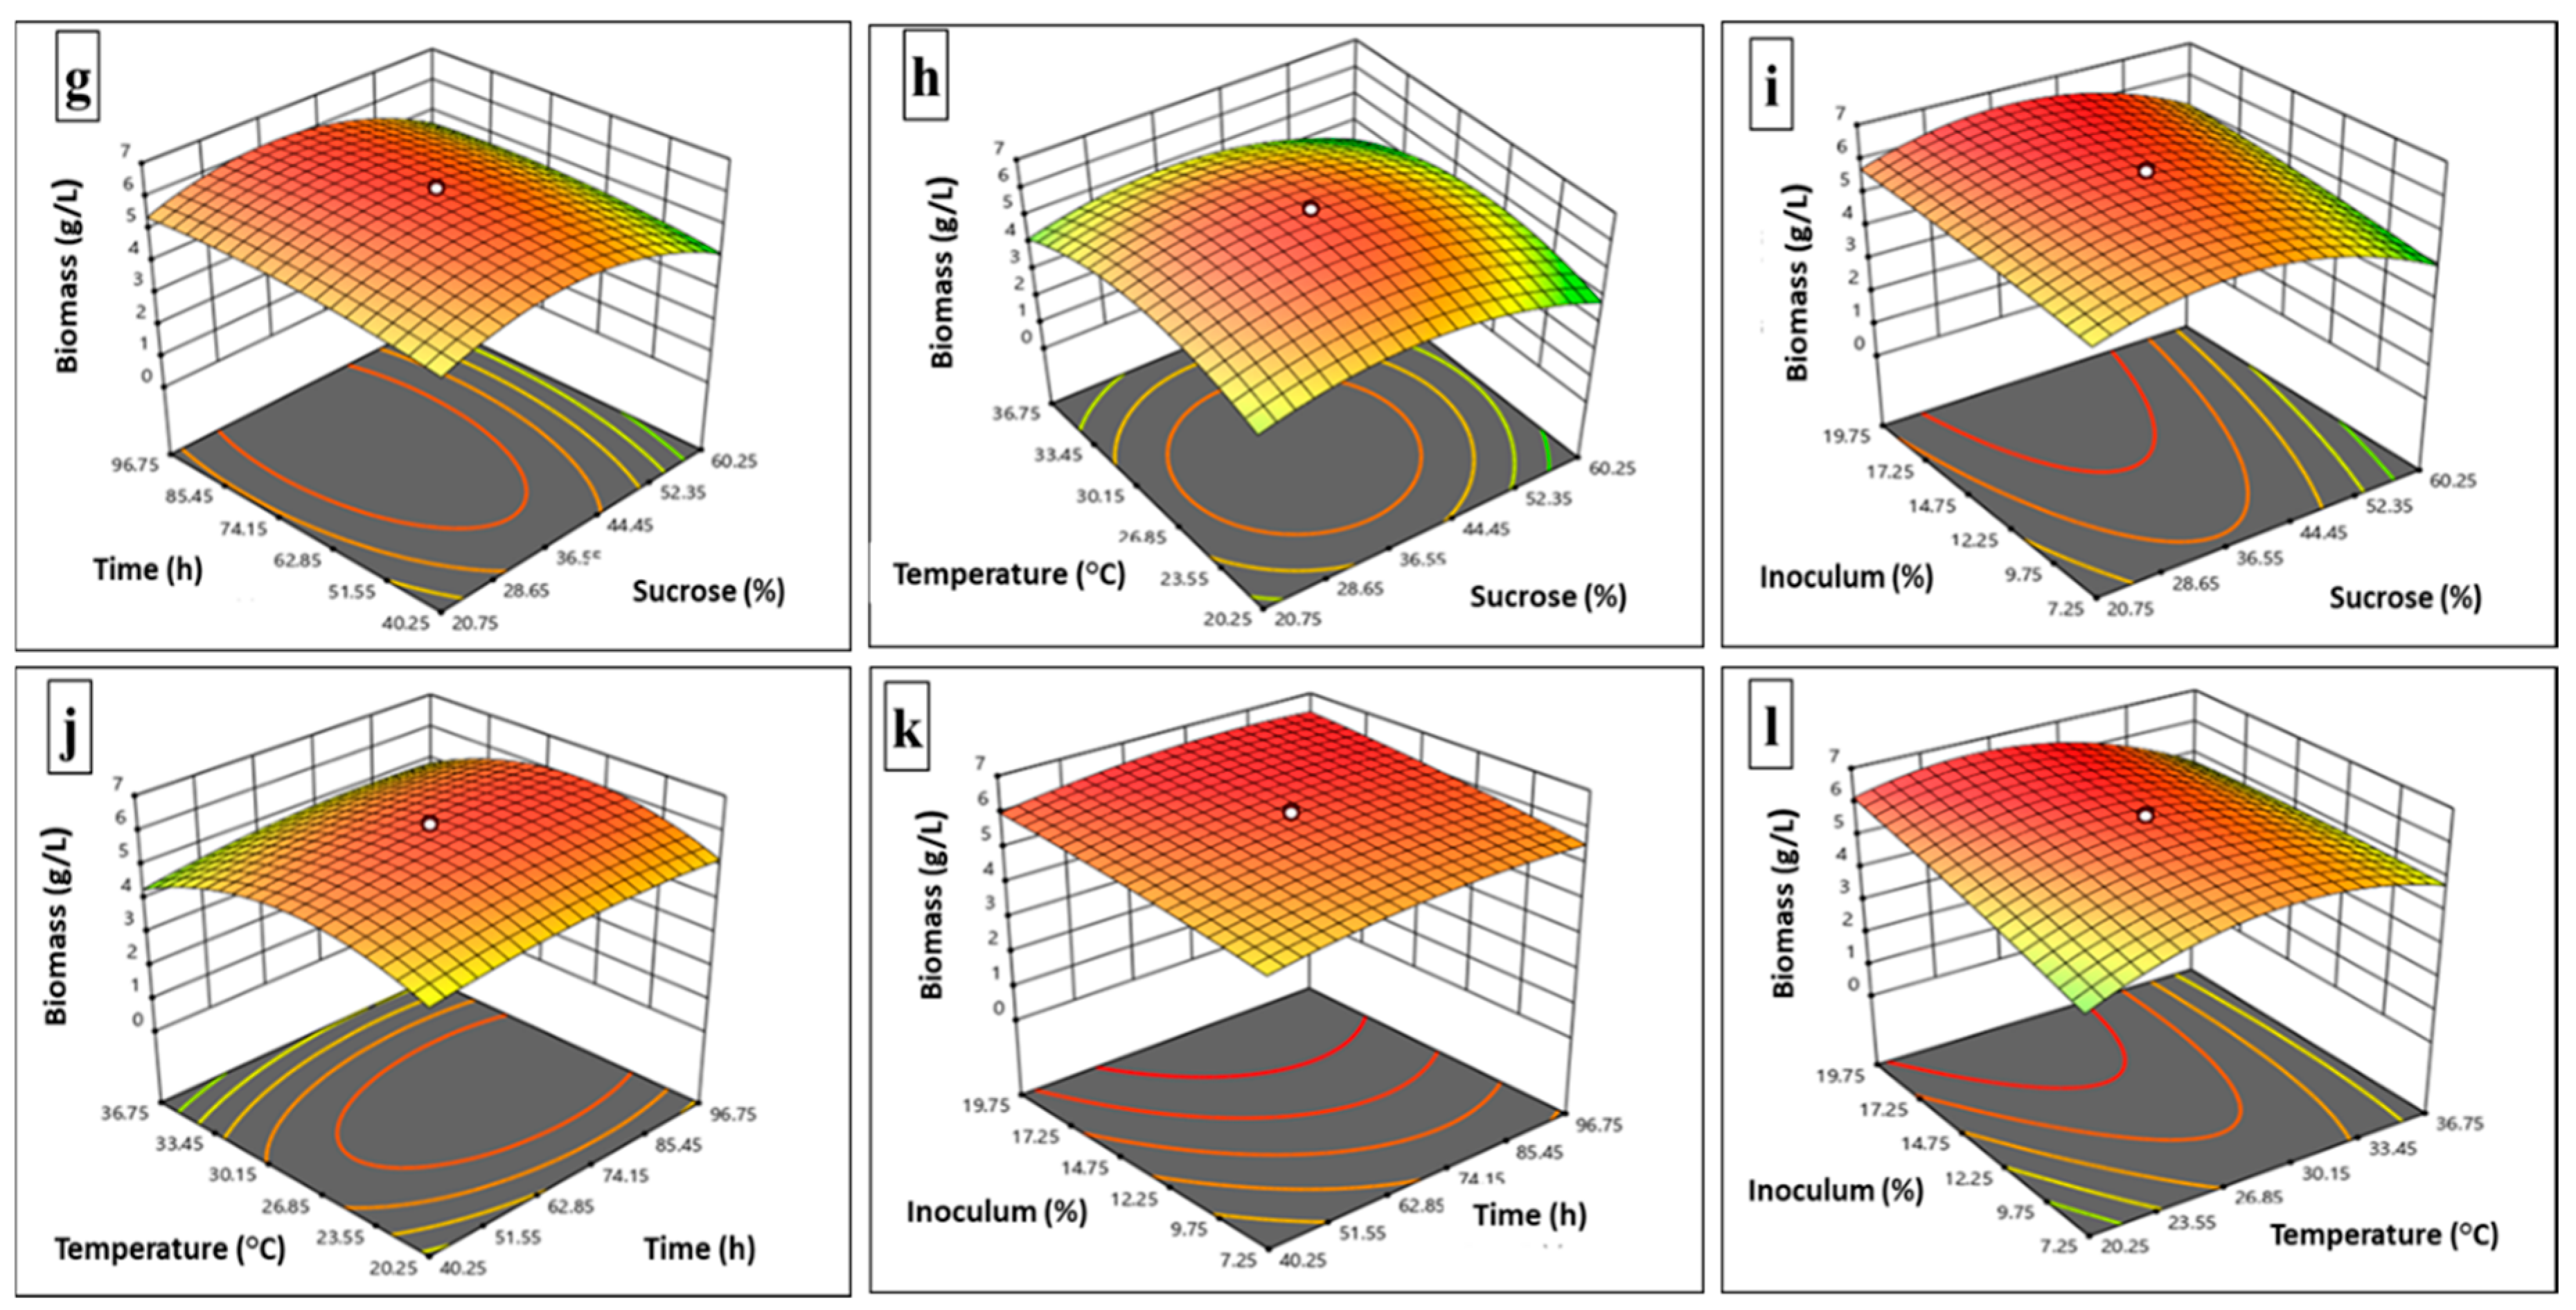

Table 1.
CCRD Experimental design variables : Coded and uncoded values.
| Independent variables | Coded levels of independent variables | ||||
| −2 | −1 | 0 | +1 | +2 | |
| Sucrose (%) | 1 | 20.75 | 40.5 | 60.25 | 80 |
| Time (h) | 12 | 40.25 | 68.5 | 96.75 | 125 |
| Temperature(°C) | 12 | 20.25 | 28.5 | 36.77 | 45 |
| Inoculum (%) | 1 | 7.25 | 13.5 | 19.75 | 26 |
Table 2.
Experimental design: CCRD of independent variables and dependent variables glucan production and cell biomass by Enterococcus hirae OL616073.
Table 2.
Experimental design: CCRD of independent variables and dependent variables glucan production and cell biomass by Enterococcus hirae OL616073.
| Independent variables | Dependent variables | ||||||
| Std | Run | Sucrose (%) | Time (h) | Temperature (°C) |
Inoculum (%) | EPS (g/L) | Biomass (g/L) |
| 16 | 1 | 60.25 | 96.75 | 36.75 | 19.75 | 39.23 | 3.32 |
| 3 | 2 | 20.75 | 96.75 | 20.25 | 7.25 | 76.5 | 3.25 |
| 5 | 3 | 20.75 | 40.25 | 36.75 | 7.25 | 27.25 | 3.61 |
| 4 | 4 | 60.25 | 96.75 | 20.25 | 7.25 | 51.67 | 2.5 |
| 26 | 5 | 40.5 | 68.5 | 28.5 | 13.5 | 117.2 | 6.27 |
| 7 | 6 | 20.75 | 96.75 | 36.75 | 7.25 | 31.6 | 4.2 |
| 29 | 7 | 40.5 | 68.5 | 28.5 | 13.5 | 122.6 | 6.18 |
| 6 | 8 | 60.25 | 40.25 | 36.75 | 7.25 | 18.65 | 2.8 |
| 12 | 9 | 60.25 | 96.75 | 20.25 | 19.75 | 45.67 | 4.77 |
| 17 | 10 | 1 | 68.5 | 28.5 | 13.5 | 13.78 | 2.6 |
| 20 | 11 | 40.5 | 125 | 28.5 | 13.5 | 61.34 | 5.8 |
| 21 | 12 | 40.5 | 68.5 | 12 | 13.5 | 45.25 | 2.48 |
| 27 | 13 | 40.5 | 68.5 | 28.5 | 13.5 | 118.3 | 5.98 |
| 28 | 14 | 40.5 | 68.5 | 28.5 | 13.5 | 119.21 | 6.26 |
| 23 | 15 | 40.5 | 68.5 | 28.5 | 1 | 77.12 | 5.12 |
| 2 | 16 | 60.25 | 40.25 | 20.25 | 7.25 | 39.24 | 2.3 |
| 18 | 17 | 80 | 68.5 | 28.5 | 13.5 | 2.2 | 0.98 |
| 19 | 18 | 40.5 | 12 | 28.5 | 13.5 | 37.25 | 4.2 |
| 8 | 19 | 60.25 | 96.75 | 36.75 | 7.25 | 18.12 | 3.27 |
| 10 | 20 | 60.25 | 40.25 | 20.25 | 19.75 | 31.25 | 4.53 |
| 24 | 21 | 40.5 | 68.5 | 28.5 | 26 | 89.27 | 6.3 |
| 11 | 22 | 20.75 | 96.75 | 20.25 | 19.75 | 63.24 | 5.32 |
| 25 | 23 | 40.5 | 68.5 | 28.5 | 13.5 | 116.3 | 5.8 |
| 15 | 24 | 20.75 | 96.75 | 36.75 | 19.75 | 45.23 | 4.06 |
| 30 | 25 | 40.5 | 68.5 | 28.5 | 13.5 | 125.56 | 6.2 |
| 22 | 26 | 40.5 | 68.5 | 45 | 13.5 | 2.23 | 1.34 |
| 9 | 27 | 20.75 | 40.25 | 20.25 | 19.75 | 54.19 | 4.9 |
| 13 | 28 | 20.75 | 40.25 | 36.75 | 19.75 | 43.27 | 3.8 |
| 1 | 29 | 20.75 | 40.25 | 20.25 | 7.25 | 62.22 | 3.4 |
| 14 | 30 | 60.25 | 40.25 | 36.75 | 19.75 | 34.28 | 3.1 |
Table 3.
Analysis of variance (ANOVA) for the experimental results of the CCD quadratic model for glucan production.
Table 3.
Analysis of variance (ANOVA) for the experimental results of the CCD quadratic model for glucan production.
| Source | Sum of squares | df | Mean Square | F-Value | P-Value | |
| Model | 40627.49 | 14 | 2901.96 | 169.09 | < 0.0001 | significant |
| A-Sucrose | 919.46 | 1 | 919.46 | 53.58 | < 0.0001 | |
| B-Time | 495.86 | 1 | 495.86 | 28.89 | < 0.0001 | |
| C-Temperature | 2654.20 | 1 | 2654.20 | 154.66 | < 0.0001 | |
| D-Inoculum | 127.93 | 1 | 127.93 | 7.45 | 0.0155 | |
| AB | 0.1661 | 1 | 0.1661 | 0.0097 | 0.9229 | |
| AC | 164.16 | 1 | 164.16 | 9.57 | 0.0074 | |
| AD | 12.94 | 1 | 12.94 | 0.7541 | 0.3989 | |
| BC | 97.27 | 1 | 97.27 | 5.67 | 0.0310 | |
| BD | 0.0014 | 1 | 0.0014 | 0.0001 | 0.9929 | |
| CD | 646.05 | 1 | 646.05 | 37.64 | < 0.0001 | |
| A² | 21061.34 | 1 | 21061.34 | 1227.22 | < 0.0001 | |
| B² | 8289.07 | 1 | 8289.07 | 482.99 | < 0.0001 | |
| C² | 15501.16 | 1 | 15501.16 | 903.23 | < 0.0001 | |
| D² | 2177.04 | 1 | 2177.04 | 126.85 | < 0.0001 | |
| Residual | 257.43 | 15 | 17.16 | |||
| Lack of Fit | 194.83 | 10 | 19.48 | 1.56 | 0.3267 | not significant |
| Pure Error | 62.60 | 5 | 12.52 | |||
| Cor Total | 40884.92 | 29 |
Table 4.
Fit Statistics for glucan production.
| Std. Dev. | 4.14 | R² | 0.9937 |
| Mean | 57.64 | Adjusted R² | 0.9878 |
| C.V. % | 7.19 | Predicted R² | 0.9703 |
| Adeq Precision | 42.0645 |
Table 5.
Analysis of variance (ANOVA) for the experimental results of the CCRD quadratic model for biomass production by Enterococcus hirae OL616073.
Table 5.
Analysis of variance (ANOVA) for the experimental results of the CCRD quadratic model for biomass production by Enterococcus hirae OL616073.
| Source | Sum of squares | df | Mean Square | F-Value | P-Value | |
| Model | 68.46 | 14 | 4.89 | 66.82 | < 0.0001 | significant |
| A-Sucrose | 3.52 | 1 | 3.52 | 48.09 | < 0.0001 | |
| B-Time | 1.24 | 1 | 1.24 | 16.91 | 0.0009 | |
| C-Temperature | 1.08 | 1 | 1.08 | 14.75 | 0.0016 | |
| D-Inoculum | 4.89 | 1 | 4.89 | 66.78 | < 0.0001 | |
| AB | 6.250E-06 | 1 | 6.250E-06 | 0.0001 | 0.9927 | |
| AC | 0.0105 | 1 | 0.0105 | 0.1436 | 0.7101 | |
| AD | 0.0946 | 1 | 0.0946 | 1.29 | 0.2735 | |
| BC | 0.0431 | 1 | 0.0431 | 0.5884 | 0.4549 | |
| BD | 0.0001 | 1 | 0.0001 | 0.0008 | 0.9782 | |
| CD | 3.68 | 1 | 3.68 | 50.25 | < 0.0001 | |
| A² | 31.15 | 1 | 31.15 | 425.72 | < 0.0001 | |
| B² | 1.90 | 1 | 1.90 | 25.97 | 0.0001 | |
| C² | 29.42 | 1 | 29.42 | 402.09 | < 0.0001 | |
| D² | 0.2016 | 1 | 0.2016 | 2.75 | 0.1177 | |
| Residual | 1.10 | 15 | 0.0732 | |||
| Lack of Fit | 0.9237 | 10 | 0.0924 | 2.66 | 0.1463 | not significant |
| Pure Error | 0.1739 | 5 | 0.0348 | |||
| Cor Total | 69.56 | 29 |
Table 6.
Fit statistics for the biomass production.
| Std. Dev. | 0.2705 | R² | 0.9842 |
| Mean | 4.15 | Adjusted R² | 0.9695 |
| C.V. % | 6.51 | Predicted R² | 0.9199 |
| Adeq Precision | 29.2152 |
Table 7.
Validation of the model with the optimized conditions.
| Run | Variables | Responses | ||||
| Sucrose (%) | Time (h) | Temperature (°C) |
Inoculum (%) | EPS (g/L) | Biomass (g/L) | |
| EPS | 38.105 | 73.426 | 26.944 | 14.986 | 124.01 | - |
| Biomass | 37.910 | 73.223 | 26.839 | 15.001 | - | 6.33 |
| EPS+Biomass | 38.016 | 72.996 | 26.870 | 15.015 | 122.10 | 6.27 |
Disclaimer/Publisher’s Note: The statements, opinions and data contained in all publications are solely those of the individual author(s) and contributor(s) and not of MDPI and/or the editor(s). MDPI and/or the editor(s) disclaim responsibility for any injury to people or property resulting from any ideas, methods, instructions or products referred to in the content. |
© 2025 by the authors. Licensee MDPI, Basel, Switzerland. This article is an open access article distributed under the terms and conditions of the Creative Commons Attribution (CC BY) license (https://creativecommons.org/licenses/by/4.0/).
Copyright: This open access article is published under a Creative Commons CC BY 4.0 license, which permit the free download, distribution, and reuse, provided that the author and preprint are cited in any reuse.


