
Submitted:
28 April 2025
Posted:
29 April 2025
You are already at the latest version
Abstract
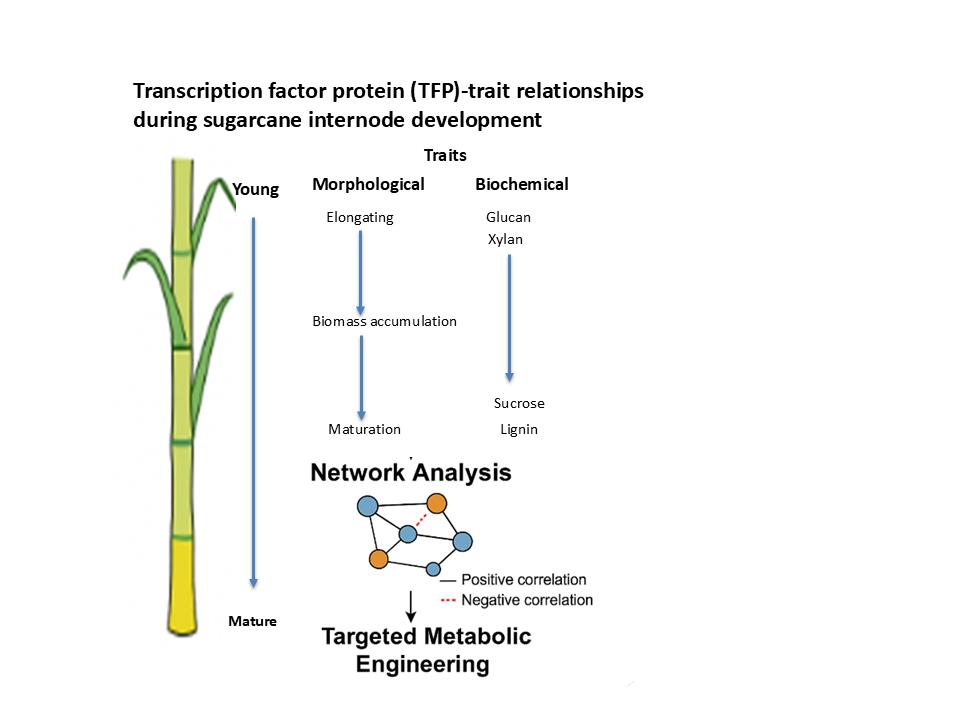
Understanding the transcriptional regulation of biomass accumulation and sucrose storage is critical for enhancing sugarcane productivity. In this study, we quantified transcription factor protein (TFP) abundance across sugarcane internodes at different developmental stages and growth rates, correlating these profiles with key biochemical traits including lignin, glucan, hemicellulose, and sucrose content. Among 7333 proteins identified, 205 were classified as transcription factors spanning 22 families. Trait-centric correlation networks revealed 107 TFP-trait associations via Pearson correlation; refinement using the Partial Correlation with Information Theory (PCIT) algorithm identified 46 high-confidence regulatory links. Key transcription factors, such as ScMYB113, ScMADS15, and ScbZIP85, displayed trait-specific roles in coordinating sucrose storage and cell wall biosynthesis. Network topology uncovered distinct regulatory modules associated with biomass production, structural polysaccharide deposition, and intermediary metabolism. Notably, sucrose and lignin accumulation primarily occurred after internode elongation ceased, implicating shifts in transcriptional regulation during maturation. This study delivers the first protein-level regulatory map linking TF abundance to metabolic traits in sugarcane and provides a robust framework for identifying candidate regulators to optimize biomass quality and yield for bioenergy applications.
Keywords:
Transcription factor proteomics
; sugarcane internode development
; carbon partitioning
; cell wall metabolism
; sucrose
; PCIT network inference
1. Introduction
The need for increased biomass utilisation in a circular, sustainable bioeconomy is underscored by global population growth and climate change. Bioenergy is already a major renewable energy source, and this trend is expected to continue growing in the coming decades [1]. Utilizing biomass as a feedstock for energy and value-added systems is often challenging due to material heterogeneity, high moisture, poor biological stability, and low energy density [1,2,3]. A sustainable biomass future economy hinges on not expanding land use. Land-use change, biodiversity loss, climate change, water pollution, and land degradation are all consequences of the past century’s unprecedented biomass harvesting [4,5]. With population growth and wealthier, more meat-heavy diets increasing biomass demand, these problems are predicted to intensify [6]. Improving biomass yield and sugar content in sugarcane is critical for advancing sustainable bioenergy production. Internode elongation and sucrose accumulation are two central traits determining productivity [7,8,9,10] yet the transcriptional mechanisms controlling these processes remain poorly defined. While previous research has examined changes in transcript levels during culm development [11,12,13,14,15], these studies do not adequately capture the functional regulatory landscape, particularly in the case of transcription factors (TFs), whose activity is regulated post-transcriptionally through protein stability, localization, and modification. The disconnect between mRNA and protein levels is especially pronounced for TFs, which are often rapidly activated or suppressed at the protein level in response to environmental or developmental cues without corresponding changes in transcript abundance [16]. Thus, identifying TFs based solely on transcriptomic data can lead to misleading conclusions. Direct measurement of TF protein abundance offers a more accurate route to identifying functionally relevant regulators. The intricate, multigene-controlled traits of cell wall composition and biomass accumulation rate are complex. Consequently, modifying the cell wall genetically would be quite challenging. It’s clear that several identified transcription factors act as master regulators in plants, with key roles in metabolic pathways [17,18]. Transcription factors (TFs), which act as metabolic regulators, modulate the expression of enzyme genes within specific metabolic pathways through activation or repression. Plant metabolic pathway control is seemingly better achieved by manipulating transcription factors than by targeting single enzyme genes [19,20]. In this study, we combine trait-specific biochemical and morphological data with quantitative proteomics of sugarcane internode tissues to identify transcription factors associated with major traits such as sucrose content, cell wall composition, and biomass accumulation. We focus on rapidly growing and developmentally staged internodes to capture dynamic regulatory changes. A key innovation of our analysis is the use of the Partial Correlation with Information Theory (PCIT) algorithm to build high-confidence trait-TF correlation networks [21,22]. Unlike conventional Pearson correlation, which captures both direct and indirect associations, PCIT removes indirect effects, resulting in a more stringent and biologically meaningful inference of regulatory relationships. This work represents the first comprehensive effort to map transcription factor–trait associations in sugarcane using protein-level data combined with the stringency of PCIT. Our findings reveal distinct TF modules linked to carbon partitioning, cell wall biosynthesis, and sucrose storage, providing a valuable resource for future metabolic engineering and crop improvement strategies.
2. Materials and Methods
2.1. Material
Research trials were conducted in field with sugarcane variety KQ228. The trial locations were at Sugar Research Australia’s Burdekin Station in QLD (19°34’0.80"S, The trials were planted in a completely randomised design, including four replicate plots per treatment. A replicate contains 40 meters of cane. Planting material, planting, fertilisation and irrigation of the trials were done as previously described [23]. Previously we have shown that the growth rate and metabolic composition of late season growth and that of MODDUS treated cane at peak growth rate does not differ significantly [23]. In the work reported here and rate of crop growth rate was controlled by the application of 50g Trinexapac-ethyl ha−1 [10]. The last application was 26 days before harvest. In the mansucript we refer to the MODDUS treated cane phenotype as "slow-growth".
2.2. Destructive Sampling
Six culm samples were collected from the field plots 1130 after planting. Previously we have shown that peak growth rates occurr around this time for KQ228 [23]. These samples were analyzed using a modified method by Berding [24]. The culm samples were disintegrated using either a garden mulcher or Dedini laboratory disintegrator at room temperature. The mulched material was then weighed to determine the fresh weight (FW) and transferred to a paper bag to be dried at 70°C until a constant dry weight (DW) was reached (usually 6 to 7 days).
2.3. Biomass Composition
All the analyses biomass compositional analysis were conducted at Celignis Analytical using the analytical package P19 (Deluxe lignocellulose: Sugars, Lignin, Extractives, and Ash, protein-corrected lignin, water-soluble sugars, uronic acids, acetyl content and starch).
2.3.1. Extraction of Biomass Component
All extractions were carried out with a Dionex Accelerated Solvent Extractor (ASE) 200 [25]. The extractions were carried out according to the National Renewable Energy Laboratory (NREL) standard operating procedure for determining extractives in biomass [26]. Ash content was determined using a Nabertherm L-240H1SN furnace, according to the NREL operating procedure for the determination of ash in biomass [26].
2.3.2. Cell Wall Constituents
Hydrolysis of the dry extractives-free samples was performed according to a modification of the NREL standard operating procedure for the determination of structural carbohydrates and lignin in biomass [27]. The procedure was divided into two main steps: a two-stage acid hydrolysis of the samples and the gravimetric filtration of the hydrolysate to separate it from the acid-insoluble residue (AIR) [26]. Klason lignin was calculated by determining the weight difference between the AIR and its ash content. Acid-soluble lignin was measured by determining the absorbance of an aliquot of the hydrolysate at 240 nm using an Agilent 8452 UV–vis spectrophotometer. The results are then converted to ASL based on Beer’s law [28]. The lignocellulosic sugars resulting from hydrolysis were determined by ion-chromatography techniques adapted from [27]. The method consisted of diluting the hydrolysate samples 20× with a deionised water solution containing known amounts of melibiose as an internal standard [25]. The diluted hydrolysates were filtered and then analysed with HPLC and fitted with an electrochemical detector (PAD).
2.3.3. Water Solubles
The sugars in the water-soluble fraction Section 2.3.1 were analysed using ion–chromatography [25].
2.4. Calculation of Growth and Metabolic Rates
Growth and metabolic rates were calculated from:
This equation calculates the difference in trait(t) (mass, concentration or internode length) between times and (i.e., ) and normalises it by the delta growing degree days(GDD) [29].
2.5. Trait-Trait Correlation
Trait-trait correlations were investigated using Spearman’s rank correlation coefficient, which assesses monotonic relationships between variables. This method was chosen because it is robust to non-linear relationships and is less sensitive to outliers compared to Pearson correlation. Before computing correlations, categorical variables in the dataset were converted to numeric values. This was achieved using the factorize function in Panda (2.2.3), which assigns integer values to unique categories.
Spearman’s rank correlation coefficient () measures the strength and direction of the monotonic relationship between two variables. Unlike Pearson correlation, it does not assume a linear relationship and is based on ranked values. The Spearman correlation coefficient is defined as:
where:
- is Spearman’s rank correlation coefficient,
- is the difference between the ranks of corresponding values,
- n is the number of observations.
2.6. Exaction of Proteins
Internodes 2,4 and 6 were removed from the stalk, and a 30mm long section was cut from the bottom of the internode. Approximately 8mm diameter cylindrical cores were bored off-centre (avoiding the pith) and vertically down using a 12mm cordless drill and Diamond drill Bit. The cylindrical samples were placed in a labelled 2mL screw cap tube and snap frozen in liquid nitrogen and stored at −80 °C. The drill bit borer was sprayed with 70% (v/v) ethanol and wiped between samples.
A portion of the liquid nitrogen frozen samples were lyophilised and used for protein extraction to generate proteome data [30]. Each sample (100 g) was taken for digestion and analysis with a 1D and 2D IDA nanoLC (Ultra nanoLC system, Eksigent) system. The IDA LC–MS/MS data were searched using ProteinPilot v5 (Sciex) in thorough mode. The top 6 most intense fragments of each peptide were extracted from the SWATH data sets (75 ppm mass tolerance, 10 min retention time window). Shared and modified peptides were excluded. After data processing, peptides with confidence ≥99% and FDR ≤1% (based on chromatographic feature after fragment extraction) were used for quantitation. Protein differential abundance was determined using unnormalised protein quantification values as input for package DESeq2 v1.18.1 (Love, 2014).
2.7. Transcription Factor Identification and Annotation
A list of all protein models for sugarcane was downloaded from the relevant genome database in FASTA format from Grassius /citegray2024a. A local REfSeq protein blast sugarcane TF database was created from the downloaded sugarcane TFs as described. A list of protein names and sequences is contained in the FASTA file was also downloaded from MaizeGDB. TFs were then identified through a Blastp search of the 7333 proteins sequences from this project against the constructed Sugarcane TF database. Identified TFs were placed into families using a set of classification rules based on available or self-built Pfam Hidden Markov Model (HMM) profiles.
2.8. Trait-Based Differential Expression Analysis
To normalize the data and avoid errors due to zero expression values, a log2 transformation was applied to all protein expression values with a pseudo-count of 1, following best practices in transcriptomics and proteomics studies [31,32]. For each selected trait of interest (e.g., sucrose, lignin, hemicellulose, etc), samples were divided into high and low expression groups using the median value of the trait as a threshold. This approach is commonly used to stratify continuous variables in differential expression analyses [33].
To identify TFs differentially expressed between high and low trait groups, a two-sample independent t-test (Welch’s t-test) was applied to log2-transformed protein expression values. Welch’s t-test was chosen due to its robustness against unequal variances between groups [34]. The resulting p-values were adjusted for multiple testing using the Benjamini-Hochberg false discovery rate (FDR) correction to control for false positives [35].
Trait-TF Correlation Analysis To assess the relationship between transcription facor protein levels and numerical traits, we employed the Partial Correlation with Information Theory (PCIT) method [21]. This approach refines correlation-based inference by eliminating spurious associations using an information-theoretic framework, making it particularly suitable for high-dimensional biological datasets. Pearson correlation coefficients were initially computed for each protein-trait pair, and the PCIT algorithm was applied to retain only biologically meaningful correlations.
For every triplet of transcription factors , the three first-order partial correlation coefficients are computed by:
is the Pearson correlation between X and Y, is the Pearson correlation between X and Z, and is the Pearson correlation between Y and Z.
Instead of using a fixed threshold (e.g., ), PCIT calculates a dynamic threshold using mutual information theory. The threshold is determined from the mean and standard deviation of the absolute values of the three partial correlations in each triplet. A connection (edge) between X and Y is retained only if their correlation is stronger than both partial correlations with any third variable Z.
Only significant correlations that survive the PCIT filtering are included in the final network. This results in a sparse, high-confidence network, where edges represent strong direct associations.
A significance threshold of 0.6 was applied to filter strong associations.
2.9. Protein-Protein Network Construction
For proteins displaying significant correlations with traits, a network-based analysis was performed using the networkx package [36]. A protein-protein correlation matrix was computed, and protein pairs exceeding a correlation threshold of 0.4 were connected in the network. This approach enabled the visualization of molecular interactions underpinning trait associations. Network topology was analysed by computing clustering coefficients for each node, measuring the degree of local connectivity [37]. Distributions of clustering coefficients were visualized through histograms and cumulative distribution plots.
2.10. Computational Analysis
The computational analyses used Python (version X.X.X) in the Spyder Integrated Development Environment (IDE; version 6.0.3) [38,39]. Data preprocessing, statistical modelling, and network visualizations were implemented using the NumPy (Numerical Python)(2.2.2), pandas (2.2.3), SciPy (1.15.2), matplotlib (3.10.0), scienceplots (2.1.1) and seaborn (0.13.2) libraries in Python. To visualize strong trait correlations, we constructed an undirected network graph were constructed using NetworkX (3.4.2).
3. Results and Discussion
3.1. Growth and Sink Strength
While a strong correlation exists between culm length, internode length, and above-ground biomass in C4 grasses [7,9,23,36], it is important to distinguish between internode elongation and biomass accumulation. These two traits have been often measured and described in sugarcane related research.
The pattern of internode elongation and biomass accumulation is sigmoidal (Figure S1). Approximately 150 was required for complete internode elongation in sugarcane KQ228 (Figure S1A). At this time-point four new internodes have formed (i.e., internode 5 is the last elongating internode [23]. In comparison, the peak of biomass accumulation (sink strength) was observed around 120-150 , with its termination at 300-360 (Figure S1B and Figure S2). Fast-growing and slow-growing sugarcane showed identical patterns of internode elongation and biomass accumulation. A Tukey HSD post-hoc analysis showed that the differences in both internode length and biomass were significantly different between the two phenotypes and the young internodes (Table 1).
In this study we measured 13 biochemical traits, and calculated six (total soluble sugar, total cell wall sugar, hexosans, pentosans, hemicellulose (Eq. 4)and ROPAL(Eq. 5)) that underpins internode elongation and biomass accumulation.
No significant differences in biomass profiles were found between fast- and slow-growing sugarcane phenotypes across 16 traits, according to ANOVA and Tukey HSD post-hoc analysis (Table 1). Except for glucuronic acid, all other 15 traits exhibited significant differences across internodes 2–6. Eleven of sixteen traits displayed no significant variation in internodes 8–12.
The yield of every component, however, is contingent upon the tissue’s concentration and total mass. Biomass yield differed significantly between phenotypes and internodes; trait yields also showed significant differences. Internodes 2 and 12 showed significantly different yields of total sugar, sucrose, glucose, fructose, xylan, rhamnan, glucuronic acid, hemicellulose, and lignin (Table S1).
Biomass accumulation and internode length correlate significantly between 0-150 , but not between 150-360 (Figure S3). This holds true for both rapidly and slowly growing sugarcane (Figure S3A,B). Approximately 25% of total biomass accumulated after internode elongation was complete, which accounts for the lack of correlation (Table 1). Fast- and slow-growing sugarcane showed no significant differences in glucan, hemicellulose, and lignin accumulation after elongation ceased; however, biomass () and sucrose () accumulation differed significantly (Table ). The bulk () of the glucan and hemicellulose are accumulated during internode elongation while more than 50% of lignin, and 70% of sucrose are accumulated after completion of internode elongation.
These two aspects warrant consideration. Faster growth leads to larger internodes, resulting in greater biomass accumulation after elongation. Secondly, fast-growing sugarcane shows a higher percentage of sucrose accumulation after internode elongation because internode elongation is a more significant sink than sucrose accumulation. Early sucrose accumulation occurs with slower growth, preceding complete internode elongation.
Metabolism and carbon allocation in upper internodes before growth ceases are critical determinants of final aboveground biomass yield and composition. Boosting sugarcane and similar bioenergy crops needs a deep understanding of metabolic regulation in their rapidly growing top internodes.
This study concentrated on the metabolic processes and transcription factors within internodes 2, 4, and 6. This paper labelled the internodes 2F, 4F, 6F, 2S, 4S, and 6S. ’F’ denotes fast-growing, while ’S’ represents slow-growing.

Table 2.
Percentage increase in total biomass components after completion of internode elongation. Fast growth occurs around 1130 after planting and slow growth was achieved by application of MODDUS.
Table 2.
Percentage increase in total biomass components after completion of internode elongation. Fast growth occurs around 1130 after planting and slow growth was achieved by application of MODDUS.
| Trait | Fast_growth | Slow_growth | p-value 1 | significance |
|---|---|---|---|---|
| Dry weight | 27.15 | 21.46 | 0.03 | * |
| glucan | 14.52 | 12.86 | 0.47 | ns |
| hemicellulose | 12.24 | 8.08 | 0.06 | ns |
| lignin | 53.74 | 51.92 | 0.42 | ns |
| sucrose | 71.76 | 52.3 | 3.20E-05 | *** |
* = , *** = .
3.2. Carbon Partitioning and Trait-Trait Correlations
Carbon was largely allocated to glucan and hemicellulose within the early internodes (2F, 2S) (Figure 1). Lignin and sucrose allocations grew while the allocation of this decreased with ongoing development. The greatest carbon allocation to ROPAL happens in early to mid-stages of development, then decreases significantly in mature internodes (Figure 1).
The data is indicative of active primary cell wall biosynthesis during elongation. During development, these pools decrease, and lignin allocation increases, consistent with a role in secondary wall deposition and tissue maturation.
ROPAL metabolism’s peak in early to mid-stage internodes, followed by a sharp decline in mature ones, points to its role in development and precursor metabolism. The substantial rise in carbon channelled into sucrose mirrors its function as a weakly responsive demand component within developing internodes.
Internode size is a key driver for sink strength [10,23]. his workflow enabled the identification of key trait-trait relationships in the dataset. The combination of statistical correlation computation and network visualization allowed for both quantitative and visual interpretation of phenotypic interactions. The threshold and edge colouring approaches ensured that the most relevant relationships were emphasized.
Glucan was positively correlated with xylan and hemicellulose (Figure 2). Hemicellulose and Xylan were nearly perfectly positively correlated (r = 0.99, p < 0.001). ROPAL acted as a connector and showed moderate correlations with other traits, positively with glucan, xylan and hemicellulose, and negatively with lignin and sucrose. Sucrose was negatively correlated with most other traits, except lignin (r = 0.64) and GOPAL, and showed the strongest negative correlation with glucan and xylan.
The strong negative relationship between sucrose and the structural components confirmed the weak demand of sucrose for incoming carbon and the strong demand of cell wall polysaccharide synthesis [10]. The tight coupling of hemicellulose and xylan confirmed the dominance of glucuronoarabinoxylan (GAX) in the hemicellulose fraction of sugarcane [37].
ROPAL’s dual connectivity implies that it may have a modulatory role in supporting sink strength and the switch from cell enlargement to sucrose accumulation. Lignin shows weak or negative associations with most traits, indicating distinct regulatory mechanisms or trade-offs between lignification and polysaccharide biosynthesis, possibly during secondary wall thickening.
3.3. Transcription Factors
A total of 7333 different proteins sequences were found in sugarcane internode tissue. Of these proteins 205 showed significant homology to the TFs that are captured in the Grassius sugarcane database (Figure S4A). These TFs belong to 22 different TF families (Figure S4B). More than 35% of the TF proteins in the internode belongs to the C3H family. Among the various families of plant TFs, the C3H (or CCCH zinc finger) family is characterized by one or more zinc finger, domains containing three cysteines and one histidine.
Originally recognized for their involvement in stress responses and post-transcriptional regulation, recent research has increasingly implicated C3H factors in key developmental processes such as stem elongation, internode differentiation, and cell wall biogenesis [38]. Studies in fast-growing species such as bamboo show that C3H factors act together with MYB and ARF proteins to establish transcriptional networks that not only promote rapid internode elongation but also signal the transition toward secondary cell wall deposition [38].
3.4. Transcription Factor Expression
A Principal Component Analysis (PCA) of the TFS expression was done by grouping the samples into three groups, fast- and slow growing, internode age, and internodes grouped and on the basis of development stage and growing rate. There was a clear clustering between the two phenotypes (fast- and slow growth (Figure S6A). The PCA reveals three distinguishable clustersof TFS expression with young samples positioned on the left, intermediate samples in the center, and mature samples more spread out on the right side of the plot (Figure S6B).
This temporal separation reflects progressive TFS changes associated with developmental progression. The relative positions suggest a continuum of TFS expression changes from young to mature stages. When phenotype and internode stage were combined six cluster were evident, though with some clear overlap (Figure S6C).
The distinct clustering of internodes reflects localized transcriptional programs. The separation between the fast- and slow growing internodes of the same positional identity underscores the interaction of TFS expression with spatial and developmental growth. This progression of clusters along PC1 and PC2 may also correspond to a gradient of growth and maturation or physiological across the internodes.
3.5. Protein-Trait Correlation
A Pearson correlation analysis indicated that there are 107 TFS were significantly (p<0.05) linked to the traits under investigation (Figure S7). This complicated network contained 107 nodes and 314 edges (links) between the TFS and traits. Trait-centric correlation networks were constructed to explore transcriptional regulators significantly associated with key cell wall and carbohydrate traits, namely glucan, xylan, sucrose, and lignin content (Figure 3). Each network includes only those transcription factors (TFs) whose expression levels were significantly correlated with the respective trait.
Distinct transcriptional signatures were observed for each trait. For instance, glucan (Figure 3A) was positively correlated with several TFs including ScMYB100 and ScCH94, while showing a strong negative association with ScbZIP85. Xylan (Figure 3B) exhibited a similar pattern, sharing several TFs with glucan, yet maintaining trait-specific associations such as ScMYB100 as a central regulator. Sucrose (Figure 3C)demonstrated a mixture of strong positive (e.g., ScMYB113) and negative (e.g., ScMADS15, ScHD53) correlations, suggesting a more complex regulatory architecture. In contrast, lignin (Figure 3D) was predominantly negatively correlated with a cluster of TFs, including ScARF6 and ScHD53, indicating potential repression by these regulators.
The connectivity distribution of the TFS in any one of the four trait networks (Figure 3 indicated that most TFs have a moderate level of connectivity (peak around 0.4) meaning that a majority of them have around 40.
Overall, while some TFs such as ScMADS15 and ScHD53 appear to participate in the regulation of multiple traits, others show specificity, highlighting both shared and divergent regulatory controls across lignocellulosic and metabolic pathways.
However, the Pearson correlation by adjusting for indirect relationships can lead to spurious associations [21]. When we applied the PCIT algorithm only 46 TFS were significantly linked to the traits through 58 edges (links) (Table. Table 3, Figure 4). This supports the use of PCIT as a more conservative and biologically meaningful method for network inference. The PCIT algorithm was central to this analysis, as it improves upon conventional Pearson correlation by adjusting for indirect relationships that could lead to spurious associations [21].
3.6. Gene-Trait Association Network Reveals Modular and Coordinated Regulation of Biomass-Related Traits
A key feature of the TFS-trait association network was the three distinct trait clusters, each reflecting a potentially co-regulated biological module:
3.6.1. A Biomass Cluster: Dry Weight and Elongation
This cluster includes TFS such as ScMYB100, ScGRAS76, and ScMADS15, pointing toward a transcriptional module regulating internode elongation and biomass accumulation. The MYB family has well-established roles in secondary cell wall biosynthesis and growth regulation. The expression pattern of these TFs are in Figure 5. The MYB family of TFs regulate secondary cell wall biosynthesis and plant growth. For instance, in Arabidopsis thaliana, AtMYB46 and AtMYB83 function as master switches activating secondary wall biosynthetic programs, influencing plant biomass [39]. Similarly, GRAS family members are known to participate in various aspects of plant development, including stem elongation and meristem maintenance [44]. Internode strength and development in maize are modulated by TFs linked to secondary wall deposition, including MYB- and GRAS-domain proteins [40]. MADS-box TFs like ScMADS15 are implicated in floral development and may also influence vegetative growth patterns [41].
Likewise, MADS-box TFs have been implicated in both floral and vegetative growth, including stem morphology [41]. The clustering of dry weight and internode elongation also aligns with findings in maize, where hormonal regulation (auxin, gibberellins) affects internode elongation by modulating TFs involved in cell wall biosynthesis [42].
3.6.2. Cell Wall Polysaccharide Cluster: Glucan and Xylan
This cluster involves TFs such as ScEREB108, ScMYB100, and ScSNF27, all of which are candidate regulators of cell wall polysaccharide biosynthesis. Ethylene-responsive factors like ScEREB108 modulate wall modification genes in response to both developmental and environmental signals [43]. Interestingly, ethylene has also been linked to internode elongation and wall remodeling in cereals, acting in tandem with auxin and gibberellin pathways [42]. The overlap of TFs between glucan and xylan supports the idea of a co-regulated transcriptional module dedicated to cellulose and hemicellulose deposition.
3.6.3. Intermediary Metabolism (ROPAL), Sucrose, and Lignin
This cluster associates with TFs such as ScMYB113, ScSNF27.1, and ScARF6, suggesting a module integrating carbon allocation, lignification, intermediary and respiratory metabolism. Lignin biosynthesis is a tightly regulated process that balances structural reinforcement with metabolic cost. MYB and ARF TFs have been shown to coordinate lignin accumulation and growth-defense trade-offs [49]. The placement of sucrose, lignin and ROPAL within this module implies a shared regulatory mechanism where sucrose and lignin accumulation is initiated only when cell wall metabolism and respiratory metabolism is down regalted by decreases in SNF, MYB and ARF6.
4. Conclusions
This study provides the first protein-level evidence linking specific transcription factors (TFs) to key biochemical and morphological traits in sugarcane internode development. By profiling TF protein abundance across developmental stages and phenotypes, we reveal dynamic, stage-specific regulatory programs that underpin biomass accumulation and carbon partitioning. Using the Partial Correlation with Information Theory (PCIT) algorithm, we refined trait-centric correlation networks to identify a compact and high-confidence set of TF-trait associations, reducing spurious links observed with Pearson correlation.
Notably, TFs such as ScMYB113, ScMADS15, and ScbZIP85 emerged as critical regulators of sucrose storage, cell wall biosynthesis, and internode elongation. Network analysis uncovered a modular regulatory structure, with clusters corresponding to biomass traits, structural polysaccharides, and intermediary metabolism (e.g., ROPAL). These modules revealed coordinated expression of TFs, suggesting distinct transcriptional programs control growth and carbon allocation during sugarcane culm development.
This integrative approach — combining proteomics, trait correlation, and PCIT-based network inference — provides a robust framework for identifying master regulators of biomass quality and yield. The resulting network modules offer promising targets for metabolic engineering aimed at optimizing carbon allocation and improving the sustainability of bioenergy crop production.
References
- Duca, D.; Toscano, G. Biomass Energy Resources: Feedstock Quality and Bioenergy Sustainability. 11, 57.
- Peláez-Samaniego, M.R.; Garcia-Perez, M.; family=Cortez, given=LB, g.i.; Rosillo-Calle, F.; Mesa, J. Improvements of Brazilian Carbonization Industry as Part of the Creation of a Global Biomass Economy. 12, 1063–1086.
- Oh, Y.K.; Hwang, K.R.; Kim, C.; Kim, J.R.; Lee, J.S. Recent Developments and Key Barriers to Advanced Biofuels: A Short Review. 257, 320–333.
- Nations, U. Transforming Our World: The 2030 Agenda for Sustainable Development. 1, 41.
- European Commission. The European Green Deal. COM (2019) 640 Final. 11, 2019.
- Muscat, A.; Olde, E.M.; Ripoll-Bosch, R.; Van Zanten, H.H.E.; Metze, T.A.P.; Termeer, C.J.A.M.; Ittersum, M.; Boer, I.J.M. Principles, Drivers and Opportunities of a Circular Bioeconomy. 2, 561–566. [CrossRef]
- Kebrom, T.H.; McKinley, B.; Mullet, J.E. Dynamics of Gene Expression during Development and Expansion of Vegetative Stem Internodes of Bioenergy Sorghum. 10, 159. [CrossRef]
- Lingle, S.E. Seasonal Internode Development and Sugar Metabolism in Sugarcane. 37, 1222–1227.
- Martin, A.; Palmer, W.; Brown, C.; Abel, C.; Lunn, J.; Furbank, R.; Grof, C.P.L. A Developing Setaria Viridis Internode: An Experimental System for the Study of Biomass Generation in a C4 Model Species. 9, 45. [CrossRef]
- Botha, F.C.; Scalia, G.; Marquardt, A.; Wathen-Dunn, K. Sink Strength During Sugarcane Culm Growth: Size Matters. [CrossRef]
- Yanagui, K.; Camargo, E.L.; family=Abreu, given=Luís Guilherme F, p.u.; Nagamatsu, S.T.; Fiamenghi, M.B.; Silva, N.V.; Carazzolle, M.F.; Nascimento, L.C.; Franco, S.F.; Bressiani, J.A. Internode Elongation in Energy Cane Shows Remarkable Clues on Lignocellulosic Biomass Biosynthesis in Saccharum Hybrids. 828, 146476.
- Chen, R.; Fan, Y.; Yan, H.; Zhou, H.; et.al.. Enhanced Activity of Genes Associated With Photosynthesis, Phytohormone Metabolism and Cell Wall Synthesis Is Involved in Gibberellin-Mediated Sugarcane Internode Growth. 11, 570094, [33193665]. [CrossRef]
- Mason, P.J.; Hoang, N.V.; Botha, F.C.; Furtado, A.; Marquardt, A.; Henry, R.J. Comparison of the Root, Leaf and Internode Transcriptomes in Sugarcane (Saccharum Spp. Hybrids). 4, 167–178.
- Wang, M.; Li, A.M.; Liao, F.; Qin, C.X.; Chen, Z.L.; Zhou, L.; Li, Y.R.; Li, X.F.; Lakshmanan, P.; Huang, D.L. Control of Sucrose Accumulation in Sugarcane (Saccharum Spp. Hybrids) Involves miRNA-mediated Regulation of Genes and Transcription Factors Associated with Sugar Metabolism. 14, 173–191. [CrossRef]
- Ferreira, S.S.; Hotta, C.T.; Poelking, V.G.d.C.; Leite, D.C.C.; Buckeridge, M.S.; Loureiro, M.E.; Barbosa, M.H.P.; Carneiro, M.S.; Souza, G.M. Co-Expression Network Analysis Reveals Transcription Factors Associated to Cell Wall Biosynthesis in Sugarcane. 91, 15–35.
- Vélez-Bermúdez, I.C.; Schmidt, W. The Conundrum of Discordant Protein and mRNA Expression. Are Plants Special? 5, 619.
- Broun, P. Transcription Factors as Tools for Metabolic Engineering in Plants. 7, 202–209.
- Grotewold, E. Transcription Factors for Predictive Plant Metabolic Engineering: Are We There Yet? 19, 138–144.
- Braun, E.L.; Dias, A.P.; Matulnik, T.J.; Grotewold, E. Chapter Five Transcription Factors and Metabolic Engineering: Novel Applications for Ancient Tools. In Recent Advances in Phytochemistry; Romeo, J.T.; Saunders, J.A.; Mattews, B.F., Eds.; Elsevier; Vol. 35, pp. 79–109. [CrossRef]
- Capell, T.; Christou, P. Progress in Plant Metabolic Engineering. 15, 148–154.
- Reverter, A.; Hudson, N.J.; Nagaraj, S.H.; Pérez-Enciso, M.; Dalrymple, B.P. Regulatory Impact Factors: Unraveling the Transcriptional Regulation of Complex Traits from Expression Data. 26, 896–904.
- Hudson, N.J.; Reverter, A.; Dalrymple, B.P. Beyond Differential Expression: The Quest for Causal Mutations and Effector Molecules. 10, 83. https://doi.org/10.1186/1471-2164-10-83. [CrossRef]
- Botha, F.C.; Marquardt, A. Metabolic Control of Sugarcane Internode Elongation and Sucrose Accumulation. 14, 1487.
- Berding, N.; Marston, D.H. Operational Validation of the Efficacy of Spectracane, a High-Speed Analytical System for Sugarcane Quality Components. pp. 445–459.
- Pisanó, I.; Gottumukkala, L.; Hayes, D.J.; Leahy, J.J. Characterisation of Italian and Dutch Forestry and Agricultural Residues for the Applicability in the Bio-Based Sector. 171, 113857. [CrossRef]
- Sluiter, A.; Hames, B.; Ruiz, R.; Scarlata, C.; Sluiter, J.; Templeton, D.; family=Crocker, given=DLAP, g.i. Determination of Structural Carbohydrates and Lignin in Biomass. 1617, 1–16.
- Hayes, D.J. Development of near Infrared Spectroscopy Models for the Quantitative Prediction of the Lignocellulosic Components of Wet Miscanthus Samples. 119, 393–405.
- Bhagia, S.; Nunez, A.; Wyman, C.E.; Kumar, R. Robustness of Two-Step Acid Hydrolysis Procedure for Composition Analysis of Poplar. 216, 1077–1082.
- Yang, S.; Logan, J.; Coffey, D. Mathematical Formulae for Calculating the Base Temperature for Growing Degree Days. 74, 61–74.
- Marquardt, A.; Henry, R.J.; Botha, F.C. Effect of Sugar Feedback Regulation on Major Genes and Proteins of Photosynthesis in Sugarcane Leaves. 158, 321–333.
- Love, M.I.; Huber, W.; Anders, S. Moderated Estimation of Fold Change and Dispersion for RNA-seq Data with DESeq2. 15, 1–21.
- Robinson, M.D.; Oshlack, A. A Scaling Normalization Method for Differential Expression Analysis of RNA-seq Data. 11, 1–9.
- Subramanian, A.; Tamayo, P.; Mootha, V.K.; Mukherjee, S.; Ebert, B.L.; Gillette, M.A.; Paulovich, A.; Pomeroy, S.L.; Golub, T.R.; Lander, E.S. Gene Set Enrichment Analysis: A Knowledge-Based Approach for Interpreting Genome-Wide Expression Profiles. 102, 15545–15550.
- Ruxton, G.D. The Unequal Variance T-Test Is an Underused Alternative to Student’s t-Test and the Mann–Whitney U Test. 17, 688–690.
- Benjamini, Y.; Hochberg, Y. On the Adaptive Control of the False Discovery Rate in Multiple Testing with Independent Statistics. 25, 60–83.
- Lingle, S.E.; Thomson, J.L. Sugarcane Internode Composition During Crop Development. 5, 168–178. [CrossRef]
- De Souza, A.P.; Leite, D.C.; Pattathil, S.; Hahn, M.G.; Buckeridge, M.S. Composition and Structure of Sugarcane Cell Wall Polysaccharides: Implications for Second-Generation Bioethanol Production. 6, 564–579.
- Chen, L.; Dou, P.; Li, L.; Chen, Y.; Yang, H. Transcriptome-Wide Analysis Reveals Core Transcriptional Regulators Associated with Culm Development and Variation in Dendrocalamus Sinicus, the Strongest Woody Bamboo in the World. 8.
- Zhong, R.; Richardson, E.A.; Ye, Z.H. The MYB46 Transcription Factor Is a Direct Target of SND1 and Regulates Secondary Wall Biosynthesis in Arabidopsis. 19, 2776–2792.
- Xie, L.; Wen, D.; Wu, C.; Zhang, C. Transcriptome Analysis Reveals the Mechanism of Internode Development Affecting Maize Stalk Strength. 22, 49.
- Becker, A.; Theißen, G. The Major Clades of MADS-box Genes and Their Role in the Development and Evolution of Flowering Plants. 29, 464–489. [CrossRef]
- Zhang, Y.; Wang, Y.; Ye, D.; Xing, J.; Duan, L.; Li, Z.; Zhang, M. Ethephon-Regulated Maize Internode Elongation Associated with Modulating Auxin and Gibberellin Signal to Alter Cell Wall Biosynthesis and Modification. 290, 110196.
- Ohme-Takagi, M.; Shinshi, H. Ethylene-Inducible DNA Binding Proteins That Interact with an Ethylene-Responsive Element. 7, 173–182. [CrossRef]
Figure 1.
Bar chart showing carbon flux into different metabolic pools as a fraction of total biomass gain in internodes at three stages of development (2,4 and 6) during fast growth (F) and slow growth (S). Peak growth rate 1130 after planting and slow growth by application of MODDUS. ROPAL is defined as the two reducing sugars (glucose and fructose), organic acids, protein, amino acids, and all other not defined as traits in this study. Error bars indicate the standard deviation.
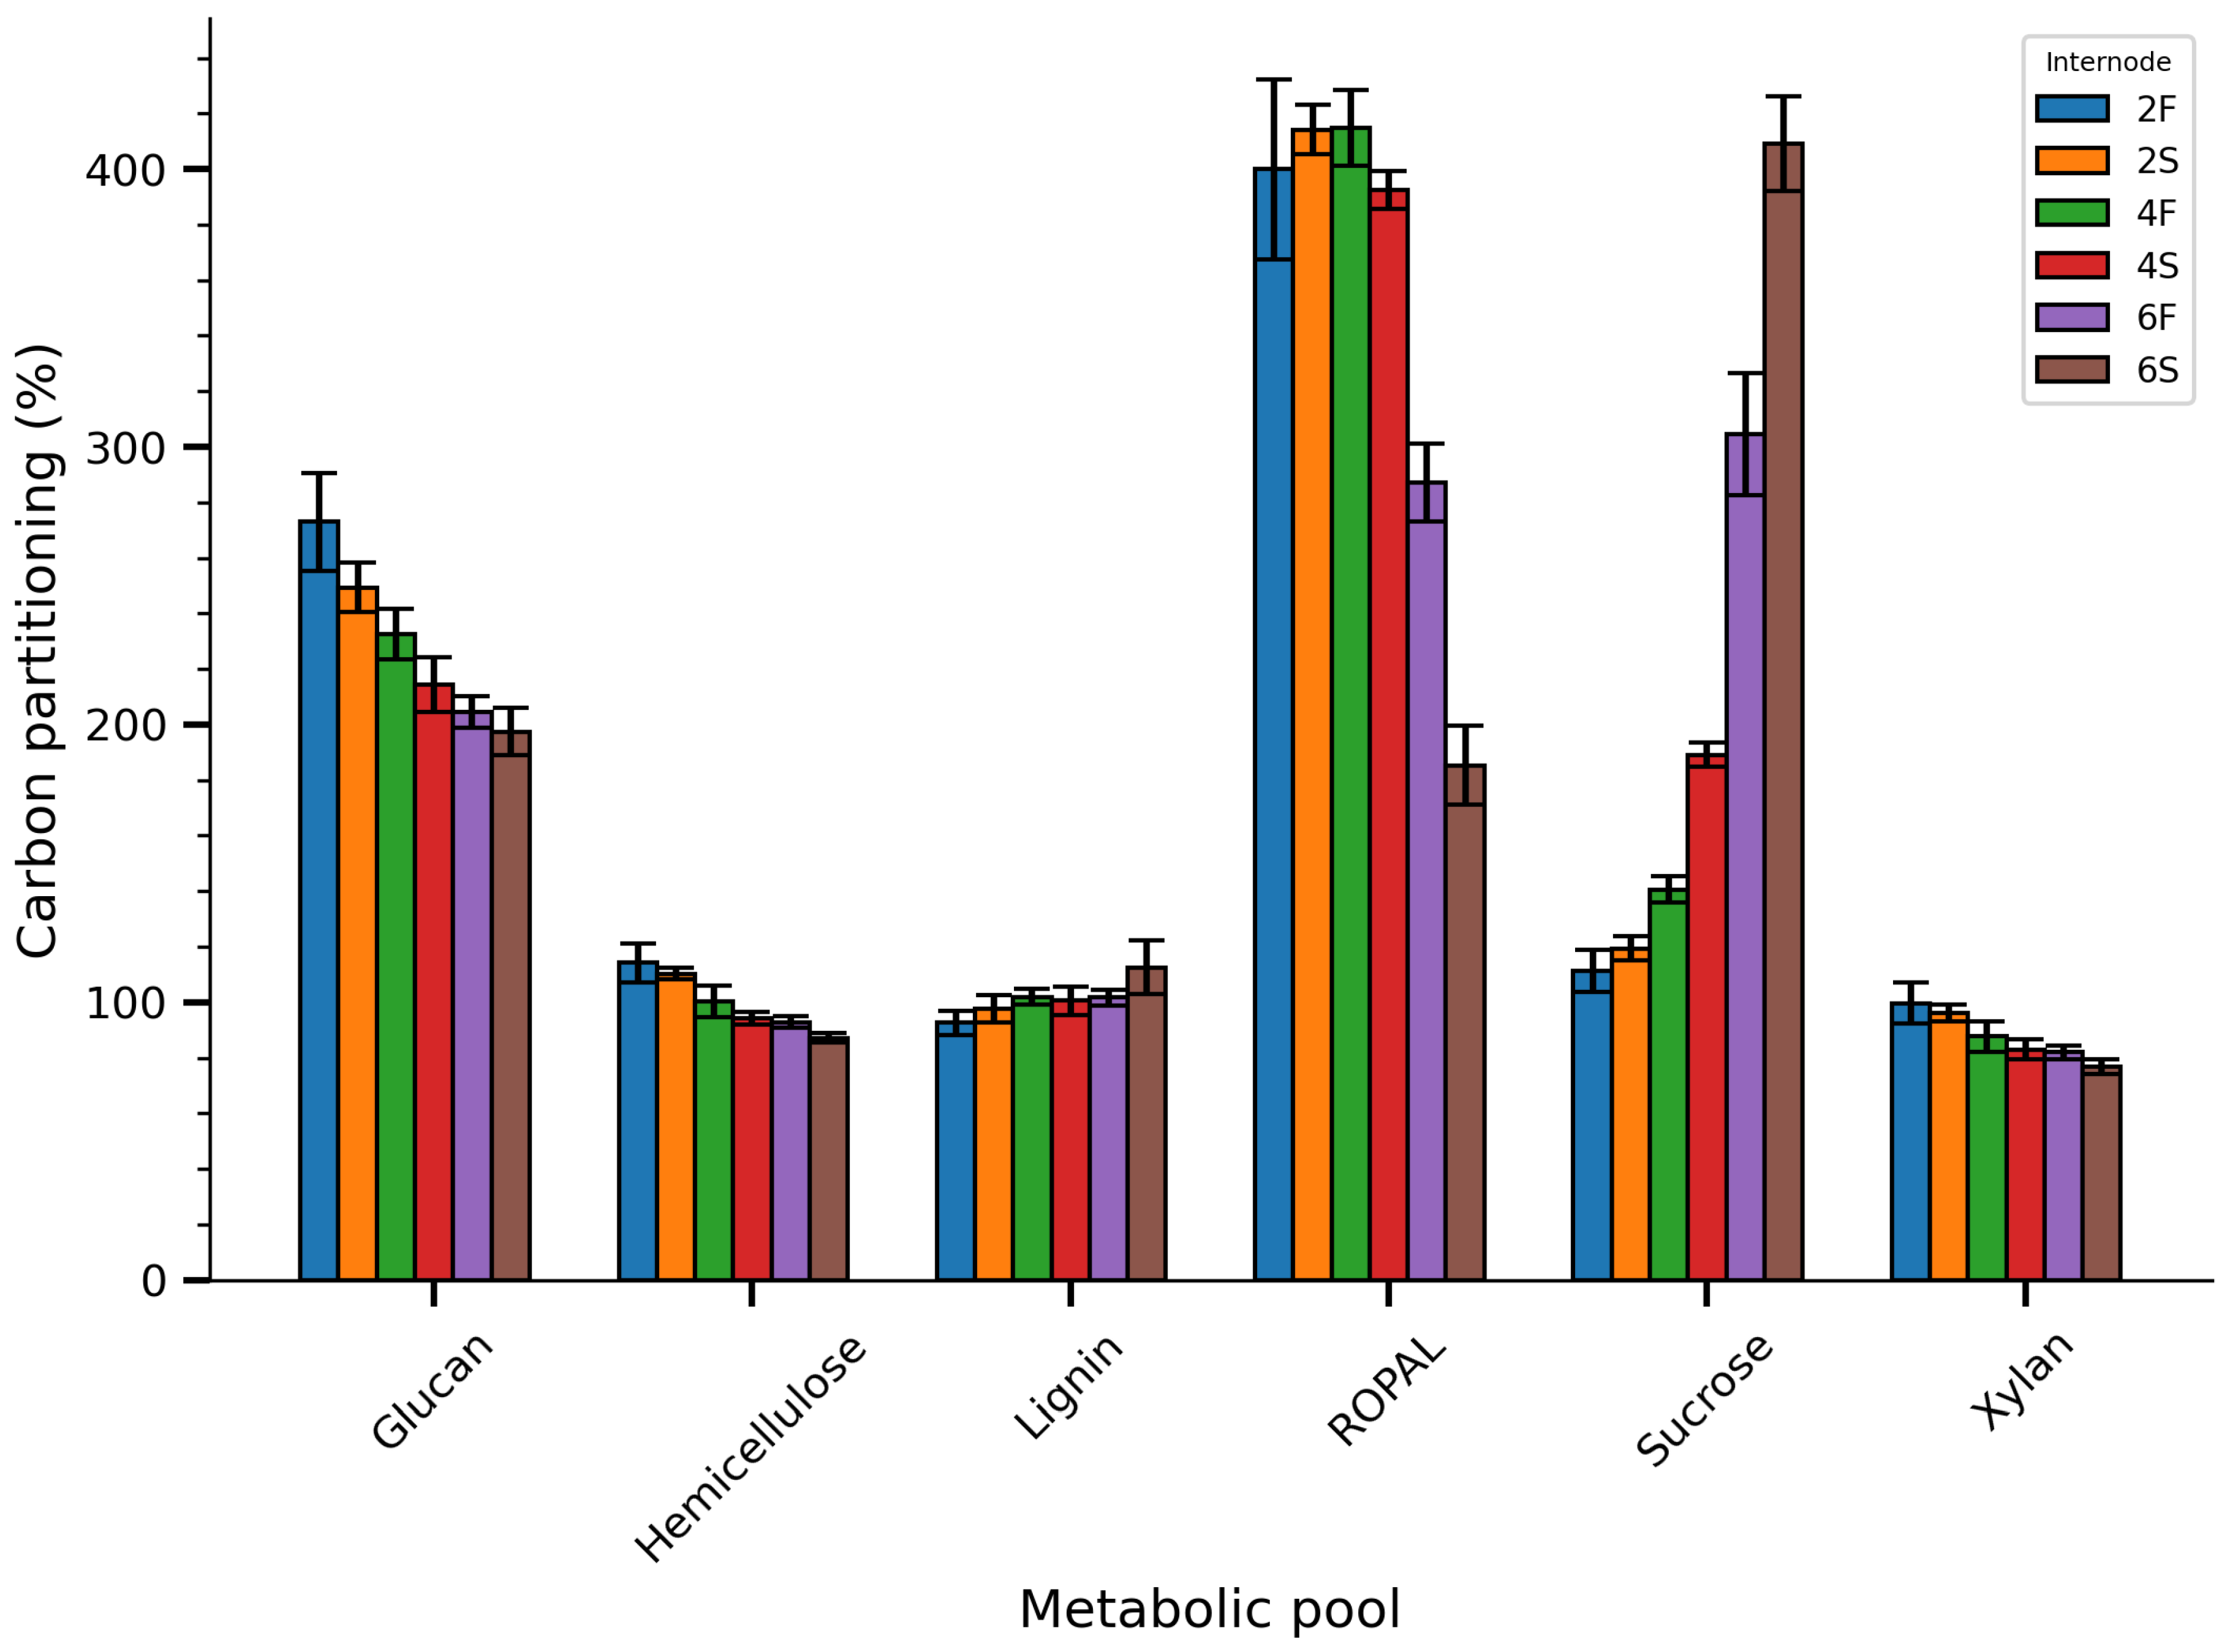
Figure 2.
Integrated Visualization of Trait Correlations. (A) Heatmap of pairwise Spearman correlation coefficients among biochemical traits. Each cell displays the correlation value and is coloured according to the statistical significance: purple for , green for , light blue for , and grey for non-significant correlations. (B) Network graph where nodes represent traits and edges denote significant correlations (absolute ). In the network, edge color indicates the direction of correlation (blue for positive, red for negative) and edge thickness scales with the magnitude of the correlation coefficient. Additional annotations below each panel summarize the applied color-coding and graphical conventions.
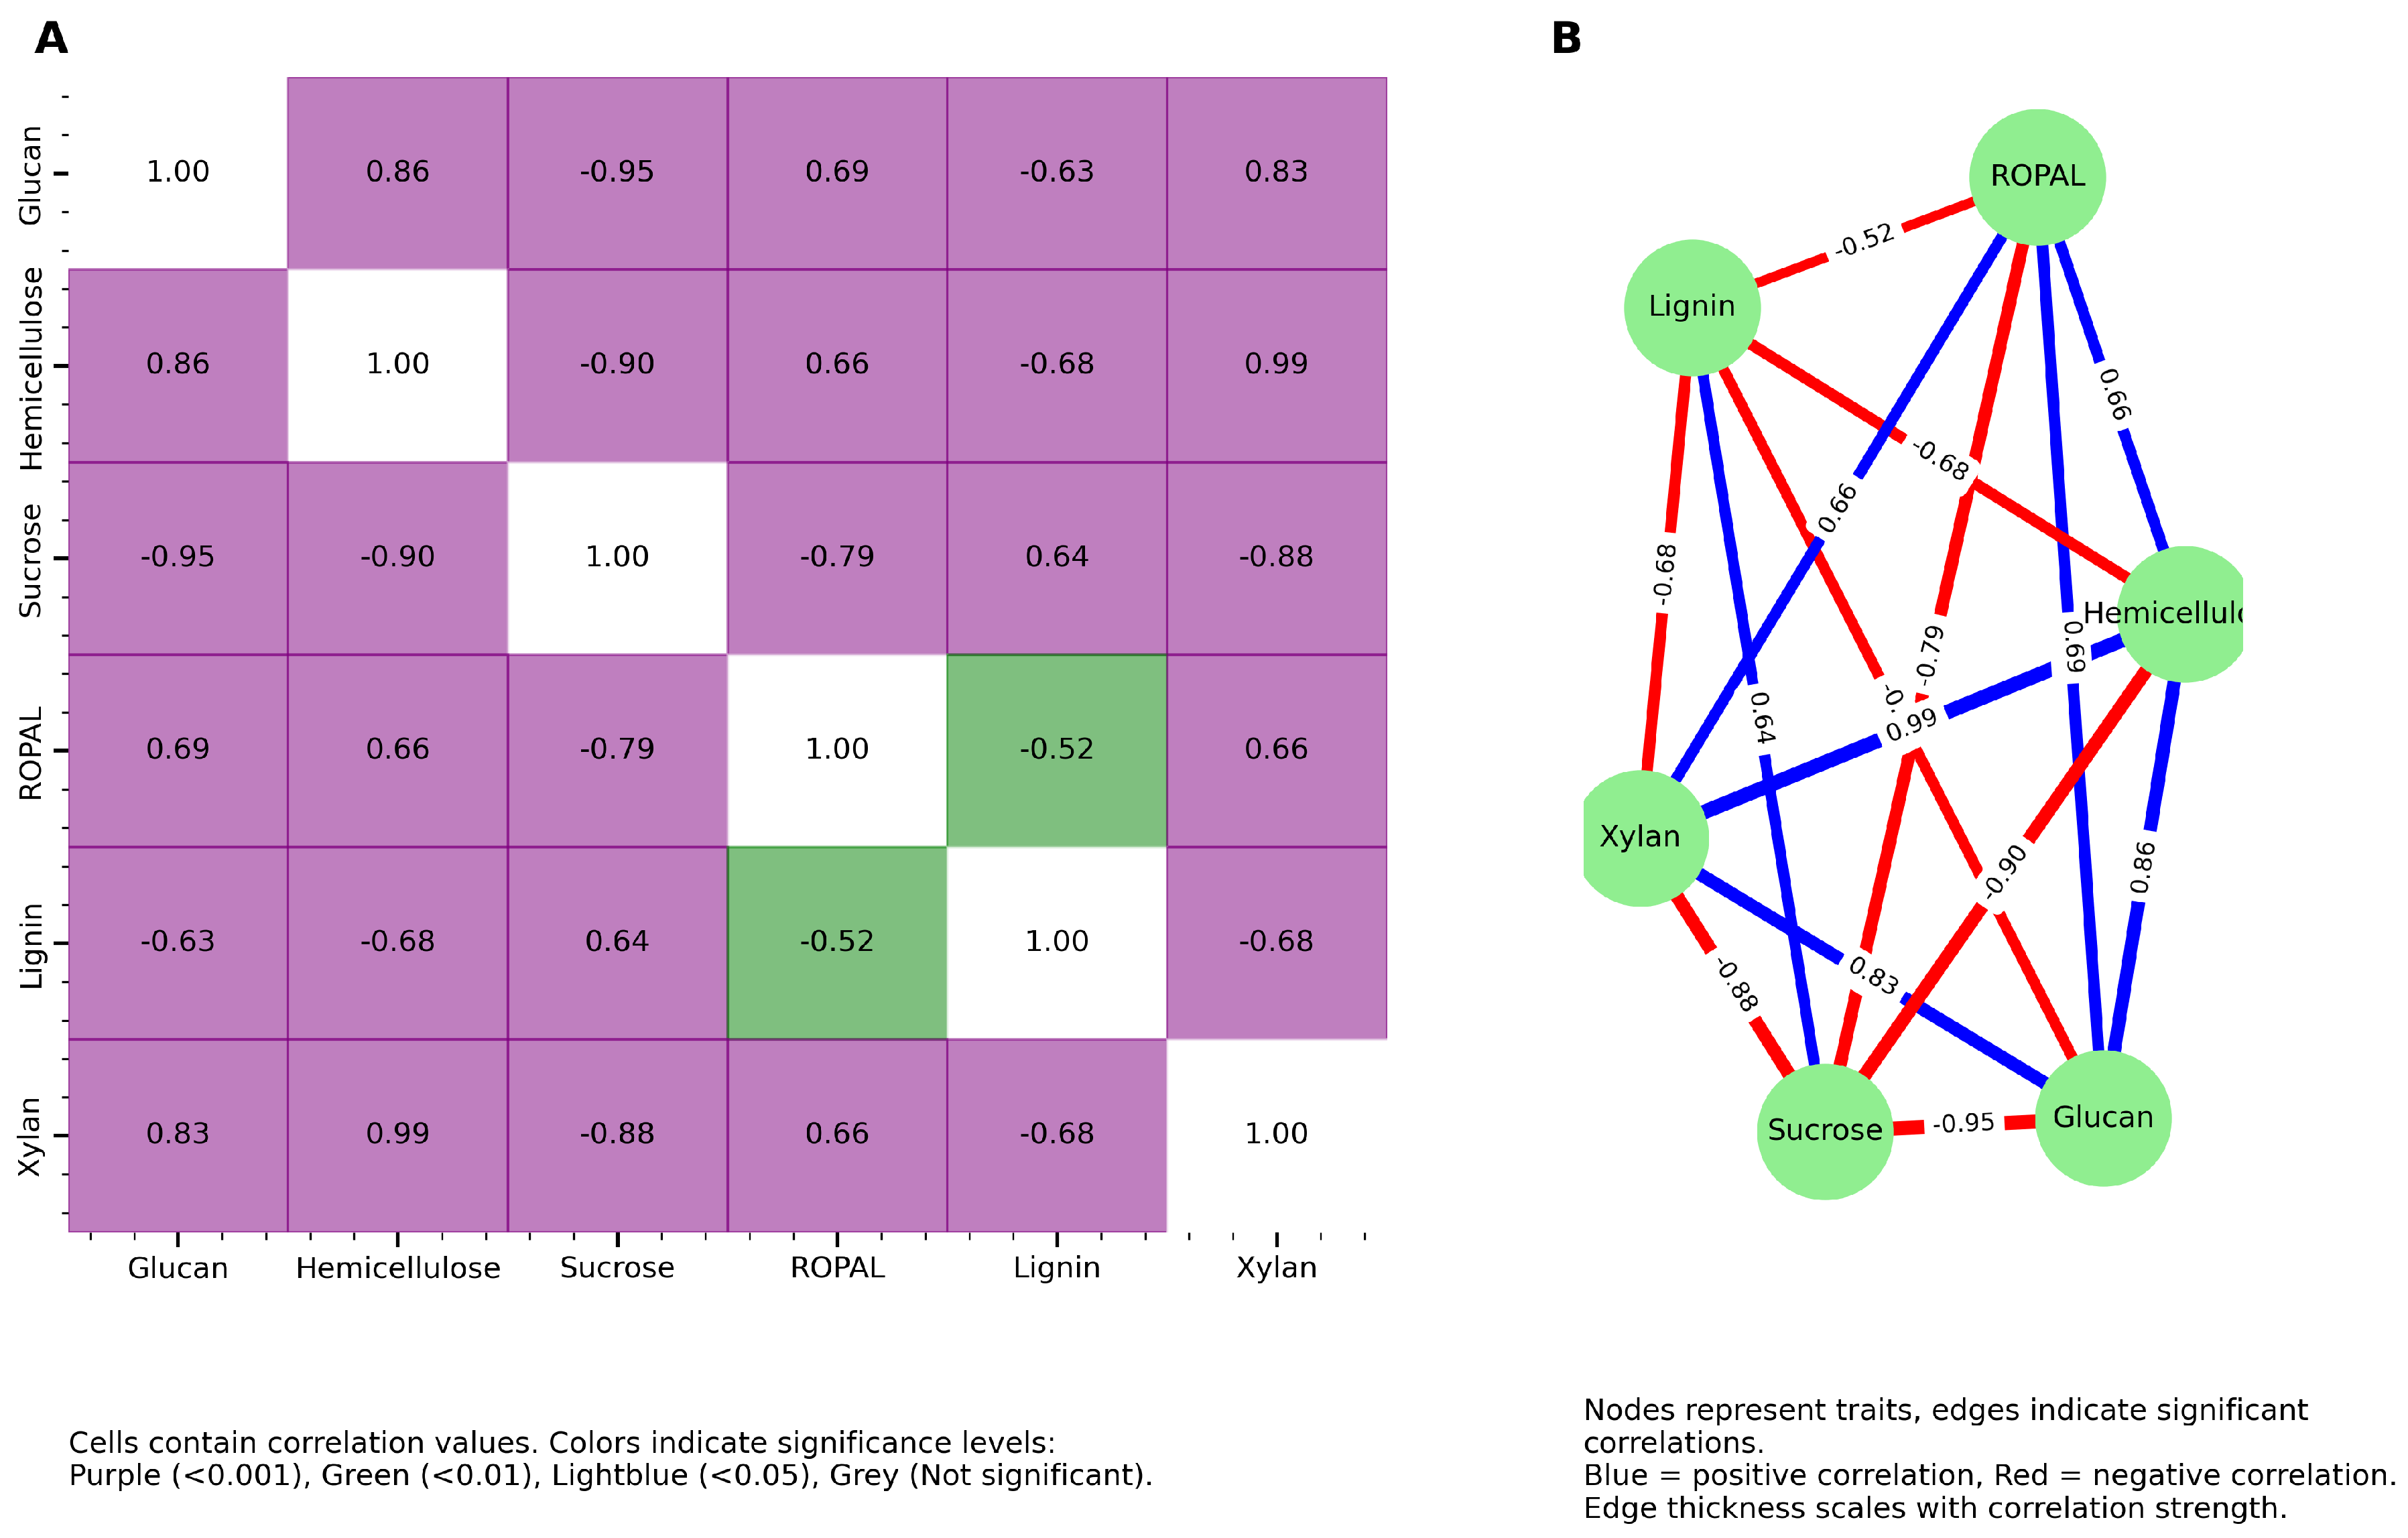
Figure 3.
Trait-centric correlation networks of transcription factors associated with major cell wall and metabolic traits. Network plots depict significant correlations (, ) between transcription factors and four key traits: (A) Glucan, (B) Xylan, (C) Sucrose, and (D) Lignin. Trait nodes are represented as green circles and transcription factors as blue nodes. Edge colors denote correlation direction: blue for positive and red for negative correlations. Edge thickness and labels reflect the strength of the correlation coefficient.
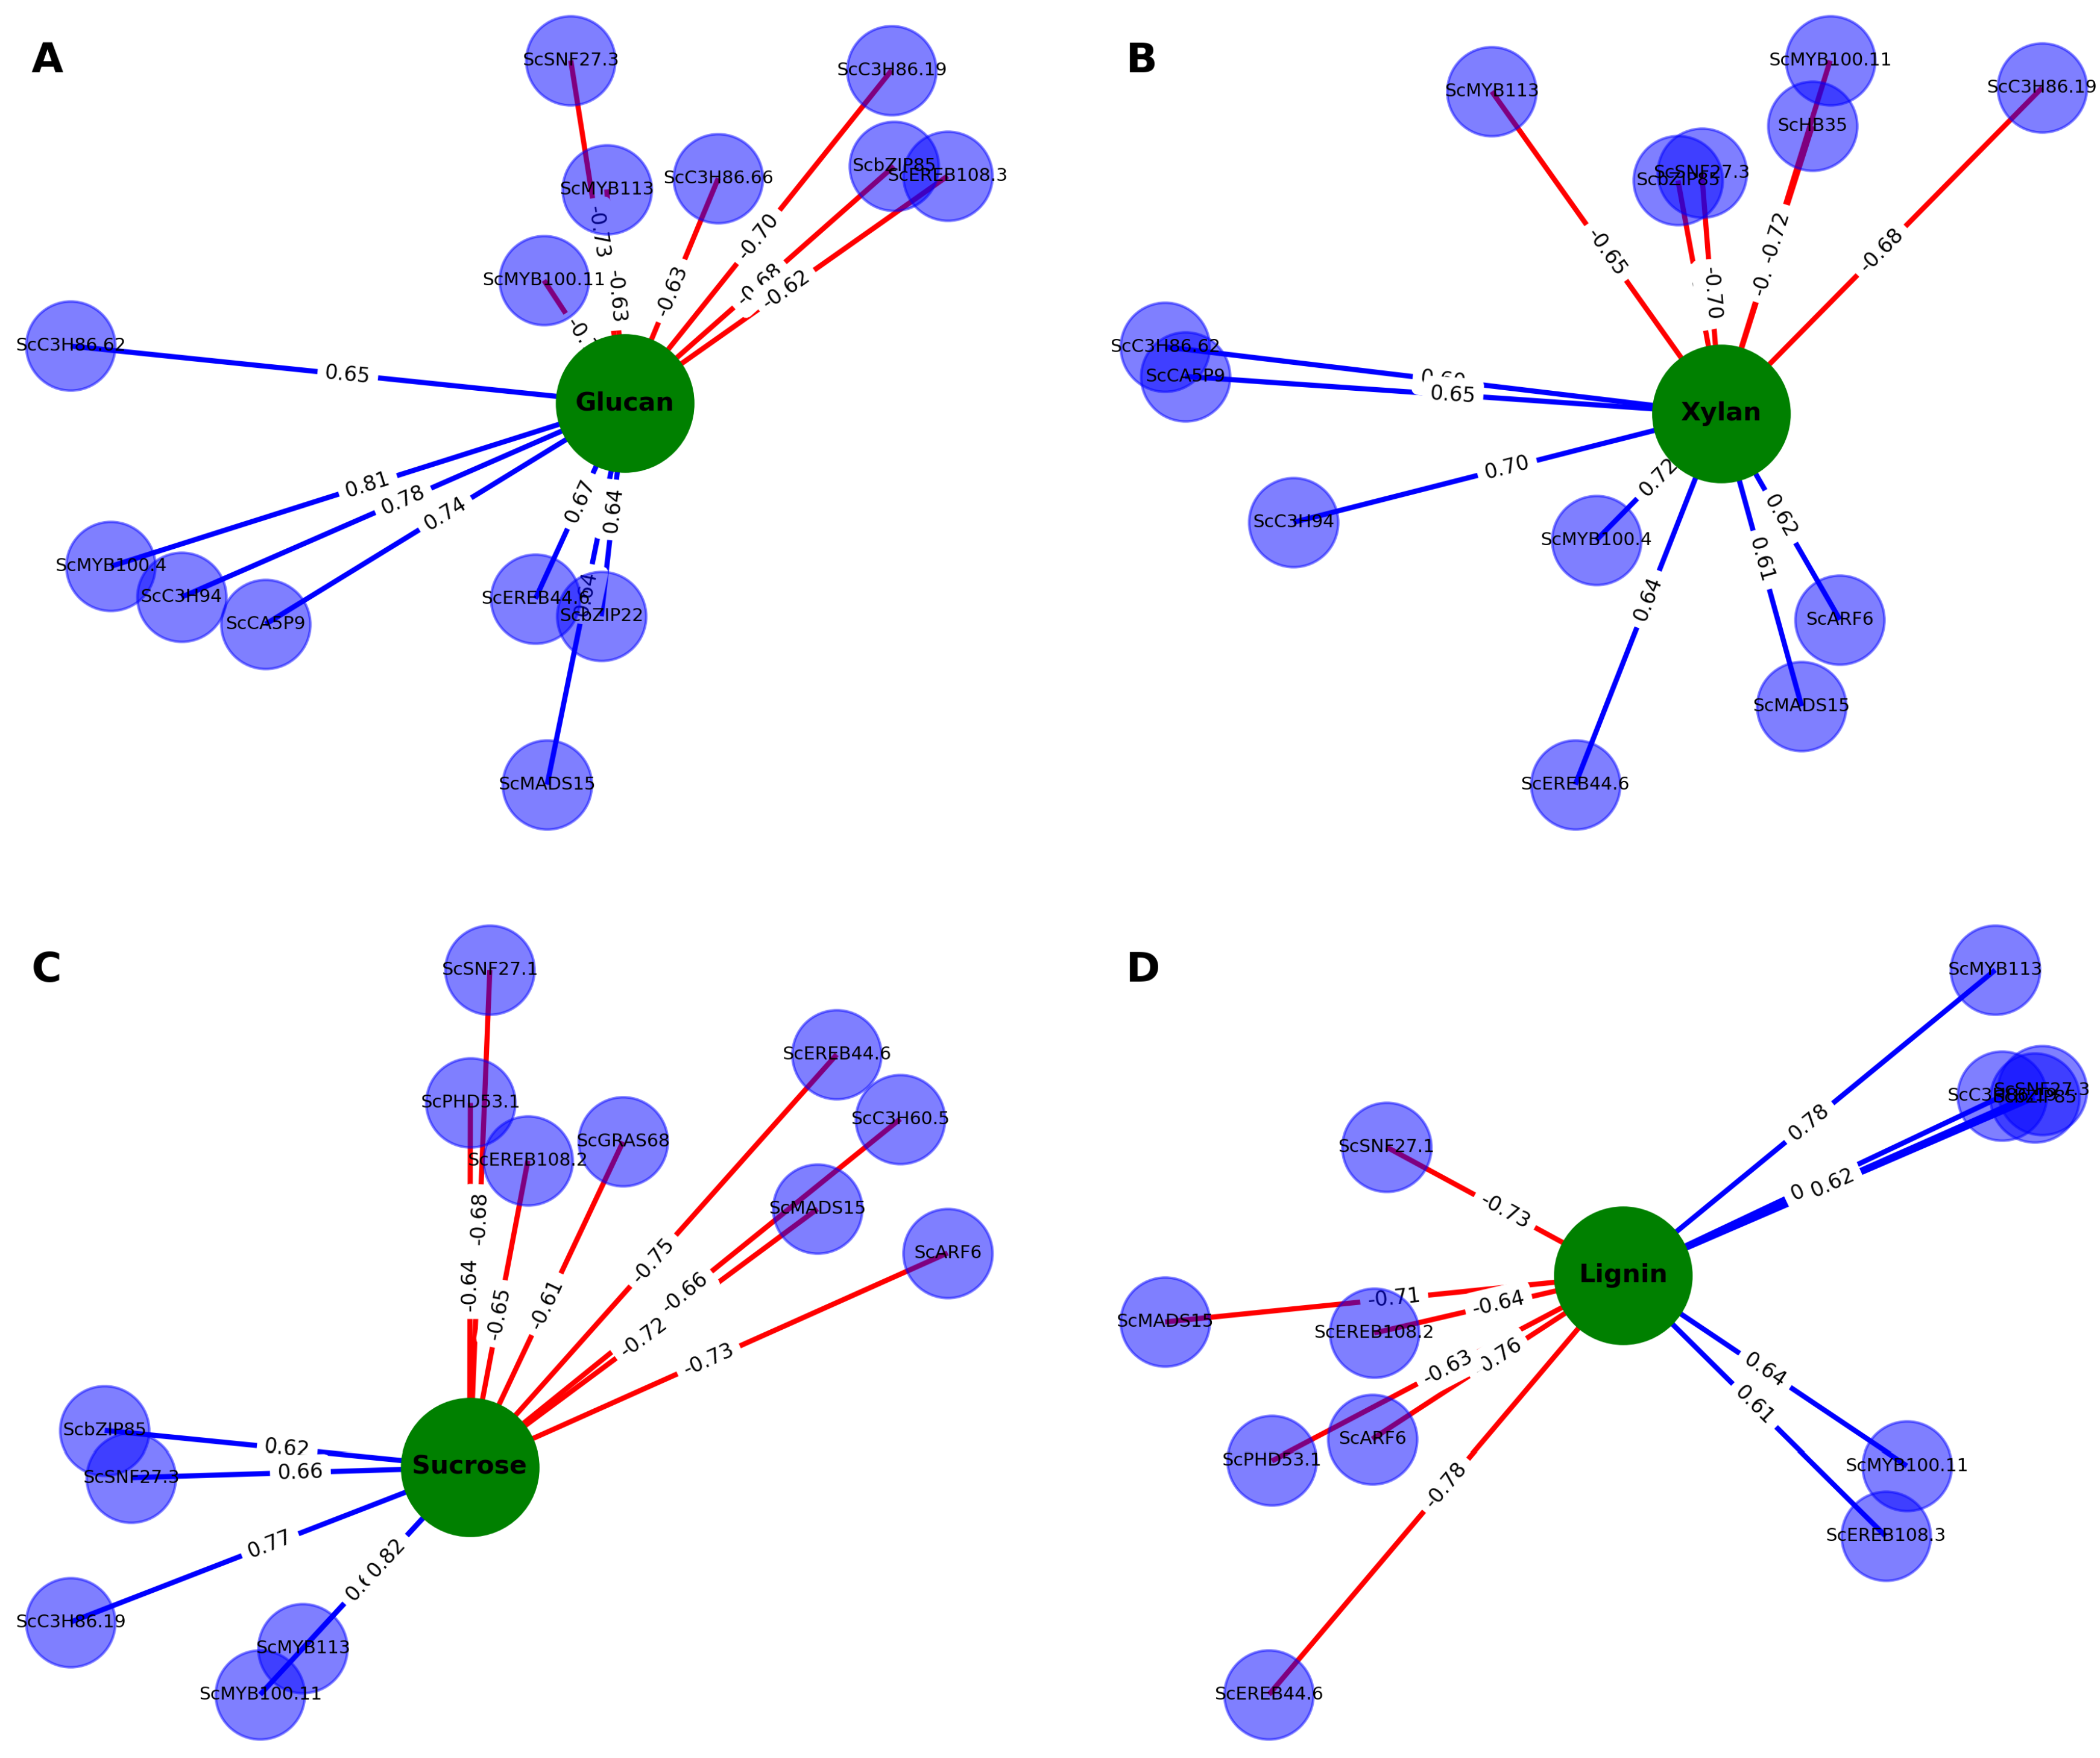
Figure 4.
Correlation network showing significant transcription factors (TFs) associated with biochemical and morphological traits in sugarcane. Yellow rectangles represent TFs, while green ellipses denote traits including cell wall components (Glucan, Xylan, Lignin), intermediary metabolism (ROPAL), the storage compound (Sucrose), and morphological traits (dry weight, length). Edges represent significant Pearson correlations (, ). Blue edges indicate positive correlations and red edges indicate negative correlations. The numerical values on edges reflect the correlation coefficients.
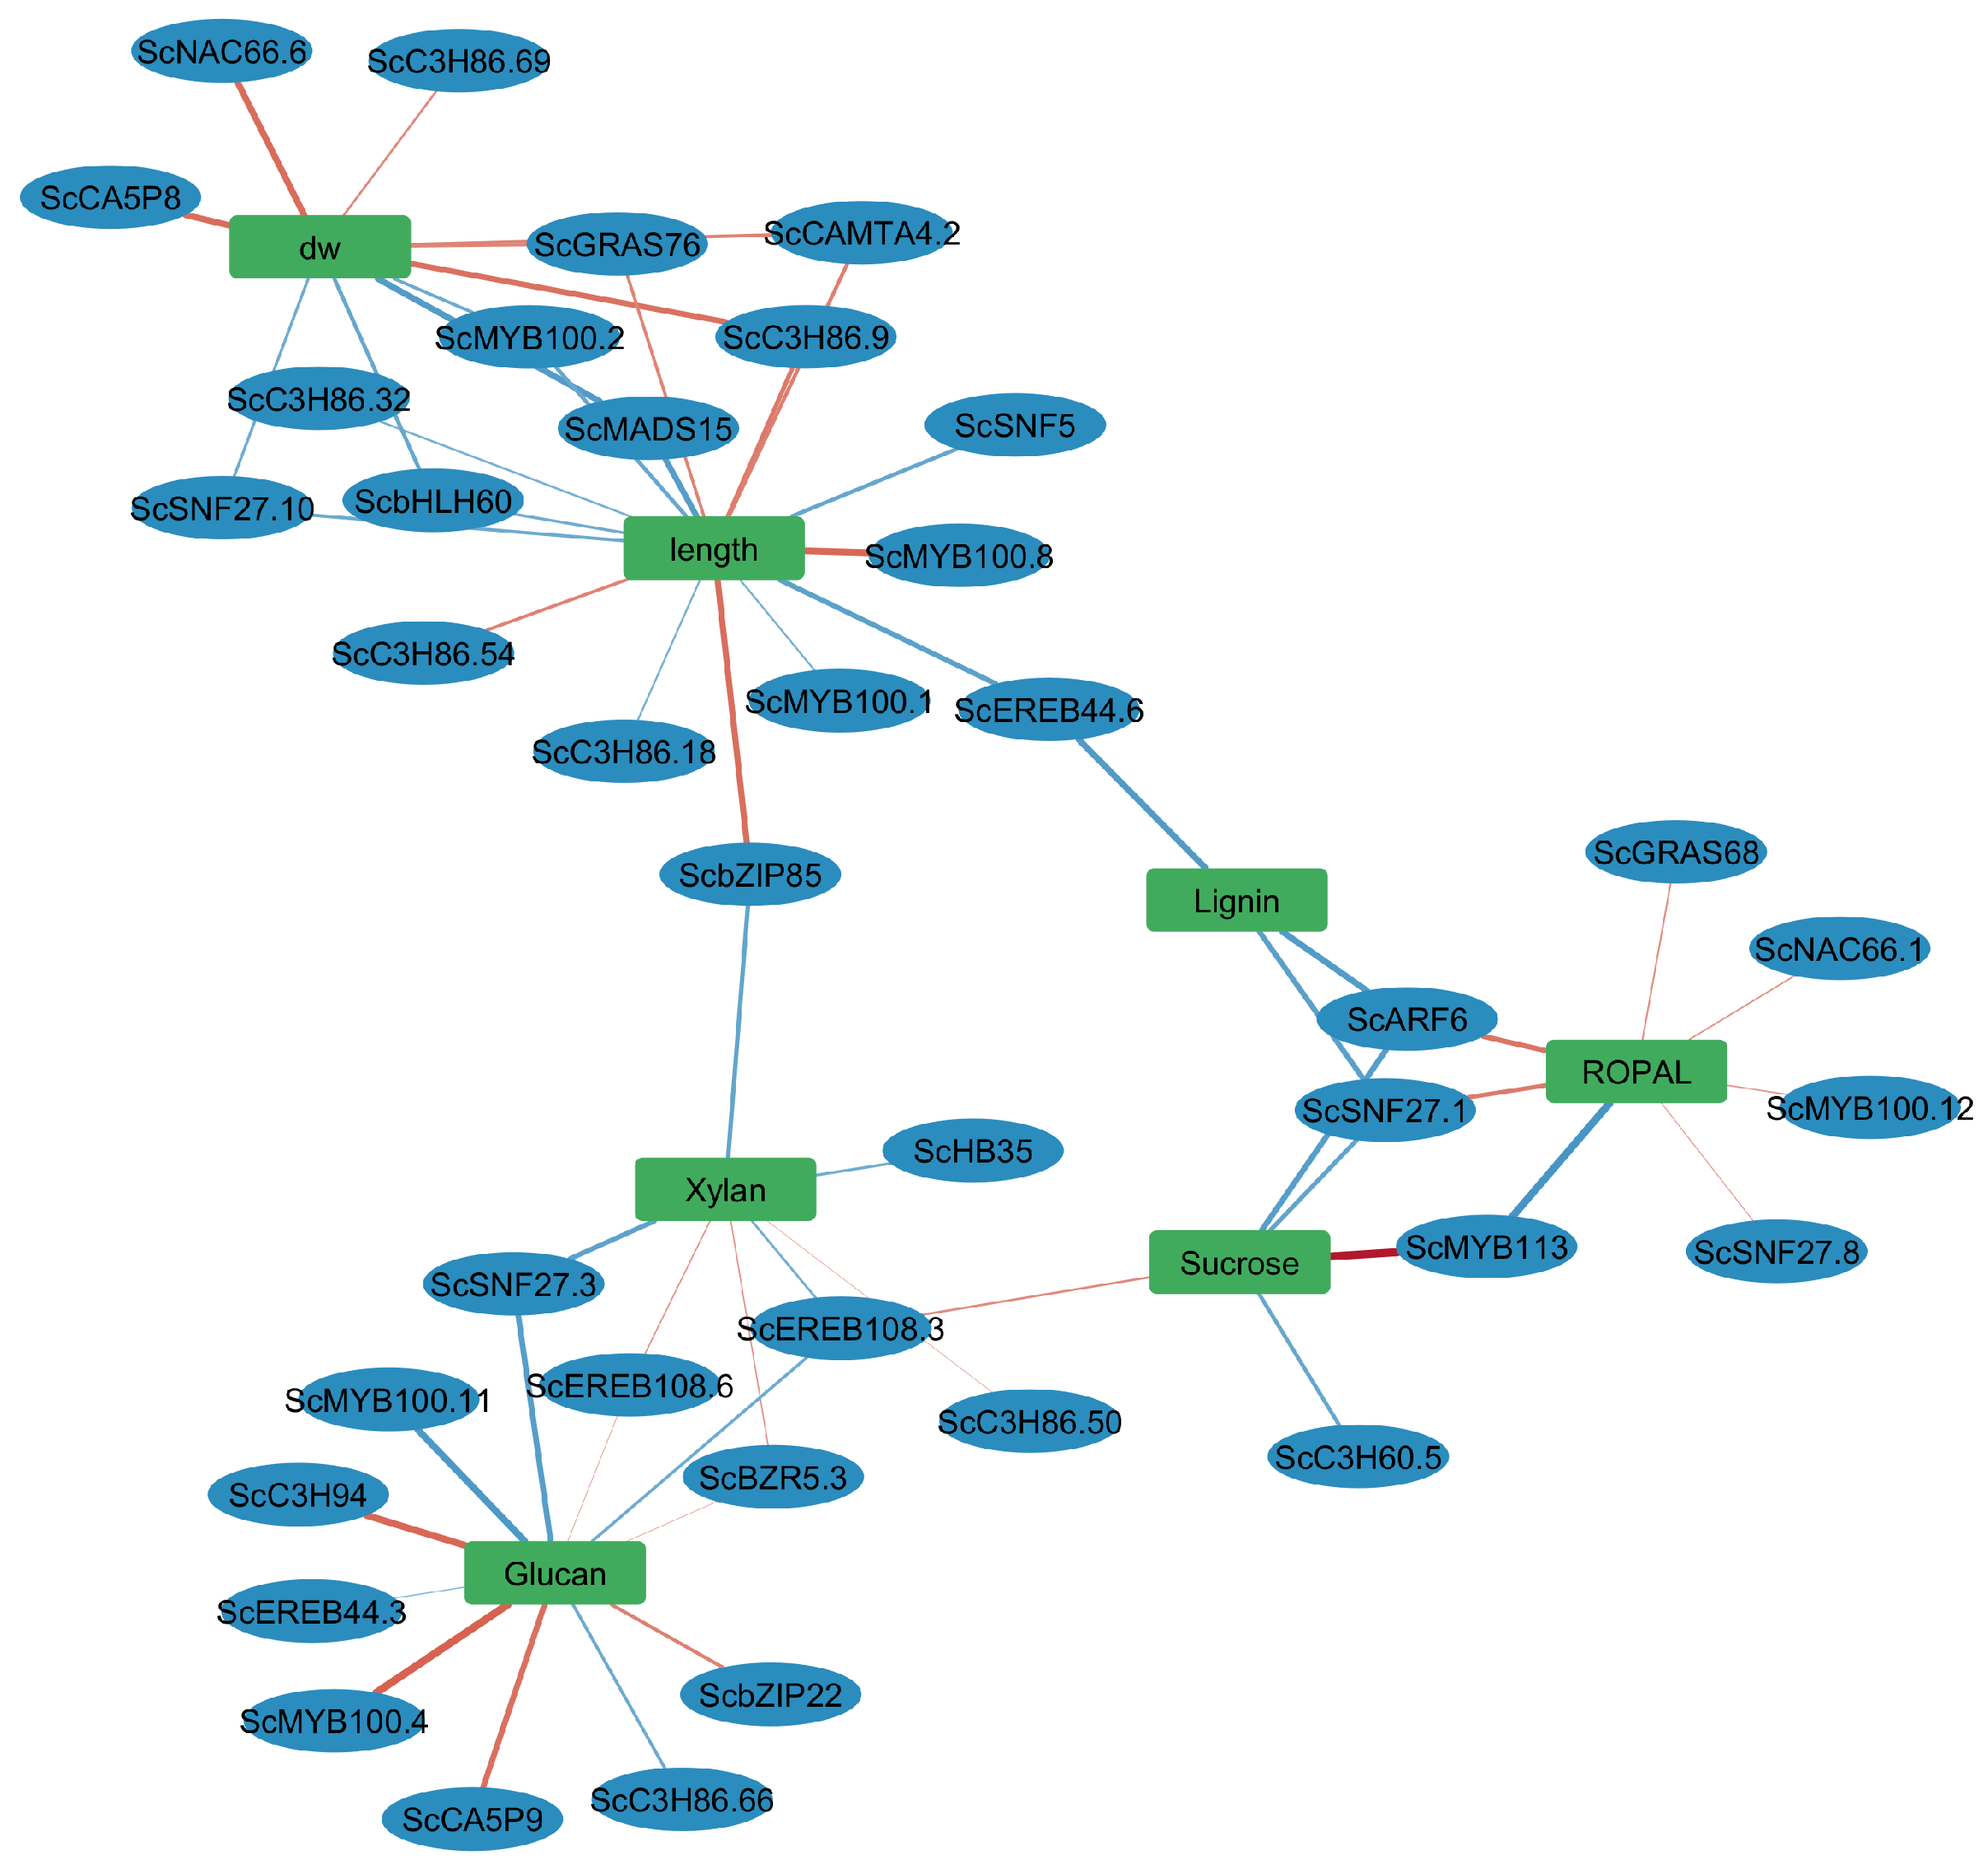
Figure 5.
Boxplots showing the expression profiles of the 15 transcription factors that are significanly linked to the seven major internode traits, across six phenotypic conditions (C2, C4, C6, S2, S4, and S6). Expression values were Z-score normalised and grouped by phenotype. Each subplot represents one transcription factor, highlighting differential expression patterns across the phenotypes.
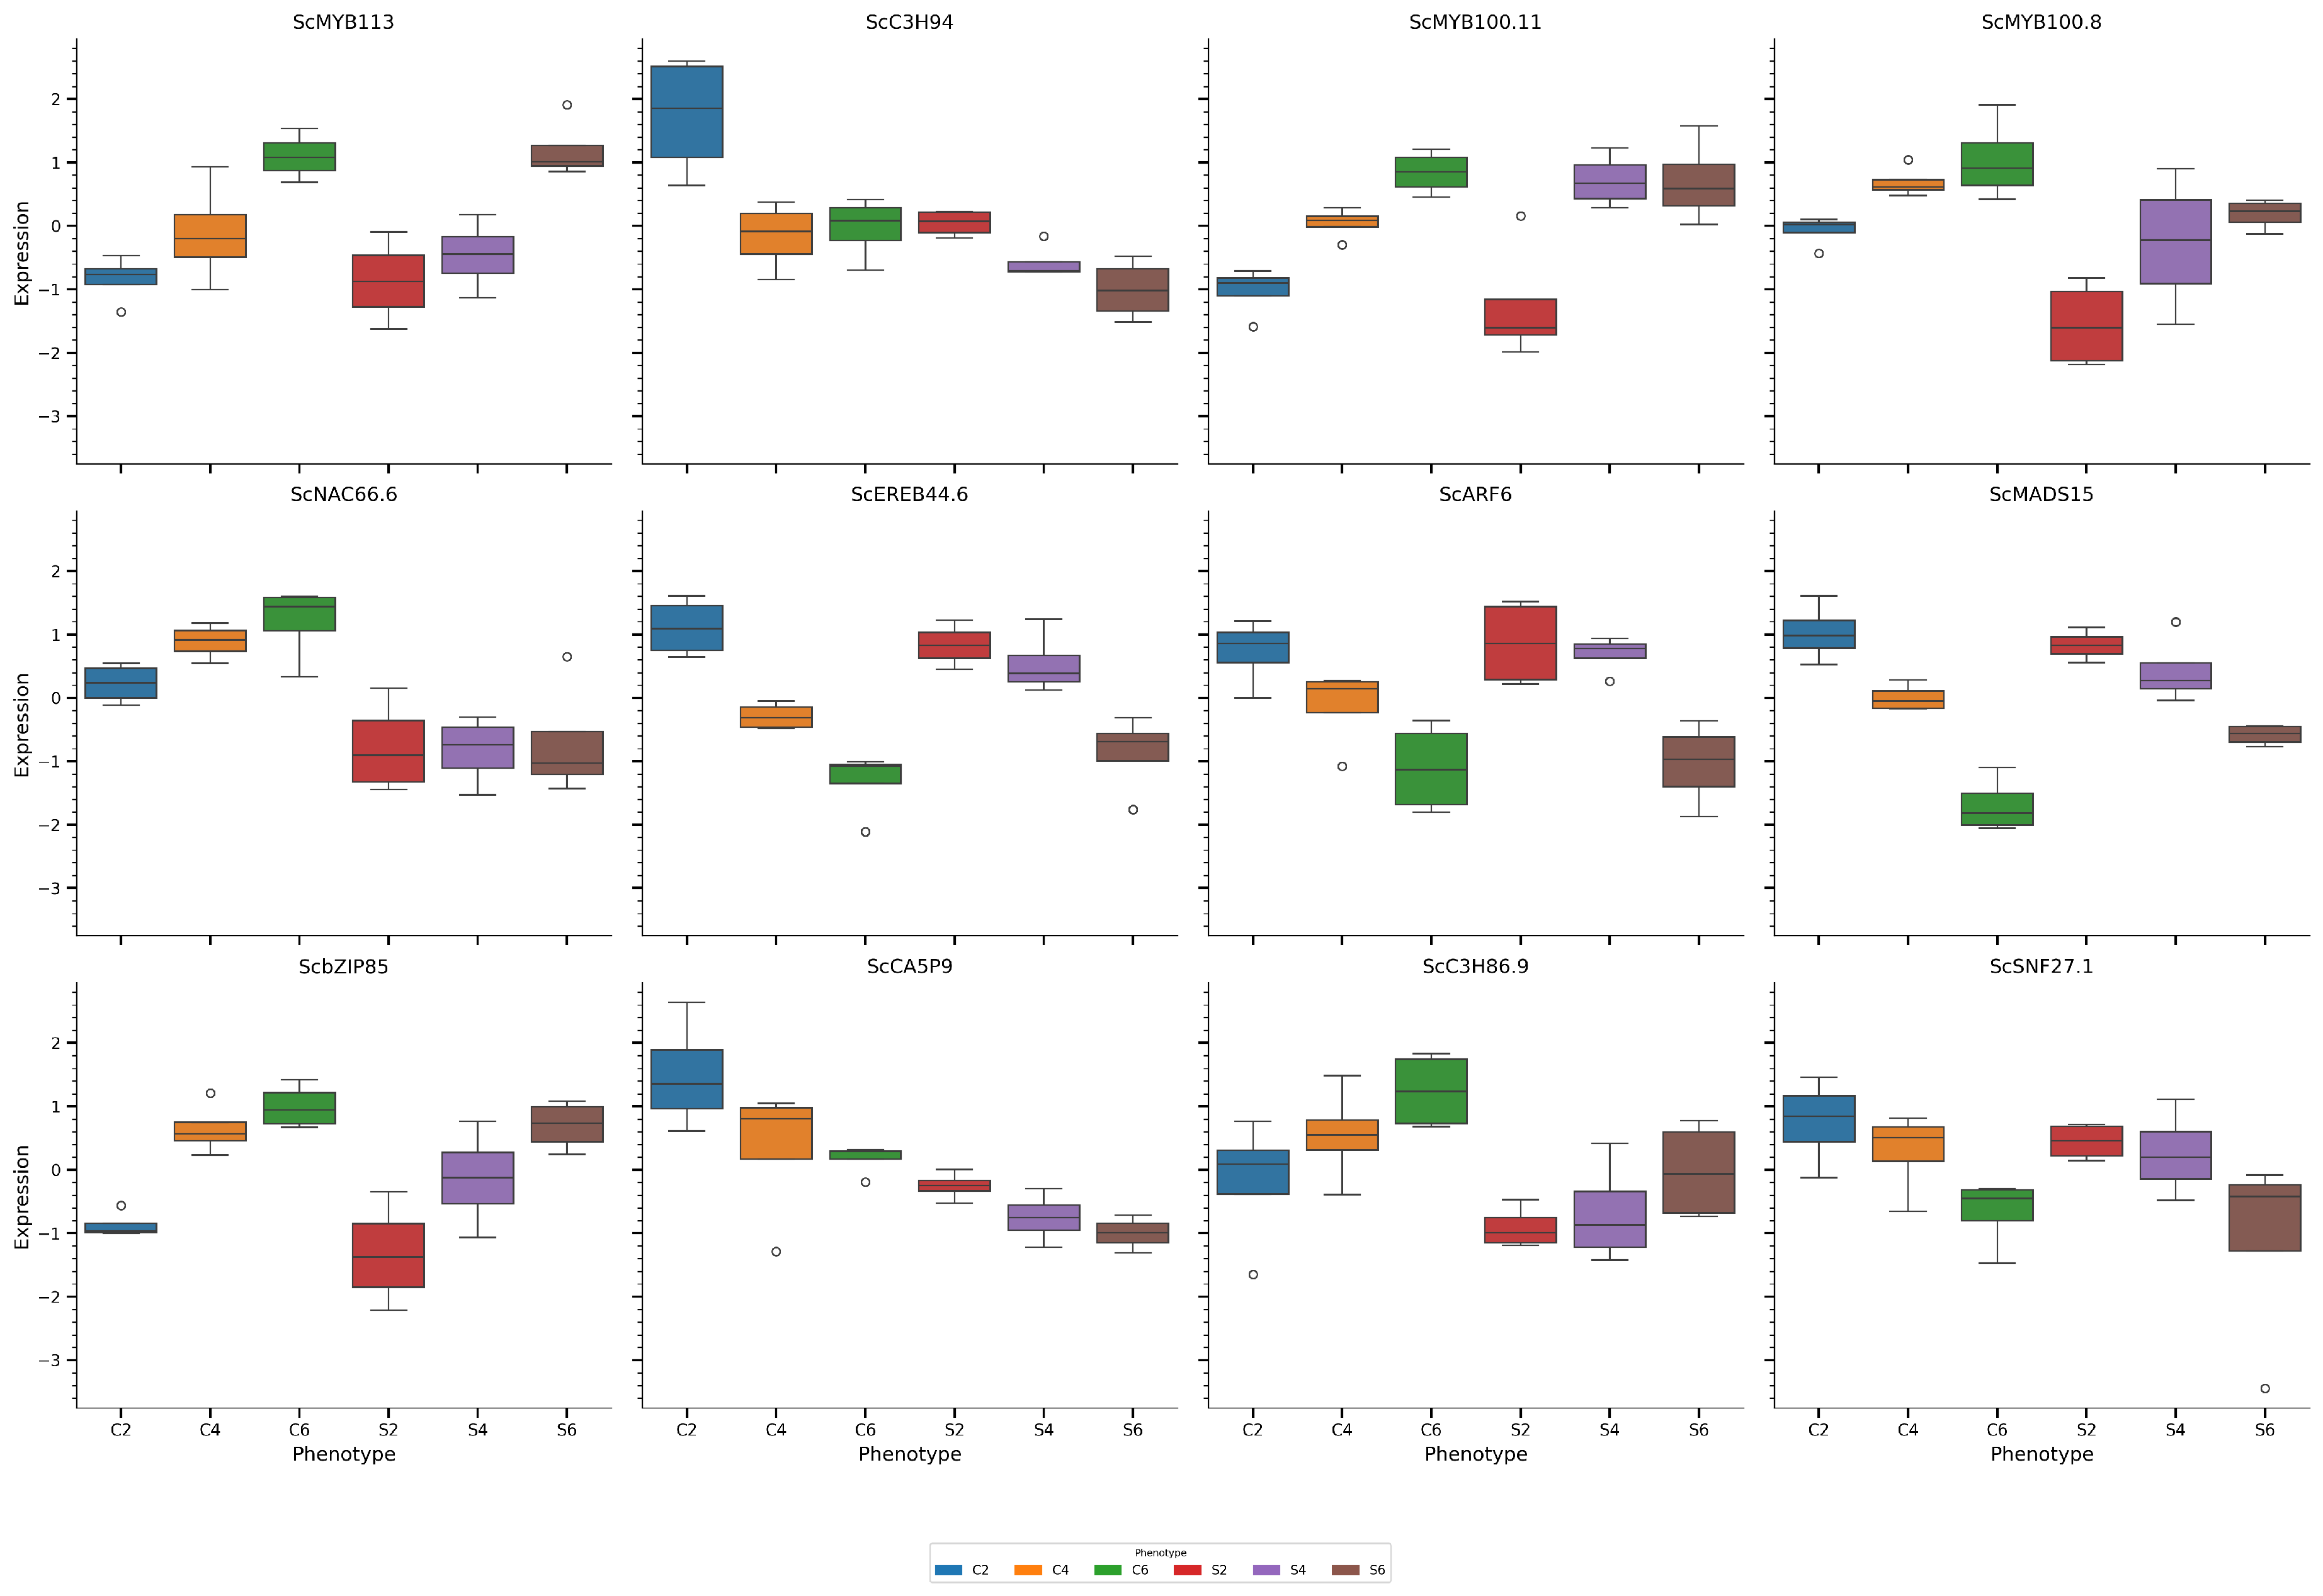
Table 1.
Changes in metabolite profiles between internodes at different stages of development during fast growth and slow growth).
Table 1.
Changes in metabolite profiles between internodes at different stages of development during fast growth and slow growth).
| Trait | Phenotype1 | Young2 | Mature3 | |||||||
| mean | p-adj | Tukey4 | mean | p-adj | Tukey4 | mean | p-adj | Tukey4 | ||
| length mm internode−1 |
-50.81 | <0.001 | ** | 58.1 | <0.001 | ** | -1.28 | 1 | ns | |
| Dry weight g internode−1 |
-11.2 | <0.001 | ** | 7.58 | <0.001 | ** | 4.02 | 0.03 | ** | |
| Water soluble | mg | |||||||||
| Total sugar | 31.59 | 0.1789 | ns | 182.46 | <0.001 | ** | -40.68 | 0.192 | ns | |
| Sucrose | 40.49 | 0.2794 | ns | 241.43 | <0.001 | ** | 31.01 | 0.6912 | ns | |
| Cellobiose | -0.02 | 0.9413 | ns | 2.86 | <0.001 | ** | -1.72 | <0.001 | ** | |
| Glucose | -4.68 | 0.5813 | ns | -32.07 | <0.001 | ** | -38.3 | <0.001 | ** | |
| Fructose | -4.03 | 0.5764 | ns | -28.49 | <0.001 | ** | -31.89 | <0.001 | ** | |
| Galactose | -0.14 | 0.3249 | ns | -1.15 | <0.001 | ** | 0.23 | 0.7982 | ns | |
| Arabinose | -0.02 | 0.2764 | ns | -0.13 | <0.001 | ** | -0.01 | 0.9997 | ns | |
| Cell wall | mg | |||||||||
| Total sugar | -23.28 | 0.0737 | ns | -83.81 | <0.001 | ** | -56.64 | <0.001 | ** | |
| Hexosans | -17.02 | 0.0764 | ns | -61.57 | <0.001 | ** | -45.28 | <0.001 | ** | |
| Glucan | -16.76 | 0.0759 | ns | -60.17 | <0.001 | ** | -45.42 | <0.001 | ** | |
| Mannan | -0.1 | 0.1828 | ns | -0.43 | 0.0012 | ** | 0.06 | 0.9992 | ns | |
| Galactan | -0.17 | 0.3208 | ns | -0.97 | 0.0046 | ** | 0.07 | 1 | ns | |
| Pentosans | -6.36 | 0.0739 | ns | -21.09 | <0.001 | ** | -9.64 | 0.0556 | ns | |
| Xylan | -5.28 | 0.0952 | ns | -18.54 | <0.001 | ** | -9.85 | 0.0712 | ns | |
| Arabinan | -0.96 | 0.0792 | ns | -3.51 | <0.001 | ** | -1.6 | 0.1171 | ns | |
| Rhamnan | -0.02 | 0.5405 | ns | -0.19 | 0.0011 | ** | 0.09 | 0.5463 | ns | |
| Glucoronic-acid | 0.31 | 0.4683 | ns | 1.29 | 0.5724 | ns | 1.05 | 0.7981 | ns | |
| Hemicellulose5 | -6.25 | 0.0856 | ns | -22.24 | <0.001 | ** | -11.36 | 0.0311 | ** | |
| mg | ||||||||||
| Lignin | Klason lignin | 2.85 | 0.6771 | ns | 21.86 | <0.001 | ** | 43.48 | <0.001 | ** |
| AS lignin | -0.36 | 0.4546 | ns | -3.39 | <0.001 | ** | 2.7 | 0.001 | ** | |
| mg | ||||||||||
| Other | ROPAL6 | -22.7 | 0.4576 | ns | -170.9 | <0.001 | ** | -6.29 | 1 | ns |
1 = Comparison between fast- and slow-growing sugarcane. 2 = Comparison between internodes 2 and 6. 3 = Comparison between internodes 8 and 12. 4 = TukeyHSD p0.05. 5 = Calculated as total of cell wall and lignin. 6 = Calculated as total biomass- the sum of water solubles, cell wall and lignin.
Table 3.
Transcription factors associated with the main traits in the sugarcane culm.
| Trait | Positive correlation | Negative correlation | ||||
| TF 1 | Correlation | p-value | TF 1 | Correlation 1 | p-value | |
| length | ScMYB100 | 0.774 | 9.07E-06 | ScC3H86 | -0.581 | 2.92E-03 |
| ScbZIP85 | 0.747 | 2.76E-05 | ScbHLH60 | -0.618 | 1.29E-03 | |
| ScC3H86 | 0.683 | 2.34E-04 | ScSNF27 | -0.636 | 8.30E-04 | |
| ScCAMTA4 | 0.653 | 5.45E-04 | ScSNF5 | -0.663 | 4.12E-04 | |
| ScGRAS76 | 0.629 | 9.84E-04 | ScMADS15 | -0.738 | 3.79E-05 | |
| ScEREB44 | -0.710 | 1.01E-04 | ||||
| Dry weight | ScC3H86 | 0.596 | 2.11E-03 | ScMADS15 | -0.750 | 2.41E-05 |
| ScGRAS76 | 0.624 | 1.11E-03 | ScbHLH60 | -0.661 | 4.43E-04 | |
| ScCAMTA4 | 0.637 | 8.12E-04 | ScMYB100 | -0.632 | 9.15E-04 | |
| ScC3H86 | 0.732 | 4.72E-05 | ScSNF27 | -0.620 | 1.24E-03 | |
| ScCA5P8 | 0.755 | 1.99E-05 | ||||
| ScNAC66 | 0.759 | 1.70E-05 | ||||
| Glucan | ScMYB100 | 0.811 | 1.52E-06 | ScEREB44 | -0.548 | 5.57E-03 |
| ScC3H94 | 0.778 | 7.71E-06 | ScEREB108 | -0.625 | 1.10E-03 | |
| ScCA5P9 | 0.736 | 4.09E-05 | ScC3H86 | -0.631 | 9.39E-04 | |
| ScbZIP22 | 0.644 | 6.88E-04 | ScSNF27 | -0.731 | 4.93E-05 | |
| ScEREB108 | 0.530 | 7.78E-03 | ||||
| ScBZR5 | 0.527 | 8.11E-03 | ||||
| Xylan | ScEREB108 | 0.556 | 4.76E-03 | ScSNF27 | -0.700 | 1.40E-04 |
| ScBZR5 | 0.555 | 4.87E-03 | ScbZIP85 | -0.679 | 2.66E-04 | |
| ScC3H86 | 0.526 | 8.33E-03 | ScHB35 | -0.613 | 1.44E-03 | |
| Sucrose | ScMYB113 | 0.824 | 7.58E-07 | ScC3H60 | -0.661 | 4.35E-04 |
| ScEREB108 | 0.593 | 2.25E-03 | ScSNF27 | -0.681 | 2.49E-04 | |
| ScARF6 | -0.733 | 4.61E-05 | ||||
| Lignin | ScEREB44 | -0.755 | 1.99E-05 | |||
| ScARF6 | -0.753 | 2.17E-05 | ||||
| ScSNF27 | -0.718 | 7.83E-05 | ||||
| ROPAL | ScARF6 | 0.712 | 9.57E-05 | ScMYB113 | -0.805 | 2.10E-06 |
| ScSNF27 | 0.679 | 2.68E-04 | ||||
| ScGRAS68 | 0.570 | 3.64E-03 | ||||
| ScNAC66 | 0.562 | 4.29E-03 | ||||
| ScSNF27 | 0.539 | 6.62E-03 | ||||
1 = Transcription factor. Name based on homology with sugarcane sequences in GRASSIUS.
Disclaimer/Publisher’s Note: The statements, opinions and data contained in all publications are solely those of the individual author(s) and contributor(s) and not of MDPI and/or the editor(s). MDPI and/or the editor(s) disclaim responsibility for any injury to people or property resulting from any ideas, methods, instructions or products referred to in the content. |
© 2025 by the authors. Licensee MDPI, Basel, Switzerland. This article is an open access article distributed under the terms and conditions of the Creative Commons Attribution (CC BY) license (http://creativecommons.org/licenses/by/4.0/).
Copyright: This open access article is published under a Creative Commons CC BY 4.0 license, which permit the free download, distribution, and reuse, provided that the author and preprint are cited in any reuse.


