
Submitted:
25 April 2025
Posted:
29 April 2025
You are already at the latest version
Abstract
Soybean (Glycine max) seeds are rich in amino acids, offering key nutritional and physiological benefits. In this study, 290 soybean accessions from the USDA-ARS Germplasm Resources Information Network (GRIN) were analyzed. Four genome-wide association study (GWAS) models—Bayesian-information and Linkage-disequilibrium Iteratively Nested Keyway (BLINK), Mixed Linear Model (MLM), Fixed and Random Model Circulating Probability Unification (FarmCPU), and Multi-Locus Mixed Model (MLMM)—identified two significant single nucleotide polymorphisms (SNPs) associated with arginine content: Gm06_19014194_ss715593808 (LOD = 9.91, 3.91% variation) at 19,014,194 bp on chromosome 6 and Gm11_2054710_ ss715609614 (LOD = 9.05, 19% variation) at 2,054,710 bp on chromosome 11. Two candidate genes Glyma.06g203200 and Glyma.11G028600 were founded in the two SNP marker regions, respectively. Genomic prediction was performed for arginine content using several models: Bayes A (BA), Bayes B (BB), Bayesian LASSO (BL), Bayesian Ridge Regression (BRR), Ridge Regression Best Linear Unbiased Prediction (rrBLUP), Random Forest (RF), and Support Vector Machine (SVM). High genomic prediction accuracy were observed in both across- and cross-populations, supporting genomic selection (GS) for breeding high-arginine soybean cultivars.
Keywords:
Glycine max
; soybean
; arginine
; GWAS
; genomic prediction
; SNP
1. Introduction
Soybean (Glycine max (L.) Merr.) is one of the most important crops worldwide, providing a vital source of protein and oil [1]. With rising living standards, the demand for high-quality soybean with enhanced nutritional value has increased. Breeding soybean accessions with improved quality traits has become a key focus in research. Among these traits, amino acid composition plays a crucial role in determining the nutritional value of soybean [2]. Amino acids in soybean seeds exist both as free compounds and as components of proteins. Free amino acids contribute to energy metabolism and biochemical pathways, with arginine, glycine, glutamic acid, and lysine being particularly important. Arginine, a fundamental component of proteins, plays a crucial role in various biochemical and physiological functions in plants.
Arginine facilitates nitrogen release during seed germination, thereby promoting plant growth and development [3,4]. It is synthesized from ornithine via the arginine biosynthesis pathway, with arginase catalyzing the final step by converting it into ornithine and urea. This process helps detoxify ammonia by converting it into urea for recycling, a mechanism distinct from urea excretion in animals [5,6,7]. Additionally, arginine serves as a precursor for polyamine biosynthesis through its conversion into agmatine, which influences plant growth, development, and stress responses [8]. Recent studies suggest that arginine and ornithine regulate leaf longevity by modulating energy metabolism and polyamine biosynthesis via ethylene signaling [9]. Furthermore, a novel energy regulation mechanism involving the co-degradation of arginine and succinate in plant root nodules has been discovered [10].
Genetic improvement is a key strategy for enhancing arginine content in soybean. Previous studies have shown that arginine content is controlled by multiple genes, with several quantitative trait loci (QTLs) identified. For example, Qin et al. (2019) mapped QTLs associated with arginine content on chromosome 7, 12, and 16, identifying candidate genes, Glyma03g129100 and Glyma03g129700 [11]. Fallen et al. (2013) reported ten QTLs associated with 17 amino acids and three genomic regions on chromosome 13 [12]; Warrington et al. (2015) conducted QTL analysis for the four amino acids in soybean population with 98 SSRs and 323 single nucleotide polymorphism (SNP) markers, and detected two QTLs on chromosome 8 and 20 for Lysine; three on chromosome 9, 17, and 20 for Threonine; four on chromosome 6, 9, 10, and 20 for Methionine [13]. These studies provide a foundation for understanding the genetic mechanisms underlying arginine content and amino acids in soybean. However, further exploration of key loci and candidate genes is necessary to support breeding efforts aimed at developing high-arginine soybean varieties.
Genomic selection (GS) is a powerful approach for predicting genome estimating breeding value (GEBV) using high-density genome-wide markers. By estimating the effects of chromosomal segments, GS facilitates marker-assisted selection (MAS) and provides valuable insights into the genetic architecture of complex traits in soybean [14]. This method relies on the principle that high-density SNP markers are in linkage disequilibrium with QTL influencing target traits, thereby improving prediction accuracy [15,16].
Several studies have demonstrated the effectiveness of GS in improving agronomic traits. Zhang et al. (2018) conducted a genome-wide association studies (GWAS) of seed quality using over 30,000 SNPs across 309 soybean accessions. Using this population as a simulation group, they estimated breeding values for seed quality traits and compared GS with MAS. Their results showed that GS achieved prediction accuracy ranging from 0.75 to 0.87, whereas MAS achieved accuracies between 0.62 and 0.75, demonstrating higher efficiency of GS [17]. In maize, Spindel et al. (2015) applied GS to predict yield-related traits, achieving significantly higher accuracy than traditional breeding methods, particularly for complex traits [18]. Similarly in wheat, Crossa et al. (2017) utilized GS to analyze global accessions, improving yield and stress resistance with prediction accuracies of 0.65-0.80 [19]. In rice, Grenier et al. (2015) demonstrated that GS provided superior prediction accuracy for drought resistance than traditional phenotypic selection [20]. These findings highlight the potential of GS in accelerating crop genetic improvement.
Enhancing arginine content in soybean is a key objective in modern soybean breeding. The development of new molecular markers for MAS and GS will facilitate the efficient identification and advancement of high-arginine soybean lines. However, research on the genetic loci associated with arginine content in soybean remains limited, and even fewer studies have applied GS approaches to dissect this trait. The main objectives of this study are: (1) to evaluate arginine content in soybean accessions collected from 12 countries; (2) to identify SNP markers associated with arginine content; and (3) to perform genomic prediction (GP) for arginine content using USDA GRIN soybean accessions. Identifying soybean accessions with high arginine content will provide valuable parental materials for breeding programs, while the molecular markers identified can support the selection of high-arginine lines through MAS and GS.
2. Materials and Methods
2.1. Plant Materials
In this study, 290 soybean accessions were obtained from the United States Department of Agriculture (USDA). Based on arginine content, the accessions were divided into two subgroups: a lower-arginine-content subgroup consisting of 126 accessions, with arginine content ranging from 5–7.5% of total protein, and a higher-arginine-content subgroup comprising 164 accessions, with arginine content ranging from 8.5–10.0% of total protein. These accessions originated from 12 countries: South Korea (175), China (45), Japan (37), the United States (14), Nepal (6), India (5), France (2), Russia (2), and one accession each from Malaysia, Moldova, Pakistan, and an unknown origin (Supplementary Table S1).
2.2. Phenotypic Identification
Phenotypic data on arginine content for the 290 soybean accessions were retrieved from the USDA GRIN website (https://npgsweb.ars-grin.gov/gringlobal/descriptors). The data were provided by Randy Nelson from the USDA Soybean Accessions Collection, Urbana, Illinois, USA (Supplementary Table S1).
2.3. Genotyping and Data Quality Control
Genotyping of the 290 accessions was performed using the USDA Soybean Accessions Soy50K SNP Infinium chip [21,22]. A total of 42,081 SNP markers for the 290 soybean accessions were downloaded from SoyBase (https://www.soybase.org/snps/). Data quality control was conducted using Microsoft Excel to filter markers and individuals based on missing rate (MISSING), heterozygosity rate (H), and minor allele frequency (MAF). Markers with a missing rate (MISSING) > 5%, heterozygosity rate (H) > 5%, or minor allele frequency (MAF) < 5% were excluded. After filtering, 33,858 SNP markers were retained for genetic diversity and association analysis (Supplementary Table S2).
2.4. Genetic Diversity and Population Structure Analysis
In this study, GAPIT 3 software [23], (https://zzlab.net/GAPIT/index.html) was used to analyze the population structure, which was divided into two subgroups. A phylogenetic tree was constructed using the Neighbor-Joining (NJ) method, followed by Principal Component Analysis (PCA) and genetic diversity analysis. Based on preliminary research and initial data exploration, the number of PCA components was set between 2 and 10, and the NJ tree was constructed with subgroup numbers ranging from 2 to 10. Genetic diversity and arginine content of the 290 accessions were evaluated using 33,858 SNPs in GAPIT 3, while a randomly selected subset of 10,000 SNPs was analyzed in MEGA7 using the maximum likelihood-based phylogenetic analysis was conducted using MEGA7 [24].
2.5. Genome-Wide Association Study
GWAS was conducted using five statistical models implemented in GAPIT 3: the generalized linear model (GLM), mixed linear model (MLM), multiple loci mixed model (MLMM), Fixed and Random Model Circulating Probability Unification (FarmCPU), and the Bayesian-information and Linkage-disequilibrium Iteratively Nested Keyway (BLINK) model (Wang & Zhang, 2021; https://zzlab.net/GAPIT/index.html). Association significance was determined using a Bonferroni-corrected threshold (0.05/33,858), corresponding to a logarithm of odds (LOD) score of 5.78.
2.6. Candidate Gene Annotation
Candidate gene models were searched within a 5 kb region flanking each significant SNP locus [25]. The soybean genome annotation reference was obtained from the Phytozome database (specifically Glycine max Wm82. a2. v1, available at (https://phytozome-next.jgi.doe.gov/info/Gmax_Wm82_a2_v1). Candidate genes associated with soybean arginine content were selected and further analyzed by performing BLAST comparisons with genome annotation data from the Arabidopsis genome database (https://www.arabidopsis.org/Blast/index.jsp). Corresponding gene annotations were reviewed using the SoyBase database (http://www.soybase.org/dlpages/). Candidate genes were identified by selecting loci with known gene functions in Arabidopsis.
2.7. Genomic Prediction
2.7.1. Genomic Prediction Using Different SNP Sets
Prediction accuracy (PA) for arginine content was assessed using seven genomic prediction (GP) models: Bayes A (BA), Bayes B (BB), Bayesian LASSO (BL), Bayesian Ridge Regression (BRR), Ridge Regression Best Linear Unbiased Prediction (rrBLUP), Random Forest (RF), and Support Vector Machine (SVM). All 33,858 SNPs were analyzed using the R software environment [26]. A five-fold cross-validation approach was employed, maintaining a 4:1 ratio between training and testing datasets. Eight randomly selected SNP sets were evaluated, ranging in size from 10 to 10,000 SNPs (labeled r10, r100, r200, r500, r1000, r2000, r5000, and r10000). In addition, one marker set (m10), derived from a GWAS, was included. Genomic estimated breeding values (GEBVs) were calculated for each of the nine SNP sets across all seven models [27,28,29,30]. Each combination was run 100 times, and mean correlation coefficients (r-values) along with standard errors (SE) were computed. Boxplots illustrating the performance of the GP models across different SNP sets were generated using the 'ggplot2' package in R.
2.7.2. Genomic Prediction Using GAPIT3 for Whole Panel
The GAPIT3 software package was also employed to GEBVs using three models: genomic best linear unbiased prediction (gBLUP), SUPER gBLUP (sBLUP), and GWAS-assisted genome BLUP (GAGBLUP, previously known as maBLUP). In this analysis, the entire panel of 290 soybean accessions was used as both the training and testing population to predict GEBVs for arginine content.
2.7.3. Genomic Prediction Using GWAS-Derived SNP Markers
GWAS-Derived SNP Markers from the Whole Panel and Self-Prediction
First, GWAS was conducted using four models (GLM, MLM, FarmCPU, and BLINK), and the associated SNP markers were identified from these models in the entire GWAS panel (290 soybean accessions). Secondly, GP was performed using the GWAS-derived SNP markers, with the whole panel serving as both the training population (TP) and validation population (VP). GP was performed as described in the previous section on GP using different SNP sets.
GWAS-Derived SNP Markers from 80% of the Whole Panel
Both cross- and across-population predictions were performed for arginine content using GWAS-derived associated SNP markers. The entire panel (290 accessions) was divided into two subsets: 80% as the training population (TP) (232 accessions) and 20% as the validation population (VP) (58 accessions). GWAS was performed on the 232 accessions using the BLINK models in GAPIT3. Associated SNPs with a LOD score (-log(P)) > 5.78 were selected and used to run the GP model 100 times, calculating GEBVs and estimating the average r-value each time. This process was repeated five times, and the mean r-value across the five replications was obtained as the prediction accuracy (average r-value). Three GP types were tested: ‘Across. Prediction’, ‘Cross. prediction’, and ‘All(self). Prediction’.
- Across. Prediction uses GWAS-derived SNP markers from the training set (80% of the population, 232 accessions) to predict the validation set (20% – 58 accessions).
- Cross. prediction uses GWAS-derived SNP markers from the training set (80% of the population, 232 accessions) to predict itself.
- All(self). Prediction uses all associated SNP markers from the five repeats to predict the entire population (290 accessions).
Additionally, GP was performed with five GP models (BA, BB, BL, BRR), and GEBVs were calculated for all models. Each replication in each model was run 100 times, and mean r-values along with standard errors (SE) were computed. Boxplots illustrating GP model performance across SNP sets were generated using ggplot2 in R.
GWAS-Derived SNP Markers Using GAGBLUP in GAPIT3
Following the same approach described above, the entire panel of 290 soybean accessions was randomly divided into two subsets: 80% as the training population (TP; 232 accessions) and 20% as the validation population (VP; 58 accessions). Genomic prediction (GP) was conducted using the GAGBLUP (BLINK) model—previously referred to as maBLUP—in GAPIT3. Within the full panel, the ‘NA’ value was assigned to individuals in the TP. The r-value was calculated as the correlation between the estimated genomic estimated breeding values (GEBVs) and the observed values in the TP. This process was repeated five times, and the mean r-value was used to assess GP efficiency. As in the previous analysis, both across-population and cross-population predictions were performed.
3. Results
3.1. Phenotypic Analysis of Arginine Content
The arginine content of the 290 soybean accessions exhibited significant variation. The average arginine content was 7.72% of total protein, with a standard deviation of 1.31 and a coefficient of variation of 17.01%. The distribution of arginine content among the accessions was as follows: 7 accessions had arginine content between 5.0% and 5.5% of total protein, 18 between 5.5% and 6.0%, 37 between 6.0% and 6.5%, 54 between 6.5% and 7.0%, 10 between 7.0% and 7.5%, 119 between 8.5% and 9.0%, 40 between 9.0% and 9.5%, and 5 between 9.5% and 10.0%. The distribution of these accessions was concentrated in two distinct intervals: 5.0–7.5% and 8.5–10.0% of total protein, forming a bimodal distribution pattern (Figure 1).
3.2. Population Structure and GWAS
The GAPIT 3 software package was used to analyze the 290 soybean accessions in R, successfully dividing them into two subgroups, Q1 and Q2 (Figure 2A, 2B and 2D). The two subgroups were clearly separated along the first and second principal components (PC1 and PC2), which explained 14.28% and 7.54% of the genetic variation, respectively (Figure 2A). This suggests significant differences in the genetic composition of materials from different sources. Based on kinship analysis, the kinship coefficients among most inbred lines ranged from 0.0 to 0.5, with only a small portion ranging from 0.5 to 1.0. This indicates that the 290 accessions are distantly related, with a degree of genetic independence, which improves the accuracy of detecting loci associated with arginine content (Figure 2D).
A GWAS for soybean arginine content was performed using four models: MLM, FarmCPU, BLINK, and MLMM. The significance threshold was set at LOD ≥ 5.78, and phenotypic variation explained (PVE) values were calculated using GAPIT3. Two significant loci associated with arginine content in soybean were identified: (1) Gm11_2054710_ss715609614, located at 2,054,710 bp on chromosome 11, with LOD values of 6.38 in MLM and 9.05 in MLMM (Table 1). This SNP explained over 30% of the phenotypic variation, with a corresponding t-test value of 21.24, indicating a highly significant association. (2) Gm06_19014194_ss715593808, located at 19,014,194 bp on chromosome 6, with LOD values of 9.91 in BLINK and 8.02 in FarmCPU (Table 1). This SNP explained up to 8.86% of the phenotypic variation, with a t-test value of 7.23, also indicating a highly significant association. These findings are summarized in
Table 1 and illustrated in Figure 3 and Figure 4. Both loci were identified by two models simultaneously, suggesting that they are likely major genetic loci controlling soybean arginine content. Additionally, two other SNPs—Gm05_464582_ss715592561 at 464,582 bp on chromosome 5, and Gm08_18566925_ss715600087 at 18,566,925 bp on chromosome 8—were also associated with arginine content, with LOD values of 6.73 and 6.46, respectively (Table 1).
3.3. Haplotype Analysis
Based on the genotype data, the locus Gm06_19014194_ss715593808 contains two haplotypes: AA and GG. An analysis of variance (ANOVA), conducted using both the genotype and phenotypic data, revealed that the AA genotype significantly increased soybean arginine content by 11.48% compared to the GG genotype (P < 0.001). Similarly, the locus Gm11_2054710_ss715609614 contains two haplotypes: AA and CC. ANOVA analysis for the AA and CC genotypes showed that the CC genotype significantly increased soybean arginine content by 10% compared to the AA genotype (P < 0.001) (Figure 5).
3.4. Candidate Gene Detection
Within the 5 kb regions flanking the loci Gm06_19014194_ss715593808 and Gm11_ 2054710_ss715609614, a total of 10 genes were identified. Among these, the gene Glyma.06g203200 is closely linked to the SNP marker Gm06_19014194_ss715593808 on chromosome 6, located within a 5 kb distance. Gene annotation reveals that this gene encodes a mitochondrial ATPase (ATP synthase), which is essential for cellular energy metabolism. The metabolic products of arginine may indirectly regulate ATP synthase activity by influencing mitochondrial function. Furthermore, the gene Glyma.11G028600 is closely linked to the SNP marker Gm11_2054710_ss715609614 on chromosome 11, also within a 5 kb distance. Annotation suggests that this gene encodes the Ycf49 protein, which is putatively involved in regulating energy metabolism during photosynthesis, which may in turn influence amino acid biosynthesis. Given that arginine is a key amino acid in energy metabolism, it is likely to interact with Ycf49’s function by modulating relevant metabolic pathways.
3.5. Genomic Prediction Using Whole Panel to Predict Ifself
The GP analysis conducted using the GAGBLUP (maBLUP), gBLUP, and sBLUP models yielded r-values of 0.95, 0.99, and 0.75, respectively (Figure 6). These estimates were obtained by predicting the arginine content of 290 soybean accessions, which were utilized as both the training and validation sets. The results highlight the effectiveness of genomic selection (GS) in identifying soybean accessions with high arginine content.
3.6. Genomic Prediction Using Randomly Selected SNPs for Cross-Prediction
The average r-value for GP based on randomly selected SNPs is as follows: r10 = 0.32 (range: 0.28–0.34); r100 = 0.63 (range: 0.62–0.64); r1000 = 0.60 (range: 0.58–0.62); r5000 = 0.69 (range: 0.68–0.71); r10000 = 0.76 (range: 0.75–0.77) (Table 2, Figure 7). These results indicate that the r-value increases as the number of randomly selected SNPs rises, from an average of 0.32 for the 10-SNP set to an average of 0.76 for the 10,000-SNP set. This suggests that, for GS targeting high arginine content, a random SNP set requires ≥1000 SNPs to achieve an r-value of at least 0.48.
3.7. Genomic Prediction by GWAS-derived SNP Markers
GWAS-Derived SNP Markers from the Whole Panel and Self-Prediction
GWAS-derived SNP markers were identified from a comprehensive GWAS panel consisting of 290 soybean accessions, which were used as both the training population (TP) and validation population (VP). The m10 set, comprising 10 GWAS-derived SNP markers, demonstrated higher r-values (Figure 8, Supplementary Table S4), confirming their association with the arginine content trait in the panel. However, it is anticipated that these r-values will decrease when the markers are applied for across-population predictions from one population as training to predict another population, Table 1) in cross-prediction with 5 fold for arginine content trait in 290 soybean accessions estimated by seven models: BA, BB, BL, BRR, RF, rrBLUP, and SVM.
Across all scenarios, GWAS-derived SNP markers generally produced high prediction accuracies, with average r-values around 0.87, ranging from 0.83 in the RF model to 0.88 in the BL model for all (self) cross-population predictions (Table S4, Figure 9, middle panel). For cross-population predictions, the r-values averaged 0.76, ranging from 0.75 in the BB model to 0.79 in the SVM model (Table S4, Figure 9, right panel). However, the prediction accuracy dropped substantially in across-population scenarios, with an average r-value of 0.54, ranging from 0.52 in the BRR, BA, BB, and BL models to 0.59 in the two other Bayesian models (Table S4, Figure 9, left panel). These results confirm a strong association between GWAS-derived SNP markers and arginine content in soybean and indicate that GS is effective, though less efficient across populations, for improving arginine content in soybean breeding programs.
3.8. Genomic Prediction by GAGBLUP from 80% of the Whole Panel
GP was conducted using the GAGBLUP (BLINK) (previously called maBLUP) model in GAPIT3 (Figure 10). The reference prediction (self-prediction = ‘all. Blink_Cross’) and cross-population prediction (80%TP. self_Blink_Cross’) yielded very high r-values of 0.9 and 0.88, respectively (Figure 10). The across-population (here: ‘80%TP.to.20%VP. Blink_Across’) also had high r-value of 0.63. These findings suggest that GP using only the significant SNP markers identified by GAGBLUP will be highly effective for selecting the arginine content in soybean through GS across- and cross-populations.
3.9. Genomic Prediction Using Difference Genomic Models
Seven genomic prediction (GP) models-BA, BB, BRR, BL, rrBLUP, cBLUP, and gBLUP-were employed to estimate r-values for both cross-population and across-population predictions. All seven models produced similar r-values (Table 2 and Table S4, Figure 7, 8, and 9), with several key observations: Among the nine randomly selected SNP sets, all models yielded an average r-value of 0.59 (Table S4, Figure 7); When using the 10 associated SNP markers (m10), the average r-values were 0.72, 0.72, 0.72, 0.71, 0.68, 0.75, and 0.79 for the BA, BB, BL, BRR, rrBLUP, RF, and SVM models, respectively (Table 2, Figure 8), with the SVM model yielding the highest r-value of 0.79; The SVM model also demonstrated the highest predictive accuracy (PA) for arginine content when using the GWAS-derived SNP markers (Table S4; Figure 9). These findings suggest that the SVM model is particularly effective for predicting arginine content in soybean, and it is therefore recommended for use in genomic selection (GS) for arginine content traits in soybean molecular breeding programs.
4. Discussion
4.1. Importance of Studying Arginine Content
Arginine is a conditionally essential amino acid for humans and a key component of the free and protein-bound amino acid pool in soybean seeds. It is involved not only in protein synthesis but also in nitrogen metabolism, energy metabolism, and signal transduction [31]. Enhancing arginine content in soybeans is essential for improving their nutritional quality and functionality, particularly for the feed and food industries [32]. Thus, this study aims to identify genetic loci associated with arginine content through GWAS and GP methods, providing a theoretical foundation and molecular marker resources for soybean breeding.
4.2. Research Background of the Identified Loci
This study identified two loci significantly associated with arginine content: Gm06_19014194_ss715593808 and Gm11_2054710_ss715609614. A literature review revealed that these loci have not been previously reported as being directly related to arginine content. However, the gene Glyma.06g203200, located near Gm06_19014194 _ss715593808 on chromosome 6, encodes mitochondrial ATPase (ATP synthase), which plays a crucial role in energy metabolism. Arginine metabolites may indirectly affect ATP synthase by regulating mitochondrial function, thus influencing arginine accumulation. Additionally, the gene Glyma.11G028600, located near Gm11_2054710_ ss715609614 on chromosome 11, encodes the Ycf49 protein, which may affect energy metabolism during photosynthesis. As arginine is a crucial amino acid in energy metabolism, it may interact with the function of Ycf49 by regulating related metabolic pathways.
4.3. Rationale for Selecting These Two Candidate Genes
The selection of Glyma.06g203200 and Glyma.11G028600 as candidate genes is primarily based on the following two points. First, these two genes are located within 5 kb of the significant SNP loci and are closely related to energy metabolism, which is intricately linked to amino acid synthesis and accumulation. Second, gene function annotation and literature support indicate that their functions are highly relevant to the potential regulatory mechanisms of arginine metabolism. For example, mitochondrial ATPase (ATP synthase) plays a central role in cellular energy supply, while the Ycf49 protein may indirectly affect arginine synthesis and accumulation by regulating energy metabolism during photosynthesis.
Although the Gm06_19014194_ss715593808 locus had a higher LOD value, it explained a smaller proportion of the phenotypic variation compared to Gm11_2054710_ ss715609614. This discrepancy may be due to the complex genetic architecture of arginine content, where multiple loci with smaller effects collectively contribute to the trait.
In summary, this study not only elucidates the genetic basis of arginine content but also identifies new candidate genes and molecular markers for soybean molecular breeding. Future research should further validate the functions of these genes and explore their specific regulatory mechanisms in arginine metabolism.
5. Conclusions
This study conducted a genome-wide association analysis (GWAS) on 290 soybean accessions with varying arginine content levels to investigate the genetic basis of arginine accumulation in soybean. By analyzing 33,858 SNP loci, two SNPs significantly associated with arginine content were identified: Gm06_19014194_ss715593808 and Gm11_2054710_ss715609614. Additionally, two candidate genes-Glyma.06g203200 and Glyma.11G028600-were identified, providing valuable insights into the molecular mechanisms regulating amino acid metabolism in soybean seeds.
At the genomic prediction (GP) level, the study assessed the effectiveness of various models, including rrBLUP, BA, BB, BL, and BRR. By examining the correlation coefficient (r) between genomic estimated breeding values (GEBV) and observed values, the analysis revealed that the r-value reached 0.72 when using GWAS-derived SNP markers. This was notably higher than the r-value obtained from randomly selected SNP sets, demonstrating the potential of these SNP markers in screening and breeding soybean lines with high arginine content. These findings establish a solid theoretical foundation for future soybean breeding programs aimed at enhancing arginine content.
Supplementary Materials
The following supporting information can be downloaded at: Preprints.org.
Author Contributions
J M: Writing – original draft, Writing – review & editing, data organization and analyses. Q Y: Writing – original draft, Writing – review & editing. C Y: Writing – original draft, Writing – review & editing. Z L: Writing –review & editing. X S: Writing – review & editing. X W: Writing – review & editing. R X: Writing – review & editing. P S: Writing – review & editing. A S: Writing – review & editing, data organization and analyses. P T: Writing – review & editing. L Y: Writing – review & editing. All authors have read and agreed to the published version of the manuscript.
Funding
Natural Science Foundation of Hebei Province (C2024301125); China Agriculture Research System of MOF and MARA (CARS-04-PS06), Hebei Agriculture Research System (HBCT2023040101), HAAFS Agriculture Science and Technology Innovation Project (2022KJCXZX-LYS-7), National Key R&D Program of China (2023YFD2301505).
Data Availability Statement
The original contributions presented in this study are included in the article. Further inquiries can be directed to the corresponding author.
Acknowledgments
I would like to express my heartfelt gratitude to everyone who has supported and helped me throughout this research.
Conflicts of Interest
The authors declare no conflicts of interest. The funders had no role in the design of the study; in the collection, analyses, or interpretation of data; in the writing of the manuscript; or in the decision to publish the results.
Abbreviations
The following abbreviations are used in this manuscript:
| GWAS | Genome-Wide Association Study |
| SNP | Single Nucleotide Polymorphism |
| GP | Genomic Prediction |
| GS | Genomic Selection |
| PA | Predictive Accuracy |
| BLUP | Best Linear Unbiased Prediction |
| BA | Bayesian A |
| BB | Bayesian B |
| BRR | Bayesian Ridge Regression |
| SVM | Support Vector Machine |
| LOD | Logarithm of the Odds |
References
- Ke, D.; He, Y.; Fan, L.; Niu, R.; Cheng, L.; Wang, L.; Zhang, Z. The soybean TGA transcription factor GmTGA13 plays important roles in the response to salinity stress. Plant biology (Stuttgart, Germany) 2022, 24, 313–322, The soybean TGA transcription factor GmTGA13 plays important roles in the response to salinity stress - PubMed. [Google Scholar] [CrossRef]
- Yawen, Xiong; Qianru, Jia.; Miaomiao, Zhou.; Hongmei, Zhang.; Huatao, Chen. Identification of excellent germplasm with high content of four free amino acids in soybean and GWAS analysis. Journal of Plant Genetic Resources 2024, 25, 957–966, 大豆四种游离氨基酸高含量优异种质鉴定及GWAS分析 - 中国知网.
- Winter, G.; Todd, C.D.; Trovato, M.; Forlani, G.; Funck, D. Physiological implications of arginine metabolism in plants. Frontiers in plant science 2015, 6, 534, Physiological implications of arginine metabolism in plants - PubMed. [Google Scholar] [CrossRef]
- King, J.E.; Gifford, D.J. Amino Acid Utilization in Seeds of Loblolly Pine during Germination and Early Seedling Growth (I. Arginine and Arginase Activity). Plant physiology 1997, 113, 1125–1135, Amino Acid Utilization in Seeds of Loblolly Pine during Germination and Early Seedling Growth (I. Arginine and Arginase Activity) | Plant Physiology | Oxford Academic. [Google Scholar] [CrossRef]
- Siddappa, S.; Marathe, G.K. What we know about plant arginases? Plant Physiology and Biochemistry 2020, 156, 600–610, What we know about plant arginases? - ScienceDirect. [Google Scholar] [CrossRef]
- Pál, M.; Szalai, G.; Gondor, O.K.; Janda, T. Unfinished story of polyamines: Role of conjugation, transport and light-related regulation in the polyamine metabolism in plants. Plant science : an international journal of experimental plant biology 2021, 308, 110923, Unfinished story of polyamines: Role of conjugation, transport and light-related regulation in the polyamine metabolism in plants - ScienceDirect. [Google Scholar] [CrossRef]
- Caldwell, R.W.; Rodriguez, P.C.; Toque, H.A.; Narayanan, S.P.; Caldwell, R.B. Arginase: A Multifaceted Enzyme Important in Health and Disease. Physiological reviews 2018, 98, 641–665, Arginase: A Multifaceted Enzyme Important in Health and Disease - PubMed. [Google Scholar] [CrossRef]
- Takahashi, T.; Kakehi, J.I. Polyamines: Ubiquitous polycations with unique roles in growth and stress responses. Annals of Botany 2010, 105, 1–6, Polyamines: ubiquitous polycations with unique roles in growth and stress responses | Annals of Botany | Oxford Academic. [Google Scholar] [CrossRef]
- Liebsch, D.; Juvany, M.; Li, Z.; Wang, H.L.; Ziolkowska, A.; Chrobok, D.; Boussardon, C.; Wen, X.; Law, S.R.; Janečková, H.; Brouwer, B.; Lindén, P.; Delhomme, N.; Stenlund, H.; Moritz, T.; Gardeström, P.; Guo, H.; & Keech, O.; Keech, O. Metabolic control of arginine and ornithine levels paces the progression of leaf senescence. Plant physiology 2022, 189, 1943–1960, Metabolic control of arginine and ornithine levels paces the progression of leaf senescence - PubMed. [Google Scholar] [CrossRef]
- Flores-Tinoco, C.E.; Tschan, F.; Fuhrer, T.; Margot, C.; Sauer, U.; Christen, M.; Christen, B. Co-catabolism of arginine and succinate drives symbiotic nitrogen fixation. Molecular systems biology 2020, 16, e9419, Co-catabolism of arginine and succinate drives symbiotic nitrogen fixation - PubMed. [Google Scholar] [CrossRef]
- Qin, J.; Shi, A.; Song, Q.; Li, S.; Wang, F.; Cao, Y.; Ravelombola, W.; Song, Q.; Yang, C.; Zhang, M. Genome Wide Association Study and Genomic Selection of Amino Acid Concentrations in Soybean Seeds. Frontiers in plant science 2019, 10, 1445, Genome Wide Association Study and Genomic Selection of Amino Acid Contents in Soybean Seeds - PubMed. [Google Scholar] [CrossRef] [PubMed]
- Fallen, B.; Hatcher, C.; Allen, F.; Kopsell, D.; Saxton, A.; Chen, P.; Kantartzi, S.; Cregan, P.; Hyten, D.; Pantalone, V. Soybean Seed Amino Acid Content QTL Detected Using the Universal Soy Linkage Panel 1.0 with 1,536 SNPs. Plant Genetics, Genomics, and Biotechnology. Soybean Seed Amino Acid Content QTL Detected Using the Universal Soy Linkage Panel 1.0 with 1,536 SNPs | Semantic Scholar. 2013. [Google Scholar]
- Warrington, C.V.; Abdel-Haleem, H.; Hyten, D.L.; Cregan, P.B.; Orf, J.H.; Killam, A.S.; Bajjalieh, N.; Li, Z.; & Boerma, H.R.; Boerma, H. R. QTL for seed protein and amino acids in the Benning × Danbaekkong soybean population. TAG. Theoretical and applied genetics. Theoretische und angewandte Genetik 2015, 128, 839–850, QTL for seed protein and amino acids in the Benning × Danbaekkong soybean population - PubMed. [Google Scholar] [CrossRef]
- Ravelombola, W.; Qin, J.; Shi, A.; Song, Q.; Yuan, J.; Wang, F.; Chen, P.; Yan, L.; Feng, Y.; Zhao, T.; Meng, Y.; Guan, K.; Yang, C.; & Zhang, M.; Zhang, M. Genome-wide association study and genomic selection for yield and related traits in soybean. PloS one 2021, 16, e0255761, Genome-wide association study and genomic selection for yield and related traits in soybean | PLOS One. [Google Scholar] [CrossRef]
- Yang, J.; Benyamin, B.; McEvoy, B.P.; Gordon, S.; Henders, A.K.; Nyholt, D.R.; Madden, P.A.; Heath, A.C.; Martin, N.G.; Montgomery, G.W.; Goddard, M.E.; Visscher, P.M. Common SNPs explain a large proportion of the heritability for human height. Nature genetics 2010, 42, 565–569, Common SNPs explain a large proportion of the heritability for human height | Nature Genetics. [Google Scholar] [CrossRef] [PubMed]
- Goddard, M.E.; Hayes, B.J.; & Meuwissen, T.H.; Meuwissen, T. H. Using the genomic relationship matrix to predict the accuracy of genomic selection. Journal of animal breeding and genetics = Zeitschrift fur Tierzuchtung und Zuchtungsbiologie 2011, 128, 409–421, Using the genomic relationship matrix to predict the accuracy of genomic selection - PubMed. [Google Scholar] [CrossRef]
- Zhang, J.; Song, Q.; Cregan, P.B.; Jiang, G.L. Genome-wide association study, genomic prediction and marker-assisted selection for seed weight in soybean (Glycine max). TAG. Theoretical and applied genetics. Theoretische und angewandte Genetik 2016, 129, 117–130, Genome-wide association study, genomic prediction and marker-assisted selection for seed weight in soybean (Glycine max) - PubMed. [Google Scholar] [CrossRef] [PubMed]
- Spindel, J.; Begum, H.; Akdemir, D.; Virk, P.; Collard, B.; Redoña, E.; Atlin, G.; Jannink, J.L.; McCouch, S.R. Correction: Genomic Selection and Association Mapping in Rice (Oryza sativa): Effect of Trait Genetic Architecture, Training Population Composition, Marker Number and Statistical Model on Accuracy of Rice Genomic Selection in Elite, Tropical Rice Breeding Lines. PLoS genetics 2015, 11, e1005350, Genomic Selection and Association Mapping in Rice (Oryza sativa): Effect of Trait Genetic Architecture, Training Population Composition, Marker Number and Statistical Model on Accuracy of Rice Genomic Selection in Elite, Tropical Rice Breeding Lines | PLOS Genetics. [Google Scholar]
- Crossa, J.; Pérez-Rodríguez, P.; Cuevas, J.; Montesinos-López, O.; Jarquín, D.; de Los Campos, G.; Burgueño, J.; González-Camacho, J.M.; Pérez-Elizalde, S.; Beyene, Y.; Dreisigacker, S.; Singh, R.; Zhang, X.; Gowda, M.; Roorkiwal, M.; Rutkoski, J.; Varshney, R.K. Genomic Selection in Plant Breeding: Methods, Models, and Perspectives. Trends in plant science 2017, 22, 961–975, Genomic Selection in Plant Breeding: Methods, Models, and Perspectives - PubMed. [Google Scholar] [CrossRef]
- Phung, N.T.; Mai, C.D.; Hoang, G.T.; Truong, H.T.; Lavarenne, J.; Gonin, M.; Nguyen, K.L.; Ha, T.T.; Do, V.N.; Gantet, P.; Courtois, B. Genome-wide association mapping for root traits in a panel of rice accessions from Vietnam. BMC plant biology 2016, 16, 64, Genome-wide association mapping for root traits in a panel of rice accessions from Vietnam | BMC Plant Biology | Full Text. [Google Scholar] [CrossRef]
- Song, Q.; Hyten, D.L.; Jia, G.; Quigley, C.V.; Fickus, E.W.; Nelson, R.L.; Cregan, P.B. Development and evaluation of SoySNP50K, a high-density genotyping array for soybean. PloS one 2013, 8, e54985, Development and Evaluation of SoySNP50K, a High-Density Genotyping Array for Soybean | PLOS One. [Google Scholar] [CrossRef]
- Song, Q.; Hyten, D.L.; Jia, G.; Quigley, C.V.; Fickus, E.W.; Nelson, R.L.; Cregan, P.B. Fingerprinting Soybean Germplasm and Its Utility in Genomic Research. G3 (Bethesda, Md.) 2015, 5, 1999–2006, "Fingerprinting soybean accessions and its utility in genomic research" by Qijian Song, D. L. Hyten et al.. [Google Scholar] [CrossRef]
- Wang, J. , Zhang, Z. GAPIT Version 3: Boosting Power and Accuracy for Genomic Association and Prediction. Genomics Proteomics Bioinformatics 2021, 19, 629–640, GAPIT Version 3: Boosting Power and Accuracy for Genomic Association and Prediction - PubMed. [Google Scholar] [CrossRef]
- Shi, A.; Gepts, P.; Song, Q.; Xiong, H.; Michaels, T.E.; Chen, S. Genome-Wide Association Study and Genomic Prediction for Soybean Cyst Nematode Resistance in USDA Common Bean (Phaseolus vulgaris) Core Collection. Frontiers in plant science 2021, 12, 624156, Genome-Wide Association Study and Genomic Prediction for Soybean Cyst Nematode Resistance in USDA Common Bean (Phaseolus vulgaris) Core Collection - PubMed. [Google Scholar] [CrossRef]
- Zhang, X.; Sallam, A.; Gao, L.; Kantarski, T.; Poland, J.; DeHaan, L.R.; Wyse, D.L.; & Anderson, J.A.; Anderson, J. A. Establishment and Optimization of Genomic Selection to Accelerate the Domestication and Improvement of Intermediate Wheatgrass. The plant genome 2016, 9. 10.3835/plantgenome2015.07.0059. Establishment and Optimization of Genomic Selection to Accelerate the Domestication and Improvement of Intermediate Wheatgrass - PubMed. [Google Scholar] [CrossRef]
- Meher, P.K.; Rustgi, S.; Kumar, A. Performance of Bayesian and BLUP alphabets for genomic prediction: analysis, comparison and results. Heredity 2022, 128, 519–530, Performance of Bayesian and BLUP alphabets for genomic prediction: analysis, comparison and results - PMC. [Google Scholar] [CrossRef]
- Pérez, P.; de los Campos, G. Genome-wide regression and prediction with the BGLR statistical package. Genetics 2014, 198, 483–495, Genome-wide regression and prediction with the BGLR statistical package - PubMed. [Google Scholar] [CrossRef]
- Jarquín, D.; Kocak, K.; Posadas, L.; Hyma, K.; Jedlicka, J.; Graef, G.; Lorenz, A. Genotyping by sequencing for genomic prediction in a soybean breeding population. BMC genomics 2014, 15, 740, Genotyping by sequencing for genomic prediction in a soybean breeding population | BMC Genomics | Full Text. [Google Scholar] [CrossRef]
- Krishnappa, G.; Savadi, S.; Tyagi, B.S.; Singh, S.K.; Mamrutha, H.M.; Kumar, S.; Mishra, C.N.; Khan, H.; Gangadhara, K.; Uday, G.; Singh, G.; & Singh, G.P.; Singh, G. P. Integrated genomic selection for rapid improvement of crops. Genomics 2021, 113, 1070–1086, Integrated genomic selection for rapid improvement of crops - ScienceDirect. [Google Scholar] [CrossRef]
- Shiyu, Qu.; Sheng, Lu.; Yang, Liu. ; Ming, Li.; Songlin, Chen. Accurate genomic selection using low-density SNP panels preselected by maximum likelihood estimation. Aquaculture 2024, 579, 740154, Accurate genomic selection using low-density SNP panels preselected by maximum likelihood estimation - ScienceDirect. [Google Scholar]
- Funck, D.; Eckard, S.; Müller, G. Non-redundant functions of two proline dehydrogenase isoforms in Arabidopsis. BMC plant biology 2010, 10, 70, Non-redundant functions of two proline dehydrogenase isoforms in Arabidopsis - PubMed. [Google Scholar] [CrossRef] [PubMed]
- Wu, G.; Bazer, F.W.; Davis, T.A.; Kim, S.W.; Li, P.; Marc Rhoads, J.; Carey Satterfield, M.; Smith, S.B.; Spencer, T.E.; Yin, Y. Arginine metabolism and nutrition in growth, health and disease. Amino acids 2009, 37, 153–168, Arginine metabolism and nutrition in growth, health and disease - PubMed. [Google Scholar] [CrossRef]
Figure 1.
The distribution arginine content reaction in 290 soybean accessions.
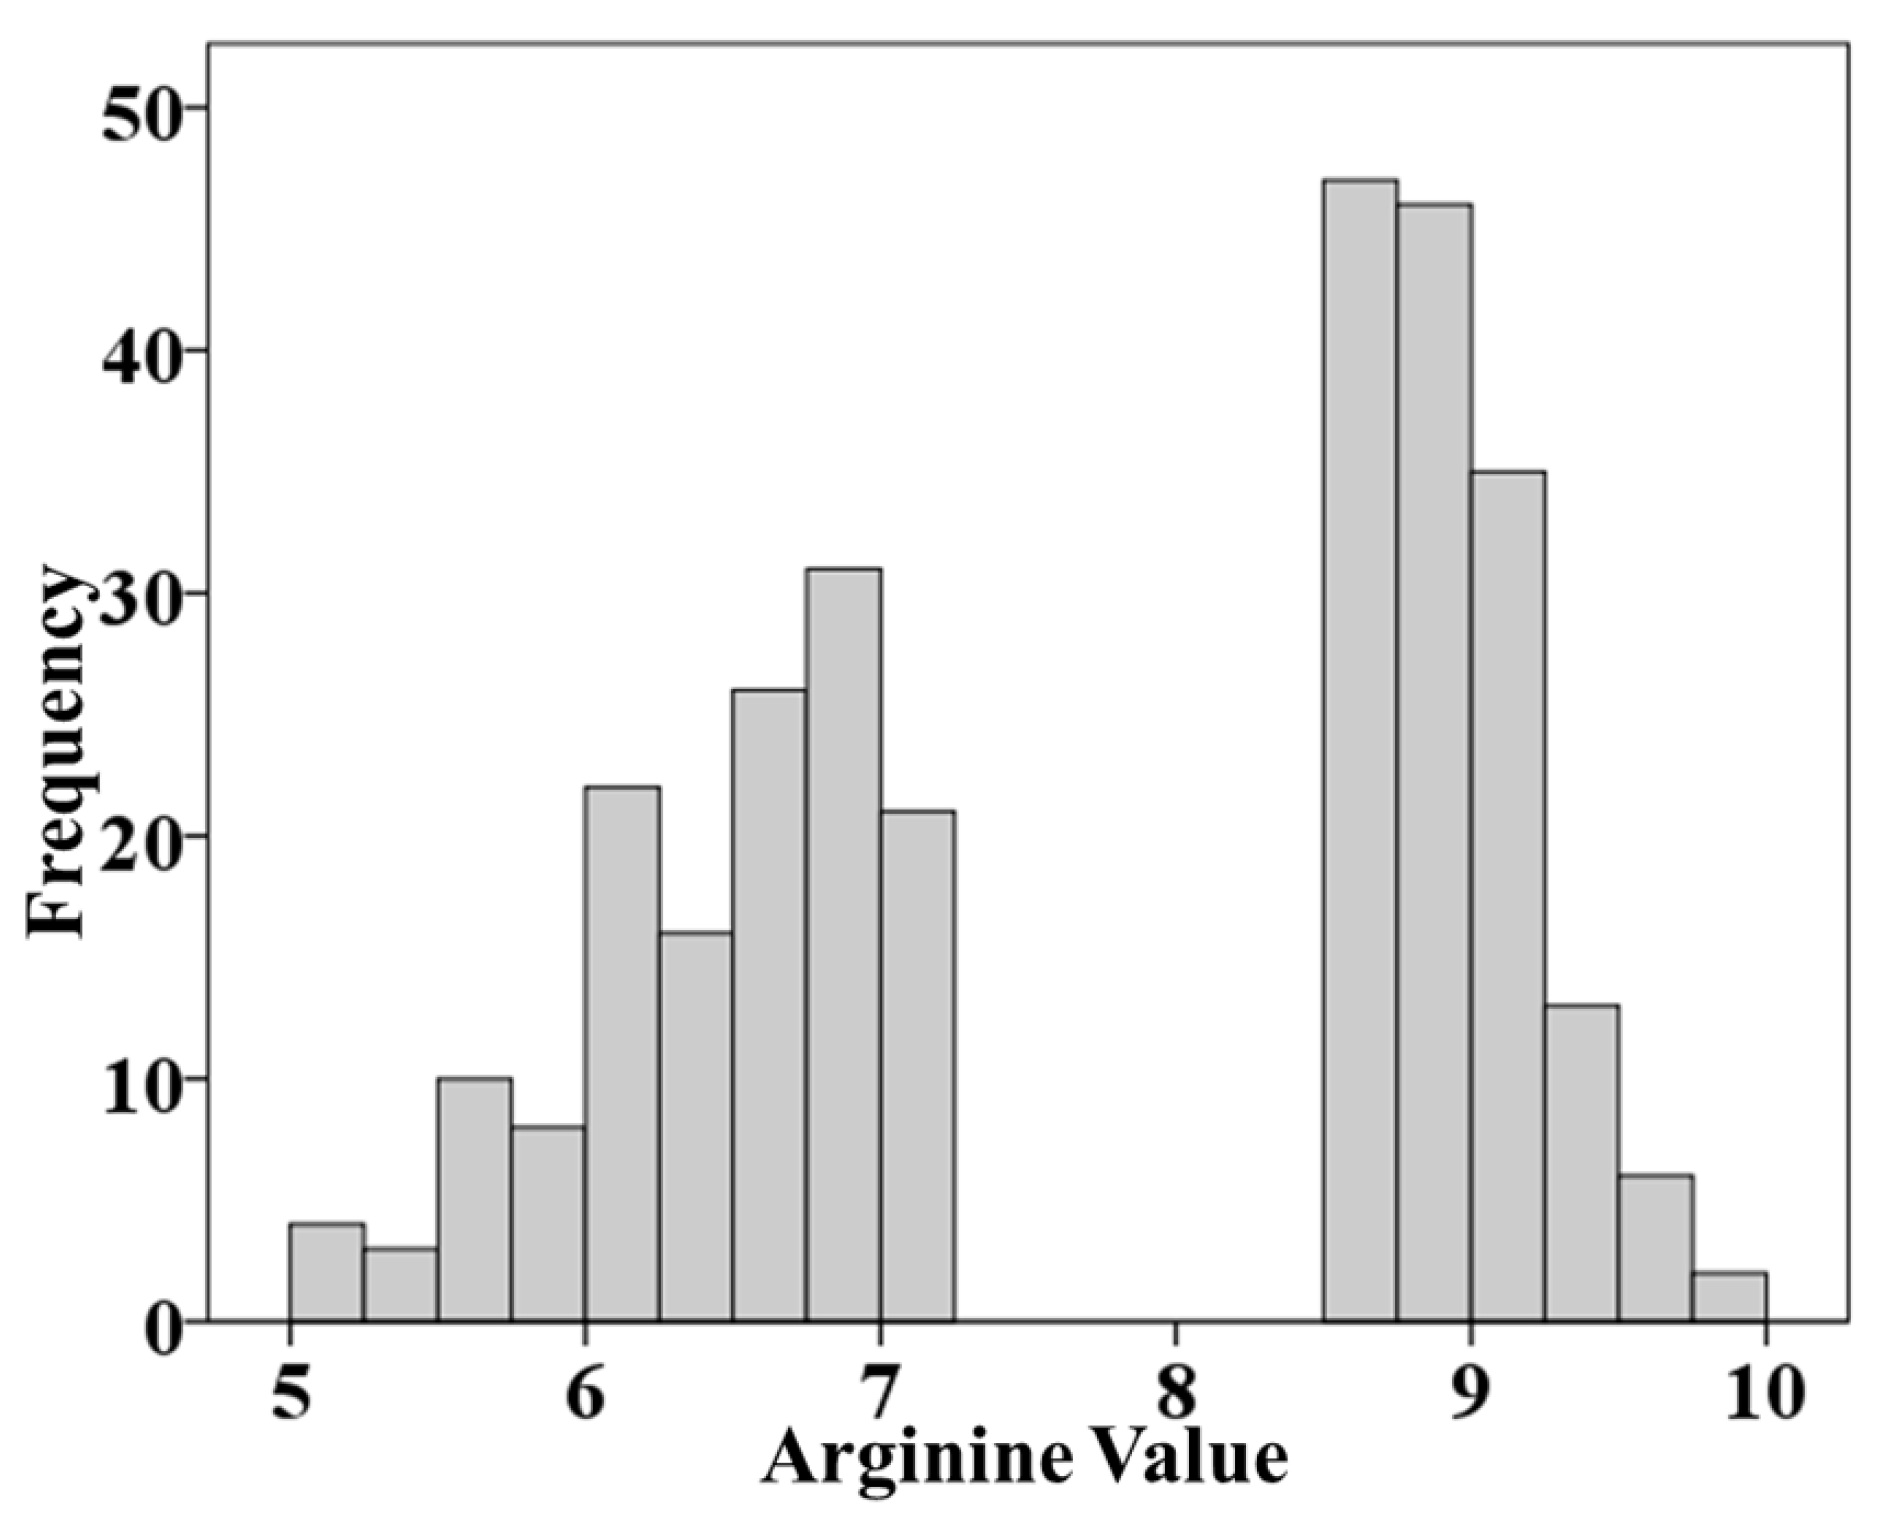
Figure 2.
Genetic diversity analysis of an association panel composed of 290 soybean accessions from the USDA: (A) Three-dimensional plot of Principal Component Analysis (PCA). (B) PCA eigenvalue plot. (C) Neighbor-joining (NJ) phylogenetic tree constructed using GAPIT3 software, depicting two subgroups (Q1, Q2). (D) Kinship analysis.
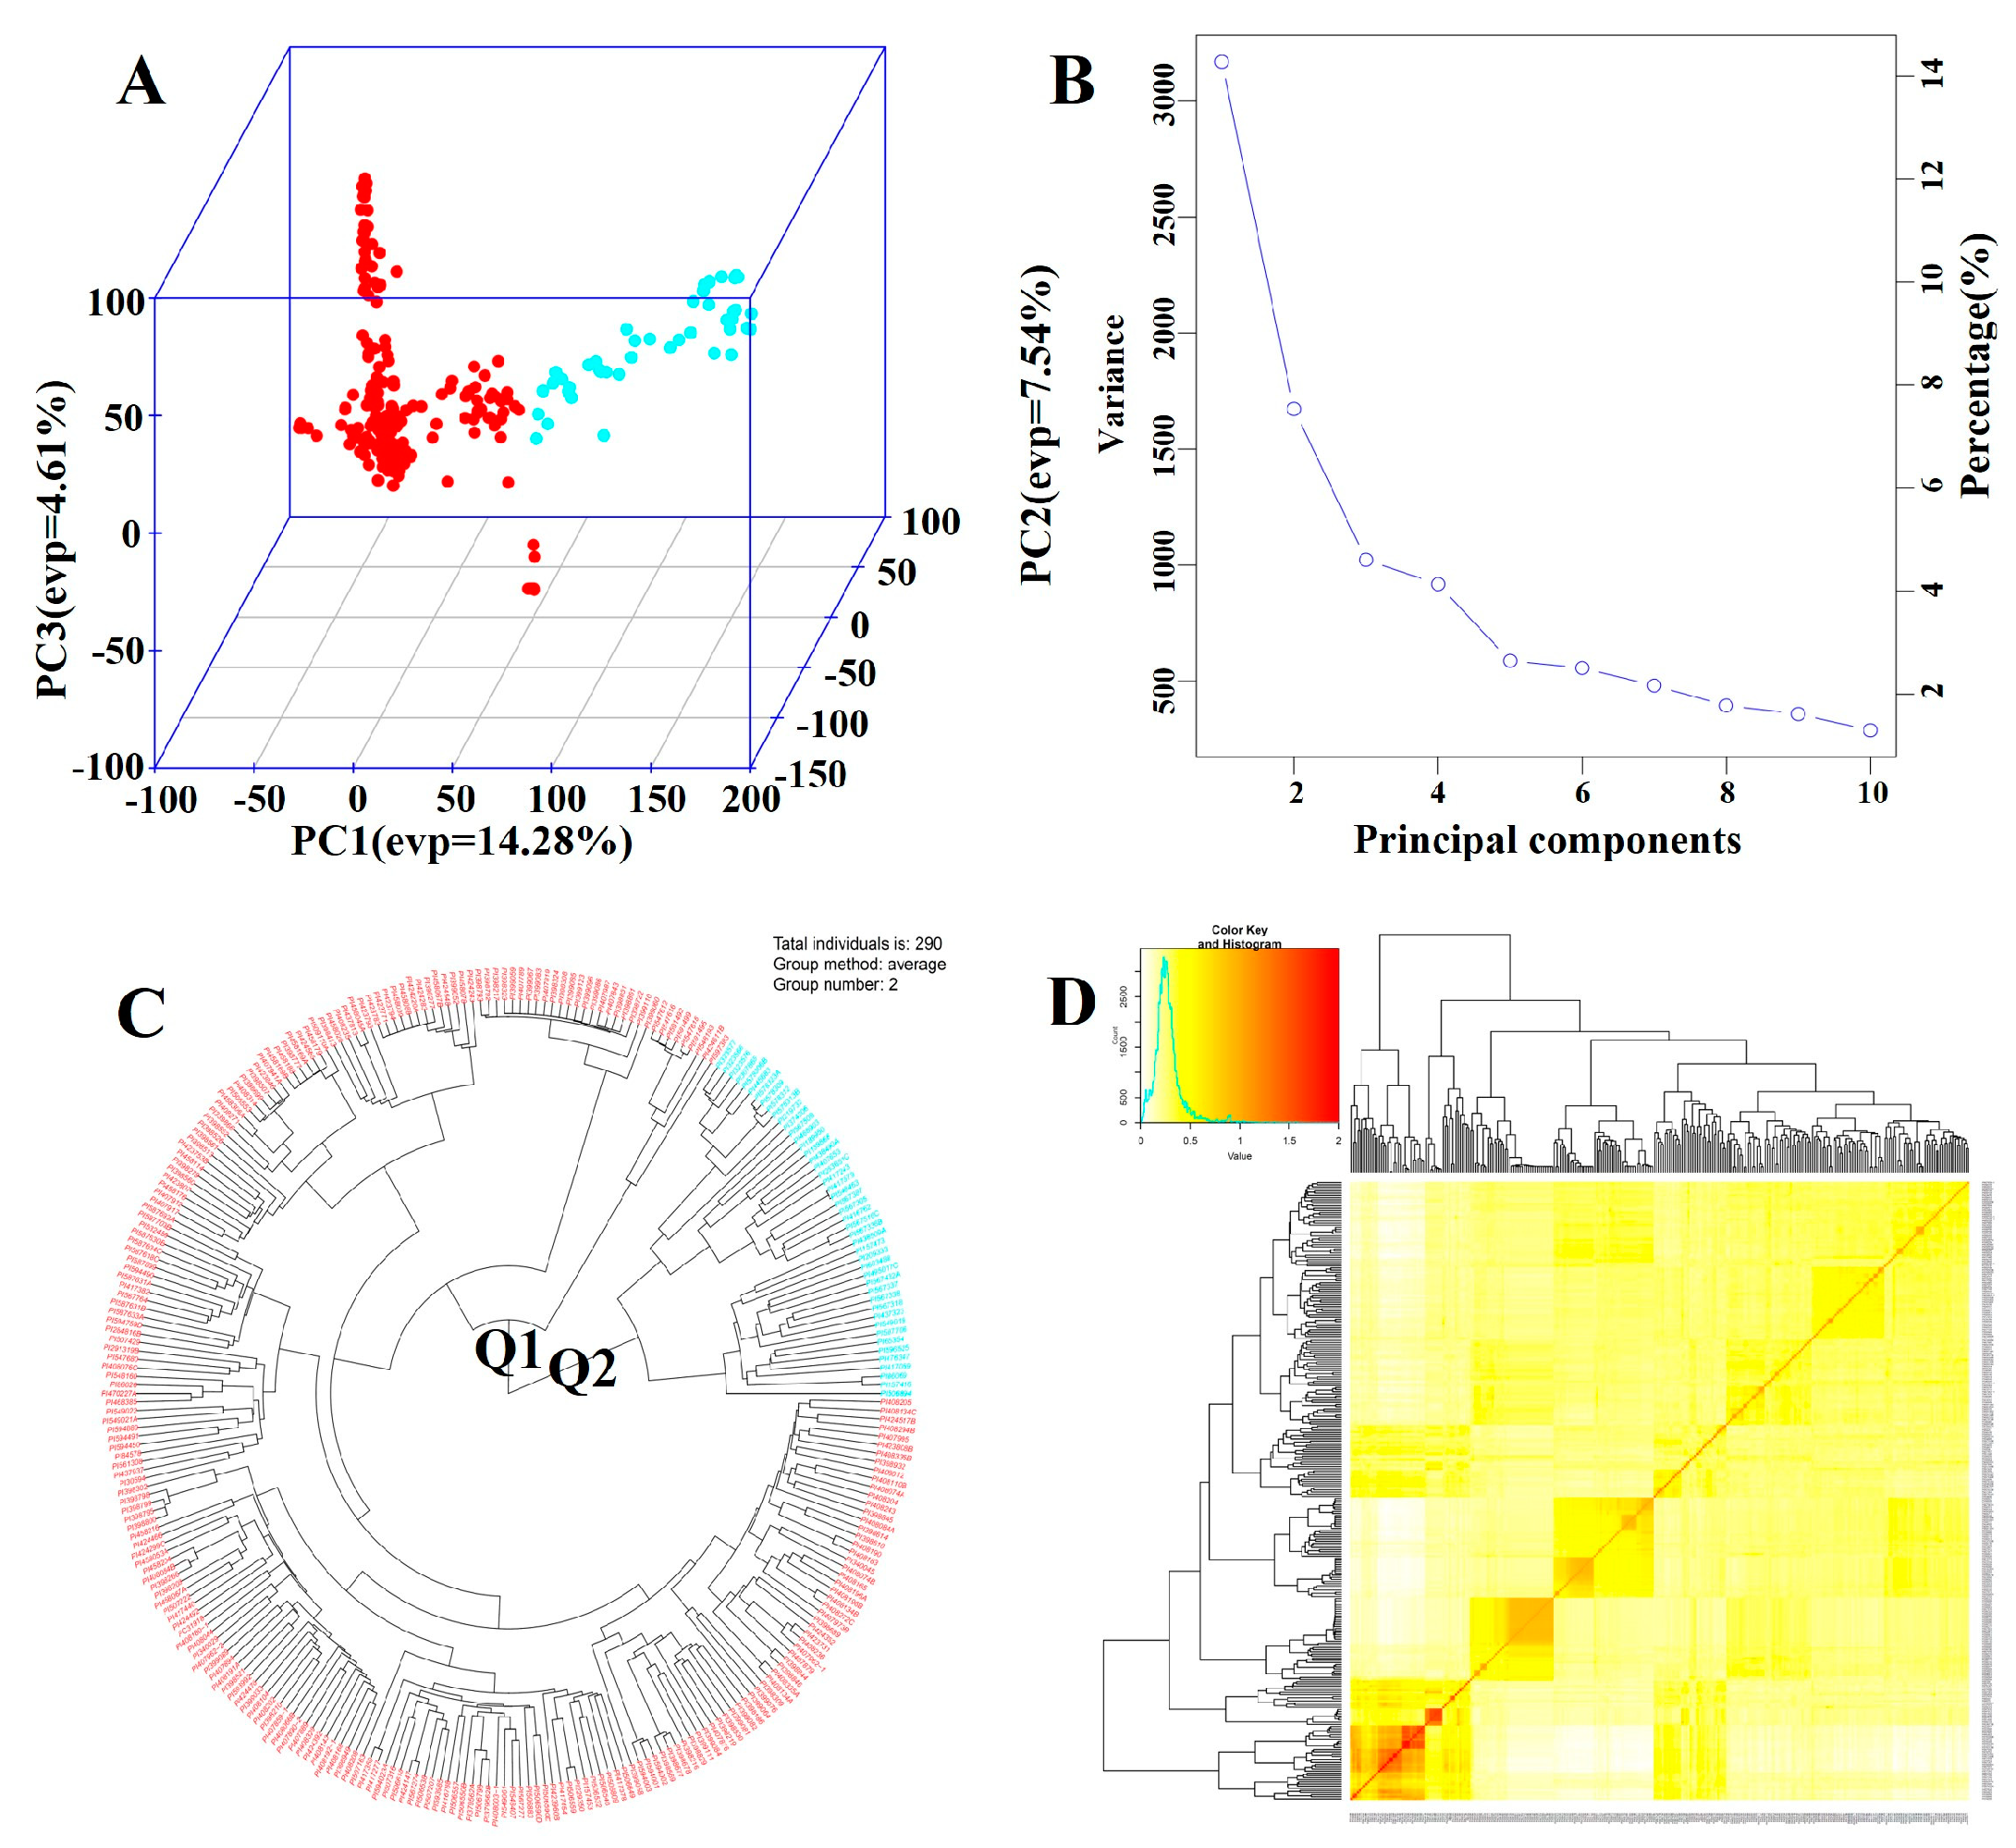
Figure 3.
The Manhattan plots of GWAS results for soybean arginine content in 290 accessions. based on the MLM, BLINK, FarmCPU, and MLMM models using GAPIT3. In the Manhattan plots, the x-axis represents soybean chromosomes, and the y-axis represents the LOD [−log(p-value)] values.
Figure 3.
The Manhattan plots of GWAS results for soybean arginine content in 290 accessions. based on the MLM, BLINK, FarmCPU, and MLMM models using GAPIT3. In the Manhattan plots, the x-axis represents soybean chromosomes, and the y-axis represents the LOD [−log(p-value)] values.
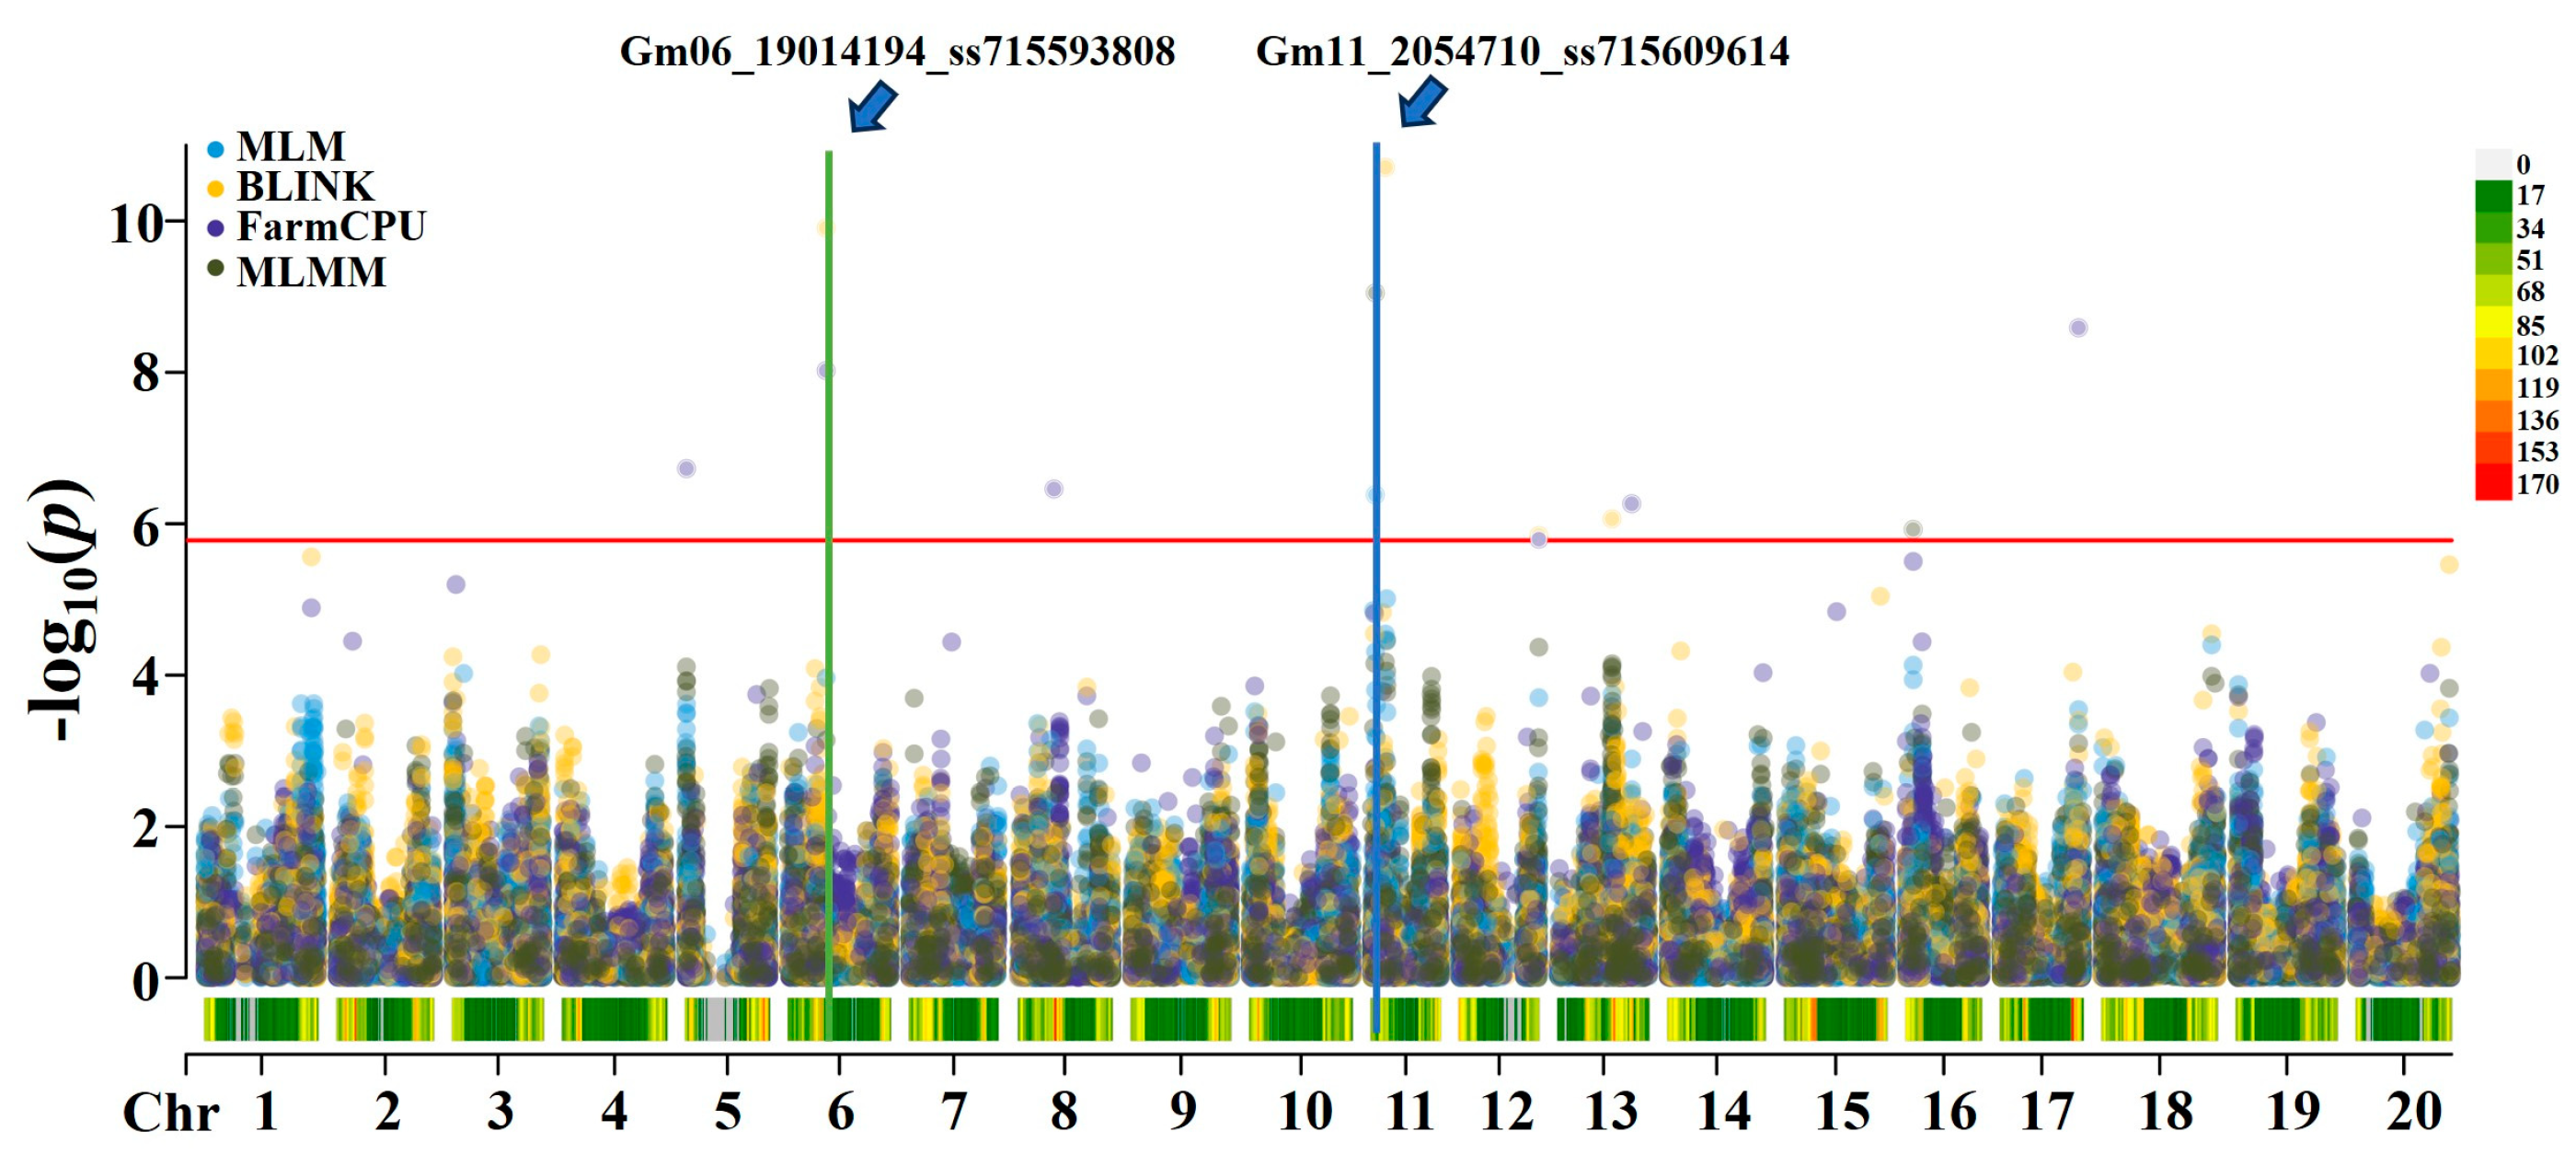
Figure 4.
The QQ plots (left) and Manhattan plots (right) of GWAS results for arginine content in 290 accessions. based on the MLM (A) Mixed Linear Model, BLINK (B) Bayesian-information and Linkage-disequilibrium Iteratively Nested Keyway, FarmCPU (C) Fixed and Random Model Circulating Probability Unification, and MLMM(D) Multi-Locus Mixed Model using GAPIT3. In the QQ plot (left), the x-axis represents the observed LOD [−log(p-value)] values, and the y-axis represents the expected LOD [−log(p-value)] values. In the Manhattan plot (right), the x-axis represents soybean chromosomes, and the y-axis represents the LOD [−log(p-value)] values.
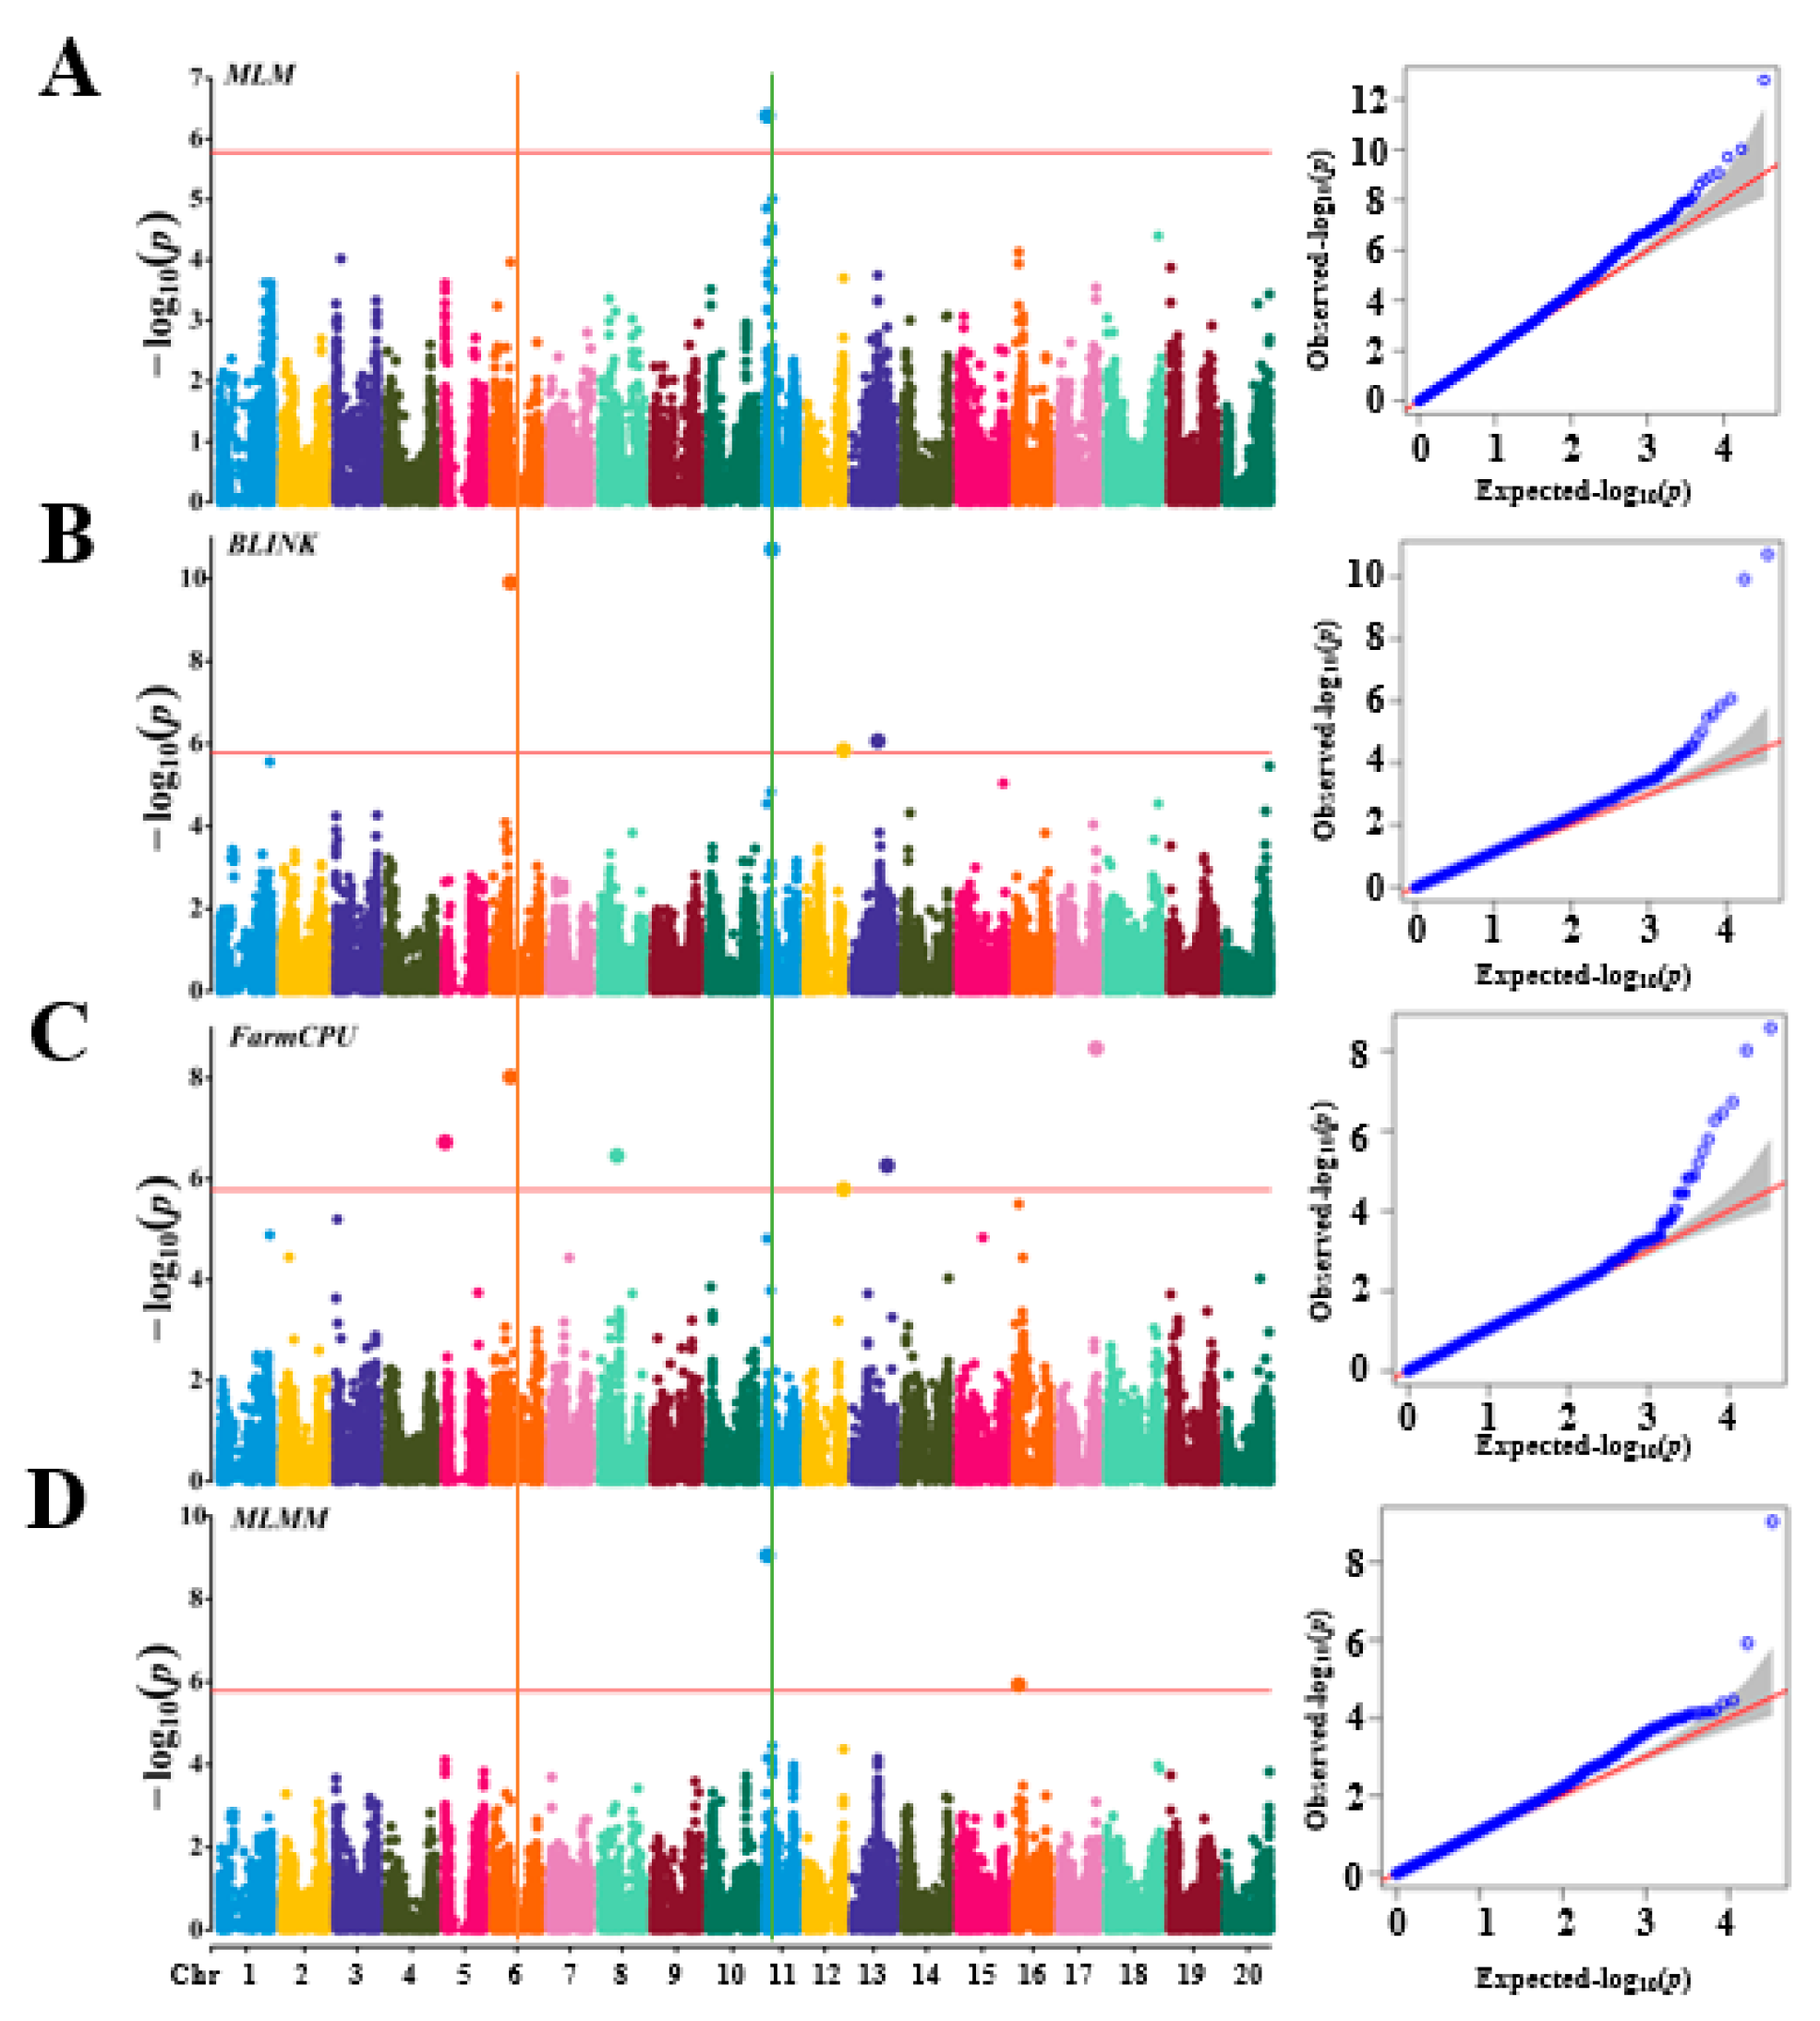
Figure 5.
Haplotype analysis of loci Gm06_19014194_ss715593808 (A) and Gm11_2054710 _ss715609614 (B) based on 290 soybean accessions from the USDA.
Figure 5.
Haplotype analysis of loci Gm06_19014194_ss715593808 (A) and Gm11_2054710 _ss715609614 (B) based on 290 soybean accessions from the USDA.
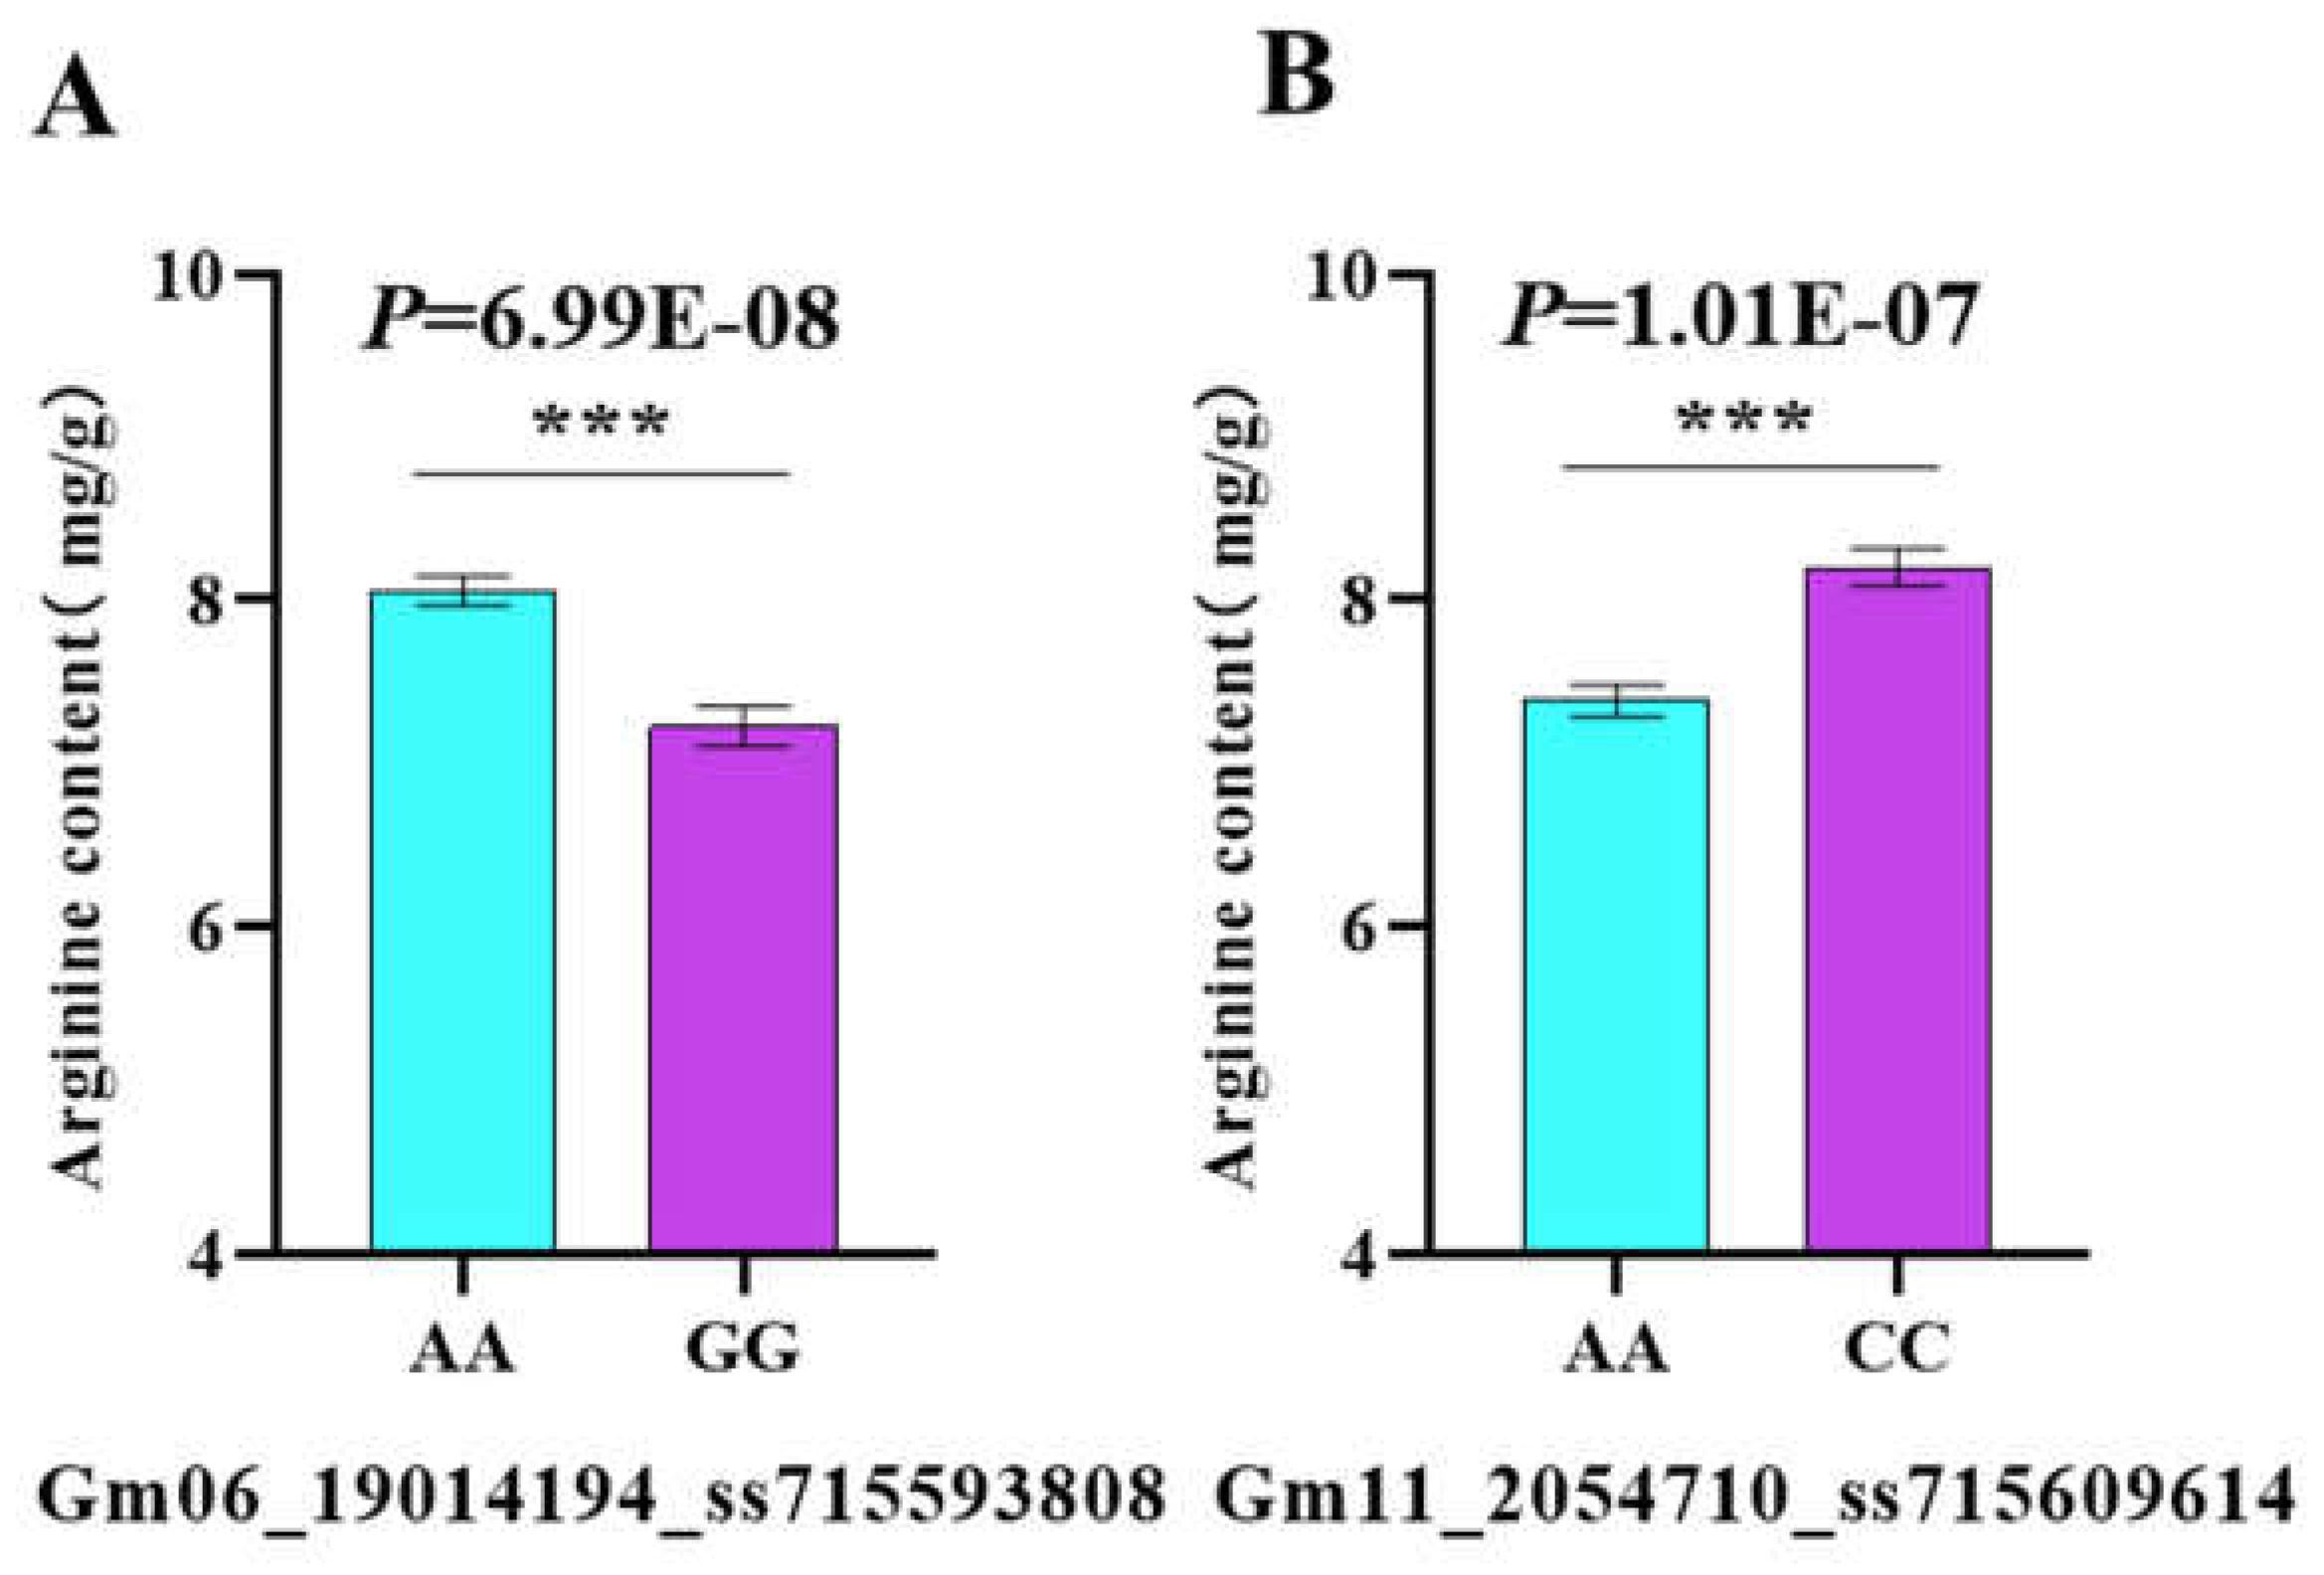
Figure 6.
The GP model r-values for the training set of arginine content in 290 soybean accessions were analyzed using 33,858 SNPs. Predictions were performed using three models: maBLUP (= GAGBLUP (GWAS-assisted genome BLUP, previously known as maBLUP), gBLUP (Genomic Best Linear Unbiased Prediction), and sBLUP (SUPER gBLUP) in GAPIT3.
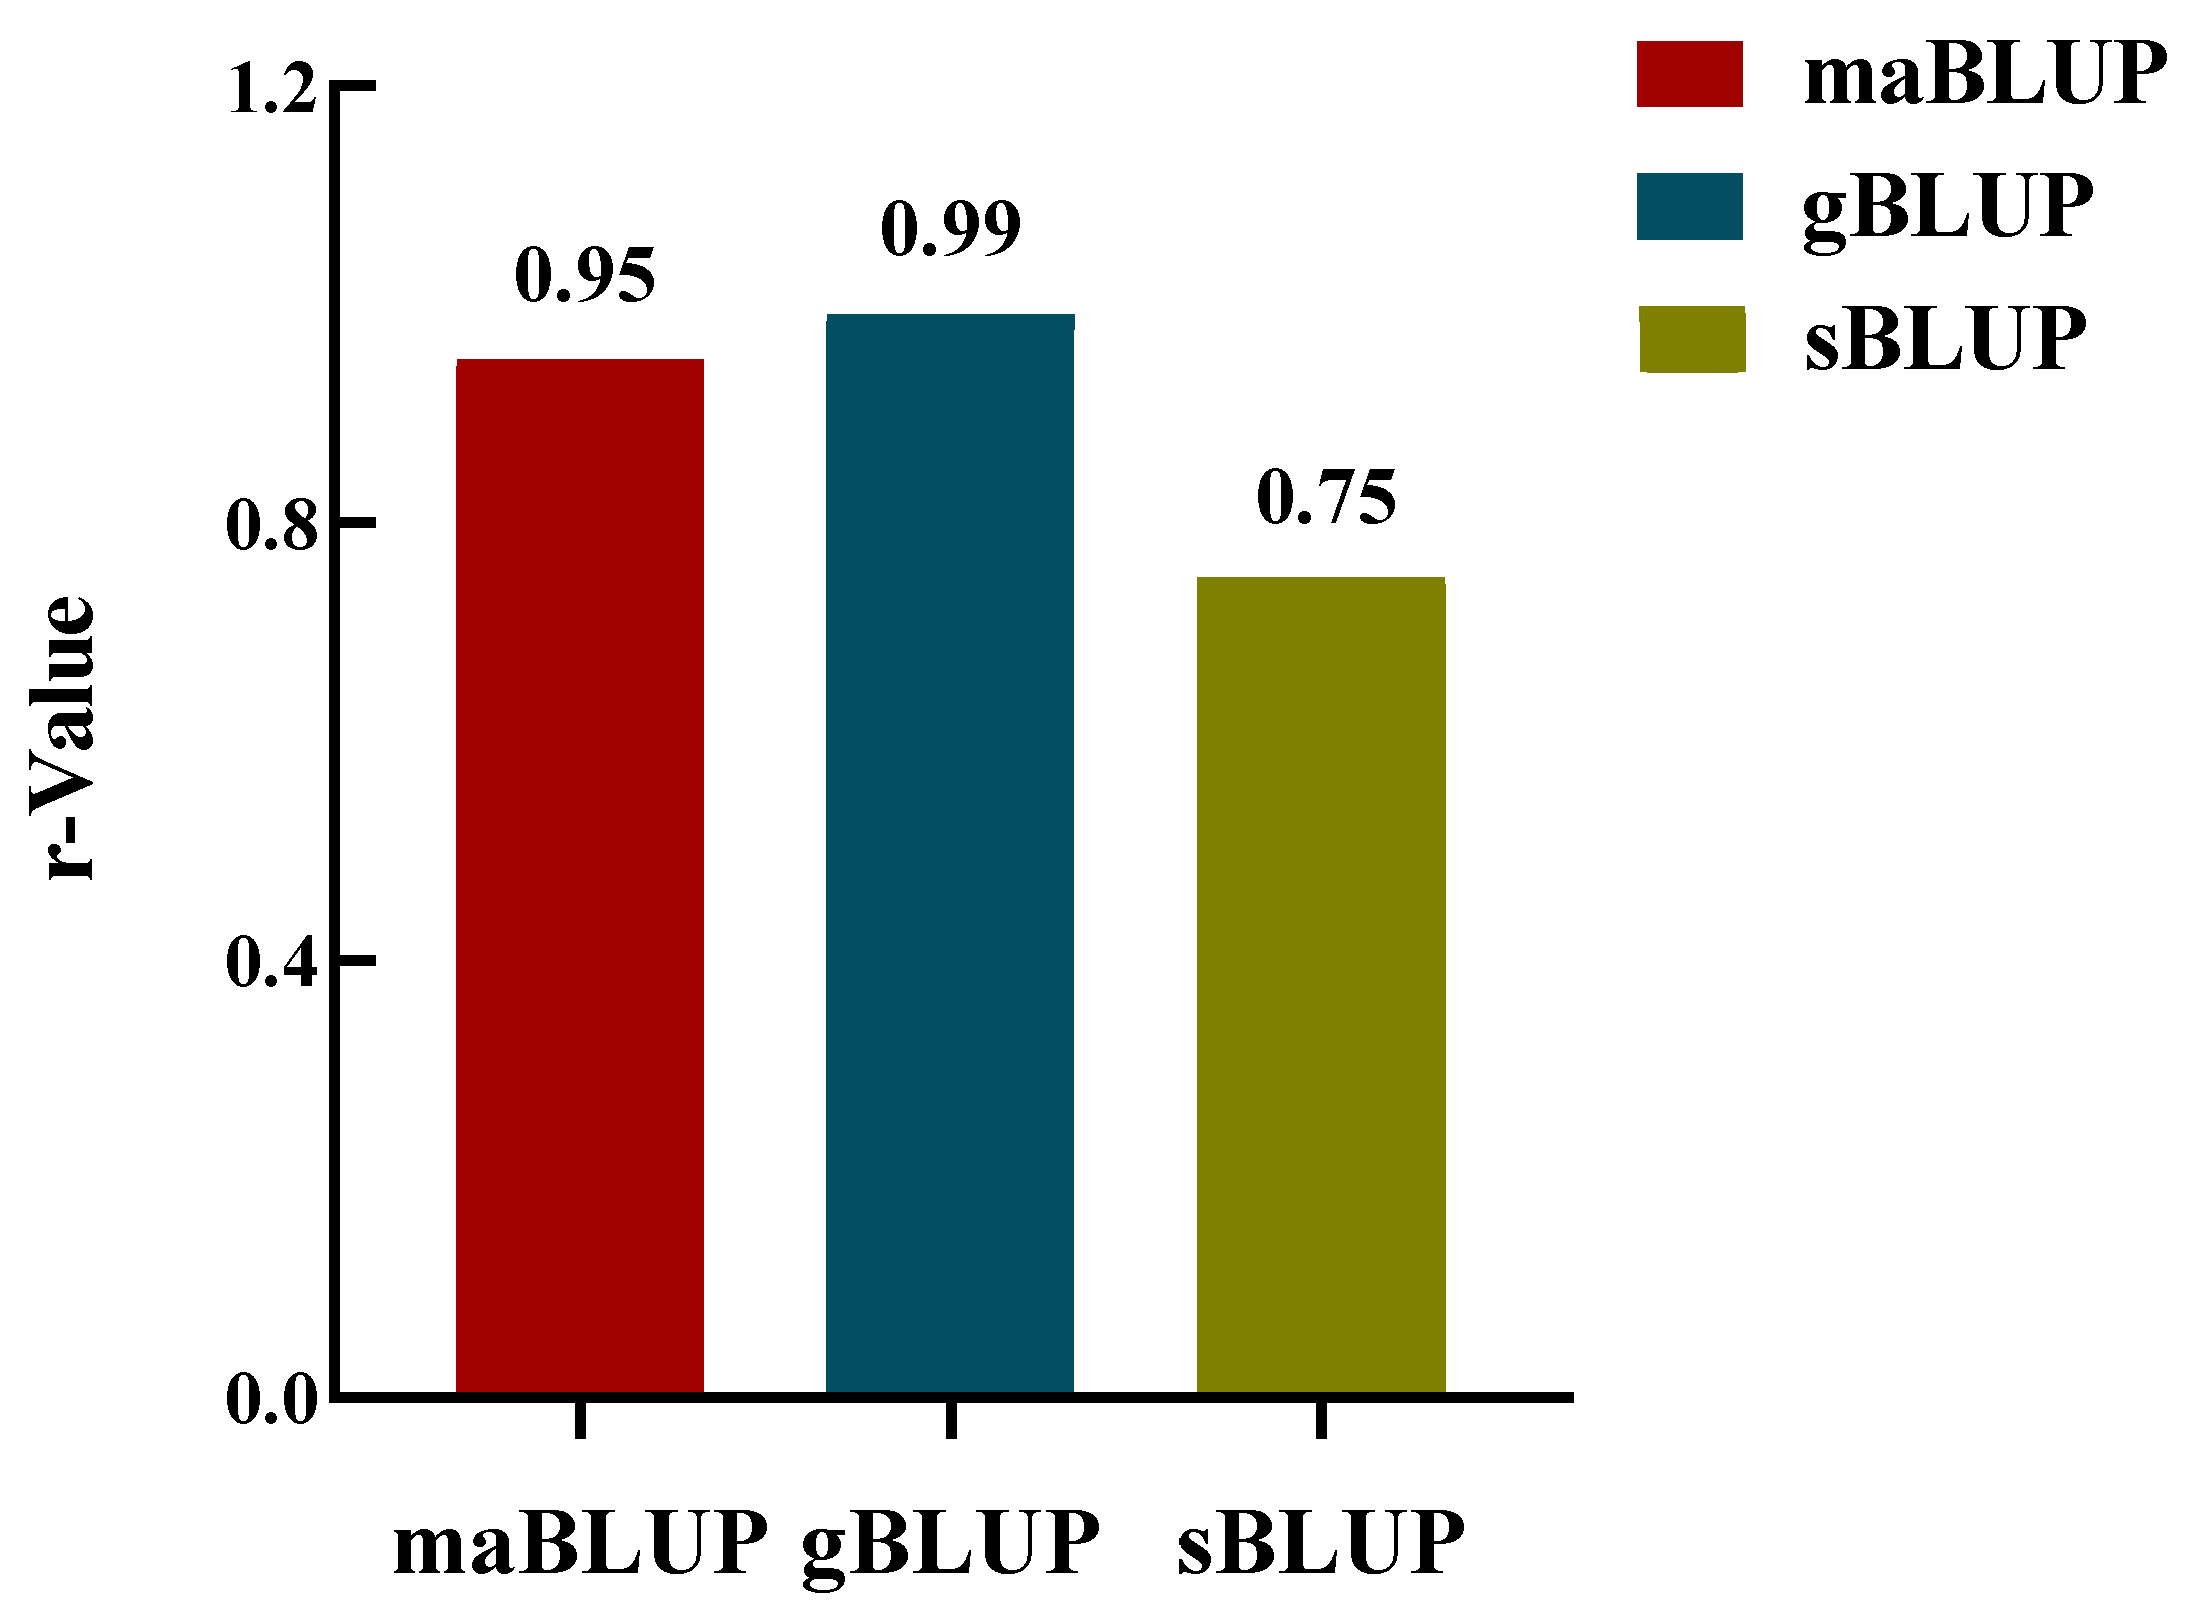
Figure 7.
The GP model r-values for arginine content using 9 SNP sets: 8 random SNP sets ranging from 10 to 10,000 SNPs, plus the ten GWAS-derived significant SNP marker set (m10). Predictions were performed using five genomic prediction (GP) models: BA (Bayesian A), BB (Bayesian B), BL (Bayesian LASSO), BRR (Bayesian Ridge Regression), and rrBLUP (Ridge Regression BLUP).
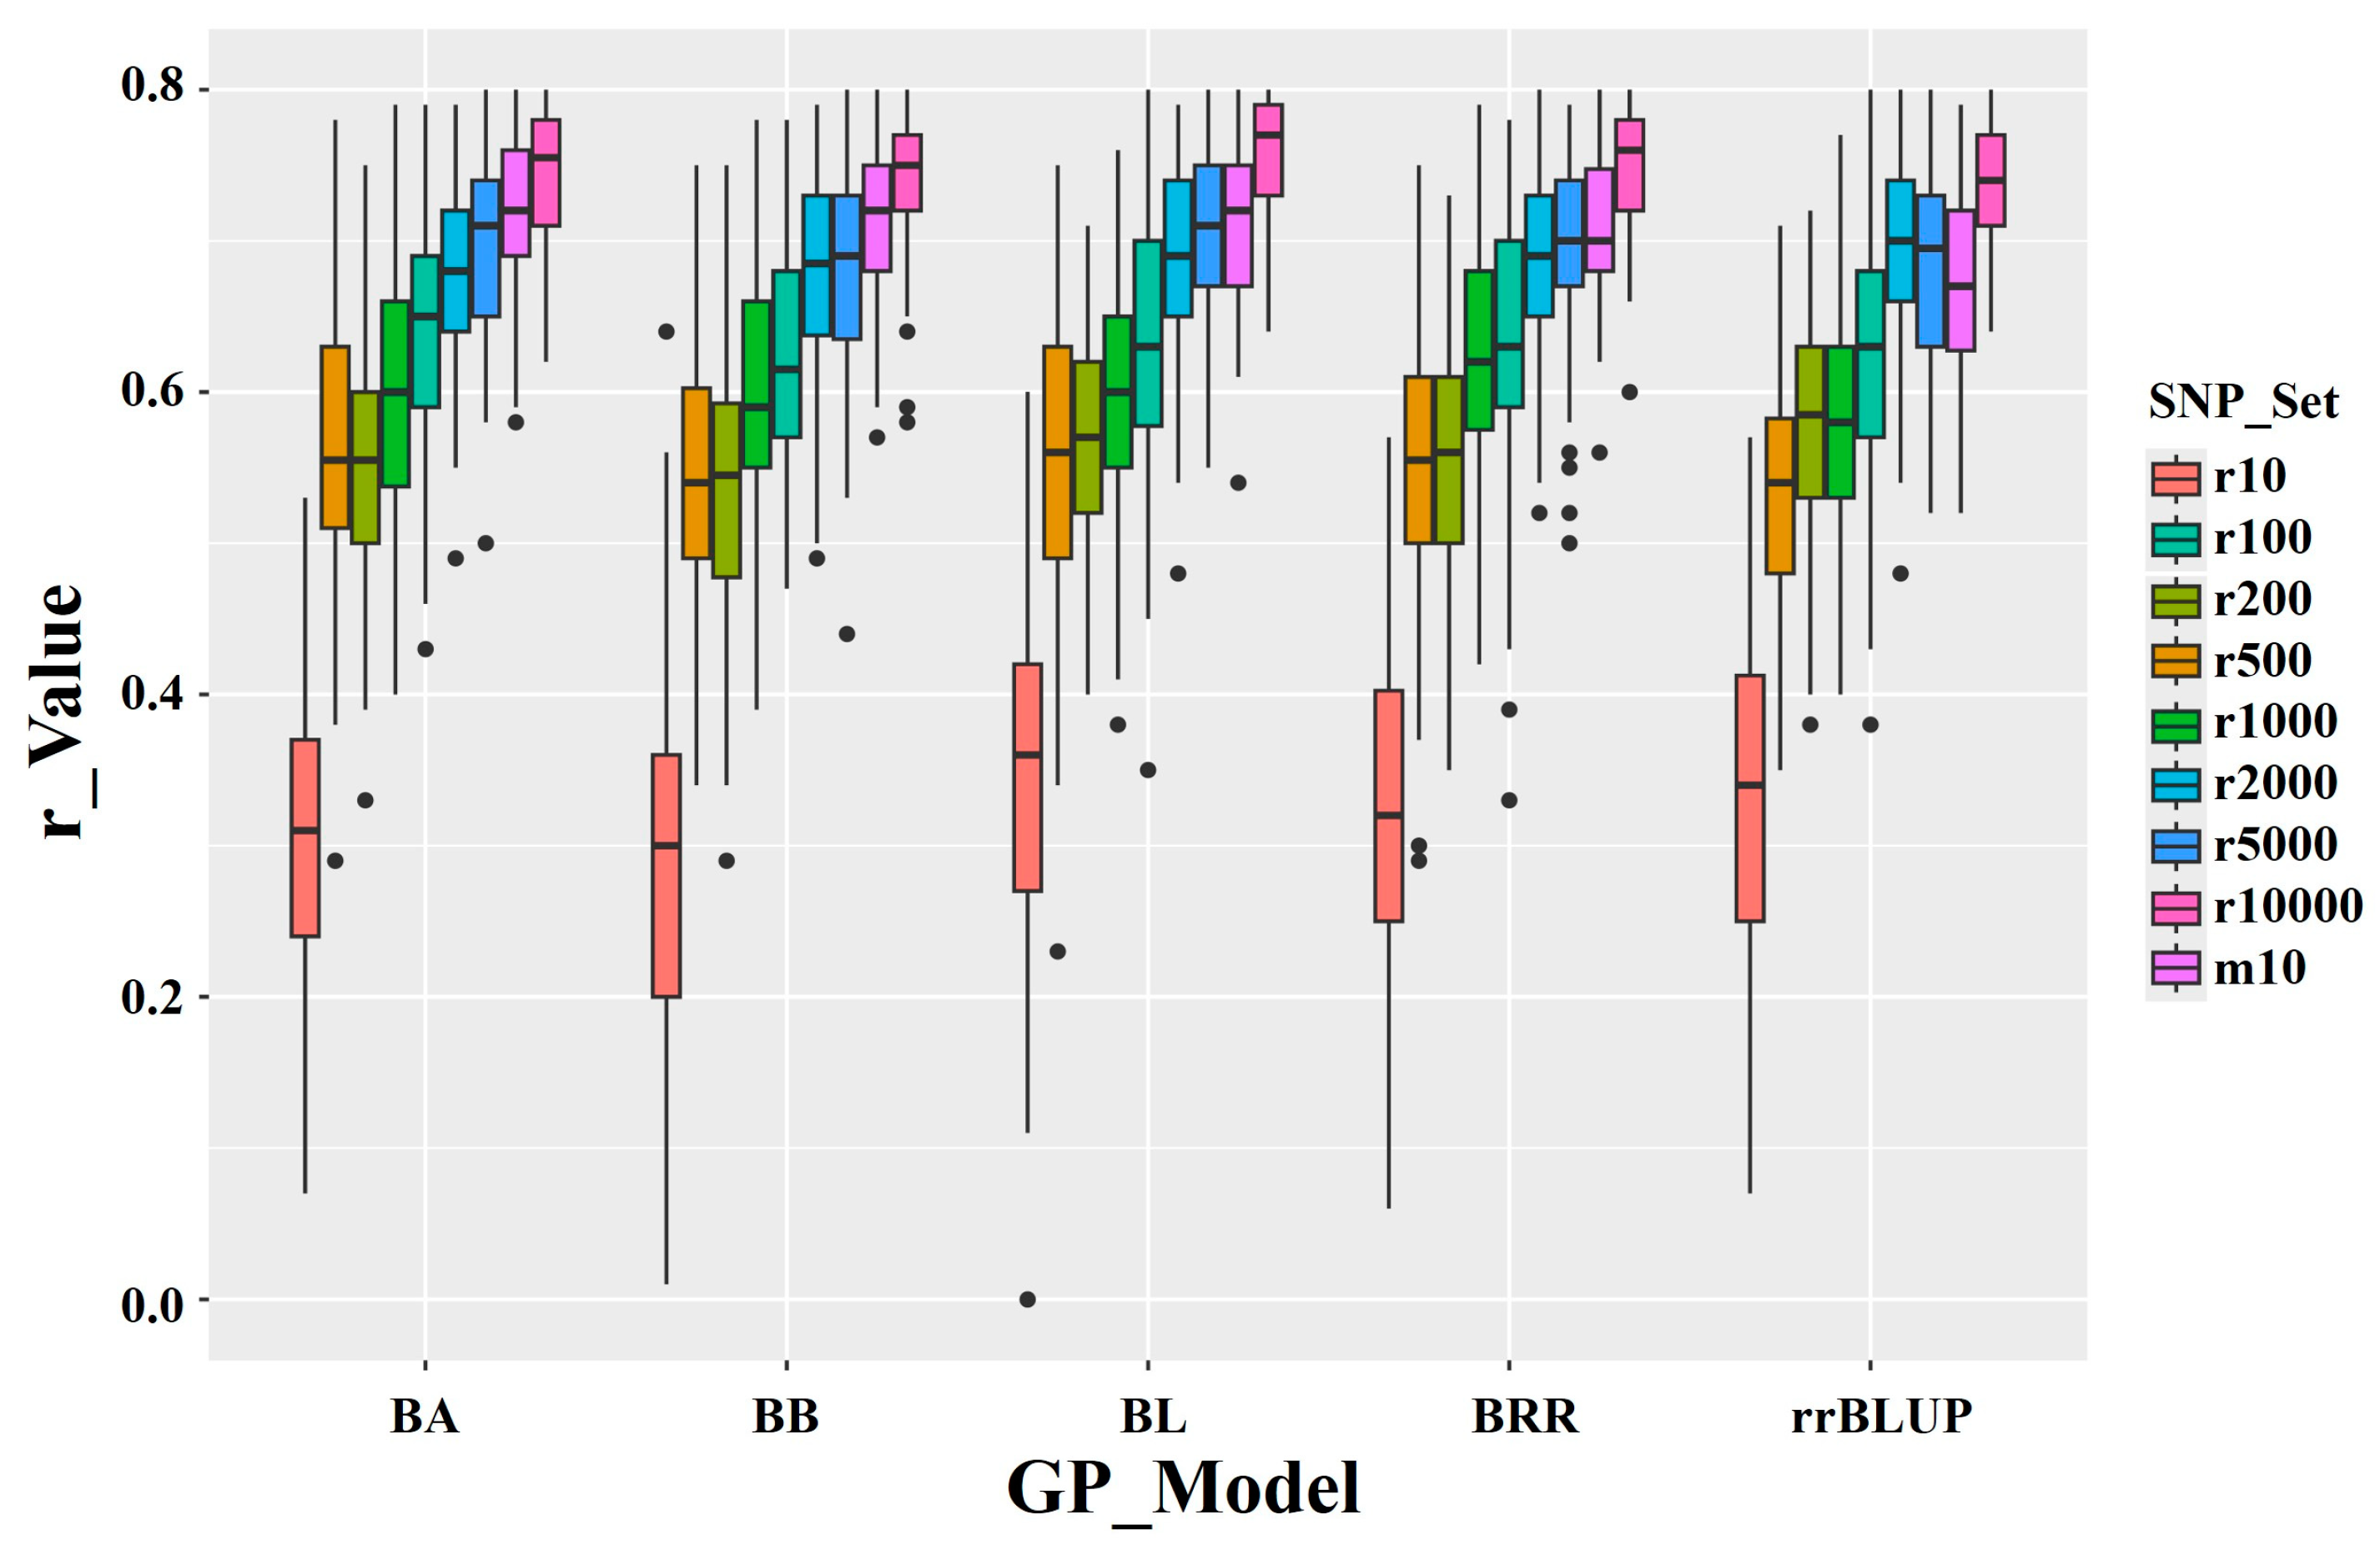
Figure 8.
Genomic prediction (r-value) of the ten GWAS-derived SNP marker set (listed in.3.7.2 GWASderived SNP Markers from 80% of the Whole Panel
Figure 8.
Genomic prediction (r-value) of the ten GWAS-derived SNP marker set (listed in.3.7.2 GWASderived SNP Markers from 80% of the Whole Panel
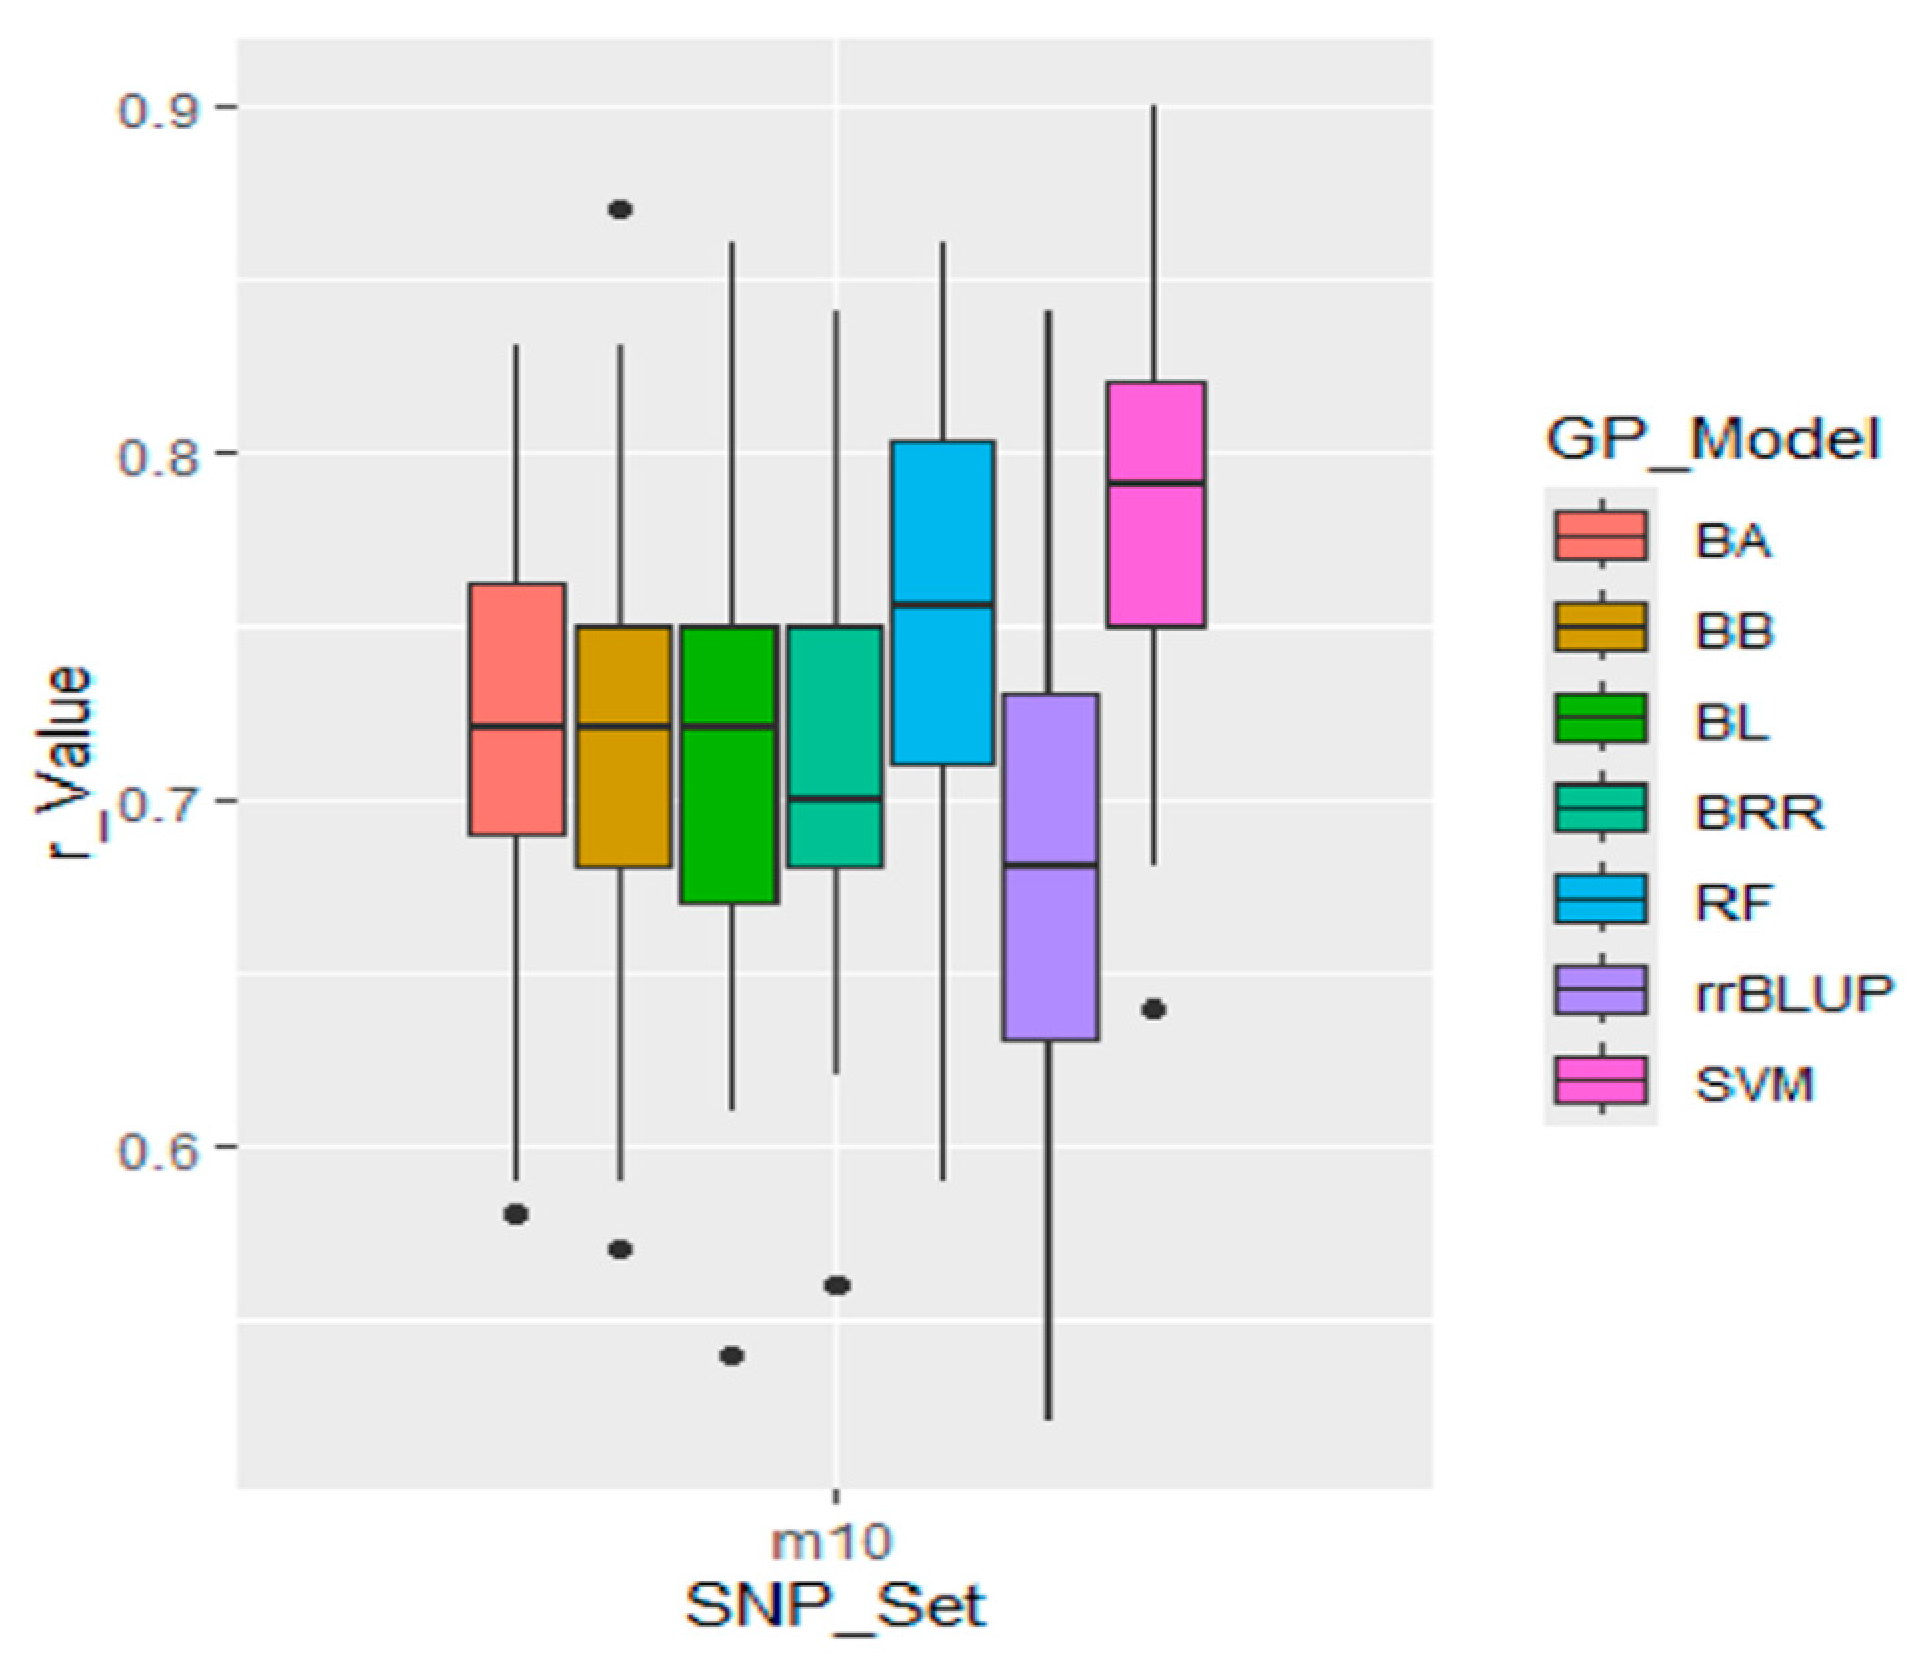
Figure 9.
Genomic prediction (GP) of arginine content using GWAS-derived SNP markers in 290 soybean accessions. Across. Prediction: GWAS-derived SNP markers from the training set (80% of the population; 232 accessions) were used to predict the validation set (20%; 58 accessions). Cross.Prediction: SNP markers from the training set (80%) were used to predict the same training set. All(self). Prediction: All GWAS-derived SNP markers from the training set (80%; 232 accessions) were applied in five replications to predict the entire population (290 accessions).
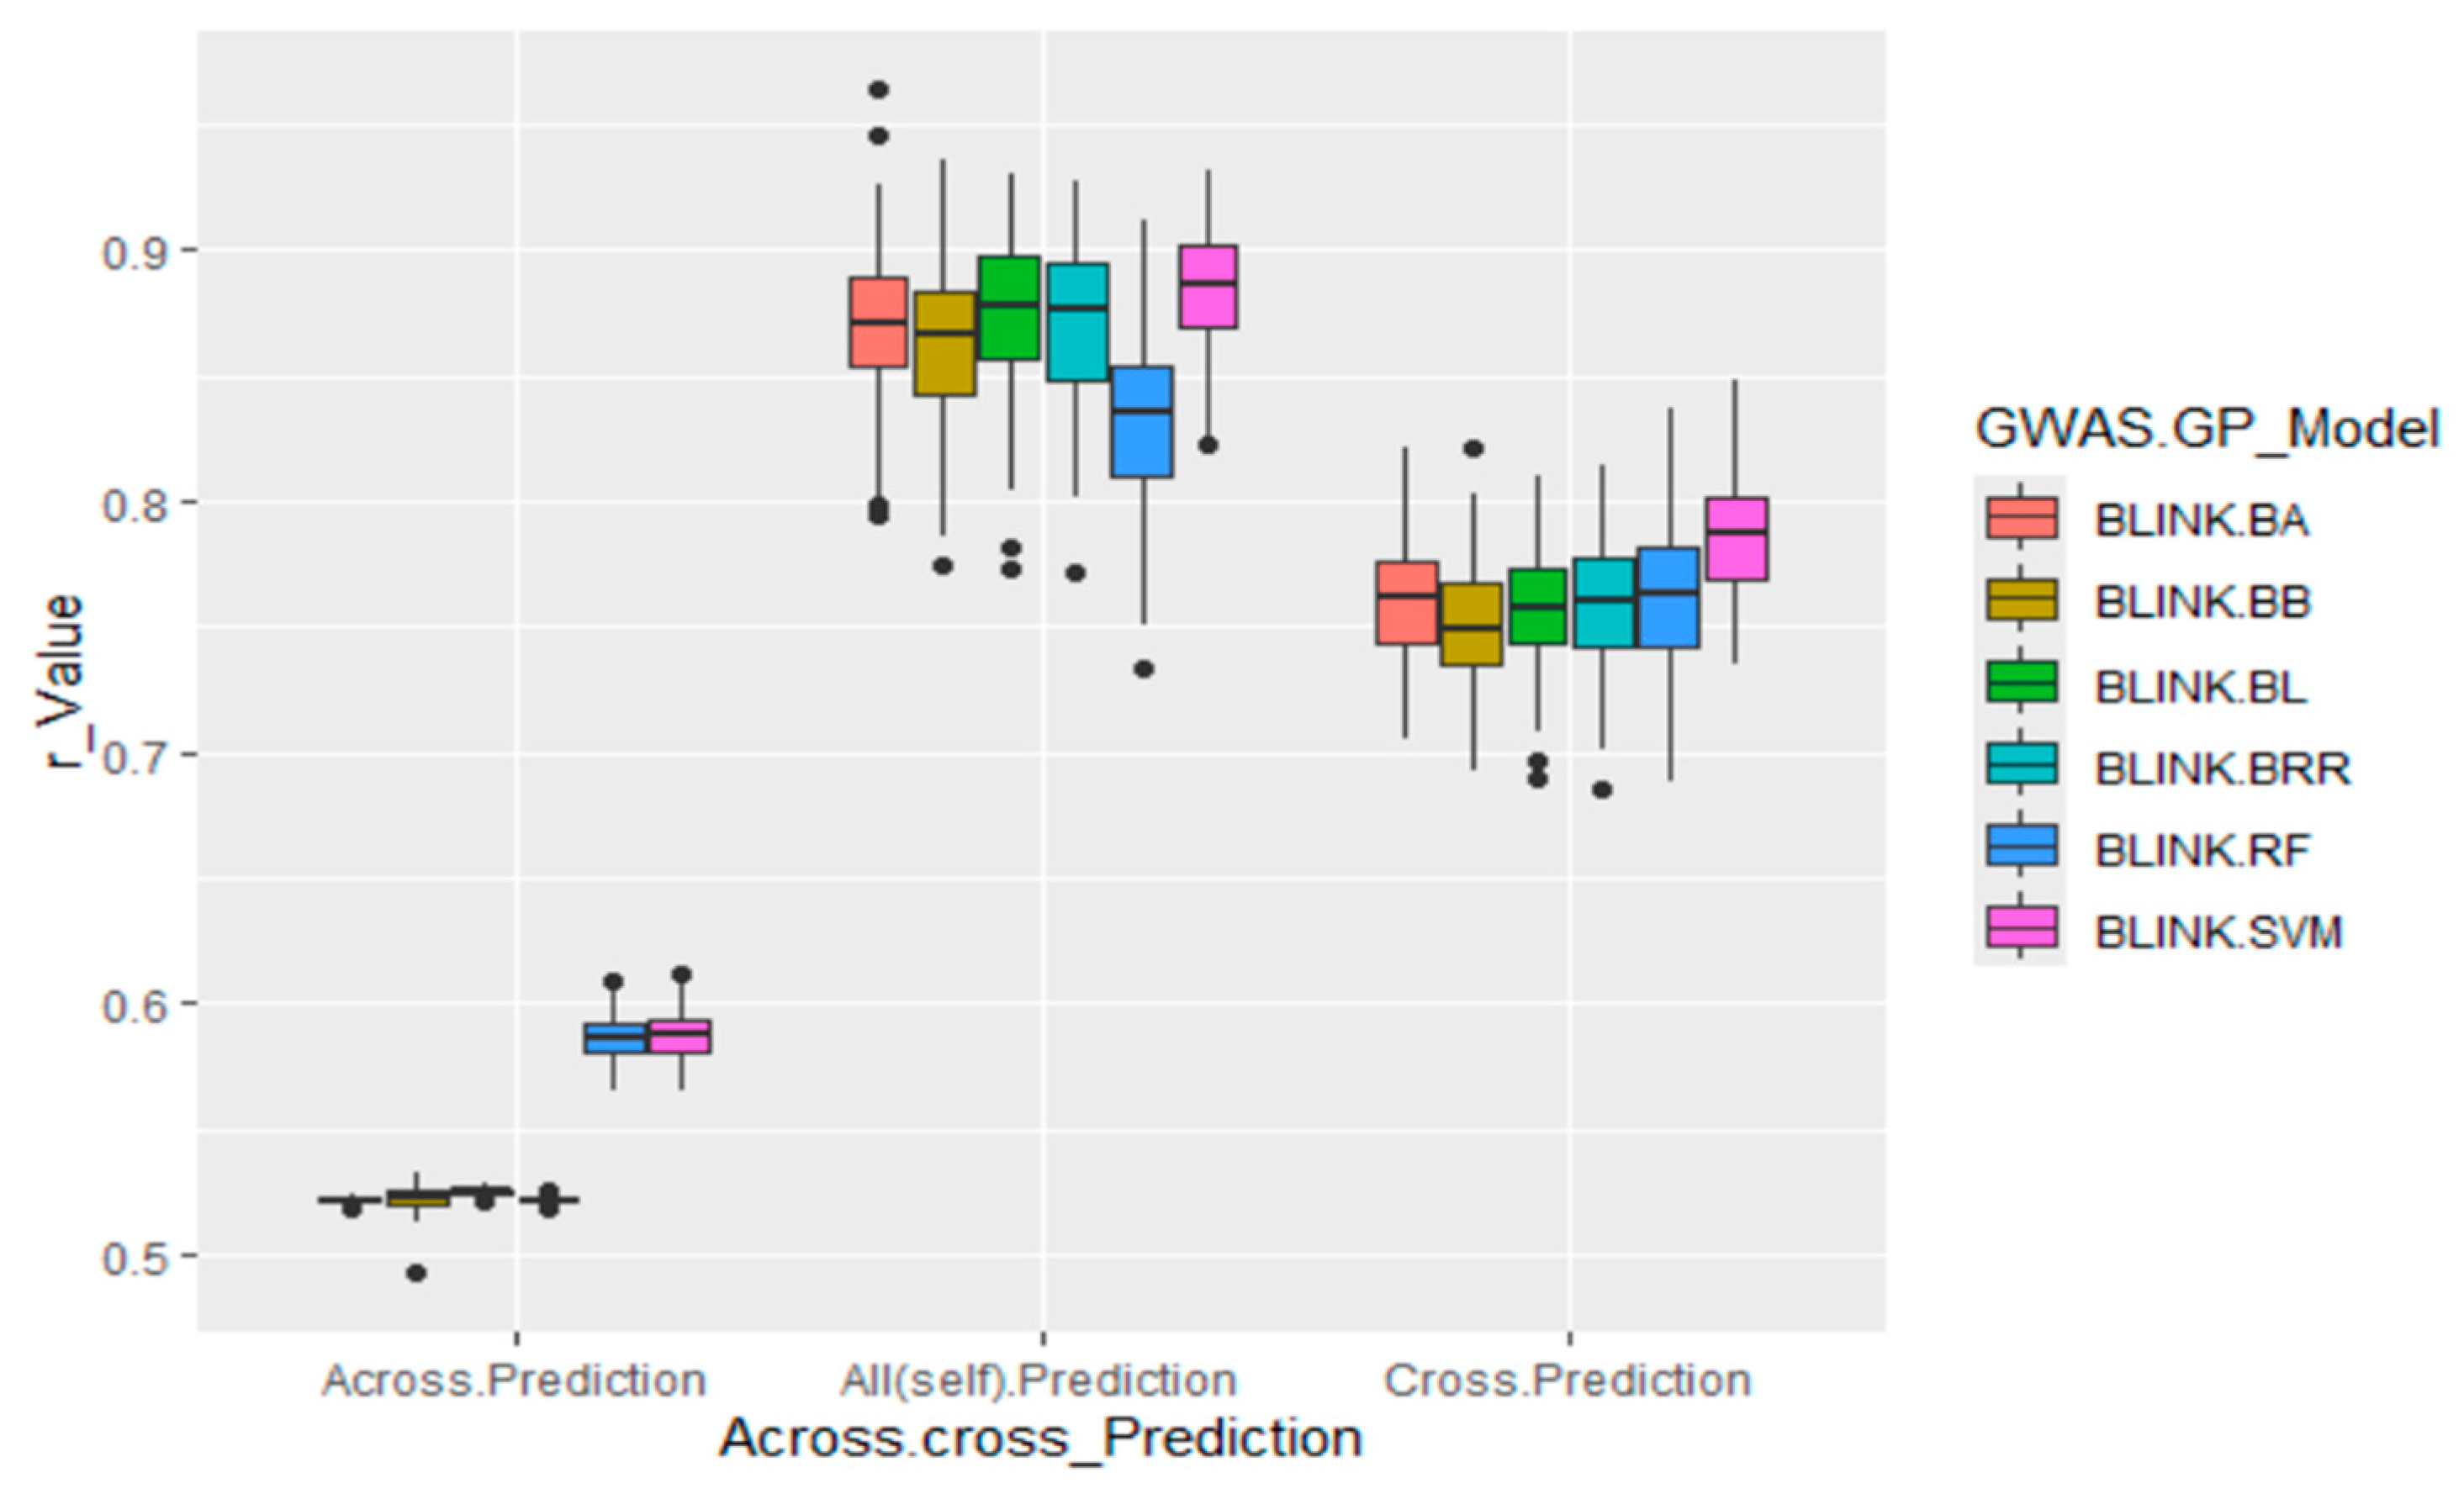
Figure 10.
Genomic prediction (GP) (r-value) for arginine content using the GAGBLUP (BLINK) model in GAPIT3.
Figure 10.
Genomic prediction (GP) (r-value) for arginine content using the GAGBLUP (BLINK) model in GAPIT3.
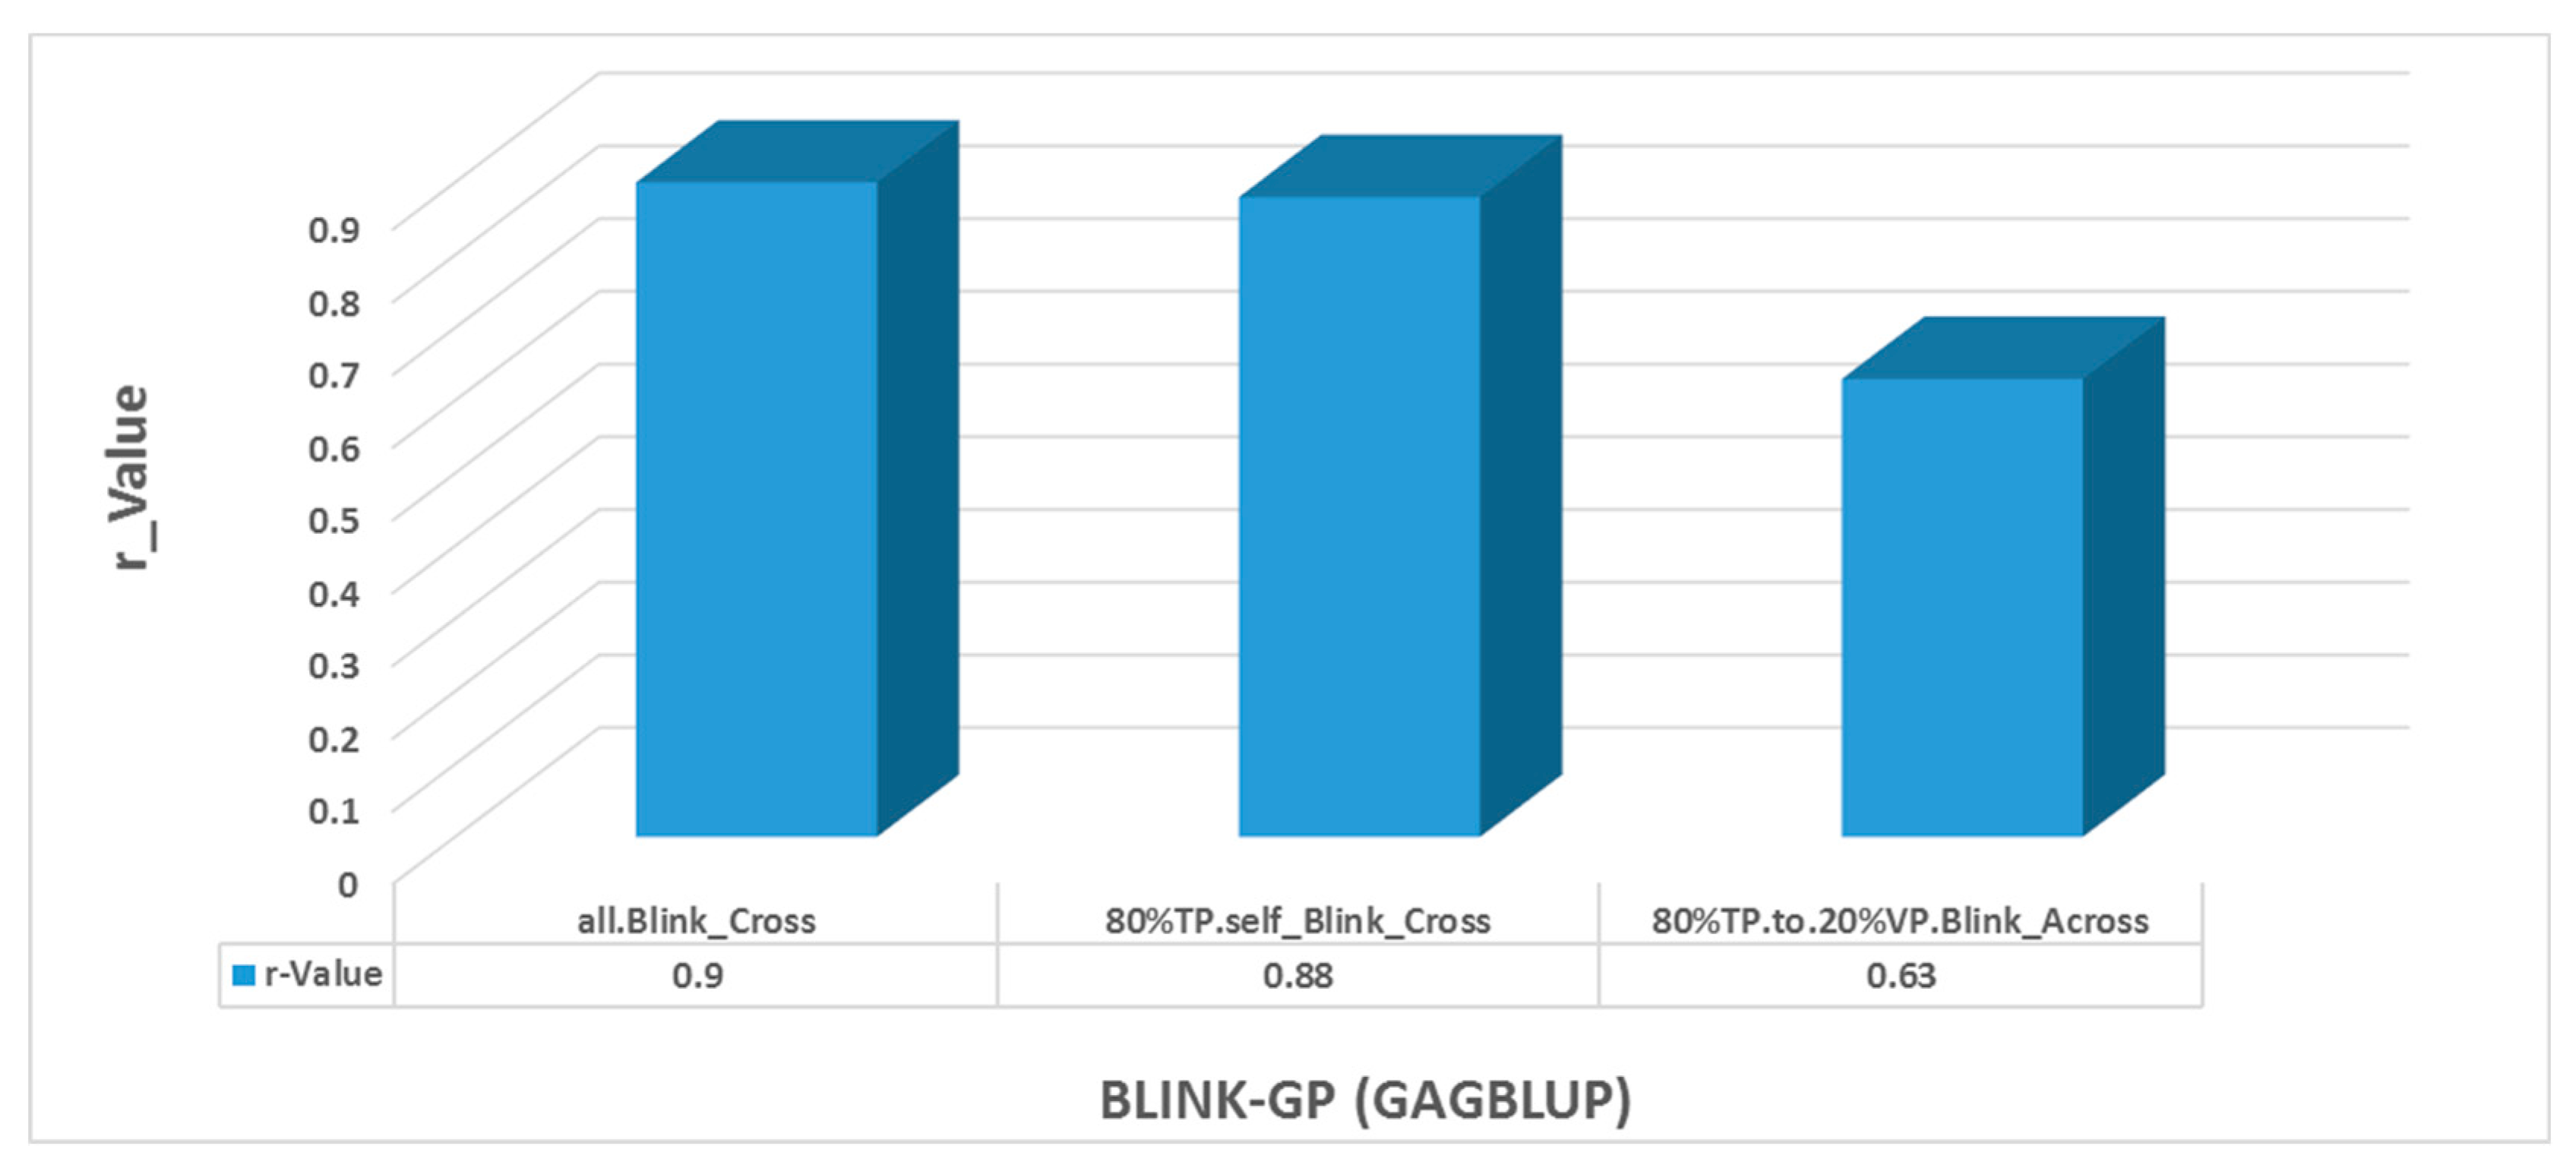

Table 1.
Putative SNPs detected for arginine content by two or more models.
| SNP | Chr. | Position | LOD | MAF (%) | Model | LOD | PVE | LinkGene |
|---|---|---|---|---|---|---|---|---|
| (t-test) | (%) | (0-5k) | ||||||
| Gm05_464582_ss715592561 | 5 | 464582 | 6.73 | 44 | FarmCPU | 7.87 | 11.16 | Glyma.05G005300 |
| Gm06_19014194_ss715593808 | 6 | 19014194 | 9.91 8.02 |
41 | BLINK、 FarmCPU |
7.23 | 8.86 3.91 |
Glyma.06g203200 |
| Gm08_18566925_ss715600087 | 8 | 18566925 | 6.46 | 31 | FarmCPU | 1.50 | 5.03 | Glyma.08g227900 |
| Gm11_2054710_ss715609614 | 11 | 2054710 | 6.38 9.05 |
41 | MLM、MLMM | 21.24 | 35.47 31.20 |
Glyma.11G028600 |
Table 2.
Genomic prediction (r - value) of arginine content using nine SNP sets: eight randomly selected SNP sets ranging from 10 to 10,000 SNPs (r10 tor10000), plus the GWAS-derived SNP marker sets (10 markers - m10).
Table 2.
Genomic prediction (r - value) of arginine content using nine SNP sets: eight randomly selected SNP sets ranging from 10 to 10,000 SNPs (r10 tor10000), plus the GWAS-derived SNP marker sets (10 markers - m10).
| GP Model | r-Value | SE of r-Value | ||||||||||
|---|---|---|---|---|---|---|---|---|---|---|---|---|
| rrBLUP | BA | BB | BL | BRR | SNP set Mean | rrBLUP | BA | BB | BL | BRR | SNP set Mean | |
| r10 | 0.34 | 0.30 | 0.28 | 0.34 | 0.32 | 0.32 | 0.11 | 0.10 | 0.13 | 0.11 | 0.11 | 0.12 |
| r100 | 0.63 | 0.64 | 0.62 | 0.63 | 0.64 | 0.63 | 0.08 | 0.08 | 0.07 | 0.08 | 0.09 | 0.08 |
| r200 | 0.58 | 0.55 | 0.54 | 0.57 | 0.56 | 0.56 | 0.07 | 0.08 | 0.09 | 0.07 | 0.08 | 0.08 |
| r500 | 0.32 | 0.32 | 0.32 | 0.33 | 0.32 | 0.32 | 0.08 | 0.09 | 0.08 | 0.10 | 0.09 | 0.09 |
| r1000 | 0.58 | 0.60 | 0.60 | 0.60 | 0.62 | 0.60 | 0.08 | 0.09 | 0.08 | 0.08 | 0.08 | 0.08 |
| r2000 | 0.70 | 0.68 | 0.68 | 0.69 | 0.69 | 0.69 | 0.06 | 0.07 | 0.07 | 0.06 | 0.07 | 0.07 |
| r5000 | 0.68 | 0.69 | 0.68 | 0.71 | 0.70 | 0.69 | 0.07 | 0.06 | 0.07 | 0.06 | 0.06 | 0.06 |
| r10000 | 0.75 | 0.76 | 0.76 | 0.77 | 0.76 | 0.76 | 0.05 | 0.05 | 0.05 | 0.05 | 0.05 | 0.05 |
| m10 | 0.68 | 0.72 | 0.71 | 0.72 | 0.71 | 0.71 | 0.07 | 0.05 | 0.05 | 0.06 | 0.05 | 0.06 |
| GP Model Mean | 0.58 | 0.58 | 0.58 | 0.60 | 0. 59 | 0.59 | 0.07 | 0.07 | 0.08 | 0.07 | 0.08 | 0.08 |
Disclaimer/Publisher’s Note: The statements, opinions and data contained in all publications are solely those of the individual author(s) and contributor(s) and not of MDPI and/or the editor(s). MDPI and/or the editor(s) disclaim responsibility for any injury to people or property resulting from any ideas, methods, instructions or products referred to in the content. |
© 2025 by the authors. Licensee MDPI, Basel, Switzerland. This article is an open access article distributed under the terms and conditions of the Creative Commons Attribution (CC BY) license (http://creativecommons.org/licenses/by/4.0/).
Copyright: This open access article is published under a Creative Commons CC BY 4.0 license, which permit the free download, distribution, and reuse, provided that the author and preprint are cited in any reuse.


