
Submitted:
27 April 2025
Posted:
28 April 2025
You are already at the latest version
Abstract
Sediments are key players in the optimum functioning of ecosystems; however, they also represent the largest known repository of harmful contaminants. The vast variety of these sediment-associated contaminants may exert harmful effects on marine communities and can impair ecosystem functioning. Whole-cell biosensors are a rapid and one of the biologically relevant tools for assessing environmental toxicity. Therefore, in this study, we aimed to develop a bioassay-based toxicity measurement system using genetically modified bacteria to create a whole-cell optical biosensor. Briefly, reporter bacteria are integrated and immobilized using a calcium-alginate matrix on fiber-optic tips connected to a photon counter placed inside a light-proof, portable case. The calcium alginate matrix acts as a semi-permeable membrane that protects the reporter-encapsulated optical fiber tips and allows the inward passage of the toxicant(s) to induce a dose-dependent response in the bioreporter. Samples were tested by directly submerging the fiber tip with immobilized bacteria into vials containing either water or suspended sediment samples and the subsequent bioluminescent responses acquired. In addition to bioavailable sediment toxicity assessments, conventional chemical methods – liquid chromatography-mass spectroscopy (LC-MS), inductively coupled plasma optical emission spectroscopy (ICP-OES) for comprehensive evaluation were likewise used. Results demonstrated the biosensor's efficacy in detecting various toxicity levels corresponding to identified contaminants, showcasing its potential integration into environmental monitoring frameworks for enhanced sediment and water quality assessments. Despite its utility, the study notes the system's operational challenges in field conditions, recommending future enhancements for improved portability and usability in remote locations.

Keywords:
Bioreporter
; Bioluminescent bacteria
; Optical-fiber biosensor
; Water toxicity
; Sediment toxicity
; In-situ monitoring
; Whole-cell biosensor
1. Introduction
Sediments are key players in the functioning of aquatic ecosystems as they directly impact the lives of benthic organisms that occupy a critical stage in complex aquatic food relationships. Toxicity evaluation of water and sediments that may impact marine life has continued to attract research efforts [1]. In particular, sediments are known to be the largest chemical repositories on Earth, where a vast variety of harmful, often persistent, hydrophobic compounds accrue and are retained long after the pollution of the overlying water has decreased or become undetectable [2]. Tests that can provide valuable information about the bioavailability and combined effects of multiple pollutants present in the environment are desirable [1]. There is a growing body of evidence suggesting the direct harmful effects of a variety of sediment-associated contaminants on the optimal functioning of the ecosystem [2,3]; however, environmental authorities such as the European Union Water Framework Directive (EU-WFD) place more emphasis on water toxicity monitoring than sediment toxicity in assessing the health of aquatic ecosystems [4]. Moreover, in events when sediment toxicity analyses are conducted, monitoring authorities usually assess the sediment quality through targeted chemical analysis, concentrating on a limited range of specific compounds and with little or no emphasis on the ecotoxicological risks that arise from the numerous (un)known mixtures of sediment-associated compounds [5]. There is a need for methods that can account not only for the presence of contaminants, but also for the biological effects of contaminants on marine biota. Traditional analytical methods such as gas chromatography (GC), liquid chromatography (HPLC), and inductively coupled plasma mass spectrometry (ICP-MS) are precise but time-consuming, expensive, and often inadequate for precise evaluation of the bioavailability and biological effects of contaminants. Moreover, these methods typically focus on chemical identification and quantification without directly addressing biological toxicity [6,7]. By using bioassays to evaluate toxicity to various organisms, such as amphipods, midges, and bivalves, the ecological risks posed by contaminated water and sediments can be determined [8]. Sediment toxicity tests are bioassays in which benthic organisms are exposed to field-contaminated or spiked sediment, and their survival, growth, emergence, and/or reproduction are generally evaluated after a certain exposure duration [2]. Specialized techniques such as direct spiking and passive sampling are being used to obtain more accurate and reliable toxicity assessments [9].
Whole-cell biosensing systems possess attributes that make them ideal for portable field kits. These attributes include the ability to withstand a wide range of environmental conditions (such as various temperatures, pH levels, and ionic strengths), providing information on analyte bioavailability, requiring minimal or no sample pretreatment, high sensitivity and selectivity, easy preparation, rapid detection, cost-effectiveness, high-throughput screening, and miniaturization [10]. These biosensors are based on genetically engineered microorganisms (broadly referred to as bioreporters) that produce quantifiable signals such as bioluminescence and fluorescence in response to specific toxicants or environmental stressors [11]. The immobilization of bioreporters for the development of fiber optic-based biosensors has proven to be an indispensable bioanalytical approach for effect-based on-site and continuous assessment of water and sediment toxicity [12]. Whole-cell fiber-optic biosensors have demonstrated their effectiveness in monitoring a variety of contaminants, including genotoxicants [13], heavy metals [6], organic pollutants [14], and specific toxic events, such as those observed in Lachish River contamination [15]. It is believed that by integrating effect-based methods with chemical profiling, these tests provide a comprehensive understanding of the potential risks associated with contaminated aquatic environments [1].
The goal of this study was to develop a field-enabled whole-cell optical biosensor for on-site direct sediment toxicity measurement using a genetically modified Escherichia coli strain expressing bioluminescent reporter genes (luxCDABE) under the control of promoters responsive to general stress that induces the expression of heat shock protein families [16]. The reporter bacterial strain was encapsulated onto the near end of the optical fiber using a biocompatible calcium alginate hydrogel matrix. The hydrogel matrix served as a semi-permeable membrane that retained the bacteria and selectively allowed the passage of toxicants into the bioreporter, triggering a dose-dependent bioluminescence response. Water and sediment samples from multiple potentially contaminated sites across Israel (Figure 1 and Figure 2) were evaluated for direct water and sediment toxicity and chemical analyses. The bioreporter-immobilized fiber optic was used for both direct (in situ) bioavailable sediment toxicity and sediment extracts (Supplementary Material Figure S2). Because of the complex matrix, microplate reader analysis and LC-MS analysis were conducted only on the water samples and the extracts, while the fiber optic set enabled a comparable toxicity measurement at the point of site. The present study demonstrates the practicality of direct sediment toxicity measurements without the need for complex sample preparation steps.
2. Materials and Methods
2.1. Materials
Calcium chloride, Luria Bertini agar Difco (244520), ampicillin (A9518-5G), low viscosity sodium alginate (Sigma, A-2158), and ethanol (19-009101-80, Romical, Israel) were of analytical grade.
2.2. Sample Collection
Water and sediment samples were collected from the banks of potentially contaminated streams and rivers across Israel [17,18,19]. Soil samples were collected from four locations across the northern and southern regions of Israel in September and October 2024 (Figure 1) from the top 10 cm layer. Water samples were collected by submerging a 50 mL tube into the water body, while sediment samples were collected using a 0.5 L plastic container and stored refrigerated until required.
2.3. Bacterial Toxicity Measurement
Two bacterial toxicity measurement approaches were employed: direct bioavailable sediment toxicity testing and testing of toxicants extracted from the sediment. Laboratory-based testing was conducted on extracted bioavailable sediment and water samples. Finally, conventional chemical analyses were performed to provide more insight into the chemical nature of the sample, as shown in the experimental workflow (Figure 3).
2.3.1. Strain Description
The organism chosen to demonstrate the proposed system’s applications and used in all the experiments was E. coli strain TV1061 [20]. This strain contains a plasmid-based fusion of the E. coli grpE promoter with the Photorhabdus luminescens luxCDABE reporter operon. The lux operon consists of five structural genes that encode the heterodimeric luciferase enzyme (luxA and luxB) and the biosynthetic enzymes (luxC, luxD, and luxE) responsible for producing the luciferase substrate, tetradecanal, in an ATP- and NADPH-dependent manner [21,22]. The grpE promoter is a part of the heat shock response system, which is activated under conditions of cellular stress and metabolic changes, such as cytotoxic substances, as shown in Figure 4 [20,23,24]. Studies have demonstrated that in liquid culture, E. coli TV1061 responds to various cytotoxic stressors, including ethanol, heavy metals, and heat shock-inducing compounds, by producing a dose-dependent increase in bioluminescence at 490 nm [13,14,15,25,26]. This response renders TV1061 a valuable bioreporter strain for detecting general cytotoxicity and environmental stressors.
2.3.2. Culturing Conditions
The bacteria were cultivated on Luria-Bertani agar supplemented with ampicillin to maintain. Cultured plates containing 100 µg/mL ampicillin were incubated at 37 °C for 24 h and then stored at 4 °C for further use. The cultures maintained their plasmid replication for up to 30 days, after which they were refreshed. Prior to sample analysis, one bacterial colony from the pure culture was grown in 10 mL of Luria-Bertani (LB) Broth medium supplemented with the appropriate antibiotic for 24 h at 37 °C with shaking at 220 RPM (TOU-120 BenchTop Orbital Shaking Incubator, MRC Ltd., Holon, Israel). A secondary culture was prepared for each experiment by growing bacteria in a fresh 30 mL antibiotic-free LB medium (1:50 dilution) for 2–3 h at 37 °C with shaking at 220 RPM (TOU-120 BenchTop Orbital Shaking Incubator, MRC Ltd., Holon, Israel). The bacterial concentration was monitored using a spectrophotometer at a wavelength of 600 nm (Ultrospec 2100 Pro, Amersham, UK). Cultures reaching an optical density at 600 nm (OD600) of 0.2-0.3 (approximately cfu/mL) were suitable for the assay since they are the most active at this stage. This specific stage within the exponential growth phase is crucial to avoid the need for dilution during measurement.
2.3.3. Preparation of Bacterial Suspensions for Immobilization
The 30 mL tubes containing a fast-growing reporter bacterial strain (E. coli TV1061) culture with an OD600 of 0.6-0.8 (approximately 3 × CFU/mL) were centrifuged at 4000 rpm for 10 min. The top 25 mL of the centrifuged suspension was discarded, and the cells were resuspended in the remaining 5 mL, resulting in an OD600 of approximately 1.2-1.4. The harvested cells were mixed with filter-sterilized 2.5% (w/v) sodium alginate solution at a volume ratio of 1:4 (bacteria: alginate).
2.3.4. Sample Collection and Preparation for Analysis
Water samples were filtered using a 45 µm syringe filter and tested on-site and in the laboratory using a microplate reader (BioTek Synergy H1, Santa Clara, CA, USA). The sediment samples were dried in an oven (BINDER GmbH, Tuttlingen, Germany) at 60°C for 48 h. The sediments were weighed before and after drying to calculate their moisture content (Supplementary section Table S2).
In the case of sediment toxicity assessment, two approaches were employed: the preparation of bioavailable toxicants from the sediment and direct sediment toxicity measurement (Figure 5) Figure 5. For bioavailable toxicity measurements, all dried sediment samples were mixed with DDW at a soil/sediment: water (w/v) ratio of 1:5 [6]. The obtained suspensions were vortexed for 1 min and then either passed through a 45 µm syringe filter or left to extract for 24 h before filtering through a 45 µm syringe filter and then refrigerated until required. Whereas for direct sediment toxicity measurement, a determined amount (114.1 ± 2.78 mg of dry, or 132.77 ± 29.27 mg of wet) of sediment samples per milliliter assay media was prepared and used for direct fiber optic-based toxicity measurement. In all the experiments, a 1% (v/v) solution of ethanol was used as a standard inducer of the E. coli (TV1061) bioreporter strain [14,15,25], and sterile DDW served as the negative control
2.3.5. Bioluminescence Measurement Using Multimode Plate Reader
The bioluminescent toxicity responses of the bioreporter TV1061 strain, as well as the optical density at 600 nm (OD600), were acquired over a 10–24 h period using a BioTek Synergy H1 microplate reader (Agilent, Santa Clara, CA, USA) and maintained at 37 °C. The luminometer was set to kinetic mode at 15 min intervals between readings. Either white (non)-transparent, 96-well, flat-bottom microplates (Nunc, Roskilde, Denmark) or 96 Well Microplate, non-binding, µClear®, white (Greiner Bio-One GmbH, Kremsmünster, Austria) were used in all experiments. Experiments were performed in three or four biological replicates. The maximum luminescence values (expressed in the relative luminescent unit, RLU) were extracted using Microsoft Office Excel, from which the induction factor was calculated as a ratio of the maximum RLU of the test to that of the negative control (in the absence of an inducer) [27].
2.3.6. Immobilization of the Bioluminescent Bacteria onto the Optical Fiber
Multimode optical fibers, SFS400/440 (Fibreguide Industries, Inc., USA) were used to immobilize the sensor bacteria. Prior to preparation, black nylon jackets (cladding) covering the fibers were stripped from a 1 cm long optical fiber tip. The stripped fiber tips were washed with a 70% (w/v) ethanol solution before immobilization. The 1-cm optical fiber tip was dipped (for a few seconds) into the bacterial–alginate suspension and then (for a few seconds) into a sterile 0.15 M calcium chloride solution. This procedure resulted in the formation of a solid Ca–alginate matrix that attached alginate-entrapped bacteria onto the fiber [27]. This procedure was repeated six times to increase the number of bacterial sensor cells attached to the optical fiber transducer [6,13,26]. Fiber-optic sensors were used immediately after the preparation Figure 6.
2.3.7. Fiber Optic Instrument Set-Up
The photon-counting system was designed and built in our laboratory as described recently [27]. The instrument set-up was placed in a light-tight box to prevent environmental light interference. A manual shutter (71430, Oriel) was placed in front of the detector to protect the photon-counting unit and was operated externally using a workshop-made lever. The output signal in the analog measurements was the mean value of the pulses generated after the multi-anode amplification in the photomultiplier tube. A P25PC Photodetector Module (Sens-Tech Ltd., Sawston, Cambridge, UK) featuring a 25 mm end-window photomultiplier tube with a blue-green sensitive bialkali photocathode was employed for bioluminescence detection. The detector operates with low dark counts, high-speed amplification, and magnetic shielding, thereby ensuring enhanced sensitivity in the blue-light spectral range. The module’s 22 mm active diameter allows for effective light collection without requiring additional optical focusing elements. Data acquisition was performed using Counter/Timer software provided by Sens-Tech Ltd., enabling precise photon counting and real-time analysis. A workshop-made fiber holder was used to secure the fiber in front of the detector. To support bacterial viability and maintain a stable temperature, a 15.5 by 22.0 cm2, 5V 2A USB-powered, 7.5 W commercial reptile heating mat was placed inside the black box and was set to 33 °C ± 3 during measurements.
2.3.8. Fiber Optic Bioluminescent Toxicity Acquisition
The fiber tips containing the adlayers of alginate-encapsulated bacterial probes were submerged into vials (1.5 mL Snap-Cap Vial, AIJIREN Technology Co., Ltd., Zhejiang, China) containing 900 µL of Luria-Bertani (LB) Broth Difco (244629) medium, 10 µL of sterile 0.15 M calcium chloride solution and 100 µL of the tested sample (either extracted bioavailable sediment toxicants or water samples). Optical fibers were passed through a small hole in the vial cap created using a 16-gauge sterile needle. The vials were placed inside a photon-counting biosensor system in a plastic tray (AIJIREN Technology Co. Ltd., Zhejiang, China) using a heating mat. The other end of the fiber was secured in front of the PMT, and the bioluminescence response was measured for up to 24 h. For the direct sediment toxicity testing, 114.1 ± 2.78 mg of dry, or 132.77 ± 29.27 mg of wet sediment samples, were added to one milliliter of assay media containing 10 µL of sterile 0.15 M calcium chloride solution, and the bioluminescent responses were acquired as described for the water or extracted sediment samples. The representative bioluminescent kinetic curves are shown in the supplementary section (Figure S3)
Complementary chemical analyses were performed using Inductively coupled plasma optical emission spectroscopy (ICP-OES) and liquid chromatography-mass spectrometry (LC-MS).
2.4. Conventional Chemical Analyses
2.4.1. Elemental Analysis by ICP-OES
Heavy metal concentrations in the collected environmental water samples were determined using inductively coupled plasma optical emission spectroscopy (ICP-OES) (SPECTROGREEN ICP-OES, SPECTRO Analytical Instruments GmbH, Germany). The instrument was operated with dual viewing plasma modes—axial end-on plasma (EOP) and radial side-on plasma (SOP)—to enhance sensitivity and precision. A sample introduction was performed using a crossflow nebulizer at a rate of 2 mL/min. Calibration standards covering a concentration range from 0.05 ppm to 100 ppm were prepared from certified stock solutions to quantify metals including Ag, Al, Ba, Cd, Co, Cr, Cu, Fe, Mn, Ni, Pb, Sr, Ti, Zn, and others, along with separate phosphate and sulfate calibration sets. The emission lines for each element were carefully selected based on optimal sensitivity and minimal spectral interference. Quality control procedures included blank measurements, standard checks, and polynomial regression analysis to confirm instrument linearity (minimum correlation coefficient > 0.996) and accuracy within the specified analytical ranges.
2.4.2. LC-MS Analysis
Non-Targeted Profiling (NTP) was performed using an LC-MS system (liquid chromatography coupled with high-resolution mass spectrometry). The extracted sediment and water samples were microfiltered, and 200 µL of the filtrate was completely dried in a vacuum concentrator. The dry pellets were resuspended in 50 µL of LC-MS grade acetonitrile and 10 µL of internal standard (13C3-cortisone 100 µg/mL in methanol), shaken for 1 min, and centrifuged twice at maximum speed for 10 min to remove insoluble materials. The pure liquid was transferred into an LC vial, and 1 µL was injected into the LC-MS system consisting of a Waters Acquity Liquid Chromatograph equipped with an HSS-T3 reverse-phase column and a Thermo Fisher Scientific Q Exactive Plus Mass Spectrometer fitted with an electron spray ionization source. A gradient of mobile phases A (0.1 % formic acid in water) and B (0.1 % formic acid in acetonitrile) was used in the following order: 0–1 min 99 % of A, 1–11 min 60 % of A, 11–13 min 30 % of A, 13–15 min 1 % of A, 15–16 min 1 % of A, 16–17 min 99 % of A, 17–20 min 99 % of A. The flow rate was 0.4 mL/min, and the temperature of the column was 40 °C [29]. Data acquisition was performed in the full-scan (60–1000 m/z) positive ionization mode. In addition, the blank sample was analyzed to remove background data, and the quality control pool was analyzed in both full-scan and MS/MS modes for secondary fragmentation data. Peak extraction and background filtering were performed using Thermo Fisher Scientific Compound Discoverer software, version 3.3. Putative annotation of metabolites was performed in Compound Discoverer by matching the detected high-resolution mass spectrum to the ChemSpider public database and the MS2 spectrum (where available) to the Thermo Fisher Scientific mzCloud database. Downstream data analysis was performed using Microsoft Excel and R-project software [30]. A heatmap was built using the “pheatmap” package [31].
2.4. Statistical Analysis
A two-way or one-way ANOVA, followed by a Tukey multiple comparisons test, was performed using GraphPad Prism version 8.0.2 for Windows (GraphPad Software, San Diego, CA, USA, www.graphpad.com, accessed on 09 November 2024).
3. Results
3.1. Bioluminescent Toxicity Response
3.1.1. The Fiber Optic-Based Bacterial Toxicity Measurement
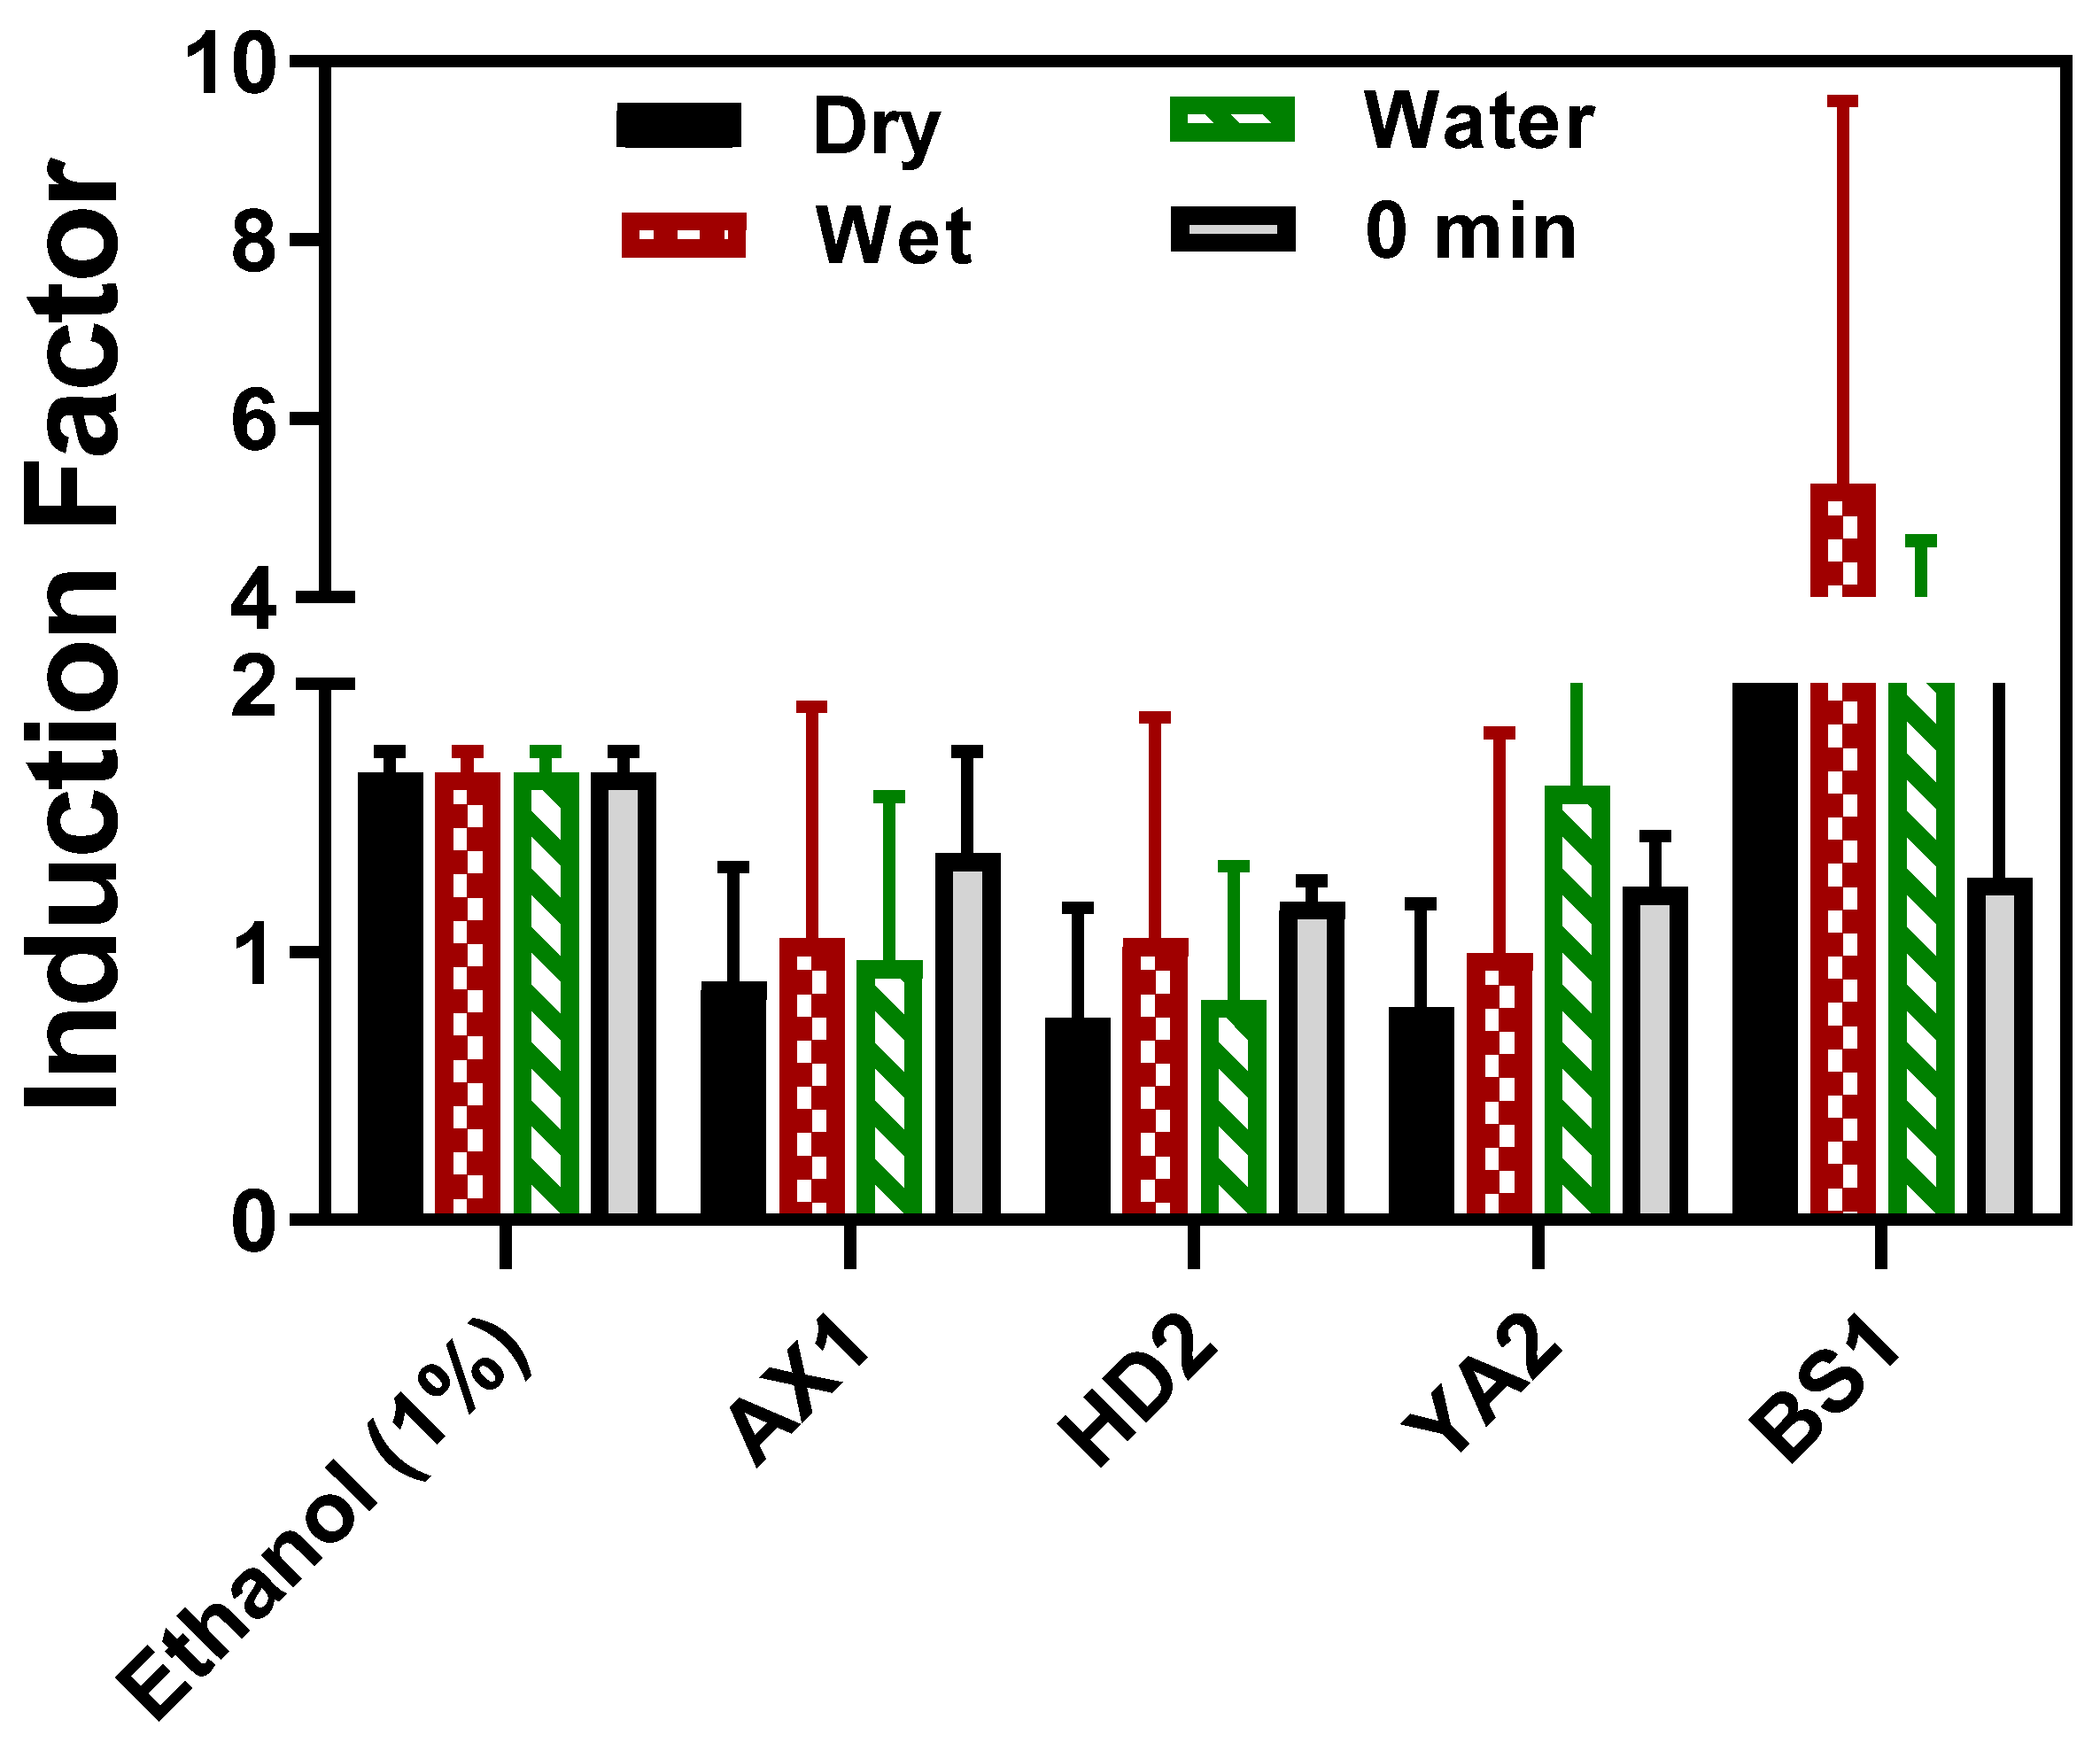
Toxicity measurements of the sediment and water samples were determined using our portable optical fiber setup at four potentially contaminated sites in Israel, as shown in Figure 1. As can be seen, the established standard concentration of ethanol and the water sample of YA2 led to an induction factor higher than 1, while the wet, dry, and water samples displayed an induction factor value less than 1. Since the reporter bacterial strain (E. coli TV106) harbors an inducible lux gene that is under the control of the grpE promoter, the activated shock response system, which is activated under conditions of cellular stress and metabolic changes, such as cytotoxic substances [20,23], different induction patterns were observed. When a stress stimulus is applied to the corresponding inducible lux-bioreporter used in this study, its receptor proteins are activated, the signal inside the cell is transmitted to the promoter upstream of the lux genes, and their expression is induced. Several minutes after induction, the luminosity rises, but when such a stimulus severely damages the cell, metabolism is impaired, and the luminosity drops [24].
Figure 7.
Fiber optic-based reporter bioluminescent bacterial direct sediment toxicity response. The wet sediment and water samples were tested on-site, whereas the sediment extracts and dry sediment samples were tested in the laboratory after the samples were oven-dried and the moisture content was determined. The results for each location were statistically compared between dry and wet sediments and water collected from the same location (p < 0.05, **** p< 0.001). The results are expressed as the mean of replicate measurements, and the error bars represent the standard deviation (SD).
3.1.2. The Laboratory-Based Toxicity Response
Furthermore, the fiber optic-tested samples were brought to the laboratory for equipment-based toxicity testing of both water and bioavailable sediment extracts (Figure 8 and Figure 9). The results show that both treated and non-treated controls demonstrated similar growth curves, indicating that bioluminescence induction did not critically impair physiological processes or result in the death of the bioreporter (Figure 8b,c).
3.2. Conventional Analysis
The conventional chemical analyses were conducted to provide insight into the possible chemical composition of the tested samples using the combination of ICP-OES and LC-MS methodologies.
3.2.1. ICP Analysis

Table 1.
ICP results for different samples analyzed in this study. + and - indicate that the element was detected or not detected, respectively.
Table 1.
ICP results for different samples analyzed in this study. + and - indicate that the element was detected or not detected, respectively.
| Element | HD1 | AX2 | YA1 | YA2 |
|---|---|---|---|---|
| Ag | - | - | - | - |
| Al | - | - | - | - |
| B | - | + | - | - |
| Ba | - | - | - | - |
| Bi | - | - | - | - |
| Ca | + | - | + | - |
| Cd | - | - | - | - |
| Co | - | - | - | - |
| Cr | - | - | - | - |
| Cu | - | - | - | - |
| Fe | - | - | - | - |
| Ga | - | - | - | - |
| K | + | + | + | + |
| Li | - | - | - | - |
| Mg | + | + | + | - |
| Mn | - | - | - | - |
| Na | + | + | + | + |
| Ni | - | - | - | - |
| Pb | - | - | - | - |
| Sr | - | - | - | - |
| Zn | - | - | - | - |
| S | + | + | + | + |
| P | - | - | - | - |
3.2.2. LC-MS Analysis
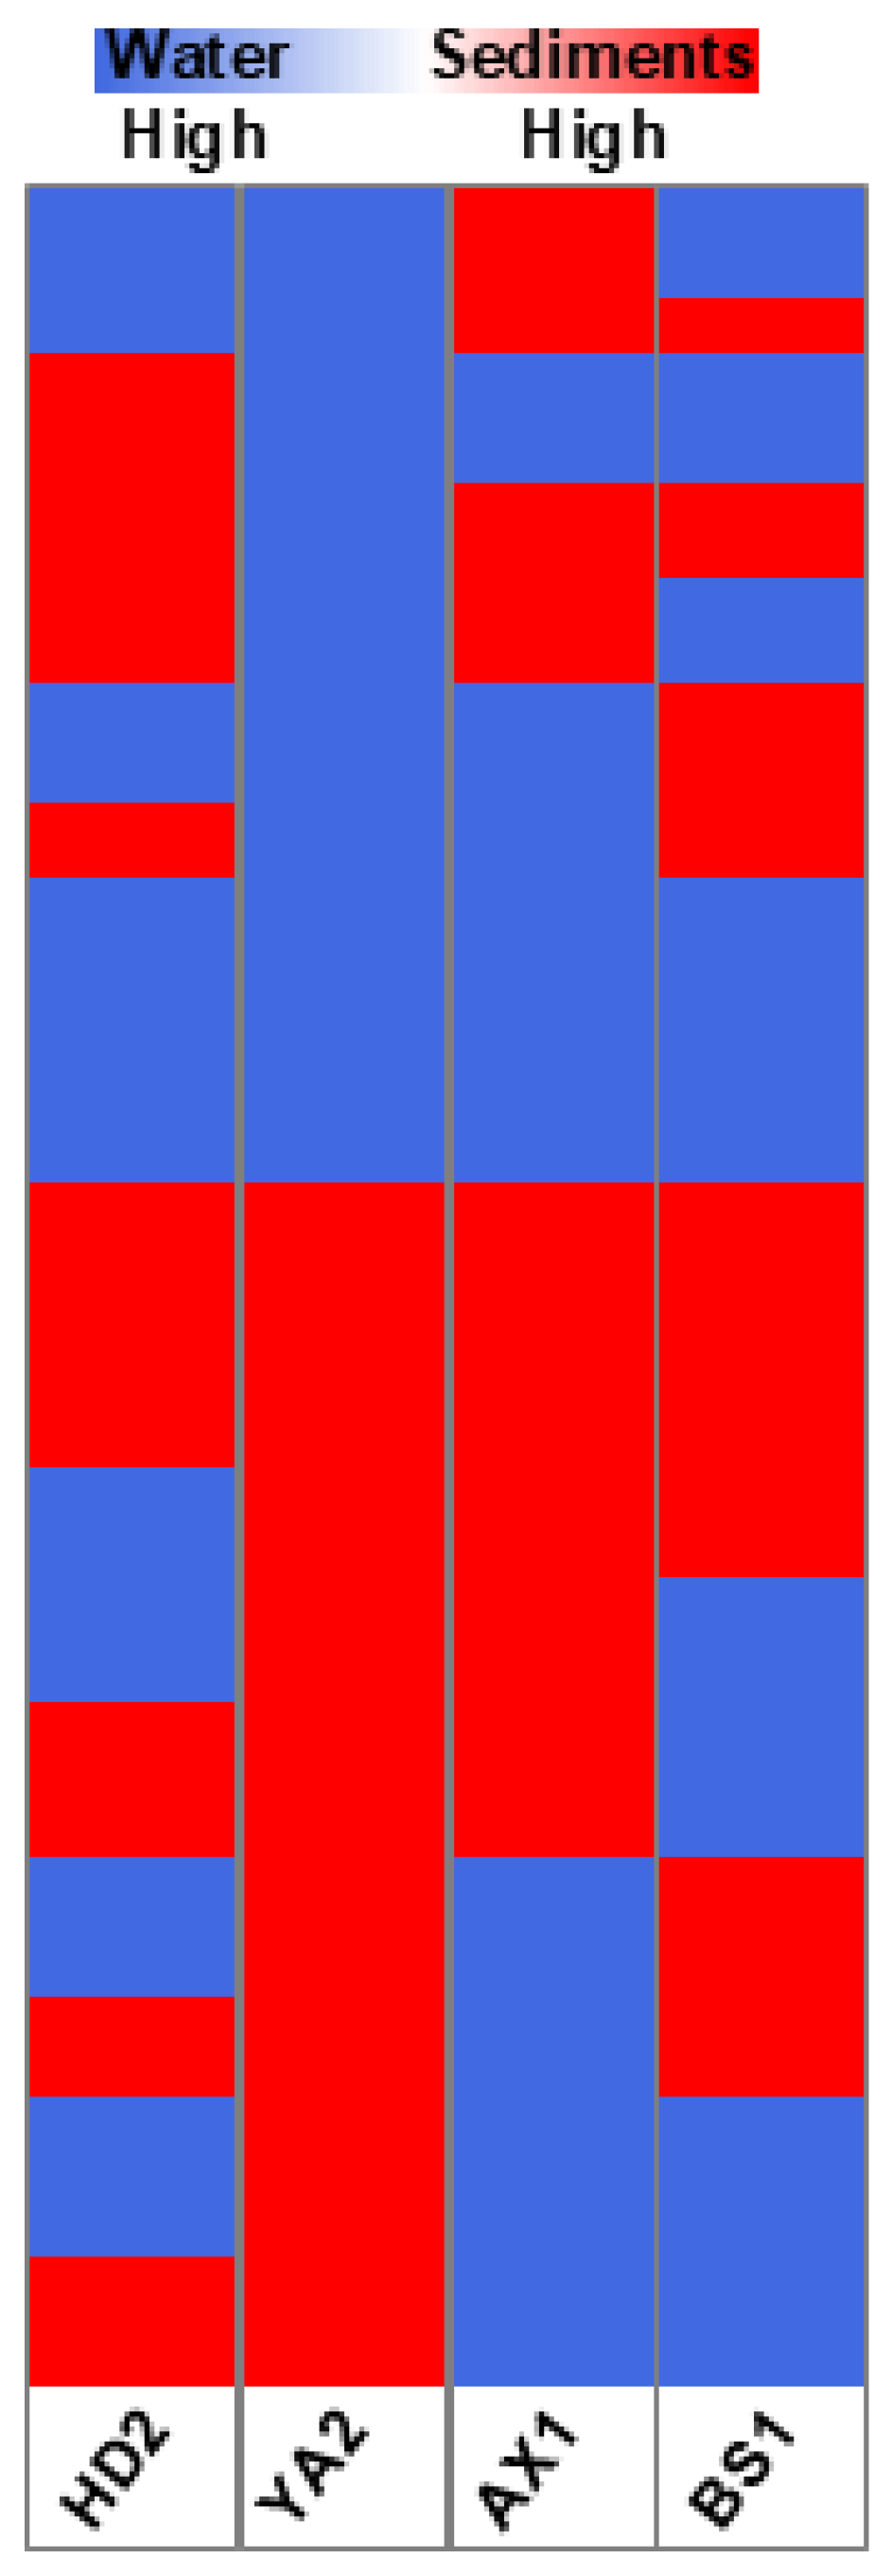
To explore the chemical composition of sediments and water in the four representative locations, we performed an untargeted metabolic analysis of bioavailable compounds extracted from sediments with those present in river water from the same locations, and compared these results with the chemical composition of pure water. The data obtained revealed 9,644 chemical compounds released from sediments across all four locations, as well as a unique fingerprint for each region (Figure 10). Intriguingly, site AX1 showed the least specific fingerprint, while the three other sites were more enriched in unique compounds and at the same time shared more chemicals between themselves compared to AX1.
The analysis revealed a distinct partitioning of contaminants between the aqueous and solid phases, highlighting the differences in pollutant bioavailability and persistence. This comparative visualization aids in understanding the environmental distribution of contaminants and their potential impacts on aquatic ecosystems.
Figure 10.
Heatmap of the comparative analysis of chemical composition of sediments versus pure water in four geographical locations (HD2, Hadera; YA2, Yarkon; AX1, Alexander; BS1, Beer Sheva). Blue color represents the chemicals found more abundantly in water; red color represents the chemicals found more abundantly in the sediment samples.
Considering the untargeted approaches to the analysis, we were unable to precisely identify the compounds. However, the use of exact m/z values detected for each chemical by high-resolution mass spectrometry allows them to be converted into potential chemical formulas. The results of this putative annotation suggest the distribution of specific toxic compounds across locations (Figure 11).
Figure 11.
Heatmap of putatively annotated specific toxic compound distributions across various locations. The compounds identified from the LC-MS analysis and heatmap were generated as the ratio of the area under the peaks of the samples divided by that of the blank. Locations A, B, C, D, E, F, G, and H are the HD2 water, HD2 sediment, YA2 water, YA2 sediment, AX1 water, AX1 sediment, BS1 water, and BS1 sediment, respectively.
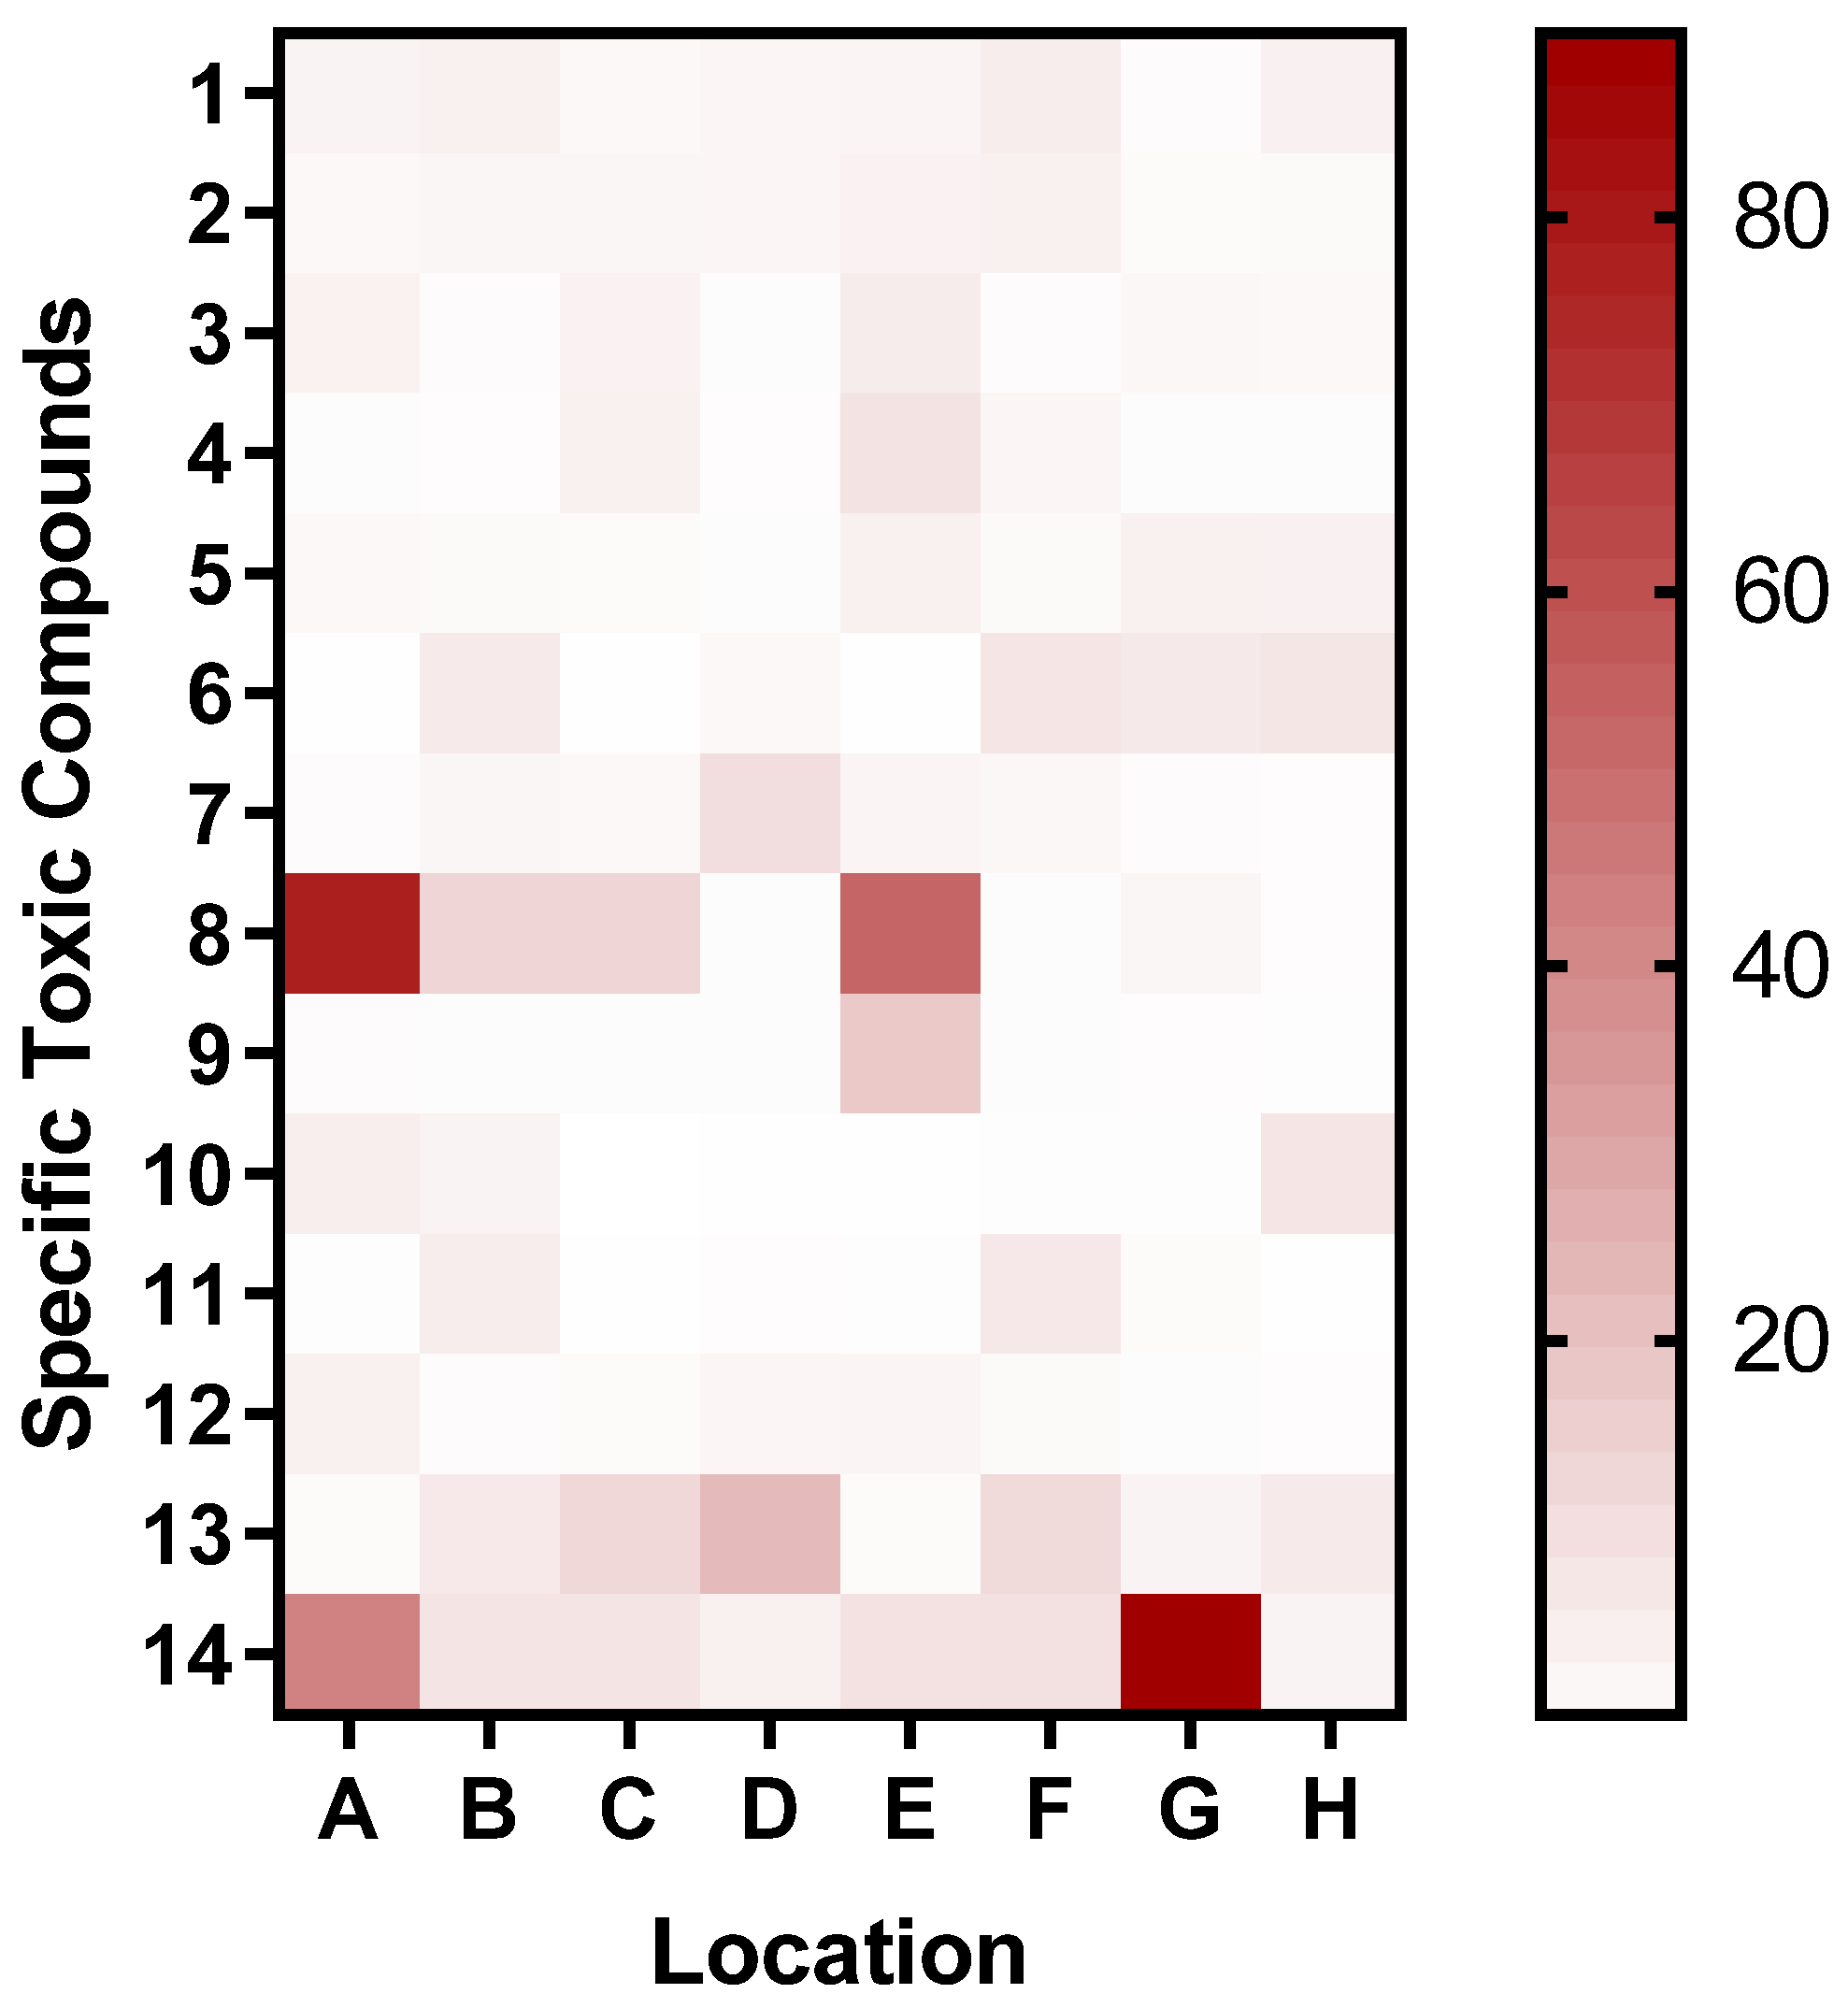
Table 2.
shows the identification of different toxic compounds listed on the heatmap above.
| Number | Name | References |
|---|---|---|
| 1 | Bis(2-ethylhexyl) amine | [32] |
| 2 | Chlorphentermine | [33,34,35] |
| 3 | Cyclohexylamine | [36,37,38,39] |
| 4 | Dichloromethane | [40,41,42] |
| 5 | Dicyclohexylamine | [43,44,45] |
| 6 | Diethanolamine | [46,47,48,49] |
| 7 | Ethephon | [50,51,52] |
| 8 | MDMA | [53,54,55] |
| 9 | N,N-Dimethylacetamide | [56,57,58] |
| 10 | N-ethylmaleimide | [59,60,61] |
| 11 | o-Toluidine | [62,63,64,65] |
| 12 | Phentermine | [66,67,68,69] |
| 13 | Phenylethyl alcohol | [70,71,72] |
| 14 | Triethanolamine | [46,48,73,74,75] |
Table 3.
Elemental distribution in water and sediment samples based on LC-MS analysis. The table presents the number of compounds in which each element was detected and its relative percentage of the total identified compounds. This comparison highlights differences in element partitioning between the aqueous and sediment phases, indicating potential variations in bioavailability and environmental persistence.
| Element | Compounds in water | Proportion in water (%) | Compounds in sediment | Proportion in sediment (%) |
|---|---|---|---|---|
| Sulfur | 299 | 40.13 | 154 | 14.41 |
| Chlorine | 279 | 37.45 | 35 | 3.27 |
| Bromine | 110 | 14.77 | 7 | 0.65 |
| Fluorine | 3 | 0.4 | 6 | 0.56 |
| Iodine | 2 | 0.27 | 1 | 0.09 |
| Selenium | 1 | 0.13 | 1 | 0.09 |
| Indium | 1 | 0.13 | 0 | 0 |
| Phosphorus | 422 | 56.64 | 198 | 18.52 |
| Nitrogen | 497 | 66.71 | 862 | 80.64 |
4. Discussion
The importance of bioavailability-based toxicity assessment has recently gained research interest because it allows a much more relevant representation of exposure to contaminants. This study presents a field-deployable bioluminescent bacteria-based toxicity assessment of water and sediment collected from potentially contaminated sites in Israel. The bioreporter E. coli (TV1061) strain used in this study is an inducible lux-biosensor with the lux genes under the control of a promoter activated in response to protein damage, producing a concentration-dependent signal output. The bioreporter was immobilized by adlayers of calcium alginate onto the tips of optical fibers, whose far end was connected to the photon counting unit for real-time luminescent counting. This system enabled direct sediment toxicity assessment as calcium alginate provided a semi-permeable membrane that allows free diffusion of solutions containing small molecules, including contaminants, excludes larger particulate matter, and retains the bioreporter bacteria immobilized within the hydrogel.
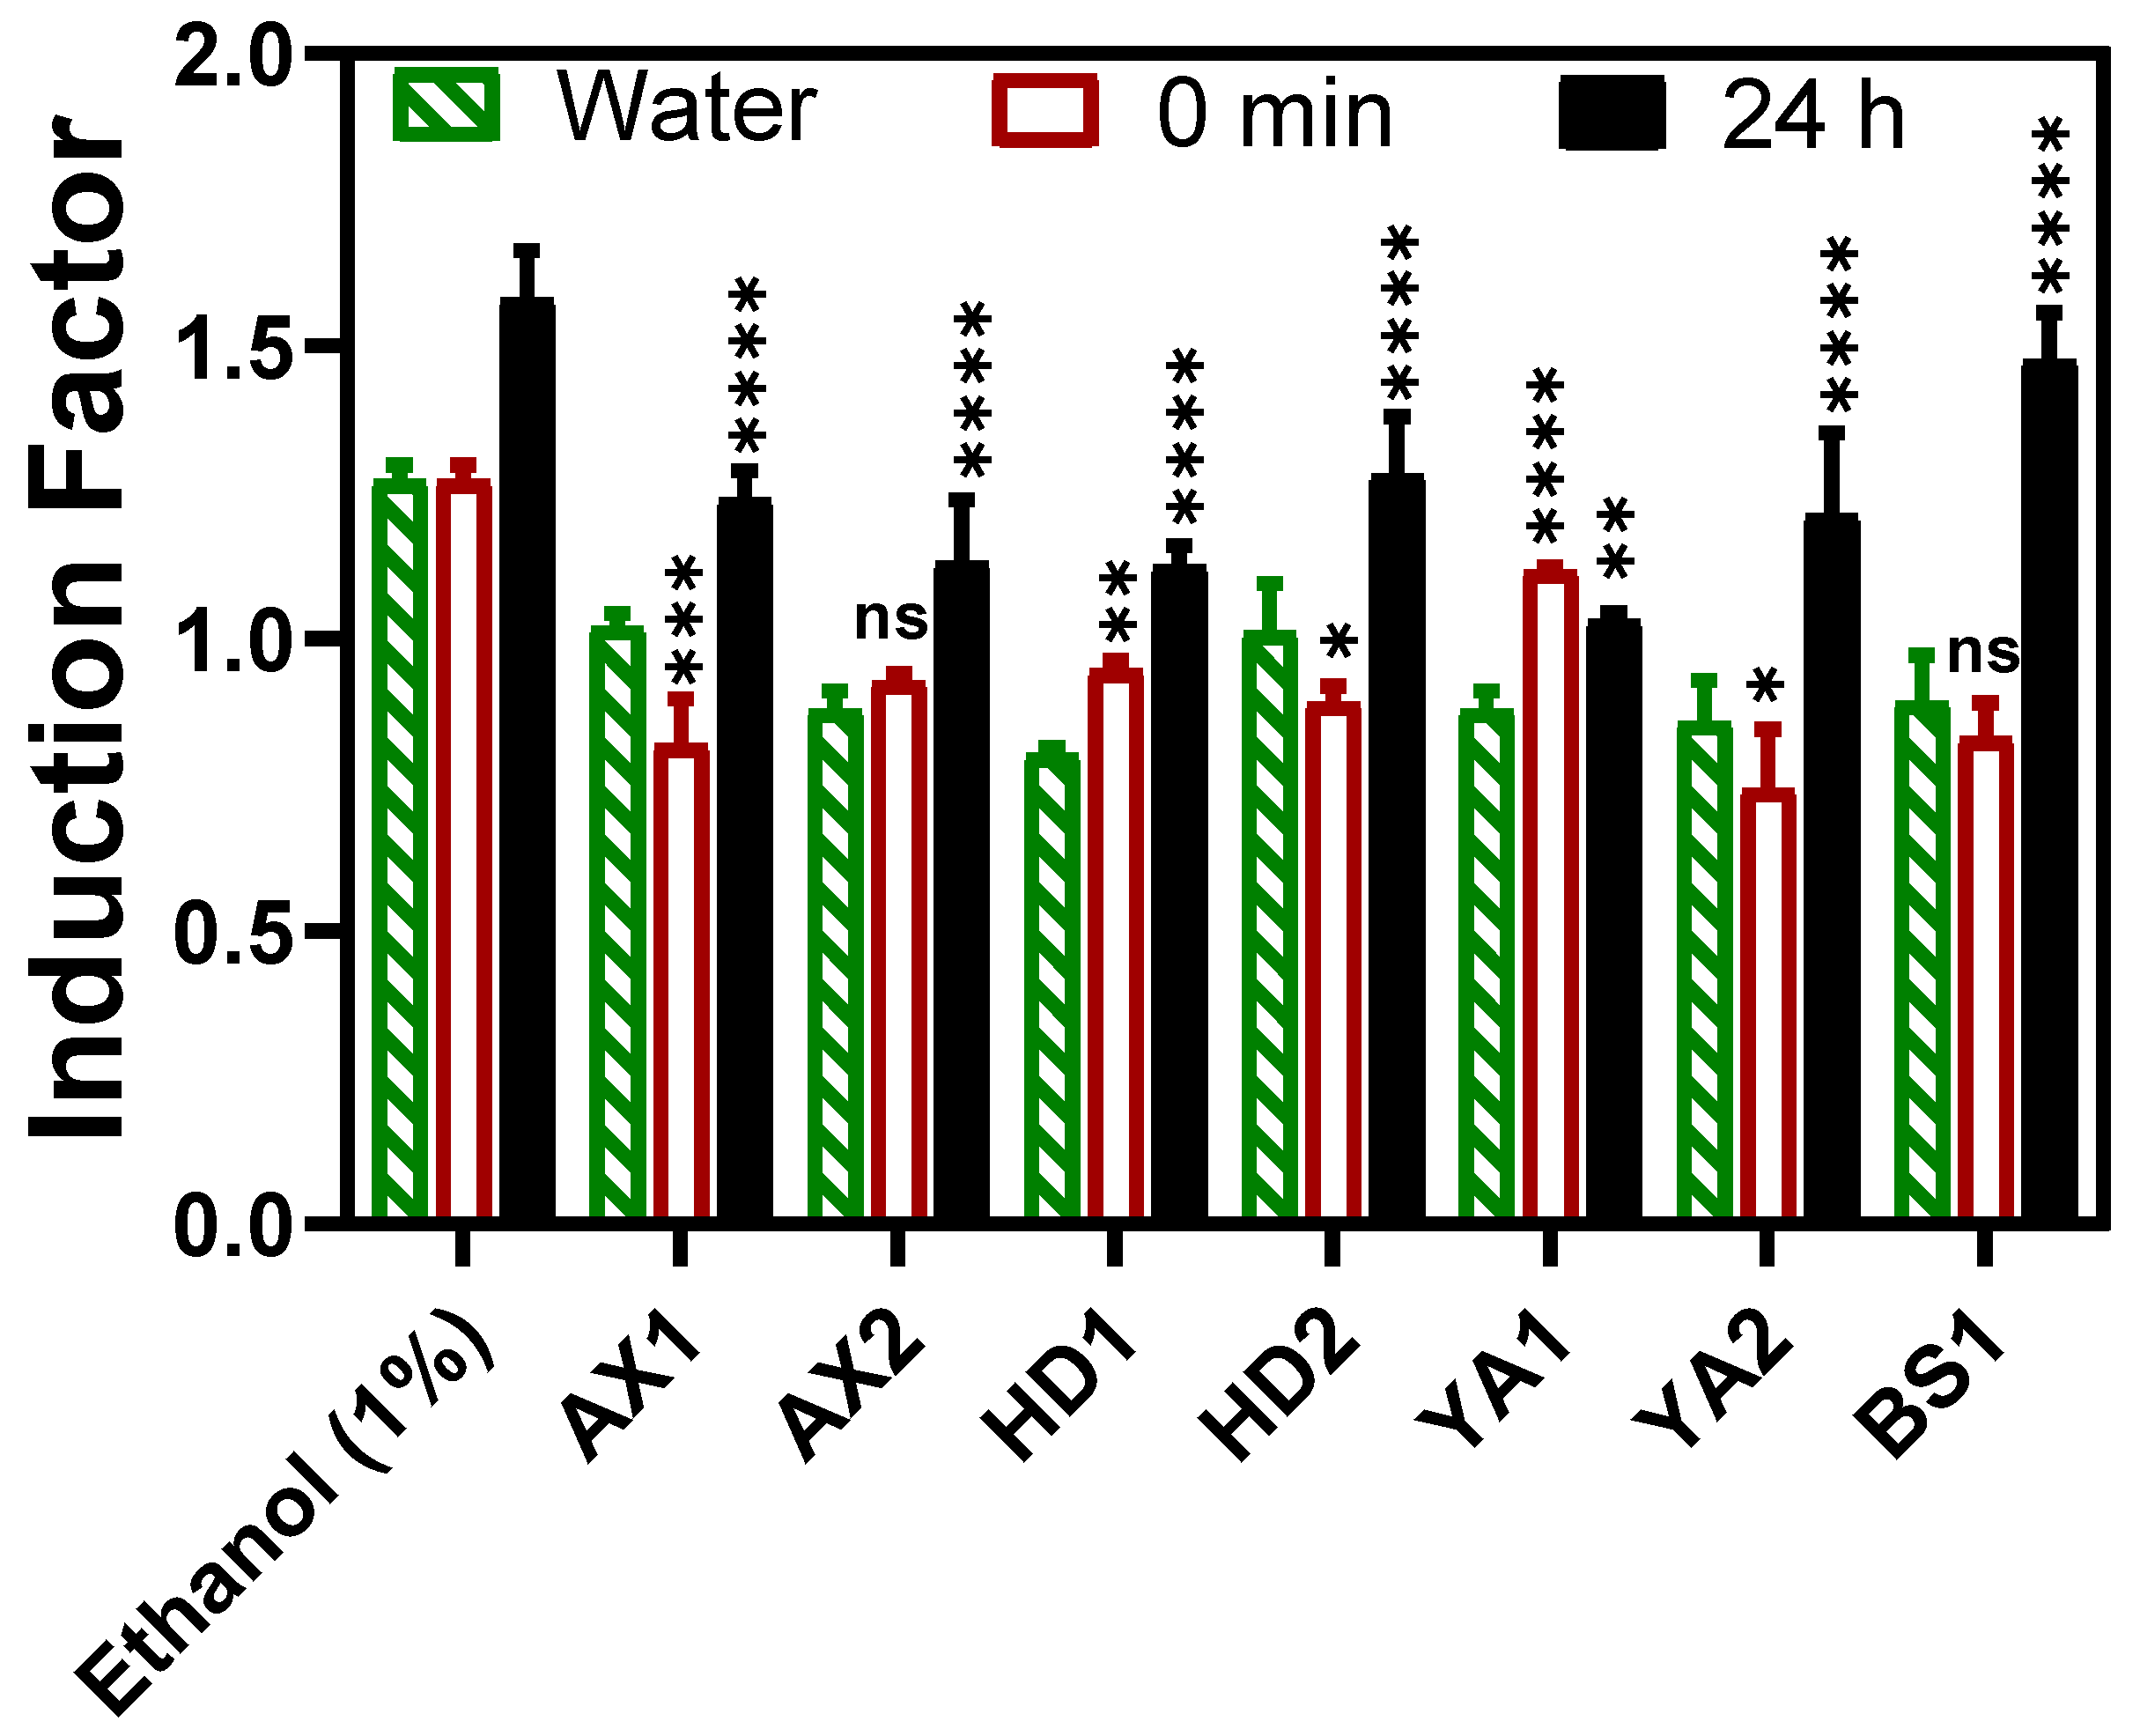
All potentially contaminated sediment and water samples used in this study induced varying degrees of bioluminescence responses, as depicted in Figure 7. Dried and wet samples were analyzed by directly dipping the calcium alginate immobilized bacteria fiber-optic into the sediment supplemented growth media (LB broth), and kinetic bioluminescent measurements were acquired. There was no statistically significant difference between the dried and wet sediment, as well as between the water samples collected at the same sample spot. Even when the direct sediment toxicity was compared with the extracted bioavailable toxicity (referred to as 0 min in Figure 7), there was no significant difference at p < 0.05. Thus, the direct sediment fiber optic-based toxicity measurement setup in this study is invaluable for deployment in real-time toxicity assessment, offering an advantage in feasibility, a non-requirement of sample extraction steps as the calcium alginate layer provided a semi-permeable barrier towards particulate matter that could potentially interfere with luminescence measurement if other techniques including luminometer were to be employed. The advantages offered by hydrogel encapsulation are shown in Figure 5 and Figure 6.
The variability in toxicity levels observed across the tested sites in Israel underscores the pressing need for site-specific environmental management strategies. Similar challenges are faced by other countries in Europe and North America, where sediment toxicity testing is commonly incorporated into environmental regulations for both prospective and retrospective assessments [76]. Such sediment toxicity assessment practices and regulatory frameworks are missing in Africa, suggesting a potential research gap in this region [76]. Our findings highlight the potential of whole-cell biosensors in guiding targeted sustainability efforts by providing rapid, on-site toxicity assessments that can be deployed in both low- and medium-income countries.
Complementary laboratory-based experiments were conducted using a microplate reader (Figure 8a and Figure 9) to determine the bioluminescent response of the bioavailable sediment extracts to corroborate the portable optical fiber setup. The bacterial growth curve was monitored by measuring the optical density at 600 nm (OD600) during the toxicity measurement to evaluate the relationship between the growth/density and biosensor response of the reporter bacteria (Figure 8b), which further confirmed that bioluminescence induction did not lead to significant physiological harm or death of the bacteria. Bioluminescence was normalized to OD600 and used to calculate the induction factor (Figure 8c,d). As can be seen, the BS1 sample produced a statistically similar (p< 0.05) bioluminescent response to that elicited by the standard inducer, showing the potential possibility of high contamination as can be seen in Figure 11. Moreover, Beer Sheva river was once listed among highly polluted rivers, including the Na’aman, Zipori, Kishon, Taninim, Hadera (HD), Alexander (AX), Yarkon (YA), Ayalon, Soreq, Lachish, and Besor streams in Israel, identifying a range of pollutants, including nonpoint agricultural runoff, urban stormwater, and discharge from industrial sites, that can be found in many streams [19]
Furthermore, chemical analyses, such as ICP-OES, revealed the presence of multiple elements in the water and sediment samples, including calcium, magnesium, potassium, sodium, and sulfur, which are often associated with industrial or agricultural run-off [19]. Notably, untargeted LC-MS analysis revealed a diverse and site-specific chemical composition, with over 9,644 compounds detected across the four representative sampling locations. Considering the untargeted approach to the analysis, we were unable to precisely identify the compounds. However, we used the exact m/z values detected for each chemical, using a high-resolution instrument, to convert them into potential molecular formulas. The results of this conversion suggested a high presence of sulfur-, chlorine-, and phosphorus-containing compounds, particularly in the river water of the collected samples, compared to the sediment extracts.
Next, we performed putative annotation of compounds found to be more abundant in sediment samples by screening the detected m/z values versus public high-resolution MS databases (ChemSpider and HMDB). This unraveled some interesting potential hints, including Adenine, Guanine, Uracil, Cytosine, and Thymine, suggesting the presence of fossils in the sediments of all four locations, although confirmation would require a targeted metabolomics approach. Additionally, LC-MS analysis detected several potentially toxic compounds at the tested sites, such as Ethephon [50,51,52], N, N-Dimethylacetamide [56,57,58], Diethanolamine, Phenylethyl alcohol, and dichloromethane (Table 2). These compounds can provide clues for increasing the I.F obtained from the biosensor. While these traditional methods, (as LC-MS and ICP-OES), offer precise quantification of specific contaminants, they fall short in assessing the bioavailable fraction of contaminants and their synergistic effects on biota. Our biosensor addresses this gap by providing rapid, on-site bioavailable toxicity data on the living system. However, challenges such as inadequate sensitivity to specific contaminants and high throughput were encountered, indicating potential areas for future improvement.
Despite these strengths, this study had some limitations. Although the fiber-optic biosensor was portable, the current setup required manual operation, careful fiber handling, and a degree of technical proficiency. Black box housing and heating mats, although functional, are not optimized for rugged or long-term outdoor use. Future improvements could include automation, wireless data logging, user-friendly interfaces, and the miniaturization of optical and electronic components. Additionally, although the use of a general stress-responsive promoter allows broad toxicity detection, employing a panel of bioreporters targeting specific stress pathways or contaminant classes could expand the sensing capabilities of the system.
5. Conclusions
This study demonstrated the development of a portable, whole-cell fiber-optic biosensor using modified E. coli for measuring sediment and water toxicity across contaminated sites in Israel. Our findings show this biosensor provides a rapid, cost-effective method for assessing environmental toxicity, bridging the gap between chemical analyses and bioassays. The calcium-alginate matrix for immobilizing reporter bacteria on fiber-optic tips has proven effective in protecting bioreporters while allowing toxicant passage, enabling accurate on-site assessment without complex sample preparation.
The biosensor’s deployment revealed variations in bacterial bioluminescent responses, reflecting diverse toxicants in the environment. This variability demonstrates the biosensor’s sensitivity in monitoring environmental pollution and ecosystem protection efforts.
The study identified challenges regarding the system’s field operation portability. Future research should focus on improving the biosensor’s design for remote environmental settings and expanding bioreporter strains to include those responsive to specific contaminants, enhancing its monitoring utility.
Supplementary Materials
The following supporting information can be downloaded at the website of this paper posted on Preprints.org, Figure S1: Representative fiber optic measurements; Table S1.2: Sample collection sites’ coordinates; Table S2.1: Sediments’ Moisture Content; Video S1: title.
Author Contributions
Concep‘tualization, R.S.M.; methodology, G.C A.B., E.E., and A.A.P; formal analysis, G.C., E.E., and A.A.P; investigation, G.C., A.A.P., E.E., and A.B.; resources, R.S.M; writing—original draft preparation, G.C, A.A.P., and K.K; writing—review and editing, G.C, A.A.P., K.K., E.E., A.B., and R.S.M; visualization, K.K., and A.A.P; supervision, R.S.M.; project administration, R.S.M.; funding acquisition, R.S.M. All the authors have read and agreed to the published version of the manuscript.
Funding
This research was funded by ‘Innovative sediment management framework for a SUstainNable DANube black SEa system (SUNDANSE),’ co-funded by the European Union, grant number 81203411.
Institutional Review Board Statement
Not applicable.
Informed Consent Statement
Not applicable
Data Availability Statement
The original results presented in this study are included in the article and supplementary materials, and further inquiries in terms of data can be found in our records in footprints (https://footprints-b291f.web.app/); authorization for access may be granted by the corresponding author (rsmarks@bgu.ac.il).
Acknowledgments
The authors wish to thank the Avram and Stella Goldstein-Goren funds for partial support and the Shimshon Belkin laboratory (Hebrew University, Jerusalem, Israel) for kindly providing the bacterial strains.
Conflicts of Interest
R.S.M. is the co-founder of footprints. The other authors have no conflicts of interest to declare.
References
- de Baat, M.L.; Wieringa, N.; Droge, S.T.; van Hall, B.G.; van der Meer, F.; Kraak, M.H.J.E.s.; technology. Smarter sediment screening: effect-based quality assessment, chemical profiling, and risk identification. 2019, 53, 14479-14488.
- Burton Jr, G.A.J.E.t.; chemistry. Assessing sediment toxicity: past, present, and future. 2013, 32, 1438-1440.
- Massei, R.; Hollert, H.; Krauss, M.; Von Tümpling, W.; Weidauer, C.; Haglund, P.; Küster, E.; Gallampois, C.; Tysklind, M.; Brack, W.J.E.S.E. Toxicity and neurotoxicity profiling of contaminated sediments from Gulf of Bothnia (Sweden): a multi-endpoint assay with Zebrafish embryos. 2019, 31, 1-12. [CrossRef]
- Borja, A.; Valencia, V.; Franco, J.; Muxika, I.; Bald, J.; Belzunce, M.; Solaun, O.J.M.P.B. The water framework directive: water alone, or in association with sediment and biota, in determining quality standards? 2004, 49, 8-11. [CrossRef]
- Den Besten, P.J.; De Deckere, E.; Babut, M.P.; Power, B.; DelValls, T.A.; Zago, C.; Oen, A.M.; Heise, S.J.J.o.s.; sediments. Biological effects-based sediment quality in ecological risk assessment for European waters. 2003, 3, 144-162. [CrossRef]
- Ivask, A.; Green, T.; Polyak, B.; Mor, A.; Kahru, A.; Virta, M.; Marks, R. Fibre-optic bacterial biosensors and their application for the analysis of bioavailable Hg and As in soils and sediments from Aznalcollar mining area in Spain. Biosensors and Bioelectronics 2007, 22, 1396-1402. [CrossRef]
- Eltzov, E.; Marks, R.S. Whole-cell aquatic biosensors. Analytical and Bioanalytical Chemistry 2011, 400, 895-913. [CrossRef]
- Anderson, B.S.; Hunt, J.W.; Phillips, B.M.; Fairey, R.; Roberts, C.A.; Oakden, J.M.; Puckett, H.M.; Stephenson, M.; Tjeerdema, R.S.; Long, E.R.J.E.T.; et al. Sediment quality in Los Angeles Harbor, USA: A triad assessment. 2001, 20, 359-370. [CrossRef]
- Jonker, M.T.; Diepens, N.J.J.E.T.; Chemistry. Improving sediment toxicity testing for very hydrophobic chemicals: Part 1—Spiking, equilibrating, and exposure quantification. 2024, 43, 1717-1727.
- Daunert, S.; Barrett, G.; Feliciano, J.S.; Shetty, R.S.; Shrestha, S.; Smith-Spencer, W.J.C.r. Genetically engineered whole-cell sensing systems: coupling biological recognition with reporter genes. 2000, 100, 2705-2738. [CrossRef]
- Trif, C.; Vunduk, J.; Parcharoen, Y.; Bualuang, A.; Marks, R.S.J.B. Bioluminescent Whole-Cell Bioreporter Bacterial Panel for Sustainable Screening and Discovery of Bioactive Compounds Derived from Mushrooms. 2024, 14, 558. [CrossRef]
- Eltzov, E.; Marks, R.S.J.I.i.; magazine, m. Parameters to consider in the construction of fiber-optic biosensors as alternative bioanalytical tools. 2009, 12, 10-16.
- Polyak, B.; Bassis, E.; Novodvorets, A.; Belkin, S.; Marks, R.S. Bioluminescent whole cell optical fiber sensor to genotoxicants: system optimization. Sensors and Actuators B: Chemical 2001, 74, 18-26. [CrossRef]
- Trif, C.; Vunduk, J.; Parcharoen, Y.; Bualuang, A.; Marks, R.S. Bioluminescent Whole-Cell Bioreporter Bacterial Panel for Sustainable Screening and Discovery of Bioactive Compounds Derived from Mushrooms. Biosensors 2024, 14, 558. [CrossRef]
- Lior, E.; Axelrod, T.; Eltzov, E.; Kushmaro, A.; Marks, R.S. Lachish river event monitored for toxicity using bioluminescent reporter organisms. The EuroBiotech Journal 2018, 2, 47-58. [CrossRef]
- Meighen, E.A.J.T.F.j. Bacterial bioluminescence: organization, regulation, and application of the lux genes. 1993, 7, 1016-1022.
- Kronfeld, J.; Navrot, J. Aspects of trace metal contamination in the coastal rivers of Israel. Water, Air, and Soil Pollution 1975, 4, 127-134. [CrossRef]
- Gitsis, A. Ha-yaʿad ha-mafṭīʾ shel ha-kharishim: Naḥal Alexander. N12 (mako) 2025/04/16 2025.
- Asaf, L.; Negaoker, N.; Tal, A.; Laronne, J.; Khateeb, N.A. Transboundary stream restoration in Israel and the Palestinian Authority. In Integrated water resources management and security in the Middle East; Springer: 2007; pp. 285-295.
- Van Dyk, T.K.; Majarian, W.R.; Konstantinov, K.B.; Young, R.M.; Dhurjati, P.S.; LaRossa, R.A. Rapid and sensitive pollutant detection by induction of heat shock gene-bioluminescence gene fusions. Applied and environmental microbiology 1994, 60, 1414-1420. [CrossRef]
- Meighen, E.A. Bacterial bioluminescence: organization, regulation, and application of the lux genes. The FASEB Journal 1993, 7, 1016-1022. [CrossRef]
- Elsemore, D.A. Insertion of promoter region::luxCDABE fusions into the Escherichia coli chromosome. Methods in molecular biology (Clifton, N.J.) 1998, 102, 97-104. [CrossRef]
- Arsène, F.; Tomoyasu, T.; Bukau, B. The heat shock response of Escherichia coli. International journal of food microbiology 2000, 55, 3-9. [CrossRef]
- Bazhenov, S.; Novoyatlova, U.; Scheglova, E.; Prazdnova, E.; Mazanko, M.; Kessenikh, A.; Kononchuk, O.; Gnuchikh, E.; Liu, Y.; Al Ebrahim, R.J.B.; et al. Bacterial lux-biosensors: Constructing, applications, and prospects. 2023, 13, 100323. [CrossRef]
- Eltzov, E.; Prilutsky, D.; Kushmaro, A.; Marks, R.; Geddes, C. Metal-enhanced bioluminescence: An approach for monitoring biological luminescent processes. Applied Physics Letters 2009, 94, 083901-083901. [CrossRef]
- Polyak, B.; Bassis, E.; Novodvorets, A.; Belkin, S.; Marks, R.S. Optical fiber bioluminescent whole-cell microbial biosensors to genotoxicants. Water Science and Technology 2000, 42, 305-311. [CrossRef]
- Paul, A.A.; Kadosh, Y.S.; Kushmaro, A.; Marks, R.S.J.B. Microbead-Encapsulated Luminescent Bioreporter Screening of P. aeruginosa via Its Secreted Quorum-Sensing Molecules. 2024, 14, 383.
- Matsunaga, T.; Sudo, H.; Takemasa, H.; Wachi, Y.; Nakamura, N. Sulfated extracellular polysaccharide production by the halophilic cyanobacterium Aphanocapsa halophytia immobilized on light-diffusing optical fibers. Applied Microbiology and Biotechnology 1996, 45, 24-27. [CrossRef]
- Carletti, M.; Sforza, E.; Batushansky, A.; Boussiba, S.; Bertucco, A.; Khozin-Goldberg, I.; Zorin, B.J.B.T. Enhanced cyanophycin accumulation in diazotrophic cyanobacterium through random mutagenesis and tailored selection under varying phosphorus availability. 2025, 419, 132018. [CrossRef]
- Team, R.D.C.J. R: A language and environment for statistical computing. 2010.
- Kolde, R.J.I.o.H.t.O.M.C.o.D.; Appearance. Package “pheatmap”: Pretty heatmaps. 2018.
- Material Safety Data Sheet: Di-(2-ethylhexyl)amine; Parchem, 415 Huguenot Street, New Rochelle, NY 10801: New Rochelle, NY, 2009/07/14 2009.
- Caldwell, J. Amphetamines and related stimulants: some introductory remarks. In Amphetamines and Related Stimulants; CRC Press: 2019; pp. 1-12.
- Mitchell, S.C.; Waring, R.H.; Smith, R.L. Curiosities in drug metabolism. Xenobiotica 2014, 44, 666-676. [CrossRef]
- Xia, Z.; Ying, G.; Hansson, A.L.; Karlsson, H.; Xie, Y.; Bergstrand, A.; DePierre, J.W.; Nässberger, L. Antidepressant-induced lipidosis with special reference to tricyclic compounds. Progress in neurobiology 2000, 60, 501-512. [CrossRef]
- Brust, K. Toxicity of aliphatic amines on the embryos of zebrafish Danio rerio-experimental studies and QSAR. 2001.
- Koppel, N.; Maini Rekdal, V.; Balskus, E.P. Chemical transformation of xenobiotics by the human gut microbiota. Science 2017, 356, eaag2770. [CrossRef]
- Chattopadhyay, S.; Raychaudhuri, U.; Chakraborty, R. Artificial sweeteners–a review. Journal of food science and technology 2014, 51, 611-621.
- Yurttas, L.; Kaya, B.; Yilmaz Cankilic, M.; Levent, S. New Cyclohexylamine-dithiocarbamate Derivatives as Potential Anti-microbial Agents. Letters in Drug Design & Discovery 2017, 14, 1308-1315. [CrossRef]
- Schlosser, P.M.; Bale, A.S.; Gibbons, C.F.; Wilkins, A.; Cooper, G.S. Human health effects of dichloromethane: key findings and scientific issues. Environmental health perspectives 2015, 123, 114-119. [CrossRef]
- Obici, S.; Otobone, F.J.; da Silva Sela, V.R.; Ishida, K.; da Silva, J.C.; Nakamura, C.V.; Cortez, D.A.G.; Audi, E.A. Preliminary toxicity study of dichloromethane extract of Kielmeyera coriacea stems in mice and rats. Journal of Ethnopharmacology 2008, 115, 131-139. [CrossRef]
- Dekant, W.; Jean, P.; Arts, J. Evaluation of the carcinogenicity of dichloromethane in rats, mice, hamsters and humans. Regulatory Toxicology and Pharmacology 2021, 120, 104858. [CrossRef]
- Westphal, G.A.; Müller, M.M.; Herting, C.; Bünger, J.; Hallier, E. Genotoxic effects of N-nitrosodicyclohexylamine in isolated human lymphocytes. Archives of toxicology 2001, 75, 118-122. [CrossRef]
- Stevanović, J.; Stanimirović, Z.; Pejin, I.I.; Lazarević, M. Monitoring of mitotic index and frequency of micronuclei in evaluation of genotoxic potential of fumagillin (dicyclohexylamine) in vivo. Acta Veterinaria-Beograd 2006, 56, 437-448.
- Casey, J.P. Amines, cycloaliphatic. Kirk-Othmer Encyclopedia of Chemical Technology 2000.
- Libralato, G.; Ghirardini, A.V.; Avezzu, F. Seawater ecotoxicity of monoethanolamine, diethanolamine and triethanolamine. Journal of hazardous materials 2010, 176, 535-539. [CrossRef]
- Abdl-Razzaq, H.T.; Al-Azzawi, M.N.A. Toxicology Study the Acute effects of Diethanolamine in Mice Blood and Liver (Oral study). Journal of International Environmental Application and Science 2017, 12, 14-23.
- Bakalova, S.; Mincheva, V.; Doycheva, A.; Groudeva, V.; Dimkov, R. Microbial toxicity of ethanolamines. Biotechnology & Biotechnological Equipment 2008, 22, 716-720.
- Fiume, M.M.; Heldreth, B.; Bergfeld, W.F.; Belsito, D.V.; Hill, R.A.; Klaassen, C.D.; Liebler, D.C.; Marks Jr, J.G.; Shank, R.C.; Slaga, T.J. Safety assessment of diethanolamine and its salts as used in cosmetics. International journal of toxicology 2017, 36, 89S-110S.
- Trakulsrichai, S.; Chuayaupakarn, K.; Tansuwannarat, P.; Rittilert, P.; Tongpoo, A.; Sriapha, C.; Wananukul, W. Ethephon Poisoning: Clinical Characteristics and Outcomes. Toxics 2025, 13, 115. [CrossRef]
- Authority, E.F.S.; Alvarez, F.; Arena, M.; Auteri, D.; Binaglia, M.; Castoldi, A.F.; Chiusolo, A.; Colagiorgi, A.; Colas, M.; Crivellente, F. Peer review of the pesticide risk assessment of the active substance ethephon. EFSA Journal 2023, 21, e07742. [CrossRef]
- Bhadoria, P.; Nagar, M.; Bharihoke, V.; Bhadoria, A.S. Ethephon, an organophosphorous, a fruit and vegetable ripener: has potential hepatotoxic effects? Journal of family medicine and primary care 2018, 7, 179–183.
- Hall, A.; Henry, J. Acute toxic effects of ‘Ecstasy’(MDMA) and related compounds: overview of pathophysiology and clinical management. BJA: British Journal of Anaesthesia 2006, 96, 678–685. [CrossRef]
- Greene, S.L.; Dargan, P.I.; O’connor, N.; Jones, A.L.; Kerins, M. Multiple toxicity from 3, 4-methylenedioxymethamphetamine (“ecstasy”). The American journal of emergency medicine 2003, 21, 121–124.
- Quinton, M.S.; Yamamoto, B.K. Causes and consequences of methamphetamine and MDMA toxicity. The AAPS journal 2006, 8, E337-E337. [CrossRef]
- Okuda, H.; Takeuchi, T.; Senoh, H.; Arito, H.; Nagano, K.; Yamamoto, S.; Matsushima, T. Developmental toxicity induced by inhalation exposure of pregnant rats to N, N-dimethylacetamide. Journal of occupational health 2006, 48, 154–160.
- Menegola, E.; Broccia, M.; Prati, M.; Giavini, E. In vitro embryotoxicity study of n, n-dimethylacetamide and its main metabolite N-monomethylacetamide. Toxicology in vitro 1999, 13, 409–415. [CrossRef]
- Nomiyama, T.; Tsukahara, T.; Hasegawa, K. Health risks of N, N-dimethylacetamide (DMAC) in humans. Journal of Occupational Health 2025, uiaf010.
- Chen, Y.; Go, Y.-M.; Pohl, J.; Reed, M.; Cai, J.; Jones, D.P. Increased mitochondrial thioredoxin 2 potentiates N-ethylmaleimide-induced cytotoxicity. Chemical research in toxicology 2008, 21, 1205–1210. [CrossRef]
- Bowes, T.J.; Gupta, R.S. Induction of mitochondrial fusion by cysteine-alkylators ethacrynic acid and N-ethylmaleimide. Journal of cellular physiology 2005, 202, 796–804. [CrossRef]
- Gu, M.B.; Mitchell, R.J.; Kim, B.C.J.B. Whole-cell-based biosensors for environmental biomonitoring and application. 2004, 269-305.
- Nos, C. o-Toluidine and o-Toluidine. Report on Carcinogens: Carcinogen Profiles 2002, 10, 242.
- Toyoda, T.; Kobayashi, T.; Miyoshi, N.; Matsushita, K.; Akane, H.; Morikawa, T.; Ogawa, K. Toxicological effects of two metabolites derived from o-toluidine and o-anisidine after 28-day oral administration to rats. The Journal of Toxicological Sciences 2022, 47, 457–466. [CrossRef]
- Ochsmann, E. o-Toluidine–Evaluation of a BAR. Assessment Values in Biological Material–Translation of the German version from 2010.
- English, J.C.; Bhat, V.S.; Ball, G.L.; McLellan, C.J. Establishing a total allowable concentration of o-toluidine in drinking water incorporating early lifestage exposure and susceptibility. Regulatory Toxicology and Pharmacology 2012, 64, 269–284. [CrossRef]
- Adegunsoye, A.; Akhter, R.; Rachshtut, M.; Green, E. 856: PULMONARY INFARCTION: AN UNUSUAL COMPLICATION OF PHENTERMINE/PHENDIMETRAZINE FOR WEIGHT LOSS. Critical Care Medicine 2011, 39.
- Yen, M.; Ewald, M.B. Toxicity of Weight Loss Agents. Journal of Medical Toxicology 2012, 8, 145–152. [CrossRef]
- Lim, S.; Rogers, L.K.; Tessler, O.; Mundinger, G.S.; Rogers, C.; Lau, F.H. Phentermine: a systematic review for plastic and reconstructive surgeons. Annals of plastic surgery 2018, 81, 503–507. [CrossRef]
- Steidl, K.E.; Darko, W.; Probst, L.A.; Noviasky, J.A.; Nasser, S. Rhabdomyolysis associated with phentermine. American Journal of Health-System Pharmacy 2010, 67, 1929–1932.
- Yu-han, L.; Jing-jing, M.; Shou-xiang, W.; Lu-qing, P.; Yu-fei, L.; Jiang-yue, W. Acute toxicity and species sensitivity distribution of p-chloroaniline, 1, 2-dichloroethane, butyl benzyl phthalate and 1-phenylethyl alcohol on two marine bivalves. Chinese Journal of MARINE ENVIRONMENTAL SCIENCE 2020, 39, 732–737.
- Politano, V.T.; Diener, R.M.; Christian, M.S.; Hoberman, A.M.; Palmer, A.; Ritacco, G.; Adams, T.B.; Api, A.M. Oral and dermal developmental toxicity studies of phenylethyl alcohol in rats. International journal of toxicology 2013, 32, 32–38. [CrossRef]
- Scognamiglio, J.; Jones, L.; Letizia, C.; Api, A. Fragrance material review on phenylethyl alcohol. Food and chemical toxicology 2012, 50, S224-S239.
- Gamer, A.O.; Rossbacher, R.; Kaufmann, W.; van Ravenzwaay, B. The Inhalation toxicity of di- and triethanolamine upon repeated exposure. Food and Chemical Toxicology 2008, 46, 2173–2183. [CrossRef]
- Service, P.H.; Services, H.; Program, N.T. NTP toxicology and carcinogenesis studies of triethanolamine (Cas No. 102-71-6) in B6C3F1 mice (dermal studies). National Toxicology Program technical report series 2004, 5-163.
- Stott, W.; Radtke, B.; Linscombe, V.; Mar, M.-H.; Zeisel, S. Evaluation of the potential of triethanolamine to alter hepatic choline levels in female B6C3F1 mice. Toxicological Sciences 2004, 79, 242–247. [CrossRef]
- Leppanen, M.T.; Sourisseau, S.; Burgess, R.M.; Simpson, S.L.; Sibley, P.; Jonker, M.T.J.E.T.; Chemistry. Sediment toxicity tests: A critical review of their use in environmental regulations. 2024, 43, 1697–1716. [CrossRef]
Figure 1.
Sample collection. A) Sampling sites across Israel; B) Hadera (HD2) Stream; C) Alexander (AX1) River; D) Yarkon (YA2) River; E) Beersheba (BS1) Stream. The coordinates are found in the supplementary section Table S1).
Figure 1.
Sample collection. A) Sampling sites across Israel; B) Hadera (HD2) Stream; C) Alexander (AX1) River; D) Yarkon (YA2) River; E) Beersheba (BS1) Stream. The coordinates are found in the supplementary section Table S1).
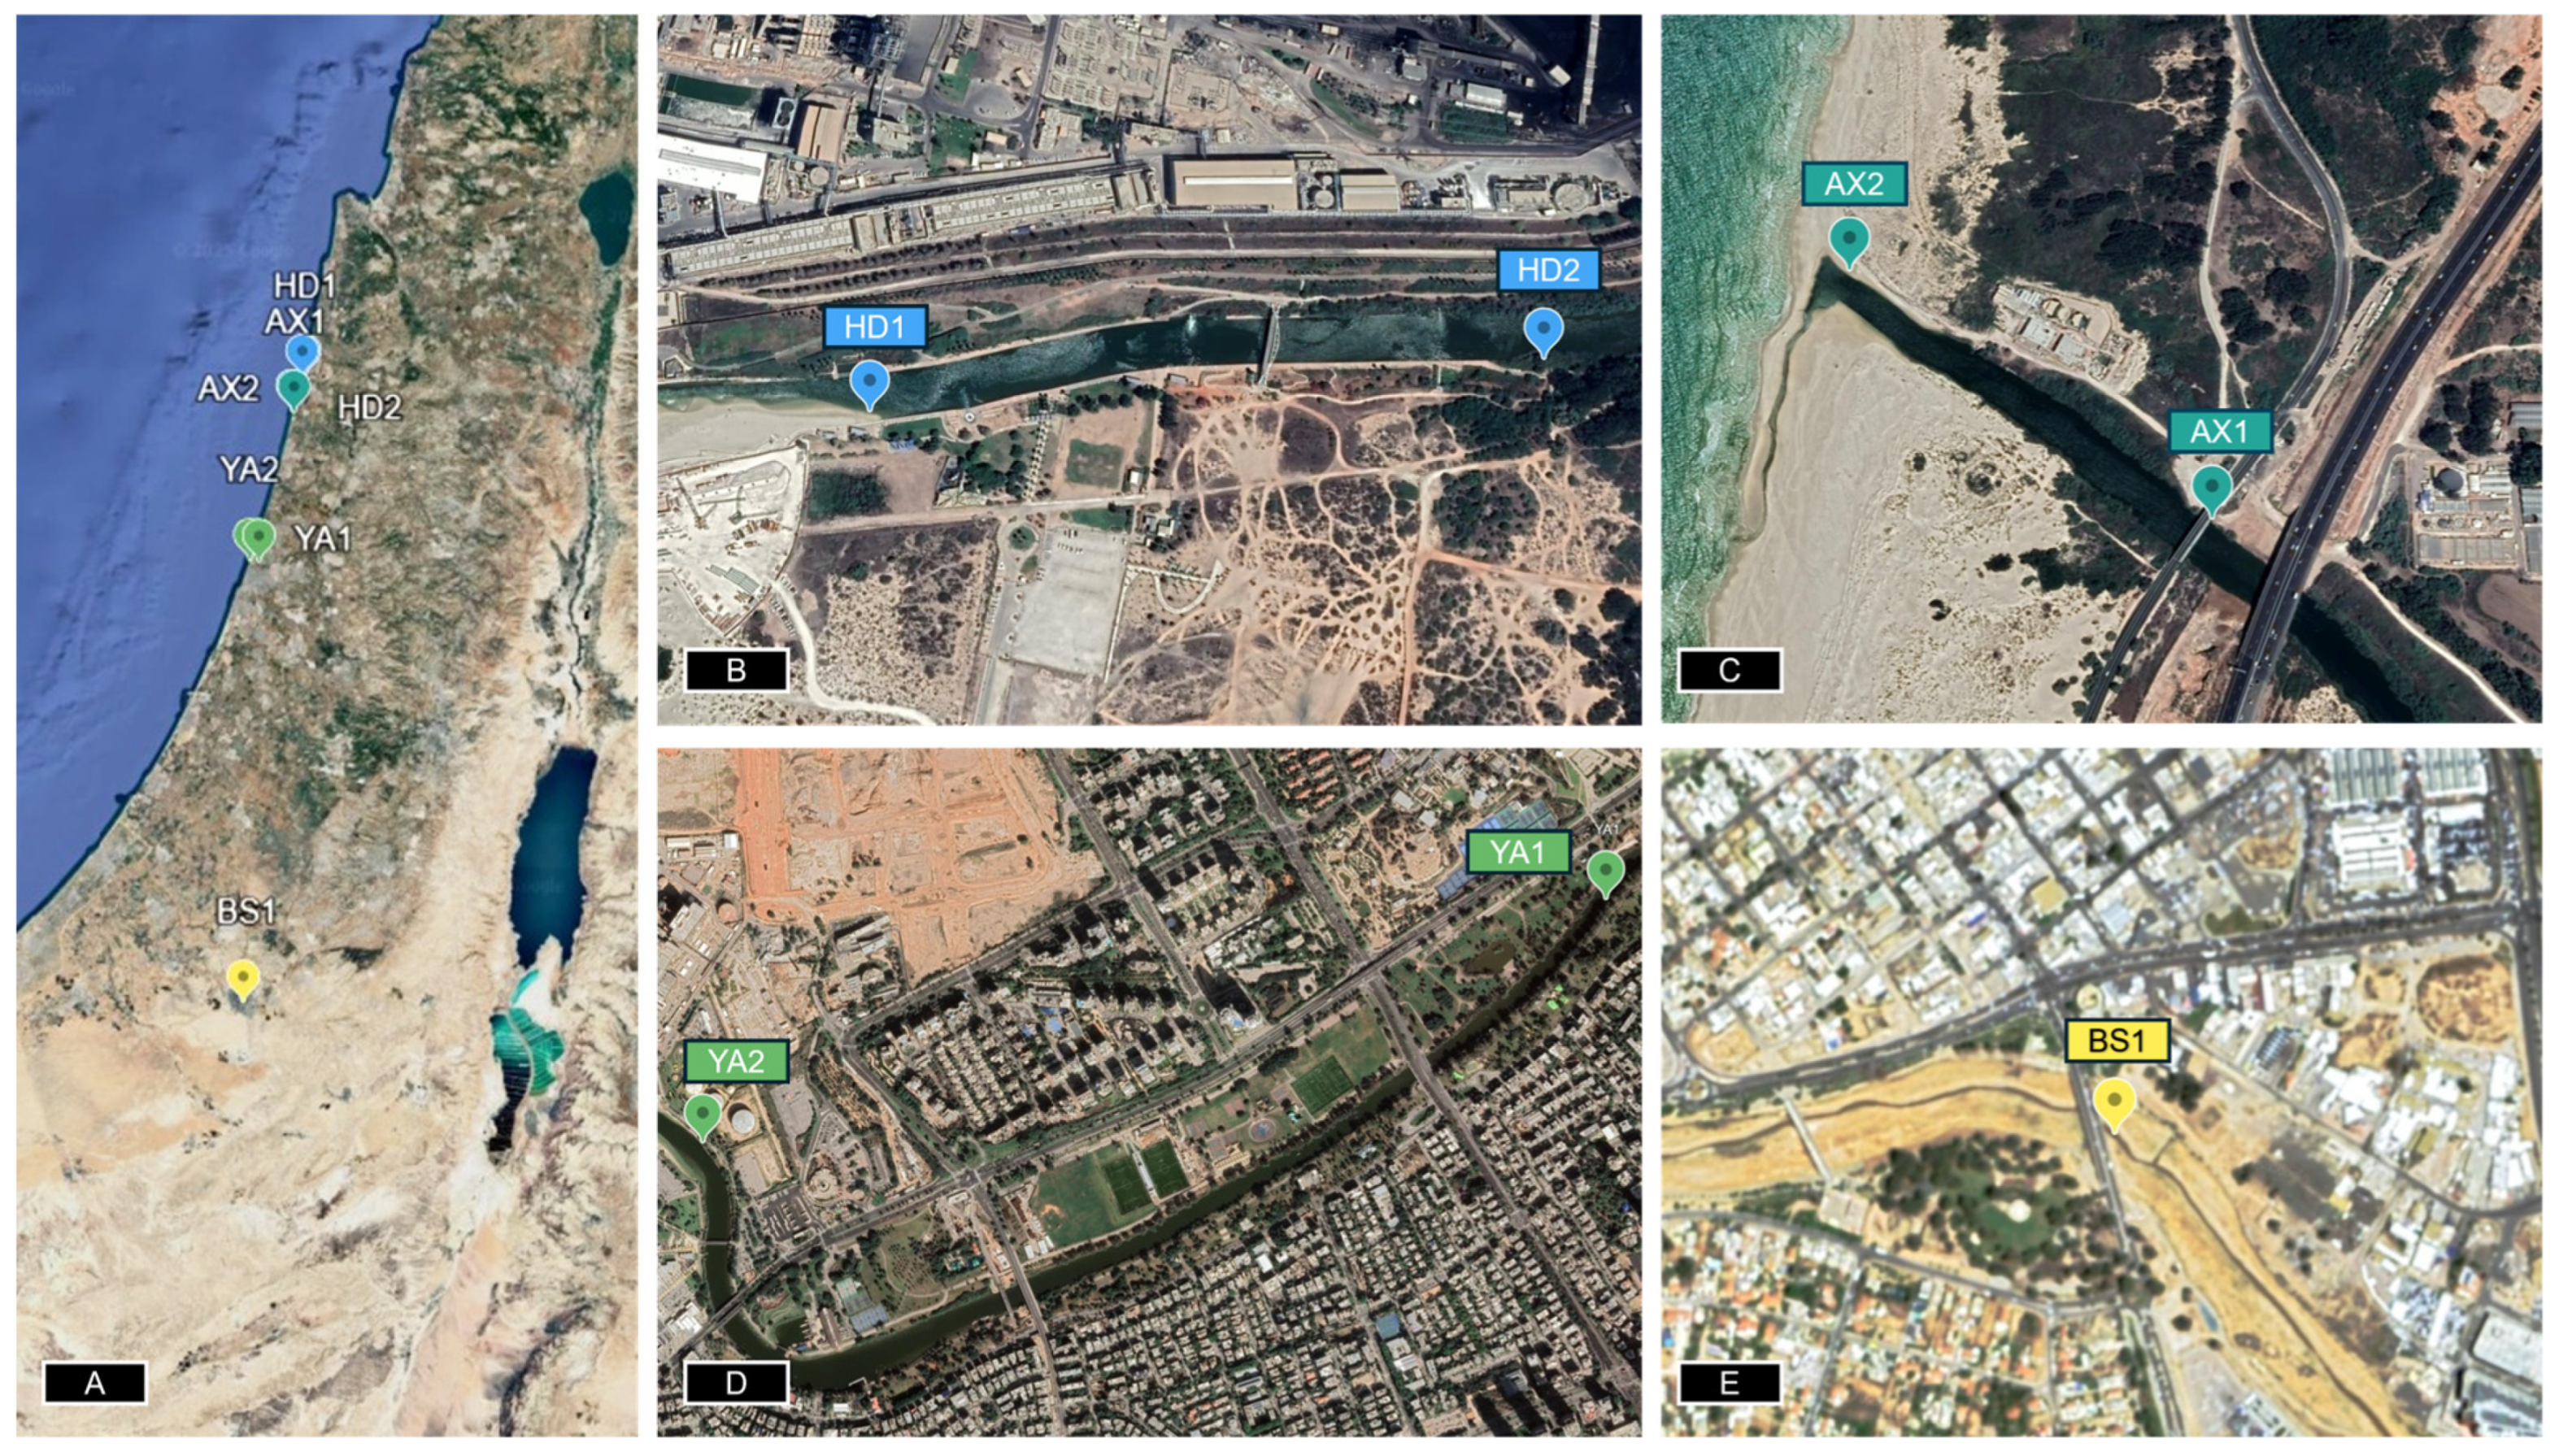
Figure 2.
human activity at the potentially polluted sites. A) Hadera Stream fishing alongside a sign that says “Danger - risk of contamination, bathing, sailing, and fishing is strictly prohibited”; B) Sailing at Alexander River.
Figure 2.
human activity at the potentially polluted sites. A) Hadera Stream fishing alongside a sign that says “Danger - risk of contamination, bathing, sailing, and fishing is strictly prohibited”; B) Sailing at Alexander River.
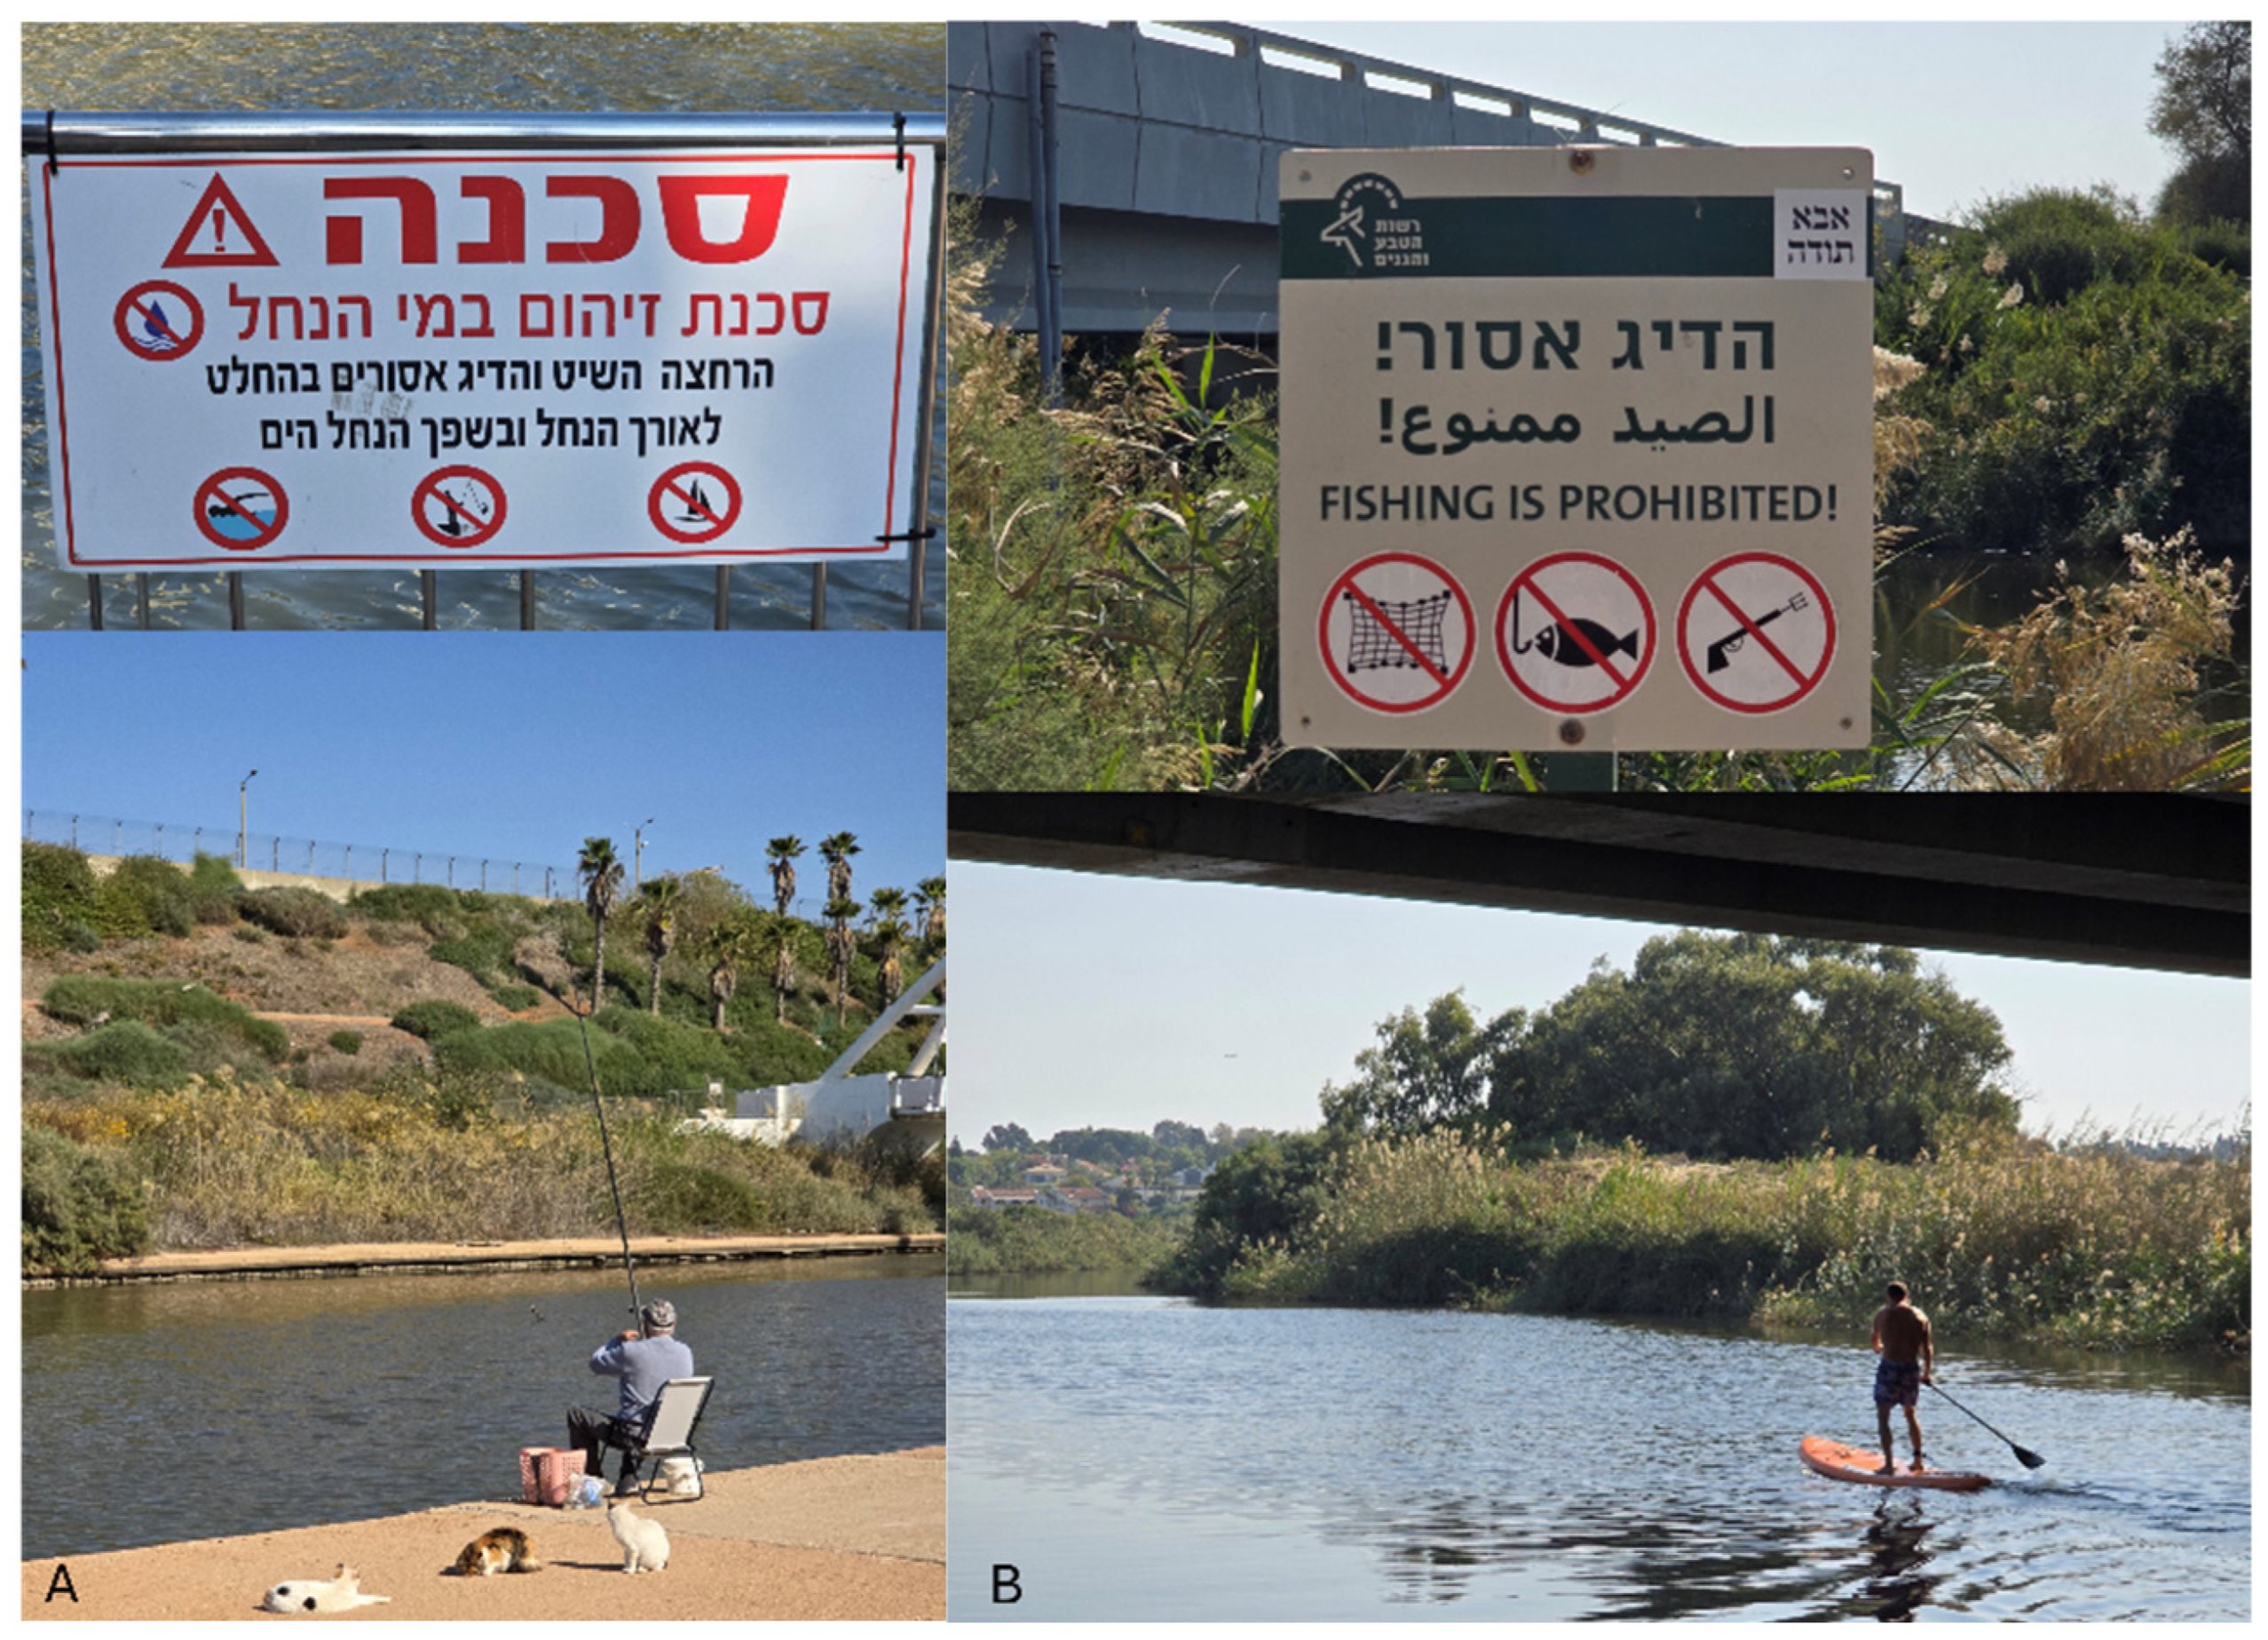
Figure 3.
Experimental workflow for this study. Water and sediment samples were evaluated using both a plate reader and a field-enabled optical fiber whole-cell biosensor, in combination with conventional methods. (Created in BioRender. Marks, R. (2025) https://BioRender.com/9yr6jqi accessed on 20th February 2025).
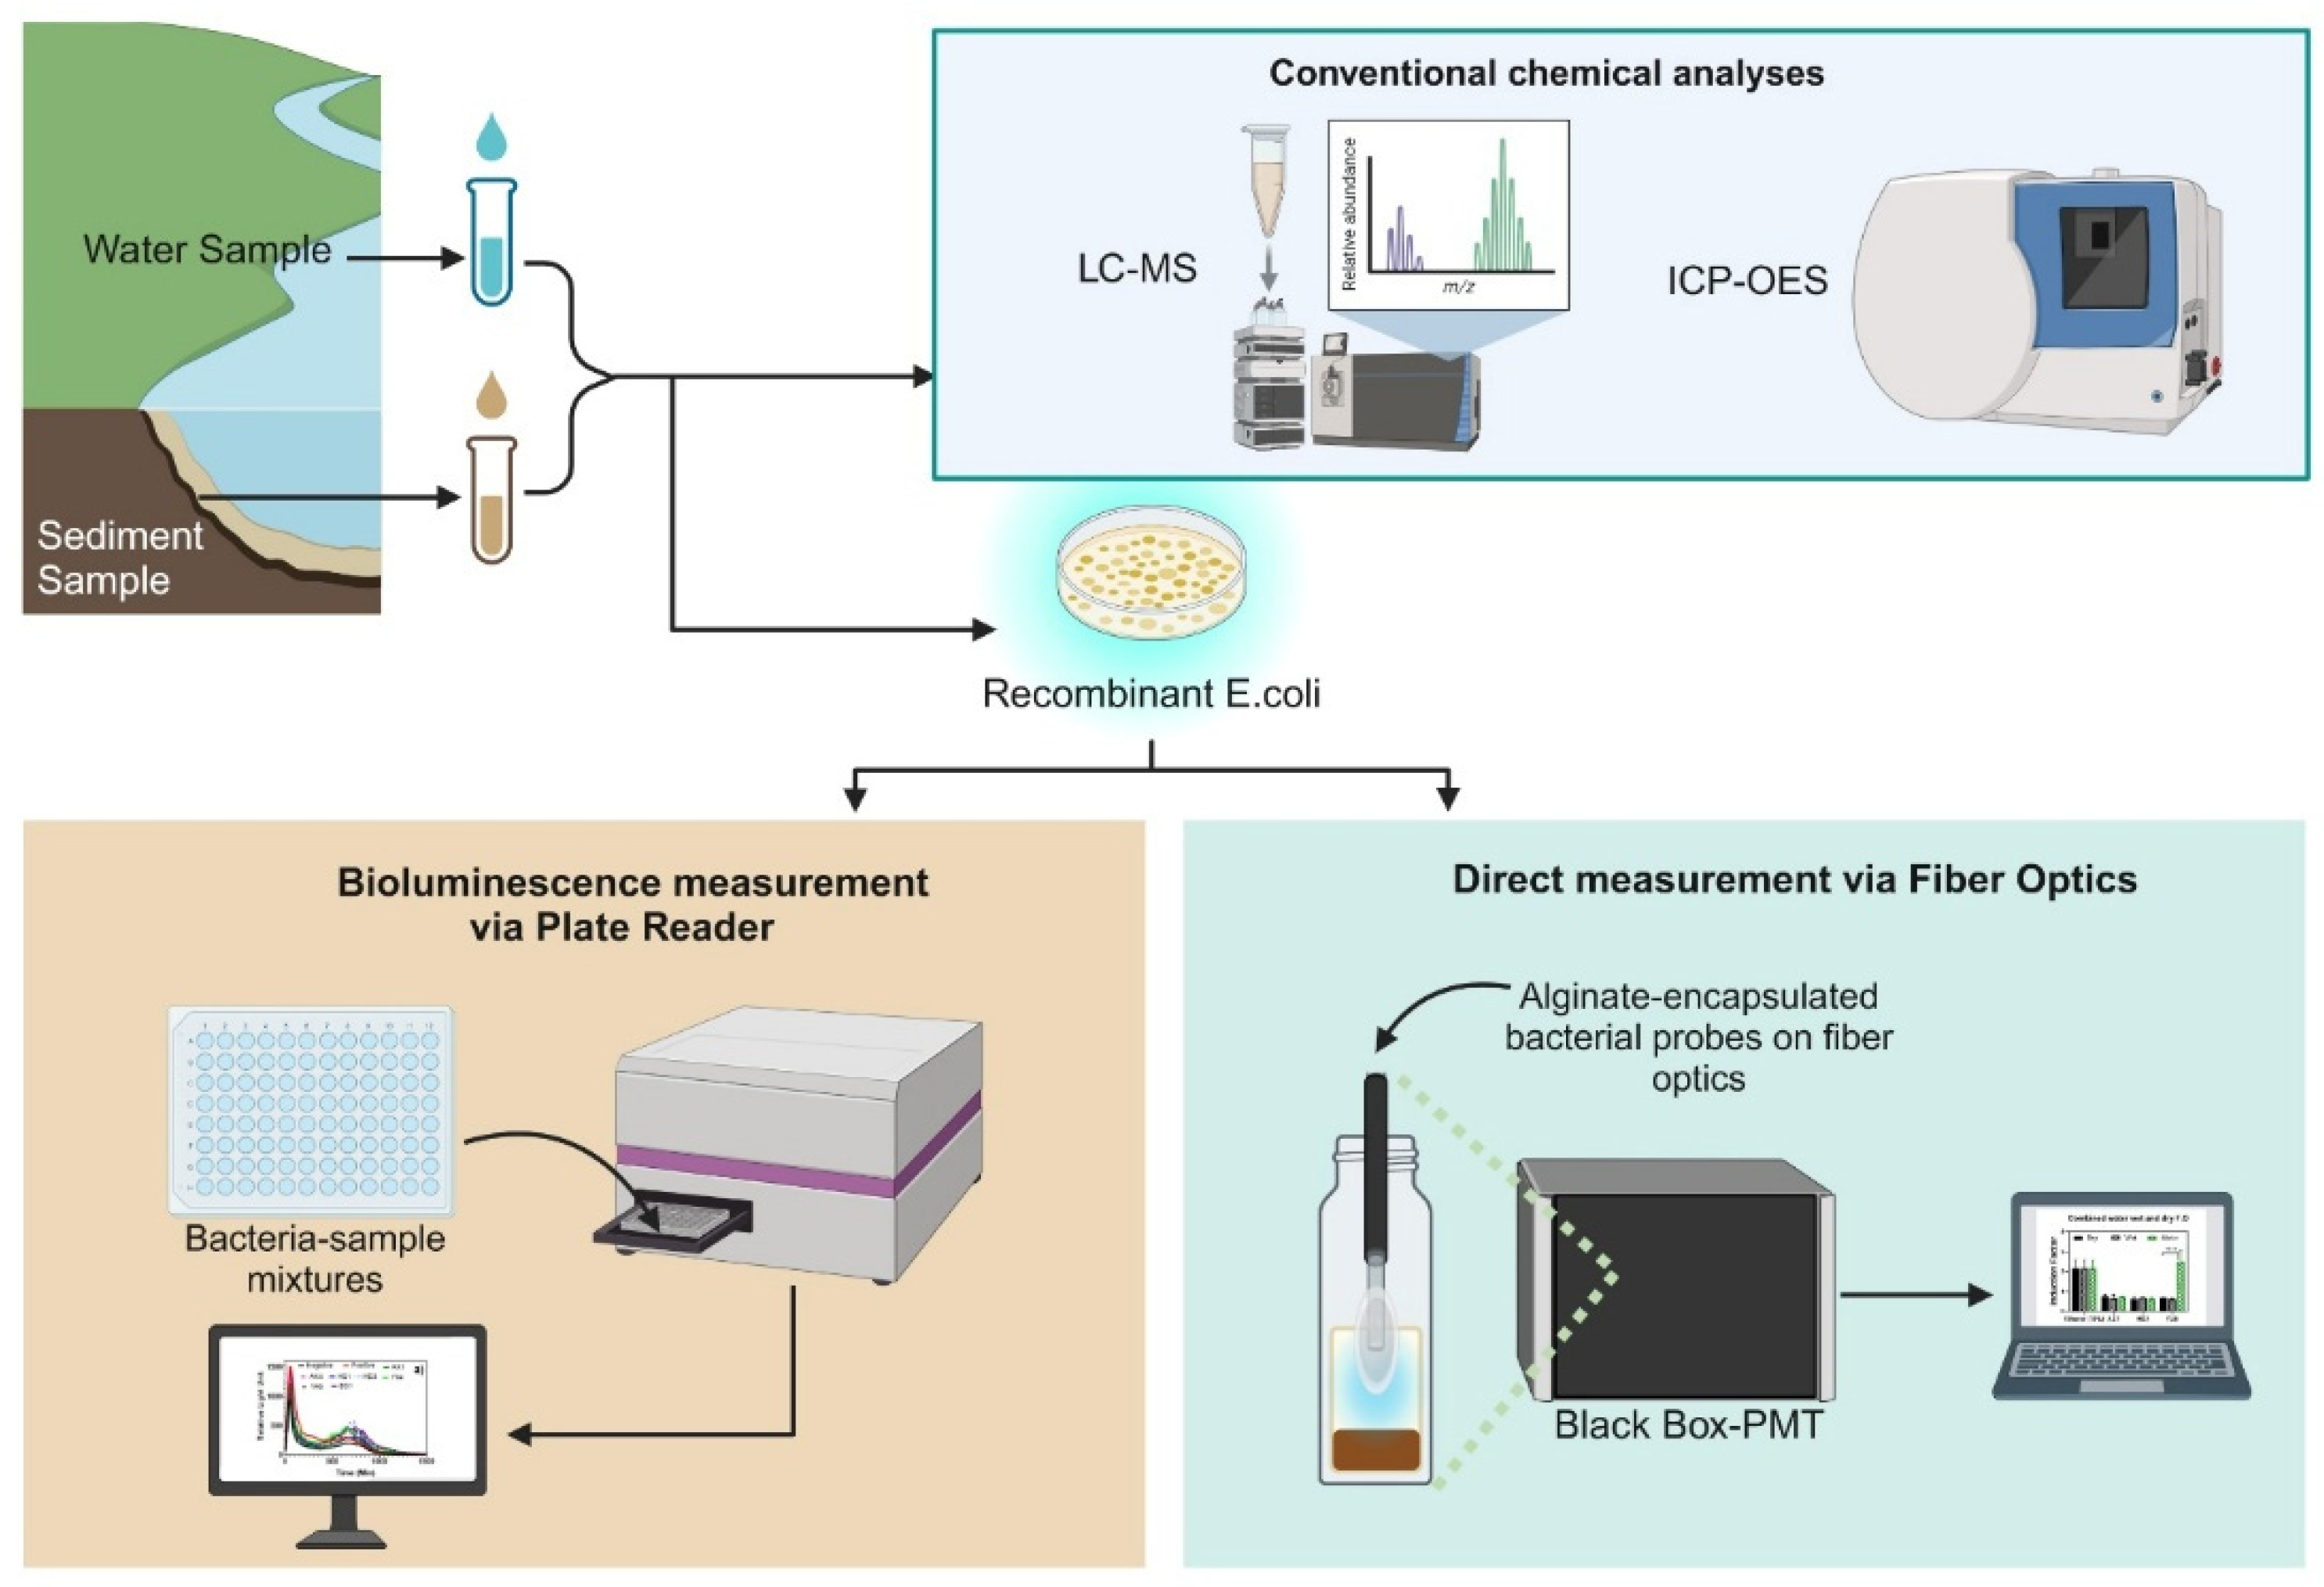
Figure 4.
Mechanism of bioluminescence toxicity measurements. A toxicant penetrates the cell wall and binds to an intracellular heat shock receptor, initiating a signal cascade to the grpE promoter. This promoter facilitates the transcription of the reporter genes (luxCDABE), leading to the induction of lux gene expression. Consequently, luciferase synthesis increases, resulting in a detectable luminescence signal. The toxicant causes protein damage, which activates specialized regulatory proteins that simultaneously trigger the stress-response genes and the lux genes. When the stimulus is sufficiently harmful to impair cellular function and disrupt metabolic processes, luminescence decreases due to reduced luciferase synthesis and substrate depletion (created with biorender.com accessed on 20th February 2025).
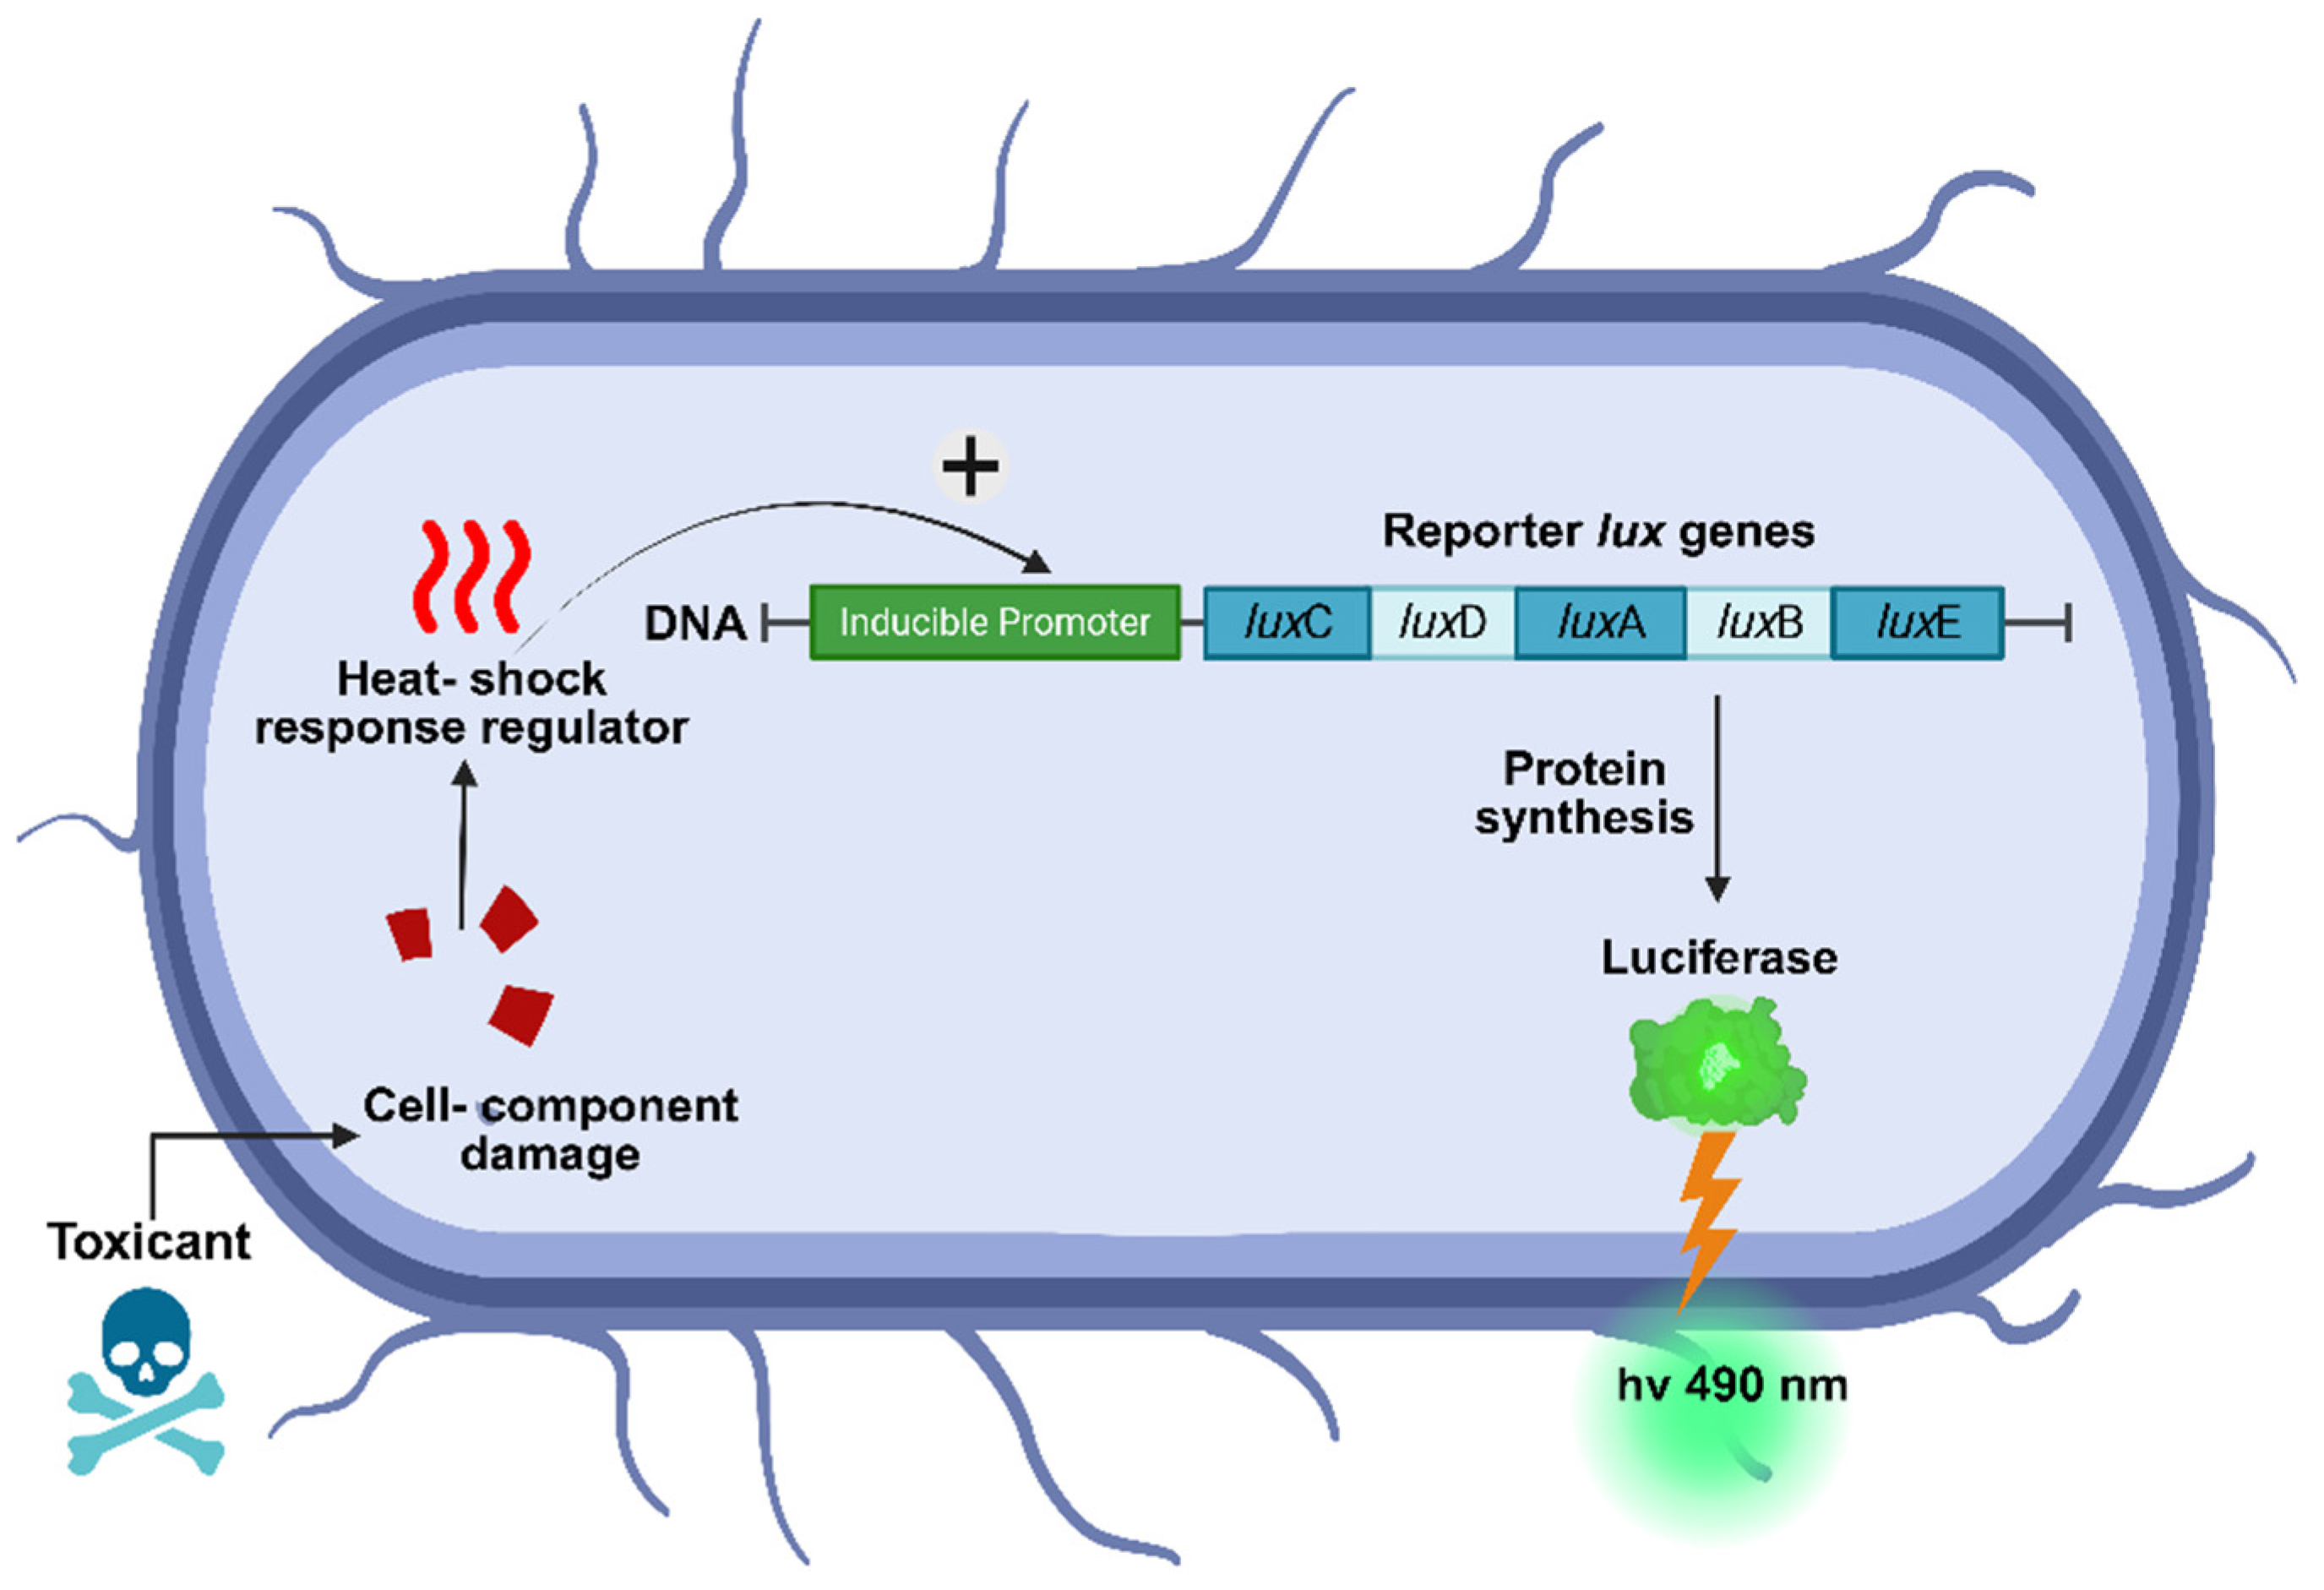
Figure 5.
Direct testing using the fiber optics black box. A) Dry sediment samples; B) Sediment samples in LB broth and CaCl2; C) Probe immersed in solution B prior to measurements; D) Sample following measurement, and E) Probe outside of the vial after measurements. The appearance of the biosensors probe during water measurement is shown in Figure S1 in the supplementary material.
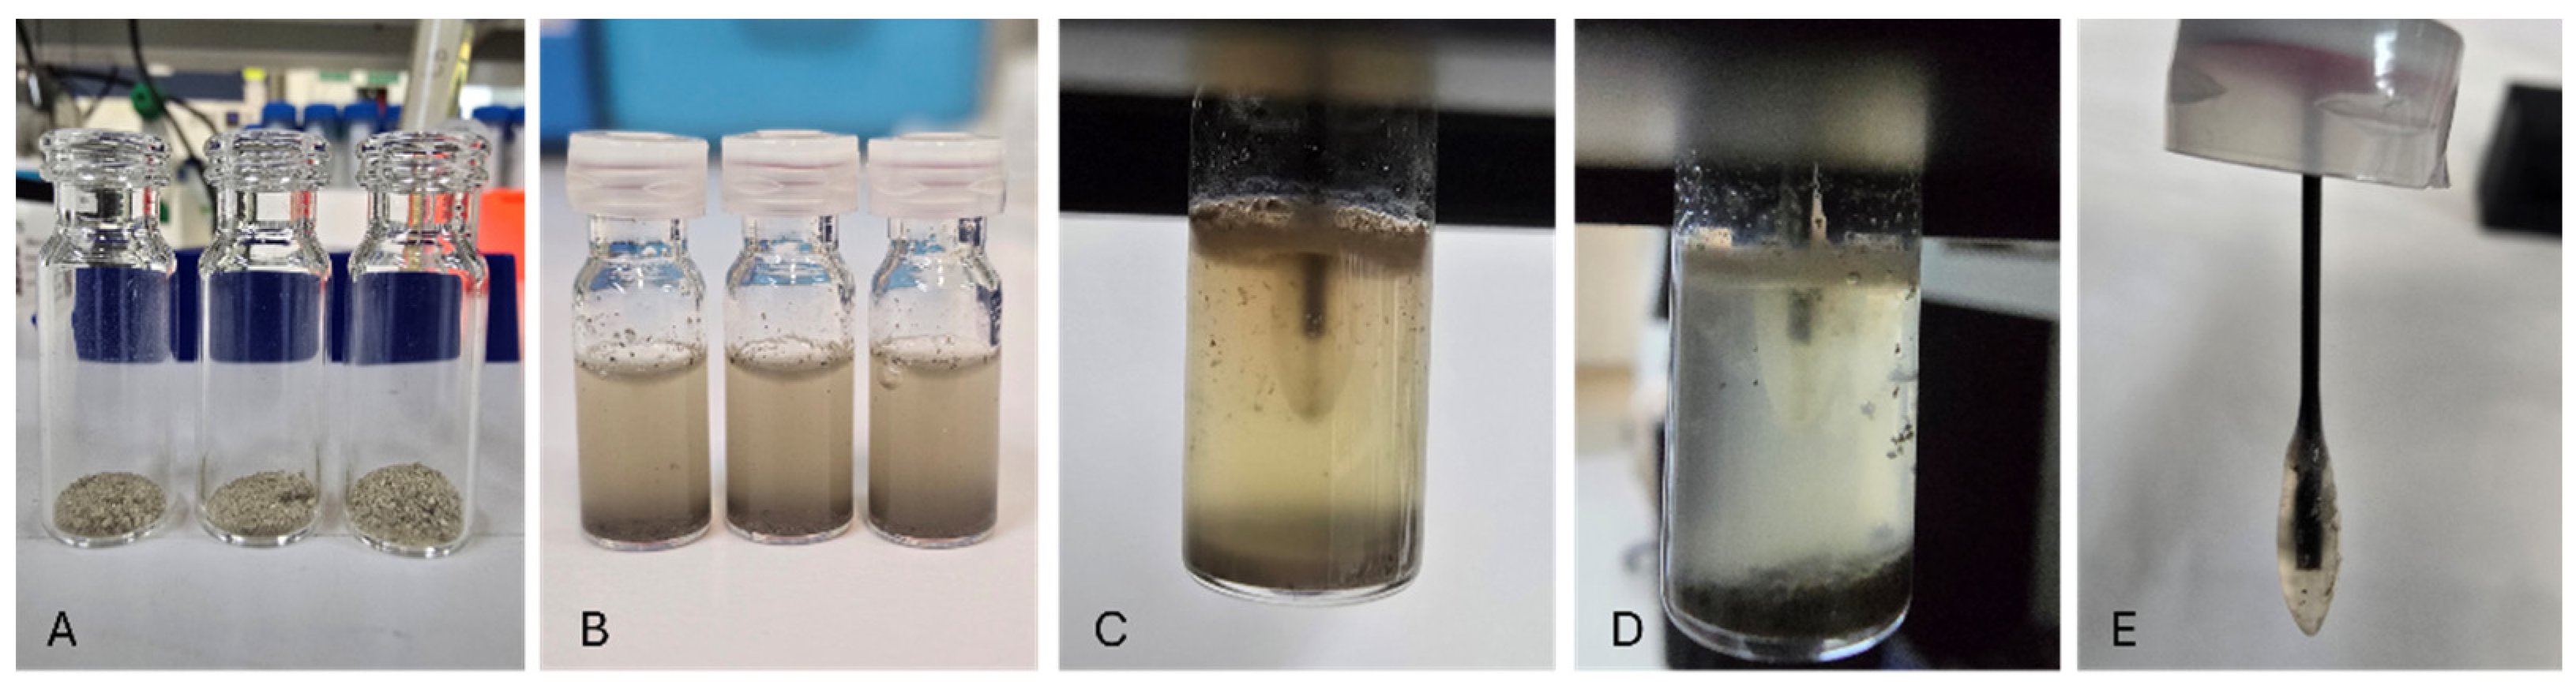
Figure 6.
Set-up of fiber-optic probe. A) encapsulated in alginate bacteria and B) inserted into the black box instrument.
Figure 6.
Set-up of fiber-optic probe. A) encapsulated in alginate bacteria and B) inserted into the black box instrument.
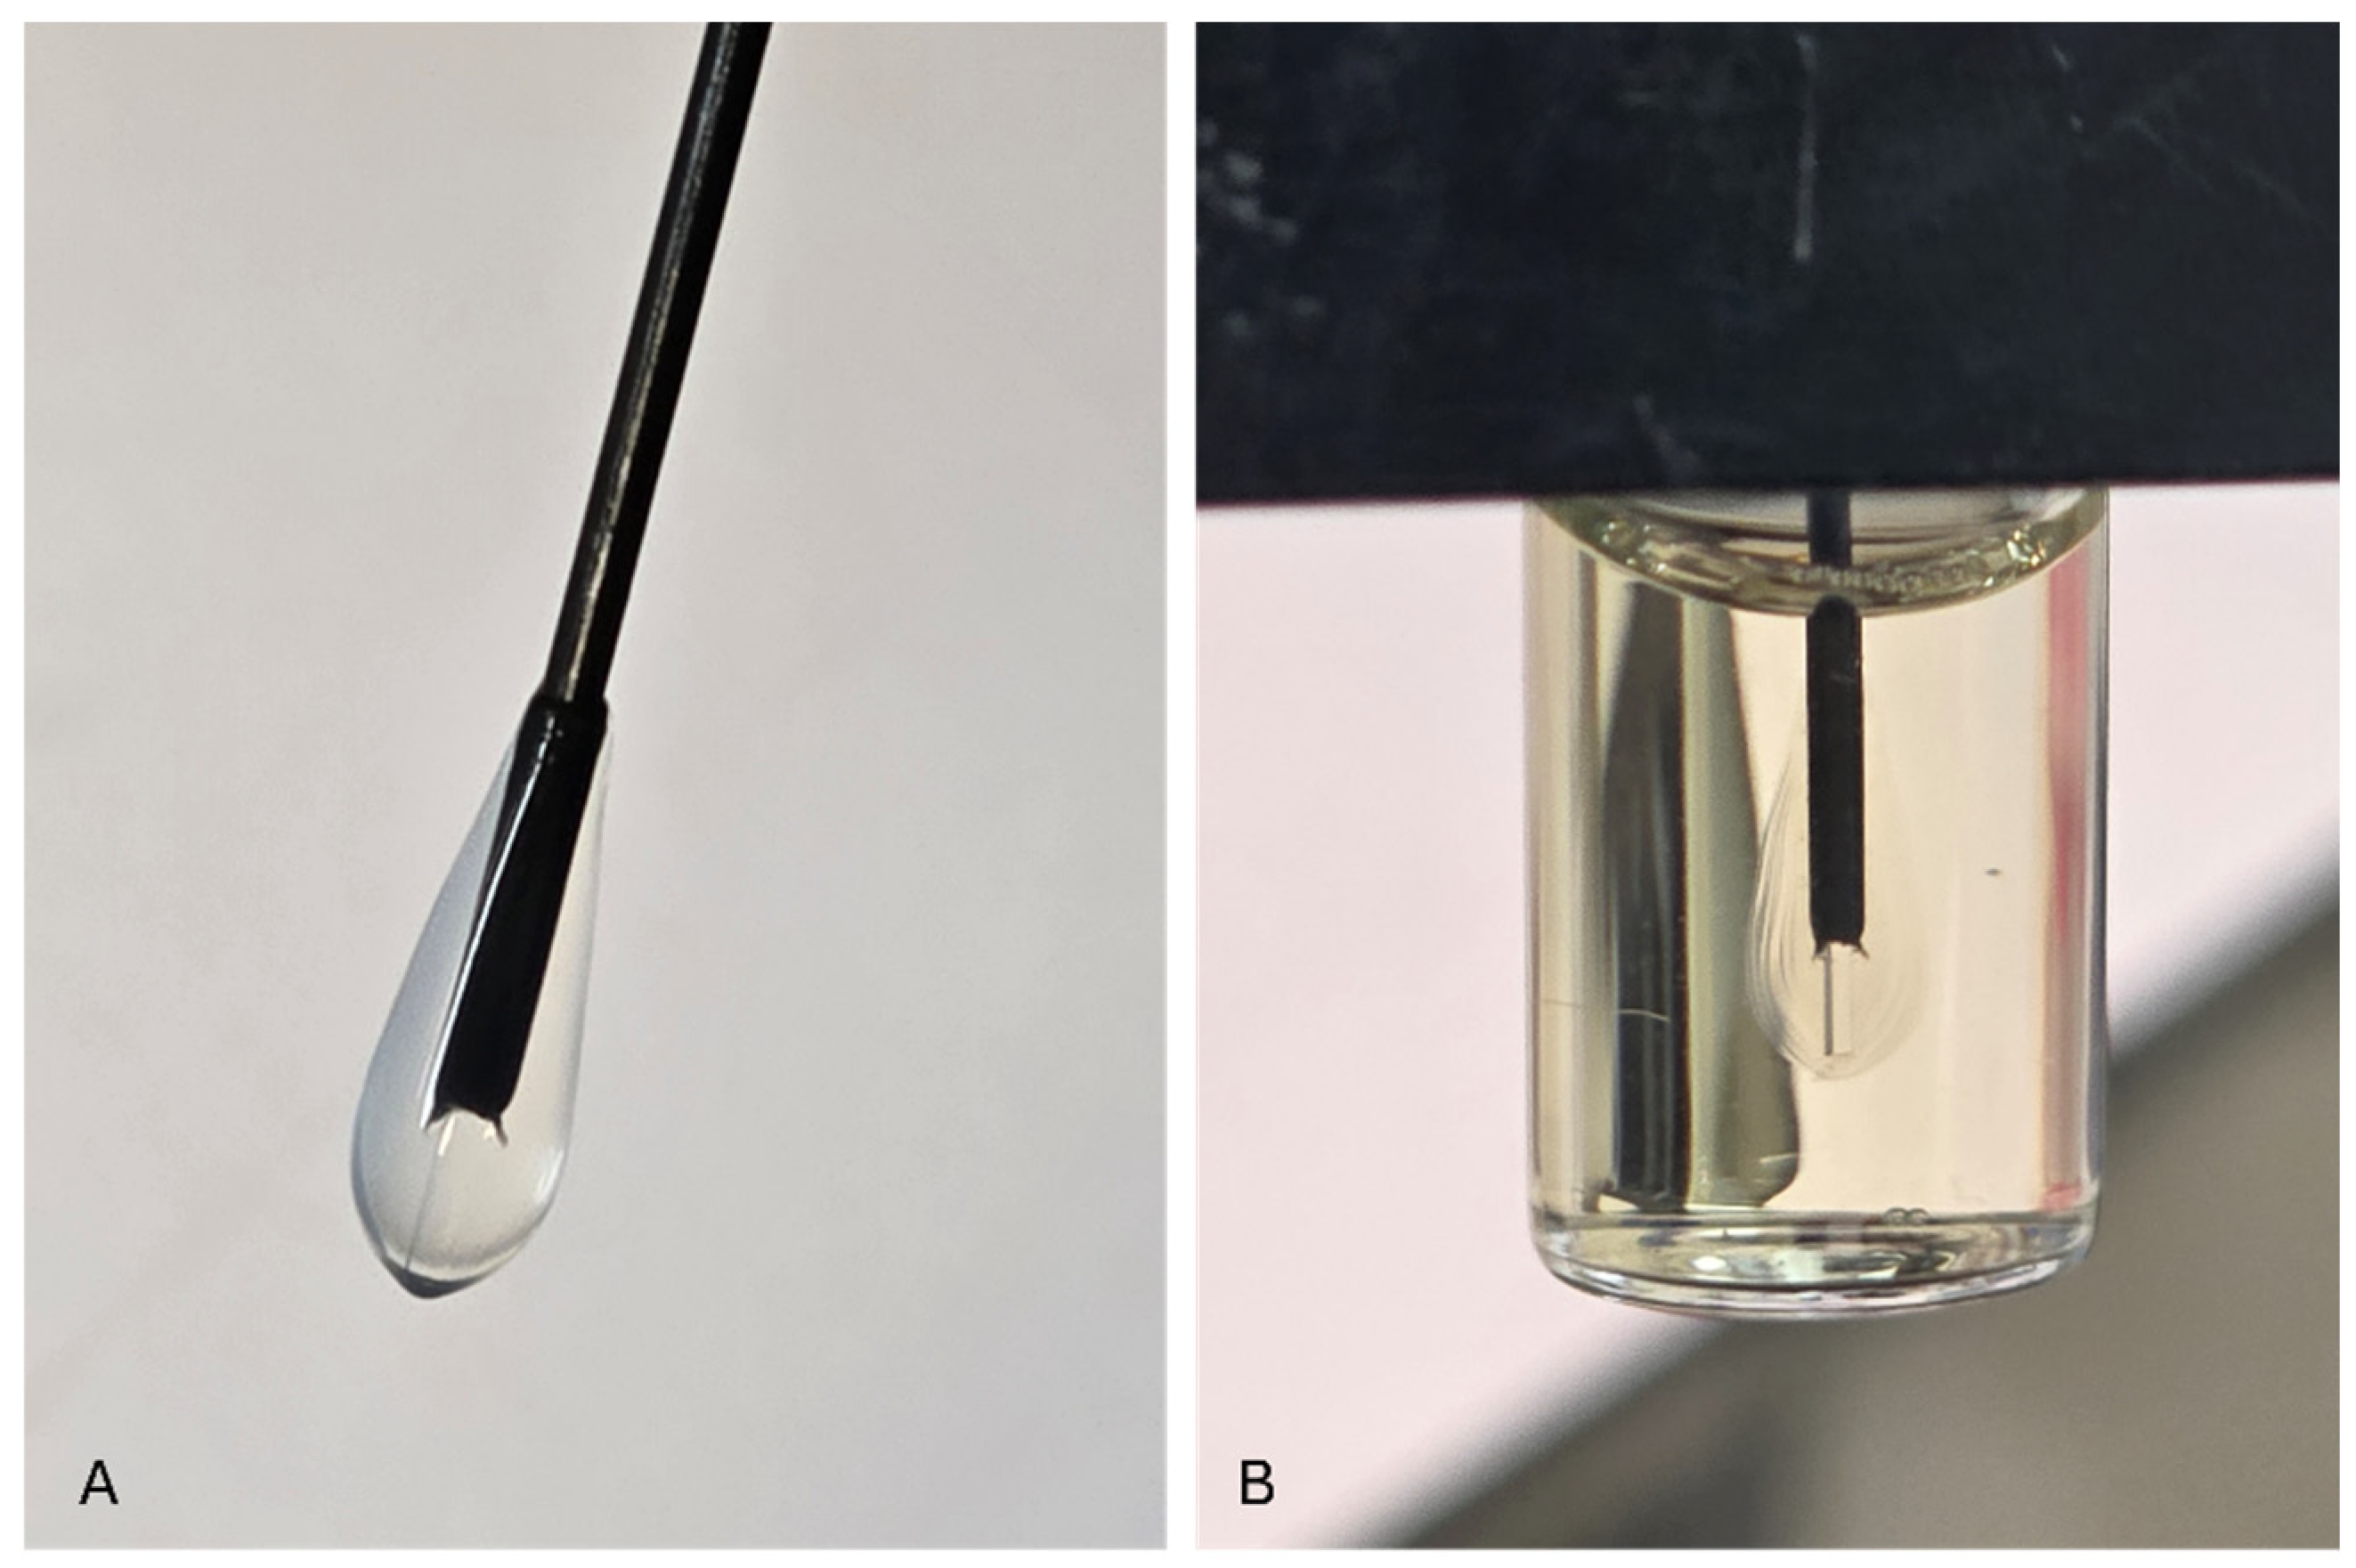
Figure 8.
Bioluminescence and bacterial growth curves in response to bioavailable sediment extracts. a) Kinetic curves of the bioluminescent response of the bioavailable toxicant obtained during the 24 h extraction. b) Bacterial growth curve (OD600) during toxicity measurement in the presence of bioavailable sediment. c) Kinetic curve normalized by OD600 at each time point. d) The induction factor was calculated as described earlier as the ratio of induced bioluminescence to the non-induced control. The results are reported as mean ± SD, n = 4. Statistical analysis revealed significant differences in the readings between different samples and ethanol at p < 0.05, 0.01, and 0.001, and ns represents no significant difference at p < 0.05.
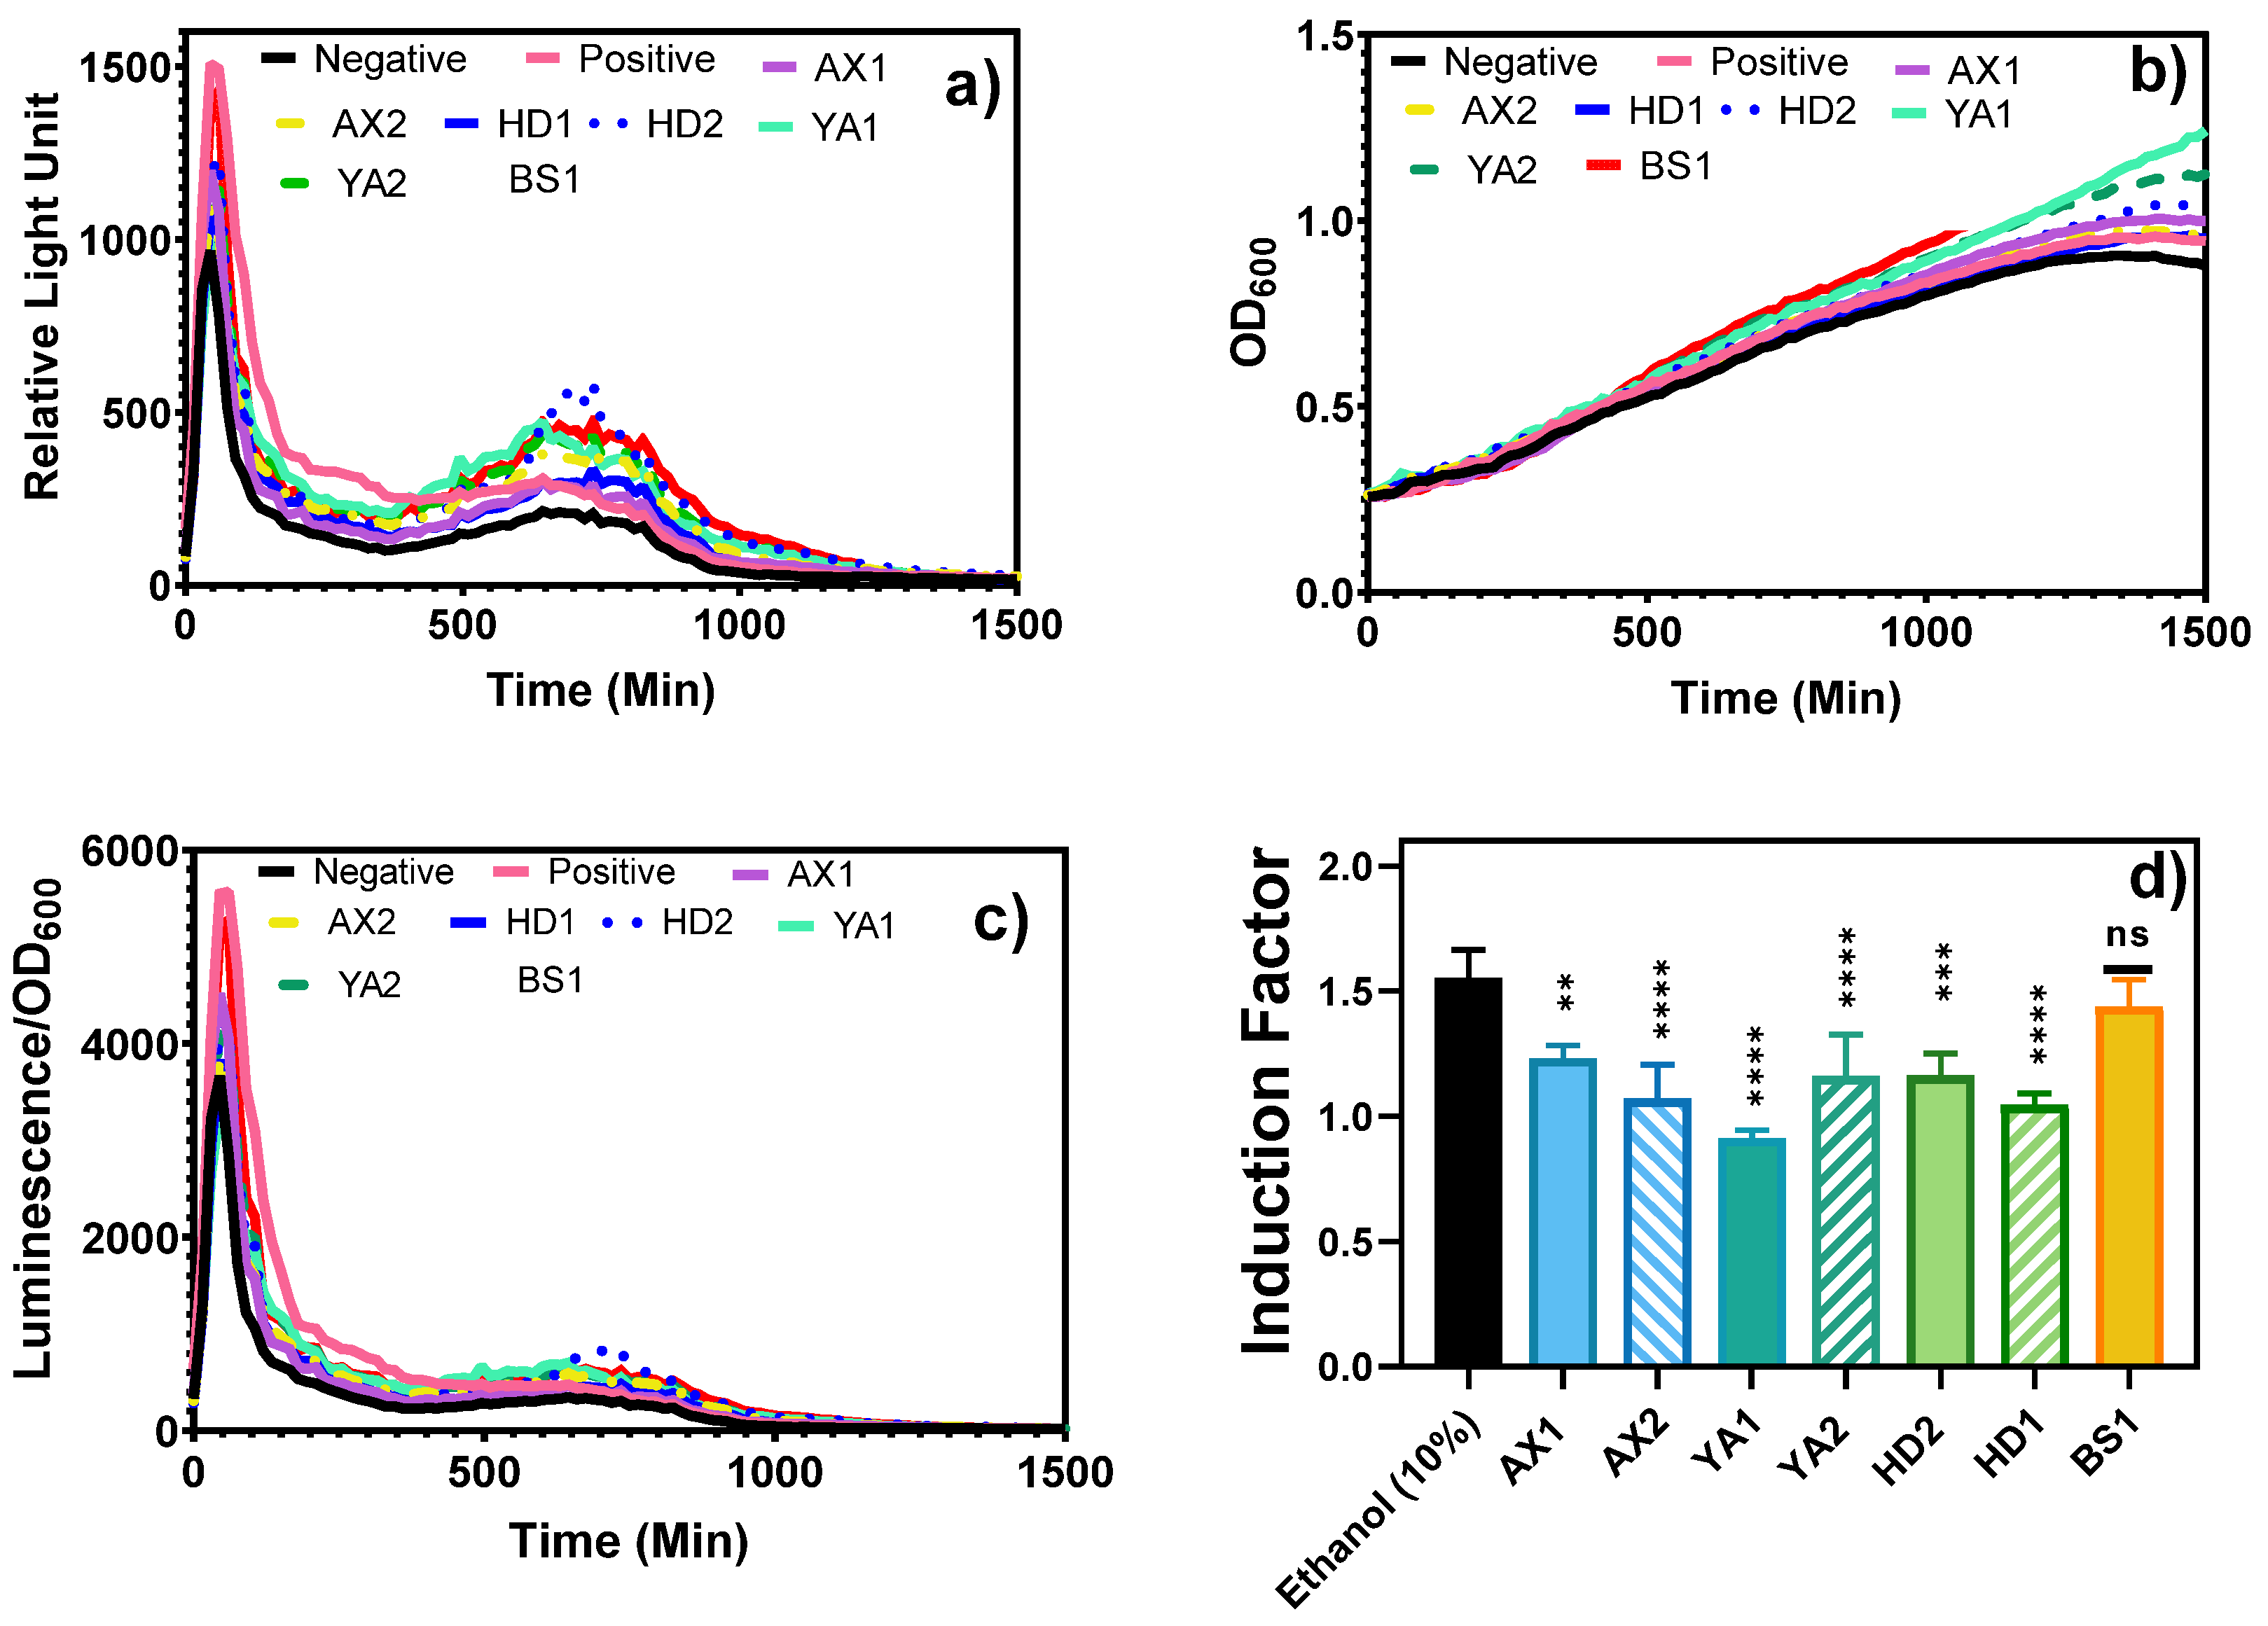
Figure 9.
Bioluminescence responses of water and bioavailable sediment samples. The results showed a bioluminescent response to water samples and bioavailable toxicants prepared instantly or after 24 h of extraction at different times. The results are reported as mean ± SD, n = 4. Statistical analysis revealed significant differences in the readings between 0 min and 24 h compared with water within each sample group at p < 0.05, 0.01, and 0.001, and ns represents no significant difference at p < 0.05. A complete comparison is provided in the Supplementary Materials table S3.
Disclaimer/Publisher’s Note: The statements, opinions and data contained in all publications are solely those of the individual author(s) and contributor(s) and not of MDPI and/or the editor(s). MDPI and/or the editor(s) disclaim responsibility for any injury to people or property resulting from any ideas, methods, instructions or products referred to in the content. |
© 2025 by the authors. Licensee MDPI, Basel, Switzerland. This article is an open access article distributed under the terms and conditions of the Creative Commons Attribution (CC BY) license (http://creativecommons.org/licenses/by/4.0/).
Copyright: This open access article is published under a Creative Commons CC BY 4.0 license, which permit the free download, distribution, and reuse, provided that the author and preprint are cited in any reuse.


