

Submitted:
19 April 2024
Posted:
23 April 2024
You are already at the latest version
Abstract
Turbidity stands as a crucial indicator for assessing water quality, and while turbidity sensors exist their high cost prohibit their extensive use. In this paper, we introduce an innovative turbidity sensor, and it is the first low-cost turbidity sensor which is designed specifically for long-term stormwater in-field monitoring. Its low cost ($23.50 USD), enables the implementation of high spatial resolution monitoring schemes. The sensor design is available under open hardware and open-source licences, and the 3D-printed sensor housing is free to modify based on different monitoring purposes and ambient conditions. The sensor was tested both in the laboratory and in the field. The laboratory results show a strong linear relationship (R2 > 0.99) between the sensor readings and the commercial hand-held turbidimeter (Thermo Scientific AQ4500) results of the solution. In the field, the low-cost sensor measurements were statistically significantly correlated (p < 0.01) to a standard high-cost commercial turbidity sensor (GreenSpan TS-1000). Biofouling and drifting issues were also analysed after the sensors were deployed in the field for more than 6 months, showing both biofouling and drift occur during monitoring. Nonetheless, in terms of maintenance requirements, the low-cost sensor exhibited similar needs compared to the Green-Span sensor.
Keywords:
sediment
; real-time
; IoT
; urban stormwater
; stormwater management
; turbidity sensor
1. Introduction
Water quality has significant environmental and public health implications [1,2,3,4]. Addressing this issue requires a comprehensive understanding of pollutant distribution in catchments to enable targeted protective measures [5,6,7,8]. To attain detailed insights, high-resolution pollutant data is essential [9,10] to identify problematic areas and sources, facilitating focused interventions [11].
Turbidity, which quantifies water’s optical clarity or cloudiness [12], is a valuable parameter [13,14,15,16,17] that reliably indicates total suspended solids (TSS) and suspended sediment concentration (SSC) [18,19]. It can also infer the presence of other pollutants like suspended microorganisms [20,21,22], making it a significant water quality surrogate. Real-time, high-temporal and spatial resolution turbidity data collection is desired for an accurate understanding of urban water system quality [23].
The conventional method for measuring turbidity is via a manually collected water sample which is then either read with a hand-held turbidimeter or transported back to the lab for measurement [24]. However, collecting water samples and measuring their turbidity demands significant labour resources, as individuals need to visit different locations to collect samples. Although portable hand-held turbidity meters have been developed for field measurements, they are unable to capture temporal turbidity variations comprehensively, as they only provide turbidity information of the manually collected samples. This limitation makes it challenging to accurately assess pollutant conditions, particularly in stormwater systems where sediment levels are known to have high variability [25].
Monitoring turbidity continuously using high-end in-field sensors allows for more comprehensive temporal turbidity data collection. However, these sensors face challenges in capturing high spatial resolution in turbidity due to their high cost (e.g. more than 2000 USD for each GreenSpan TS-1000A turbidity sensor [26]), space requirements (bulky batteries and dataloggers are required for data collection), and installation difficulties (shelter is required for the sensor and cabinet needs to be installed for the battery and datalogger) [27].
In light of these challenges, there is a pressing need for innovative, low-cost turbidity measurement devices that can overcome the limitations of conventional approaches. While a range of innovative devices have been developed in recent years to measure turbidity, the majority of these devices are not well-suited for extended stormwater field monitoring applications. This limitation largely stems from the fact that the development focus of many such devices has been at the laboratory scale, and they have not been robustly tested for long term field-scale deployments [28,29,30,31,32,33,34,35,36,37,38,39,40,41,42,43,44,45,46,47,48,49,50,51,52].
On occasions where long-term applicability is considered, the focus frequently shifts to domains other than stormwater systems (such as drainage networks or flowing water channels). For instance, Oscar et al. (2020) designed a turbidity meter capable of transmitting monitoring results and GPS information via satellite communication [53], yet the design is focused on open-water body/lake monitoring and is unsuitable for monitoring flowing stormwater drains. Similar challenges apply to the sensor designed by He et al. [54] (2020) and although the sensor boasts high sensitivity, its bulky size prevents its application in urban stormwater systems. Based on our review, there are no publications that report on a sensor which is suited to in-situ and continuous monitoring of turbidity in stormwater systems.
As such, this paper presents the design and validation of a low-cost turbidity sensor suitable for long-term implementation specifically in the stormwater water system. After validating its laboratory performance, field application and validation were conducted in Troups Creek Wetland, located in Narre Warren North, southeastern Melbourne. The objective of this work was to verify whether this innovative technology could meet the following requirements: (1) provide reliable, long-term monitoring results compared to a high-end turbidity sensor (GreenSpan TS-1000A turbidity sensor); (2) be of low-cost; (3) have low power consumption; (4) be resistant to biofouling; and (5) have minimal drift issues after long-term deployment.
2. Materials and Methods
2.1. Turbidity Measurement Mechanism
The mechanism used for water turbidity measurement in the proposed sensor relies on optical-based sensing techniques [50]. This method utilizes reflectance principles [19], wherein light emitted from a source is reflected by particles present in the water before being detected by a photodetector. The amount of reflected scattered light received by the photodetector increases with the presence of more particles in the water column.
The key components of the low-cost innovative sensor include a light emitter (VSLY5850 LED) and a photodetector (BPW77NB phototransistor) [36]. The resistance of the phototransistor is light-dependent, leading to a decrease in resistance as it detects higher levels of light (indicating increased turbidity) and an increase in resistance under low-light conditions (low turbidity). To facilitate this measurement, the phototransistor is integrated into a voltage divider configuration in series with a resistor. An ATmega328P microcontroller (MCU) is employed to gauge the voltage drop across the resistor within the circuit using an analogue pin. Consequently, a positive correlation between turbidity and the voltage drop emerges, allowing the creation of a calibration curve based on this relationship.
2.2. Electrical and Physical Overview
The mechanism used for water turbidity measurement in the proposed sensor relies on optical-based sensing techniques [50]. This method utilizes reflectance principles [19], wherein light emitted from a source is reflected by particles present in the water before being detected by a photodetector. The amount of reflected scattered light received by the photodetector increases with the presence of more particles in the water column.
The turbidity sensor is able to operate under a 3.3V power supply and communicate via a universal asynchronous receiver-transmitter (UART). The sensor circuit, as depicted in Figure 1 (a), utilizes an ATmega328P chip as the MCU due to its ease of use and familiarity in sensing applications [55,56]. The circuit includes one LED, one phototransistor, and a voltage regulator to match the nominal voltage of the infrared LED (1.65V [57]). The phototransistor is powered by an NPN transistor. A 2MΩ resistor forms a voltage divider with the phototransistor, and the MCU measures the voltage drop across the resistor; this voltage drop is converted to digital values by the MCU’s 10-bit analogue to digital converter (ADC) such that the output of the sensor is an integer between 0 and 1023. These integers are positively correlated with turbidity.
The dimension of the PCB is 24mm by 12mm. To ensure reliable performance in the urban water system, a 3D printed housing is utilized to accommodate the PCB and components. Within the housing, the LED and phototransistor are fixed facing outwards at a 90-degree angle to each other and spaced apart by 22mm (centre to centre). A transparent epoxy board is placed in front of the LED and phototransistor (Figure 1c) to provide protection. The 3D printed housing is filled with a potting compound to ensure water resistance [58].
2.3. Removal of Ambient Interference
To address the issue of ambient noise, particularly sunlight interference, a 3D printed sensor cover is applied to the turbidity sensor. This cover ensures that the phototransistor only detects light emitted from the LED, effectively eliminating external light sources. Additionally, the cover prevents sunlight penetration, significantly reducing the growth rate of biofilms [59] and minimizing the need for maintenance.
When selecting the material for the cover, testing is conducted to ensure that no light can penetrate. For this specific design, different brands of two materials, Polylactic acid (PLA) and polyethylene terephthalate glycol (PET-G), are carefully tested to determine the most effective one. It is important to note that certain materials, even with 100% printing infill, may still allow light to pass through and impact the sensor readings. In the final design, the sensor cover is produced using Bilby 3D (PET-G) material [60].
While the cover eliminates most light sources, there may still be a small amount of natural light detected by the phototransistor, causing interference. To mitigate the impact of background noise and achieve more accurate monitoring results, a scanning process is performed twice: once with the LED turned on and once with the LED turned off. The two scanning processes are conducted within two seconds of each other. The reading obtained with the LED turned off serves as the ambient noise, and the final turbidity measurement results are estimated by calculating the difference between the readings obtained when the LED is turned off and on [61].
where M is the analogue difference of the sensor readings, Ron is the turbidity sensor reading with LED turned on, Roff is the turbidity sensor reading with LED turned off.
2.4. Sensor Operation
During the operational phase of the turbidity sensor, two types of readings are obtained: the "LED on" and the "LED off". Each measurement takes one millisecond, and a total of 1000 measurements are taken during each scan, which amounts to one second. The results obtained from the 1000 measurements are averaged.
The turbidity sensor operates in two modes: working mode and sleep mode. In the working mode, the sensor is active, and both the LED and phototransistor consume power to take readings. This mode is utilized when actively monitoring and collecting turbidity data. The sleep mode is designed to conserve energy during long-term continuous field monitoring. In this mode, the device remains active but the electrical components (LED, phototransistor and AT-mega 328 chip) are not powered, resulting in reduced power consumption. Despite being in a low-power state, the sensor can quickly resume active measurements when required. By switching between these modes, the sensor optimizes energy usage while maintaining its functionality for extended monitoring periods.
2.5. Sensor Cost
The cost of a single low-cost turbidity sensor amounts to approximately 23.50 USD. The price of each component is detailed in Table 1.
2.6. Power Consumption
To determine the power consumption of the innovative turbidity sensor, the current of the sensor is measured in both the working and sleeping modes. This is accomplished by connecting an ammeter in series with the sensor circuit. For the working mode, there are two phases, one with LED on and one with LED off, the measurements of both phases were conducted. In the sleep mode, the sensor transfers to a low power state. The ammeter readings are recorded for both the working mode and the sleep mode, providing data on the power consumption of the sensor in different operating states.
2.7. Labortory Calibration
In order to establish the correlation between the sensor’s output (i.e. an integer between 1 and 1023) and turbidity, it is necessary to generate a calibration curve for the sensor. Since we were unsure whether turbidity sensors would vary between individual units, each sensor needed to undergo individual testing to generate its own calibration curve. During the calibration process, a standard solution (Australian Chemical Reagent, ACR 4000NTU standard turbidity solution) was used to create different turbidity solutions; we created roughly 25, 50, 100, 150 and 250NTU solutions respectively and checked them using a commercial Thermo Scientific AQ4500 hand-held turbidimeter, which we consider providing accurate turbidity readings. The analogue readings obtained from the low-cost turbidity sensor are compared to the measured turbidity values to assess if a reasonable regression relationship exists. This relationship can then be utilized as a calibration curve for subsequent turbidity measurements. Each solution is tested three times using the low-cost sensor and the hand-held turbidimeter. The average of these three readings is employed for calibration analysis. The expected relationship between the turbidity sensor readings and the hand-held turbidimeter reading values is theoretically linear[62] and can be expressed as:
where T is the calibrated turbidity value, a is the parameter to indicate the slope of the linear relationship, M is the analogue difference of the sensor readings, and b is the parameter to indicate the intercept of the linear relationship.
2.8. Field Validation
2.8.1. Validation Sites
The low-cost turbidity sensors were validated through a field test at Troups Creek Wetland in Narre Warren, south-east Melbourne. Two locations, the wetland inlet and outlet, were chosen for the sensor installation. These locations represent key points for assessing the removal of turbidity through the wetland, and is commonly done in literature [63,64,65,66]. The sensors were installed alongside high-end turbidity sensors (GreenSpan TS1000 turbidity sensor) with a distance of approximately 30cm between them. This setup allowed for monitoring turbidity under similar conditions.
2.8.2. Sensor Installation
To gain a more comprehensive understanding of the site conditions, a low-cost depth, electrical conductivity (EC), and temperature sensor [58] was also installed alongside the low-cost turbidity sensor. To facilitate the installation, both the low-cost turbidity sensor and the depth, EC and temperature sensor were mounted on a 50mm PVC pipe using a specially designed 3D printed sensor holder (Figure 2a). A logger box, housing an ATmega based data logger (BoSL Board v0.4.1 [67]) and a 3.3v battery, was securely attached to the top of the PVC pipe (Figure 2b). The logger box featured a drilled hole at its base, allowing the sensor cables to pass through and connect to the logger. This integrated setup, encompassing all the sensors and the logger box, constituted a cost-effective sensor package capable of monitoring water turbidity, EC, temperature, and depth (Figure 2c).
During the installation of the low-cost sensor package, a star picket was previously driven into the wetland base. Subsequently, the PVC pipe was slid over the star picket, providing stability and allowing the unit to be positioned within the wetland for data collection.
2.8.3. Monitoring Regime
Both the low-cost sensor package and the GreenSpan turbidity sensor followed an identical monitoring regime, ensuring consistency in data collection. For both sensors, the scan interval was set at 1 minute and the averaging interval and logging intervals were set at 6 minutes; this means the logger averaged the six scan results (taken at 1-minute intervals) and then logged this value (to a remote cloud store for our low cost sensor system and to a local Campbell Scientific logger for the GreenSpan sensor).
2.8.4. Sensor Maintenance and Calibration
To ensure the accuracy of the monitoring results and mitigate the potential impact of biofilm and algae, regular maintenance was carried out on the sensors. The frequency of maintenance was determined based on the sensor's functionality and the local environmental conditions [68]. In this particular case study, we aimed to conduct maintenance every two weeks. The maintenance process consisted of three steps: before cleaning calibration, sensor cleaning, and after cleaning calibration. Over time, as the sensors remained installed in the wetland, a biofilm developed on the surface of the probe, potentially affecting the sensor readings. Hence, it was crucial to establish calibration curves for both the conditions: with biofilm (before-cleaning) and without biofilm (after-cleaning). By having these calibration curves, the data could be adjusted appropriately by using the respective calibration before and after the cleaning process. This approach ensured accurate and reliable data analysis and interpretation.
- Step 1. Before cleaning. We used the diluted standard turbidity solutions (25, 50, 100, 150 and 250NTU) for calibration, the preparation methods were the same as the lab calibration process (dilute the 4000NTU standard turbidity solution). With the sensor becoming dirty after a period of field installation such as mud or algae settling on the surface, they needed a general clean to avoid contaminating of the turbidity solution. When cleaning the sensor, only the sensor body was cleaned, and the sensor surface where the LED and PT transmit/read remained untouched, so the biofilm impact of the sensor was able to be captured. When recording the monitoring data, the sensor probe was submerged in the turbidity solution, the reading of the sensors taken and recorded first, then checked against the turbidimeter to test the actual turbidity of the solution which makes sure an identical turbidity reading is captured. Both the low-cost sensor and the turbidity meter take three continuous readings and calculate the average for comparison.
- • Step 2. Cleaning. The probe of the sensor was carefully cleaned by DI water and delicate task wipers (Kimwipes), the sensor probe was wiped gently multiple times until no dirt or biofilm was obvious on the wiper.
- • Step 3. After cleaning. After the probe was cleaned, the checking process was repeated as per Step 1, exactly, to assess after cleaning conditions.
The maintenance procedure described above was implemented for the fixed GreenSpan sensors in the field. To simplify the calibration process for the low-cost sensors, each monitoring site is equipped with two sensors that are periodically swapped to collect comprehensive data throughout the monitoring period. The low-cost sensor calibration process was conducted in the lab, but following the same process as outlined above.
2.8.5 Data combination and adjustments based on calibration curves
For each monitoring site, two low-cost sensor packages were utilized, enabling continuous data collection. When one sensor package was removed for maintenance, another package was deployed to ensure uninterrupted monitoring. To mitigate the effects of resuspension attributed to maintenance procedures for both the GreenSpan sensor and the low-cost sensor, the duration of maintenance activities (including the time required for swapping the low-cost sensor in the wetland) was recorded. Subsequently, data collected during these maintenance intervals were excluded from the comprehensive dataset.
The collected data from the sensors were in raw form and required adjustment using 'before-cleaning' and 'after-cleaning' calibration curves, as each sensor had two calibration curves for each monitoring period. These curves accounted for the difference in data between conditions with and without biofilm. The monitoring results from each site were consolidated to form a comprehensive database during data analysis. This approach facilitated accurate calibration and integration of the monitoring data for further analysis.
During each monitoring period, the calibration curve exhibited a distinct difference influenced by the presence of biofilm. It was assumed that the biofilm growth rate remained constant over time. The change rate of the calibration curve displayed a linear relationship. Both parameter a and parameter b in Equation 2 were presumed to change at a constant rate based on the sensor's in-water duration. As a result, the calibration parameters varied for each monitoring timestamp, and the calibrated turbidity was determined using the specific calibration information available at that timestamp. This approach accounted for the evolving biofilm conditions over time, resulting in more accurate estimations of turbidity and enhancing the reliability of the monitoring data analysis.
2.8.6. Data Validation
The combined and adjusted data underwent a validation process consisting of several criteria. These criteria were derived from available information encompassing the data itself, maintenance records, environmental factors, and any issues encountered during the measurement process. Additionally, a combination of these three elements was considered [68]. The designed criteria aimed to filter and retain valid data points for subsequent analysis.
- Criterion 1: Sensor monitoring status (in-water for monitoring, or not). The sensor monitoring status was used to determine if the sensor was immersed in the water for monitoring purposes. This test verified whether the sensor remained fully submerged in the water, ensuring reliable monitoring of turbidity. If the water depth was insufficient, such that it fell below the top surface of the turbidity sensor, the collected data was identified as invalid. The sensor could be out of water for calibration and checking, for instance.
- Criterion 2: Missing data. Missing data at specific timestamps occurred due to various factors such as battery issues, hardware malfunctions, or software problems. In these cases, when the sensor failed to collect data, the corresponding data points at these timestamps were considered invalid or missing.
- Criterion 3: Turbidity is outside the calibrated range of the sensor. After applying the calibration curves to the raw data of the two sensors, the calibrated turbidity values should fall within the calibrated range. Since the turbidity solutions used for calibration ranged from 0 NTU to 250 NTU, the reliable detection range for both sensors was set within the same range (0 NTU – 250 NTU). Therefore, any calibrated turbidity values that fell outside this reliable detection range for their respective sensors were identified as not valid.
- Criterion 4: Continuous trend data. If the monitoring data exhibits a continuous trend of either increasing or decreasing for a period exceeding 7 days, and this trend remains consistent regardless of weather changes, the entirety of the continuous trend data is considered invalid and is assumed to have been caused by rapid build-up of material on the sensors surface.
- Criterion 5: Significant fouling. When conducting maintenance, if the presence of dirt, sediments, algae, or snails was observed on the surface of the sensor, it could have a substantial impact on the sensor readings. As it is difficult to determine precisely when the dirt started to accumulate on the sensor, the data collected during the monitoring period between the last maintenance and the current maintenance was regarded as uncertain.
- Criterion 6: Duration after the last maintenance. If the sensor had not undergone maintenance for a period exceeding two weeks, the data collected beyond the two-week mark from the last maintenance was designated as uncertain.
- Criterion 7: Filtering erratic values. To filter out erratic increases or decreases in sensor data, as well as unrealistic gradients that do not align with physical processes and local environmental conditions, the Page-Hinckley test was applied [69,70]. This testing method involves comparing the absolute sum of the difference between the residue and the cumulative average with a threshold. Determining the appropriate threshold involves an iterative process with a moving window. The moving average and threshold values need to be set differently for each sensor, considering their specific characteristics. Since the residue of turbidity results follows a normal distribution, around 10% of the total data can be expected to be removed based on this criterion. A sensitivity matrix can be constructed for each sensor, illustrating the amount of data to be removed with different moving window sizes and thresholds. This matrix enables the selection of the optimal combination of moving window and threshold values to effectively filter out inconsistent or erroneous data points.
Following this data validation criteria, the valid data points were retained for further comparison and analysis. The percentage of removed data, resulting from this process, is determined and discussed.
2.8.7. Time Series Data Comparison
To evaluate the reliability of the innovative low-cost turbidity sensors, a comparison was made between their long-term continuous monitoring results and the GreenSpan monitoring results. Only the valid data points from both sensors were considered for this analysis. The turbidity changing patterns during the monitoring period were illustrated by plotting time series data for both sensors at each monitoring site. To provide further context, rainfall data was incorporated as turbidity changes are often associated with rainfall events. Additionally, the influence of high-speed wind causing resuspension and increased turbidity was explored by including wind speed data. Other weather data obtained from the Bureau of Meteorology (BoM) was utilized to enhance the understanding and interpretation of the sensor data.
2.8.8. Statistical Analysis of the Comparison between the Two Sensors
A comparison between the data obtained from both sensors was conducted, and statistical analyses were performed to assess the correlation between the two sensors. To quantitatively assess the correlation between the two sensors' data, Pearson correlation test [71] was applied to the collected data. The Pearson correlation test was used to evaluate the linear association between the two datasets.
2.8.9. Biofouling Impact of the Sensors
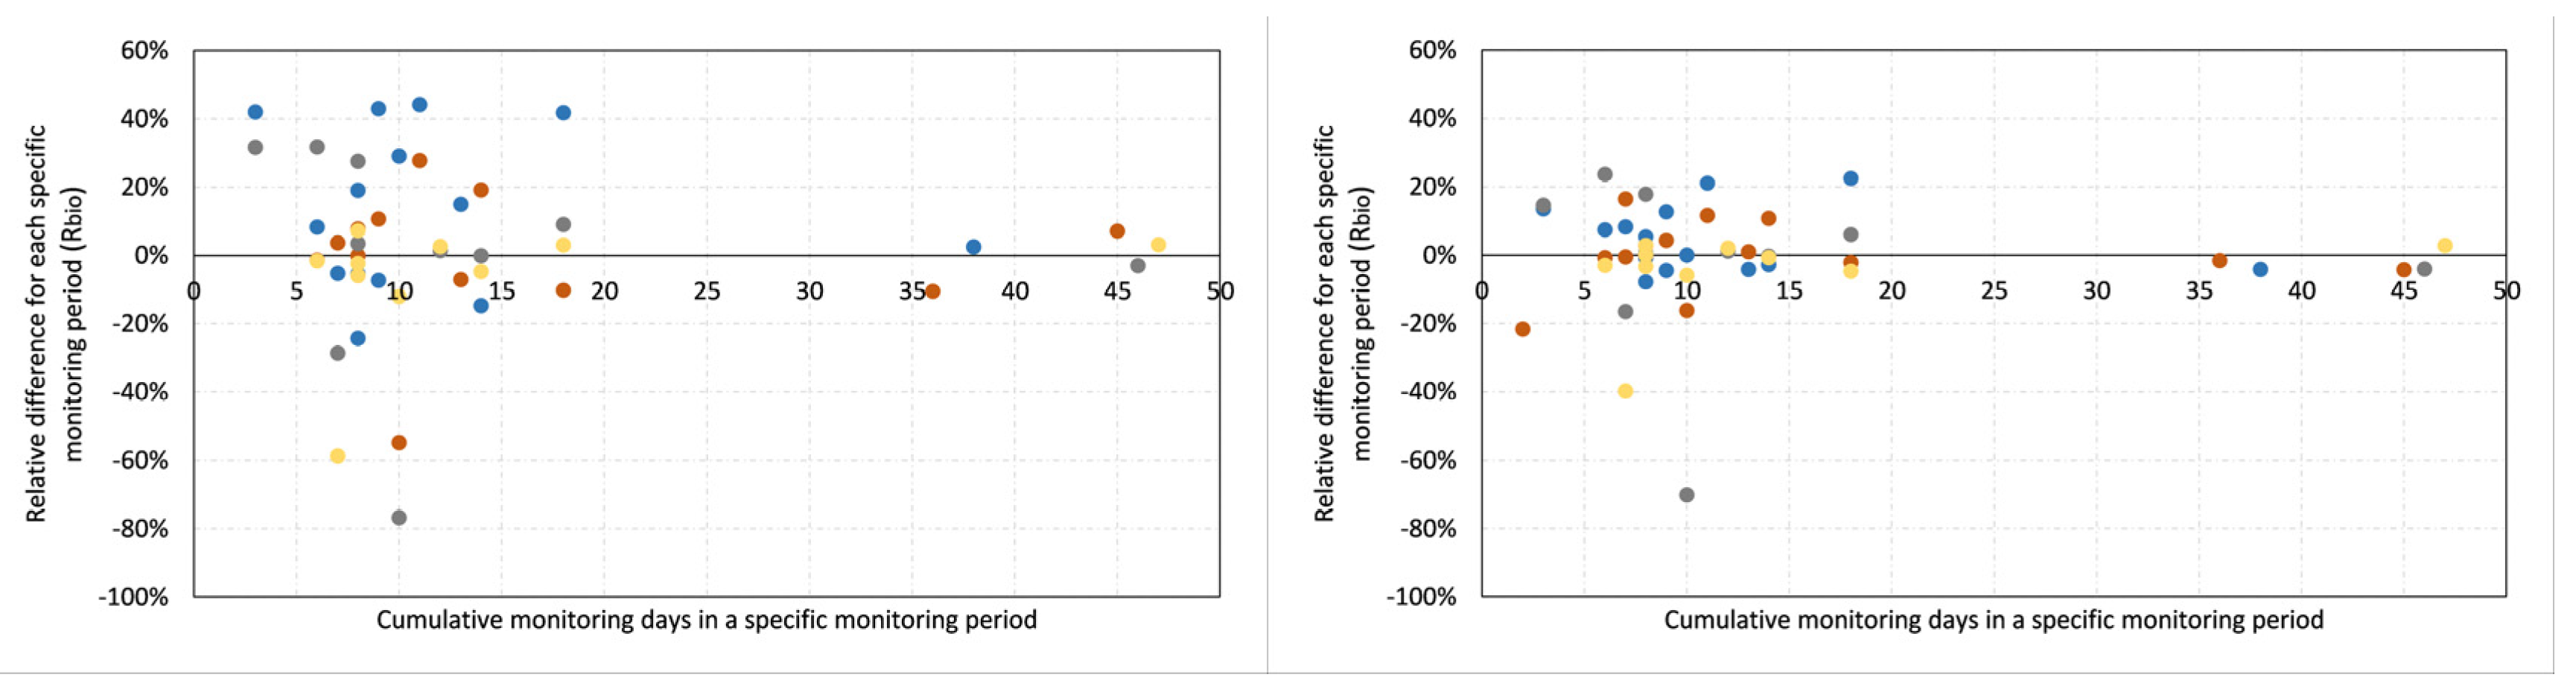
As biofilm increases on the probe's surface, the sensor reading may be higher due to increased light reflection by the biofilm. To assess the influence of biofouling, a comparison was made using the calibration information. For each monitoring period, the after-cleaning calibration curve (representing a cleaned sensor) was compared with the before-cleaning calibration curve (representing a sensor potentially affected by biofilm). In this comparison, different raw readings were assigned to the sensors to align their actual turbidity readings with the 25th, 50th, and 75th percentiles of the entire monitoring results. For instance, once the 25th percentile of the raw readings was obtained, this value was applied to both the “before-cleaning” and “after-cleaning” calibration curves to determine the calibrated turbidity results. Then the relative difference between these calibrated results was calculated, facilitating further analytical exploration. This methodology was consistently applied to the 50th and 75th percentiles of the raw readings to obtain a better understanding of the effects of biofilm accumulation over time.
Where Rbio is the relative difference between ‘after-cleaning turbidity’ and ‘before-cleaning turbidity’. TA is the ‘after-cleaning turbidity’ reading for one specific monitoring period, TB is the ‘before-cleaning turbidity’ reading for one specific monitoring period.
To assess the potential impact of biofouling on turbidity readings, the relationship between the relative difference of before-cleaning and after-cleaning readings and the in-water time was examined. This analysis aimed to evaluate whether biofilm growth influenced the turbidity measurements. This analysis was repeated for all cleaning events for both the low-cost sensors and the GreenSpan sensor, and they were then compared. A Wilcoxon Rank Sum test [72] was conducted to assess the difference between the low-cost turbidity sensor and the GreenSpan sensor in terms of biofouling issues. A p-value of 0.05 was considered as the acceptable threshold for statistical significance in the Wilcoxon Rank Sum test.
2.8.10. Permanent Drifting of Sensors
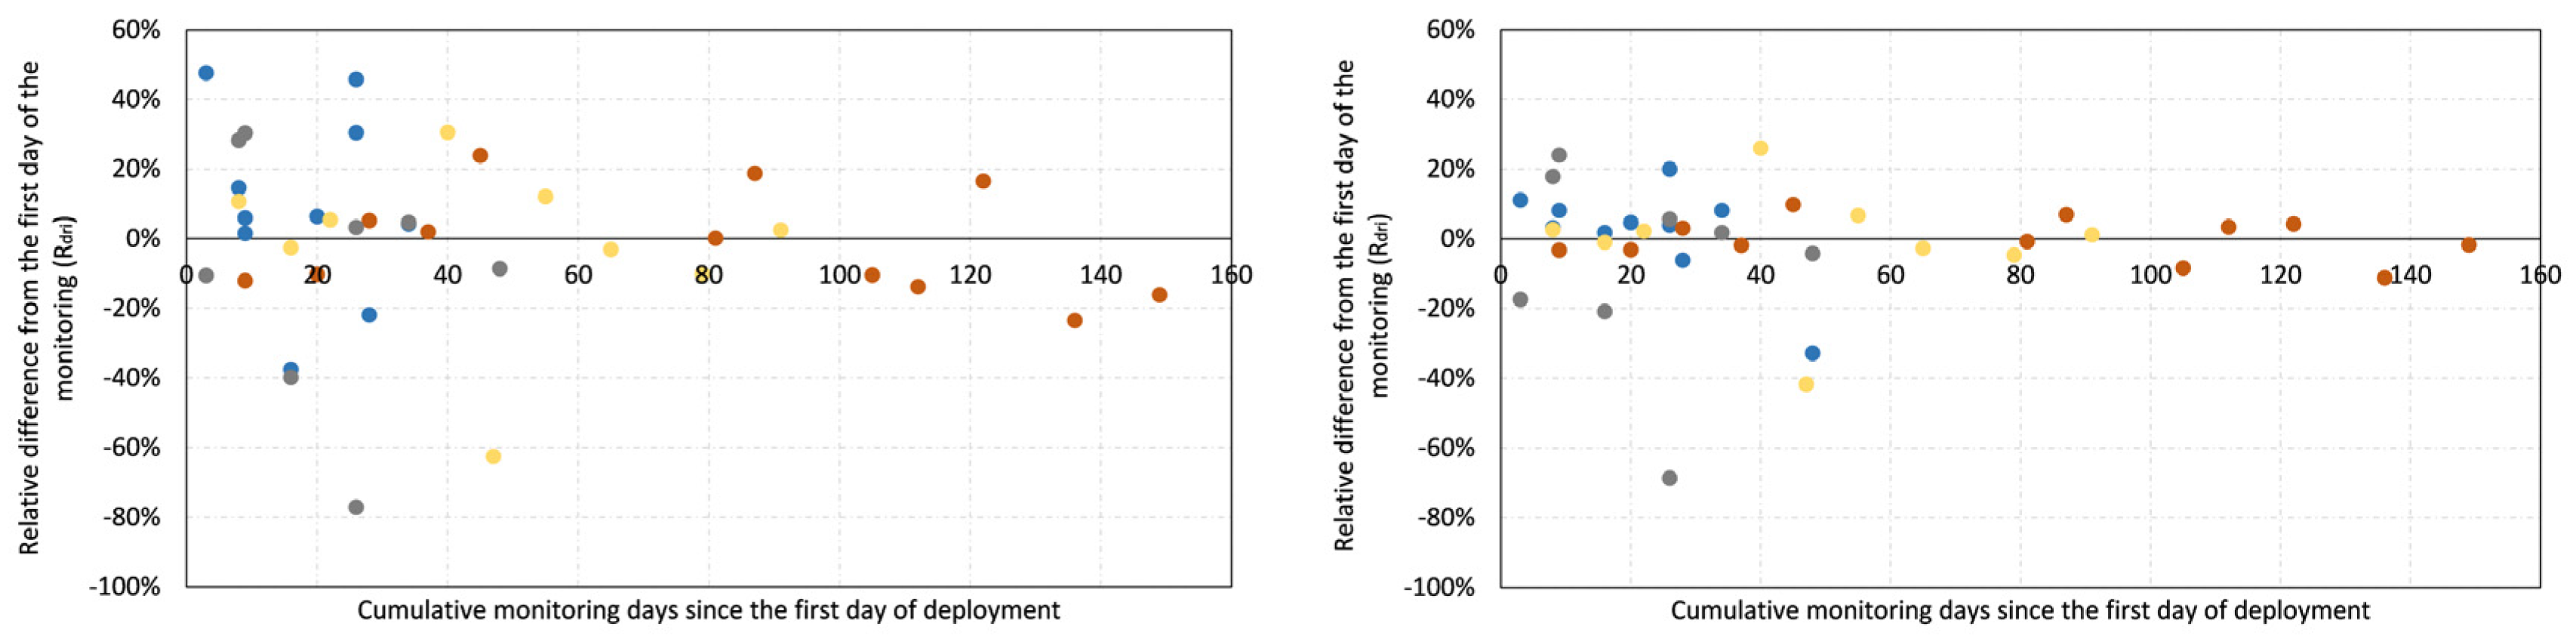
Permanent drift refers to the phenomenon where a sensor's output progressively deviates from its initial value over time. In the case of the turbidity sensor, such drift could be attributed to scratches incurred from prolonged exposure to harsh environmental conditions. To assess the presence of drift issues, it is crucial to compare the sensor's performance under conditions indicative of optimal functionality, specifically when the sensor is thoroughly cleaned and unaffected by biofilm accumulation. Therefore, an analysis was conducted by comparing the calibrated results from the “after-cleaning” calibration curves. The analysis of the sensor drift issue parallels that of assessing the impact of biofouling, with the sole distinction being the basis of comparison. Specifically, the relative difference is calculated using the results derived from the 'after-cleaning' calibration data. The after-cleaning calibration curves (i.e. from Step 3, above) from these two cleaning instances were compared to assess two aspects:
1. Correlation between in-water time and relative difference: The relationship between the in-water time and the relative difference in the calibration curves was examined.
2. Bias after deployment: The comparison of the after-cleaning calibration curves aimed to identify any significant bias or offset that may occur in the sensors' readings after being deployed in the water.
By examining these aspects, the presence of permanent drift issues and any potential correlations or biases in the sensor readings after being deployed in water could be evaluated. The relative difference can be calculated as:
Where Rdri is the relative difference between ‘after cleaning’ turbidity and ‘before cleaning’ turbidity. is the ‘after-cleaning’ turbidity reading before the sensor was deployed) for a specific (nth) monitoring period, is the ‘after-cleaning’ turbidity reading after the sensor was retrieved for one specific (nth) monitoring period.
To evaluate the presence of permanent drift issues, this calculation was done for each monitoring period and for each sensor. The summarized data was then subjected to a Wilcoxon Rank Sum test to assess any significant differences between the low-cost and GreenSpan sensors regarding drifting issues.
3. Results and Discussion
3.1. Power Consumption
In the sensor’s working mode, the LED operates at two different current levels: 88 mA during the active phase and 4 mA during the inactive phase. During its sleep phase, the current draw is exceptionally low, to the extent that it falls to less than 0.1 µA. Based on the current consumption data outlined in Table 2, assuming a measurement frequency of one measurement per minute, the projected total power consumption over a year of continuous monitoring amounts to approximately 13,500 mAh. This means that a single typical 18650 Li-ion cell with a capacity of 3,500 mAh can sustain the turbidity sensor's continuous operation for approximately three months. It's worth noting that the monitoring duration can be extended by reducing the scan frequency, as a lower scan frequency would increase the sensor's operational lifespan.
3.2. Laboratory Calibration
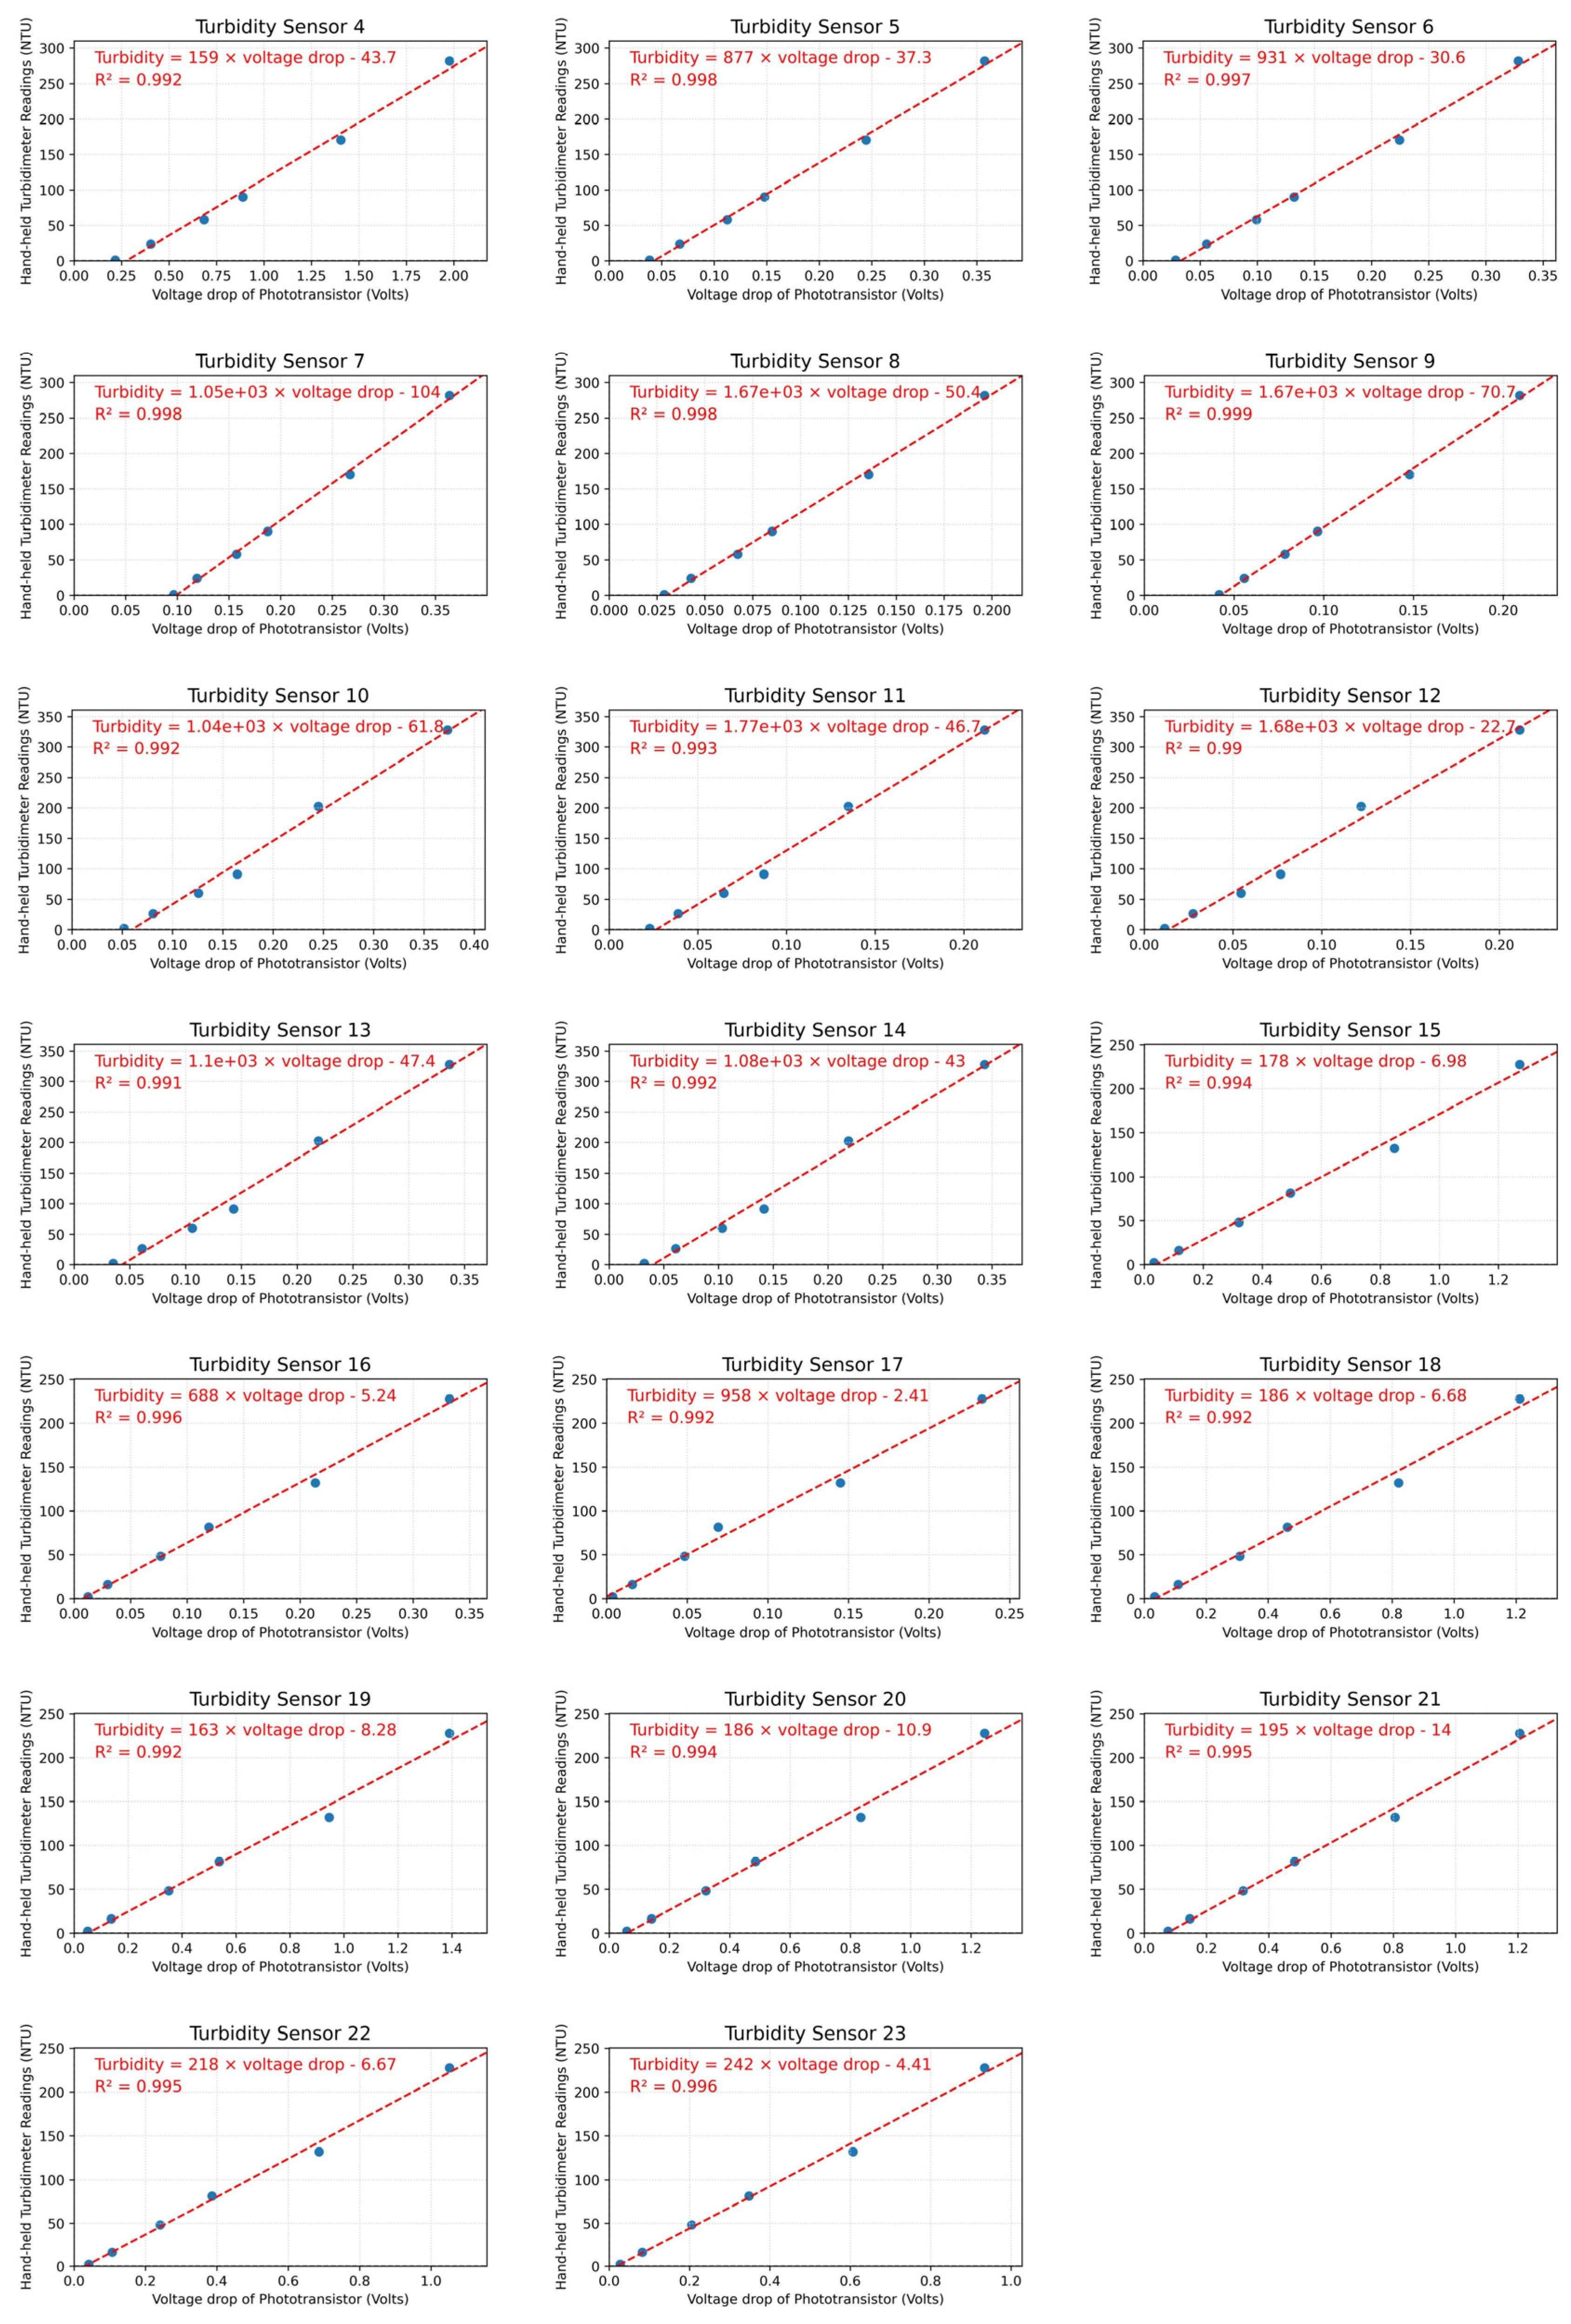
Our results demonstrate significant linear relationships between the known turbidity levels and the corresponding sensor output obtained from the sensors (Figure 3; R2 > 0.99, p < 0.01). In this study, a total of 23 sensors were subjected to testing and calibration in the laboratory and Figure 3 showcases three randomly selected example sensors (all sensors shown in Appendix A). However, it is worth noting that each tested sensor exhibits distinct lines of best fit parameters. The slopes of the calibration curves range from 159 to 1770, while the intercepts vary from -104 to 2.41. These variations stem from differences in sensor manufacturing, such as slight disparities in the gap between the LED and the front epoxy board, which ultimately influence the calibration information and suggest that each sensor should undergo calibration checks before deployment.
3.3. Field Validation
3.3.1. Data Cleaning
Based on the data cleaning criteria, no data was removed due to Criterion 1 (submersion of sensors), while Criterion 2 (missing data) resulted in data loss primarily caused by battery outage during extensive COVID-19 lockdowns that occurred in Melbourne during the testing period. The low-cost sensor had more data removed due to Criterion 3 than that of the GreenSpan, which could be explained by debris accumulation due to the untimely maintenance during the COVID-19 lockdown. At the outlet, the low-cost sensor and GreenSpan sensor had 3.4% and 1.5% of data removed, respectively. Delayed maintenance during the COVID-19 outbreak led to approximately 20% of data removal based on Criterion 6. Overall, around 55% of the data was removed, with delayed maintenance accounting for the largest portion of data loss (Table 3). Overall, there was not a big difference between total removed data percentages of the GreenSpan compared to the low-cost sensor.
3.3.2. Time Series Data Comparison
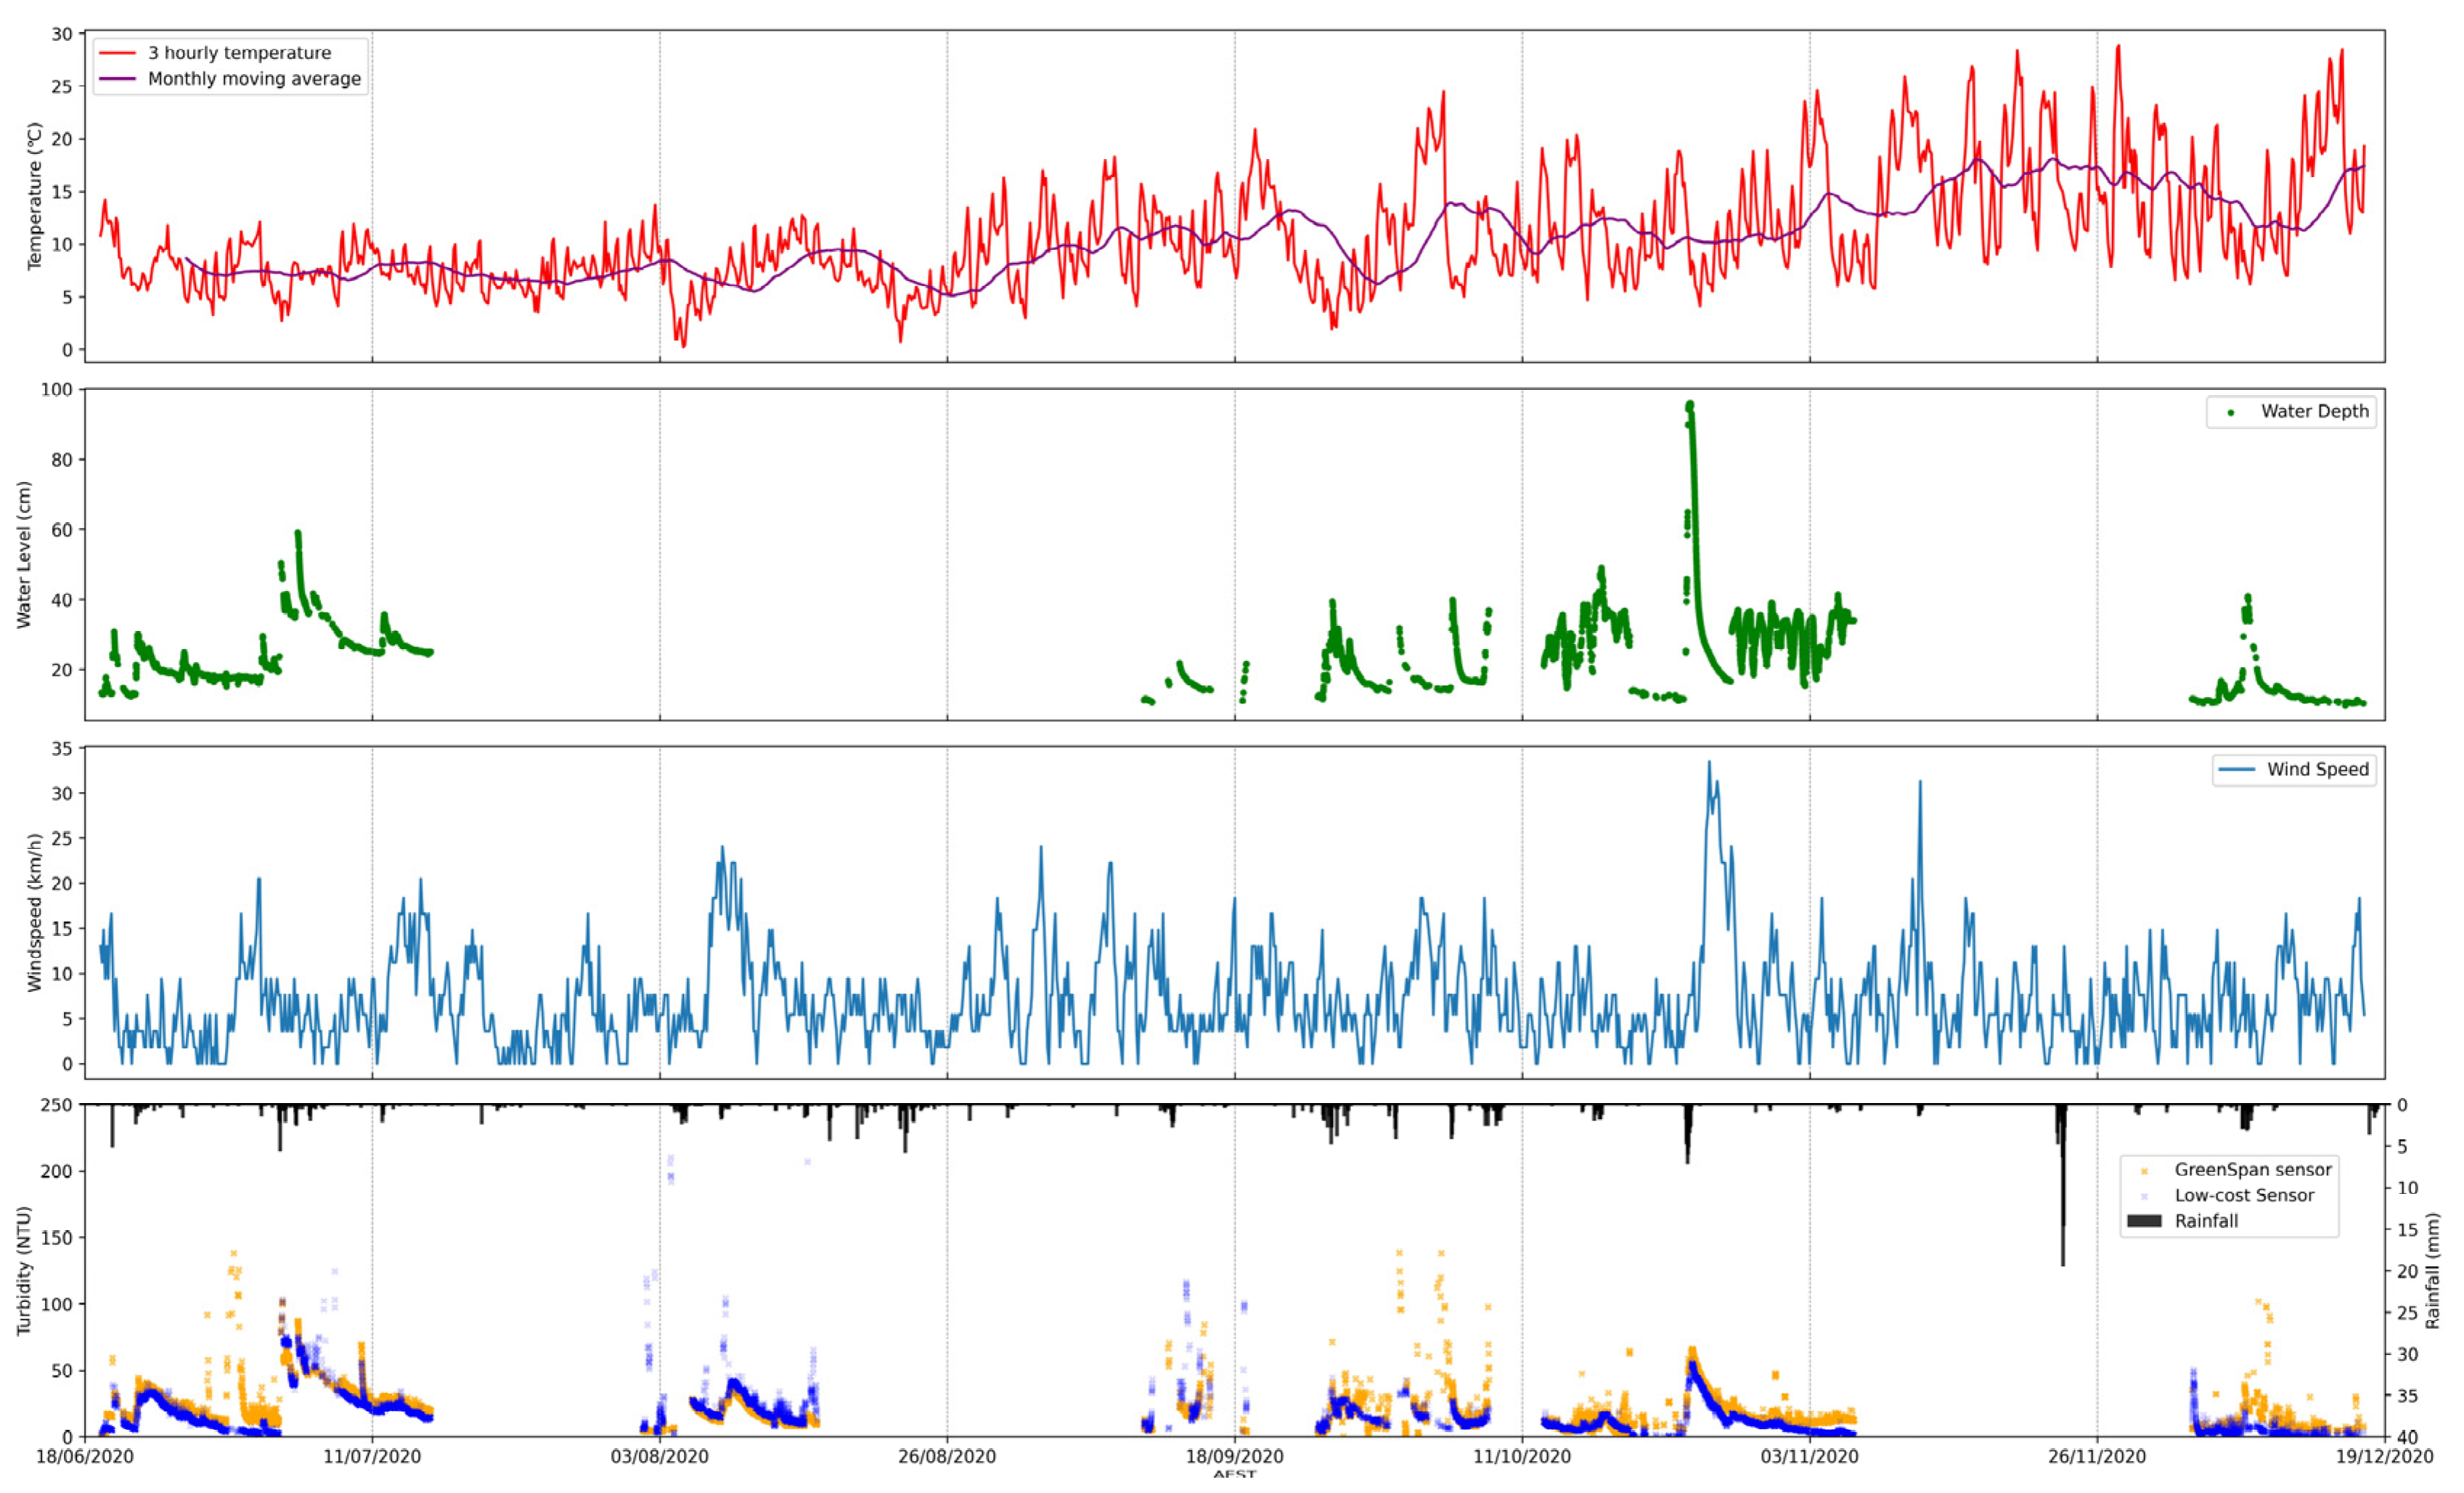
There is a strong positive relationship between rainfall and turbidity indicating that turbidity rises are consistently associated with rainfall events (Figure 4). The connection can be attributed to stormwater surface runoff, which transports sediments into the wetland, and the high flow that induces resuspension of sediment at the wetland bed [73]. Additionally, it is worth noting that the rising turbidity can also be influenced by the resuspension caused by wind and wave action [74]. This can be observed in the inlet data on June 30th, where not much rainfall was recorded but higher wind speeds were present.
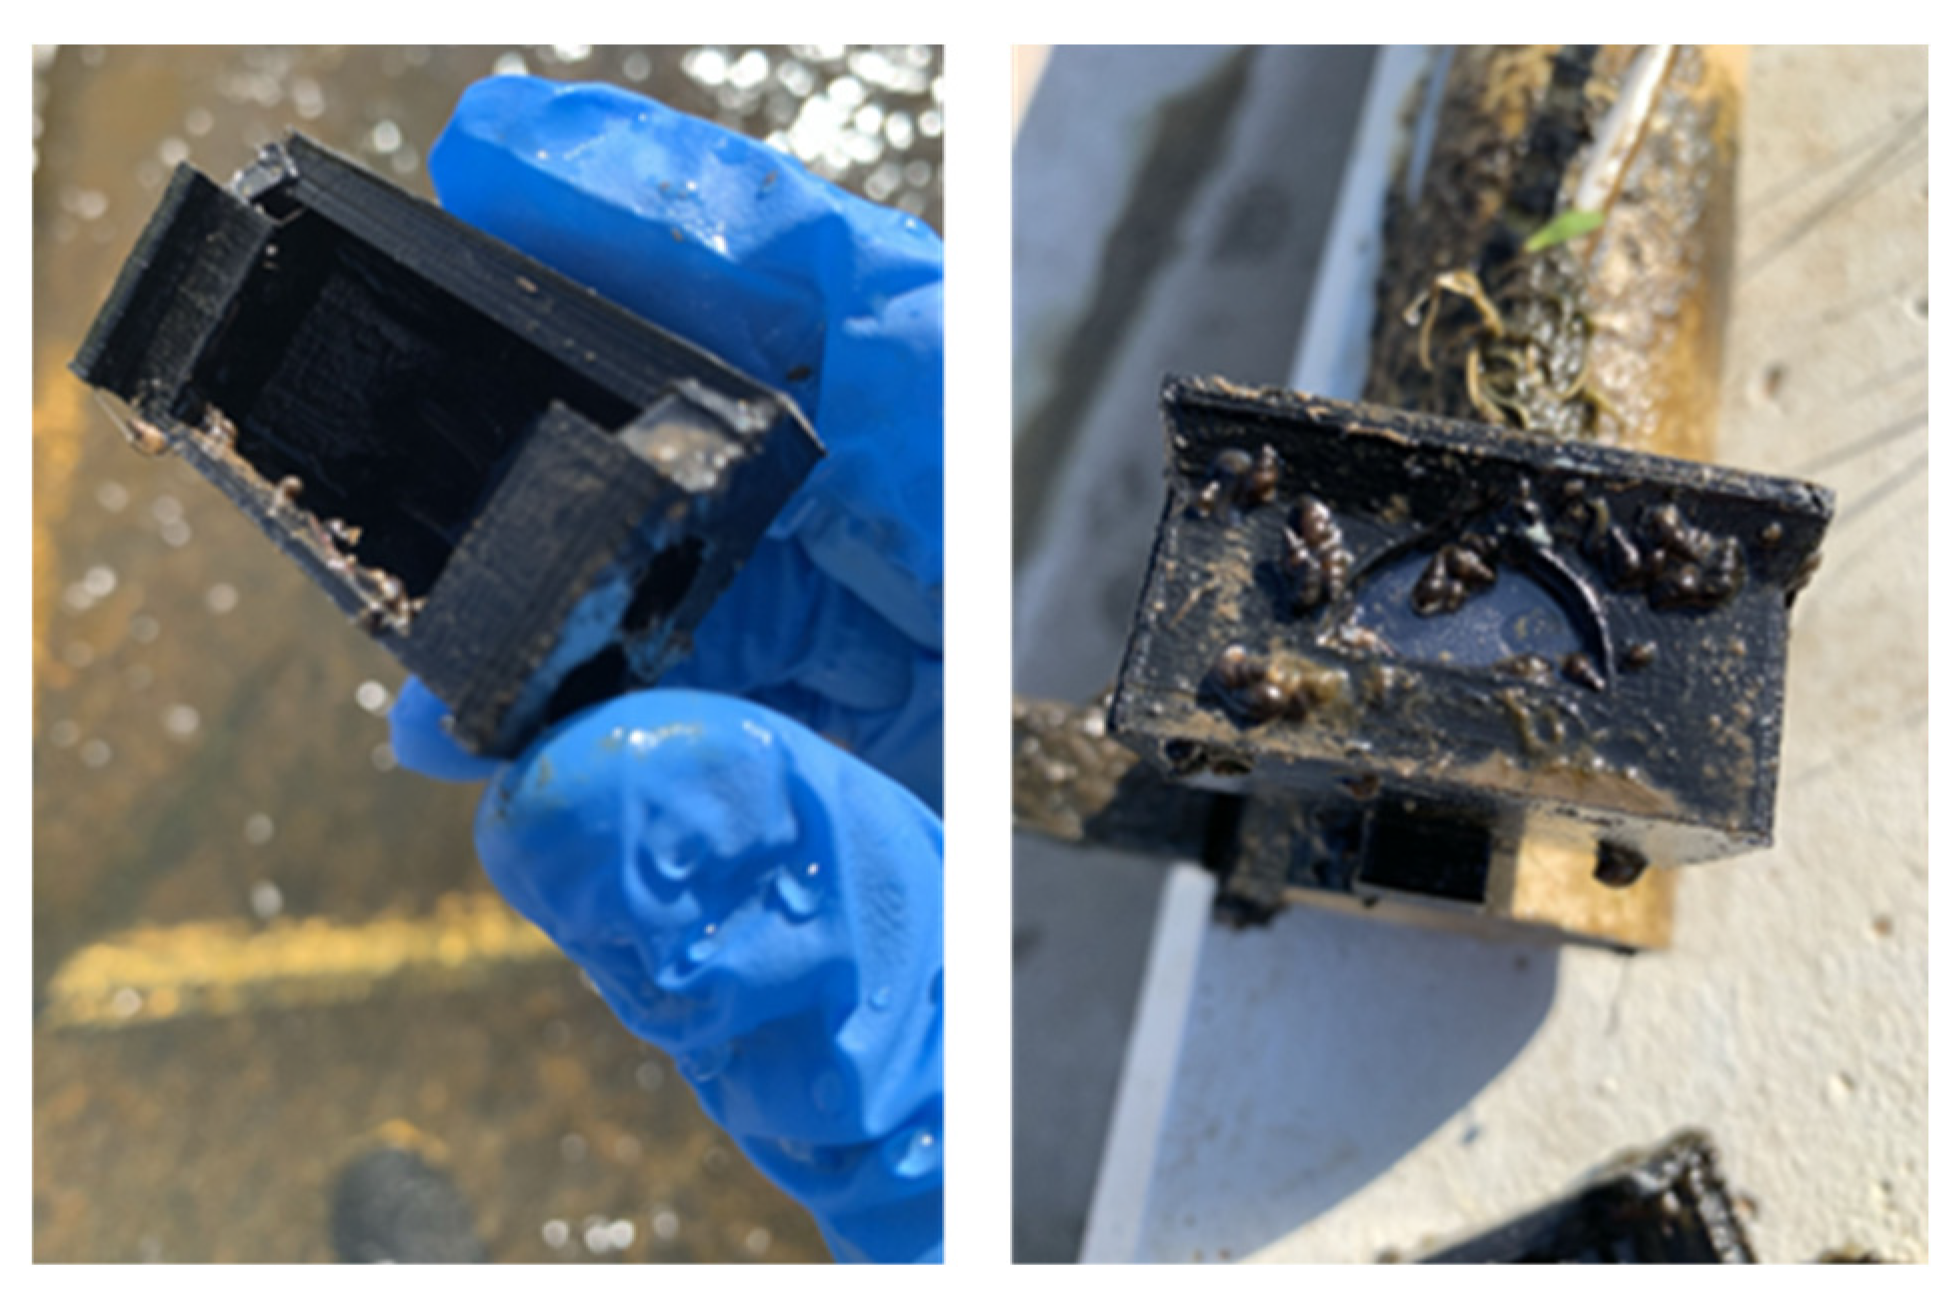
The comparison between the turbidity data collected by the GreenSpan and low-cost turbidity sensors reveals a generally similar trend and a good response to weather changes. However, some differences are observed during specific periods in the monitoring plots. In the inlet (Figure 4, top), the GreenSpan sensor tends to exhibit high turbidity readings mainly during rainfall events or periods of high wind speed, whereas the scatter points from the low-cost sensor often appear after rainfall events. The discrepancy is due to two main factors. Firstly, the uncovered GreenSpan sensor is more affected by water flow debris, unlike the low-cost sensor whose cover reduces debris impact. Secondly, the low-cost sensor's cover may trap debris and aquatic animals, leading to higher turbidity readings after high flow events. This also affects the data, with the GreenSpan sensor showing more variability. Sensor placement near the weir, where water depth increases, also contributes to the low-cost sensor's more stable results during rainfall-induced vortex turbulence.
3.3.3. Statistical Analysis of the Comparison between Our Low-Cost and the GreenSpan Sensors
There are statistically significant relationships between the low-cost and the GreenSpan turbidity sensor at both inlet (ρ = 0.69; p < 0.01) and outlet (ρ = 0.33; p < 0.01), demonstrating the performance of the low-cost novel sensor. The trend line slope at the inlet is 0.745 indicating that the majority of data points clustered around the identity line, with a few points exhibiting higher turbidity readings from the low-cost sensor. However, the outlet’s slope of 0.22 indicates that more data points fall below the identity line, suggesting higher turbidity readings from the GreenSpan sensor compared to the low-cost sensor.
Further interrogation of the outlet datasets shows that the GreenSpan sensor displays more scattered data points and outliers both during and after rainfall events (Figure 4). These irregularities are likely caused by the suspended sediments and debris within the turbulent flow during wet weather days, while with the help of the cover, less impacts were imposed to the low-cost sensor.
3.3.4. Biofouling Impact of the Sensors
Biofouling was detected for both low cost and Greenspan sensors, at both the inlet and the outlet (Figure 6, top left). Biofouling was more prominent when testing the sensors in low turbidity levels (25th percentile), where the difference between before and after cleaning was sometimes greater than 50%. The observed high relative difference in turbidity readings may stem from the low background turbidity levels, where minor changes can appear more significant, thus showing a higher percentage change. This effect diminishes in conditions of higher turbidity (at the 50th and 75th percentiles). Furthermore, instances where after-cleaning turbidity readings are lower than before-cleaning (indicated by a positive Rbio) can be attributed to the calibration procedure. During the calibration of low-cost sensors, the process begins with placing the "before-cleaning" sensor in the solution to take a reading, followed by measuring the solution's turbidity with a handheld turbidity meter. The sensor is then removed for cleaning and reinserted into the same solution for a “after-cleaning” reading. Removing the "before-cleaning" sensor can dislodge dirt and biofilm, contaminating the solution and potentially increasing its true turbidity, increasing the sensors voltage-drop and resulting in a modification to the calibration curve such that a positive Rbio is estimated. Despite these calibration discrepancies in the low-cost sensors, the Wilcoxon Rank Sum test reveal no significant differences between the low-cost and Greenspan sensors at both inlet and outlet locations, indicating that, statistically, the low-cost sensor and the GreenSpan sensor offer similar performance despite the variabilities observed.
Furthermore, the analysis of the relationship between deployment time and relative difference in turbidity readings, illustrated in Figure 6 (bottom left), showed no significant correlation. The data points scattered around the axis suggest that neither the low-cost or the GreenSpan sensor had a detectable biofouling trend with time. This indicates that time of deployment is not necessarily an important factor in governing the degree of biofouling and perhaps other factors (e.g. those that control algae growth, such nutrient levels and light exposure [75]) are more important for fouling of the sensors.
3.3.5. Drift of the Sensors
Drift of the sensors was observed for both sensors at both the inlet and the outlet deployment locations (Figure 6, top right). Drift was more apparent for the low-cost sensors than that of the GreenSpan (greater deviations from 0%; Figure 6, bottom right). Indeed, there was a significant difference detected between drift values obtained by GreenSpan and low-cost sensors at the inlet. This could be due to the quality of the plastic cover used to protect the low-cost device which may scratch more readily (as opposed to the glass on the GreenSpan) from high velocity debris at the inlet and because of frequent cleaning. Some differences observed here could be could also be attributed to the contamination of the calibration solution [76]. Similarly to the biofouling issue results, no significant relationship was found between the relative difference in drift and the cumulative deployment period (Figure 6, bottom right), suggesting that sensor scratching is likely not cumulative and perhaps occurs more episodic or acute in nature (e.g. a large scratch occurs once during maintenance, rather accumulation of smaller scratches overtime).
4. Conclusion
In conclusion, this paper presents the development and testing of a novel turbidity sensor, which has a low cost of around USD $23.50. The sensor's operational current and sleep mode current were measured, demonstrating its energy efficiency. Both laboratory experiments and field tests were conducted to validate the sensor's performance. The lab calibration established a linear relationship as the calibration curve for turbidity measurements. The field performance validation involved comparing the sensor's time series data with the GreenSpan sensor, and the results showed that the low-cost sensor effectively detected turbidity changes in the water column. The linear regression statistical test was applied to analyse the sensor data, which showed differences between the data, but a statistically significant relationship was still observed between the sensor results. No correlation was detected between biofouling and the deployment time of the sensors; however, discrepancies in readings were observed, likely originating from the calibration procedure. Furthermore, in the biofouling analysis of both sensors, no significant biofouling was found on either the low-cost sensor or the GreenSpan sensor. This implies that the same maintenance requirements could be applied to the low-cost sensor as to the GreenSpan sensor. Additionally, drift in the low-cost sensor readings was noted, which could be attributed to scratches resulting from harsh environmental conditions and frequent cleaning, this problem is linked to the quality of the transparent epoxy board and could be improved by further hardware enhancements. Overall, the low-cost turbidity sensor demonstrates a potential opportunity to apply the sensor to capture high temporal and spatial data from complex water systems.
Supplementary Materials
The following supporting information can be downloaded at: www.mdpi.com/xxx/s1, Please find the complete design files necessary to modify and build the sensors, along with the data used in the analysis of this study, in the supplementary materials.
Author Contributions
Conceptualization, M.W. and D.M.; methodology, M.W. and D.M.; software, M.W. and D.M.; validation, M.W and D.M.; formal analysis, M.W. and D.M.; investigation, M.W., D.M., B.S. and S.C.; resources, M.W., D.M., B.S. and S.C; data curation, M.W. and D.M.; writing—original draft preparation, M.W.; writing—review and editing, M.W., B.S., S.C. and D.M.; visualization, M.W. and D.M.; supervision, D.M.; project administration, D.M.; funding acquisition, D.M. All authors have read and agreed to the published version of the manuscript.
Funding
This research received no external funding.
Institutional Review Board Statement
Not applicable.
Informed Consent Statement
Not applicable.
Data Availability Statement
The data presented in this study are available in the supplementary materials.
Conflicts of Interest
The author declares there is no conflict of interest.
Appendix A Low-Cost Sensor Lab Test Results
Figure A-1.
Regression of measured turbidity and the low-cost sensor reading results, the blue dots indicate the measuring results vs the actual turbidity reading, the redline is the trend line of the best fits of the results, the red words displayed in the graphs indicate the equation of the trendline and the R square value.
Figure A-1.
Regression of measured turbidity and the low-cost sensor reading results, the blue dots indicate the measuring results vs the actual turbidity reading, the redline is the trend line of the best fits of the results, the red words displayed in the graphs indicate the equation of the trendline and the R square value.
Appendix B Sensor Time Series Data with the Weather Data
Figure B-1.
Turbidity and weather time series data at wetland inlet, from the top to the bottom, 1. Temperature during the monitoring period, red line indicates the 3 hourly temperature while the purple line is the monthly temperature moving average, 2. Water level at the monitoring point, 3. Hourly wind speed, 4. Turbidity sensor data from both sensors and the rainfall data.
Figure B-1.
Turbidity and weather time series data at wetland inlet, from the top to the bottom, 1. Temperature during the monitoring period, red line indicates the 3 hourly temperature while the purple line is the monthly temperature moving average, 2. Water level at the monitoring point, 3. Hourly wind speed, 4. Turbidity sensor data from both sensors and the rainfall data.
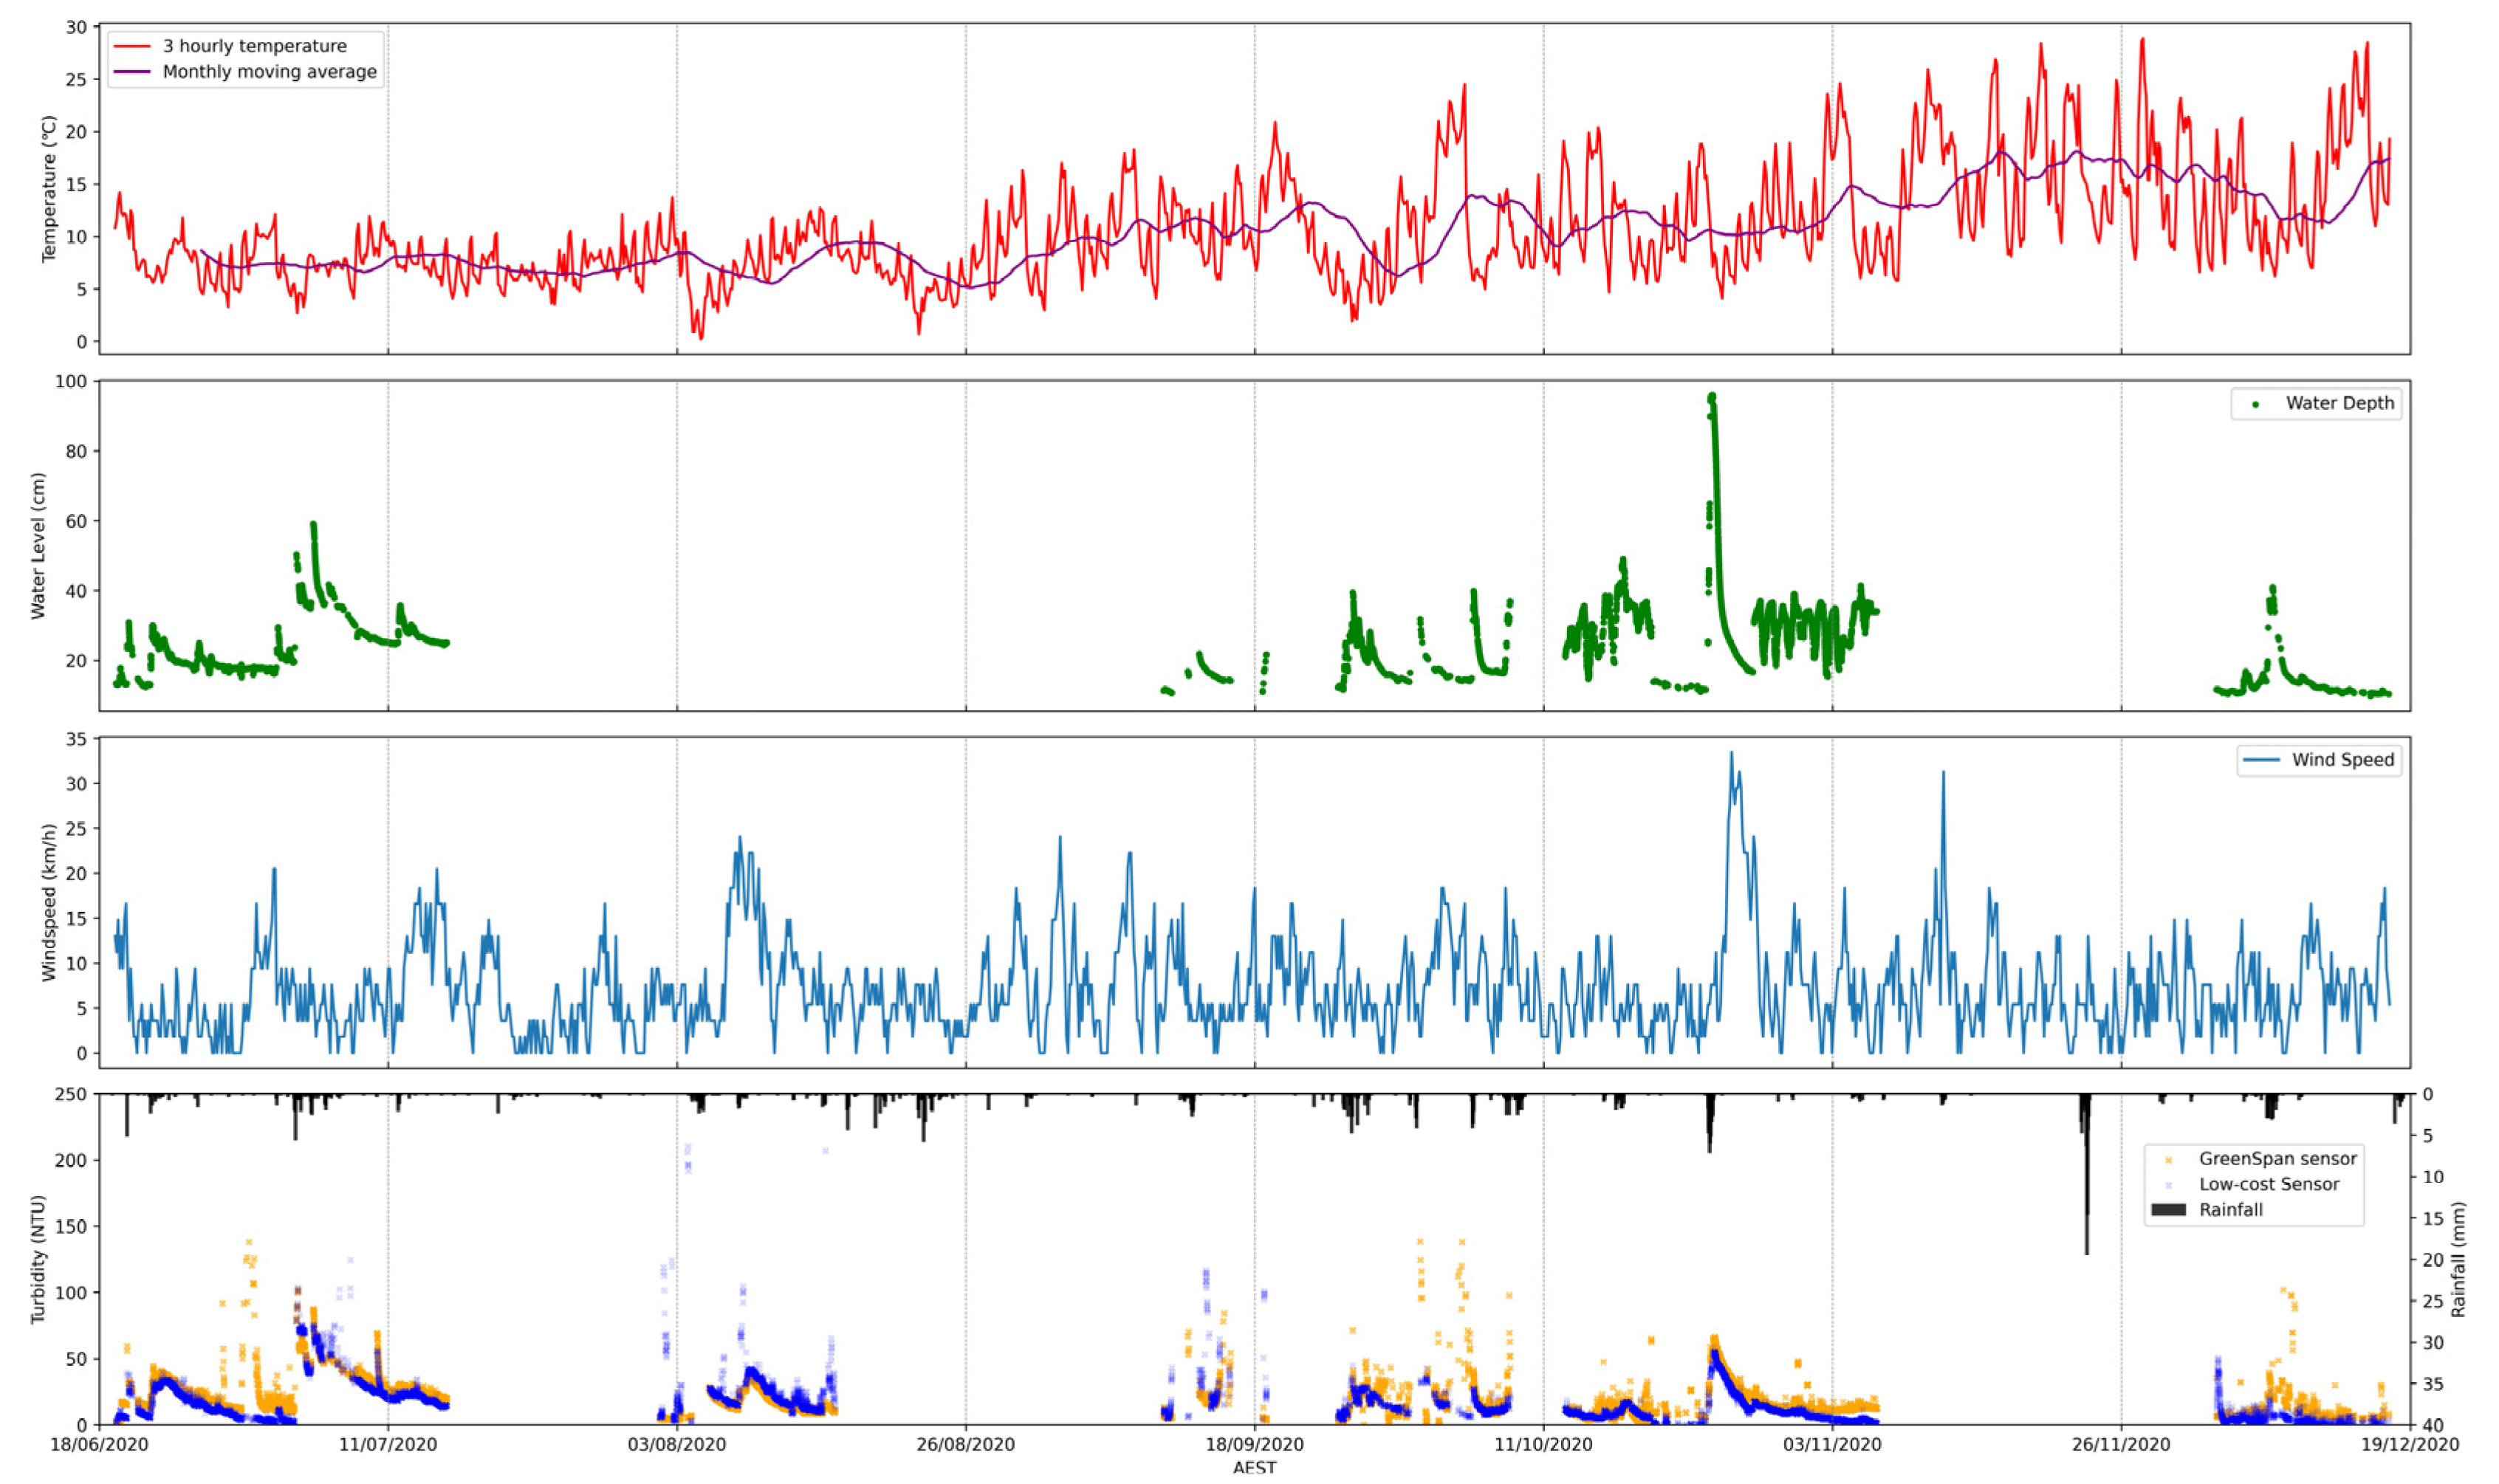
Figure B-1.
Turbidity and weather time series data at wetland outlet, from the top to the bottom, 1. Temperature during the monitoring period, red line indicates the 3 hourly temperature while the purple line is the monthly temperature moving average, 2. Water level at the monitoring point, 3. Hourly wind speed, 4. Turbidity sensor data from both sensors and the rainfall data.
Figure B-1.
Turbidity and weather time series data at wetland outlet, from the top to the bottom, 1. Temperature during the monitoring period, red line indicates the 3 hourly temperature while the purple line is the monthly temperature moving average, 2. Water level at the monitoring point, 3. Hourly wind speed, 4. Turbidity sensor data from both sensors and the rainfall data.
Appendix C Evidence of the Debris on the Low-Cost Turbidity Sensor Surface
Figure C-1.
Debris and aquatic animal (river snails) in the sensor cover and on the sensor surface.
Appendix D Relative Difference for Biofouling Issue
Figure D-1.
Relative difference between the after-cleaning turbidity and before-cleaning turbidity for each sensor, 25th percentile turbidity level (left) and 75th percentile turbidity level (right).
Figure D-1.
Relative difference between the after-cleaning turbidity and before-cleaning turbidity for each sensor, 25th percentile turbidity level (left) and 75th percentile turbidity level (right).
Appendix E Relative Difference for Drift Issue
Figure E-1.
Relative difference between the after-cleaning turbidity and after-cleaning turbidity for each sensor, 25th percentile turbidity level (left) and 75th percentile turbidity level (right).
Figure E-1.
Relative difference between the after-cleaning turbidity and after-cleaning turbidity for each sensor, 25th percentile turbidity level (left) and 75th percentile turbidity level (right).
References
- Gaffield, S.J.; Goo, R.L.; Richards, L.A.; Jackson, R.J. Public Health Effects of Inadequately Managed Stormwater Runoff. Am. J. Public Health 2003, 93, 1527–1533.
- Landsberg, J.H. The Effects of Harmful Algal Blooms on Aquatic Organisms. Rev. Fish. Sci. 2002, 10, 113–390.
- Loucks, D.P.; Van Beek, E. Water Resource Systems Planning and Management: An Introduction to Methods, Models, and Applications; Springer, 2017; ISBN 3319442341.
- Withanachchi, S.S.; Ghambashidze, G.; Kunchulia, I.; Urushadze, T.; Ploeger, A. Water Quality in Surface Water: A Preliminary Assessment of Heavy Metal Contamination of the Mashavera River, Georgia. Int. J. Environ. Res. Public Health 2018, 15, 1–25. [CrossRef]
- Jaskuła, J.; Sojka, M.; Fiedler, M.; Wróżyński, R. Analysis of Spatial Variability of River Bottom Sediment Pollution with Heavy Metals and Assessment of Potential Ecological Hazard for the Warta River, Poland. Minerals 2021, 11, 1–21. [CrossRef]
- Wilbers, G.J.; Becker, M.; Nga, L.T.; Sebesvari, Z.; Renaud, F.G. Spatial and Temporal Variability of Surface Water Pollution in the Mekong Delta, Vietnam. Sci. Total Environ. 2014, 485–486, 653–665. [CrossRef]
- Nafi, Z.; Rohaizah, N.; Zaharin, A. Spatial Variation Impact of Landscape Patterns and Land Use on Water Quality across an Urbanized Watershed in Bentong , Malaysia. Ecol. Indic. 2021, 122, 107254. [CrossRef]
- Shi, B.; Bach, P.M.; Lintern, A.; Zhang, K.; Coleman, R.A.; Metzeling, L.; McCarthy, D.T.; Deletic, A. Understanding Spatiotemporal Variability of In-Stream Water Quality in Urban Environments – A Case Study of Melbourne, Australia. J. Environ. Manage. 2019, 246, 203–213. [CrossRef]
- Bonhomme, C.; Petrucci, G. Should We Trust Build-up/Wash-off Water Quality Models at the Scale of Urban Catchments? Water Res. 2017, 108, 422–431. [CrossRef]
- Dotto, C.B.S.; Kleidorfer, M.; Deletic, A.; Fletcher, T.D.; McCarthy, D.T.; Rauch, W. Stormwater Quality Models: Performance and Sensitivity Analysis. Water Sci. Technol. 2010, 62, 837–843.
- Shi, B. Detecting and Understanding Urban Illicit Discharges by Utilising Newly Developed Low-Cost and IoT-Based Technologies. 2021.
- Liu, Y.; Chen, Y.; Fang, X. A Review of Turbidity Detection Based on Computer Vision. IEEE Access 2018, 6, 60586–60604. [CrossRef]
- Huey, G.M.; Meyer, M.L. Turbidity as an Indicator of Water Quality in Diverse Watersheds of the Upper Pecos River Basin. Water 2010, 2, 273–284.
- Lambrou, T.P.; Anastasiou, C.C.; Panayiotou, C.G. A Nephelometric Turbidity System for Monitoring Residential Drinking Water Quality. Lect. Notes Inst. Comput. Sci. Soc. Telecommun. Eng. 2010, 29 LNICST, 43–55. [CrossRef]
- Lloyd, D.S. Turbidity as a Water Quality Standard for Salmonid Habitats in Alaska. North Am. J. Fish. Manag. 1987, 7, 34–45.
- McCoy, W.F.; Olson, B.H. Relationship among Turbidity, Particle Counts and Bacteriological Quality within Water Distribution Lines. Water Res. 1986, 20, 1023–1029. [CrossRef]
- Organization, W.H. Water Quality and Health-Review of Turbidity: Information for Regulators and Water Suppliers. 2017.
- . Kitchener, B.G.B.; Wainwright, J.; Parsons, A.J. A Review of the Principles of Turbidity Measurement. Prog. Phys. Geogr. 2017, 41, 620–642. [CrossRef]
- Omar, A.F. Bin; MatJafri, M.Z. Bin Turbidimeter Design and Analysis: A Review on Optical Fiber Sensors for the Measurement of Water Turbidity. Sensors 2009, 9, 8311–8335. [CrossRef]
- Farrell, C.; Hassard, F.; Jefferson, B.; Leziart, T.; Nocker, A.; Jarvis, P. Turbidity Composition and the Relationship with Microbial Attachment and UV Inactivation Efficacy. Sci. Total Environ. 2018, 624, 638–647. [CrossRef]
- Reilly, J.K.; Kippin, J.S. Relationship of Bacterial Counts With Turbidity and Free Chlorine in Two Distribution Systems. J. / Am. Water Work. Assoc. 1983, 75, 309–312. [CrossRef]
- Romero, D.A.D.; Cristina, M.; Silva, D.A.; Cha, B.J.M. Biosand Filter as a Point-of-Use Water Treatment Technology : Influence of Turbidity on Microorganism Removal E Ffi Ciency. 2020.
- Kerkez, B.; Gruden, C.; Lewis, M.; Montestruque, L.; Quigley, M.; Wong, B.; Bedig, A.; Kertesz, R.; Braun, T.; Cadwalader, O.; et al. Smarter Stormwater Systems. Environ. Sci. Technol. 2016, 50, 7267–7273. [CrossRef]
- Duchrow, R.M.; Everhart, W.H. Turbidity Measurement. Trans. Am. Fish. Soc. 1971, 100, 682–690.
- McCarthy, D.T.; Hathaway, J.M.; Hunt, W.F.; Deletic, A. Intra-Event Variability of Escherichia Coli and Total Suspended Solids in Urban Stormwater Runoff. Water Res. 2012, 46, 6661–6670.
- Turbidity Sensor TS-1000A from Greenspan. Australian Made Sensors. Available online: https://www.essearth.com/product/ts1000-turbidity-sensor/ (accessed on 10 April 2024).
- Box, P.O.; Deventer, A.E.; Engineering, C.; Box, P.O.; Delft, G.A.; Engineering, C.; Box, P.O.; Delft, G.A. On Monitoring of Turbidity in Sewers Guy J.R. Henckens*, Robin G. Veldkamp** and Tonny D. Schuit*** *. 2004.
- Adzuan, M.A.; Azman, A.A.; Rahiman, M.H.F. Design and Development of Infrared Turbidity Sensor for Aluminium Sulfate Coagulant Process. In Proceedings of the 2017 IEEE 8th Control and System Graduate Research Colloquium, ICSGRC 2017 - Proceedings; 2017.
- Aiestaran, P.; Arrue, J.; Zubia, J. Design of a Sensor Based on Plastic Optical Fibre (POF) to Measure Fluid Flow and Turbidity. Sensors 2009, 9, 3790–3800. [CrossRef]
- Wei, J.; Qin, F.; Li, G.; Li, X.; Liu, X.; Dai, X. Chirp Modulation Enabled Turbidity Measurement for Large Scale Monitoring of Fresh Water. Meas. J. Int. Meas. Confed. 2021, 184, 109989. [CrossRef]
- Wen, Y.; Hu, Y.; Wang, X. Application of a Colorimeter for Turbidity Measurement. J. Phys. Conf. Ser. 2016, 679. [CrossRef]
- Alimorong, F.M.L.S.; Apacionado, H.A.D.; Villaverde, J.F. Arduino-Based Multiple Aquatic Parameter Sensor Device for Evaluating PH, Turbidity, Conductivity and Temperature. 2020 IEEE 12th Int. Conf. Humanoid, Nanotechnology, Inf. Technol. Commun. Control. Environ. Manag. HNICEM 2020 2020. [CrossRef]
- Wiranto, G.; Hermida, I.D.P.; Fatah, A.; Waslaluddin Design and Realisation of a Turbidimeter Using TSL250 Photodetector and Arduino Microcontroller. In Proceedings of the IEEE International Conference on Semiconductor Electronics, Proceedings, ICSE; 2016; Vol. 2016-September.
- Yao, Y.; Wang, Y.; Yan, J.; Wang, D. A Low-Cost Portable Optical Fiber-Based Sensor for Water Turbidity Measurement. 2019 4th Optoelectron. Glob. Conf. OGC 2019 2019, 131–135. [CrossRef]
- Zang, Z.; Qiu, X.; Guan, Y.; Zhang, E.; Liu, Q.; He, X.; Guo, G.; Li, C.; Yang, M. A Novel Low-Cost Turbidity Sensor for in-Situ Extraction in TCM Using Spectral Components of Transmitted and Scattered Light. Meas. J. Int. Meas. Confed. 2020, 160, 107838. [CrossRef]
- Wang, Y.; Rajib, S.M.S.M.; Collins, C.; Grieve, B. Low-Cost Turbidity Sensor for Low-Power Wireless Monitoring of Fresh-Water Courses. IEEE Sens. J. 2018, 18, 4689–4696. [CrossRef]
- Arifin, A.; Irwan, I.; Abdullah, B.; Tahir, D. Design of Sensor Water Turbidity Based on Polymer Optical Fiber. In Proceedings of the 2017 International Seminar on Sensors, Instrumentation, Measurement and Metrology (ISSIMM); IEEE, 2017; pp. 146–149.
- Azman, A.A.; Hezri, M.; Rahiman, F.; Nasir, M.; Mara, U.T. A Low Cost Nephelometric Turbidity Sensor for Continual Domestic Water Quality Monitoring System. 2016, 202–207.
- Bayram, A.; Yalcin, E.; Demic, S.; Gunduz, O.; Solmaz, M.E. Development and Application of a Low-Cost Smartphone-Based Turbidimeter Using Scattered Light. Appl. Opt. 2018, 57, 5935–5940.
- Kelley, C.D.; Krolick, A.; Brunner, L.; Burklund, A.; Kahn, D.; Ball, W.P.; Weber-Shirk, M. An Affordable Open-Source Turbidimeter. Sensors 2014, 14, 7142–7155.
- Bilro, L.; Prats, S.A.; Pinto, J.L.; Keizer, J.J.; Nogueira, R.N. Design and Performance Assessment of a Plastic Optical Fibre-Based Sensor for Measuring Water Turbidity. Meas. Sci. Technol. 2010, 21. [CrossRef]
- . Flores, G.; Rodriguez-Mata, A.E.; Amabilis-Sosa, L.E.; Gonzalez-Huitron, V.A.; Hernández-González, O.; Lopéz-Peréz, P.A. A Turbidity Sensor Development Based on NL-PI Observers: Experimental Application to the Control of a Sinaloa’s River Spirulina Maxima Cultivation. Open Chem. 2020, 18, 1349–1361. [CrossRef]
- . García, A.; Pérez, M.A.; Ortega, G.J.G.; Dizy, J.T. A New Design of Low-Cost Four-Beam Turbidimeter by Using Optical Fibers. IEEE Trans. Instrum. Meas. 2007, 56, 907–912. [CrossRef]
- Gillett, D.; Marchiori, A. A Low-Cost Continuous Turbidity Monitor. Sensors (Switzerland) 2019, 19, 1–18. [CrossRef]
- Kitchener, B.G.B.; Dixon, S.D.; Howarth, K.O.; Parsons, A.J.; Wainwright, J.; Bateman, M.D.; Cooper, J.R.; Hargrave, G.K.; Long, E.J.; Hewett, C.J.M. A Low-Cost Bench-Top Research Device for Turbidity Measurement by Radially Distributed Illumination Intensity Sensing at Multiple Wavelengths. HardwareX 2019, 5. [CrossRef]
- Kirkey, W.D.; Bonner, J.S.; Fuller, C.B. Low-Cost Submersible Turbidity Sensors Using Low-Frequency Source Light Modulation. IEEE Sens. J. 2018, 18, 9151–9162. [CrossRef]
- Metzger, M.; Konrad, A.; Blendinger, F.; Modler, A.; Meixner, A.J.; Bucher, V.; Brecht, M. Low-Cost GRIN-Lens-Based Nephelometric Turbidity Sensing in the Range of 0.1–1000 NTU. Sensors (Switzerland) 2018, 18. [CrossRef]
- Osman, S.O.; Mohamed, M.Z.; Suliman, A.M.; Mohammed, A.A. Design and Implementation of a Low-Cost Real-Time In-Situ Drinking Water Quality Monitoring System Using Arduino. 2018 Int. Conf. Comput. Control. Electr. Electron. Eng. ICCCEEE 2018 2018, 0–6. [CrossRef]
- Parra, L.; Rocher, J.; Escrivá, J.; Lloret, J. Design and Development of Low Cost Smart Turbidity Sensor for Water Quality Monitoring in Fish Farms. Aquac. Eng. 2018, 81, 10–18. [CrossRef]
- . Samah, A.H.A.; Rahman, M.F.A.; Omar, A.F.; Ahmad, K.A.; Yahaya, S.Z. Sensing Mechanism of Water Turbidity Using LED for in Situ Monitoring System. 2017 IEEE 7th Int. Conf. Underw. Syst. Technol. Theory Appl. USYS 2017 2018, 2018-Janua, 1–6. [CrossRef]
- . Siahaan, A.P.U.; Silitonga, N.; Iqbal, M.; Aryza, S.; Fitriani, W.; Ramadhan, Z.; Tharo, Z.; Rusiadi; Hidayat, R.; Hasibuan, H.A.; et al. Arduino Uno-Based Water Turbidity Meter Using LDR and LED Sensors. Int. J. Eng. Technol. 2018, 7. [CrossRef]
- Siahaan, I.A.; Mutiara, G.A.; Sani, M.I. A Low-Cost Water Quality Monitoring Based on Photodiode and LDR. In Proceedings of the 2021 IEEE Asia Pacific Conference on Wireless and Mobile (APWiMob); IEEE, 2021; pp. 141–146.
- Sampedro, Ó.; Salgueiro, J.R. Turbidimeter and RGB Sensor for Remote Measurements in an Aquatic Medium. Meas. J. Int. Meas. Confed. 2015, 68, 128–134. [CrossRef]
- Jiang, H.; Hu, Y.; Yang, H.; Wang, Y.; Ye, S. A Highly Sensitive Deep-Sea In-Situ Turbidity Sensor with Spectrum Optimization Modulation-Demodulation Method. IEEE Sens. J. 2020, 20, 6441–6449. [CrossRef]
- Bradley, L.J.; Wright, N.G. Optimising SD Saving Events to Maximise Battery Lifetime for Arduino TM / Atmega328P Data Loggers. 2020. [CrossRef]
- Catsamas, S.; Shi, B.; Wang, M.; Xiao, J.; Kolotelo, P.; McCarthy, D. A Low-Cost Radar-Based IoT Sensor for Noncontact Measurements of Water Surface Velocity and Depth. Sensors 2023, 23. [CrossRef]
- Semiconductors, V. Vishay Semiconductors High Speed Infrared Emitting Diode , 850 Nm , SYMBOL Vishay Semiconductors. 1–5.
- Shi, B.; Catsamas, S.; Kolotelo, P.; Wang, M.; Lintern, A.; Jovanovic, D.; Bach, P.M.; Deletic, A.; McCarthy, D.T. A Low-cost Water Depth and Electrical Conductivity Sensor for Detecting Inputs into Urban Stormwater Networks. Sensors 2021, 21. [CrossRef]
- Schnurr, P.J.; Espie, G.S.; Allen, D.G. The Effect of Light Direction and Suspended Cell Concentrations on Algal Biofilm Growth Rates. Appl. Microbiol. Biotechnol. 2014, 98, 8553–8562. [CrossRef]
- B3D - PETG Filament - 1.75 Mm - Black - 1kg Spool Details Available online: https://www.b3d.com.au/DispProd.asp?CatID=19&SubCatID=138&ProdID=PETG175Black1 (accessed on 8 June 2023).
- Sampedro, Ó.; Salgueiro, J.R. Turbidimeter and RGB Sensor for Remote Measurements in an Aquatic Medium. 2015, 68, 128–134. [CrossRef]
- Davies-Colley, R.J.; Smith, D.G. Turbidity Suspeni) Ed Sediment, and Water Clarity: A Review 1. JAWRA J. Am. Water Resour. Assoc. 2001, 37, 1085–1101.
- Birch, G.F.; Matthai, C.; Fazeli, M.S.; Suh, J.Y. Efficiency of a Constructed Wetland in Removing Contaminants from Stormwater. Wetlands 2004, 24, 459–466. [CrossRef]
- Garcia Chanc, L.M.; Van Brunt, S.C.; Majsztrik, J.C.; White, S.A. Short- and Long-Term Dynamics of Nutrient Removal in Floating Treatment Wetlands. Water Res. 2019, 159, 153–163. [CrossRef]
- Greenway, M. Wetlands and Ponds for Stormwater Treatment in Subtropical Australia: Their Effectiveness in Enhancing Biodiversity and Improving Water Quality? J. Contemp. Water Res. Educ. 2010, 146, 22–38. [CrossRef]
- Guerrero, J.; Mahmoud, A.; Alam, T.; Chowdhury, M.A.; Adetayo, A.; Ernest, A.; Jones, K.D. Water Quality Improvement and Pollutant Removal by Two Regional Detention Facilities with Constructedwetlands in South Texas. Sustain. 2020, 12. [CrossRef]
- BoSL Board v0.4 - BoSL Wiki Available online: https://www.bosl.com.au/wiki/BoSL_Board_v0.4 (accessed on 10 April 2024).
- Mourad, M.; Bertrand-Krajewski, J.L. A Method for Automatic Validation of Long Time Series of Data in Urban Hydrology. Water Sci. Technol. 2002, 45, 263–270. [CrossRef]
- Gama, J.; Sebastião, R.; Rodrigues, P.P. On Evaluating Stream Learning Algorithms. Mach. Learn. 2013, 90, 317–346. [CrossRef]
- Mouss, H.; Mouss, D.; Mouss, N.; Sefouhi, L. Test of Page-Hinckley, an Approach for Fault Detection in an Agro-Alimentary Production System. 2004 5th Asian Control Conf. 2004, 2, 815–818. [CrossRef]
- Sedgwick, P. Pearson’s Correlation Coefficient. BMJ 2012, 345, 1–2. [CrossRef]
- Bridge, P.D.; Sawilowsky, S.S. Increasing Physicians ’ Awareness of the Impact of Statistics on Research Outcomes : Comparative Power of the t-Test and Wilcoxon Rank-Sum Test in Small Samples Applied Research. 1999, 52, 229–235.
- Solano-Rivera, V.; Geris, J.; Granados-Bolaños, S.; Brenes-Cambronero, L.; Artavia-Rodríguez, G.; Sánchez-Murillo, R.; Birkel, C. Exploring Extreme Rainfall Impacts on Flow and Turbidity Dynamics in a Steep, Pristine and Tropical Volcanic Catchment. Catena 2019, 182, 104118.
- Bever, A.J.; MacWilliams, M.L.; Fullerton, D.K. Influence of an Observed Decadal Decline in Wind Speed on Turbidity in the San Francisco Estuary. Estuaries and Coasts 2018, 41, 1943–1967.
- Schnurr, P.J.; Allen, D.G. Factors Affecting Algae Biofilm Growth and Lipid Production: A Review. Renew. Sustain. Energy Rev. 2015, 52, 418–429.
- Carroll, M.; Chigounis, D.; Gilbert, S.; Gundersen, K.; Hayashi, K.; Janzen, C.; Johengen, T.; Koles, T.; McKissack, T.; McIntyre, M. Performance Verification Statement for the YSI 6600 EDS Sonde and 6136 Turbidity Sensor. 2006.
Figure 1.
(a) circuit diagram of the innovative turbidity sensor, (b) PCB of the turbidity sensor (left for front side, right for back side), (c) assembled innovative turbidity sensor, (d) turbidity sensor with cover.
Figure 1.
(a) circuit diagram of the innovative turbidity sensor, (b) PCB of the turbidity sensor (left for front side, right for back side), (c) assembled innovative turbidity sensor, (d) turbidity sensor with cover.
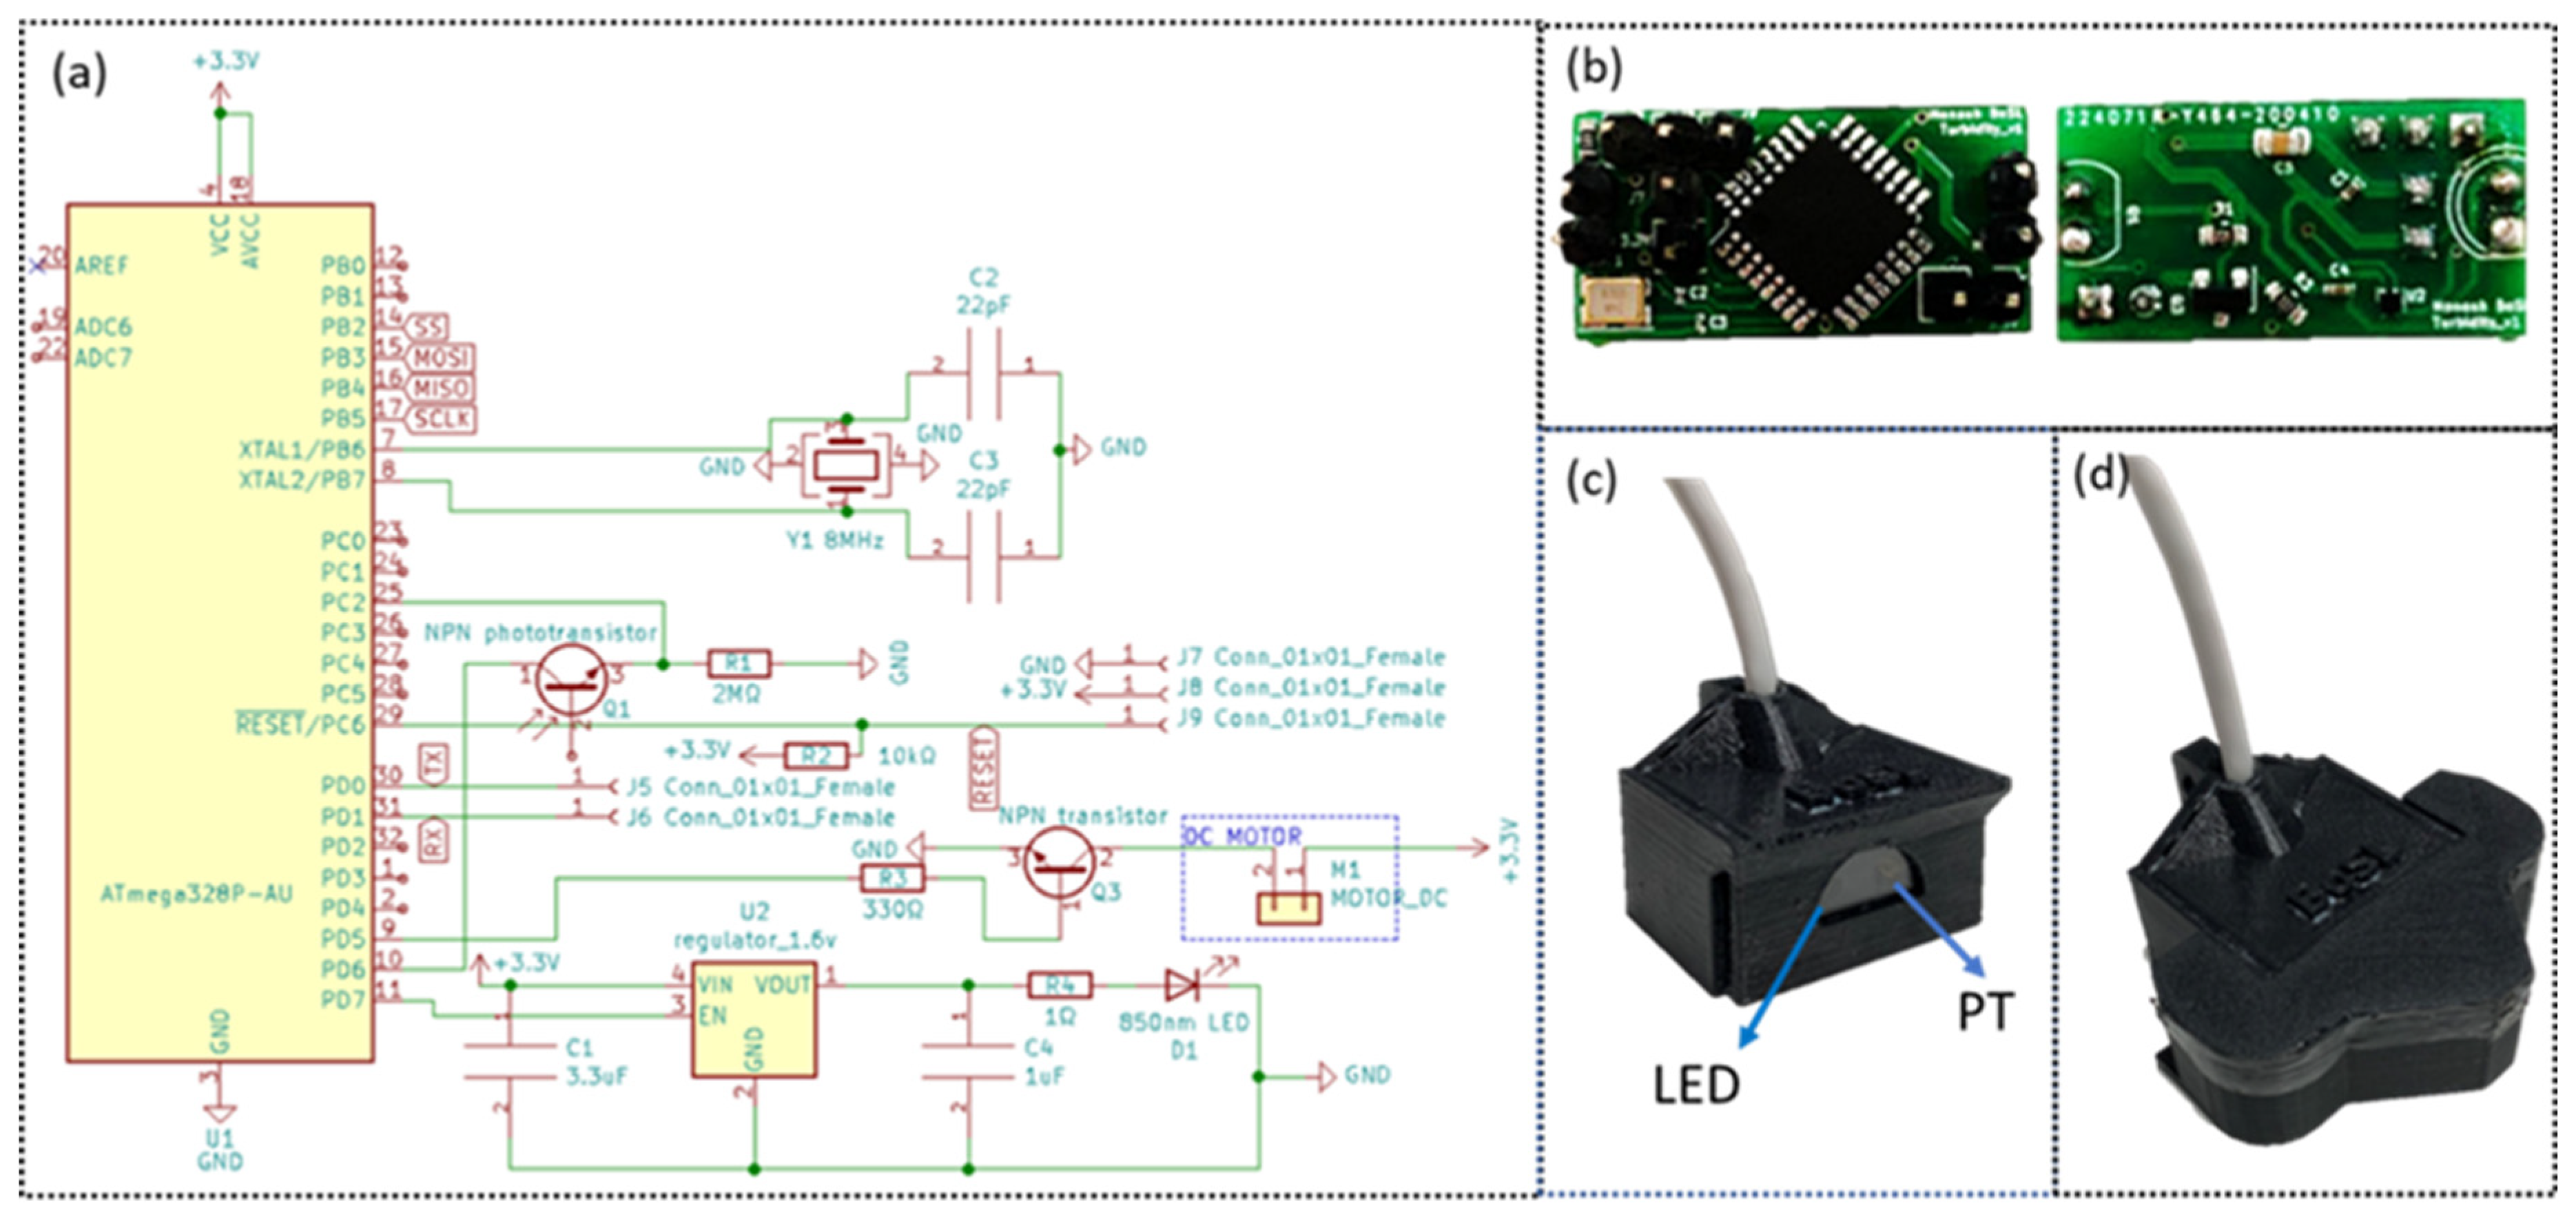
Figure 2.
(a) low-cost sensors fixed on the PVC pipe, (b) low-cost sensor logger box, (c) low-cost sensor package in the wetland.
Figure 2.
(a) low-cost sensors fixed on the PVC pipe, (b) low-cost sensor logger box, (c) low-cost sensor package in the wetland.
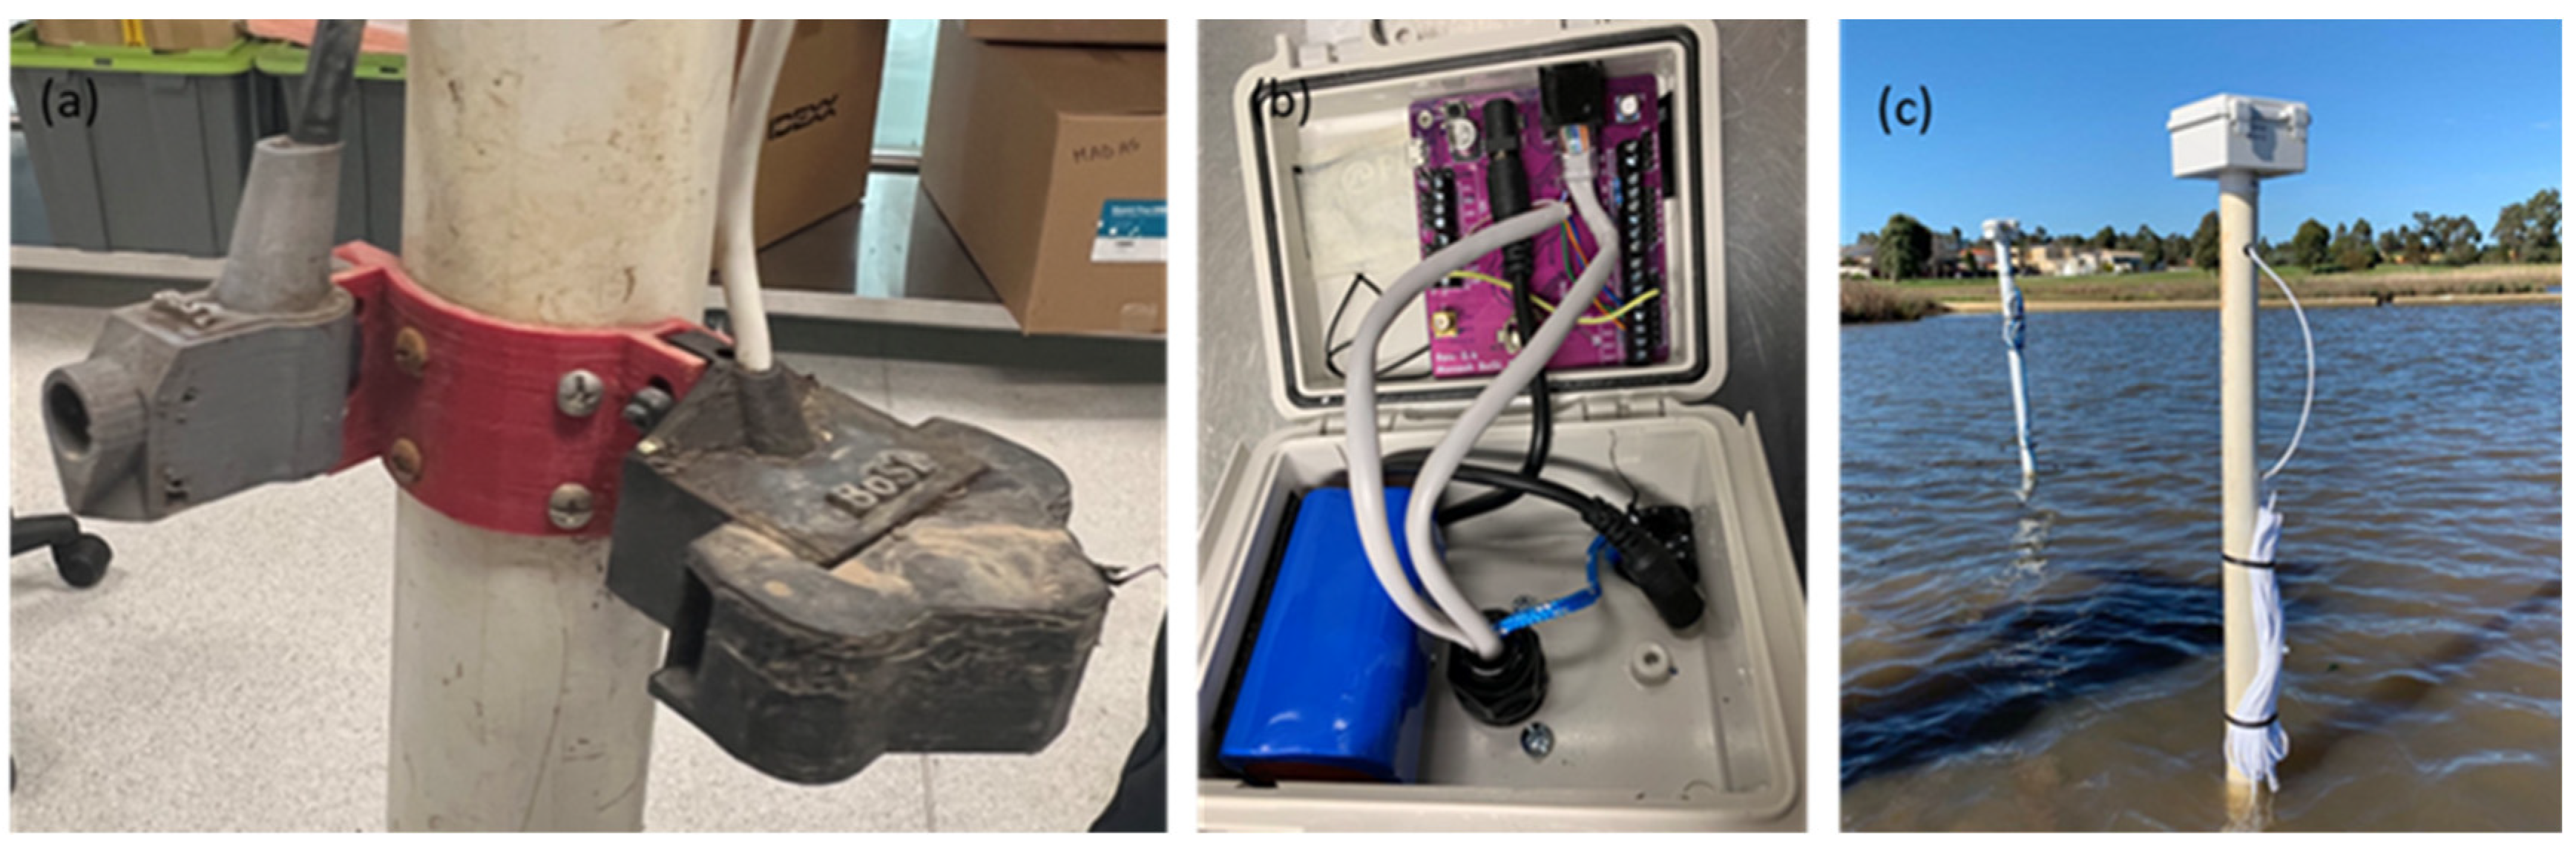
Figure 3.
Regression of measured turbidity and the low-cost sensor’s outputs, the blue dots indicate the measuring results vs the actual turbidity reading, the red dash line is the trend line of the best fits of the results, the red words displayed in the graphs indicate the equation of the trendline and the R square value.
Figure 3.
Regression of measured turbidity and the low-cost sensor’s outputs, the blue dots indicate the measuring results vs the actual turbidity reading, the red dash line is the trend line of the best fits of the results, the red words displayed in the graphs indicate the equation of the trendline and the R square value.
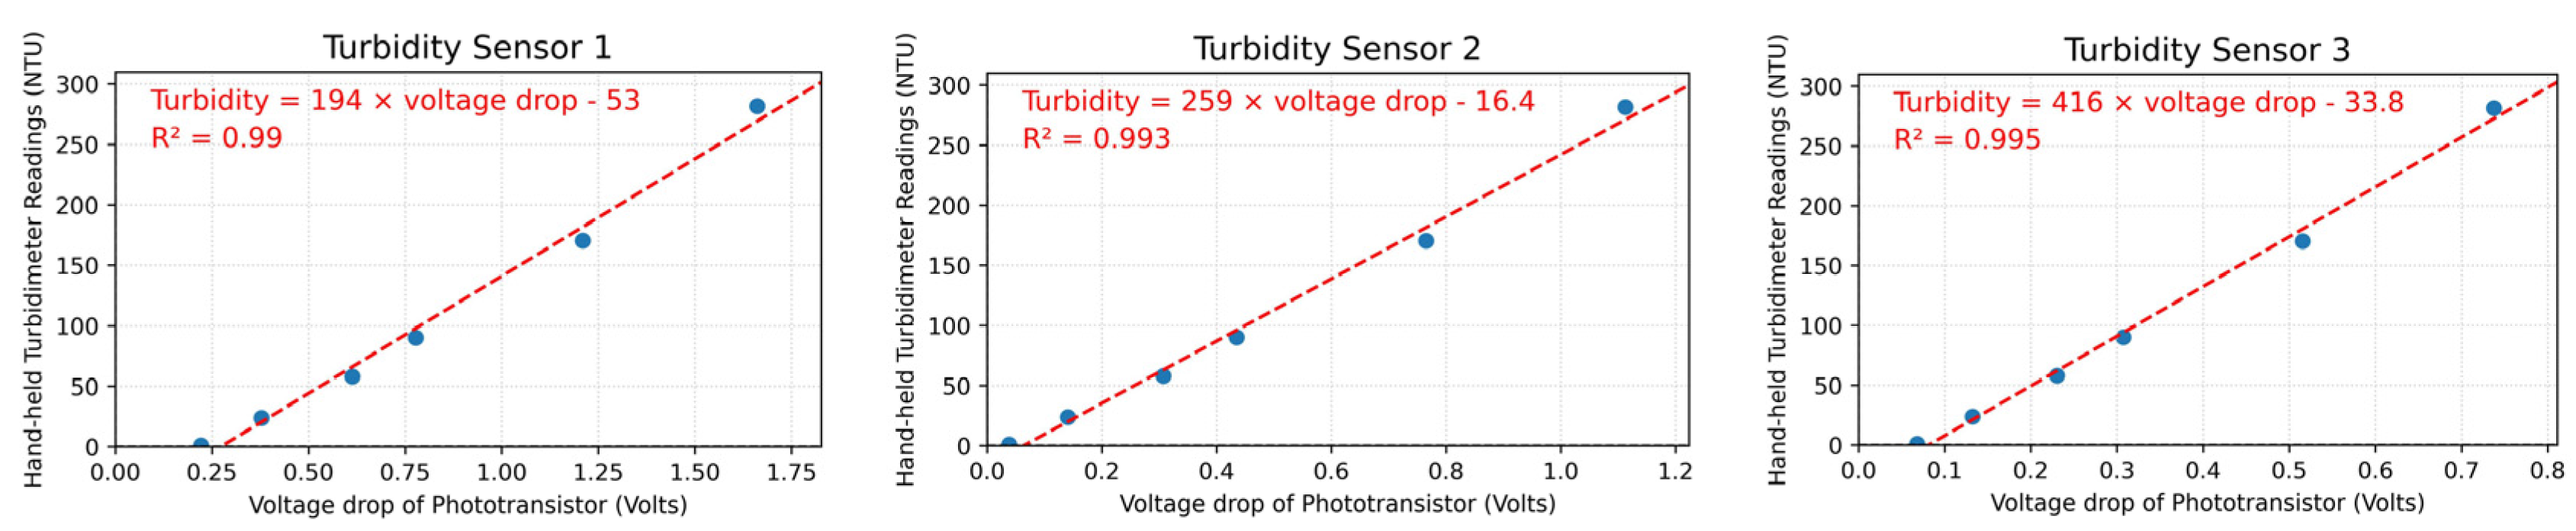
Figure 4.
Time series data (after cleaning) comparison between Low-cost sensor and GreenSpan sensor, the top diagram shows the comparison of the inlet data, the bottom diagram shows the comparison of the outlet data.
Figure 4.
Time series data (after cleaning) comparison between Low-cost sensor and GreenSpan sensor, the top diagram shows the comparison of the inlet data, the bottom diagram shows the comparison of the outlet data.
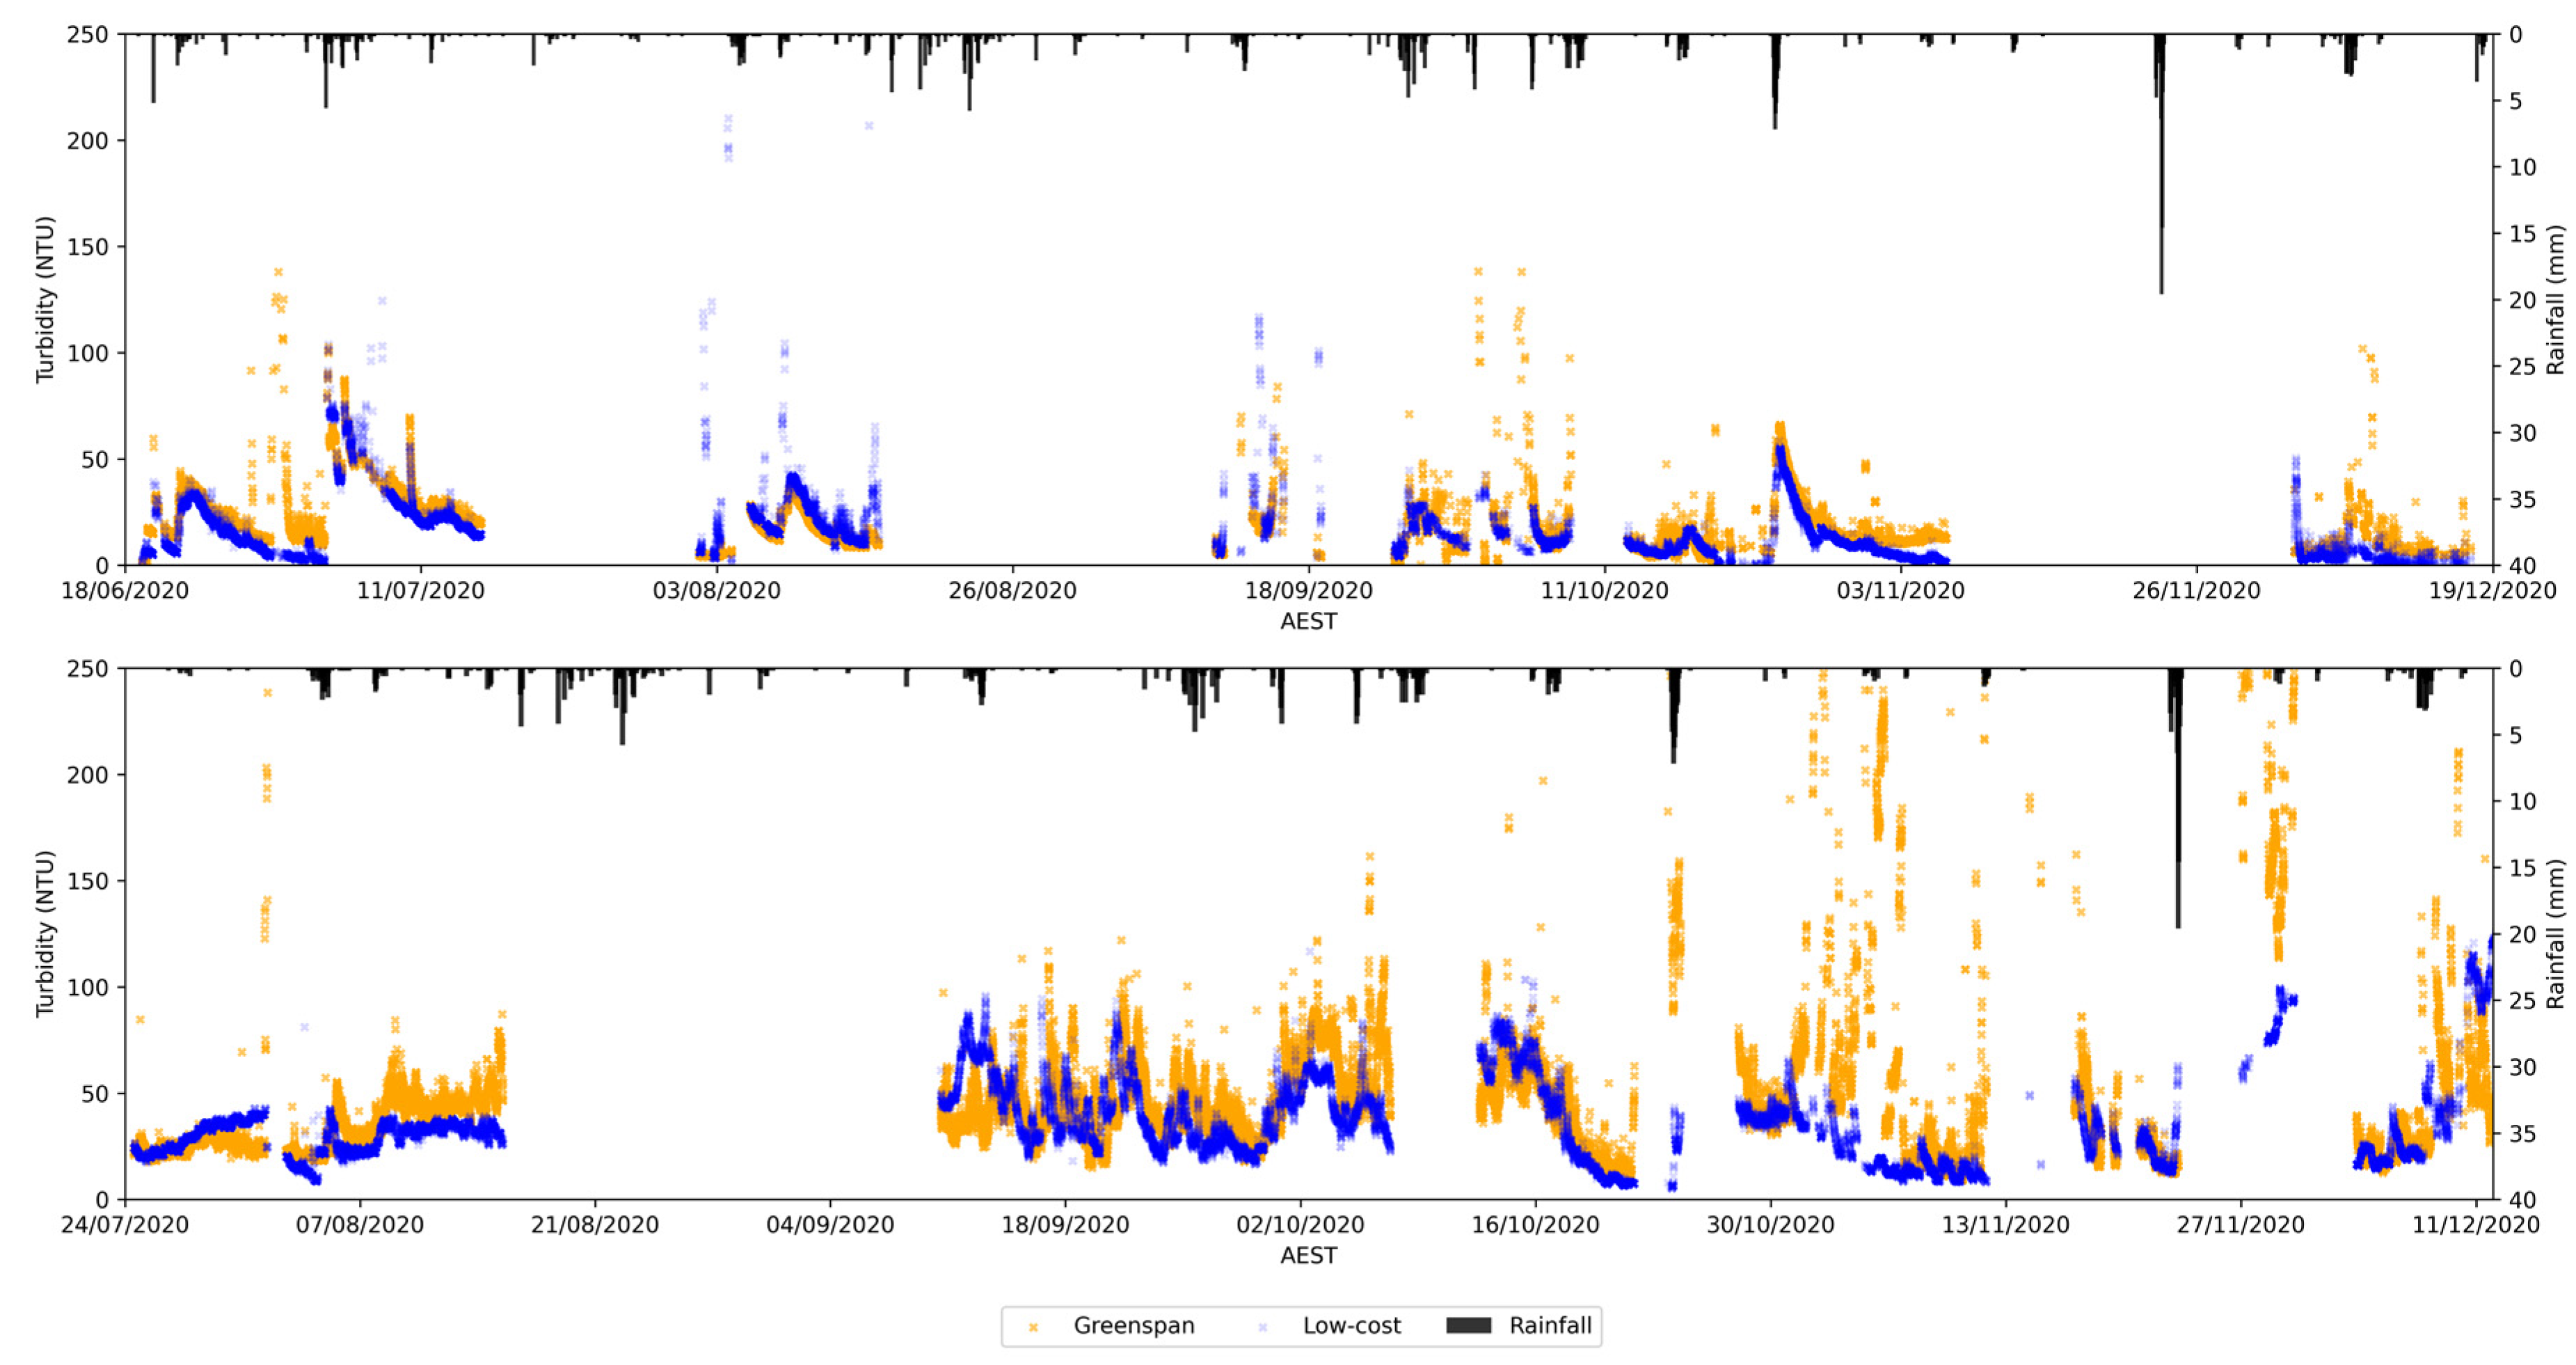
Figure 5.
Plot of the GreenSpan sensor results vs Low-cost sensor results at both wetland inlet (left) and outlet (right), the black dash line shows the identity line, and the red dash line is the best fit line for the data series, linear trendline equation is shown in red colour, the R value and p-value of Pearson test are shown in the diagram respectively.
Figure 5.
Plot of the GreenSpan sensor results vs Low-cost sensor results at both wetland inlet (left) and outlet (right), the black dash line shows the identity line, and the red dash line is the best fit line for the data series, linear trendline equation is shown in red colour, the R value and p-value of Pearson test are shown in the diagram respectively.
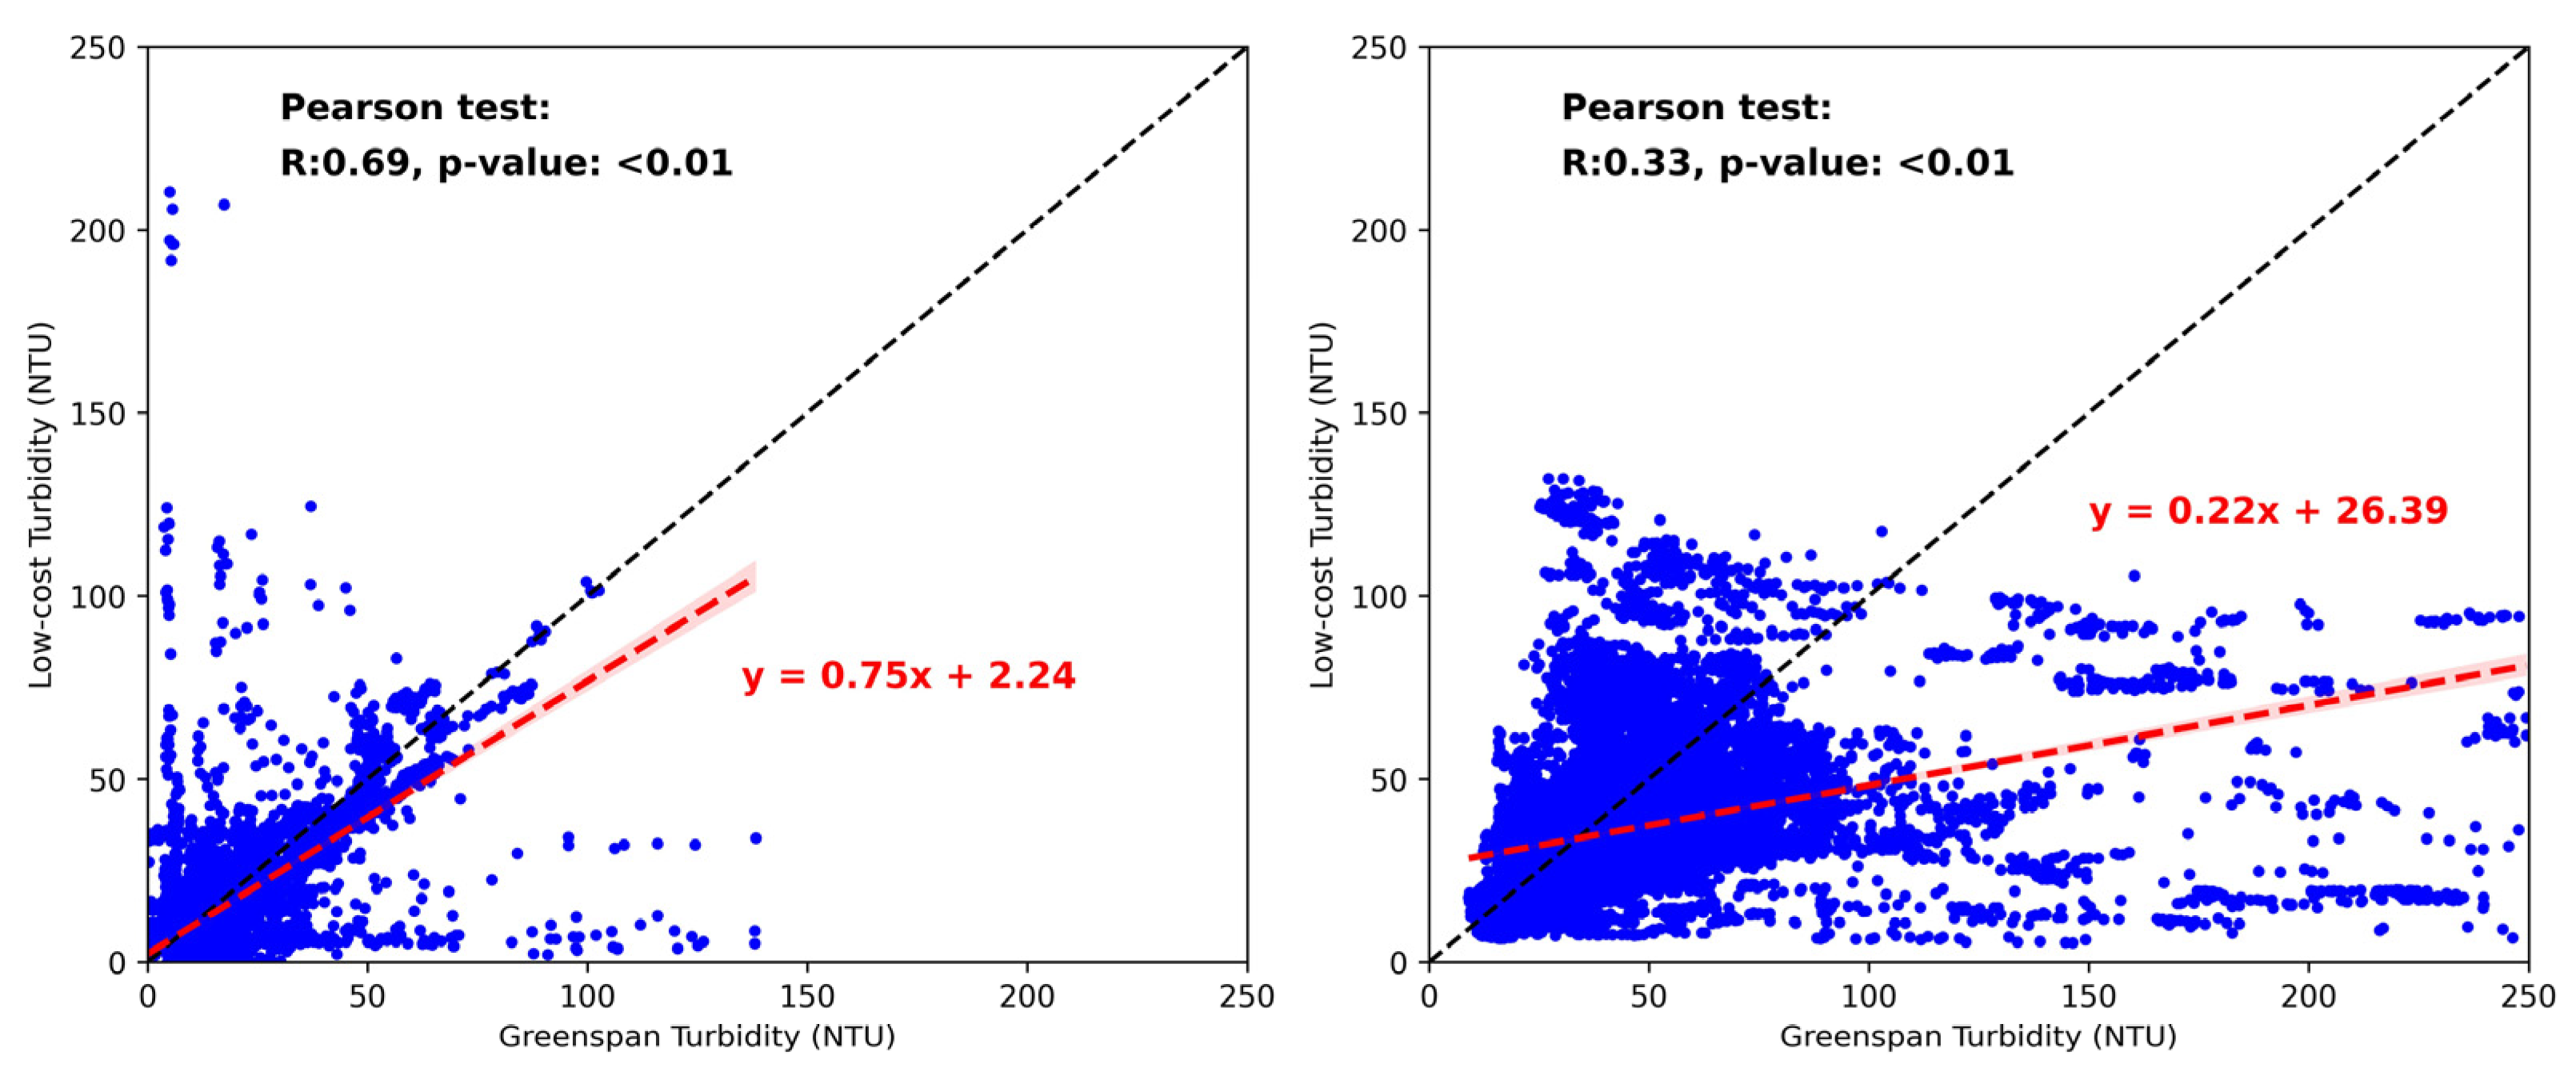
Figure 6.
Plots of biofouling analysis and drift analysis. The left two graphs show the biofouling results, the top left graph is the boxplots of the relative difference (Rbio) of biofouling effect and the bottom left graph shows the relative difference (Rbio) against the cumulative monitoring days in each specific monitoring period. Negative values mean “after-cleaning” turbidity is smaller than the “before-cleaning” turbidity in a specific raw reading, and positive values mean “after-cleaning” turbidity is greater than the “before-cleaning” turbidity in a specific raw reading. The right two graphs show the drift results, the top left graph is the boxplots of the relative difference of drift effect, and the top left graph shows the relative difference of the drift effect against the cumulative monitoring days since the sensor deployment. Negative values mean “after-cleaning” turbidity before sensor is deployed is smaller than the “after-cleaning” turbidity after sensor is deployed in a specific raw reading, and positive values mean “after-cleaning” turbidity before sensor is deployed is greater than the “after-cleaning” turbidity after sensor is deployed in a specific raw reading. Wilcoxon Rank Sum Test results of comparing the box plots of low-cost sensor and GreenSpan sensor for both biofouling and drift effects are also shown below the box plots. Due to the axis limitation, some outliers are not shown in the boxplots (1 outlier for biofouling analysis 25 percentile, 1 outlier for drift analysis 25 percentile and 1 outlier for drift analysis 50 percentile), the turbidity ranges for different percentile at both inlet and outlet are also presented on the top of the top graphs.
Figure 6.
Plots of biofouling analysis and drift analysis. The left two graphs show the biofouling results, the top left graph is the boxplots of the relative difference (Rbio) of biofouling effect and the bottom left graph shows the relative difference (Rbio) against the cumulative monitoring days in each specific monitoring period. Negative values mean “after-cleaning” turbidity is smaller than the “before-cleaning” turbidity in a specific raw reading, and positive values mean “after-cleaning” turbidity is greater than the “before-cleaning” turbidity in a specific raw reading. The right two graphs show the drift results, the top left graph is the boxplots of the relative difference of drift effect, and the top left graph shows the relative difference of the drift effect against the cumulative monitoring days since the sensor deployment. Negative values mean “after-cleaning” turbidity before sensor is deployed is smaller than the “after-cleaning” turbidity after sensor is deployed in a specific raw reading, and positive values mean “after-cleaning” turbidity before sensor is deployed is greater than the “after-cleaning” turbidity after sensor is deployed in a specific raw reading. Wilcoxon Rank Sum Test results of comparing the box plots of low-cost sensor and GreenSpan sensor for both biofouling and drift effects are also shown below the box plots. Due to the axis limitation, some outliers are not shown in the boxplots (1 outlier for biofouling analysis 25 percentile, 1 outlier for drift analysis 25 percentile and 1 outlier for drift analysis 50 percentile), the turbidity ranges for different percentile at both inlet and outlet are also presented on the top of the top graphs.
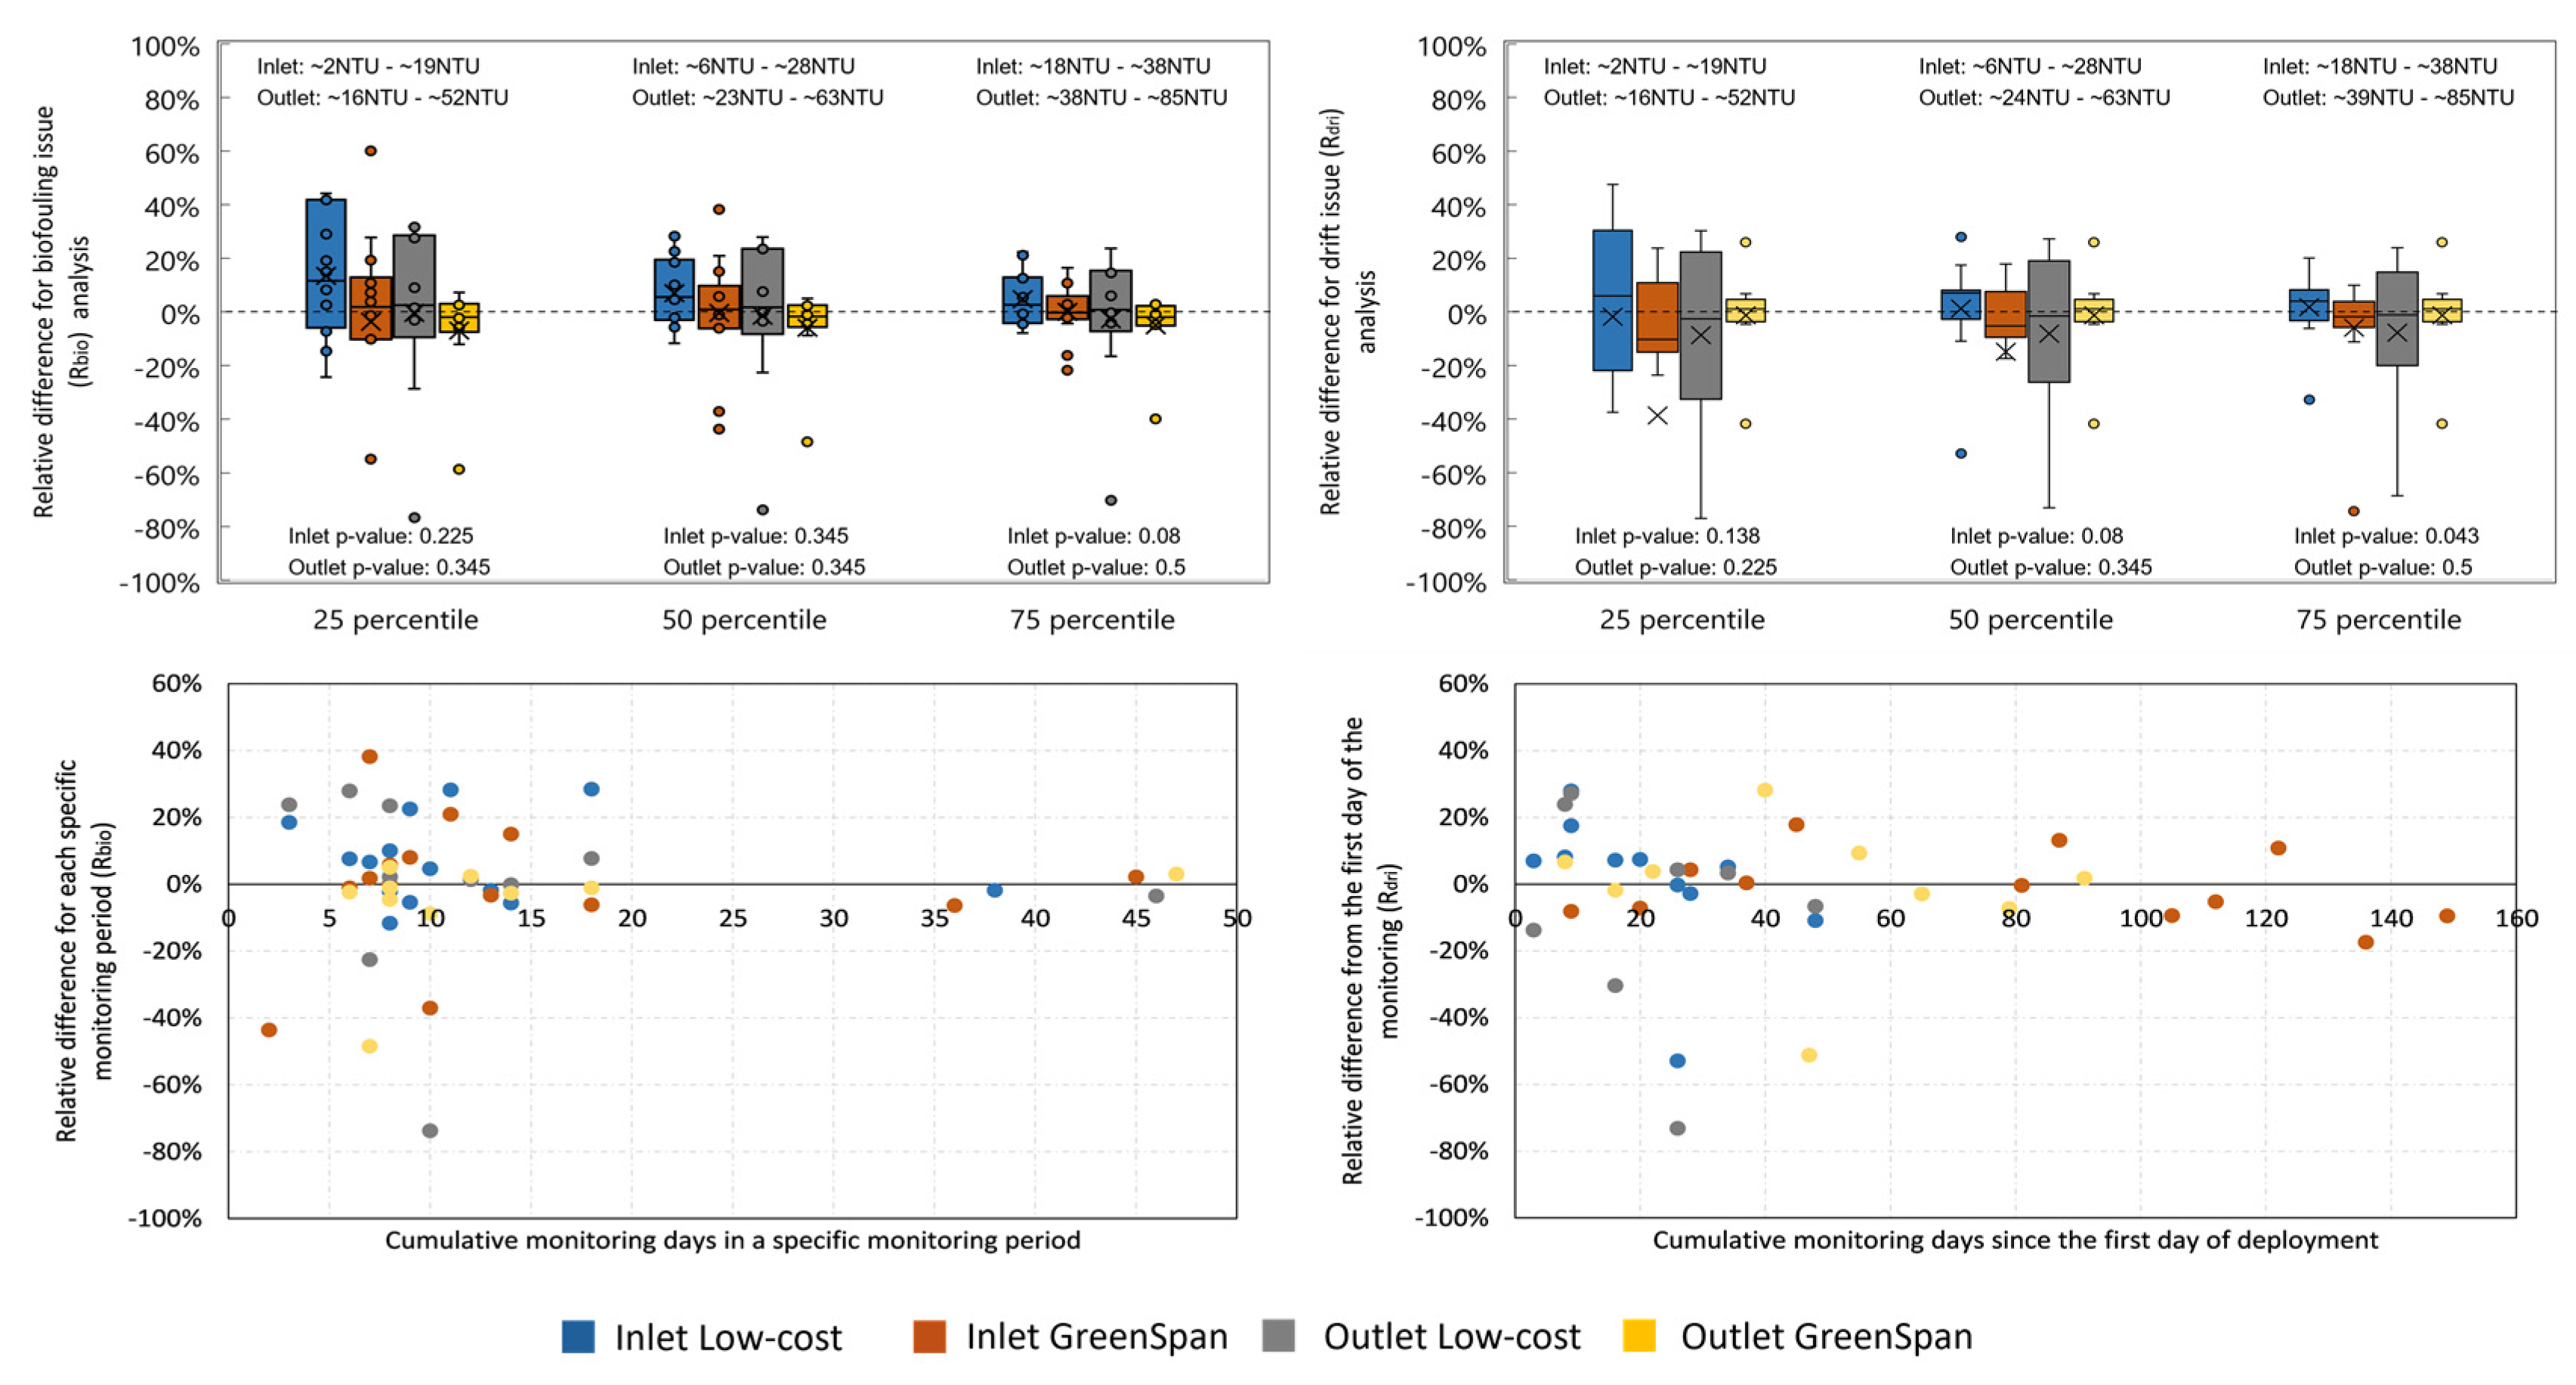

Table 1.
Detailed cost of the low-cost turbidity sensor.
| Parts | Cost in USD |
|---|---|
| LED | 1.20 |
| Phototransistor | 3.20 |
| PCB | 15.00 |
| Potting compound | 1.00 |
| Epoxy cover | 0.10 |
| 3D printing house | 3.00 |
| Price in total | 23.50 |
Table 2.
Results of lab power usage showing the measured current consumption in various modes, and the accumulated battery charge use over a year of operation using 1 minute measurement intervals.
Table 2.
Results of lab power usage showing the measured current consumption in various modes, and the accumulated battery charge use over a year of operation using 1 minute measurement intervals.
| Mode | Time | Current | Battery Charge Use |
|---|---|---|---|
| Working Mode with active LED | 1s | 88mA | 0.024 mAh |
| Working Mode with inactive LED | 1s | 4mA | 0.0011mAh |
| Sleeping Mode | 58s | <0.1 µA | <0.0001 µAh |
| Yearly Power use | 13.43 Ah |
Table 3.
Percentage of the removed data based on different criterions, Data fitting multiple criteria has been counted under the first matching criterion. Therefore, no removed data has been counted under multiple columns in this table.
Table 3.
Percentage of the removed data based on different criterions, Data fitting multiple criteria has been counted under the first matching criterion. Therefore, no removed data has been counted under multiple columns in this table.
| Sensor | Criterion 1: if in water (%) | Criterion 2: missing data (%) | Criterion 3: beyond detecting range (%) | Criterion 4: Continuous trend data (%) | Criterion 5: dirt on prob (%) | Criterion 6: Long time after maintenance (%) | Criterion 7: Erratic gradients values (%) | Total (%) |
|---|---|---|---|---|---|---|---|---|
| Inlet low-cost | 0.0 | 3.9 | 20.9 | 8.5 | 0.0 | 20.8 | 9.6 | 63.6 |
| Inlet GreenSpan | 0.0 | 7.0 | 12.3 | 0.0 | 0.0 | 26.1 | 10.8 | 56.2 |
| Outlet low-cost | 0.0 | 5.8 | 3.4 | 3.6 | 0.0 | 32.3 | 12.8 | 57.8 |
| Outlet GreenSpan | 0.0 | 0.0 | 1.5 | 0.0 | 0.0 | 39.2 | 11.4 | 52.1 |
Disclaimer/Publisher’s Note: The statements, opinions and data contained in all publications are solely those of the individual author(s) and contributor(s) and not of MDPI and/or the editor(s). MDPI and/or the editor(s) disclaim responsibility for any injury to people or property resulting from any ideas, methods, instructions or products referred to in the content. |
© 2024 by the authors. Licensee MDPI, Basel, Switzerland. This article is an open access article distributed under the terms and conditions of the Creative Commons Attribution (CC BY) license (http://creativecommons.org/licenses/by/4.0/).
Copyright: This open access article is published under a Creative Commons CC BY 4.0 license, which permit the free download, distribution, and reuse, provided that the author and preprint are cited in any reuse.


