
Submitted:
17 May 2024
Posted:
20 May 2024
You are already at the latest version
Abstract
Turbidity is an important indicator of water quality in hydrology. More traditional ways to monitor turbidity can provide reliable results. However, they are prone to human error, have elevated costs, and lack real-time monitoring capacity. Addressing these hindrances, in this work we combine spectral bands and indices from Sentinel-2 with several machine learning paradigms, namely XGBoost, Random Forests, GMDH, Support Vector Regression, k-Nearest Neighbors and Least Absolute Shrinkage and Selection Operator to model turbidity, using data from twelve monitoring stations encompassing the Mississippi River, USA. Results show that considering the individual monitoring stations, the ML paradigms for turbidity modeling were satisfactory at locations with a larger range and standard deviation values, achieving a mean R2 value of 59.5%. Tree-based models were the best overall approach, often ranking as the best or second-best performing model. When all the samples from the monitoring stations were used, the XGBoost provided superior output for turbidity modeling, reaching an R2 equal to 75.7%. A comprehensive comparison with the literature found values showed that the models implemented using this study’s methodology could provide competitive results, deeming it as an alternative for turbidity modeling from remote sensing data.
Keywords:
Sentinel Satellite Constellation
; Machine Learning
; Turbidity
; Spectral Indices
; Mississippi River
; Missouri River
1. Introduction
Monitoring river water quality is paramount for developing effective, sustainable management strategies and preserving both freshwater water resources for agricultural irrigation and domestic/industrial use, as well as for safeguarding the health of these invaluable aquatic ecosystems. However, anthropogenic and natural processes can disrupt the physical-chemical balance in a river. This leads to the endangerment of water quality, negatively impacting human health and aquatic biodiversity and causing significant economic implications worldwide [1,2,3,4]. To cite a few, diverse parameters can be used to monitor water quality, such as dissolved oxygen, chlorophyll, and salt concentrations [4,5,6]. Among the set of possible water quality parameters, turbidity is often deemed the most relevant indicator for water quality. This optical property of water indicates how the light incident to the water body is scattered, absorbed, or directly transmitted. Its importance lies in its ability to indirectly provide information about other parameters, as it is vastly influenced by them [7,8].
Traditional ways of measuring turbidity in water, such as turbidimeters, nephelometry, and spectrometry, consist of gathering water samples and often providing reliable results. However, they have the downside of being expensive, prone to human error, and do not offer the capacity for real-time monitoring of turbidity [7,9,10]. A viable strategy to overcome this hindrance is the use of remote sensing. The ever-increasing geospatial data from satellite devices allowed the implementation of data-driven approaches, such as Machine Learning (ML) [11]. The combined usage of ML and satellite information covering a vast spatial area allows monitoring spatiotemporal variations of water quality parameters, including turbidity [12]. Furthermore, compared to other approaches, such as numerical methods, ML has a more straightforward implementation, has improved computational performance, and can generalize data remarkably well for time-series applications [13,14,15].
Using ML models with the sizeable spatiotemporal coverage of satellite images proved valuable for water monitoring, as corroborated in previous studies [11]. In the work of Silveira Kupssinskü et al. [16], the authors implemented several ML paradigms to estimate future levels of chlorophyll-a (Chla) and Total Suspended Solids (TSS) for two locations in Brazil. The models were trained with Sentinel-2 and unmanned aerial vehicle imagery. The authors achieved satisfactory results for the ML applications, which consistently outputted coefficient of determination (R2) values greater than 80%. In the work conducted by Zhang et al. [17], the authors estimated Chla on lakes located in China using a Support Vector Machine (SVM) and Landsat-8 images. The assessed model successfully predicted the concentration of Chla, reaching R2 = 77% and Root Mean Squared Error (RMSE) of 22.64 μg/L. In their work, Ma et al. [18] investigated the use of Sentinel-2 imagery for turbidity prediction in lakes in China. Again, the ML paradigms, especially forest-based approaches, offered competitive results for water quality assessment, returning R2 values greater than 80%. Another comprehensive study was conducted in [19], which investigated twelve different ML algorithms for phosphorous modeling in reservoirs in China using Landsat-8 satellite data. Again, the ML paradigms showed excellence in predicting time-series data from remotely sensed images, where a tree-based approach was the best-performing model with an R2 of 85%. Another ML paradigm investigated in past studies was the Group Method of Data Handling (GMDH), which has been used for different hydrological applications, such as predicting water quality [20], Chla [21], and turbidity [22]. Nonetheless, there is still a gap in the knowledge regarding using GMDH with satellite data for turbidity modeling.
As discussed above, the ML models are paramount in hydrological applications, particularly concerning water quality management when combining ground-based monitoring with remotely sensed datasets. Thus, the present study seeks to advance our knowledge on the details of training and testing machine learning algorithms, namely eXtreme Gradient Boosting (XGBoost), Random Forests (RF), GMDH, Support Vector Regression (SVR), k-Nearest Neighbors (kNN) and Least Absolute Shrinkage and Selection Operator (LASSO) to model turbidity levels on the Mississippi River, USA. Every method was implemented individually at each monitoring station along the Mississippi River and collectively across all stations. This approach aimed to assess the methods’ generalization on specific locations and the broader river system. To this end, the models were trained and tested with Sentinel-2 remote sensed data. The specific objectives of this study are:
- A thorough investigation of the influence of the Sentinel-2 spectral bands and several indexes on ML applications for turbidity modeling in a large spatial area.
- Use of parameter selection strategy to determine the best inputs for the ML models.
- Evaluate the performance of the GMDH ML model for turbidity modeling using satellite imagery.
- Generalizability analysis of the modelling approaches considering specific stations and their collective datasets for turbidity modeling.
2. Materials and Methods
2.1. Study Site Location
The Mississippi River, a critical hydrological source in the USA, ranks as the second largest river in the country. It spans over 3.7 thousand kilometres from its source in Minnesota to its termination at the Gulf of Mexico. The Mississippi River provides resources for 15 million people at its upper basin alone and serves over 50 cities along its course. The Mississippi River has a discharge flow rate greater than 600 thousand cubic meters per second at its delta. Its watershed also upholds significant natural, hydrological, and economic resources, encompassing over 250 lakes, covering more than 3.2 million square kilometres, including 32 American states and 2 Canadian provinces, encompassing more than 40% of the total continental USA area [23,24]. Given its extension, the Mississippi River and its watershed house a vast biodiversity and cultural sites for its inhabitants [25,26].
Given its significance, the preservation of the Mississippi River has become paramount for river management agencies [27]. However, anthropogenic activities undermine the Mississippi River’s environmental stability, altering its hydrological dynamics and landscape [27,28]. Additionally, the Missouri River, the most important tributary of the Mississippi River, is a significant source of sediments, which can also negatively impact the Mississippi River equilibrium. Given the current global warming and climate change scenario, this is a vital concern, endangering the riverine population relying on its waters, mainly at its delta [29].
The data used in this study is made publicly available by the United States Geological Survey (USGS) (data available at https://help.waterdata.usgs.gov/, accessed on 22 February 2024). The USGS is the state agency responsible for compiling and collecting water-use data for the American Government since the 1950s, stratified into several categories [30]. A total of 12 monitoring stations were used in this study, encompassing locations for both the Mississippi and the Missouri rivers. Each station records daily turbidity data, comprising the years 2018 to 2023. The geographical location of the monitoring stations, the Mississippi River, its basin and principal tributaries are presented in Figure 1 [31,32]. The statistical information for the dataset is presented in Table 1. A complete statistical analysis of the data can be found in the supplementary material.
2.2. Sentinel-2 Imagery
2.2.1. Spectral Data
The Sentinel-2 constellation comprises two polar-orbiting satellites led by the European Space Agency (ESA). The first satellite, Sentinel-2A, was launched back in 2015. The second, Sentinel-2B, was launched two years later, in 2017. Both monitor the Earth in the same sun-synchronous orbit. The main goal of the Sentinel-2 constellation is to monitor Earth’s environment, providing remotely sensed data to track changes in its climate, with a revisiting time of 5 days after the launching of Sentinel-2B [33,34,35]. The Multispectral Instruments (MSI) present in the constellation are state-of-the-art equipment that can provide information within a wide range of spatial coverage, registering data in thirteen different spectral bands [34,36,37]. Table 2 compiles the configuration for the MSI equipment in the Sentinel-2 constellation.
This study collected remote sensed data using Level-1C processing. The collected data goes through rigorous monthly quality checks to maintain its integrity. [39]. The satellite imagery is sectioned into different parts for this processing level based on the UTM/WGS84 projection. For each tile, whose limits are separated by a distance of 100 km, the radiometric values are calculated using top-of-the-atmosphere reflectances, later converted to irradiance [40,41].
2.2.2. Spectral Indices
The spectral indices are mathematical formulations that combine different satellite bands to extract more information from the satellite data. The usage of spectral indices can be found in the literature with applications in various areas of knowledge, such as monitoring crops [42,43], vegetation [44,45], and also water quality [46,47], to cite a few.
In the present study, the influence of several indices for the modeling of turbidity levels in the Mississippi River was investigated. Table 3 compiles the 17 indices assessed and their intended original usage.
It is possible to notice that many of the mentioned indices in Table 3 are not directly related to water assessment. However, including indices not directly related to water quality may still provide insight for the predictive model, thus improving the turbidity modeling.
In the final stage of the process, the revisit time of Sentinel-2 was synchronized with the date of the turbidity sample acquisition. This synchronization ensured that the remote sensing data and the turbidity sample shared the same collection date, allowing their comparison. The entire dataset was randomly split into training and testing data with this information, following an 80/20 ratio.
2.3. Machine Learning Models
In this work, turbidity was modeled using several ML models. It is important to disclose that deep learning (DL) models were not implemented in this work. This is because DL paradigms require extensive datasets, as well as long computational times. Previous works show that DL performance can yield similar and even inferior outcomes compared to classical ML approaches, when the dataset size is not sufficiently broad [79,80,81]. Therefore, the implementation of DL models in this study was not considered, as the available data for each monitoring station amounts to 2453 for the period under investigation.
The implemented ML structures are briefly discussed as follows.
2.3.1. Tree-Based ML Models
Tree-based paradigms are popular approaches applied to time-series problems. They are versatile models that handle non-linear problems for either classification or regression. Fundamentally, it consists of splitting the multidimensional predictive space into smaller regions. This approach offers a good interpretation of its results and may offer competitive performance to more advanced ML models when combined with resampling approaches, such as bagging [82,83].
Two different tree-based models were implemented in the present study. The first is called Random Forest (RF). This approach consists of training many independent tree models using the bagging resample. Thus, each tree is trained using a subsample of the total predictors, i.e., the spectral bands and indexes [82,83]. Later, these trees are combined into a larger model, which is called an ensemble model. This approach reduces the model variance, improving its output [84].
The second tree-based model implemented was the eXtreme Gradient Boosting (XGBoost) [85]. This is also an ensemble model and an improved version of the RF paradigm. Its theory consists of combining weaker ML models to combine them sequentially, each one improving its predecessor’s residual errors. This creates small trees, which will slowly learn the underlying patterns in the dataset. The resulting model is more robust to overfitting, with less variance and more generalization capacity [82,83].
2.3.2. Self-Structured ML Model
Another methodology investigated in this study was the Group Method of Data Handling (GMDH). It was first proposed in the 1960s, as an approximation model using a reduced dataset with high non-linearity between the inputs and outputs [21,86,87]. This model does not require hyperparameter tuning, as it selects its best configuration automatically [88]. Despite being a relatively old ML model, its application to time-series problems, including hydrology-related applications, has been positively validated by previous research [89,90,91].
2.3.3. Support Vector Regression ML Model
The Support Vector Regression (SVR) model comes from the Support Vector Machine (SVM) paradigm, a versatile approach able to handle linear and non-linear problems [83]. To this end, the SVR uses a kernel trick, which consists of using a kernel trick and kernel functions that allow the model to handle the dataset in higher dimensions. This benefits the model twofold: by being computationally efficient and allowing it to retrieve non-linear relationships within the dataset that could not be detected in simpler dimensions [92]. However, a significant limitation of the SVR lies in its inability to handle extensive datasets efficiently, resulting in longer computational training times [93,94].
2.3.4. k-Nearest Neighbour ML Model
The k-Nearest Neighbour (kNN) model was another paradigm investigated in this study. This is another versatile model that performs both classification and regression strategies. When applied to regression cases, the kNN attributes the mean value to the unknown point based on its neighbors [82,92,95]. This approach is more straightforward than classification, where kNN classifies the new point based on a voting system by its neighbors, which may be scattered in a possibly high-dimensional space.
2.3.4. The Least Absolute Shrinkage and Selection Operator ML Model
The Least Absolute Shrinkage and Selection Operator (LASSO) is a linear approach that was investigated in this work. This methodology combines parameter selection with a regularization strategy to avoid overfitting [84,96]. Thus, the LASSO paradigm seeks to provide the best-fitting regression hyperplane describing the data.
2.4. Evaluation Metrics
To compare the performance of the proposed ML models, one of the most used metrics for ML applications in time-series problems is the coefficient of determination (R2) [97]. It is an indicator of the amount of variance in the output that the predictors explain. It offers more information about the regression model output while also providing good interpretability [98].
2.5. Data Preprocessing
Before using the dataset to train the ML models, we first cleaned the dataset, removing outliers and incorrect values. Afterwards, we investigated different normalization strategies. Normalization often improves ML models’ performance by setting the dataset values to the same order of magnitude [13]. The first preprocessing methodology was the standard normalization. It sets the dataset mean to zero and its standard deviation to one. The second normalization implemented was the Yeo-Johnson. This normalization strategy seeks to reduce the skewness in the data, approximating it to a normal distribution. To this end, the Yeo-Johnson transformation implements power transformations, ensuring that all data values are positive [99]. A combination between Yeo-Johnson and standard normalization was investigated as well. The case where no normalization was applied to the dataset was also evaluated as input for the models.
3. Results
3.1. Parameter Selection
The best parameters among bands and spectral indexes were selected before feeding the ML models with the data. To this end, the forward stepwise parameter selection was performed [82]. This approach consists of adding one predictor at a time and verifying if its inclusion improved the model’s performance in terms of reduced error. In this study, we first selected the best indices among the ones presented in Table 2. The benchmarking model to evaluate the parameters was the XGBoost, where the R2 metric was assessed. The results for the best indices are depicted in Figure 2.
From Figure 2, the selected indices were the NDGI, GCI, AWEI, GNDVI, SWM, 3BSI, NDMI, EVI, BSI, SAVI, MSI, NDWI, and NDSI, achieving an R2 equal to 74%. Analysing both Figure 2 and Table 2, we can conclude that the predictive model benefited from indices related to both water and vegetation. Indices related to glaciers and snow also promoted improvements in turbidity modeling, as demonstrated by the selection of NDGI and NDSI. Although it may seem counterintuitive, including such indices befits the ML model by conveying relevant spatiotemporal data. Additionally, the selection of the best set of spectral bands is presented in Figure 3.
Figure 3 shows that the best Sentinel-2 bands for turbidity modeling were B02 and B06, achieving an R2 of 76%, promoting an improvement of 2% compared to the indices’ selection alone. Analyzing Table 1, B02 has a spectral range around the blue spectrum, with a high spatial resolution of 10 meters. Additionally, B06 conveys information ranging on the red edge of the vegetation of the light spectrum, with a high spatial resolution of 20 meters. It’s worth noting that we incorporated the cubic root of the predictors as a predictive parameter. This was done to mitigate data skewness and bring the distribution closer to normal [100]. Henceforth, the results presented for the turbidity modeling are based on the selected parameters presented in Figure 2 and Figure 3, and the cubic root of each predictor.
3.2. Turbidity Modeling Results
The ML models were built using Python and Scikit-Learn [101]. Besides the GMDH model, which is a self-organizing approach, the hyperparameters were determined using the GridSearch tool for Scikit-Learn with 5 cross-validations. Such methodology proved to yield good outputs for time-series applications [95]. The results achieved by the models for each monitoring station are presented in Table 4, for each monitored station, as presented in Figure 1.
Table 4 elucidates that the best results in terms of coefficient of determination are achieved at the Missouri River at St. Joseph station. At this location, the best-performing model was kNN, achieving an R2 value of 86.7%, while the second-best model was RF, achieving an R2 of 85.1%. At the Missouri River at Randolph and Mississippi River stations at Baton Rouge, the R2 value was also superior to 80%. The GMDH approach yielded the best results for both of them, followed by XGBoost and SVR, respectively.
Contrarywise, the lowest R2 was achieved at E. Fk. Black R. bl Lower Taum Sauk Reservoir station, where RF output a 25.7% for the coefficient of determination, while the second-best performing model at this location was XGBoost, with R2 of 25.2%. Other locations where the coefficient of determination fell below 30% included the East Fork Black River near Lesterville and the Mississippi River at Clinton. In both cases, the XGBoost model was the best-performing approach, followed by SVR and kNN.
For the monitoring station Mississippi River at Dam 13 near Fulton, it was not possible to derive an optimal model using the available data. As can be observed from Table 1, reduced values for range and standard deviation of turbidity indicate a lack of variability in the data. At this station, the measured turbidity is practically constant, leading to a poor generalization by the ML model and a degenerated R2 value.
As informed by Table 4, considering the best-performing models, not normalizing the dataset usually provided the best outcomes. For some cases, the normal standardization improved the modeled turbidity value a couple of times at stations Mississippi River at Keokuk and the Mississippi River at Baton Rouge. Combining Yeo-Johnson and normal standardization improved turbidity modeling only at station Missouri River at Hermann.
The rank of the best-performing and second best-performing models is presented in Table 5 as follows.
Table 5 elucidates that the most common best-performing model was GMDH, which bested the remaining paradigms four out of eleven times. It was closely followed by the XGBoost approach, the best-performing model three times. Considering both XGBoost and RF, the three-based methodology surpassed the GMDH. In this case, it is safe to say that these models offer a more general approach for modeling turbidity, posing as a more viable alternative.
To underscore the non-linear behaviour of the turbidity, we compared it with the coefficient of determination of each stations using different statistical metric. To this end, we removed the stations with fewer turbidity samples, according to Table 1, namely Missouri at Hermann, Mississippi at Clinton, and Mississippi at Dam 13. This relationship is depicted in the following Figure 4.
Figure 4 reveals a strong second-order relationship between mean turbidity values and the coefficient of determination for each monitoring station. Figure 4 illustrates that there exists a natural limitation for increments on turbidity values. Examining the plotted data, we observe that the R2 value for the modeled turbidity shows an upward trend in the range of 4 FNU to 57 FNU. Interestingly, the R2 shows stabilization at an r-squared value of 88.7%, with turbidity value of 44 FNU. Beyond this threshold, the regression line for the modeled turbidity starts to show a downwards behaviour, indicating that an increase in turbidity is likely to result in data dispersion without necessarily improving the models’ outcomes. This is seen by the right-most point in Figure 4, representing the station Missouri River at Randolph, MO, where the coefficient of determination is 87% for a mean turbidity value of 57 FNU.
The models’ performance were investigated to verify the their generalization capacity using information from all the monitoring stations to model turbidity values. The best-performing approaches are presented in Table 6.
Considering the whole monitoring station data, the best model was the XGBoost, reaching a coefficient of determination of 75.7% using no normalization. The RF model was the second-best performing methodology, achieving an R2 of 70.7% also without normalization. Compared with the results from Table 4, which provide an average R2 value of 59.5%, the models trained using all the samples showed a superior overall performance.
4. Discussion
4.1. Bands and Indices Selection
Earlier research has demonstrated the significance of individual and combined bands in assessing turbidity values. In a previous study [18], the authors confirmed a positive Pearson correlation for both these categories using remote sense data from Sentinel-2. Specifically, bands 1 through 5 exhibited a strong positive correlation with turbidity, achieving a Pearson correlation coefficient exceeding 70%. In the case of combined bands, bands 2, 3, 4, 5, and 8 they also displayed a superior positive correlation, reaching a correlation value of 70%. In the study conducted by Zhu et al. [102], the authors used the Shapley additive explanations (SHAP) analysis [103] to determine the importance of bands for water quality estimation, including turbidity, using machine learning models and Sentinel-2 images for Shenzen Bay, China. Their findings revealed that bands 2 through 8A (Table 2) contributed the most to determining turbidity.
In [104], the authors concluded that every band improved turbidity estimation in the North Tyrrhenian Sea, Italy . They found that bands 5, 6, 7, and 8A contributed the most to this end. In another study by Psychalas et al. [105], their results showed significant contributions from bands 4, 5, 8A, 11, and 12 for identifying highly turbid waters in reservoirs. Specifically, the contributions from bands 11 and 12 were attributed to the variety of land classes and cloud formations present in their remote sensing data.
In our study, a comprehensive analysis of Table 2 and Table 3 reveals that bands 8, 3, 11, 4, and 2 are the five most relevant attributes in terms of frequency, in that order. Our findings are following the results from the literature. This alignment allows us to affirm the significance of the red spectrum bands and the green and blue bands in modeling turbidity values. As discussed by Maimouni et al. [106], due to the high reflectance of turbid water, the Sentinel-2 bands related to the visible spectrum are particularly influential for monitoring water turbidity due to the high reflectance of this type of water. Additionally, SWIR and NIR bands can enhance turbidity modeling in highly murky waters. These wavelengths are more adept at gathering information about the turbidity in such waters, especially when the spectral reflectance is saturated.
Furthermore, our study underscores the critical role of high spatial resolution in turbidity modeling, as band 11 is the only one with a spatial resolution worse than 10 m. The spatial resolution is important for turbidity modeling as it can better identify and convey finer spatial information to the model, thus improving its performance [107]. The importance of spatial resolution was also attested and discussed in previous studies related to water quality monitoring [108,109,110].
4.2. Turbidity Modeled Using for Each Monitoring Station
Assessing the performance of the ML approaches for each monitoring station, we concluded that proper turbidity modeling depends on the availability of a dataset containing a wide range of turbidity values. The models perform better when applied to a specific location, i.e., when implemented to model turbidity at specific monitoring stations. This is due to the reduced variance in the data, which tends to improve the model’s performance. This can be seen in Table 4, where the individual models can achieve R2 values over 88%. Interestingly, kNN outperformed more complex models for the Missouri River at St. Joseph station. This can be explained by the fact that kNN, being a non-parametric approach [82], maybe more resistant to noisy data. Furthermore, the architecture of kNN is specifically designed to identify similar data points. Given that the data from the station above exhibits this characteristic, kNN can accurately capture the turbidity levels surrounded by similar instances.
The LASSO model, which is a linear approach, also surpassed the non-linear models for the Missouri River near Council Bluffs station. This can be explained by the data available at the mentioned station. Being the LASSO a linear model, it is suited to perform linear regression on linear data, which may be the case at the station. Additionally, this approach applies parameter selection using L1 regularization, which can reduce the error related to the variance while focusing on more relevant features [96].
Interestingly, each assessed model achieved the best result at least once. The “no free lunch” theorem [111] can be used to explain this phenomenon. In the ML field, this theorem explains that no “one-fit-all” model exists. The best-suited ML approach depends on the designed task and data availability. Different models may excel due to their inherent strengths and weaknesses for particular tasks but perform similarly on average when provided with a sufficiently large amount of data.
4.3. Comparison with Results from the Literature
The performance of the proposed model was compared with results from the literature, compiled in Table 7. At this point, it is crucial to emphasize that direct comparison between different ML models is difficult. Each ML model possesses unique characteristics, with different methodologies and geographic contexts, leading to varying performances. Nevertheless, comparing the metrics from these models remains a valid benchmarking approach for evaluating ML performances across different applications [112,113].
In the work by [104], the authors implemented two different ML models to estimate turbidity in the North Tyrrhenian Sea, Italy, from April 2015 to December 2021. Their results showed a good performance for both proposed models, linear and a kernel-based approaches. Compared to our results in Table 4, we observe a very similar performance with the LASSO model and the stepwise linear regression proposed by those authors, both paradigms reached values around 73%. Regarding kernel-based models, again, we observe similarities between their results, where our SVR model was slightly outperformed by a marginal difference of 9%, and a marginal difference of 9% slightly outperformed our SVR model. Still, our work’s results for GMDH and kNN are significantly superior, showing that they can better identify non-linear relationships related to turbidity modeling. Considering all the monitoring stations, the XGboost approach performed better, achieving an R2 value of almost 75.7%. It is essential to note that Magrì et al.‘s work focuses on modeling turbidity in an oceanic scenario, where turbidity concentrations remain relatively stable across seasons. Additionally, their spatial coverage is significantly narrower than ours. These characteristics may limit their model’s generalization due to the specific context and data availability.
Ma and colleagues [18] investigated several machine-learning models to assess turbidity in lakes in Northeastern China from June to September 2018. Their results showed that the XGBoost model was the top performer, achieving an R2 value of 88%. Compared to the XGBoost model in our study, the models used by these authors demonstrated significant superiority. Their results are on par with the coefficient of determination achieved by kNN and GMDH. When evaluating the performance XGBoost model considering all the monitoring station data, we observe that our proposed approach falls short compared to the results presented by Ma et al. However, the significant discrepancy between the output of these models can be explained by the shorter time window investigated on their study and the fact that their research was conducted on lakes. As previously noted, the study spanned four months. This limited timeframe might not capture significant fluctuations in turbidity values, resulting in a dataset with lower variance. Additionally, lakes typically exhibit more stable turbidity values, which can enhance the predictive accuracy of machine-learning models.
In the study by Katlane et al. [108], the authors used a semi-empiric approach to evaluate turbidity values using remote sensing data for a lagoon in Tunisia. The authors harnessed Sentinel-2 and PRecursore IperSpettrale della Missione Applicativa (PRISMA) satellite imagery for the year 2021. Their proposed semi-empirical approach showed good performance in predicting turbidity at their location, with an R2 of 88%. Compared to our models using individual station data, its performance is matched by kNN and GMDH. On the other hand, the XGBoost approach, which used all the sample data, performed inferiorly to the one reported by their study. Again, their reduced temporal coverage and more stable turbidity values for the given location can explain their superiority over our models, at the expense of a less general predictive approach.
Chen et al. [111] present a novel self-optimizing model for water quality determination on an urban river in China. Using remote sensing data from GF-1C satellite for the year 2021, the authors showed that the best result achieved for turbidity modeling was an R2 of 67.9%, a value well below the range of the output found in our study. When compared to our study, specifically when all the monitoring stations are considered, it is possible to visualize a better performance of the latter, which improved turbidity modeling by around 8%.
In another work [115], the authors used multispectral images captured by an unmanned aerial vehicle to feed an ML model determining water quality in Changlin River, China, from February to June 2023. After appraising several predictive models, the authors found that the best results were provided by the CBR approach, which reached a coefficient of determination of 92% for turbidity. Such value surpasses the ones presented in Table 4, where the best model achieves a maximum R2 of 88.7%. The models using all available data from the monitoring stations also fall short when compared to their results. Again, we state that this discrepancy may be due to the improved spatial resolution and reduced time window in their study, factors that are presumed to enhance the output of their model.
5. Conclusions
In this study, we implemented several ML paradigms to model turbidity for the Mississippi River, USA. We utilized remote sensing data from the Sentinel-2 mission and applied forward stepwise selection to identify the optimal input parameter set. To this end, we investigated several attributes containing the 13 bands of the Sentinel-2 satellite and spectral indices.
The selection of the best input parameters proved that it is beneficial for the model to combine both bands and indices, as they can convey spatiotemporal information for the predictive model. A comprehensive analysis of the selected inputs revealed that bands 8, 3, 11, 4, and 2 are the five most relevant attributes for turbidity modeling, which agrees with the literature.
Additionally, the individual results from the ML models exhibited considerable variation. Upon investigating this outcome, we found that the performance of the ML models was heavily dependent on the data availability for each site, particularly the amount of data in the third quantile. As shown in Table 4, the GMDH architecture generally produced superior performance among the individual models considered. Tree-based models like XGBoost and Random Forest (RF) achieved comparable results, demonstrating their potential for accurate turbidity modeling.
On average, the individual models reached an R2 value of 59.5%. The methodology using XGBoost and all the monitoring station data was also investigated. Its result proved to be significantly superior to the mean performance of the models using data from individual stations, achieving a coefficient of determination of 75.7%.
A comparison with the literature values showed that the results found in this study are competitive, deeming the proposed methodology an important tool for turbidity characterization from remote sensing data.
The assessment of water quality, turbidity included, is paramount for informed decision-making related to new legislation and water management strategies. To enhance the effectiveness of this process, future research could consider incorporating additional spectral indices and employing advanced image processing techniques.
To achieve better results in this scenario, future works may include the addition of more indices, as well as the usage of higher-level image processing. by integrating information from other satellites, such as Landsat-8. The incorporation of these elements has the potential to reduce dataset variance, thereby enhancing the accuracy of turbidity modeling for the target location.
Supplementary Materials
The following supporting information can be downloaded at the website of this paper posted on Preprints.org, Figure S1: title; Table S1: title; Video S1: title.
Author Contributions
Conceptualization, J.V.G.T. and B.G.; methodology, P.A.C.R., J.V.G.T. and B.G.; software, P.A.C.R.; validation, P.A.C.R., J.V.G.T. and B.G.; formal analysis, P.A.C.R.; investigation, P.A.C.R., J.V.G.T. and B.G.; resources, J.V.G.T. and B.G.; data curation, J.V.G.T. and B.G.; writing—original draft preparation, V.O.S. and P.A.C.R.; writing—review and editing, V.O.S., P.A.C.R., J.V.G.T. and B.G.; visualization, V.O.S. and P.A.C.R.; supervision, J.V.G.T. and B.G.; project administration, J.V.G.T. and B.G.; funding acquisition, B.G. and J.V.G.T. All authors have read and agreed to the published version of the manuscript.
Funding
This research study was funded by the Natural Sciences and Engineering Research Council of Canada (NSERC) Alliance, grant No. 401643, in association with Lakes Environmental Software Inc., and by the Conselho Nacional de Desenvolvimento Científico e Tecnológico—Brasil (CNPq), grant no. 303585/2022-6.
Data Availability Statement
Publicly available datasets were analyzed in this study. The code for Sentinel-2 data download and for the ML models can be found here: https://drive.google.com/drive/folders/16mWt-WrXmGbFw9YDOLop59R9taWEhac6 (accessed on 16 May 2024).
Conflicts of Interest
Author Jesse Van Griensven The’ is employed by the company Lakes Software. The remaining authors declare that the research was conducted in the absence of any commercial or financial relationships that could be construed as a potential conflict of interest.
References
- Kumar, L.; Afzal, M.S.; Ahmad, A. Prediction of Water Turbidity in a Marine Environment Using Machine Learning: A Case Study of Hong Kong. Regional Studies in Marine Science 2022, 52, 102260. [Google Scholar] [CrossRef]
- Desbureaux, S.; Damania, R.; Rodella, A.-S.; Russ, J.; Zaveri, E. The Impact of Water Quality on GDP Growth; World Bank: Washington, DC, 2019. [Google Scholar]
- Damania, R.; Desbureaux, S.; Rodella, A.-S.; Russ, J.; Zaveri, E. The Invisible Water Crisis; World Bank: Washington, DC, 2019. [Google Scholar]
- Oliveira Santos, V.; Costa Rocha, P.A.; Thé, J.V.G.; Gharabaghi, B. Graph-Based Deep Learning Model for Forecasting Chloride Concentration in Urban Streams to Protect Salt-Vulnerable Areas. Environments 2023, 10, 157. [Google Scholar] [CrossRef]
- Rocha, P.A.C.; Santos, V.O.; Thé, J.V.G.; Gharabaghi, B. New Graph-Based and Transformer Deep Learning Models for River Dissolved Oxygen Forecasting. 2023.
- Warren, M.A.; Simis, S.G.H.; Selmes, N. Complementary Water Quality Observations from High and Medium Resolution Sentinel Sensors by Aligning Chlorophyll-a and Turbidity Algorithms. Remote Sensing of Environment 2021, 265, 112651. [Google Scholar] [CrossRef] [PubMed]
- Iglesias, C.; Martínez Torres, J.; García Nieto, P.J.; Alonso Fernández, J.R.; Díaz Muñiz, C.; Piñeiro, J.I.; Taboada, J. Turbidity Prediction in a River Basin by Using Artificial Neural Networks: A Case Study in Northern Spain. Water Resour Manage 2014, 28, 319–331. [Google Scholar] [CrossRef]
- Tomperi, J.; Isokangas, A.; Tuuttila, T.; Paavola, M. Functionality of Turbidity Measurement under Changing Water Quality and Environmental Conditions. Environmental Technology 2022, 43, 1093–1101. [Google Scholar] [CrossRef] [PubMed]
- Chen, K.; Wang, X.; Wang, C. High-Precision Monitoring System for Turbidity of Drinking Water by Using Scattering Method. IEEE Sensors J. 2023, 23, 29525–29535. [Google Scholar] [CrossRef]
- Zounemat-Kermani, M.; Alizamir, M.; Fadaee, M.; Sankaran Namboothiri, A.; Shiri, J. Online Sequential Extreme Learning Machine in River Water Quality (Turbidity) Prediction: A Comparative Study on Different Data Mining Approaches. Water and Environment Journal 2021, 35, 335–348. [Google Scholar] [CrossRef]
- Mukonza, S.S.; Chiang, J.-L. Meta-Analysis of Satellite Observations for United Nations Sustainable Development Goals: Exploring the Potential of Machine Learning for Water Quality Monitoring. Environments 2023, 10, 170. [Google Scholar] [CrossRef]
- Shi, J.; Shen, Q.; Yao, Y.; Li, J.; Chen, F.; Wang, R.; Xu, W.; Gao, Z.; Wang, L.; Zhou, Y. Estimation of Chlorophyll-a Concentrations in Small Water Bodies: Comparison of Fused Gaofen-6 and Sentinel-2 Sensors. Remote Sensing 2022, 14, 229. [Google Scholar] [CrossRef]
- Rocha, P.A.C.; Santos, V.O. Global Horizontal and Direct Normal Solar Irradiance Modeling by the Machine Learning Methods XGBoost and Deep Neural Networks with CNN-LSTM Layers: A Case Study Using the GOES-16 Satellite Imagery. Int J Energy Environ Eng 2022, 13, 1271–1286. [Google Scholar] [CrossRef]
- Costa Rocha, P.A.; Johnston, S.J.; Oliveira Santos, V.; Aliabadi, A.A.; Thé, J.V.G.; Gharabaghi, B. Deep Neural Network Modeling for CFD Simulations: Benchmarking the Fourier Neural Operator on the Lid-Driven Cavity Case. Applied Sciences 2023, 13, 3165. [Google Scholar] [CrossRef]
- Oliveira Santos, V.; Costa Rocha, P.A.; Scott, J.; Van Griensven Thé, J.; Gharabaghi, B. Spatiotemporal Analysis of Bidimensional Wind Speed Forecasting: Development and Thorough Assessment of LSTM and Ensemble Graph Neural Networks on the Dutch Database. Energy 2023, 278, 127852. [Google Scholar] [CrossRef]
- Silveira Kupssinskü, L.; Thomassim Guimarães, T.; Menezes De Souza, E.; Zanotta, D.C.; Roberto Veronez, M.; Gonzaga, L.; Mauad, F.F. A Method for Chlorophyll-a and Suspended Solids Prediction through Remote Sensing and Machine Learning. Sensors 2020, 20, 2125. [Google Scholar] [CrossRef] [PubMed]
- Zhang, T.; Huang, M.; Wang, Z. Estimation of Chlorophyll-a Concentration of Lakes Based on SVM Algorithm and Landsat 8 OLI Images. Environ Sci Pollut Res 2020, 27, 14977–14990. [Google Scholar] [CrossRef]
- Ma, Y.; Song, K.; Wen, Z.; Liu, G.; Shang, Y.; Lyu, L.; Du, J.; Yang, Q.; Li, S.; Tao, H.; et al. Remote Sensing of Turbidity for Lakes in Northeast China Using Sentinel-2 Images With Machine Learning Algorithms. IEEE J. Sel. Top. Appl. Earth Observations Remote Sensing 2021, 14, 9132–9146. [Google Scholar] [CrossRef]
- Qiao, Z.; Sun, S.; Jiang, Q.; Xiao, L.; Wang, Y.; Yan, H. Retrieval of Total Phosphorus Concentration in the Surface Water of Miyun Reservoir Based on Remote Sensing Data and Machine Learning Algorithms. Remote Sensing 2021, 13, 4662. [Google Scholar] [CrossRef]
- Loc, H.H.; Do, Q.H.; Cokro, A.A.; Irvine, K.N. Deep Neural Network Analyses of Water Quality Time Series Associated with Water Sensitive Urban Design (WSUD) Features. Journal of Applied Water Engineering and Research 2020, 8, 313–332. [Google Scholar] [CrossRef]
- Alizamir, M.; Heddam, S.; Kim, S.; Mehr, A.D. On the Implementation of a Novel Data-Intelligence Model Based on Extreme Learning Machine Optimized by Bat Algorithm for Estimating Daily Chlorophyll-a Concentration: Case Studies of River and Lake in USA. Journal of Cleaner Production 2021, 285, 124868. [Google Scholar] [CrossRef]
- Tsai, T.-M.; Yen, P.-H. GMDH Algorithms Applied to Turbidity Forecasting. Appl Water Sci 2017, 7, 1151–1160. [Google Scholar] [CrossRef]
- Mississippi River Watershed. Available online: https://mvc.on.ca/mississippi-river-watershed/ (accessed on 20 February 2024).
- Blvd, M.A. 111 E.K.; Paul, S. 105 S.; Us, M. 55101 P. 651-293-0200 T. is the general phone line at the M.R.V.C.C. Mississippi River Facts - Mississippi National River & Recreation Area (U.S. National Park Service). Available online: https://www.nps.gov/miss/riverfacts.htm (accessed on 22 February 2024).
- Giblin, S.M.; Larson, J.H.; King, J.D. Environmental Drivers of Cyanobacterial Abundance and Cyanotoxin Production in Backwaters of the Upper Mississippi River. River Research & Apps 2022, 38, 1115–1128. [Google Scholar] [CrossRef]
- Pereira, L.S.F.; Andes, L.C.; Cox, A.L.; Ghulam, A. Measuring Suspended-Sediment Concentration and Turbidity in the Middle Mississippi and Lower Missouri Rivers Using Landsat Data. JAWRA Journal of the American Water Resources Association 2018, 54, 440–450. [Google Scholar] [CrossRef]
- Bouska, K.L.; Larson, D.M.; Drake, D.C.; Lund, E.M.; Carhart, A.M.; Bales, K.R. Aquatic Vegetation Dynamics in the Upper Mississippi River over 2 Decades Spanning Vegetation Recovery. Freshwater Science 2022, 41, 33–44. [Google Scholar] [CrossRef]
- Meade, R.H.; Moody, J.A. Causes for the Decline of Suspended-Sediment Discharge in the Mississippi River System, 1940–2007. Hydrological Processes 2010, 24, 35–49. [Google Scholar] [CrossRef]
- Lam, N.; Xu, Y.; Liu, K.; Dismukes, D.; Reams, M.; Pace, R.; Qiang, Y.; Narra, S.; Li, K.; Bianchette, T.; et al. Understanding the Mississippi River Delta as a Coupled Natural-Human System: Research Methods, Challenges, and Prospects. Water 2018, 10, 1054. [Google Scholar] [CrossRef]
- Bagstad, K.J.; Ancona, Z.H.; Hass, J.; Glynn, P.D.; Wentland, S.; Vardon, M.; Fay, J. Integrating Physical and Economic Data into Experimental Water Accounts for the United States: Lessons and Opportunities. Ecosystem Services 2020, 45, 101182. [Google Scholar] [CrossRef]
- OpenStreetMap. Available online: https://www.openstreetmap.org/copyright (accessed on 27 February 2024).
- Esteban, M.; Takagi, H.; Shibayama, T. Handbook of Coastal Disaster Mitigation for Engineers and Planners; Elsevier Butterworth Heinemann, 2015; ISBN 978-0-12-801060-0. [Google Scholar]
- Phiri, D.; Simwanda, M.; Salekin, S.; Nyirenda, V.; Murayama, Y.; Ranagalage, M. Sentinel-2 Data for Land Cover/Use Mapping: A Review. Remote Sensing 2020, 12, 2291. [Google Scholar] [CrossRef]
- Drusch, M.; Del Bello, U.; Carlier, S.; Colin, O.; Fernandez, V.; Gascon, F.; Hoersch, B.; Isola, C.; Laberinti, P.; Martimort, P.; et al. Sentinel-2: ESA’s Optical High-Resolution Mission for GMES Operational Services. Remote Sensing of Environment 2012, 120, 25–36. [Google Scholar] [CrossRef]
- Zhang, T.; Su, J.; Liu, C.; Chen, W.-H.; Liu, H.; Liu, G. Band Selection in Sentinel-2 Satellite for Agriculture Applications. In Proceedings of the 2017 23rd International Conference on Automation and Computing (ICAC); Huddersfield, United Kingdom: September 2017; pp. 1–6.
- Ienco, D.; Interdonato, R.; Gaetano, R.; Ho Tong Minh, D. Combining Sentinel-1 and Sentinel-2 Satellite Image Time Series for Land Cover Mapping via a Multi-Source Deep Learning Architecture. ISPRS Journal of Photogrammetry and Remote Sensing 2019, 158, 11–22. [Google Scholar] [CrossRef]
- Zhang, T.-X.; Su, J.-Y.; Liu, C.-J.; Chen, W.-H. Potential Bands of Sentinel-2A Satellite for Classification Problems in Precision Agriculture. Int. J. Autom. Comput. 2019, 16, 16–26. [Google Scholar] [CrossRef]
- Prasad, A.D.; Ganasala, P.; Hernández-Guzmán, R.; Fathian, F. Remote Sensing Satellite Data and Spectral Indices: An Initial Evaluation for the Sustainable Development of an Urban Area. Sustain. Water Resour. Manag. 2022, 8, 19. [Google Scholar] [CrossRef]
- European Space Agency Annual Performance Report. Available online: https://sentinels.copernicus.eu/web/sentinel/technical-guides/sentinel-2-msi/data-quality-reports (accessed on 3 February 2024).
- European Space Agency User Guides - Sentinel-2 MSI - Level-1C Product - Sentinel Online. Available online: https://copernicus.eu/user-guides/sentinel-2-msi/product-types/level-1c (accessed on 3 February 2024).
- European Space Agency Sentinel-2 MSI Level-1C TOA Reflectance. Available online: https://sentinels.copernicus.eu/web/sentinel/sentinel-data-access/sentinel-products/sentinel-2-data-products/collection-1-level-1c (accessed on 3 February 2024).
- Pôças, I.; Calera, A.; Campos, I.; Cunha, M. Remote Sensing for Estimating and Mapping Single and Basal Crop Coefficientes: A Review on Spectral Vegetation Indices Approaches. Agricultural Water Management 2020, 233, 106081. [Google Scholar] [CrossRef]
- Zhang, L.; Liu, Z.; Ren, T.; Liu, D.; Ma, Z.; Tong, L.; Zhang, C.; Zhou, T.; Zhang, X.; Li, S. Identification of Seed Maize Fields With High Spatial Resolution and Multiple Spectral Remote Sensing Using Random Forest Classifier. Remote Sensing 2020, 12, 362. [Google Scholar] [CrossRef]
- Tran, T.V.; Reef, R.; Zhu, X. A Review of Spectral Indices for Mangrove Remote Sensing. Remote Sensing 2022, 14, 4868. [Google Scholar] [CrossRef]
- Meneses, B.M. Vegetation Recovery Patterns in Burned Areas Assessed with Landsat 8 OLI Imagery and Environmental Biophysical Data. Fire 2021, 4, 76. [Google Scholar] [CrossRef]
- Maliki, A.A.A.; Chabuk, A.; Sultan, M.A.; Hashim, B.M.; Hussain, H.M.; Al-Ansari, N. Estimation of Total Dissolved Solids in Water Bodies by Spectral Indices Case Study: Shatt al-Arab River. Water Air Soil Pollut 2020, 231, 482. [Google Scholar] [CrossRef]
- Sagan, V.; Peterson, K.T.; Maimaitijiang, M.; Sidike, P.; Sloan, J.; Greeling, B.A.; Maalouf, S.; Adams, C. Monitoring Inland Water Quality Using Remote Sensing: Potential and Limitations of Spectral Indices, Bio-Optical Simulations, Machine Learning, and Cloud Computing. Earth-Science Reviews 2020, 205, 103187. [Google Scholar] [CrossRef]
- Moravec, D.; Komárek, J.; López-Cuervo Medina, S.; Molina, I. Effect of Atmospheric Corrections on NDVI: Intercomparability of Landsat 8, Sentinel-2, and UAV Sensors. Remote Sensing 2021, 13, 3550. [Google Scholar] [CrossRef]
- Huang, S.; Tang, L.; Hupy, J.P.; Wang, Y.; Shao, G. A Commentary Review on the Use of Normalized Difference Vegetation Index (NDVI) in the Era of Popular Remote Sensing. J. For. Res. 2021, 32, 1–6. [Google Scholar] [CrossRef]
- Gitelson, A.A.; Kaufman, Y.J.; Merzlyak, M.N. Use of a Green Channel in Remote Sensing of Global Vegetation from EOS-MODIS. Remote Sensing of Environment 1996, 58, 289–298. [Google Scholar] [CrossRef]
- Ge, Y.; Atefi, A.; Zhang, H.; Miao, C.; Ramamurthy, R.K.; Sigmon, B.; Yang, J.; Schnable, J.C. High-Throughput Analysis of Leaf Physiological and Chemical Traits with VIS–NIR–SWIR Spectroscopy: A Case Study with a Maize Diversity Panel. Plant Methods 2019, 15, 66. [Google Scholar] [CrossRef]
- Huete, A. A Comparison of Vegetation Indices over a Global Set of TM Images for EOS-MODIS. Remote Sensing of Environment 1997, 59, 440–451. [Google Scholar] [CrossRef]
- Zhen, Z.; Chen, S.; Yin, T.; Gastellu-Etchegorry, J.-P. Globally Quantitative Analysis of the Impact of Atmosphere and Spectral Response Function on 2-Band Enhanced Vegetation Index (EVI2) over Sentinel-2 and Landsat-8. ISPRS Journal of Photogrammetry and Remote Sensing 2023, 205, 206–226. [Google Scholar] [CrossRef]
- Huete, A.R. A Soil-Adjusted Vegetation Index (SAVI). Remote Sensing of Environment 1988, 25, 295–309. [Google Scholar] [CrossRef]
- Ghazaryan, G.; Dubovyk, O.; Graw, V.; Kussul, N.; Schellberg, J. Local-Scale Agricultural Drought Monitoring with Satellite-Based Multi-Sensor Time-Series. GIScience & Remote Sensing 2020, 57, 704–718. [Google Scholar] [CrossRef]
- Lastovicka, J.; Svec, P.; Paluba, D.; Kobliuk, N.; Svoboda, J.; Hladky, R.; Stych, P. Sentinel-2 Data in an Evaluation of the Impact of the Disturbances on Forest Vegetation. Remote Sensing 2020, 12, 1914. [Google Scholar] [CrossRef]
- Welikhe, P.; Quansah, J.E.; Fall, S.; McElhenney, W. Estimation of Soil Moisture Percentage Using LANDSAT-Based Moisture Stress Index. J Remote Sensing & GIS 2017, 06. [Google Scholar] [CrossRef]
- Hunt, E., Jr.; Rock, B. Detection of Changes in Leaf Water Content Using Near- and Middle-Infrared Reflectances☆. Remote Sensing of Environment 1989, 30, 43–54. [Google Scholar] [CrossRef]
- Gitelson, A.A.; Gritz †, Y.; Merzlyak, M.N. Relationships between Leaf Chlorophyll Content and Spectral Reflectance and Algorithms for Non-Destructive Chlorophyll Assessment in Higher Plant Leaves. Journal of Plant Physiology 2003, 160, 271–282. [Google Scholar] [CrossRef]
- Vasudeva, V.; Nandy, S.; Padalia, H.; Srinet, R.; Chauhan, P. Mapping Spatial Variability of Foliar Nitrogen and Carbon in Indian Tropical Moist Deciduous Sal (Shorea Robusta) Forest Using Machine Learning Algorithms and Sentinel-2 Data. International Journal of Remote Sensing 2021, 42, 1139–1159. [Google Scholar] [CrossRef]
- Escuin, S.; Navarro, R.; Fernández, P. Fire Severity Assessment by Using NBR (Normalized Burn Ratio) and NDVI (Normalized Difference Vegetation Index) Derived from LANDSAT TM/ETM Images. International Journal of Remote Sensing 2008, 29, 1053–1073. [Google Scholar] [CrossRef]
- Xu, N.; Tian, J.; Tian, Q.; Xu, K.; Tang, S. Analysis of Vegetation Red Edge with Different Illuminated/Shaded Canopy Proportions and to Construct Normalized Difference Canopy Shadow Index. Remote Sensing 2019, 11, 1192. [Google Scholar] [CrossRef]
- Saha, S.; Saha, M.; Mukherjee, K.; Arabameri, A.; Ngo, P.T.T.; Paul, G.C. Predicting the Deforestation Probability Using the Binary Logistic Regression, Random Forest, Ensemble Rotational Forest, REPTree: A Case Study at the Gumani River Basin, India. Science of The Total Environment 2020, 730, 139197. [Google Scholar] [CrossRef] [PubMed]
- McFeeters, S.K. The Use of the Normalized Difference Water Index (NDWI) in the Delineation of Open Water Features. International Journal of Remote Sensing 1996, 17, 1425–1432. [Google Scholar] [CrossRef]
- Yang, X.; Zhao, S.; Qin, X.; Zhao, N.; Liang, L. Mapping of Urban Surface Water Bodies from Sentinel-2 MSI Imagery at 10 m Resolution via NDWI-Based Image Sharpening. Remote Sensing 2017, 9, 596. [Google Scholar] [CrossRef]
- Dozier, J. Spectral Signature of Alpine Snow Cover from the Landsat Thematic Mapper. Remote Sensing of Environment 1989, 28, 9–22. [Google Scholar] [CrossRef]
- Gascoin, S.; Grizonnet, M.; Bouchet, M.; Salgues, G.; Hagolle, O. Theia Snow Collection: High-Resolution Operational Snow Cover Maps from Sentinel-2 and Landsat-8 Data. Earth System Science Data 2019, 11, 493–514. [Google Scholar] [CrossRef]
- Keshri, A.K.; Shukla, A.; Gupta, R.P. ASTER Ratio Indices for Supraglacial Terrain Mapping. International Journal of Remote Sensing 2009, 30, 519–524. [Google Scholar] [CrossRef]
- Dirscherl, M.; Dietz, A.J.; Kneisel, C.; Kuenzer, C. Automated Mapping of Antarctic Supraglacial Lakes Using a Machine Learning Approach. Remote Sensing 2020, 12, 1203. [Google Scholar] [CrossRef]
- Kaufman, Y.J.; Tanre, D. Atmospherically Resistant Vegetation Index (ARVI) for EOS-MODIS. IEEE Trans. Geosci. Remote Sensing 1992, 30, 261–270. [Google Scholar] [CrossRef]
- Somvanshi, S.S.; Kumari, M. Comparative Analysis of Different Vegetation Indices with Respect to Atmospheric Particulate Pollution Using Sentinel Data. Applied Computing and Geosciences 2020, 7, 100032. [Google Scholar] [CrossRef]
- Penuelas, J.; Frederic, B.; Filella, I. Semi-Empirical Indices to Assess Carotenoids/Chlorophyll a Ratio from Leaf Spectral Reflectance. 2013.
- Zhang, N.; Su, X.; Zhang, X.; Yao, X.; Cheng, T.; Zhu, Y.; Cao, W.; Tian, Y. Monitoring Daily Variation of Leaf Layer Photosynthesis in Rice Using UAV-Based Multi-Spectral Imagery and a Light Response Curve Model. Agricultural and Forest Meteorology 2020, 291, 108098. [Google Scholar] [CrossRef]
- Robak, A.; Gadawska, A.; Milczarek, M.; Lewiński, S. The detection of water on Sentinel-2 imagery.
- Feyisa, G.L.; Meilby, H.; Fensholt, R.; Proud, S.R. Automated Water Extraction Index: A New Technique for Surface Water Mapping Using Landsat Imagery. Remote Sensing of Environment 2014, 140, 23–35. [Google Scholar] [CrossRef]
- Bhaga, T.D.; Dube, T.; Shekede, M.D.; Shoko, C. Impacts of Climate Variability and Drought on Surface Water Resources in Sub-Saharan Africa Using Remote Sensing: A Review. Remote Sensing 2020, 12, 4184. [Google Scholar] [CrossRef]
- Gitelson, A.A.; Dall’Olmo, G.; Moses, W.; Rundquist, D.C.; Barrow, T.; Fisher, T.R.; Gurlin, D.; Holz, J. A Simple Semi-Analytical Model for Remote Estimation of Chlorophyll-a in Turbid Waters: Validation. Remote Sensing of Environment 2008, 112, 3582–3593. [Google Scholar] [CrossRef]
- Aranha, T.R.B.T.; Martinez, J.-M.; Souza, E.P.; Barros, M.U.G.; Martins, E.S.P.R. Remote Analysis of the Chlorophyll-a Concentration Using Sentinel-2 MSI Images in a Semiarid Environment in Northeastern Brazil. Water 2022, 14, 451. [Google Scholar] [CrossRef]
- Alzubaidi, L.; Zhang, J.; Humaidi, A.J.; Al-Dujaili, A.; Duan, Y.; Al-Shamma, O.; Santamaría, J.; Fadhel, M.A.; Al-Amidie, M.; Farhan, L. Review of Deep Learning: Concepts, CNN Architectures, Challenges, Applications, Future Directions. J Big Data 2021, 8, 53. [Google Scholar] [CrossRef] [PubMed]
- Talaei Khoei, T.; Ould Slimane, H.; Kaabouch, N. Deep Learning: Systematic Review, Models, Challenges, and Research Directions. Neural Comput & Applic 2023, 35, 23103–23124. [Google Scholar] [CrossRef]
- Luo, Z.; Lu, P.; Chen, Z.; Liu, R. Ozone Concentration Estimation and Meteorological Impact Quantification in the Beijing-Tianjin-Hebei Region Based on Machine Learning Models. Earth and Space Science 2024, 11, e2023EA003346. [Google Scholar] [CrossRef]
- James, G.; Witten, D.; Hastie, T.; Tibshirani, R.; Taylor, J. An Introduction to Statistical Learning: With Applications in Python; Springer International Publishing, 2023; ISBN Springer International Publishing. [Google Scholar]
- Géron, A. Hands-On Machine Learning with Scikit-Learn, Keras, and TensorFlow; O’Reilly Media, Inc., 2022; ISBN 978-1-09-812246-1. [Google Scholar]
- Ghojogh, B.; Crowley, M. The Theory Behind Overfitting, Cross Validation, Regularization, Bagging, and Boosting: Tutorial 2023.
- Chen, T.; Guestrin, C. XGBoost: A Scalable Tree Boosting System. In Proceedings of the 22nd ACM SIGKDD International Conference on Knowledge Discovery and Data Mining, San Francisco, CA, USA, 13 August 2016; pp. 785–794. [Google Scholar]
- Ivakhnenko, A.G. The Group Method of Data Handling, A Rival of the Method of Stochastic Approximation. Soviet Automatic Control 1968, 13, 43–55. [Google Scholar]
- Walton, R.; Binns, A.; Bonakdari, H.; Ebtehaj, I.; Gharabaghi, B. Estimating 2-Year Flood Flows Using the Generalized Structure of the Group Method of Data Handling. Journal of Hydrology 2019, 575, 671–689. [Google Scholar] [CrossRef]
- Azimi, H.; Bonakdari, H.; Ebtehaj, I.; Gharabaghi, B.; Khoshbin, F. Evolutionary Design of Generalized Group Method of Data Handling-Type Neural Network for Estimating the Hydraulic Jump Roller Length. Acta Mech 2018, 229, 1197–1214. [Google Scholar] [CrossRef]
- Ashrafzadeh, A.; Kişi, O.; Aghelpour, P.; Biazar, S.M.; Masouleh, M.A. Comparative Study of Time Series Models, Support Vector Machines, and GMDH in Forecasting Long-Term Evapotranspiration Rates in Northern Iran. J. Irrig. Drain Eng. 2020, 146, 04020010. [Google Scholar] [CrossRef]
- Ebtehaj, I.; Sammen, S.S.; Sidek, L.M.; Malik, A.; Sihag, P.; Al-Janabi, A.M.S.; Chau, K.-W.; Bonakdari, H. Prediction of Daily Water Level Using New Hybridized GS-GMDH and ANFIS-FCM Models. Engineering Applications of Computational Fluid Mechanics 2021, 15, 1343–1361. [Google Scholar] [CrossRef]
- Wang, W.; Du, Y.; Chau, K.; Chen, H.; Liu, C.; Ma, Q. A Comparison of BPNN, GMDH, and ARIMA for Monthly Rainfall Forecasting Based on Wavelet Packet Decomposition. Water 2021, 13, 2871. [Google Scholar] [CrossRef]
- Goodfellow, I.; Bengio, Y.; Courville, A. Deep Learning; MIT Press, 2016; ISBN 978-0-262-03561-3. [Google Scholar]
- Bansal, M.; Goyal, A.; Choudhary, A. A Comparative Analysis of K-Nearest Neighbor, Genetic, Support Vector Machine, Decision Tree, and Long Short Term Memory Algorithms in Machine Learning. Decision Analytics Journal 2022, 3, 100071. [Google Scholar] [CrossRef]
- Manoharan, A.; Begam, K.M.; Aparow, V.R.; Sooriamoorthy, D. Artificial Neural Networks, Gradient Boosting and Support Vector Machines for Electric Vehicle Battery State Estimation: A Review. Journal of Energy Storage 2022, 55, 105384. [Google Scholar] [CrossRef]
- Vidal Bezerra, F.D.; Pinto Marinho, F.; Costa Rocha, P.A.; Oliveira Santos, V.; Van Griensven Thé, J.; Gharabaghi, B. Machine Learning Dynamic Ensemble Methods for Solar Irradiance and Wind Speed Predictions. Atmosphere 2023, 14, 1635. [Google Scholar] [CrossRef]
- Tibshirani, R. Regression Shrinkage and Selection Via the Lasso. Journal of the Royal Statistical Society: Series B (Methodological) 1996, 58, 267–288. [Google Scholar] [CrossRef]
- Weisberg, S. Applied Linear Regression; John Wiley & Sons, 2005; ISBN 978-0-471-70408-9. [Google Scholar]
- Chicco, D.; Warrens, M.J.; Jurman, G. The Coefficient of Determination R-Squared Is More Informative than SMAPE, MAE, MAPE, MSE and RMSE in Regression Analysis Evaluation. PeerJ Computer Science 2021, 7, e623. [Google Scholar] [CrossRef]
- Yeo, I.-K.; Johnson, R.A. A New Family of Power Transformations to Improve Normality or Symmetry. Biometrika 2000, 87, 954–959. [Google Scholar] [CrossRef]
- Tumbas, M.; Markovic, S.; Salom, I.; Djordjevic, M. A Large-Scale Machine Learning Study of Sociodemographic Factors Contributing to COVID-19 Severity. Front. Big Data 2023, 6. [Google Scholar] [CrossRef] [PubMed]
- Pedregosa, F.; Varoquaux, G.; Gramfort, A.; Michel, V.; Thirion, B.; Grisel, O.; Blondel, M.; Prettenhofer, P.; Weiss, R.; Dubourg, V.; et al. Scikit-Learn: Machine Learning in Python. Journal of Machine Learning Research 2011, 12, 2825–2830. [Google Scholar]
- Zhu, X.; Guo, H.; Huang, J.J.; Tian, S.; Xu, W.; Mai, Y. An Ensemble Machine Learning Model for Water Quality Estimation in Coastal Area Based on Remote Sensing Imagery. Journal of Environmental Management 2022, 323, 116187. [Google Scholar] [CrossRef] [PubMed]
- Lundberg, S.M.; Lee, S.-I. A Unified Approach to Interpreting Model Predictions. In Proceedings of the Advances in Neural Information Processing Systems; Curran Associates, Inc., 2017; Volume 30. [Google Scholar]
- Magrì, S.; Ottaviani, E.; Prampolini, E.; Besio, G.; Fabiano, B.; Federici, B. Application of Machine Learning Techniques to Derive Sea Water Turbidity from Sentinel-2 Imagery. Remote Sensing Applications: Society and Environment 2023, 30, 100951. [Google Scholar] [CrossRef]
- Psychalas, C.; Vlachos, K.; Moumtzidou, A.; Gialampoukidis, I.; Vrochidis, S.; Kompatsiaris, I. Towards a Paradigm Shift on Mapping Muddy Waters with Sentinel-2 Using Machine Learning. Sustainability 2023, 15, 13441. [Google Scholar] [CrossRef]
- Maimouni, S.; Moufkari, A.A.; Daghor, L.; Fekri, A.; Oubraim, S.; Lhissou, R. Spatiotemporal Monitoring of Low Water Turbidity in Moroccan Coastal Lagoon Using Sentinel-2 Data. Remote Sensing Applications: Society and Environment 2022, 26, 100772. [Google Scholar] [CrossRef]
- Yang, Z.; Gong, C.; Lu, Z.; Wu, E.; Huai, H.; Hu, Y.; Li, L.; Dong, L. Combined Retrievals of Turbidity from Sentinel-2A/B and Landsat-8/9 in the Taihu Lake through Machine Learning. Remote Sensing 2023, 15, 4333. [Google Scholar] [CrossRef]
- Katlane, R.; Doxaran, D.; ElKilani, B.; Trabelsi, C. Remote Sensing of Turbidity in Optically Shallow Waters Using Sentinel-2 MSI and PRISMA Satellite Data. PFG 2023. [Google Scholar] [CrossRef]
- Caballero, I.; Stumpf, R.P. Confronting Turbidity, the Major Challenge for Satellite-Derived Coastal Bathymetry. Science of The Total Environment 2023, 870, 161898. [Google Scholar] [CrossRef]
- Chowdhury, M.; Vilas, C.; Van Bergeijk, S.; Navarro, G.; Laiz, I.; Caballero, I. Monitoring Turbidity in a Highly Variable Estuary Using Sentinel 2-A/B for Ecosystem Management Applications. Front. Mar. Sci. 2023, 10, 1186441. [Google Scholar] [CrossRef]
- Wolpert, D.H.; Macready, W.G. No Free Lunch Theorems for Optimization. IEEE Trans. Evol. Computat. 1997, 1, 67–82. [Google Scholar] [CrossRef]
- Nevo, S.; Morin, E.; Gerzi Rosenthal, A.; Metzger, A.; Barshai, C.; Weitzner, D.; Voloshin, D.; Kratzert, F.; Elidan, G.; Dror, G.; et al. Flood Forecasting with Machine Learning Models in an Operational Framework. Hydrology and Earth System Sciences 2022, 26, 4013–4032. [Google Scholar] [CrossRef]
- Costa Rocha, P.A.; Oliveira Santos, V.; Scott, J.; Van Griensven Thé, J.; Gharabaghi, B. Application of Graph Neural Networks to Forecast Urban Flood Events: The Case Study of the 2013 Flood of the Bow River, Calgary, Canada. International Journal of River Basin Management 2024, 1–18. [Google Scholar] [CrossRef]
- Chen, P.; Wang, B.; Wu, Y.; Wang, Q.; Huang, Z.; Wang, C. Urban River Water Quality Monitoring Based on Self-Optimizing Machine Learning Method Using Multi-Source Remote Sensing Data. Ecological Indicators 2023, 146, 109750. [Google Scholar] [CrossRef]
- Chen, Y.; Yao, K.; Zhu, B.; Gao, Z.; Xu, J.; Li, Y.; Hu, Y.; Lin, F.; Zhang, X. Water Quality Inversion of a Typical Rural Small River in Southeastern China Based on UAV Multispectral Imagery: A Comparison of Multiple Machine Learning Algorithms. Water 2024, 16, 553. [Google Scholar] [CrossRef]
Figure 1.
Map containing the geographic location of the Mississippi River and its five main tributaries. The green markers represent the location of the monitoring stations withing the Mississippi River Basin, represented by the blue area. The pins starting at Illinois and ending at Louisiana, are in the Mississippi River course. The pins beginning in Iowa and ending at Missouri, are in the Missouri River course.
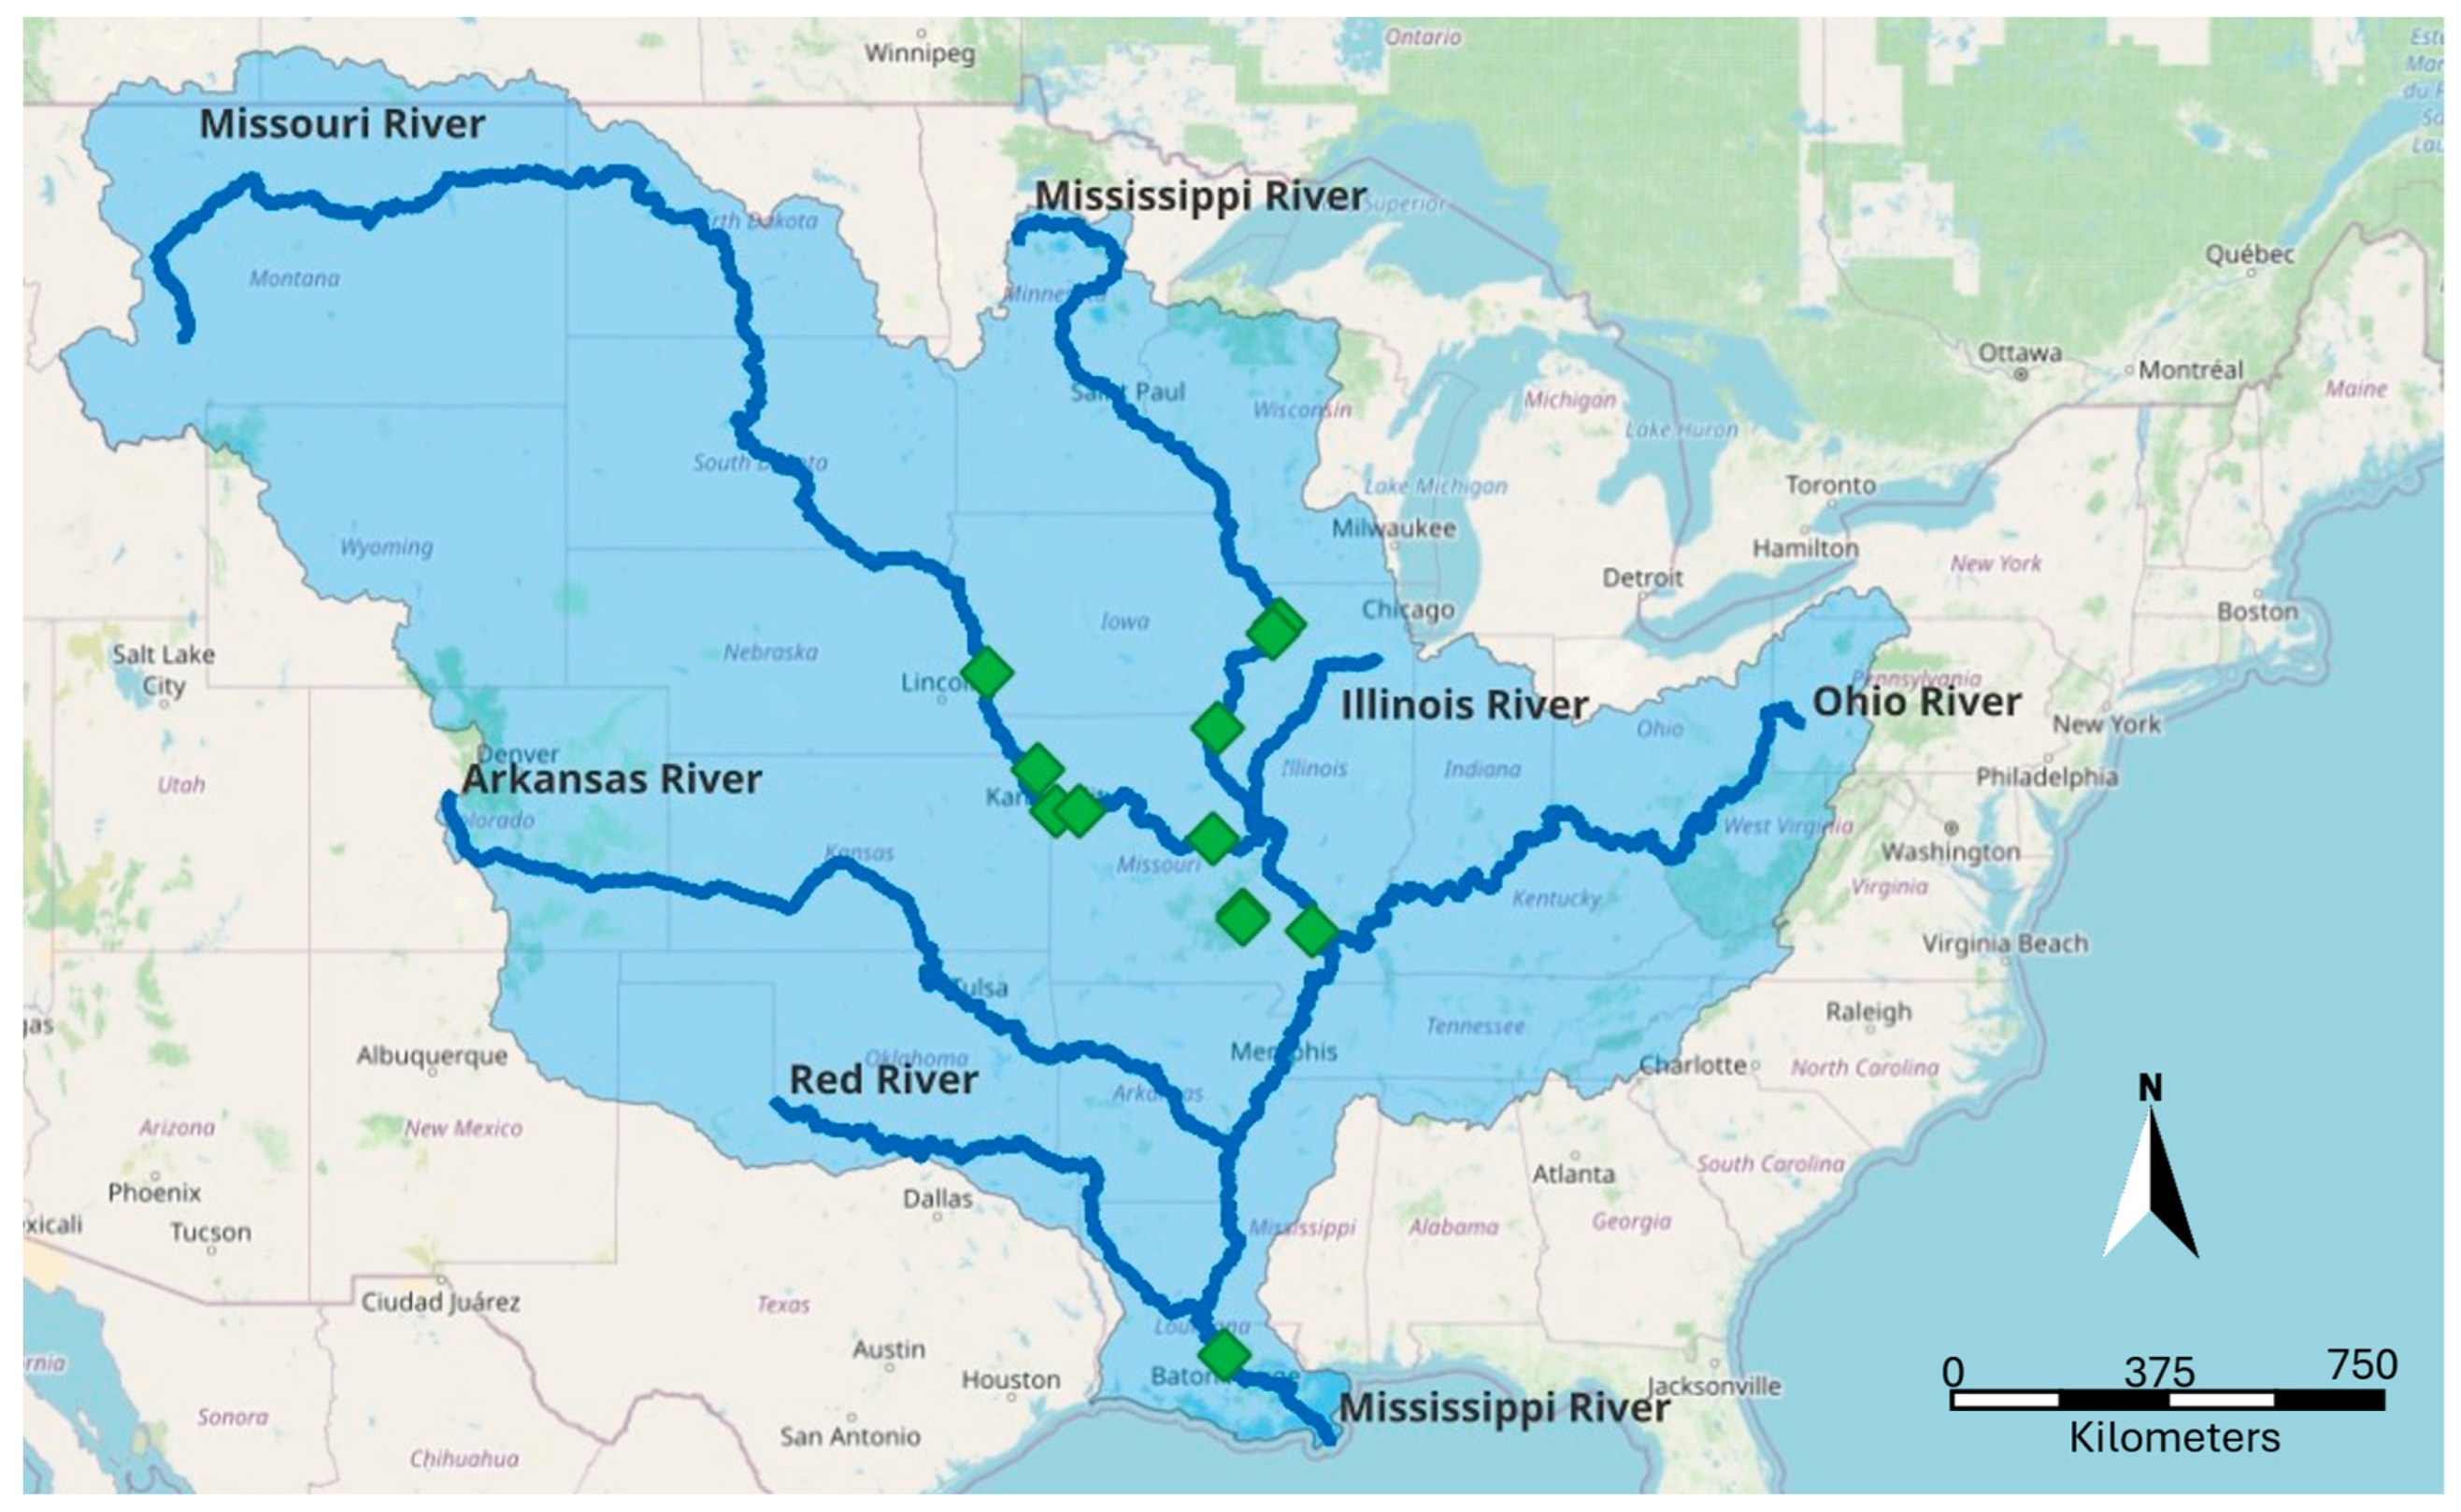
Figure 2.
Results for the selection of the best spectral indices for turbidity modeling. The darker color indicates the best outcome in terms of R2.
Figure 2.
Results for the selection of the best spectral indices for turbidity modeling. The darker color indicates the best outcome in terms of R2.
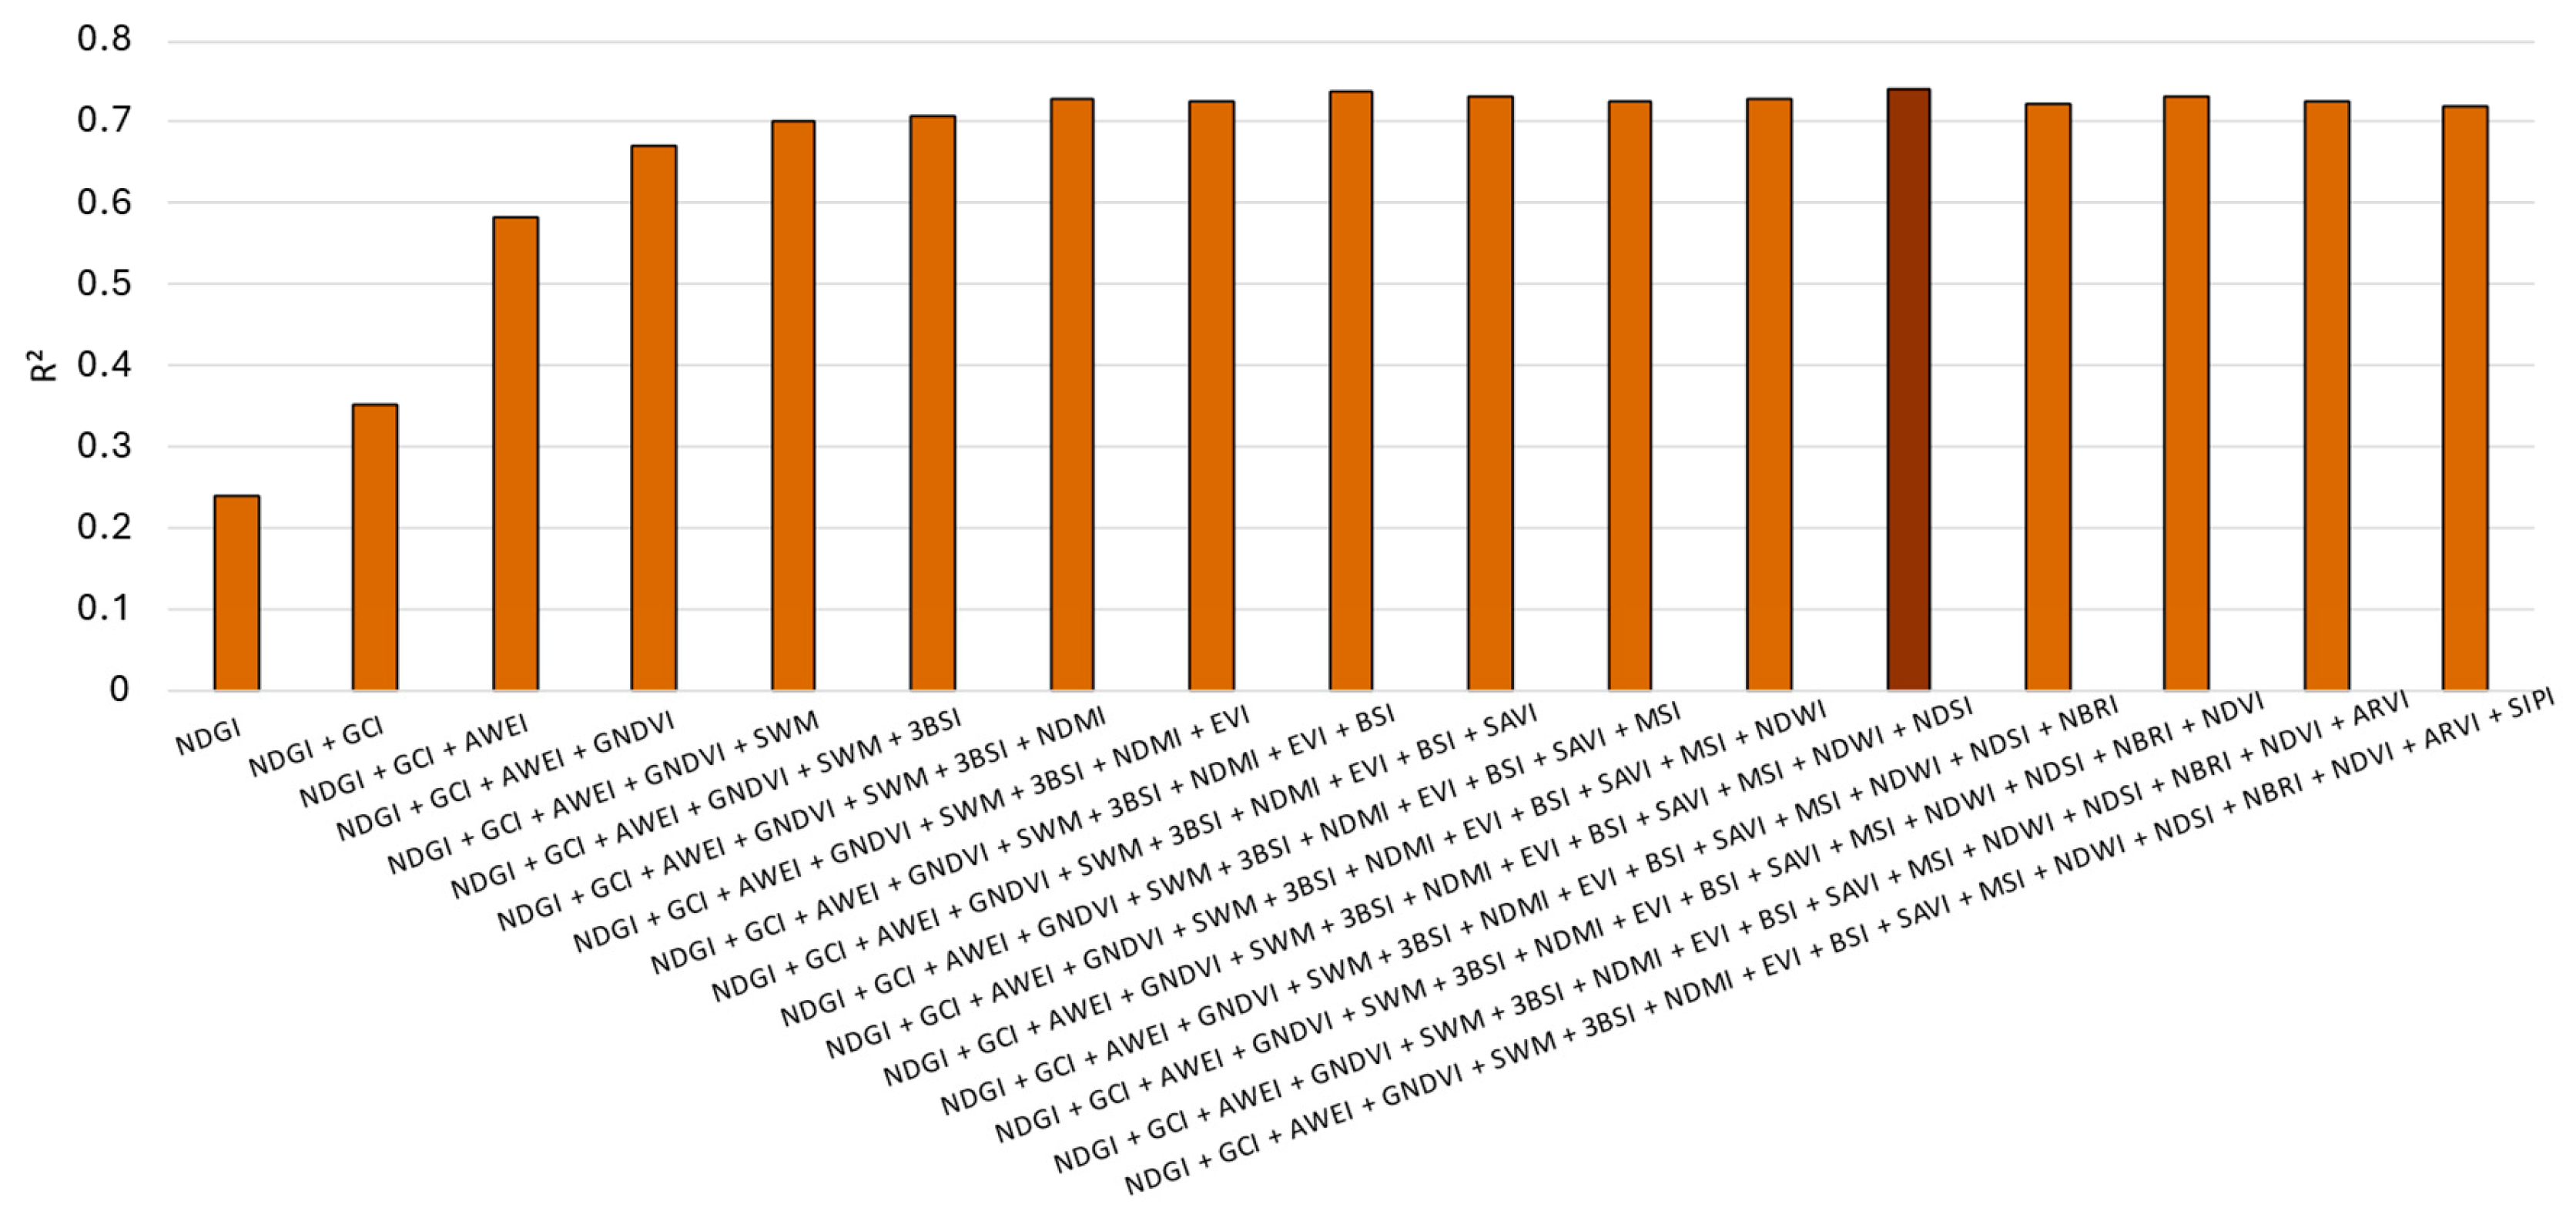
Figure 3.
Results for the selection of the best spectral bands for turbidity modeling. The darker color indicates the best outcome in terms of R2.
Figure 3.
Results for the selection of the best spectral bands for turbidity modeling. The darker color indicates the best outcome in terms of R2.
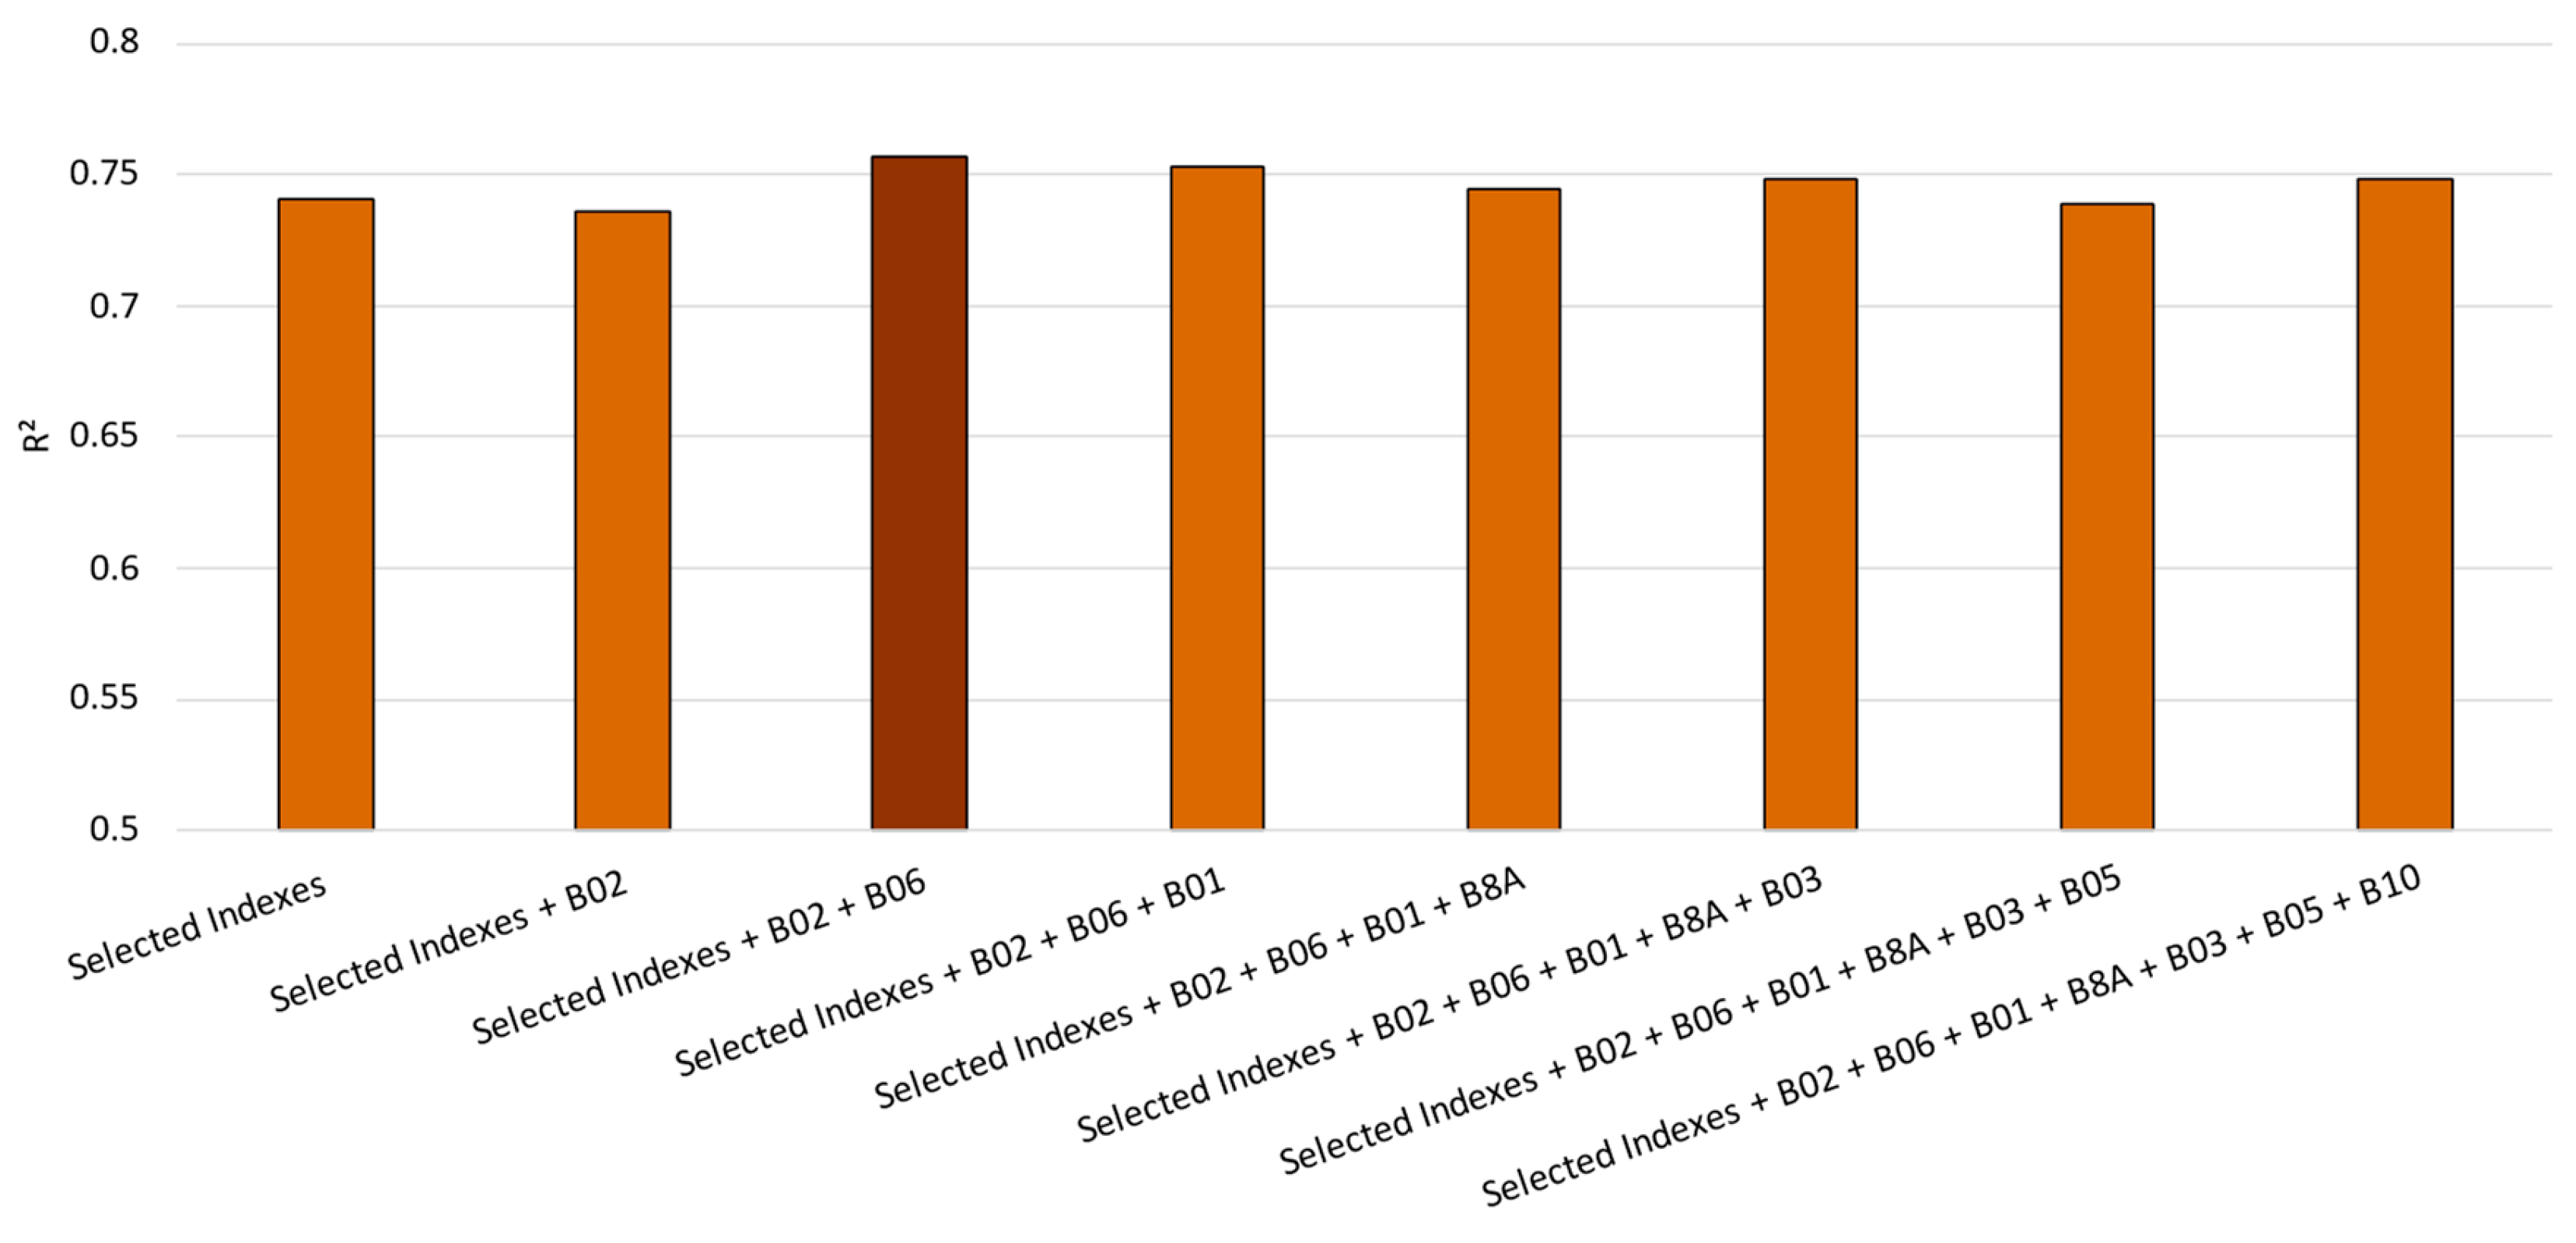
Figure 4.
Regression line for turbidity versus third quantile values.
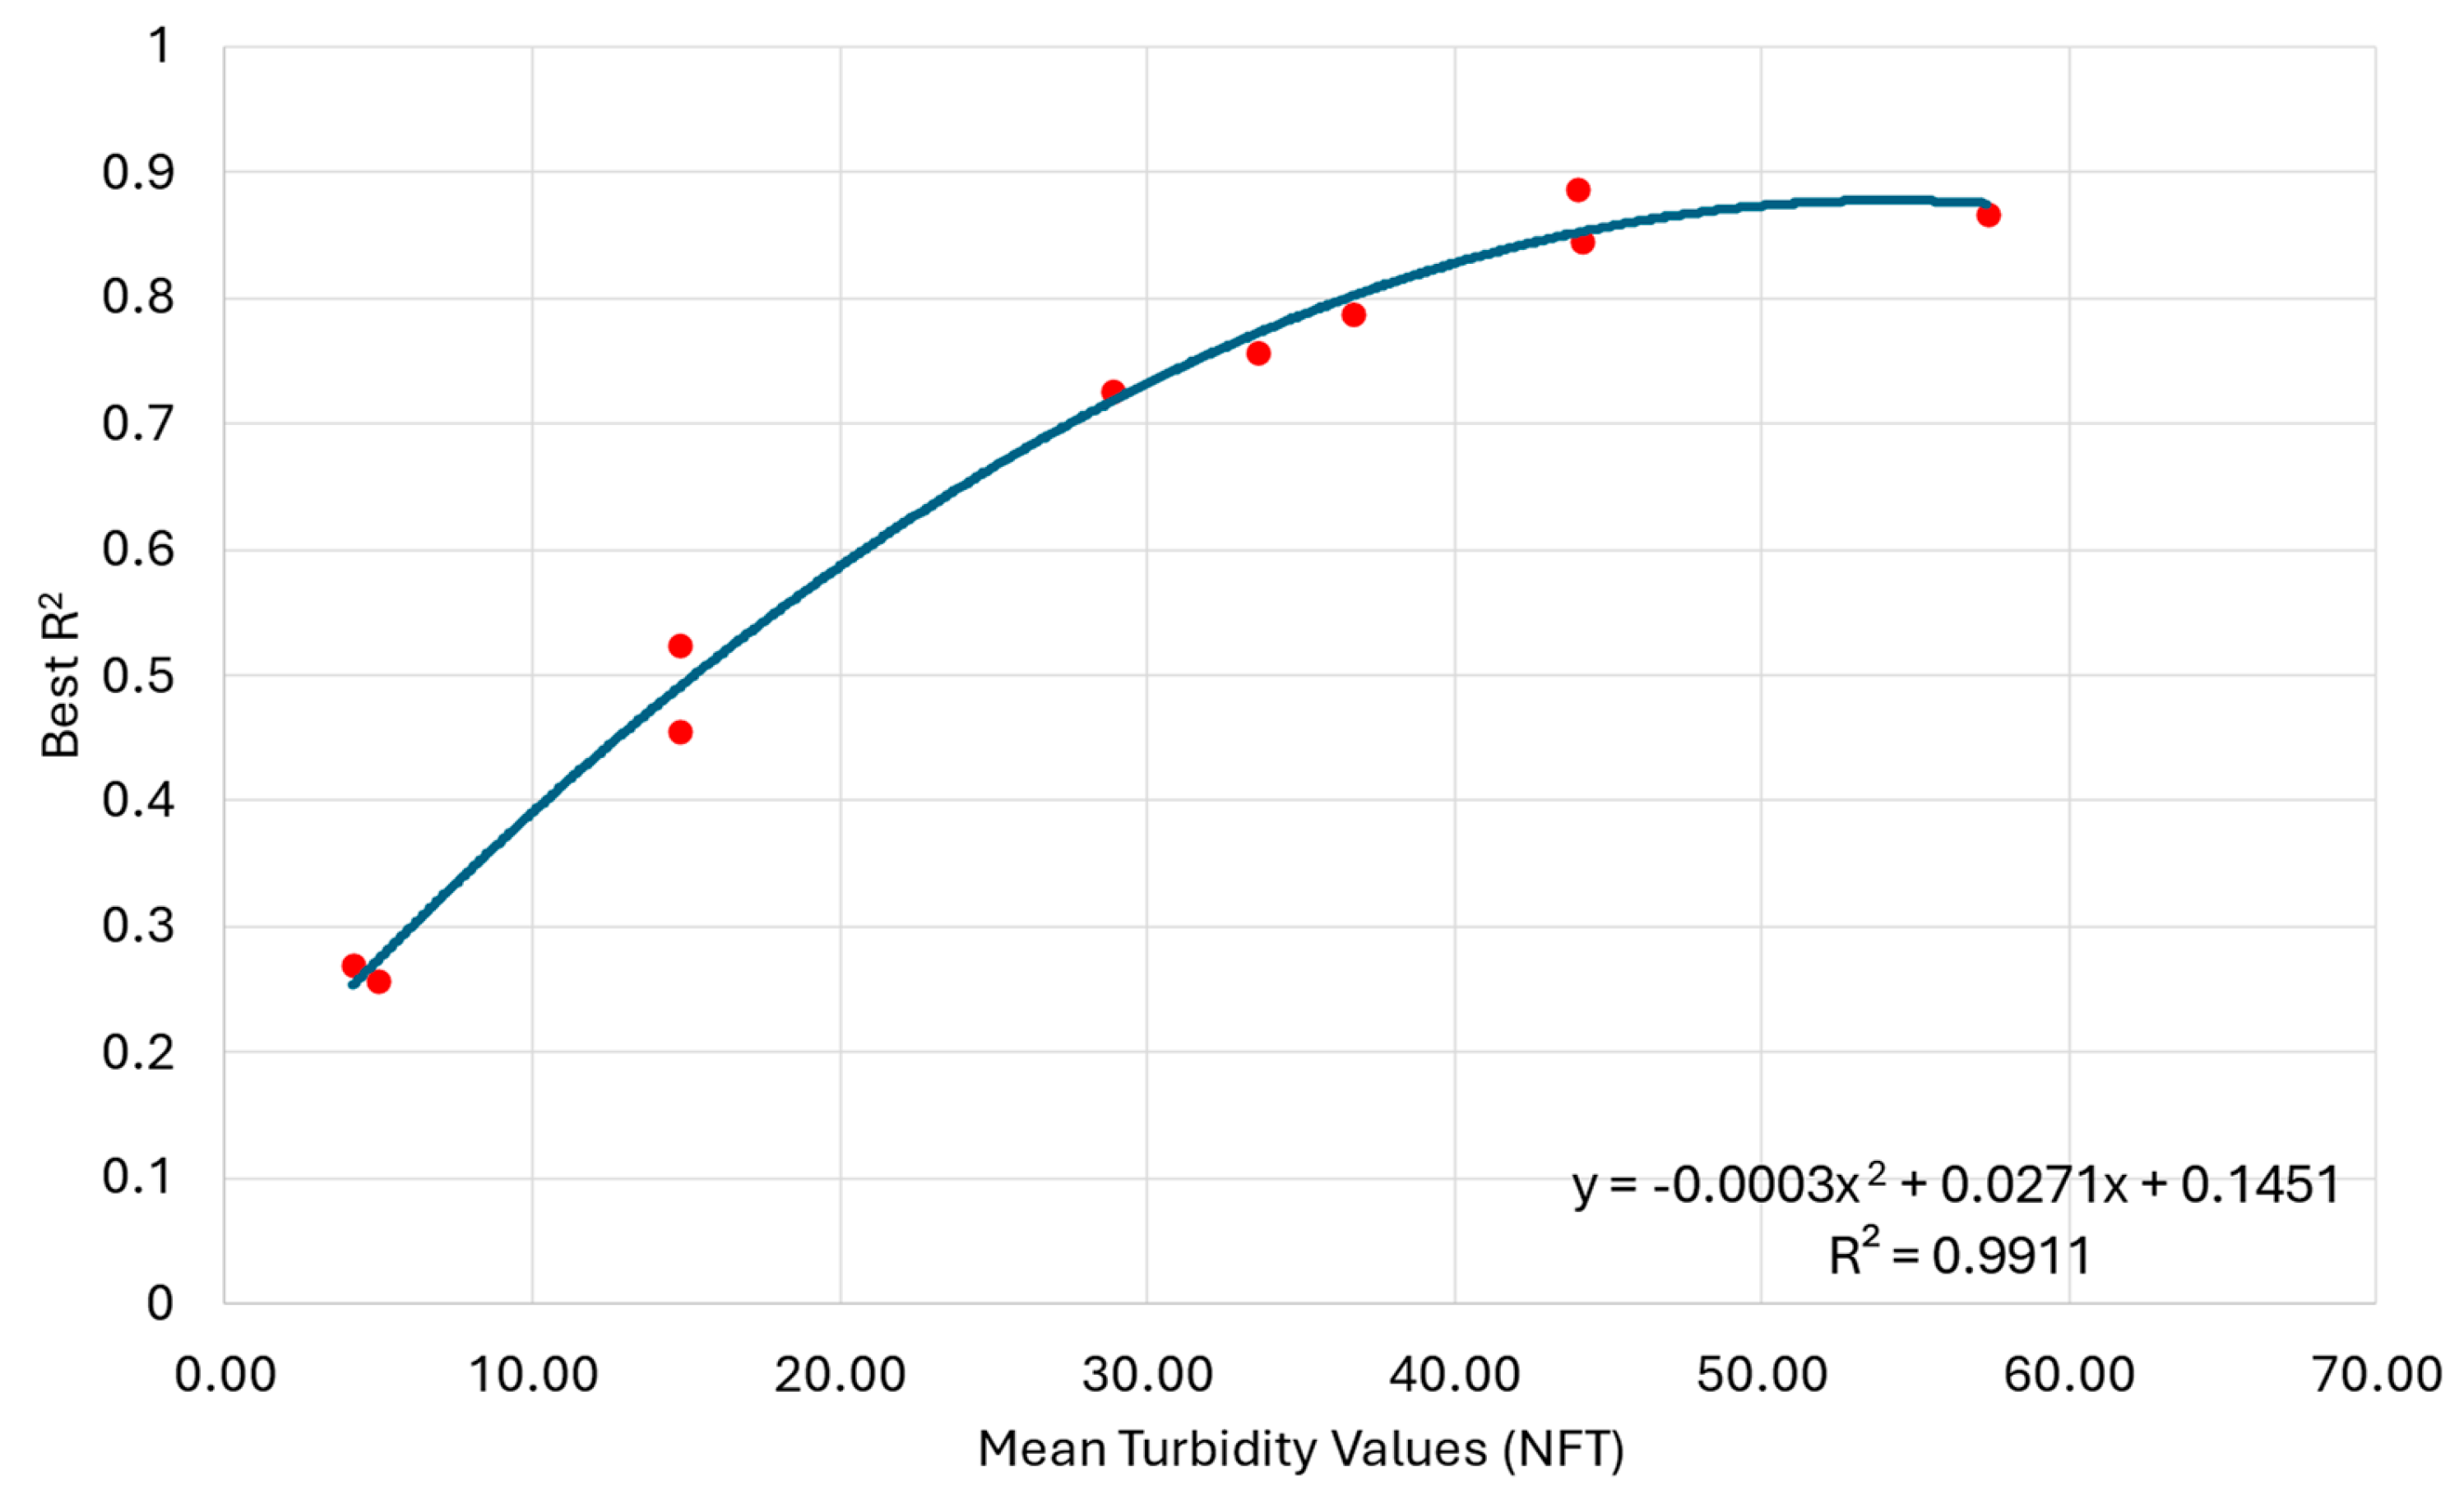

Table 1.
Statistical analysis of the dataset for each one of the monitoring stations. The unit for turbidity values is the Formazin Nephelometric Unit (FNU).
Table 1.
Statistical analysis of the dataset for each one of the monitoring stations. The unit for turbidity values is the Formazin Nephelometric Unit (FNU).
| Monitoring Stations | Count | Mean (FNU) |
Stdev (FNU) |
Minimum (FNU) |
Median (FNU) |
Maximum (FNU) |
| All Stations | 2453 | 33.59 | 50.56 | 0.00 | 20.40 | 617.00 |
| Missouri River at Randolph, MO | 327 | 57.30 | 71.52 | 7.50 | 34.50 | 617.00 |
| Missouri River at St. Joseph, MO | 311 | 43.94 | 61.00 | 5.10 | 24.90 | 518.00 |
| East Fork Black River near Lesterville, MO | 288 | 4.15 | 4.86 | 0.00 | 2.10 | 27.40 |
| E. Fk. Black R. bl Lower Taum Sauk Reservoir | 288 | 4.95 | 4.13 | 0.40 | 3.40 | 28.30 |
| Missouri River at Napoleon, MO | 279 | 36.67 | 0.90 | 28.90 | 36.80 | 36.80 |
| Missouri River near Council Bluffs, IA | 159 | 28.83 | 32.53 | 5.60 | 18.60 | 304.00 |
| Mississippi River at Keokuk, IA | 135 | 14.79 | 3.45 | 4.60 | 15.60 | 26.60 |
| Mississippi River at Cape Girardeau, MO | 135 | 14.79 | 3.45 | 4.60 | 15.60 | 26.60 |
| Mississippi River at Baton Rouge, LA | 133 | 44.09 | 20.54 | 12.60 | 41.10 | 98.50 |
| Missouri River at Hermann, MO | 124 | 85.01 | 102.63 | 3.60 | 38.80 | 604.00 |
| Mississippi River at Clinton, IA | 121 | 25.47 | 37.43 | 3.20 | 14.40 | 167.00 |
| Mississippi River at Dam 13 near Fulton, IL | 92 | 4.62 | 0.47 | 1.60 | 4.70 | 4.70 |
| Band | Central wavelength (nm) |
Bandwidth (nm) |
Spatial resolution (m) |
Band spectral range |
| 1 | 443 | 20 | 60 | Coastal aerosol |
| 2 | 490 | 65 | 10 | Blue |
| 3 | 560 | 35 | 10 | Green |
| 4 | 665 | 30 | 10 | Red |
| 5 | 705 | 15 | 20 | Vegetation red edge 1 |
| 6 | 740 | 15 | 20 | Vegetation red edge 2 |
| 7 | 783 | 20 | 20 | Vegetation red edge 3 |
| 8 | 842 | 115 | 10 | NIR |
| 8A | 865 | 20 | 20 | Narrow NIR |
| 9 | 945 | 20 | 60 | Water vapor |
| 10 | 1380 | 30 | 60 | SWIR-Cirrus |
| 11 | 1610 | 90 | 20 | SWIR 1 |
| 12 | 2190 | 180 | 20 | SWIR 2 |
Table 3.
Spectral indices were investigated in this study. We recommend referring to the provided references for further information regarding their formulation.
Table 3.
Spectral indices were investigated in this study. We recommend referring to the provided references for further information regarding their formulation.
| Index | Use | Reference | Formulation |
| Normalized Difference Vegetation Index (NDVI) | This index is primarily used to assess green areas. | [48,49] | |
| Green Normalized Difference Vegetation Index (GNDVI) | This index is a modified version of the NDVI that aims to detect Chla. | [50,51] | |
| Enhanced Vegetation Index (EVI) | This index is similar to NDVI but does not consider atmospheric nor soil signals. | [52,53] | |
| Soil-Adjusted Vegetation Index (SAVI) | This index improves the NDVI by considering the soil effect on the remote sensed data. | [53,54] | |
| Normalized Difference Moisture Index (NDMI) | This index identifies changes in the vegetation related to the water concentration. | [55,56] | |
| Moisture Stress Index (MSI) | This index identifies alterations in the water content of the vegetation. | [57,58] | |
| Green Chlorophyll Vegetation Index (GCI) | This index identifies signals related to chlorophyll levels in the vegetation. | [59,60] | |
| Normalized Burned Ratio Index (NBRI) | This index is applied to identify fire occurrences, both natural and man-made. | [45,61] | |
| Bare Soil Index (BSI) | This index detects the state of vegetation health, given the exposed soil area. | [62,63] | |
| Normalized Difference Water Index (NDWI) | This index fetches information related to water bodies. | [64,65] | |
| Normalized Difference Snow Index (NDSI) | This index detects the total snow covering an area of interest. | [66,67] | |
| Normalized Difference Glacier Index (NDGI) | This index detects the coverage of glaciers in an area of interest. | [68,69] | |
| Atmospherically Resistant Vegetation Index (ARVI) | This index improves the NDVI by adding atmospheric corrections to it. | [70,71] | |
| Structure-Insensitive Pigment Index (SIPI) | This index can be applied to identify vegetal coverage with different canopy structures and vegetation stress. | [72,73] | |
| Sentinel Water Mask (SWM) | This index was specifically created to retrieve water information from Sentinel-2 data. | [74] | |
| Automated Water Extraction Index (AWEI) | This index is used to identify water in remotely sensed data for different environment configurations. | [75,76] | |
| 3 Band Spectral Index (3BSI) | This index was developed for inland waters, aiming to identify the absorption coefficient of chlorophyll. | [77,78] |
Table 4.
Results for turbidity modeling by the investigated ML models for each monitoring station.
| Monitoring Stations | Best Model (R2) |
Best Model Normalization |
2nd Best Model (R2) |
2nd Best model Normalization |
| Missouri River at Randolph, MO | GMDH (86.8%) |
None | XGBoost (83.3%) |
None |
| Missouri River at St. Joseph, MO | kNN (88.7%) |
None | RF (85.2%) |
Yeo-Johnson with normal standardization |
| East Fork Black River near Lesterville, MO | XGBoost (27.0%) |
None | SVR (25.6%) |
Yeo-Johnson with normal standardization |
| E. Fk. Black R. bl Lower Taum Sauk Reservoir | RF (25.7%) |
None | XGBoost (25.2%) |
None |
| Missouri River at Napoleon, MO | XGboost (78.8%) |
None | RF (75.7%) |
None |
| Missouri River near Council Bluffs, IA | LASSO (72.6%) |
None | GMDH (68.8%) |
Normal Standardization |
| Mississippi River at Keokuk, IA | GMDH (45.6%) |
Normal Standardization | RF (43.2%) |
Yeo-Johnson with normal standardization |
| Mississippi River at Cape Girardeau, MO | GMDH (52.5%) |
None | LASSO (51.9%) |
None |
| Mississippi River at Baton Rouge, LA | GMDH (84.6%) |
Normal standardization | SVR (84.5%) |
Normal standardization |
| Missouri River at Hermann, MO | SVR (63.6%) |
Yeo-Johnson with normal standardization | GMDH (61.4%) |
None |
| Mississippi River at Clinton, IA | XGBoost (28.3%) |
None | kNN (25.2%) |
None |
| Mississippi River at Dam 13 near Fulton, IL | None | - | None | - |
| Average R2 | 59.5% | - | 57.3% | - |
Table 5.
Frequency of times each assessed model was the best, or second-best performing approach considering all the stations.
Table 5.
Frequency of times each assessed model was the best, or second-best performing approach considering all the stations.
| Frequency of best performing model |
Frequency of second-best performing model |
Total | |
| GMDH | 4 | 2 | 6 |
| XGBoost | 3 | 2 | 5 |
| RF | 1 | 3 | 4 |
| SVR | 1 | 2 | 3 |
| kNN | 1 | 1 | 2 |
| LASSO | 1 | 1 | 2 |
Table 6.
Results for the modeled turbidity considering all the 2.453 samples from the monitoring stations.
Table 6.
Results for the modeled turbidity considering all the 2.453 samples from the monitoring stations.
| Best Model (R2) |
Best Model Normalization | 2nd Best Model (R2) | 2nd Best Model Normalization |
| XGBoost (75.7%) |
None | RF (70.7%) |
None |
Table 7.
Compilation of results for turbidity modeling found in the literature.
| Model | Location | Dataset | R2 | Reference |
| Two ML learning approaches: a stepwise linear regression and a polynomial kernel regression | North Tyrrhenian Sea, Italy | Sentinel-2 imagery | 73.6% 72.5% |
Magrì et al. [104] |
| Gradient Boosting Decision Tree | Lakes in Northeast China | Sentinel-2 imagery |
88% | Ma et al. [18] |
| Semi-empirical regional turbidity algorithm | Bizerte, Tunisia | Sentinel-2 and Prisma imagery |
88% | Katlane et al. [108] |
| Self-optimizing machine learning model | Nanfei City, China | GF-1C imagery | 67.9% | Chen et al. [114] |
| Catboost regression (CBR) model | Changlin River, China | Multispectral image from unmanned aerial vehicles | 92% | Chen et al. [115] |
Disclaimer/Publisher’s Note: The statements, opinions and data contained in all publications are solely those of the individual author(s) and contributor(s) and not of MDPI and/or the editor(s). MDPI and/or the editor(s) disclaim responsibility for any injury to people or property resulting from any ideas, methods, instructions or products referred to in the content. |
© 2024 by the authors. Licensee MDPI, Basel, Switzerland. This article is an open access article distributed under the terms and conditions of the Creative Commons Attribution (CC BY) license (http://creativecommons.org/licenses/by/4.0/).
Copyright: This open access article is published under a Creative Commons CC BY 4.0 license, which permit the free download, distribution, and reuse, provided that the author and preprint are cited in any reuse.


