
Submitted:
24 April 2025
Posted:
25 April 2025
You are already at the latest version
Abstract
The contemporary world is marked by a continuous process of change and adaptation, and this phenomenon is especially reflected in the fields of creativity, culture, entertainment and art. From cultural traditions to modern forms of artistic expression, it is evident that change is an essential part of the evolution of this domain. In this context, rural and mountain tourism plays a crucial role in promoting and capitalizing on the cultural heritage of communities in mountainous areas, while young people are in a constant search for recreational and educational activities, such as hiking, camps, and excursions. The article explores the impact of mountain tourism on the development of local entrepreneurship, particularly in the fields of art and entertainment, with a focus on the evolution of this sector in the period 2021-2022. The study analyzes economic and performance indicators, such as the number of businesses, forced employment, and seasonal fluctuations, highlighting how these factors influence the viability and sustainability of businesses in this field.
Keywords:
Art and Entertainment
; Cultural Heritage
; Mountain Entrepreneurship
; Statistic Analysis
Introduction
The world is in continuous motion, and change is inevitable in all spheres of occupation, including in the creative process. Different forms of expression in traditional art have periodically brought about new changes conditioned by modernity. An exaggerated sympathy for the past, traditions, the fear of improvisation, and the acceptance of everything new, along with the tendency for self-preservation, are not beneficial for art and hinder the creative process.
Romanian rural communities have the chance to benefit from considerable heritage that proves useful when viewed from the perspective of tourism. The major issue currently facing these communities is the valorization of this heritage through rural tourism, which ensures effective conservation while also striving for better integration into current conditions.
Mountains undergo conceptual metamorphosis in many forms and appear to us in numerous practical facets. They create a syncretism between space and time, with space providing geopolitical orientations that encompass historical, cultural, social, national, and individual identities. Mountains lend themselves as subjects of philosophical reflection, environmental meditation, and ecocritical ontology. They embody avenues for spiritual dynamism, scientific advancement, medical therapy, and recreation. Moreover, mountains represent both a priori and a posteriori technological and artistic innovations, specific to human and non-human exploitation. Mountain spaces are sometimes presented as borderlands—contested zones of expansion, conflict, and migration. The most dynamic aspects of the mountain environment are found in tourism, agribusiness, and industrialization. Mountains can represent cultural-artistic and entertainment facets, as well as technical, technological, and socio-economic dimensions of a pattern tied to a distinct form of memory—the memory of mountains, a cultural memory. The shapes of mountains, in constant flux, are molded and remolded through processes of cultural and geological erosion. (Müller & Quendler, 2021)
The arts, entertainment and culture are important because they define the reference system of the respective area, which is especially true in mountain regions. The state and evolution of culture define the history of a people.
Beyond its intrinsic value, culture offers significant social and economic benefits. Cultural heritage broadens opportunities for education and lifelong learning, allowing us to better understand the world and its history. All material, spiritual, and ideological expressions that represent a broader group of people form their culture. As a creation of the human being, culture is an exclusive heritage of humanity. Cultural expressions such as art, literature, language, and religion, along with a community’s values and beliefs, form its essence and are reflected in the lifestyle of its members. Each culture is unique and different, and this diversity adds immeasurable value to the cultural heritage of humanity. The cultural field is represented by a diverse structure of specialized units, distinct in terms of their activities, organizational structure, and the ways in which they engage with the public. For example, in Romania, the Dornelor Basin is defined by a cultural environment with a long-standing and well-recognized tradition, which continues to be a hub of national and international interest today, thanks to major cultural events organized in its constituent localities. (Antonescu, 2023)
The mountain area offers a wide range of recreational and entertainment opportunities throughout the entire year, not limited to just seasonal activities. Recently (in the last few decades), tourism has developed by promoting various forms of entertainment and recreational activities, such as youth tourism, culinary tourism, spa tourism, ecumenical tourism, festival tourism, ecological and adventure tourism, sports tourism, and more.
Youth tourism is continuously developing, with young people increasingly interested in acquiring various skills. This type of tourism is an effective method for educating and training young people, teaching them at the same time how to face responsibilities.
Various activities are offered to young people depending on their preferences, for educational, social, or recreational purposes. Hiking, excursions, and camps are forms of youth tourism that they can benefit from.
Mountain tourism and coastal tourism are frequently visited by young tourists because they offer numerous activities depending on the season. Given the tourist flow of this category of tourists, a significant evolution will be noted. The main activities and particularities of youth tourism are also addressed.
Young people are passionate about their interests, in which they invest not only time but also financial resources. Whether they choose sports, intellectual activities, or those dedicated to recreation, young people prefer to spend their free time with various forms of tourism, such as hiking, excursions, or camps.
Hiking generally begins from the point where transportation can no longer go, meaning hikers must walk to the tourist destination, often a natural one. A concrete example is a hike accessible to young people, the Bușteni-Babele trail, which generally lasts between 7 and 9 hours, assuming stops are made every two hours (Niță, 2009).
Whether organized in groups or individually, an excursion involves organizing the time so that tourists benefit from a set itinerary. The excursion aims to visit pre-established tourist objectives, making stops to purchase souvenirs or participate in various role-playing games organized in bazaars or fairs (Goga, 1983).
Camps are forms of tourism organized for homogeneous groups, limited in duration, and characterized by a predefined program.
Human development encompasses all aspects of human existence. Human development evolves through dimensions that define it, such as: the improvement of human skills and the creation of suitable conditions for people. Empowerment is quantified through long and healthy life, knowledge, decent living standards, and the creation of suitable conditions that involve participation in political and community life, environmental sustainability, gender and security, and human rights.
Human development is sustainable only in the presence of these dimensions that support human dignity and are fostered through entrepreneurship (UNDP, 2015). Entrepreneurship is one of the key factors in human development and, implicitly, human dignity. Entrepreneurship leads to the expansion of human capacity and develops goal-oriented behavior. It is effective if there is consistent support for the human capital it creates and if a good grouping of activities can be ensured. The engine of adequate human development is essential in the development of human knowledge and is crucial for overall human development.
Methodology
Mountain entrepreneurship lies at the intersection of a specific natural environment, characterized by unique geographical and economic conditions, and an economic activity oriented toward culture, art, and entertainment. Analyzing this sector can provide valuable insights into how economic, social, and environmental factors influence business development in mountain areas.
Mountain arts and entertainment include both traditional forms (crafts, visual arts, theater) and modern forms (musical events, festivals, cultural tourism). In this context, it is essential to understand how entrepreneurship performance in this field evolves, using relevant indicators from a set of statistical data.
The aim of this article is to analyze the evolution and variability of mountain entrepreneurship in the arts and entertainment sector, using specific indicators that reflect the performance of this sector. We will examine the statistical indicators from the datasets to understand the trends, fluctuations, and particularities of this type of entrepreneurship during different periods.
The data used in this study were collected over several months from a variety of statistical sources. Each dataset reflects the economic, financial, and participation performance of businesses in the mountain arts and entertainment sector. The indicators analyzed include: the number of valid observations, mean, standard error of the mean, medians, modes, standard deviation, skewness, and kurtosis for each quarter of the years 2021 and 2022 (tables and figures).
The analysis spans the period from 2021 to 202022, with 2025 perspetive. The dataset includes 28 key indicators from Eurostat / provided at [https://doi.org/10.5281/zenodo.14713867]. The research encompasses 15 European countries: Austria, Bulgaria, Croatia, Czechia, France, Germany, Greece, Italy, Poland, Portugal, Romania, Slovakia, Slovenia, Spain, and Sweden. Eurostat data were analyzed in SPSS/Excel.
It is also crucial to examine variance and trends according to the type of artistic or entertainment activity, as well as the impact of seasonality on these activities.
The "N Valid" indicator represents the number of valid observations for each time period (month/quarter), while "N Missing" indicates the number of missing observations. From the data analysis, it is observed that the number of valid observations ranges from 10 to 15 for most months, suggesting relatively consistent data coverage. Missing data (N Missing) are more common in certain months, which may reflect data collection errors or seasonal fluctuations in entrepreneurial activity.
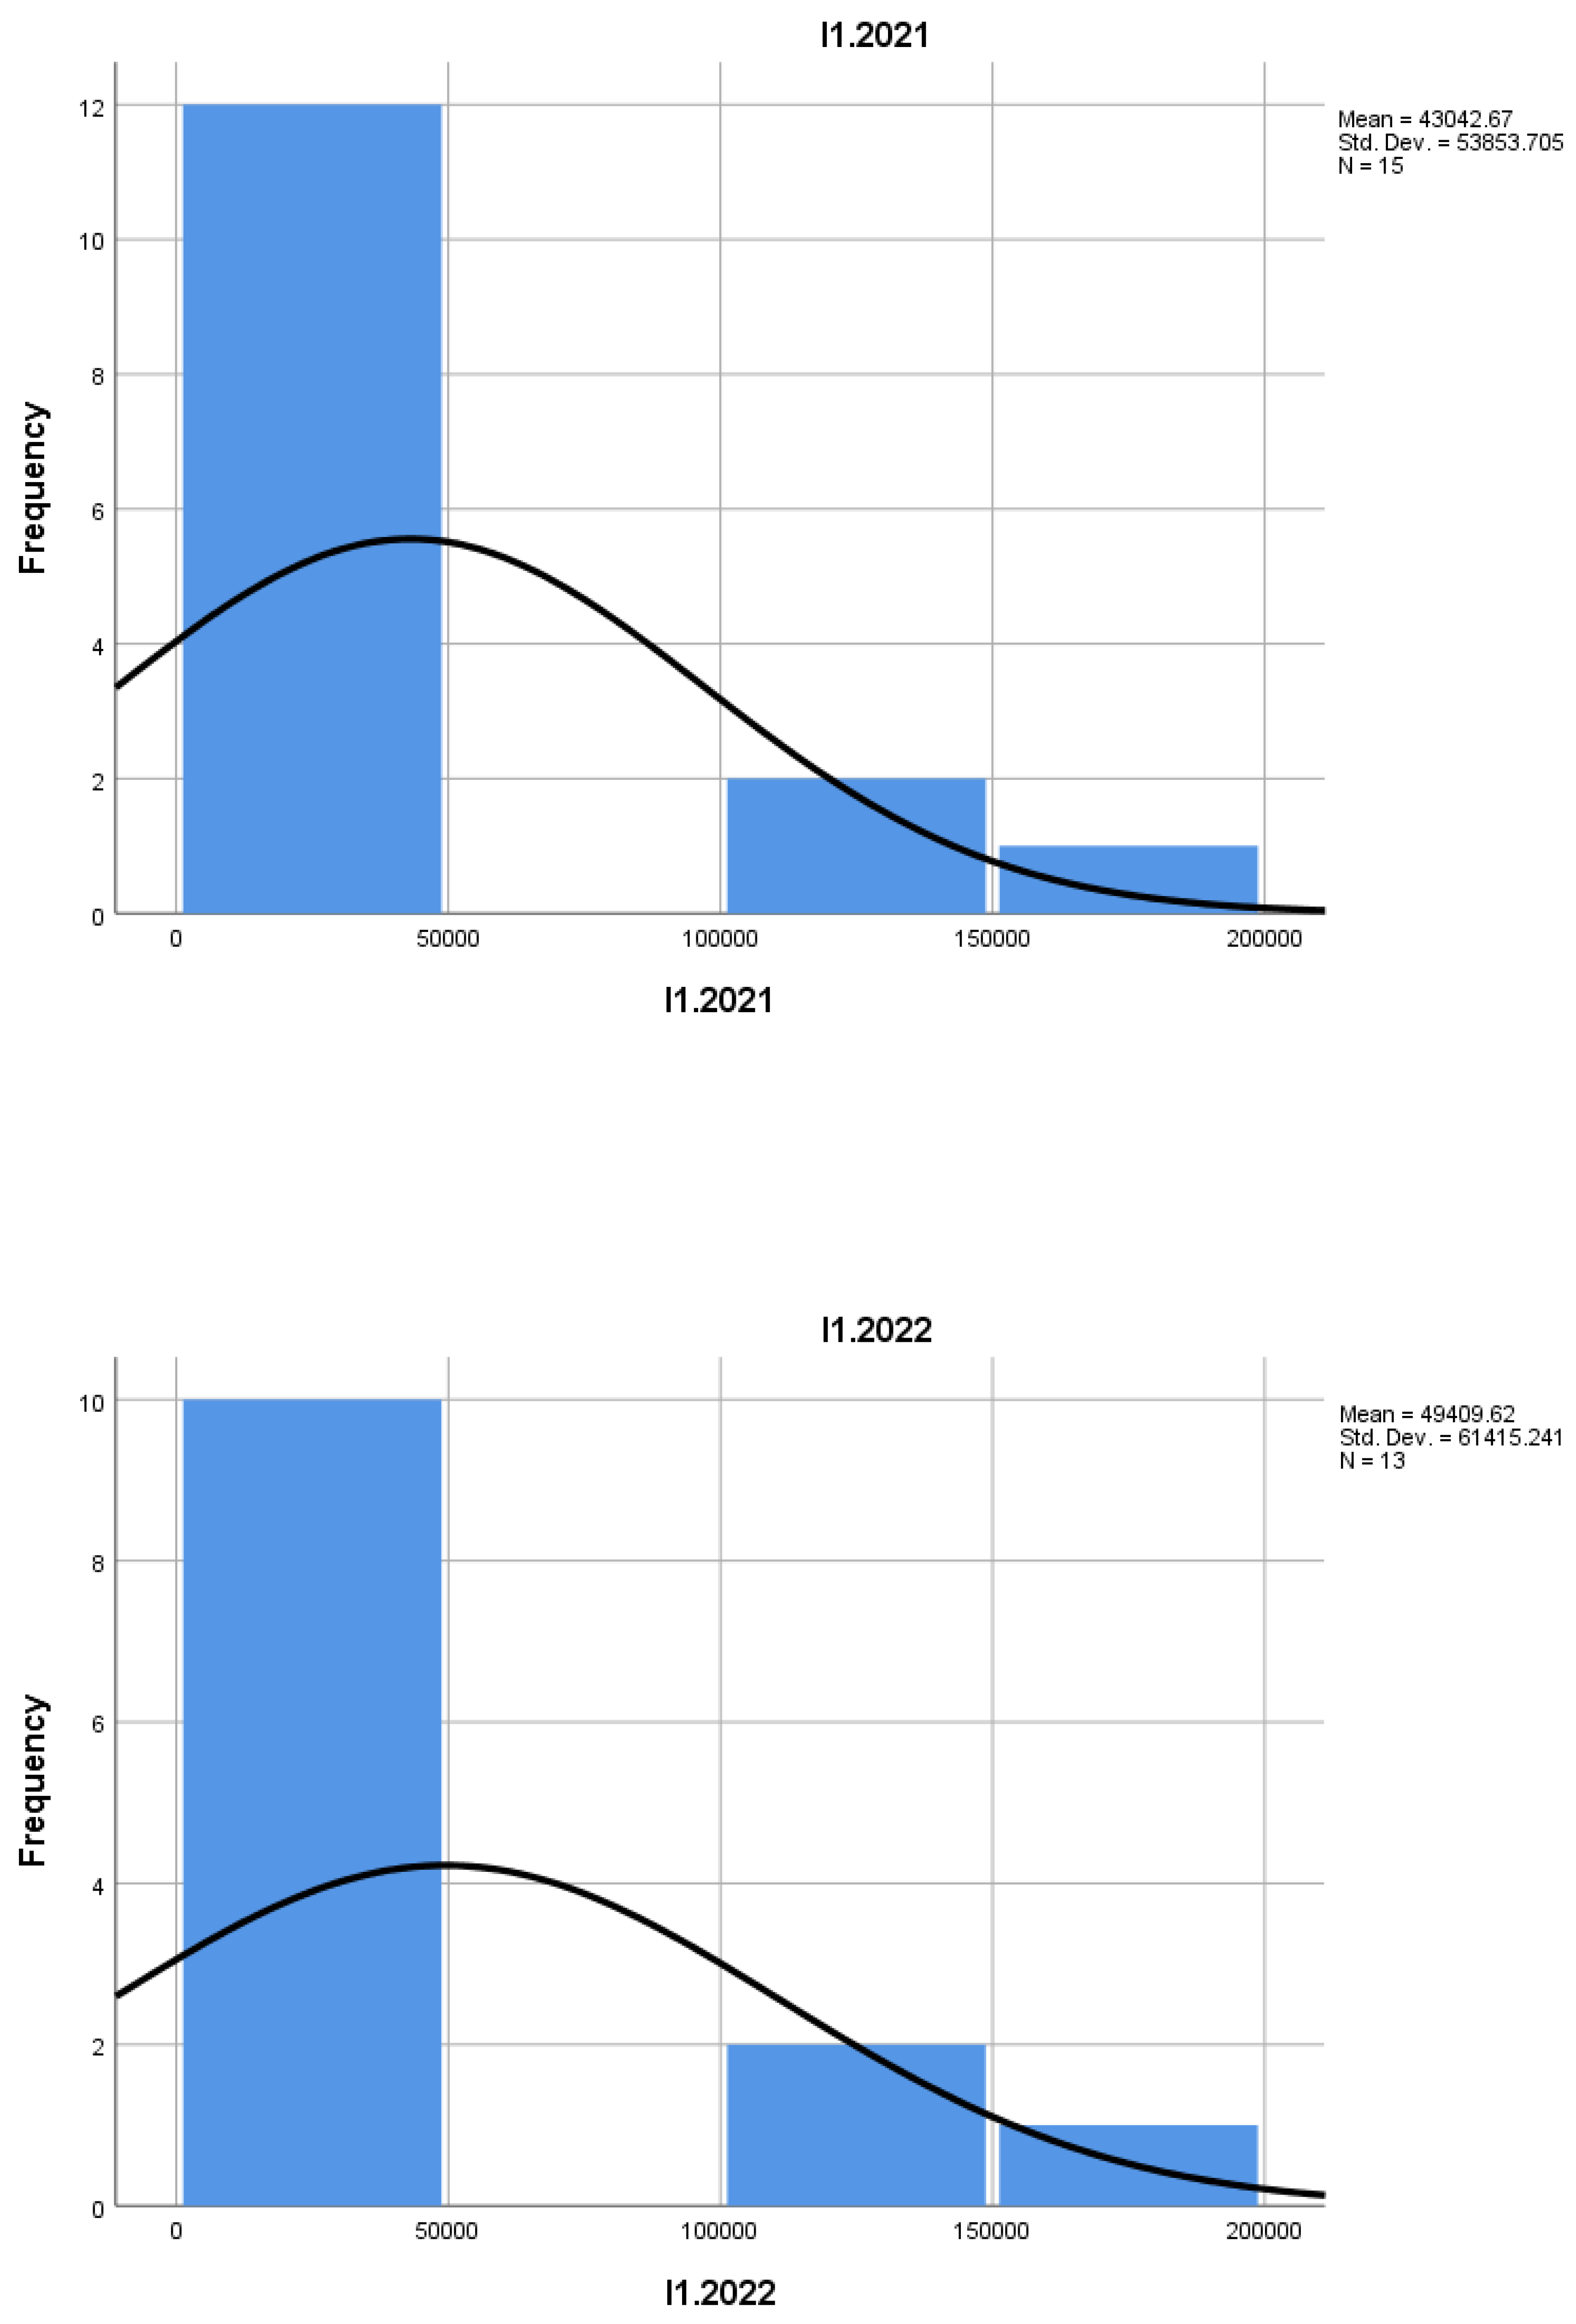
The mean represents the central value of each indicator, while the standard error of the mean reflects the variability of this value. For example, for indicator I1, the mean for the first quarter of 2021 was 43,042.67, with a standard error of 13,904.97. This indicates a relatively large fluctuation in the number of mountain entrepreneurs, but also a constant increase from year to year (e.g., 49,409.62 in 2022).
The median represents the central value of an ordered dataset and is less influenced by extremes than the mean. For example, in the detailed analyses for 2021, the medians were 22,376 in the first quarter and 25,226 in 2022, indicating a steady increase in the central value.
| I1.2021 | I1.2022 | I2.2021 | I2.2022 | I3.2021 | I3.2022 | I4.2021 | I4.2022 | I5.2021 | I5.2022 | I6.2021 | I6.2022 | I7.2021 | |
| N Valid | 15 | 13 | 15 | 12 | 12 | 10 | 13 | 12 | 13 | 12 | 11 | 11 | 14 |
| N Missing | 0 | 2 | 0 | 3 | 3 | 5 | 2 | 3 | 2 | 3 | 4 | 4 | 1 |
| Mean | 43042.67 | 49409.62 | 4604.33 | 5805.75 | 1.0708 | 0.9590 | 1.00 | 1.00 | 2548.31 | 4347.83 | 23.7264 | 23.9882 | 2791.29 |
| Std. Error of Mean | 13904.967 | 17033.523 | 1609.405 | 2119.177 | 0.08063 | 0.06392 | 0.000 | 0.000 | 823.364 | 1632.644 | 10.08098 | 9.69053 | 980.475 |
| Median | 22376.00 | 25226.00 | 2027.00 | 2285.00 | 1.0650 | 1.0350 | 1.00 | 1.00 | 1498.00 | 1892.00 | 10.2000 | 10.3700 | 1455.50 |
| Mode | 1802a | 1525a | 125a | 135a | 1.06 | .57a | 1 | 1 | 86a | 71a | 1.03a | .94a | 87a |
| Std. Deviation | 53853.705 | 61415.241 | 6233.197 | 7341.044 | 0.27930 | 0.20212 | 0.000 | 0.000 | 2968.682 | 5655.646 | 33.43482 | 32.13984 | 3668.601 |
| Skewness | 1.941 | 1.689 | 1.961 | 1.539 | 1.039 | -1.019 | 2.200 | 1.813 | 2.390 | 2.269 | 2.294 | ||
| Std. Error of Skewness | 0.580 | 0.616 | 0.580 | 0.637 | 0.637 | 0.687 | 0.616 | 0.637 | 0.616 | 0.637 | 0.661 | 0.661 | 0.597 |
| Kurtosis | 3.021 | 1.891 | 2.697 | 0.895 | 3.628 | -0.158 | 4.384 | 2.556 | 5.823 | 5.263 | 5.470 | ||
| Std. Error of Kurtosis | 1.121 | 1.191 | 1.121 | 1.232 | 1.232 | 1.334 | 1.191 | 1.232 | 1.191 | 1.232 | 1.279 | 1.279 | 1.154 |
| Range | 185592 | 197477 | 19978 | 20840 | 1.15 | 0.61 | 0 | 0 | 10469 | 18165 | 112.97 | 108.42 | 13438 |
| Minimum | 1802 | 1525 | 125 | 135 | 0.62 | 0.57 | 1 | 1 | 86 | 71 | 1.03 | 0.94 | 87 |
| Maximum | 187394 | 199002 | 20103 | 20975 | 1.77 | 1.18 | 1 | 1 | 10555 | 18236 | 114.00 | 109.36 | 13525 |
| Sum | 645640 | 642325 | 69065 | 69669 | 12.85 | 9.59 | 13 | 12 | 33128 | 52174 | 260.99 | 263.87 | 39078 |
| Percentile 25 | 14363.00 | 12646.50 | 1358.00 | 1725.00 | 0.9675 | 0.7675 | 1.00 | 1.00 | 1324.50 | 1184.75 | 5.8300 | 5.9900 | 966.00 |
| Percentile 50 | 22376.00 | 25226.00 | 2027.00 | 2285.00 | 1.0650 | 1.0350 | 1.00 | 1.00 | 1498.00 | 1892.00 | 10.2000 | 10.3700 | 1455.50 |
| Percentile 75 | 34569.00 | 74495.00 | 2911.00 | 9739.50 | 1.1550 | 1.1125 | 1.00 | 1.00 | 2216.00 | 6686.50 | 22.3000 | 22.0700 | 3369.00 |
| a. Multiple modes exist. The smallest value is shown | |||||||||||||
| I7.2022 | I8.2021 | I8.2022 | I10.2021 | I10.2022 | I12.2021 | I12.2022 | I13.2021 | I13.2022 | I14.2021 | I14.2022 | I15.2022 | I16.2021 | I16.2022 | |
| N Valid | 12 | 14 | 12 | 13 | 10 | 13 | 12 | 15 | 12 | 13 | 12 | 13 | 13 | 13 |
| N Missing | 3 | 1 | 3 | 2 | 5 | 2 | 3 | 0 | 3 | 2 | 3 | 2 | 2 | 2 |
| Mean | 3260.08 | 6.5007 | 6.8725 | 25.15 | 29.10 | 18.4062 | 20.4367 | 10.2233 | 11.7475 | 8.0254 | 8.6883 | 3.7915 | 81754.62 | 93094.08 |
| Std. Error of Mean | 1185.642 | 0.57889 | 0.63499 | 8.310 | 14.774 | 1.36704 | 1.57506 | 0.74165 | 0.82342 | 0.64837 | 0.96058 | 1.89429 | 33829.917 | 35576.251 |
| Median | 1518.50 | 6.9300 | 7.3200 | 16.00 | 10.00 | 18.8700 | 19.6650 | 10.7300 | 12.1500 | 7.7300 | 7.7900 | 5.2600 | 31689.00 | 40412.00 |
| Mode | 69a | 2.83a | 7.32 | 6 | 8 | 11.71a | 13.51a | 6.94a | 8.27a | 7.73 | 4.66a | -15.37a | 2947a | 3043a |
| Std. Deviation | 4107.184 | 2.16599 | 2.19968 | 29.963 | 46.720 | 4.92895 | 5.45617 | 2.87241 | 2.85240 | 2.33772 | 3.32755 | 6.82998 | 121975.502 | 128271.998 |
| Skewness | 1.789 | -0.410 | -0.652 | 2.308 | 2.829 | 0.623 | 0.202 | 0.891 | 0.348 | 1.277 | 1.206 | -1.937 | 2.184 | 2.018 |
| Std. Error of Skewness | 0.637 | 0.597 | 0.637 | 0.616 | 0.687 | 0.616 | 0.637 | 0.580 | 0.637 | 0.616 | 0.637 | 0.616 | 0.616 | 0.616 |
| Kurtosis | 2.665 | -0.803 | -0.092 | 6.044 | 8.375 | -0.213 | -1.325 | 1.190 | -0.914 | 2.793 | 1.811 | 5.364 | 3.918 | 3.372 |
| Std. Error of Kurtosis | 1.232 | 1.154 | 1.232 | 1.191 | 1.334 | 1.191 | 1.232 | 1.121 | 1.232 | 1.191 | 1.232 | 1.191 | 1.191 | 1.191 |
| Range | 13427 | 6.73 | 7.53 | 110 | 155 | 16.02 | 15.08 | 10.42 | 8.49 | 9.21 | 11.98 | 28.85 | 398533 | 421038 |
| Minimum | 69 | 2.83 | 2.41 | 2 | 3 | 11.71 | 13.51 | 6.94 | 8.27 | 4.77 | 4.66 | -15.37 | 2947 | 3043 |
| Maximum | 13496 | 9.56 | 9.94 | 112 | 158 | 27.73 | 28.59 | 17.36 | 16.76 | 13.98 | 16.64 | 13.48 | 401480 | 424081 |
| Sum | 39121 | 91.01 | 82.47 | 327 | 291 | 239.28 | 245.24 | 153.35 | 140.97 | 104.33 | 104.26 | 49.29 | 1062810 | 1210223 |
| Percentile 25 | 831.50 | 4.7475 | 4.9000 | 6.00 | 7.25 | 14.2600 | 14.6100 | 7.5300 | 8.7975 | 6.5050 | 5.9550 | 3.1650 | 19002.00 | 19616.00 |
| Percentile 50 | 1518.50 | 6.9300 | 7.3200 | 16.00 | 10.00 | 18.8700 | 19.6650 | 10.7300 | 12.1500 | 7.7300 | 7.7900 | 5.2600 | 31689.00 | 40412.00 |
| Percentile 75 | 5533.00 | 8.2850 | 8.8100 | 33.00 | 30.00 | 20.6350 | 26.1700 | 11.9500 | 13.8425 | 8.8400 | 10.7750 | 6.1150 | 75367.50 | 109095.00 |
| a. Multiple modes exist. The smallest value is shown | ||||||||||||||
| I17.2021 | I17.2022 | I18.2021 | I18.2022 | I19.2021 | I19.2022 | I20.2021 | I20.2022 | I21.2021 | I21.2022 | I22.2021 | I22.2022 | I23.2021 | I23.2022 | |||||||||||
| N Valid | 12 | 10 | 11 | 10 | 10 | 10 | 11 | 12 | 12 | 12 | 9 | 10 | 11 | 12 | ||||||||||
| N Missing | 3 | 5 | 4 | 5 | 5 | 5 | 4 | 3 | 3 | 3 | 6 | 5 | 4 | 3 | ||||||||||
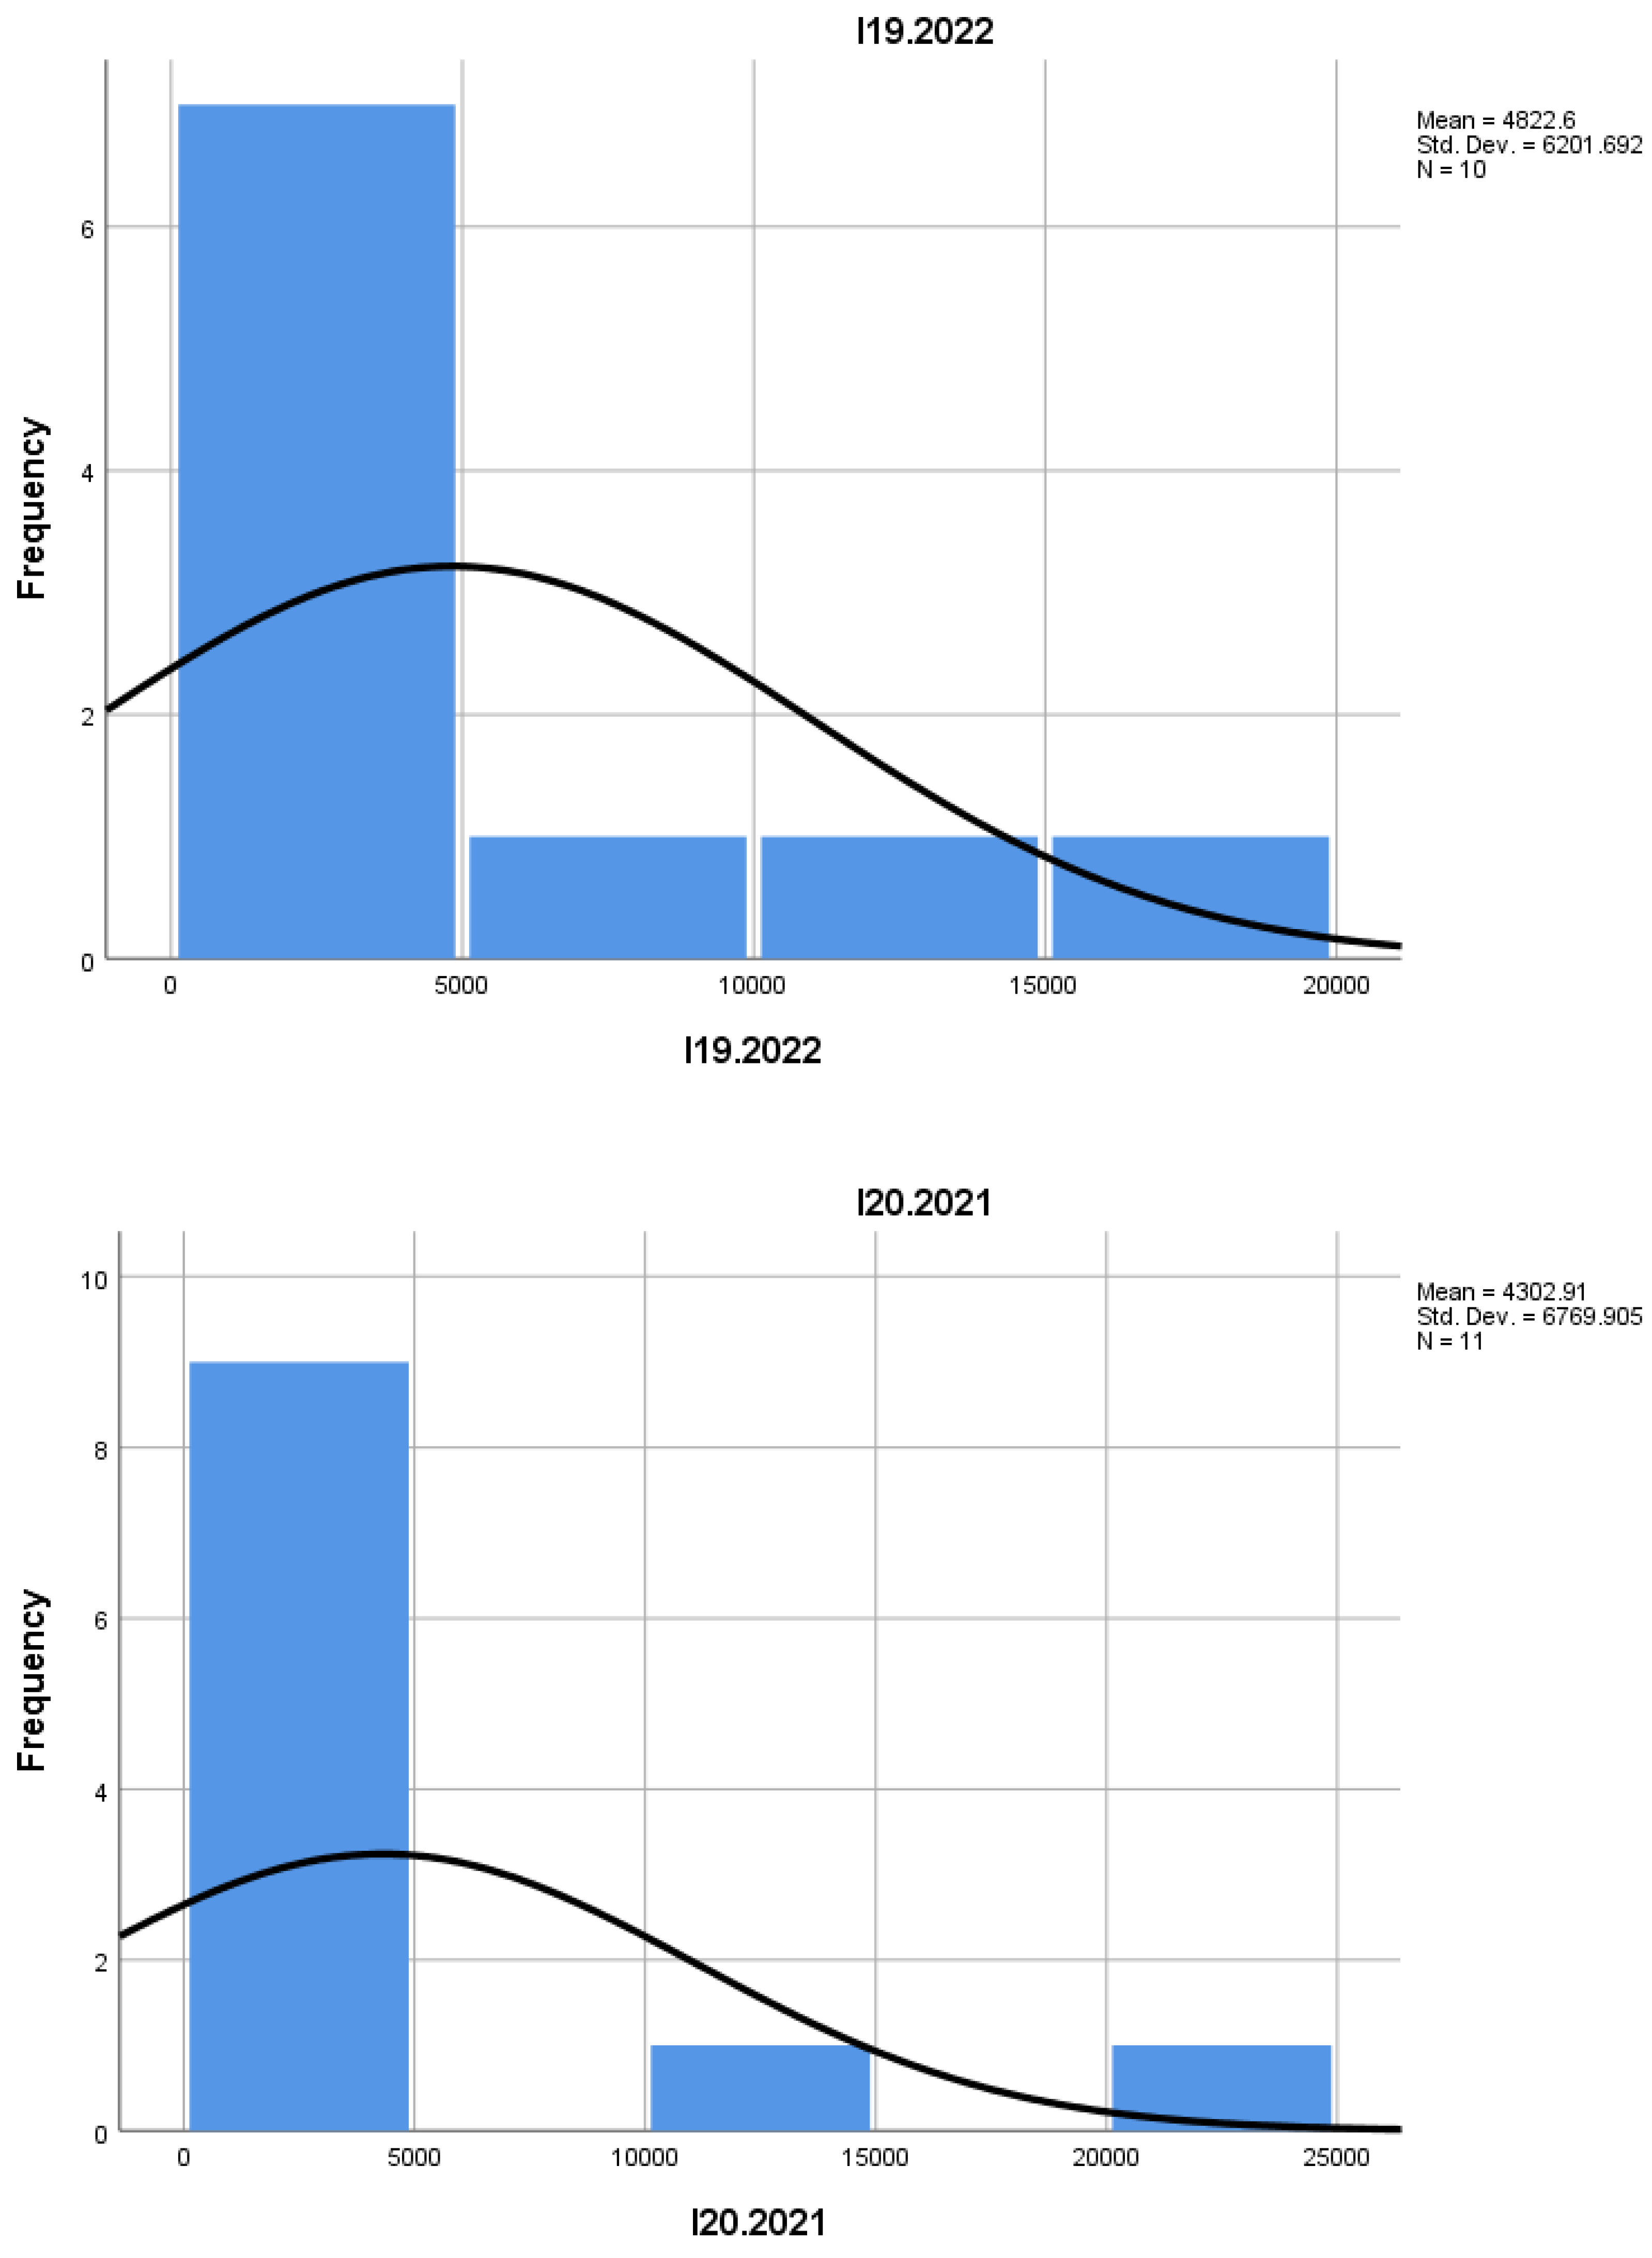
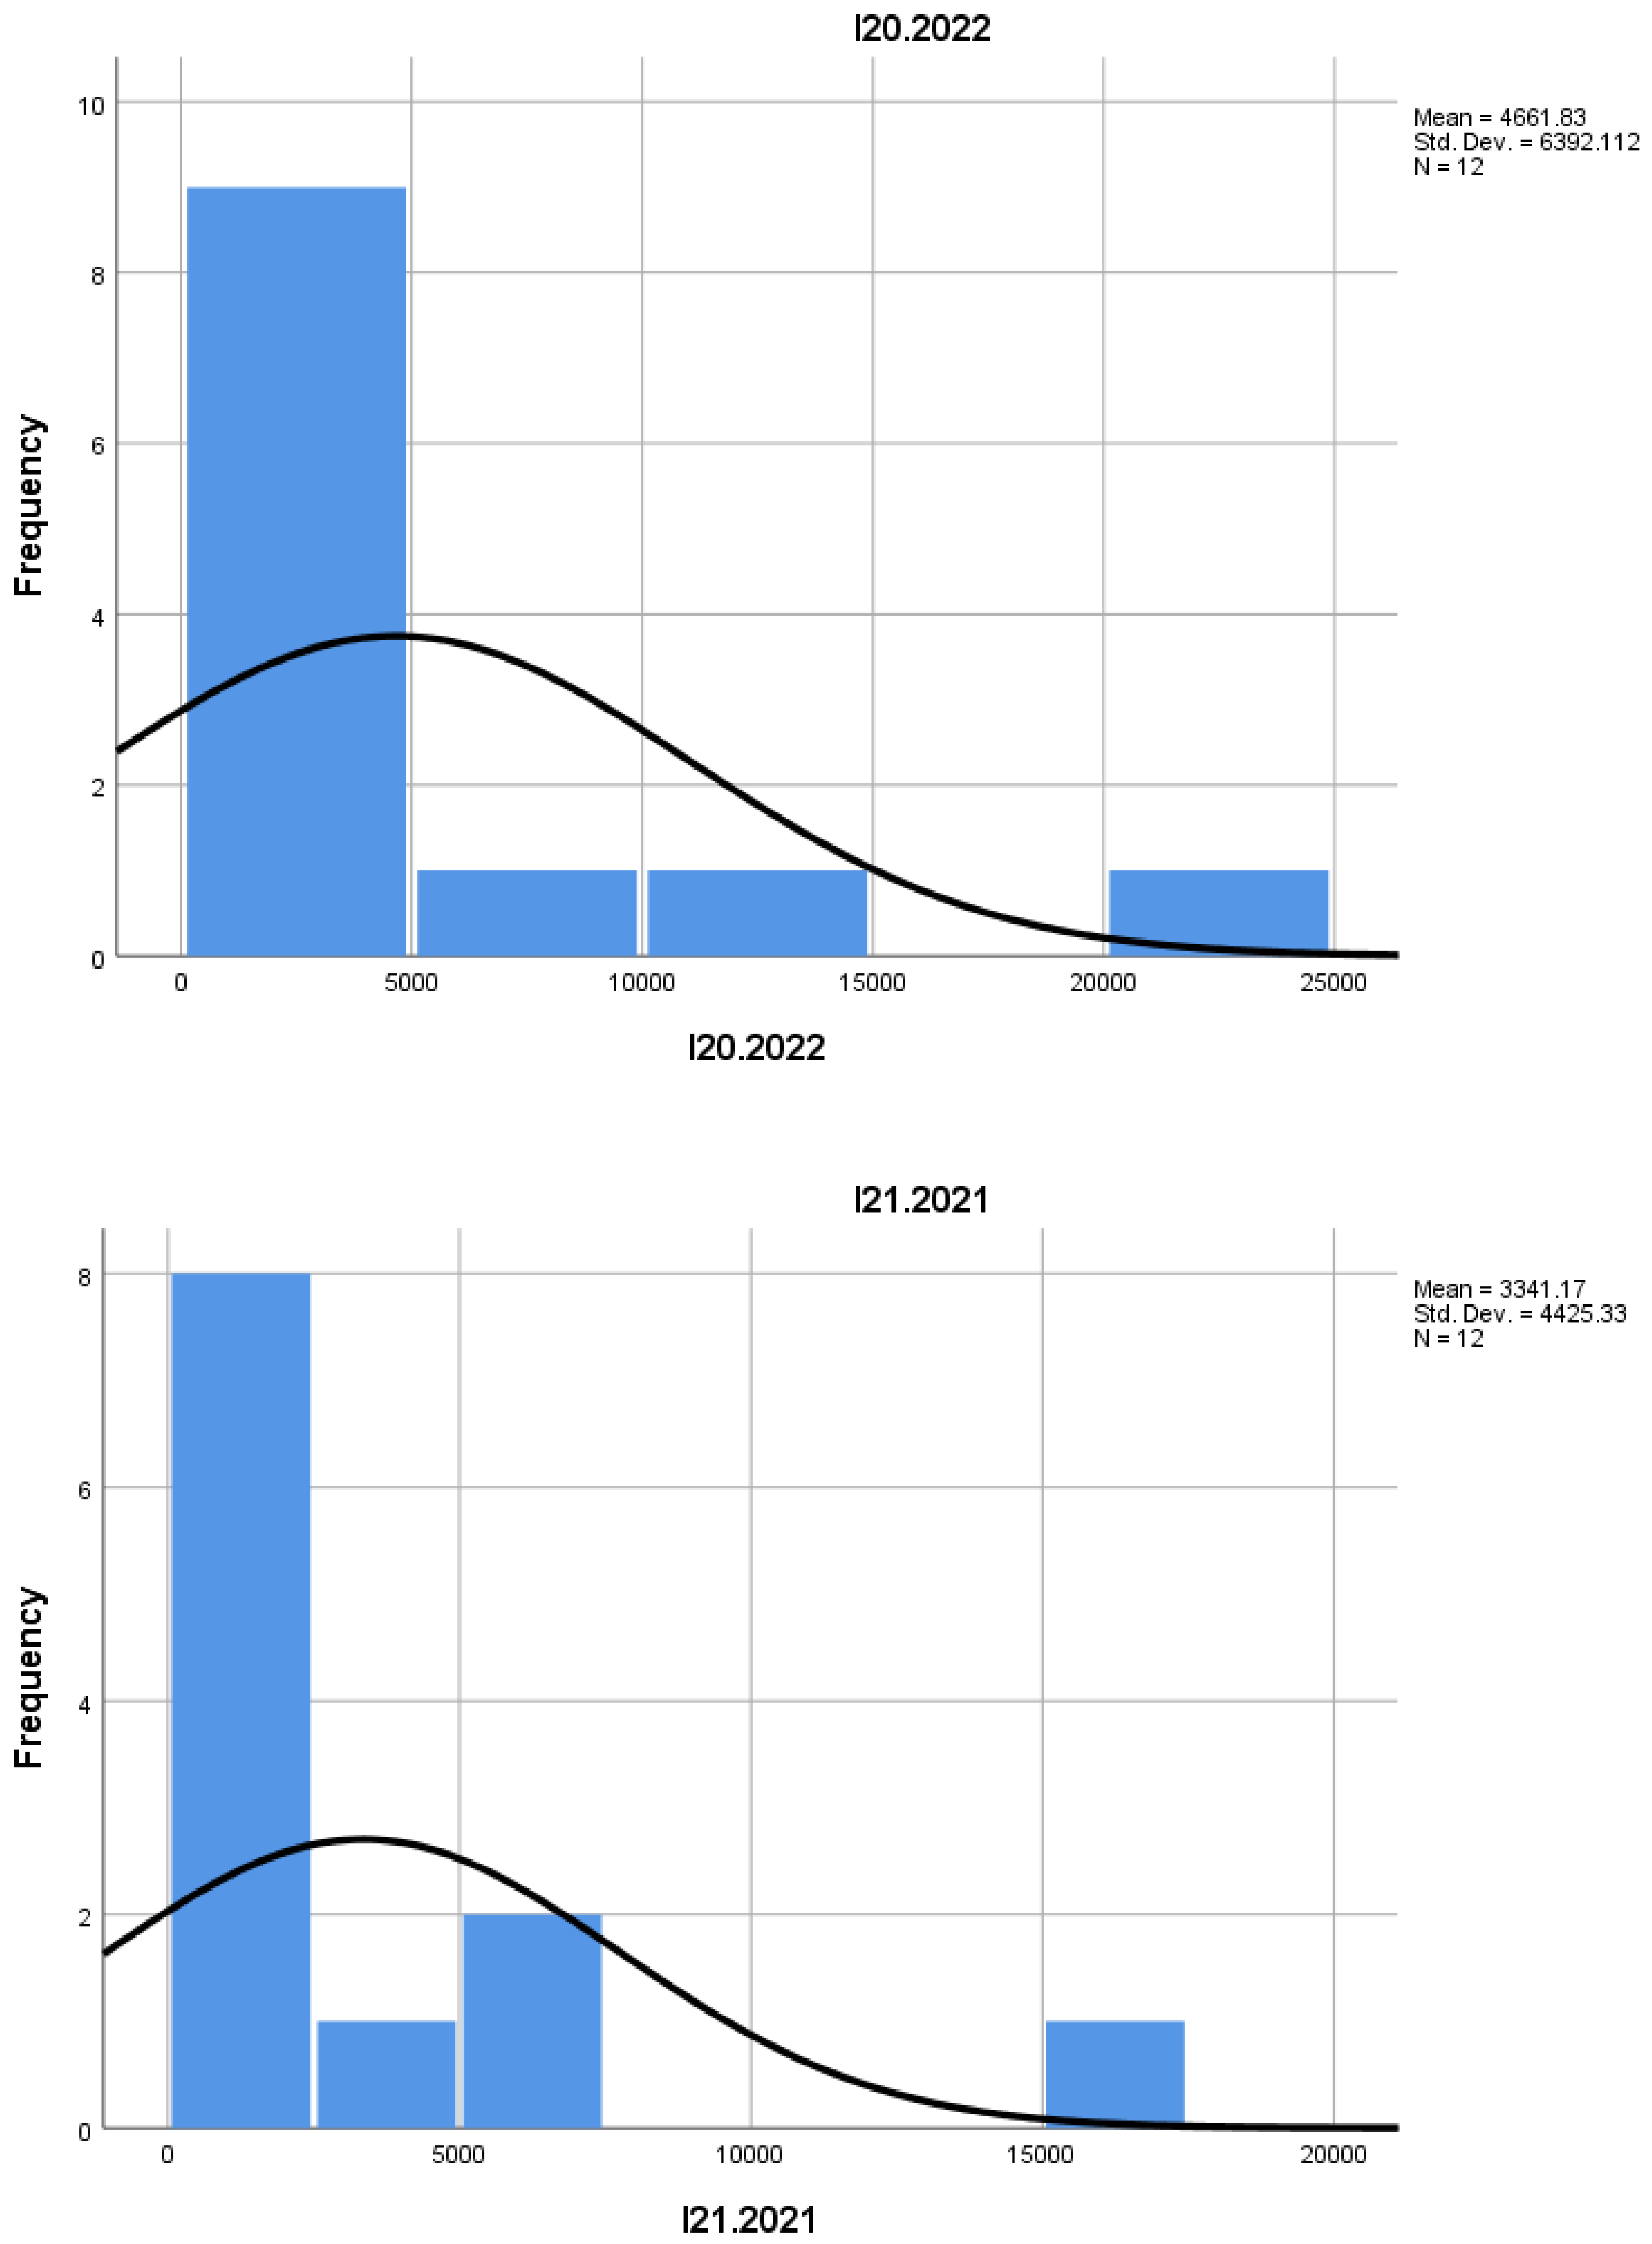
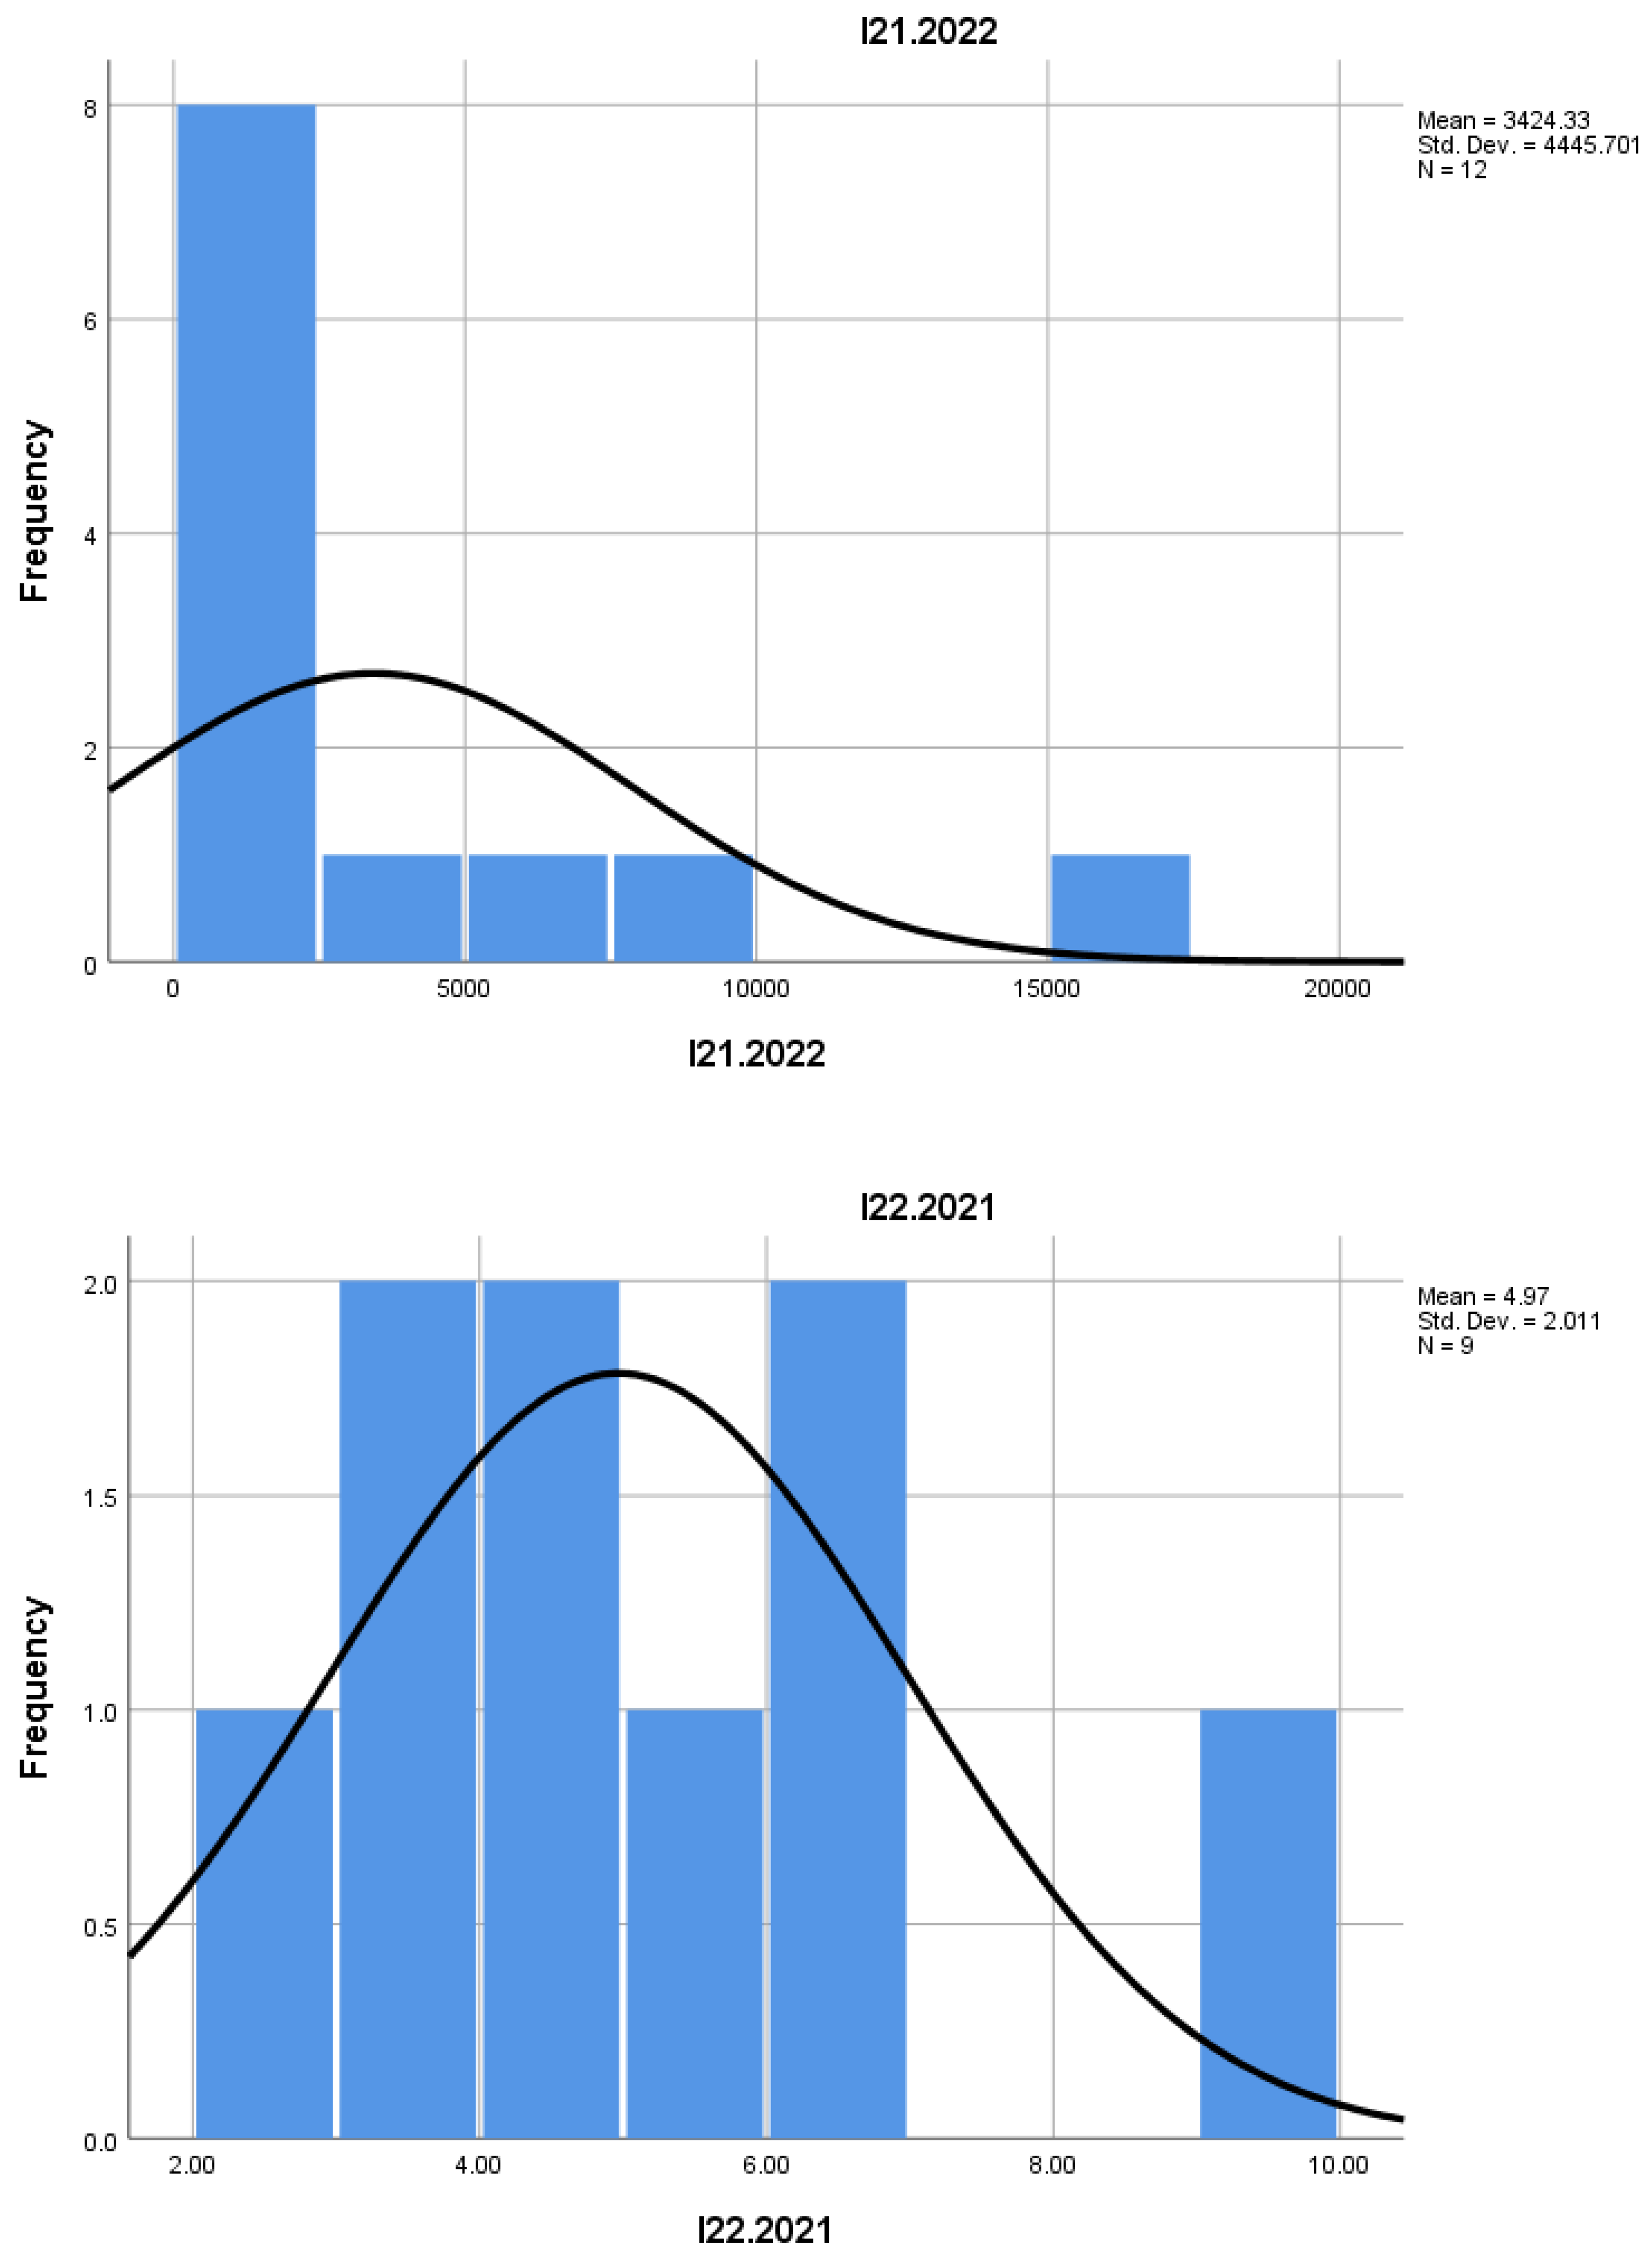
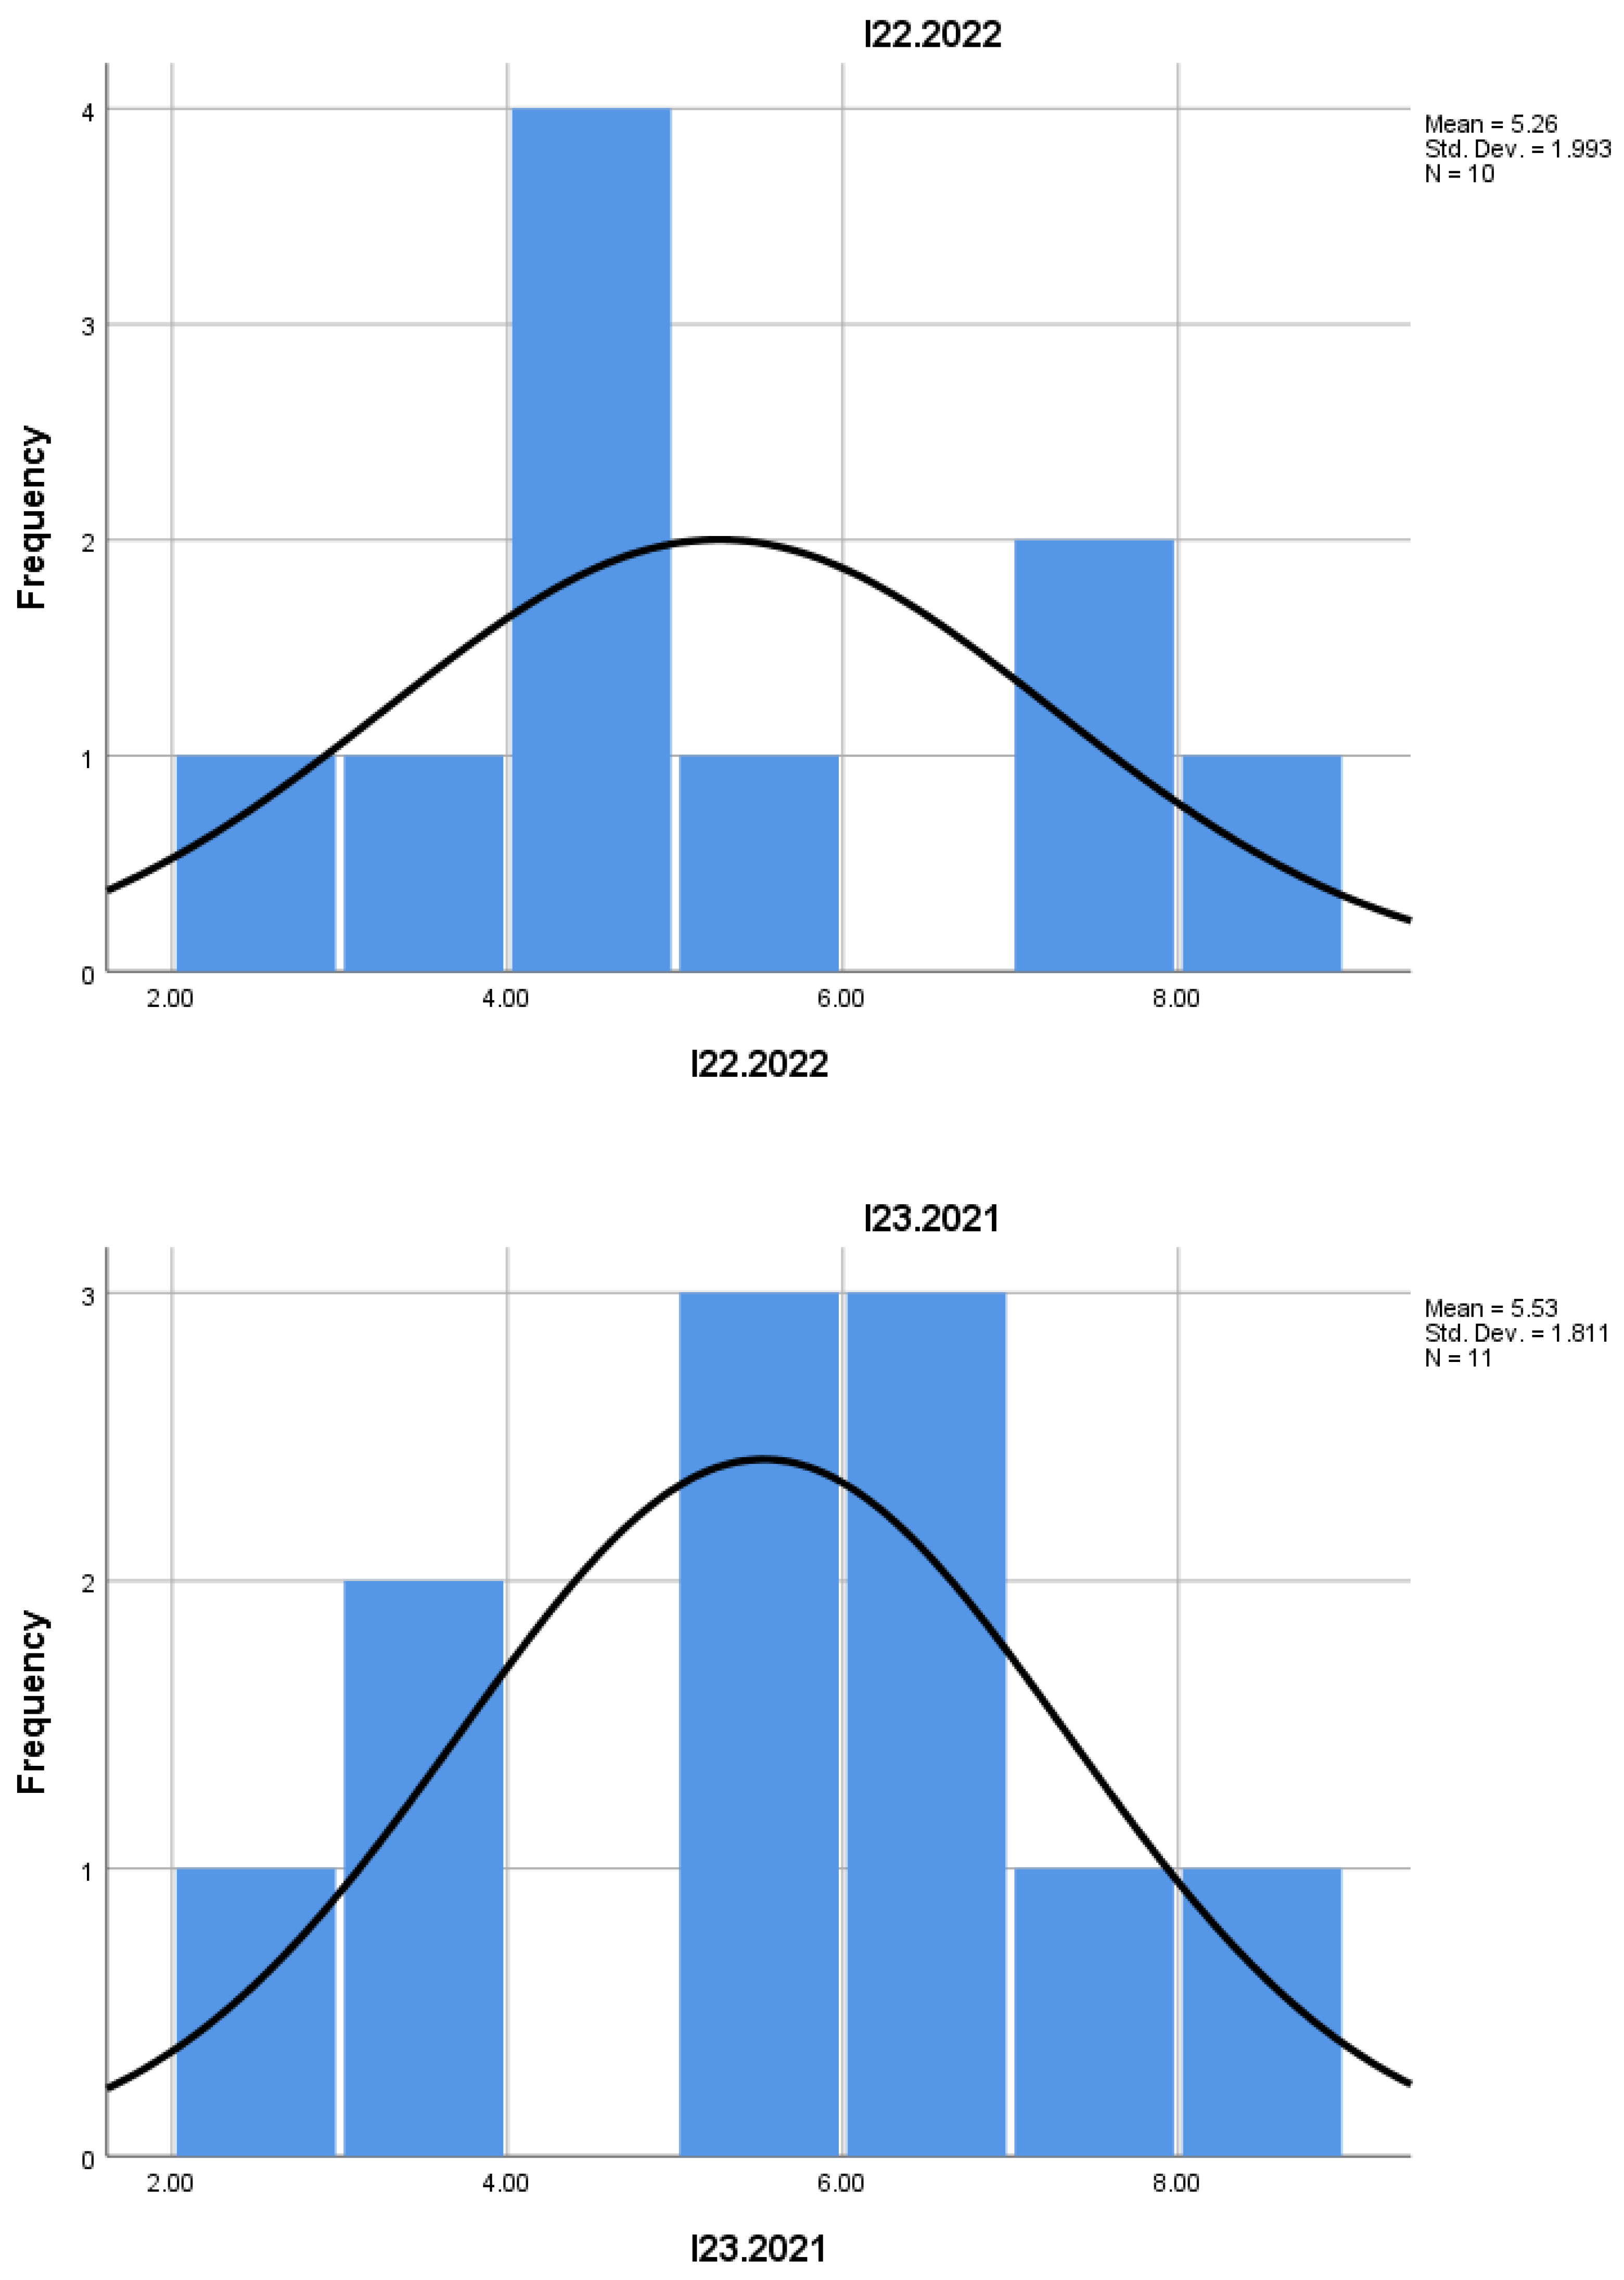
| Mean | 5073.92 | 5700.00 | 6.1309 | 6.6400 | 2347.40 | 4822.60 | 4302.91 | 4661.83 | 3341.17 | 3424.33 | 4.9667 | 5.2620 | 5.5255 | 5.4617 | ||||||||||
| Std. Error of Mean | 1793.330 | 2152.330 | 0.53490 | 0.71990 | 800.817 | 1961.147 | 2041.203 | 1845.244 | 1277.483 | 1283.363 | 0.67023 | 0.63035 | 0.54612 | 0.62659 | ||||||||||
| Median | 2616.50 | 2428.00 | 5.4400 | 6.1450 | 1699.50 | 1986.50 | 1722.00 | 1742.00 | 1734.00 | 1524.50 | 4.1800 | 4.8000 | 5.6700 | 5.3650 | ||||||||||
| Mode | 119a | 106a | 3.61a | 3.48a | 83a | 64a | 90a | 65a | 89a | 68a | 2.82a | 2.10a | 2.48a | 2.14a | ||||||||||
| Std. Deviation | 6212.277 | 6806.266 | 1.77408 | 2.27654 | 2532.406 | 6201.692 | 6769.905 | 6392.112 | 4425.330 | 4445.701 | 2.01068 | 1.99335 | 1.81126 | 2.17055 | ||||||||||
| Skewness | 1.916 | 1.501 | 0.318 | 0.146 | 2.227 | 1.868 | 2.473 | 2.229 | 2.328 | 2.202 | 0.981 | 0.310 | -0.485 | -0.029 | ||||||||||
| Std. Error of Skewness | 0.637 | 0.687 | 0.661 | 0.687 | 0.687 | 0.687 | 0.661 | 0.637 | 0.637 | 0.637 | 0.717 | 0.687 | 0.661 | 0.637 | ||||||||||
| Kurtosis | 3.590 | 1.503 | -1.158 | -1.466 | 5.609 | 3.250 | 6.178 | 5.153 | 5.820 | 5.120 | 0.755 | -0.694 | -0.867 | -0.903 | ||||||||||
| Std. Error of Kurtosis | 1.232 | 1.334 | 1.279 | 1.334 | 1.334 | 1.334 | 1.279 | 1.232 | 1.232 | 1.232 | 1.400 | 1.334 | 1.279 | 1.232 | ||||||||||
| Range | 21126 | 20708 | 5.38 | 6.53 | 8799 | 19597 | 22667 | 22114 | 15622 | 15538 | 6.23 | 6.26 | 5.58 | 6.68 | ||||||||||
| Minimum | 119 | 106 | 3.61 | 3.48 | 83 | 64 | 90 | 65 | 89 | 68 | 2.82 | 2.10 | 2.48 | 2.14 | ||||||||||
| Maximum | 21245 | 20814 | 8.99 | 10.01 | 8882 | 19661 | 22757 | 22179 | 15711 | 15606 | 9.05 | 8.36 | 8.06 | 8.82 | ||||||||||
| Sum | 60887 | 57000 | 67.44 | 66.40 | 23474 | 48226 | 47332 | 55942 | 40094 | 41092 | 44.70 | 52.62 | 60.78 | 65.54 | ||||||||||
| Percentile 25 | 1356.00 | 1355.25 | 5.2900 | 4.6950 | 888.50 | 1090.50 | 1122.00 | 1188.75 | 996.25 | 1009.75 | 3.2000 | 3.9250 | 3.6300 | 3.8575 | ||||||||||
| Percentile 50 | 2616.50 | 2428.00 | 5.4400 | 6.1450 | 1699.50 | 1986.50 | 1722.00 | 1742.00 | 1734.00 | 1524.50 | 4.1800 | 4.8000 | 5.6700 | 5.3650 | ||||||||||
| Percentile 75 | 9029.75 | 11417.25 | 7.8700 | 8.9950 | 2752.75 | 7553.75 | 3245.00 | 6519.25 | 4617.25 | 5111.25 | 6.1200 | 7.5625 | 6.8300 | 7.4450 | ||||||||||
| a. Multiple modes exist. The smallest value is shown | ||||||||||||||||||||||||
| I24.2021 | I24.2022 | I25.2021 | I25.2022 | I26.2021 | I26.2022 | I27.2021 | I27.2022 | I28.2021 | I28.2022 | |||||||||||||||
| N Valid | 11 | 12 | 13 | 12 | 9 | 8 | 7 | 9 | 9 | 8 | ||||||||||||||
| N Missing | 4 | 3 | 2 | 3 | 6 | 7 | 8 | 6 | 6 | 7 | ||||||||||||||
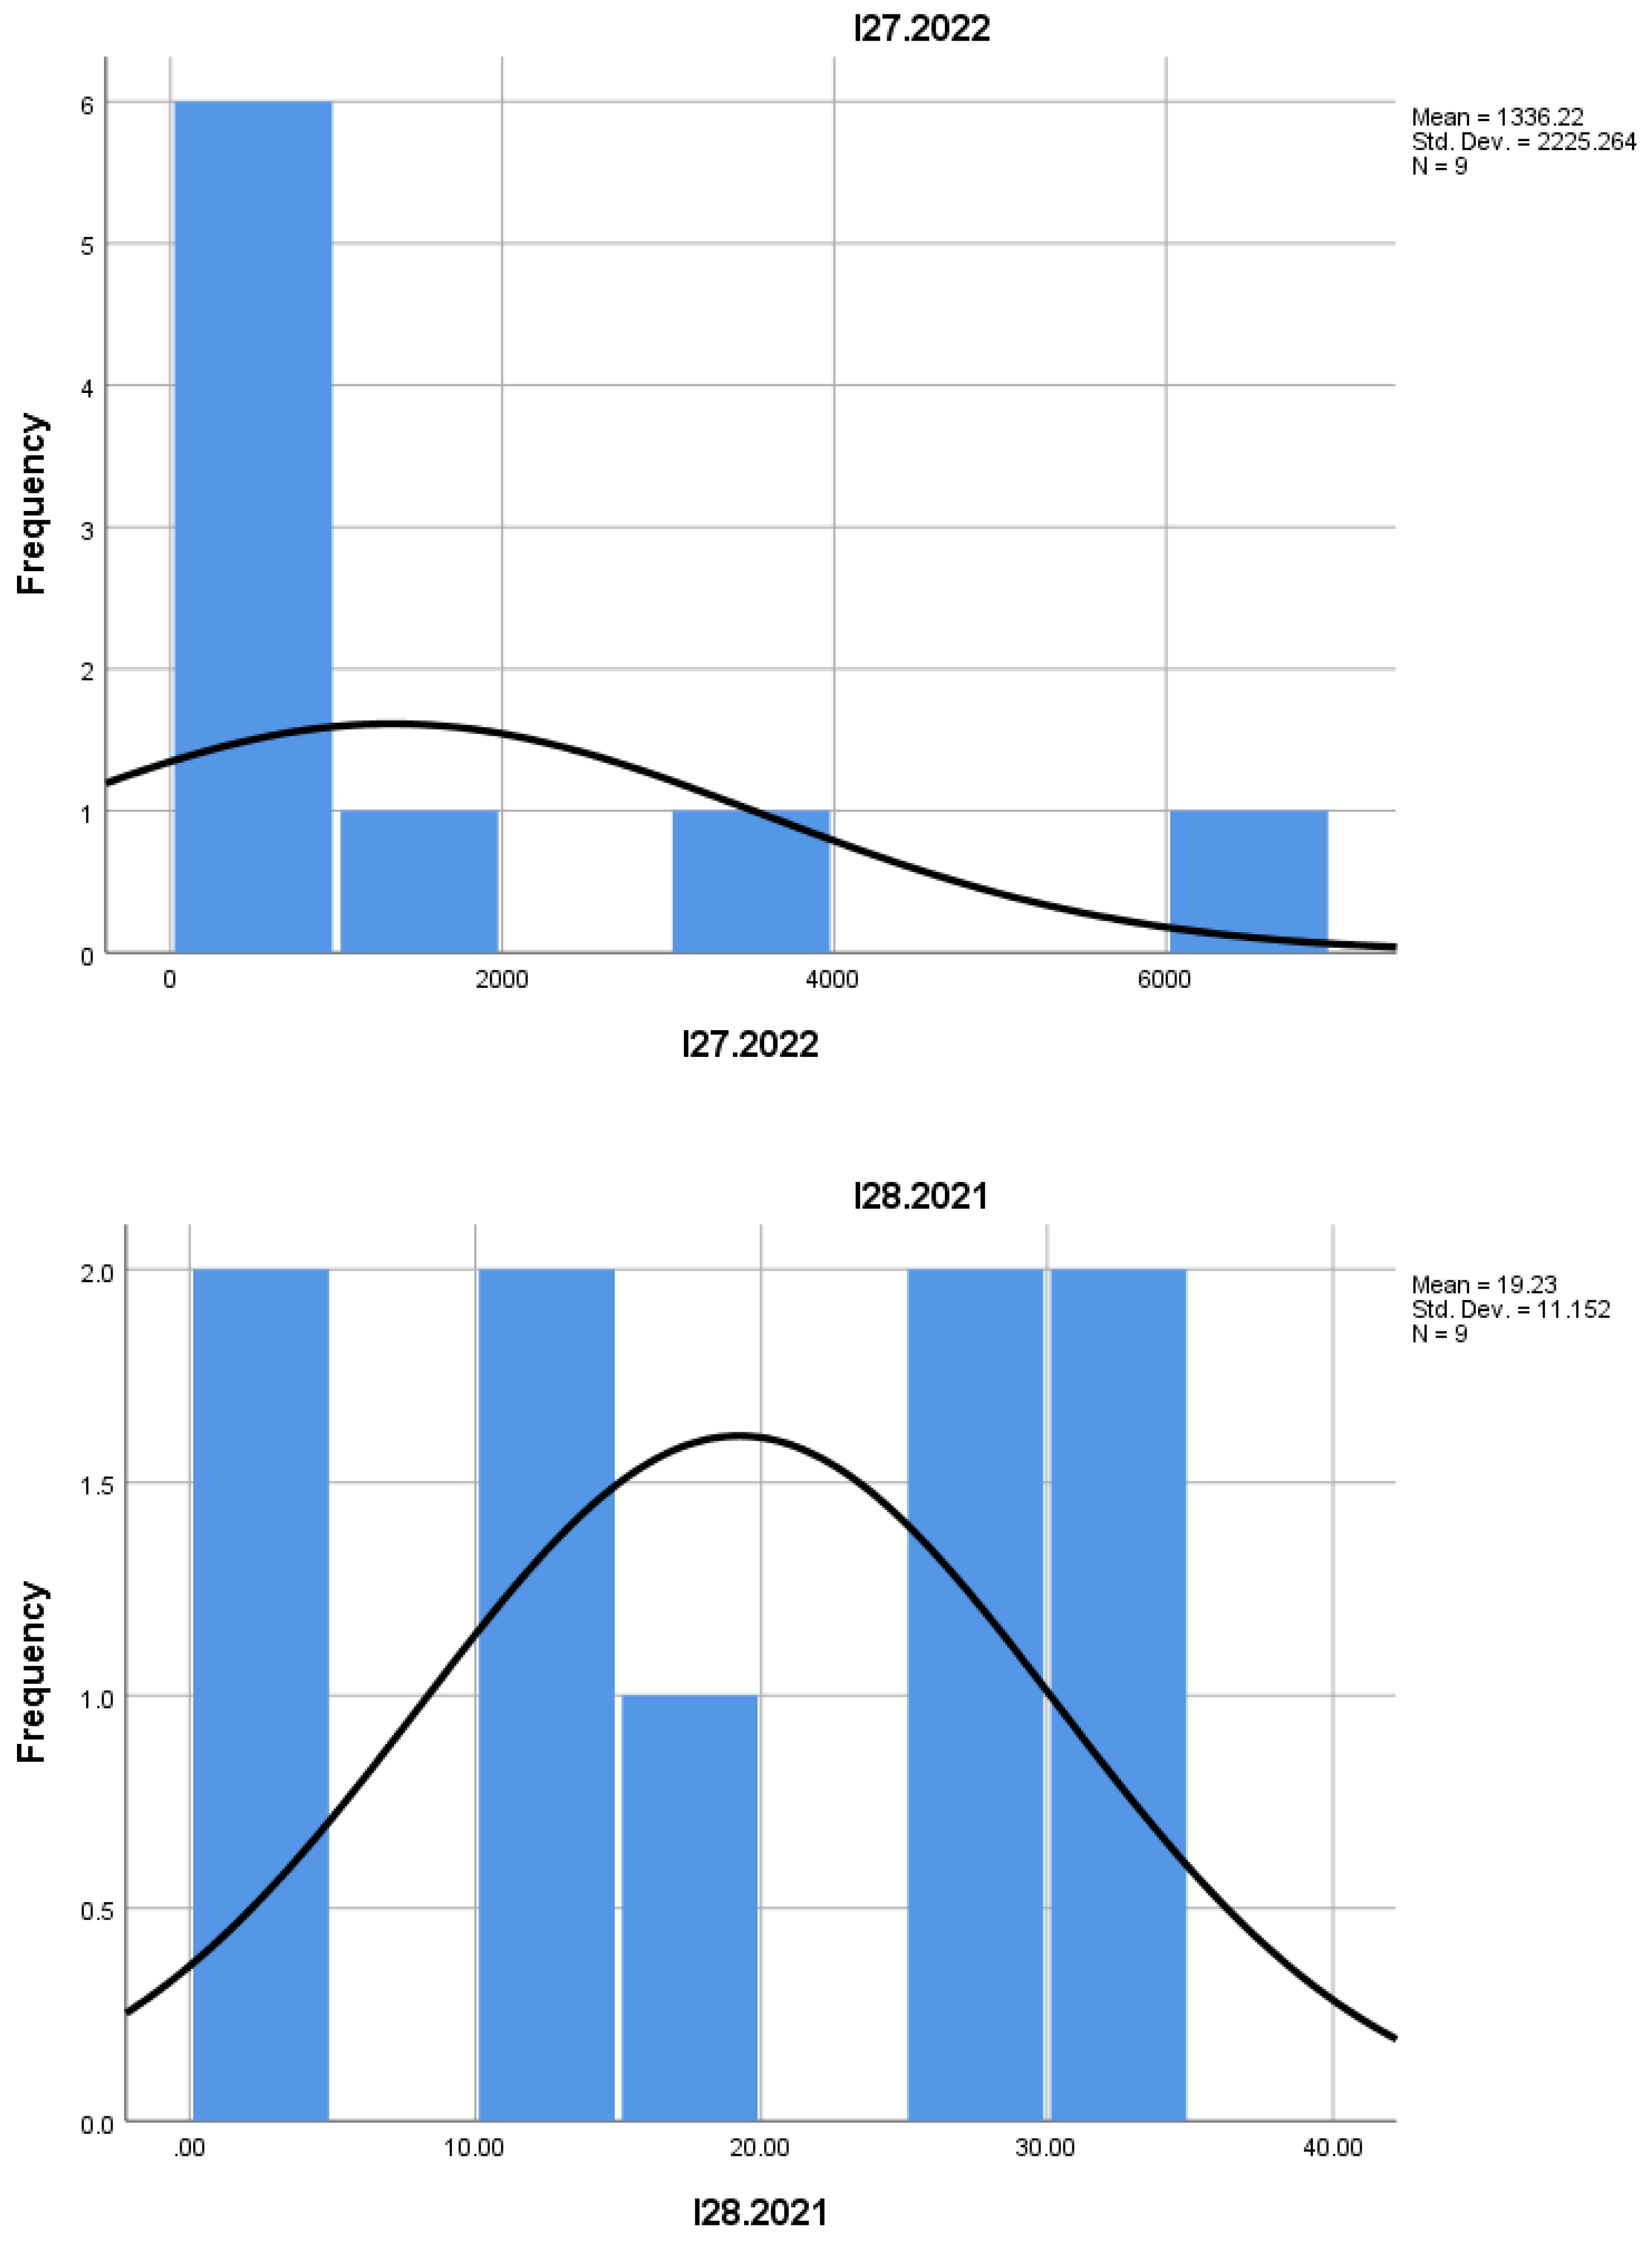
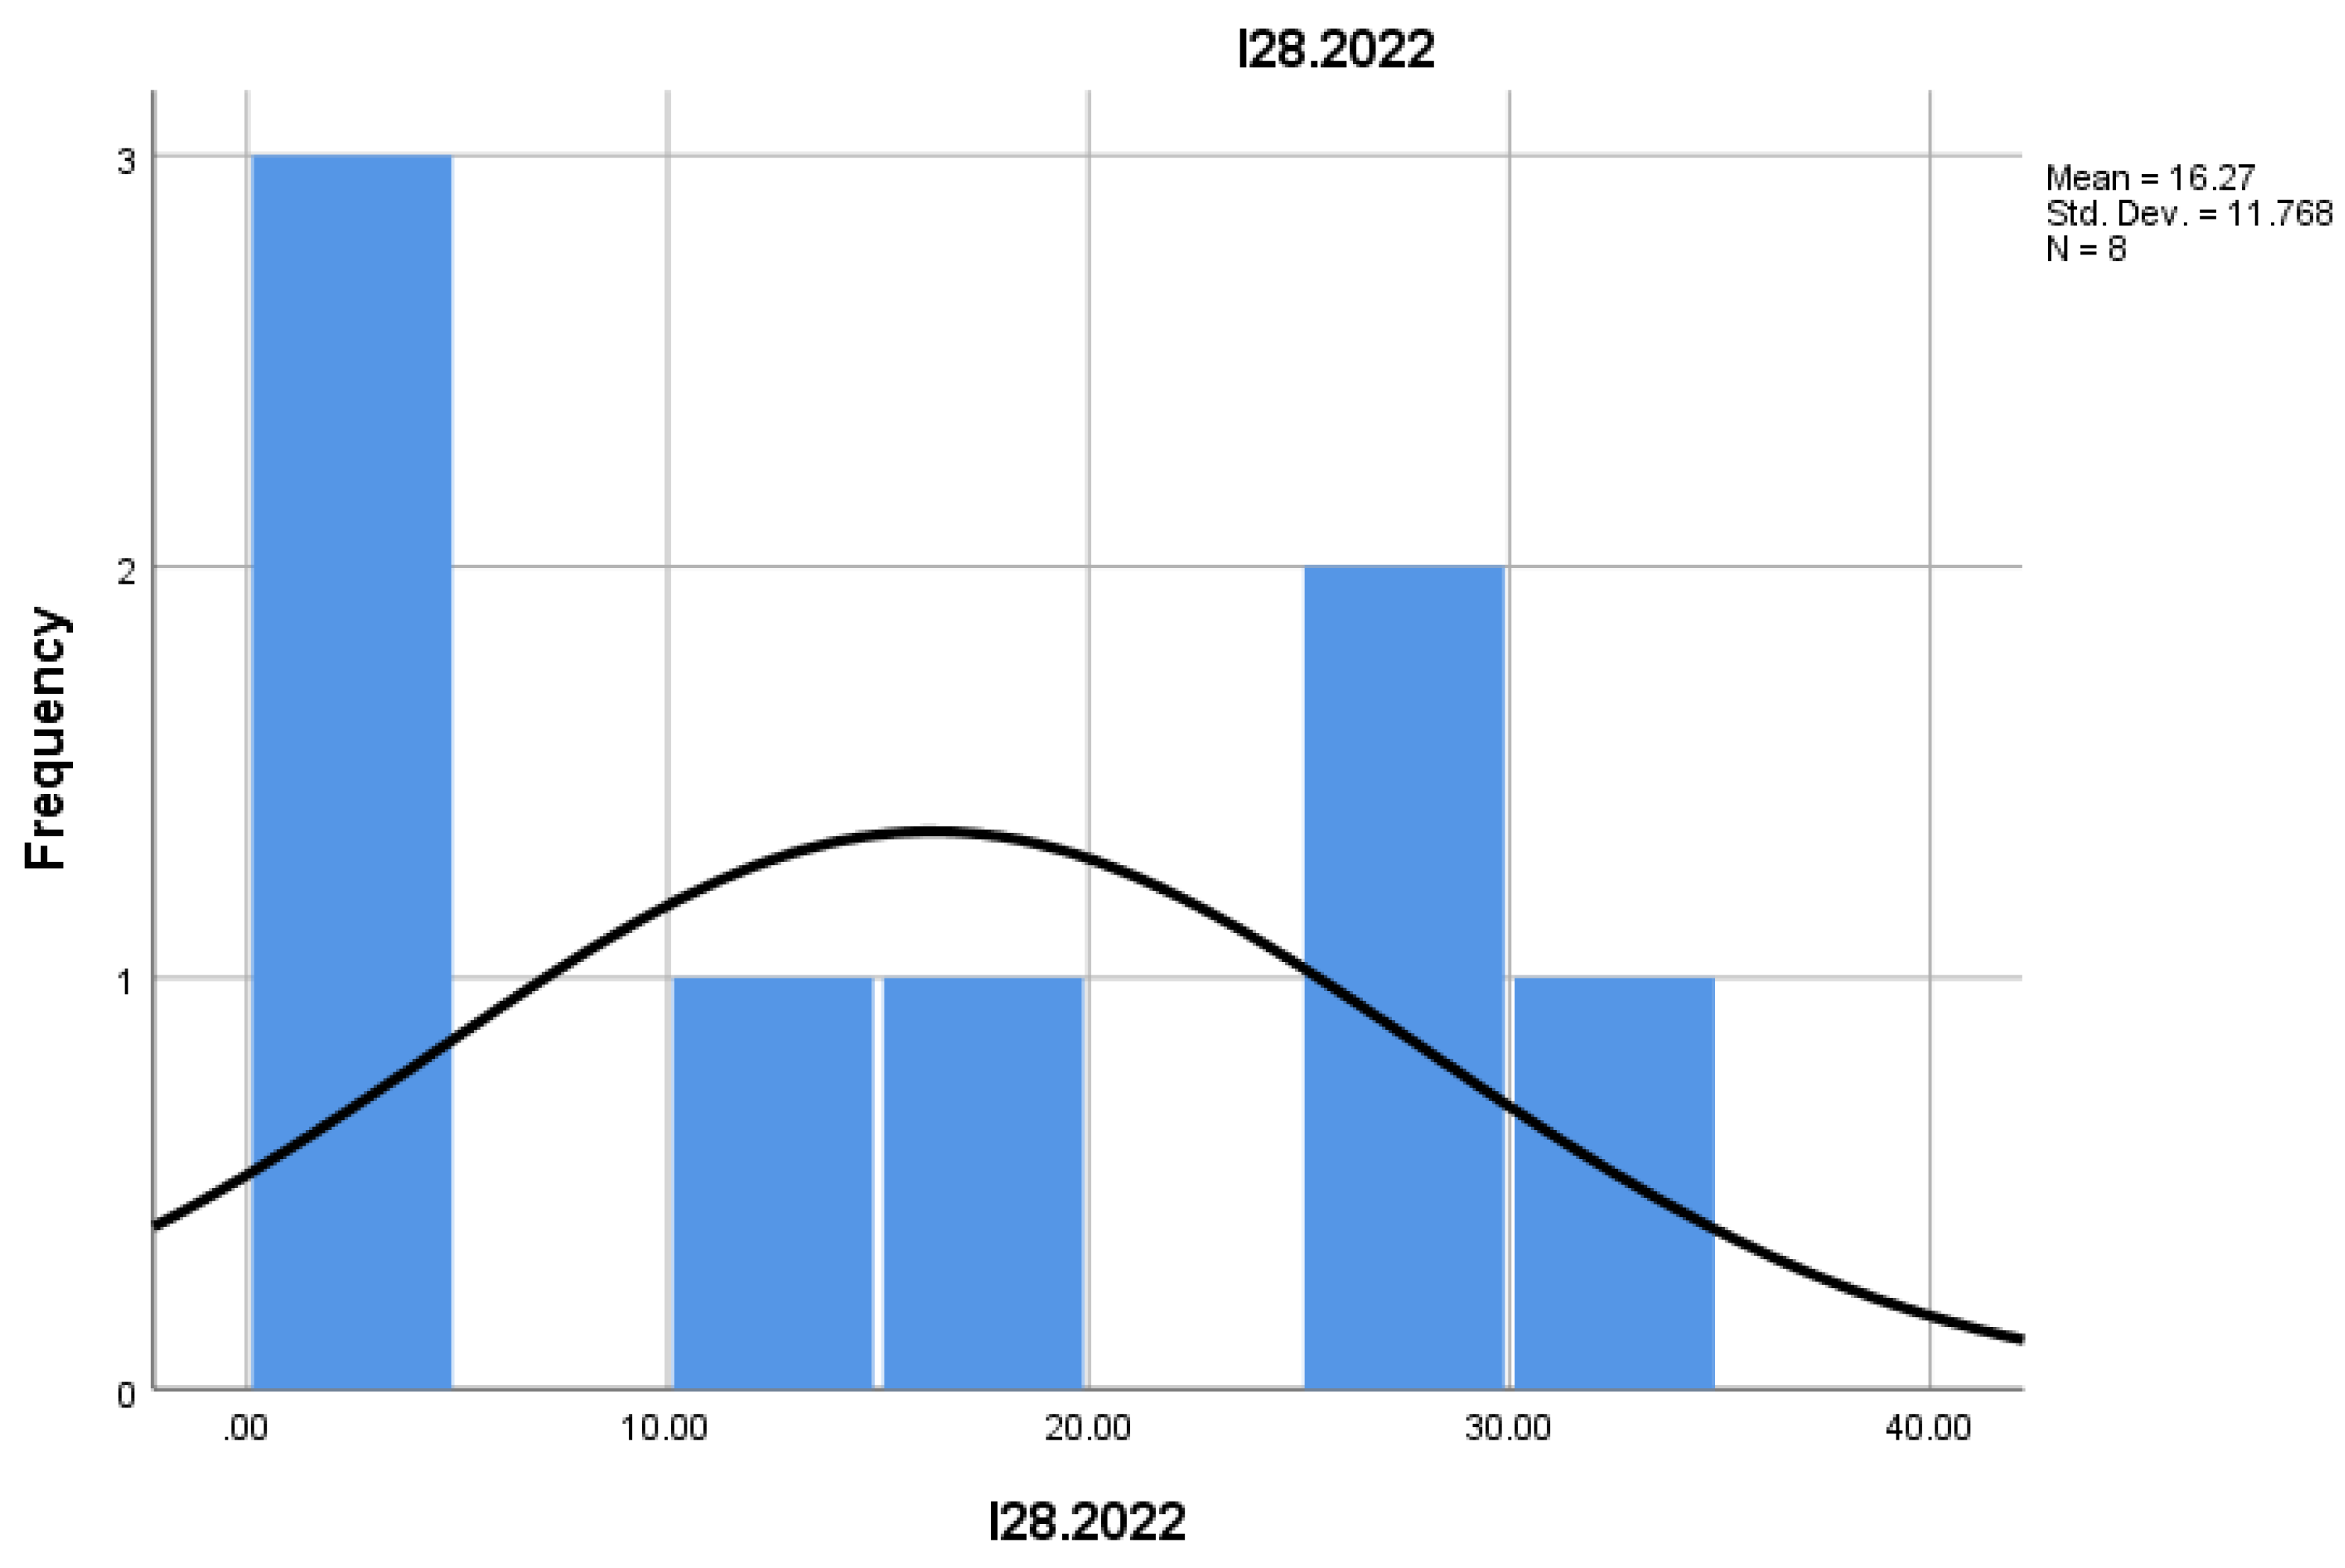
| Mean | 21.0545 | 26.0717 | 48201.38 | 52012.58 | 1205.11 | 1221.00 | 535.14 | 1336.22 | 19.2278 | 16.2750 | ||||||||||||||
| Std. Error of Mean | 5.22310 | 7.94507 | 21780.581 | 24832.347 | 767.625 | 745.356 | 308.074 | 741.755 | 3.71721 | 4.16079 | ||||||||||||||
| Median | 18.4100 | 23.2100 | 12443.00 | 14568.00 | 176.00 | 242.00 | 211.00 | 219.00 | 17.4800 | 14.8500 | ||||||||||||||
| Mode | 1.12a | -4.41a | 1484a | 1850a | 36a | 4a | 1a | 2a | 4.07a | 3.67a | ||||||||||||||
| Std. Deviation | 17.32305 | 27.52253 | 78531.000 | 86021.774 | 2302.876 | 2108.184 | 815.087 | 2225.264 | 11.15164 | 11.76850 | ||||||||||||||
| Skewness | 0.645 | 1.443 | 2.456 | 2.385 | 2.658 | 2.352 | 2.110 | 2.086 | -0.136 | 0.178 | ||||||||||||||
| Std. Error of Skewness | 0.661 | 0.637 | 0.616 | 0.637 | 0.717 | 0.752 | 0.794 | 0.717 | 0.717 | 0.752 | ||||||||||||||
| Kurtosis | -1.227 | 2.758 | 5.996 | 5.485 | 7.313 | 5.729 | 4.463 | 4.210 | -1.668 | -2.038 | ||||||||||||||
| Std. Error of Kurtosis | 1.279 | 1.232 | 1.191 | 1.232 | 1.400 | 1.481 | 1.587 | 1.400 | 1.400 | 1.481 | ||||||||||||||
| Range | 46.02 | 99.57 | 272852 | 287150 | 7103 | 6176 | 2273 | 6621 | 29.53 | 27.15 | ||||||||||||||
| Minimum | 1.12 | -4.41 | 1484 | 1850 | 36 | 4 | 1 | 2 | 4.07 | 3.67 | ||||||||||||||
| Maximum | 47.14 | 95.16 | 274336 | 289000 | 7139 | 6180 | 2274 | 6623 | 33.60 | 30.82 | ||||||||||||||
| Sum | 231.60 | 312.86 | 626618 | 624151 | 10846 | 9768 | 3746 | 12026 | 173.05 | 130.20 | ||||||||||||||
| Percentile 25 | 6.5300 | 3.7500 | 7773.50 | 7974.00 | 71.50 | 71.50 | 71.00 | 45.00 | 8.8400 | 4.0575 | ||||||||||||||
| Percentile 50 | 18.4100 | 23.2100 | 12443.00 | 14568.00 | 176.00 | 242.00 | 211.00 | 219.00 | 17.4800 | 14.8500 | ||||||||||||||
| Percentile 75 | 44.8500 | 39.7325 | 50366.00 | 46140.25 | 1393.50 | 1694.50 | 837.00 | 2238.00 | 29.2300 | 29.1750 | ||||||||||||||
| a. Multiple modes exist. The smallest value is shown | ||||||||||||||||||||||||
The "mode" indicates the most frequent value observed. The presence of multiple modes suggests that the data may include distinct groups of entrepreneurs, with very different performance levels.
Standard deviation measures the dispersion of the data from its mean. High values of standard deviation (e.g., 53,853.705 in 2021) suggest considerable variation in the performance of different mountain businesses. These fluctuations could be influenced by factors such as seasonality, different marketing strategies, or available resources.
Skewness measures the symmetry of the data distribution, and kurtosis indicates the shape of the distribution. For the indicators I1-I28, positive skewness (e.g., 1.941 in 2021) indicates a concentration of values smaller than the mean, suggesting a large number of entrepreneurs with smaller businesses. Positive kurtosis (e.g., 3.021 in 2021) suggests a distribution with sharp peaks, meaning a high concentration of data around a central value.
The range represents the difference between the maximum and minimum values of the data. For example, the range for businesses in 2021 varies significantly (185,592 – 199,477), which may signal significant differences between successful enterprises and those with poorer performance. Analyzing the extremes can reveal very profitable businesses, as well as those with large losses.
Percentiles are useful for understanding data distribution. For example, the 25th percentile of indicators I1-I28 in 2021 (14,363) suggests that 25% of entrepreneurs earned less than this value. Similarly, the 75th percentile (34,569) shows that 75% of entrepreneurs earned less than this amount, which can help identify distinct market segments.
The data analyze the fluctuations and economic trends among mountain entrepreneurs in the arts and entertainment sector, indicating a complex evolution of these businesses. Overall, the number of enterprises, revenue, and other economic performances are influenced by various factors, including seasonality, marketing strategies, access to resources, and external economic conditions.
The increases observed in 2022 compared to 2021 suggest a process of consolidation for this type of entrepreneurship, but also significant disparities between different businesses. While some businesses show constant growth, others are still in an early stage or show more modest performance.
The study of mountain entrepreneurship in the arts and entertainment sector shows that this field has significant growth potential, but it is marked by a wide diversity of performance levels. Factors influencing this sector include both economic aspects (number of enterprises, employability, revenue, and costs) and social and cultural aspects (participation in events, impact of cultural tourism). Analyzing these data will contribute to the development of more effective public policies and strategies to support this type of entrepreneurship.
Results
In this section, we present the analysis of the results for relevant indicators regarding mountain entrepreneurship in the field of art and entertainment during 2021 and 2022 (tables and figures). The data were collected for various time intervals, and the analysis focuses on key indicators of mountain enterprises, including their birth and death rates, as well as employment trends.
Regarding I1, the average values for 2021 and 2022 range from 43,042.67 (in I1.2021) to 49,409.62 (in I1.2022). This suggests a slight upward trend in the number of active enterprises, with a significant fluctuation range. Additionally, the data distribution is positively skewed (skewness of 1.941 for I1.2021), indicating a high number of small enterprises, but also a few large ones that influence the mean.
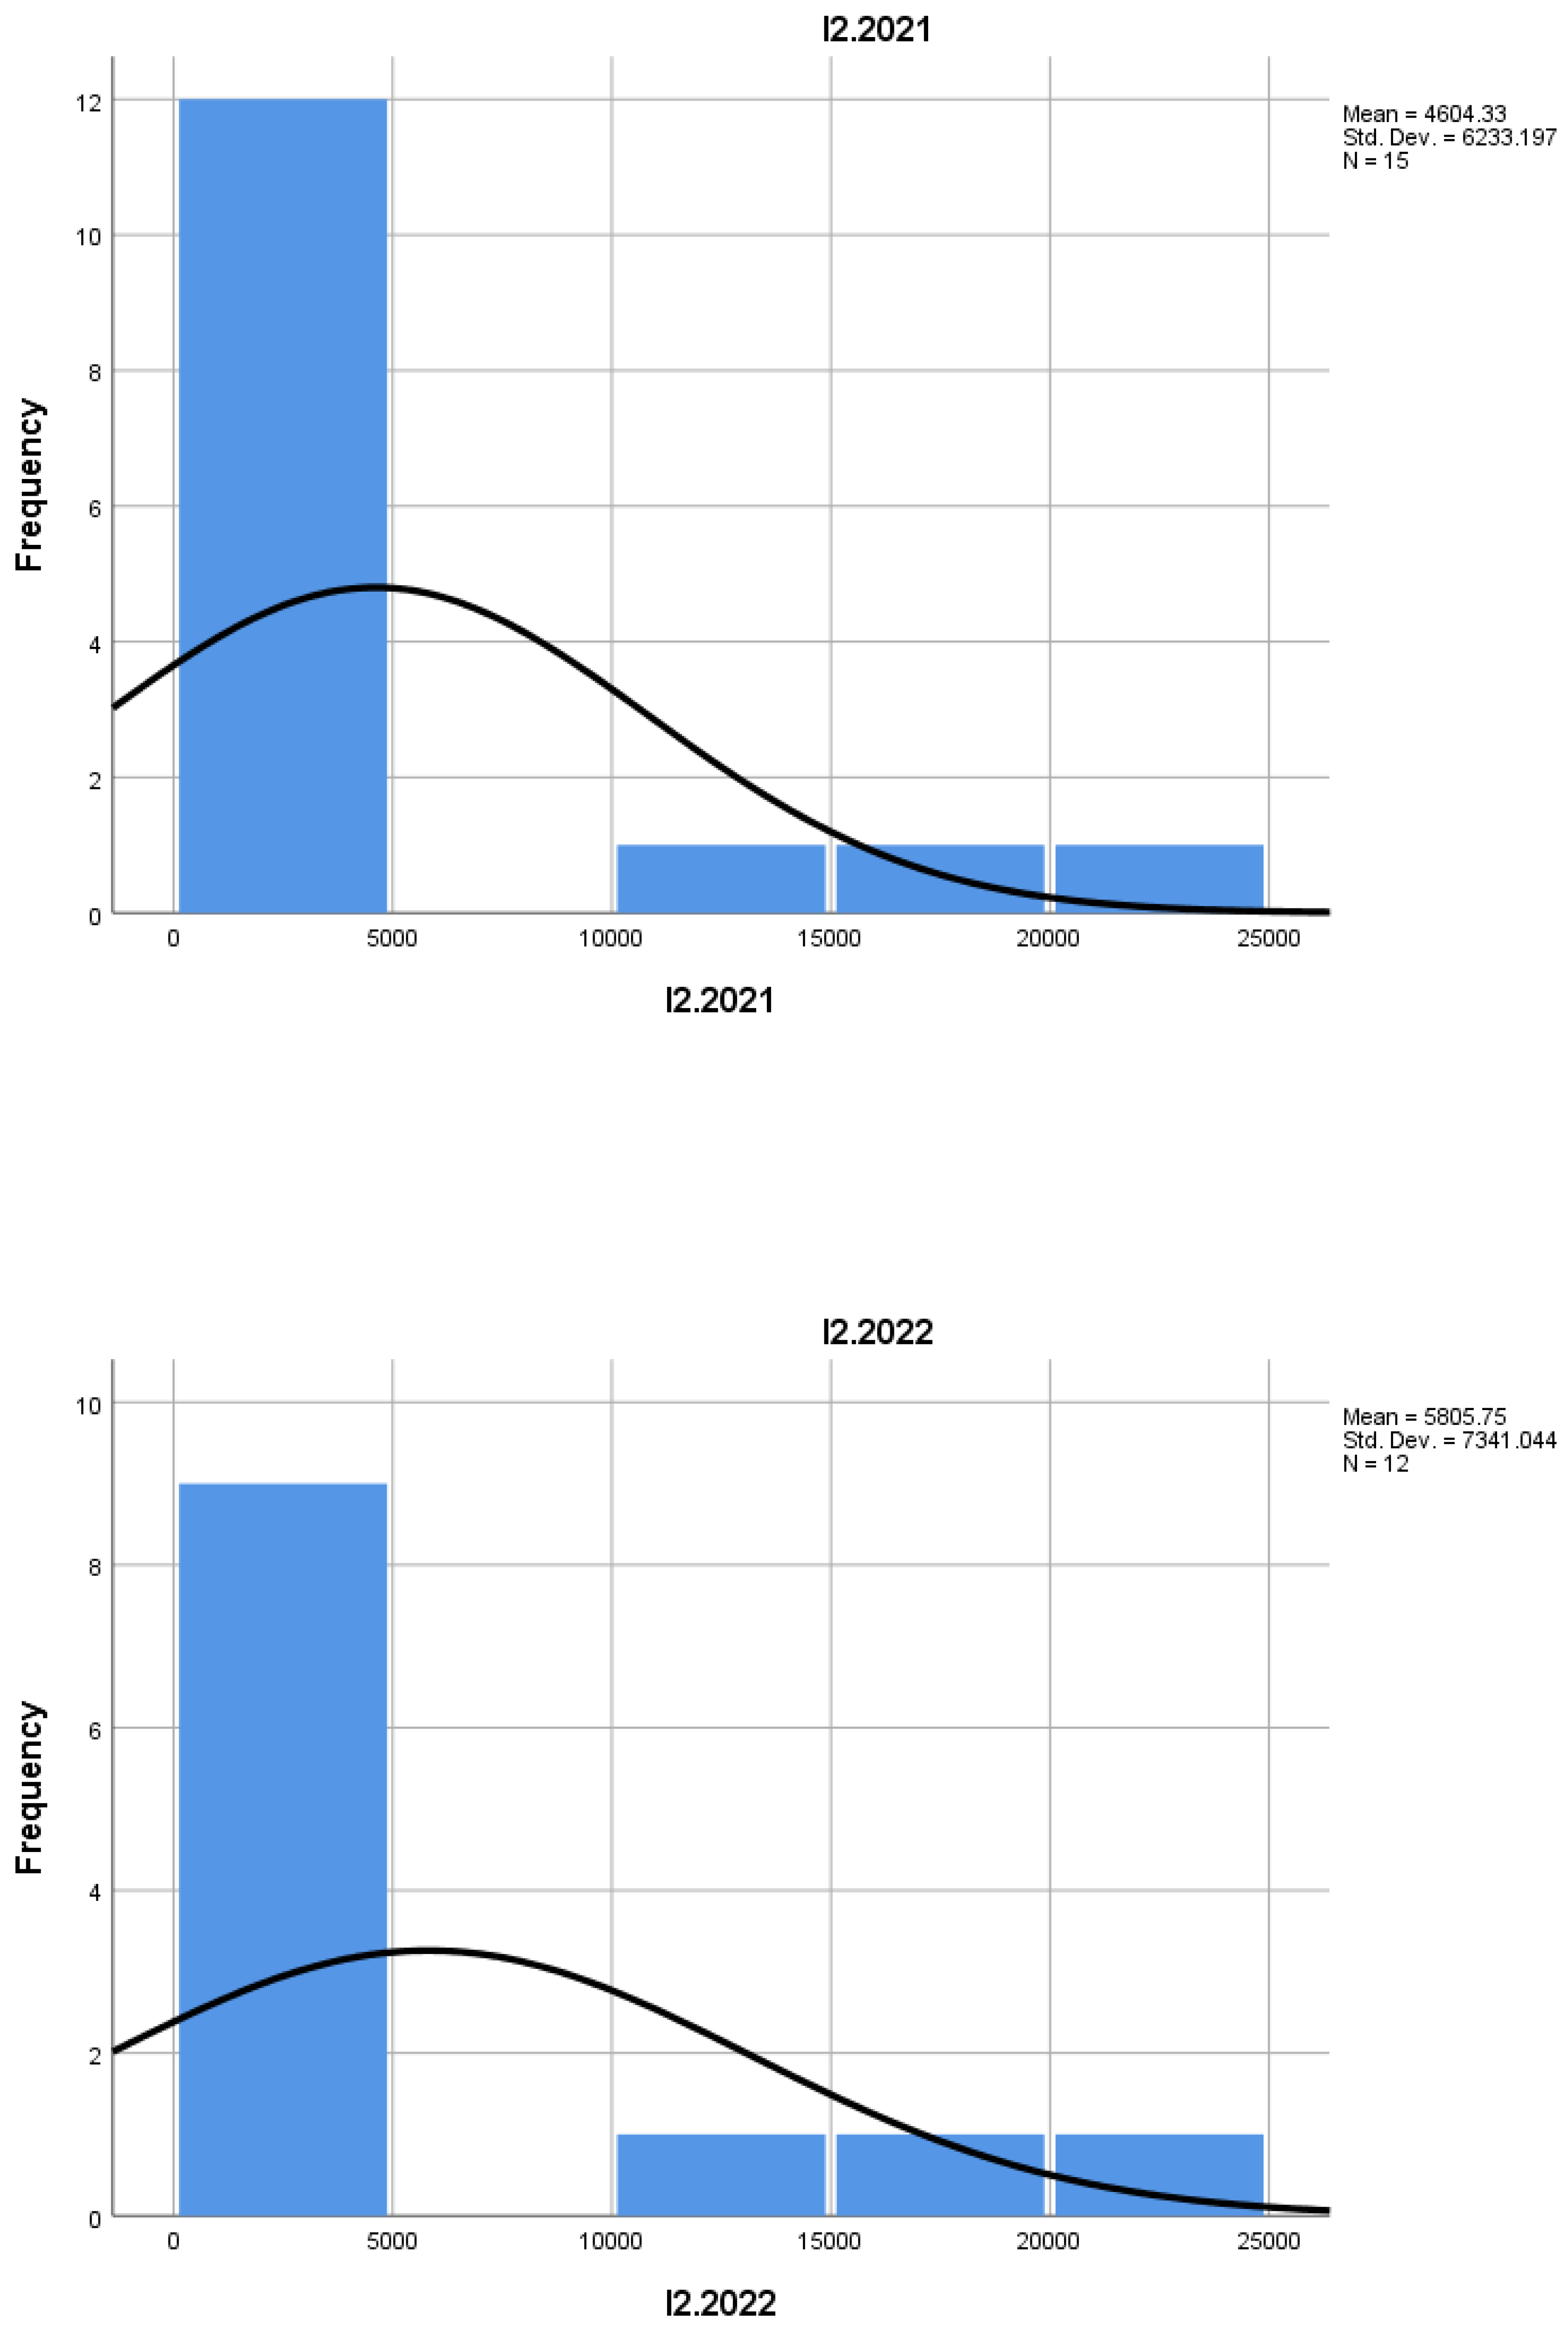
Regarding I2, we observe a decrease in the average values from 4,604.33 (I2.2021) to 5,805.75 (I2.2022), suggesting a slight increase in the number of new business startups. This trend may reflect a growing interest in developing entrepreneurship in the field of mountain art and entertainment. The data also show high dispersion, with significant standard deviations (6,233.197 in 2021 and 7,341.044 in 2022), suggesting considerable variation in the size of new enterprises.
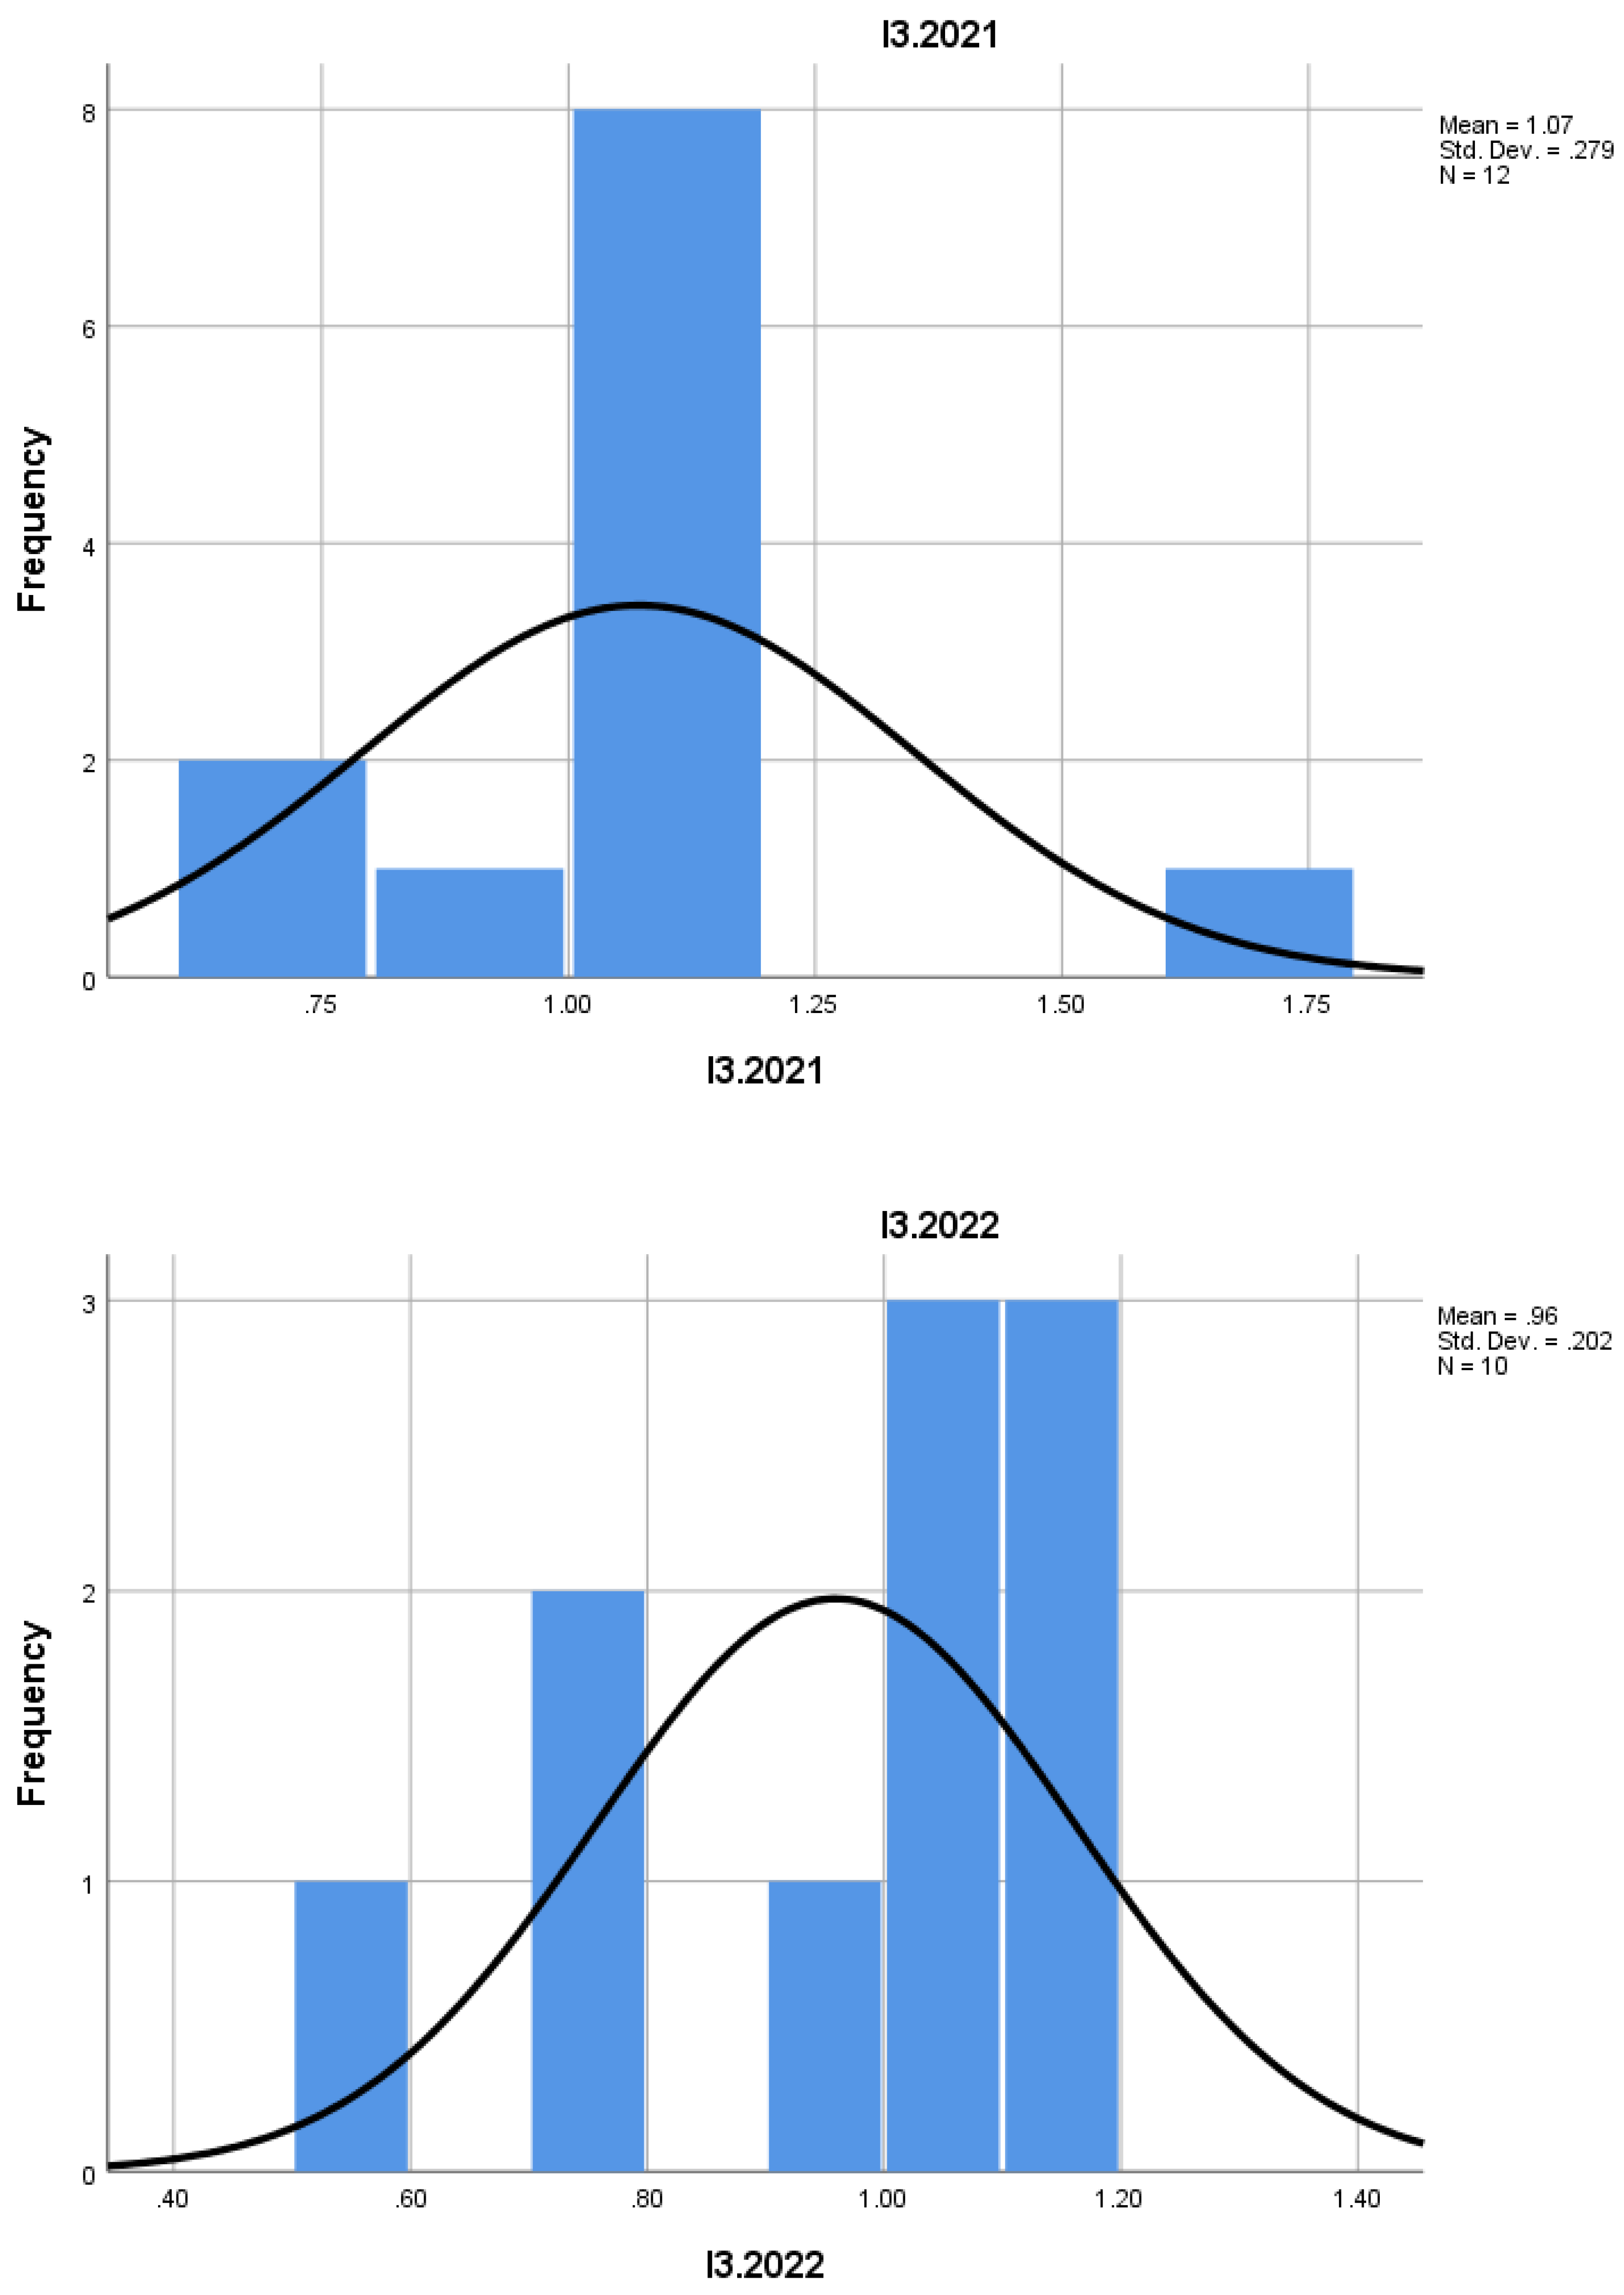
I3 shows a significant decline, with an average value of 1.0708 in 2021 and 0.9590 in 2022. This suggests a downward trend in the number of employees in new enterprises, which could indicate difficulties in attracting human resources or a trend towards the growth of micro-enterprises that require fewer employees.
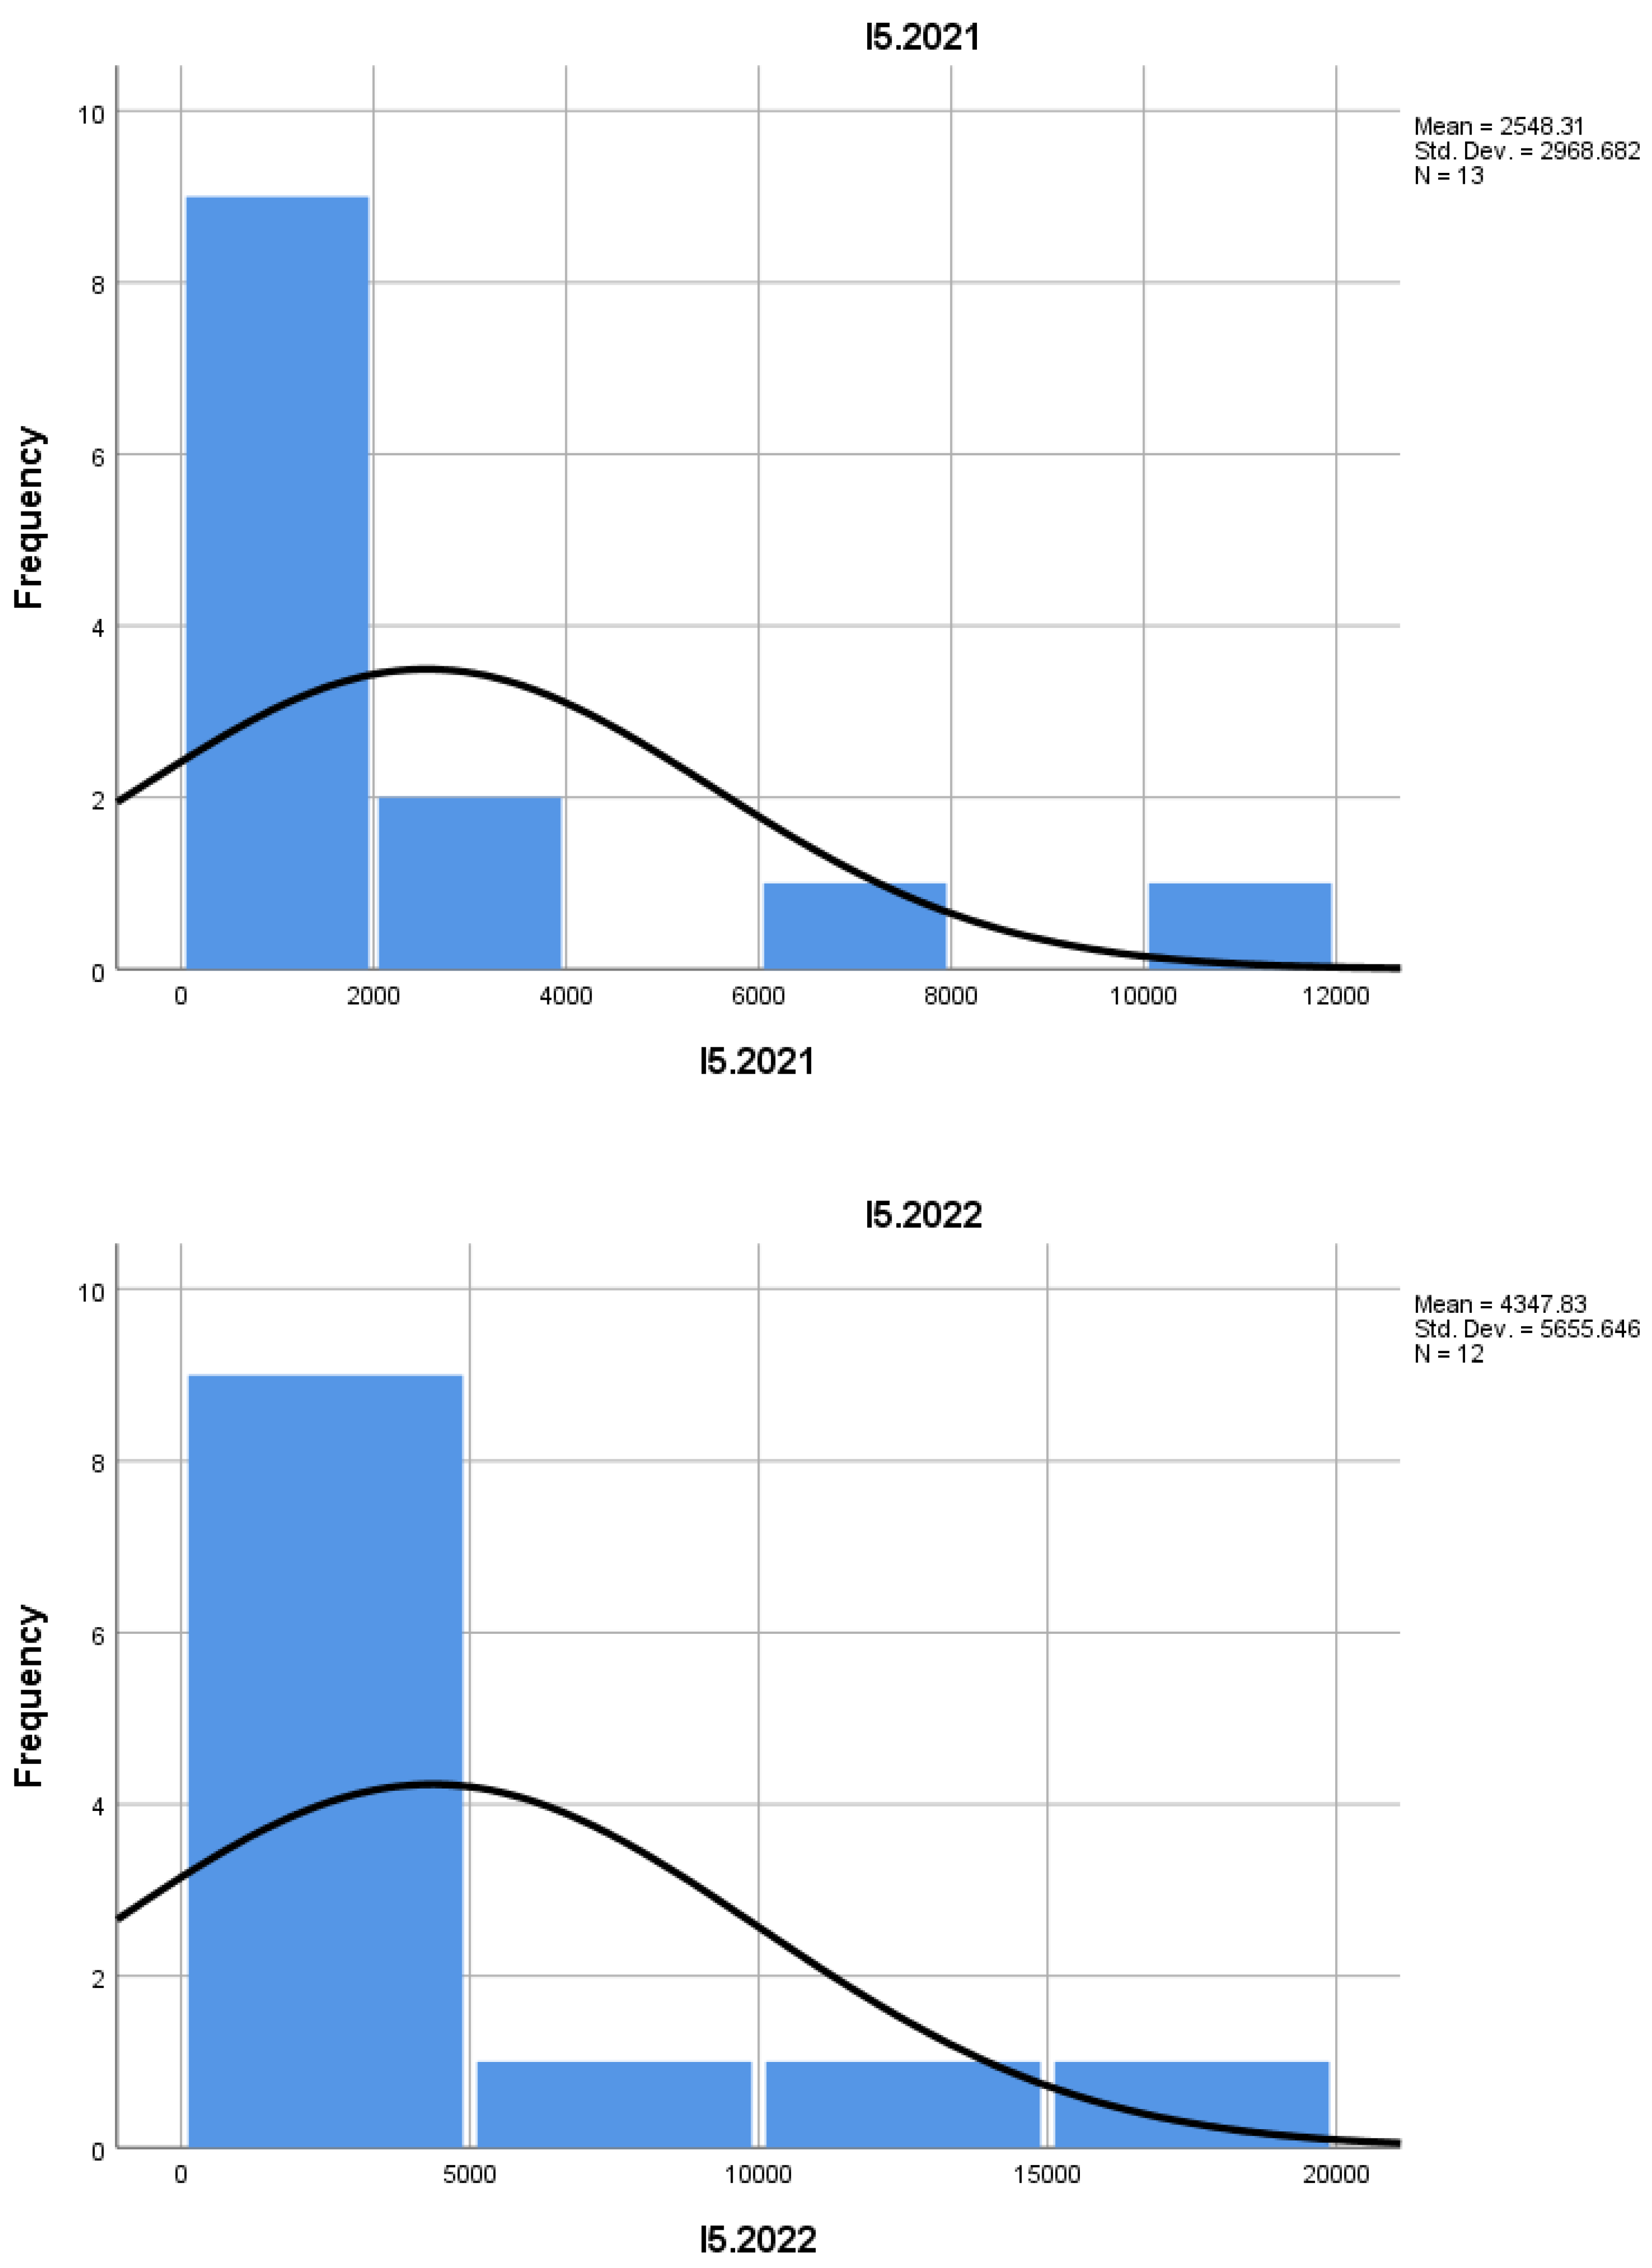
I5 varies significantly, with an average number of 2,548.31 in 2021 and 4,347.83 in 2022, indicating an increasing trend of enterprise closures. This may reflect economic difficulties, as well as a potential retreat from the art or entertainment sector in the mountain area. Additionally, this indicator has a high standard deviation (2,968.682 in 2021 and 5,655.646 in 2022), suggesting considerable variability in this process.
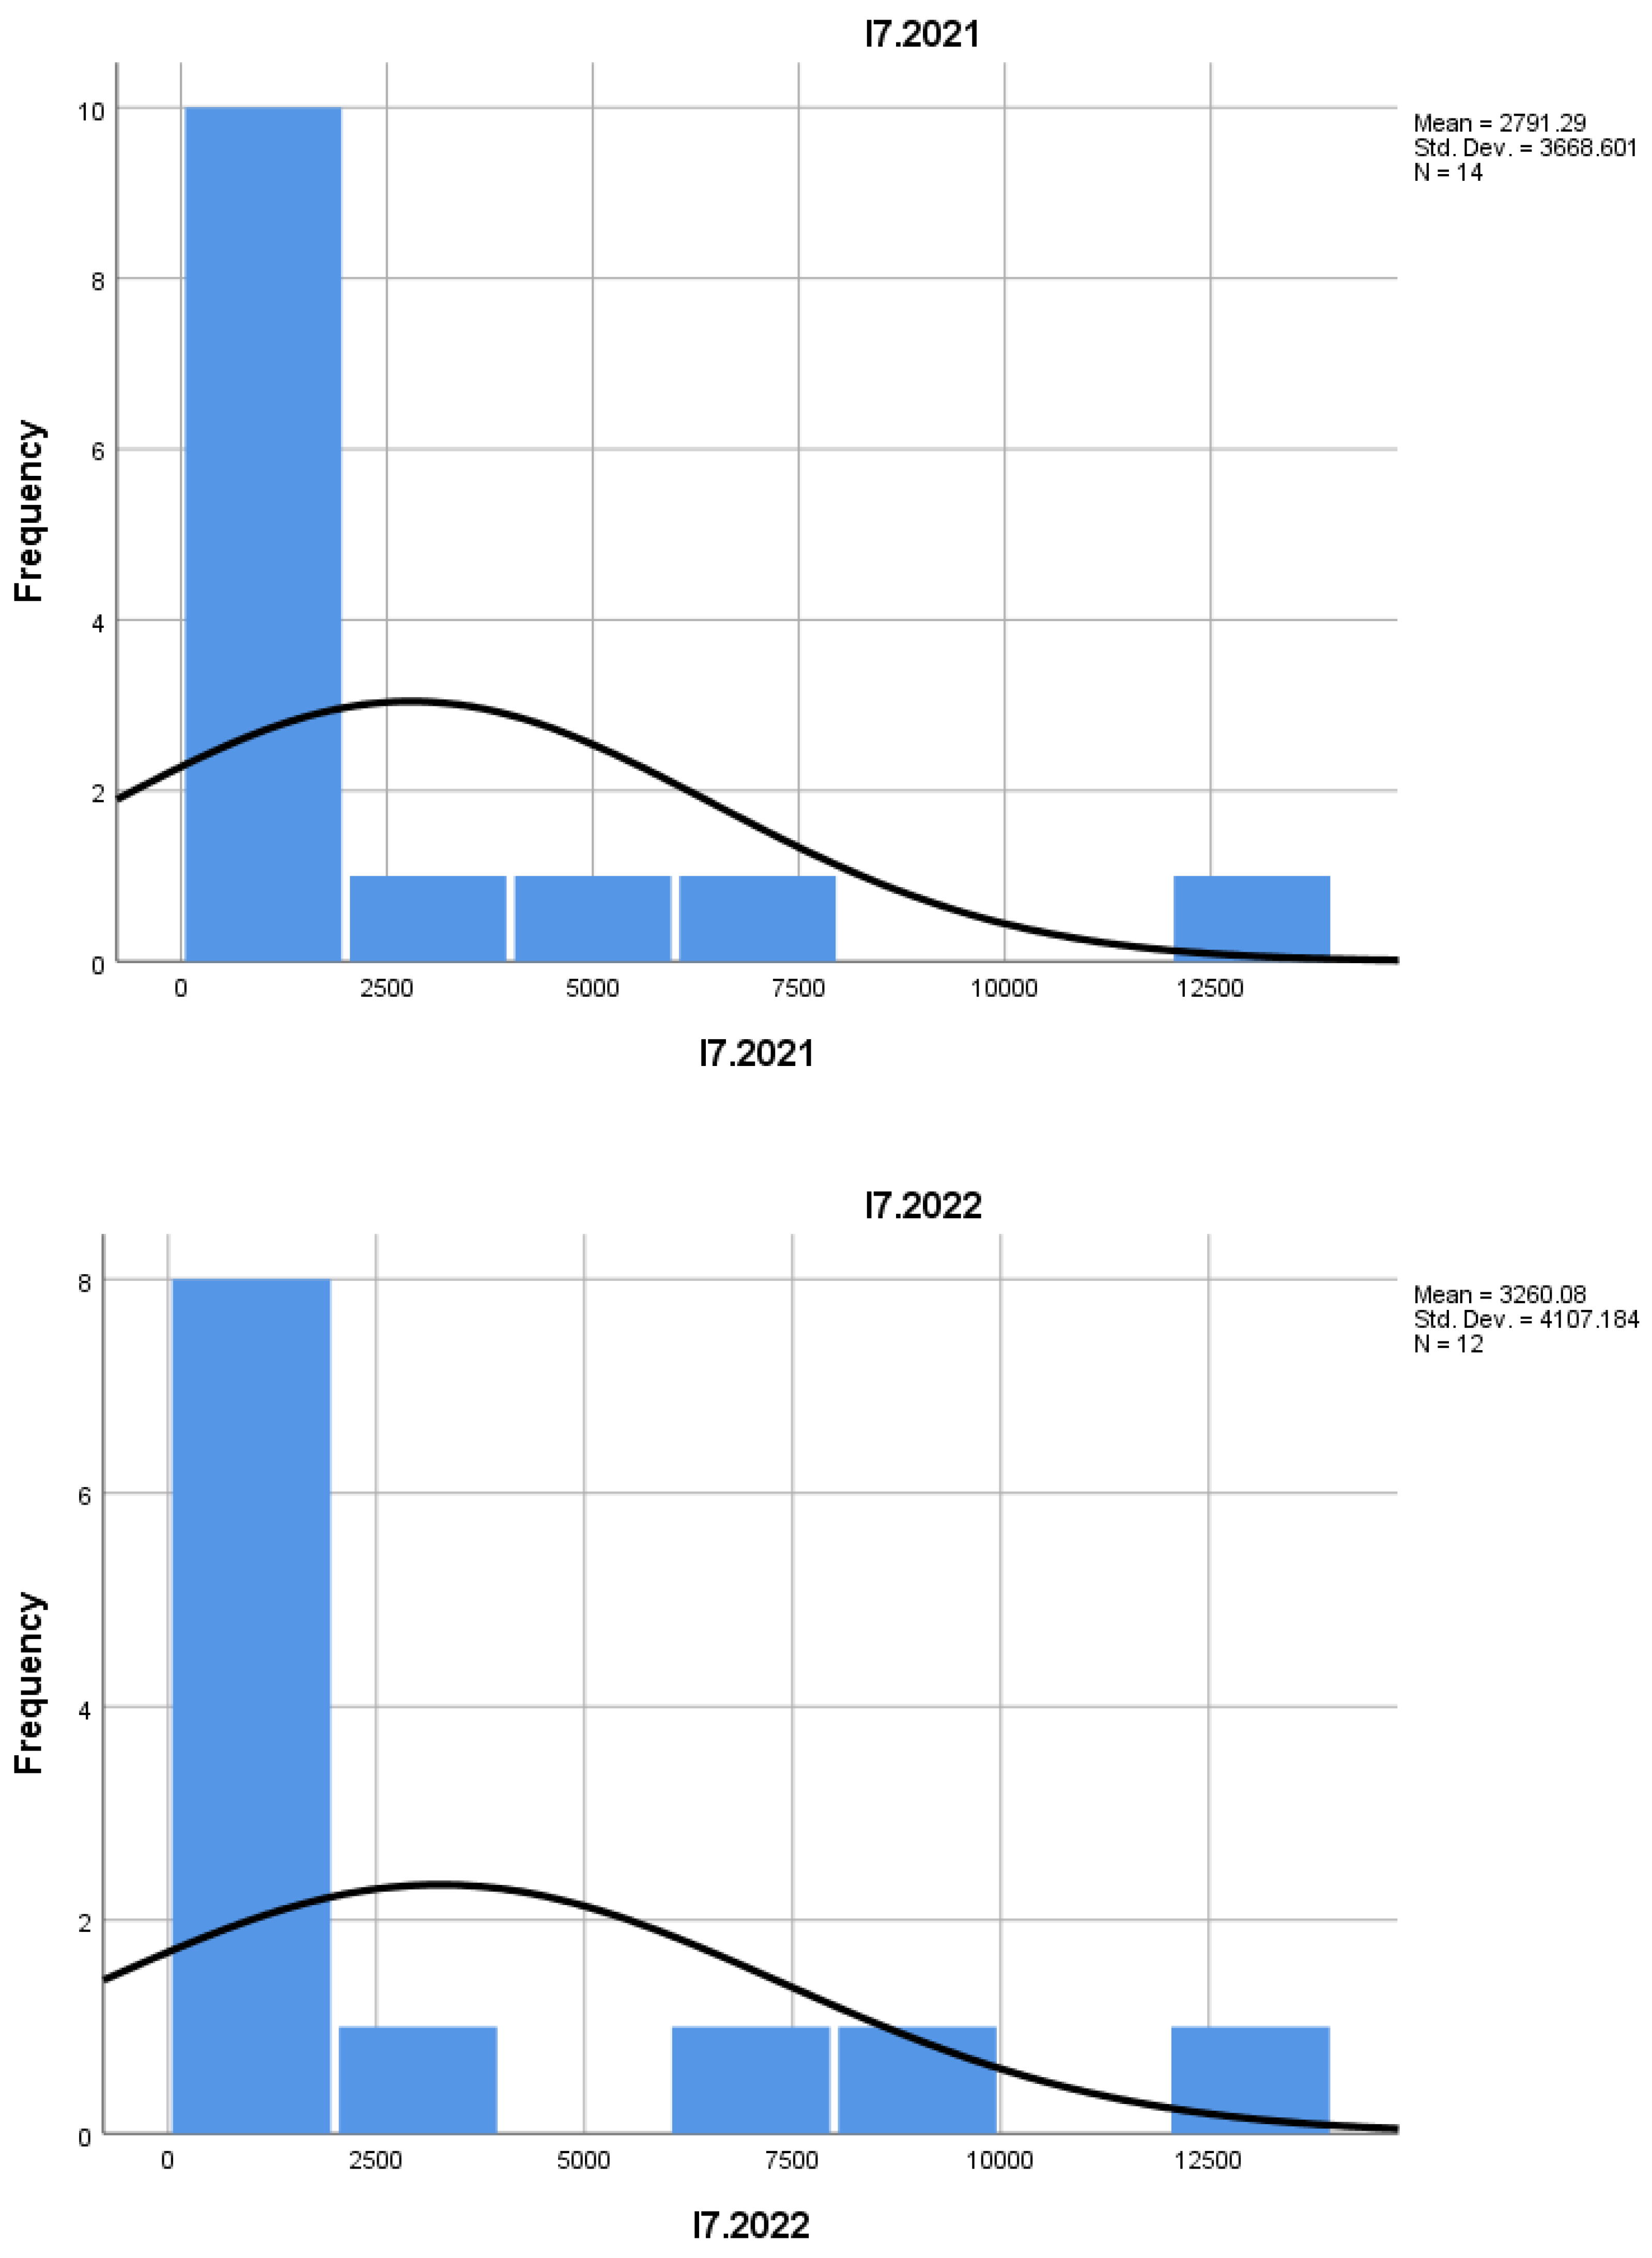
I7 indicates an average of 3,260.08 in 2021 and 6,500.7 in 2022, suggesting a trend of stabilization for mountain enterprises, though fluctuations remain quite large (standard deviation of 4,107.184 in 2021). The lower survival rate in 2022 may signal difficulties for enterprises in the art and entertainment sector to endure in the long term.
I9 shows a slightly favorable trend, with values remaining above 50% in most intervals, indicating that most mountain art and entertainment enterprises have a significant chance of surviving and developing in the medium term. This reflects a potential consolidation of the sector, as well as a shift towards sustainability and adaptability.
The data for the analyzed indicators so far show a mixed trend in mountain entrepreneurship in art and entertainment, with an increase in the number of newly established enterprises but also significant closure rates. The medium-term survival of enterprises seems favorable, with indicators suggesting adaptability to economic and market conditions. However, greater attention to enterprise size and sustainable growth strategies is crucial to ensuring a stable and viable business environment in the long term.
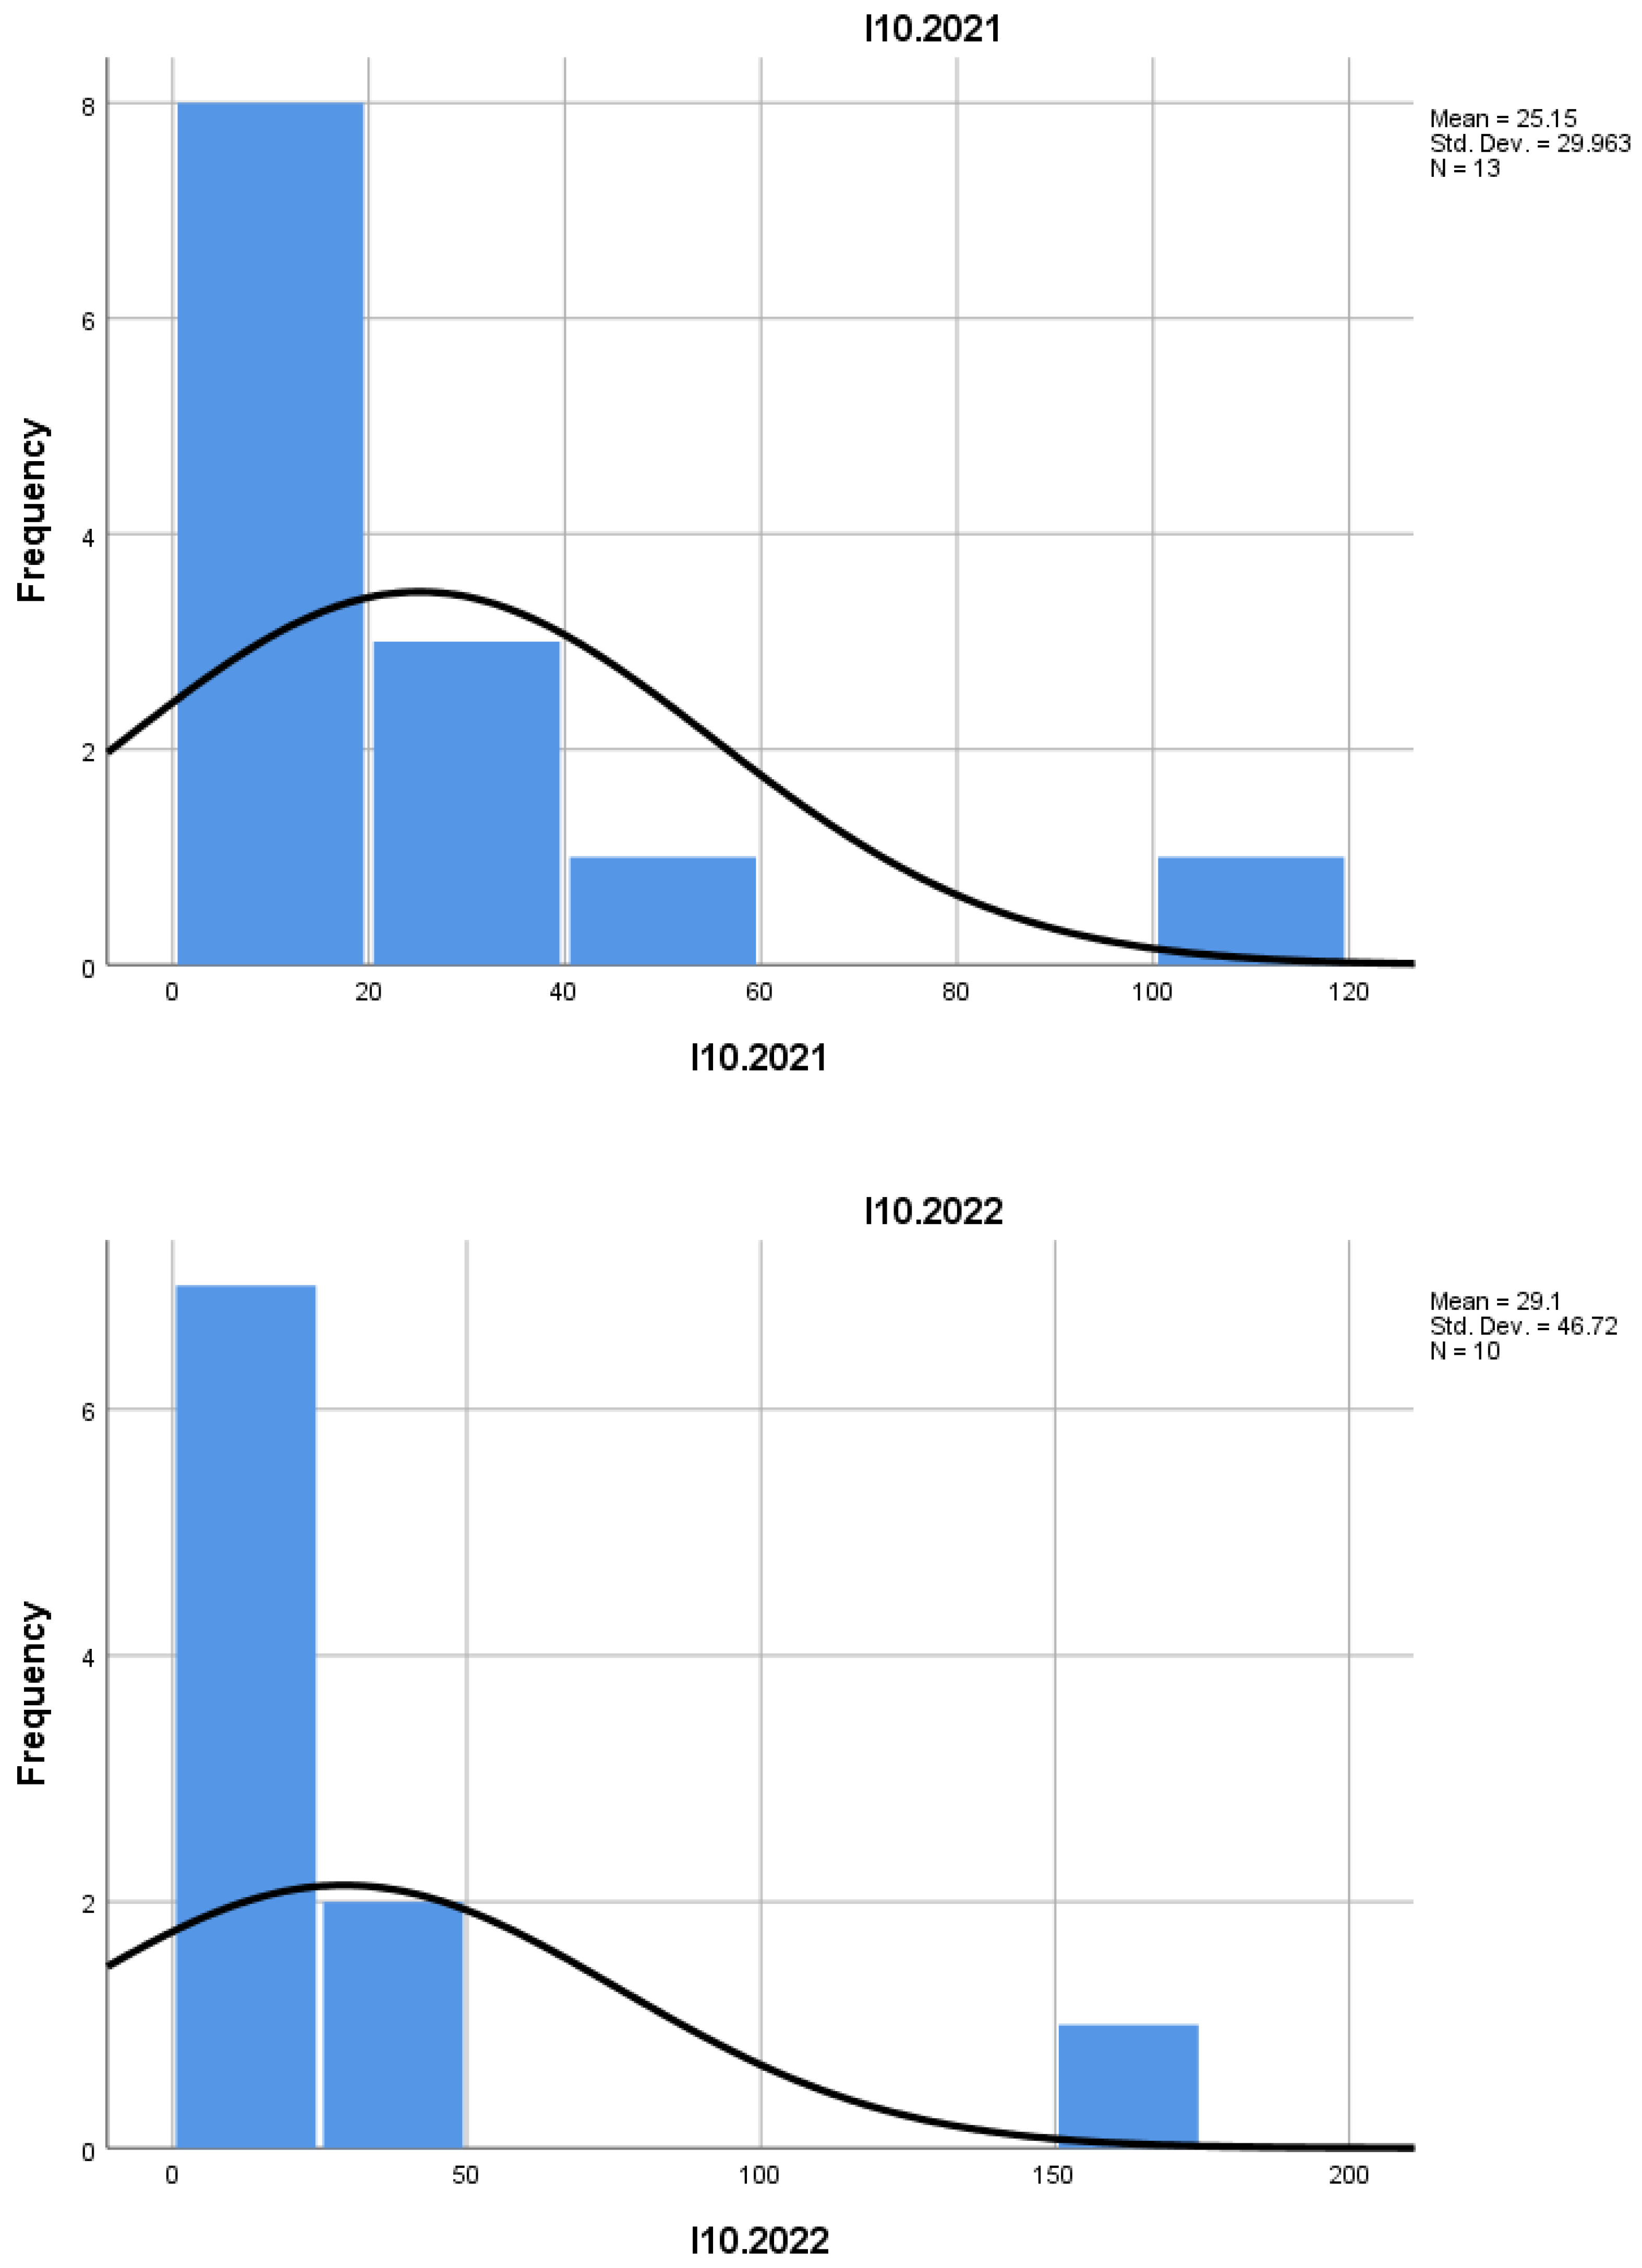
I10 shows the following values: - N Valid: 12 (2021), 13 (2022); - Mean: 25.15 (I10.2021), 29.10 (I10.2022); - Std. Deviation: 29.963 (I10.2021), 46.720 (I10.2022); - Median: 16.00 (I10.2021), 10.00 (I10.2022); - Skewness: 2.308 (I10.2021), 2.829 (I10.2022) — suggesting a skewed distribution with higher values on the right; - Kurtosis: 6.044 (I10.2021), 8.375 (I10.2022) — indicating the presence of larger extremes, characteristic of a small number of entities with high growth.
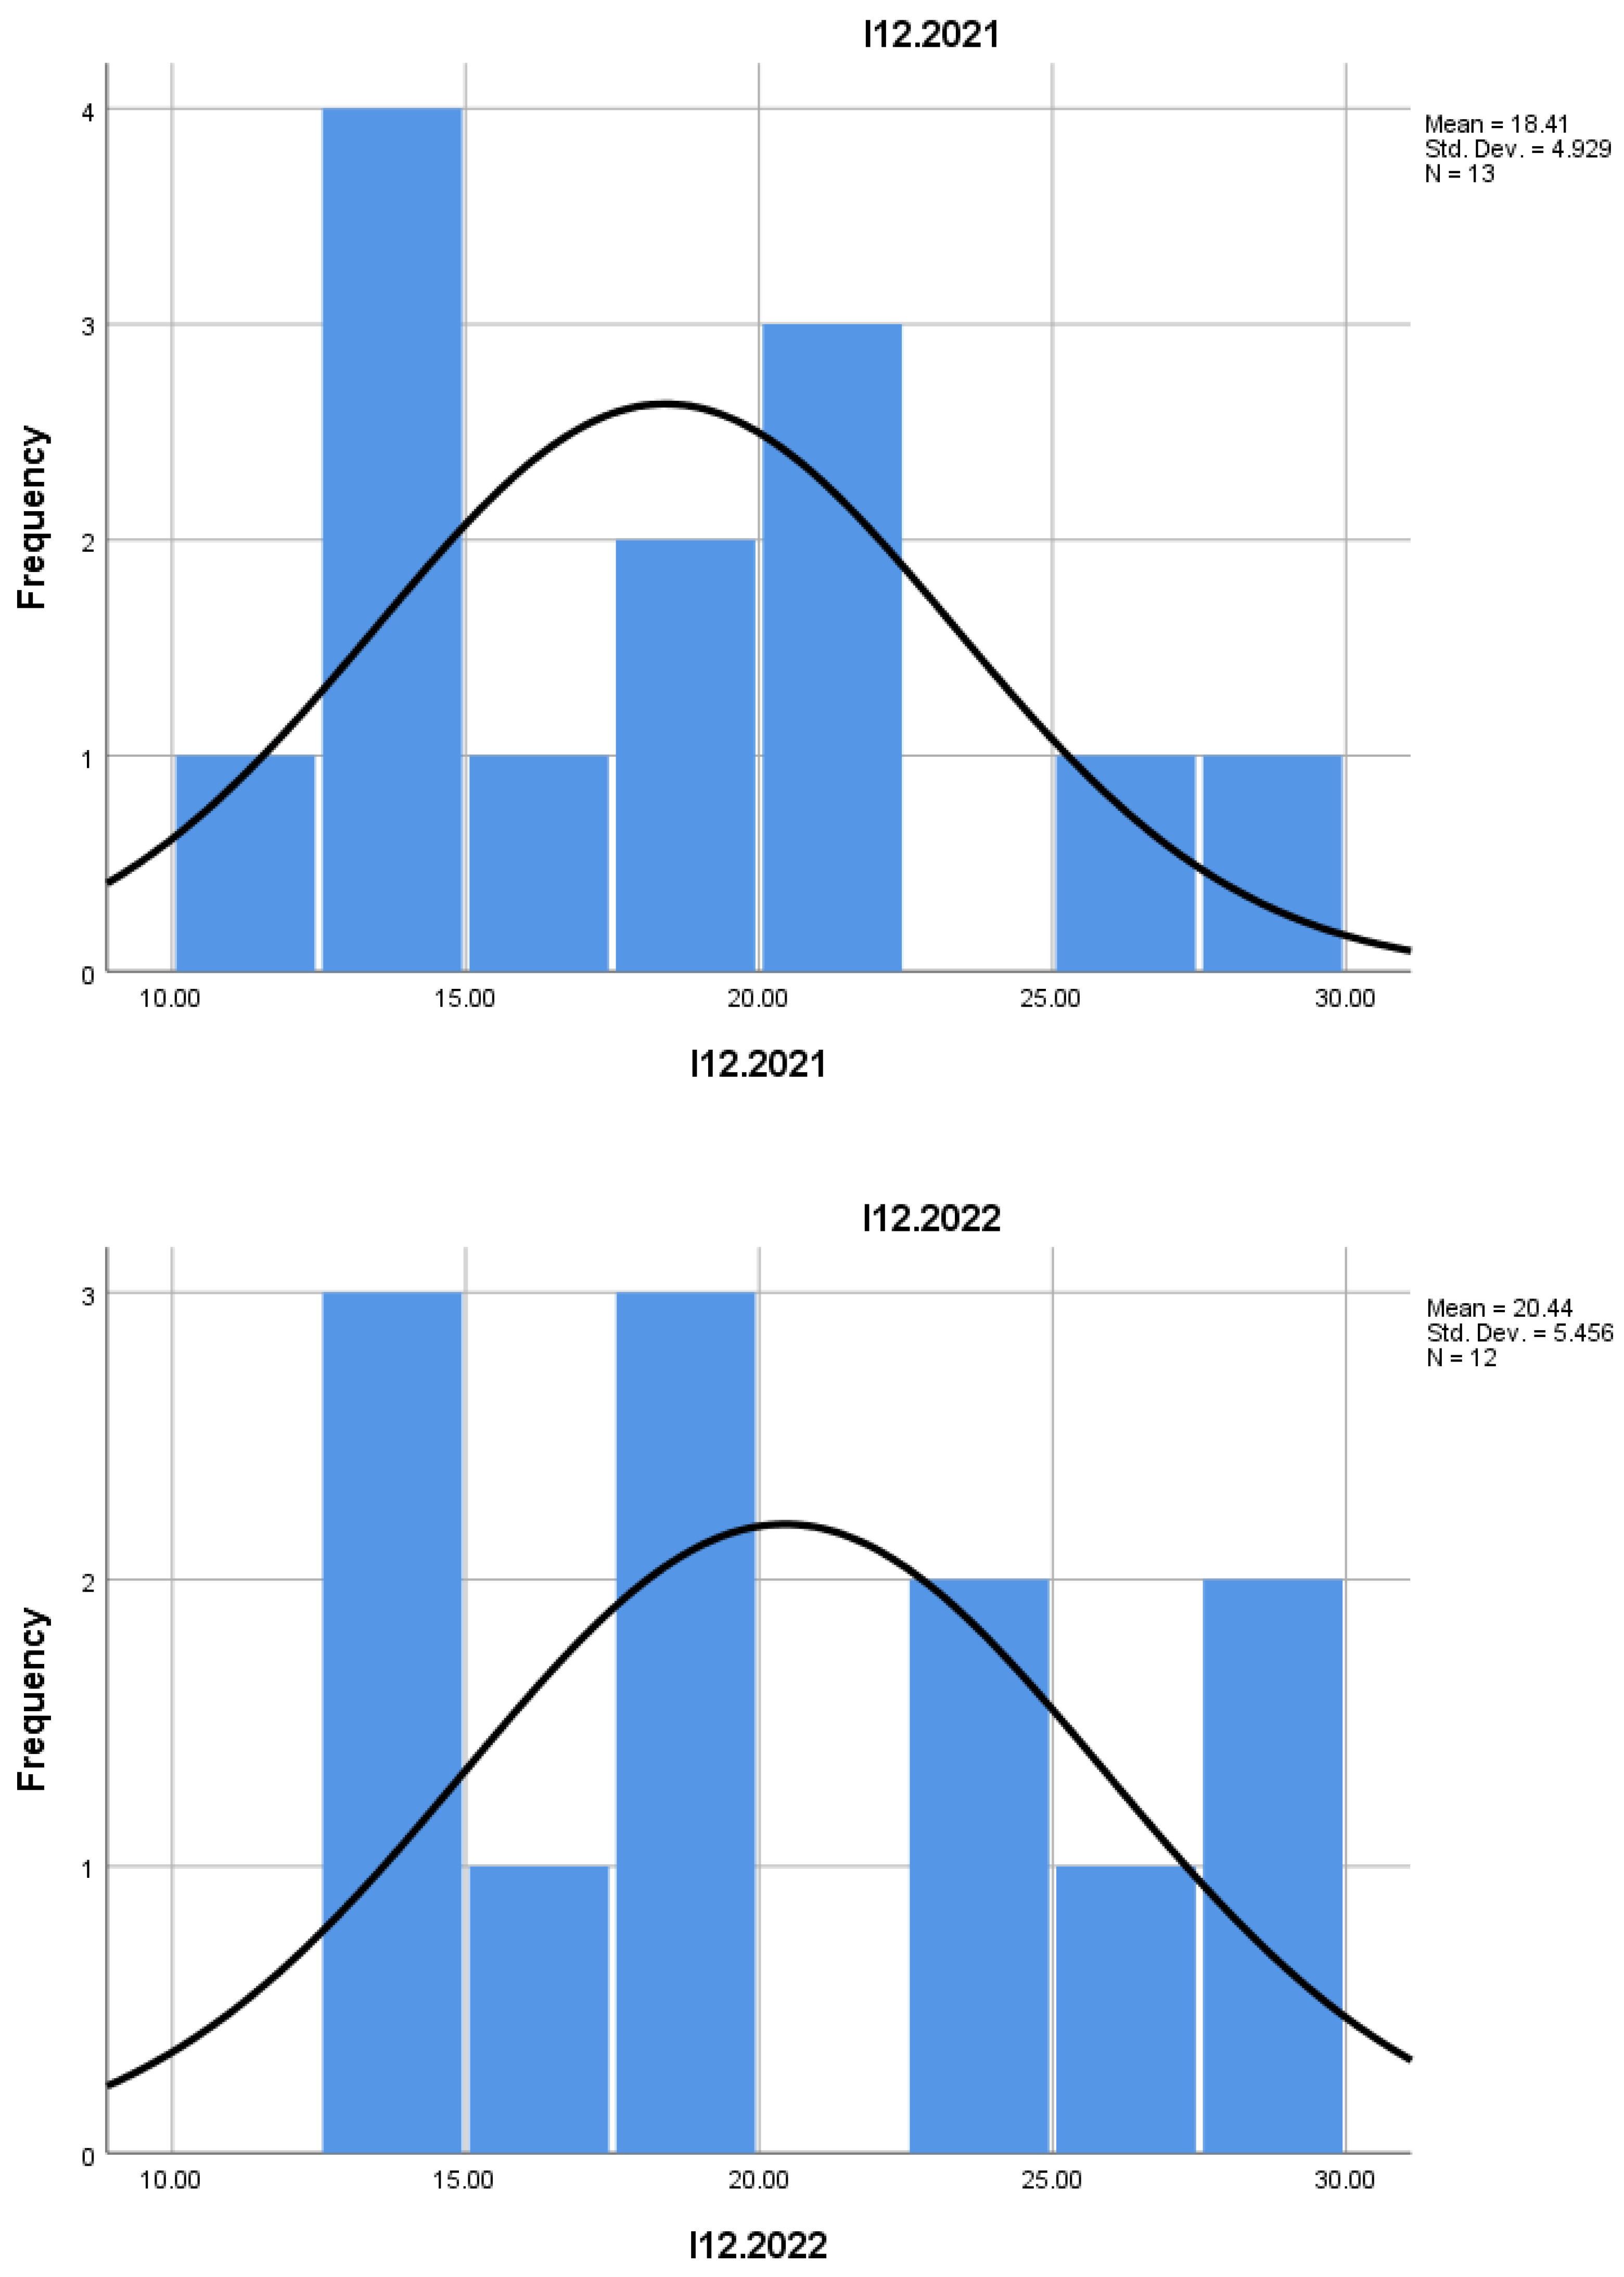
I11 shows: - N Valid: 12 (2021), 13 (2022); - Mean: 18.4062 (I11.2021), 20.4367 (I11.2022); - Std. Deviation: 4.92895 (I11.2021), 5.45617 (I11.2022); - Median: 18.8700 (I11.2021), 19.6650 (I11.2022); - Skewness: 0.623 (I11.2021), 0.202 (I11.2022) — relatively balanced distribution; - Kurtosis: -0.213 (I11.2021), -1.325 (I11.2022) — indicating a distribution less concentrated than a normal distribution.
I12: This indicator reflects a slight decrease in average values, suggesting a reduction in the intensity of activity or performance among the analyzed enterprises. The change in the type of skewness in the distribution may signal a transformation in the sector's structure, possibly through the emergence of more homogeneous entities.
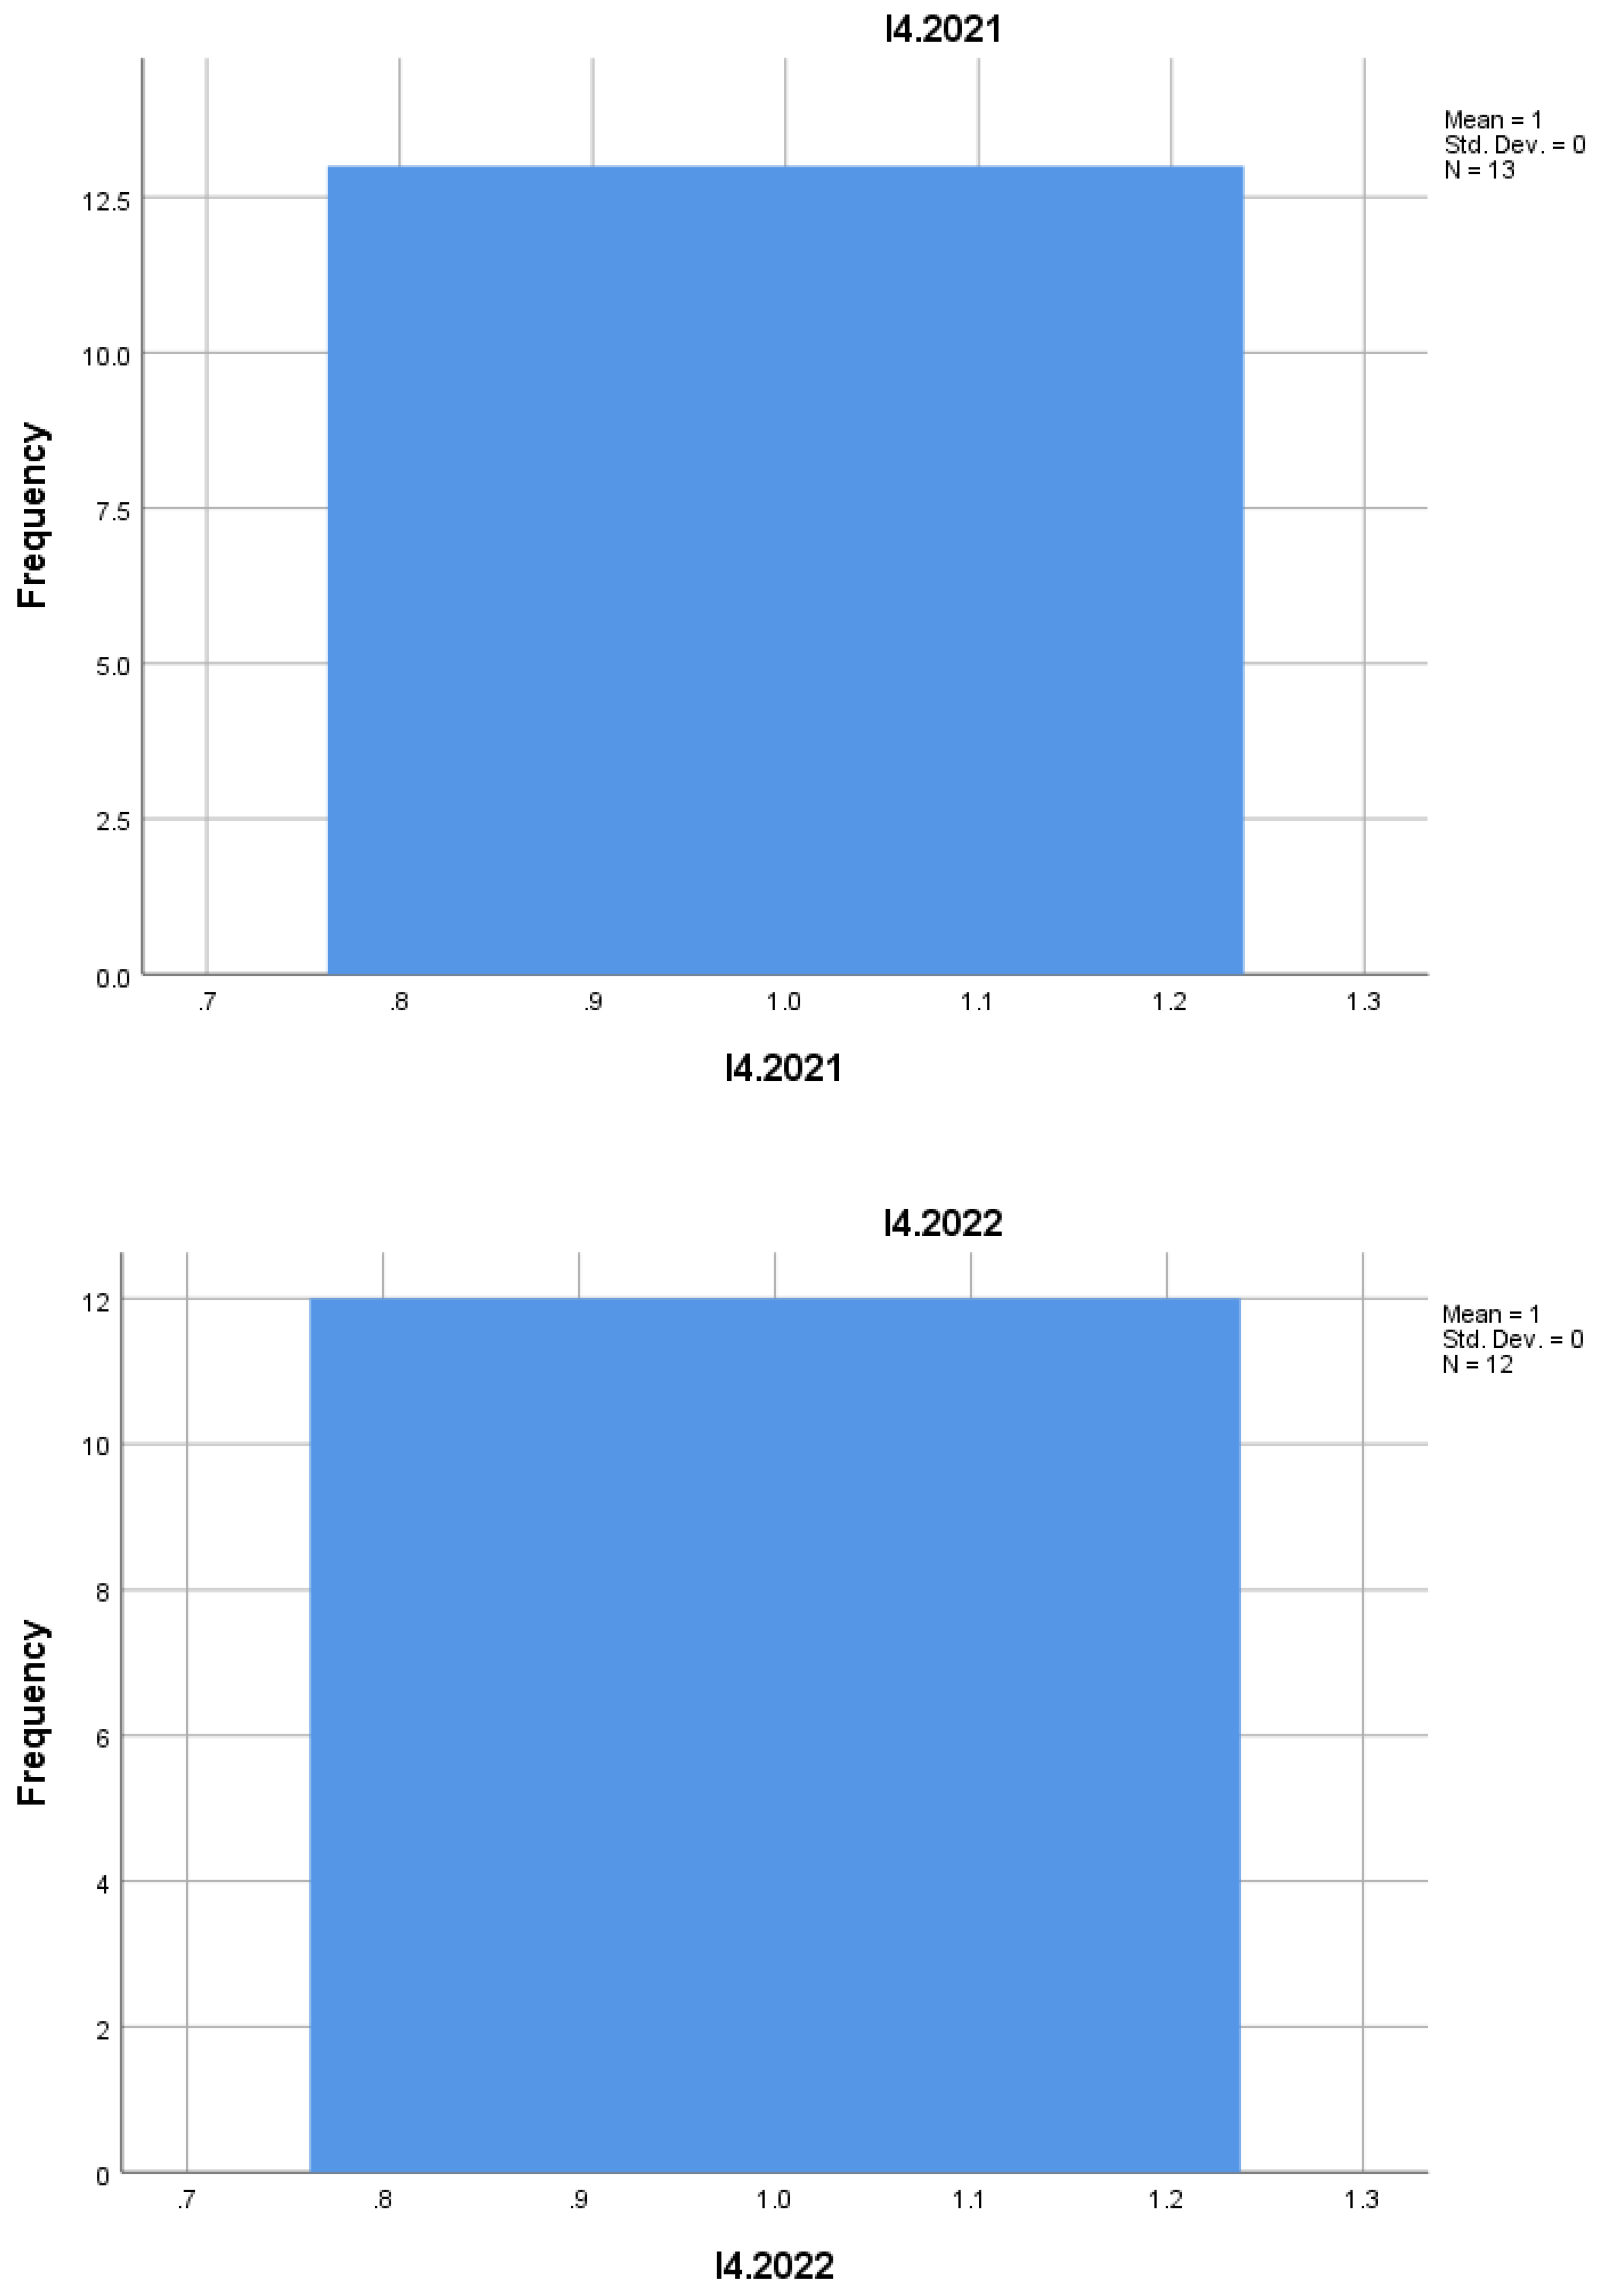
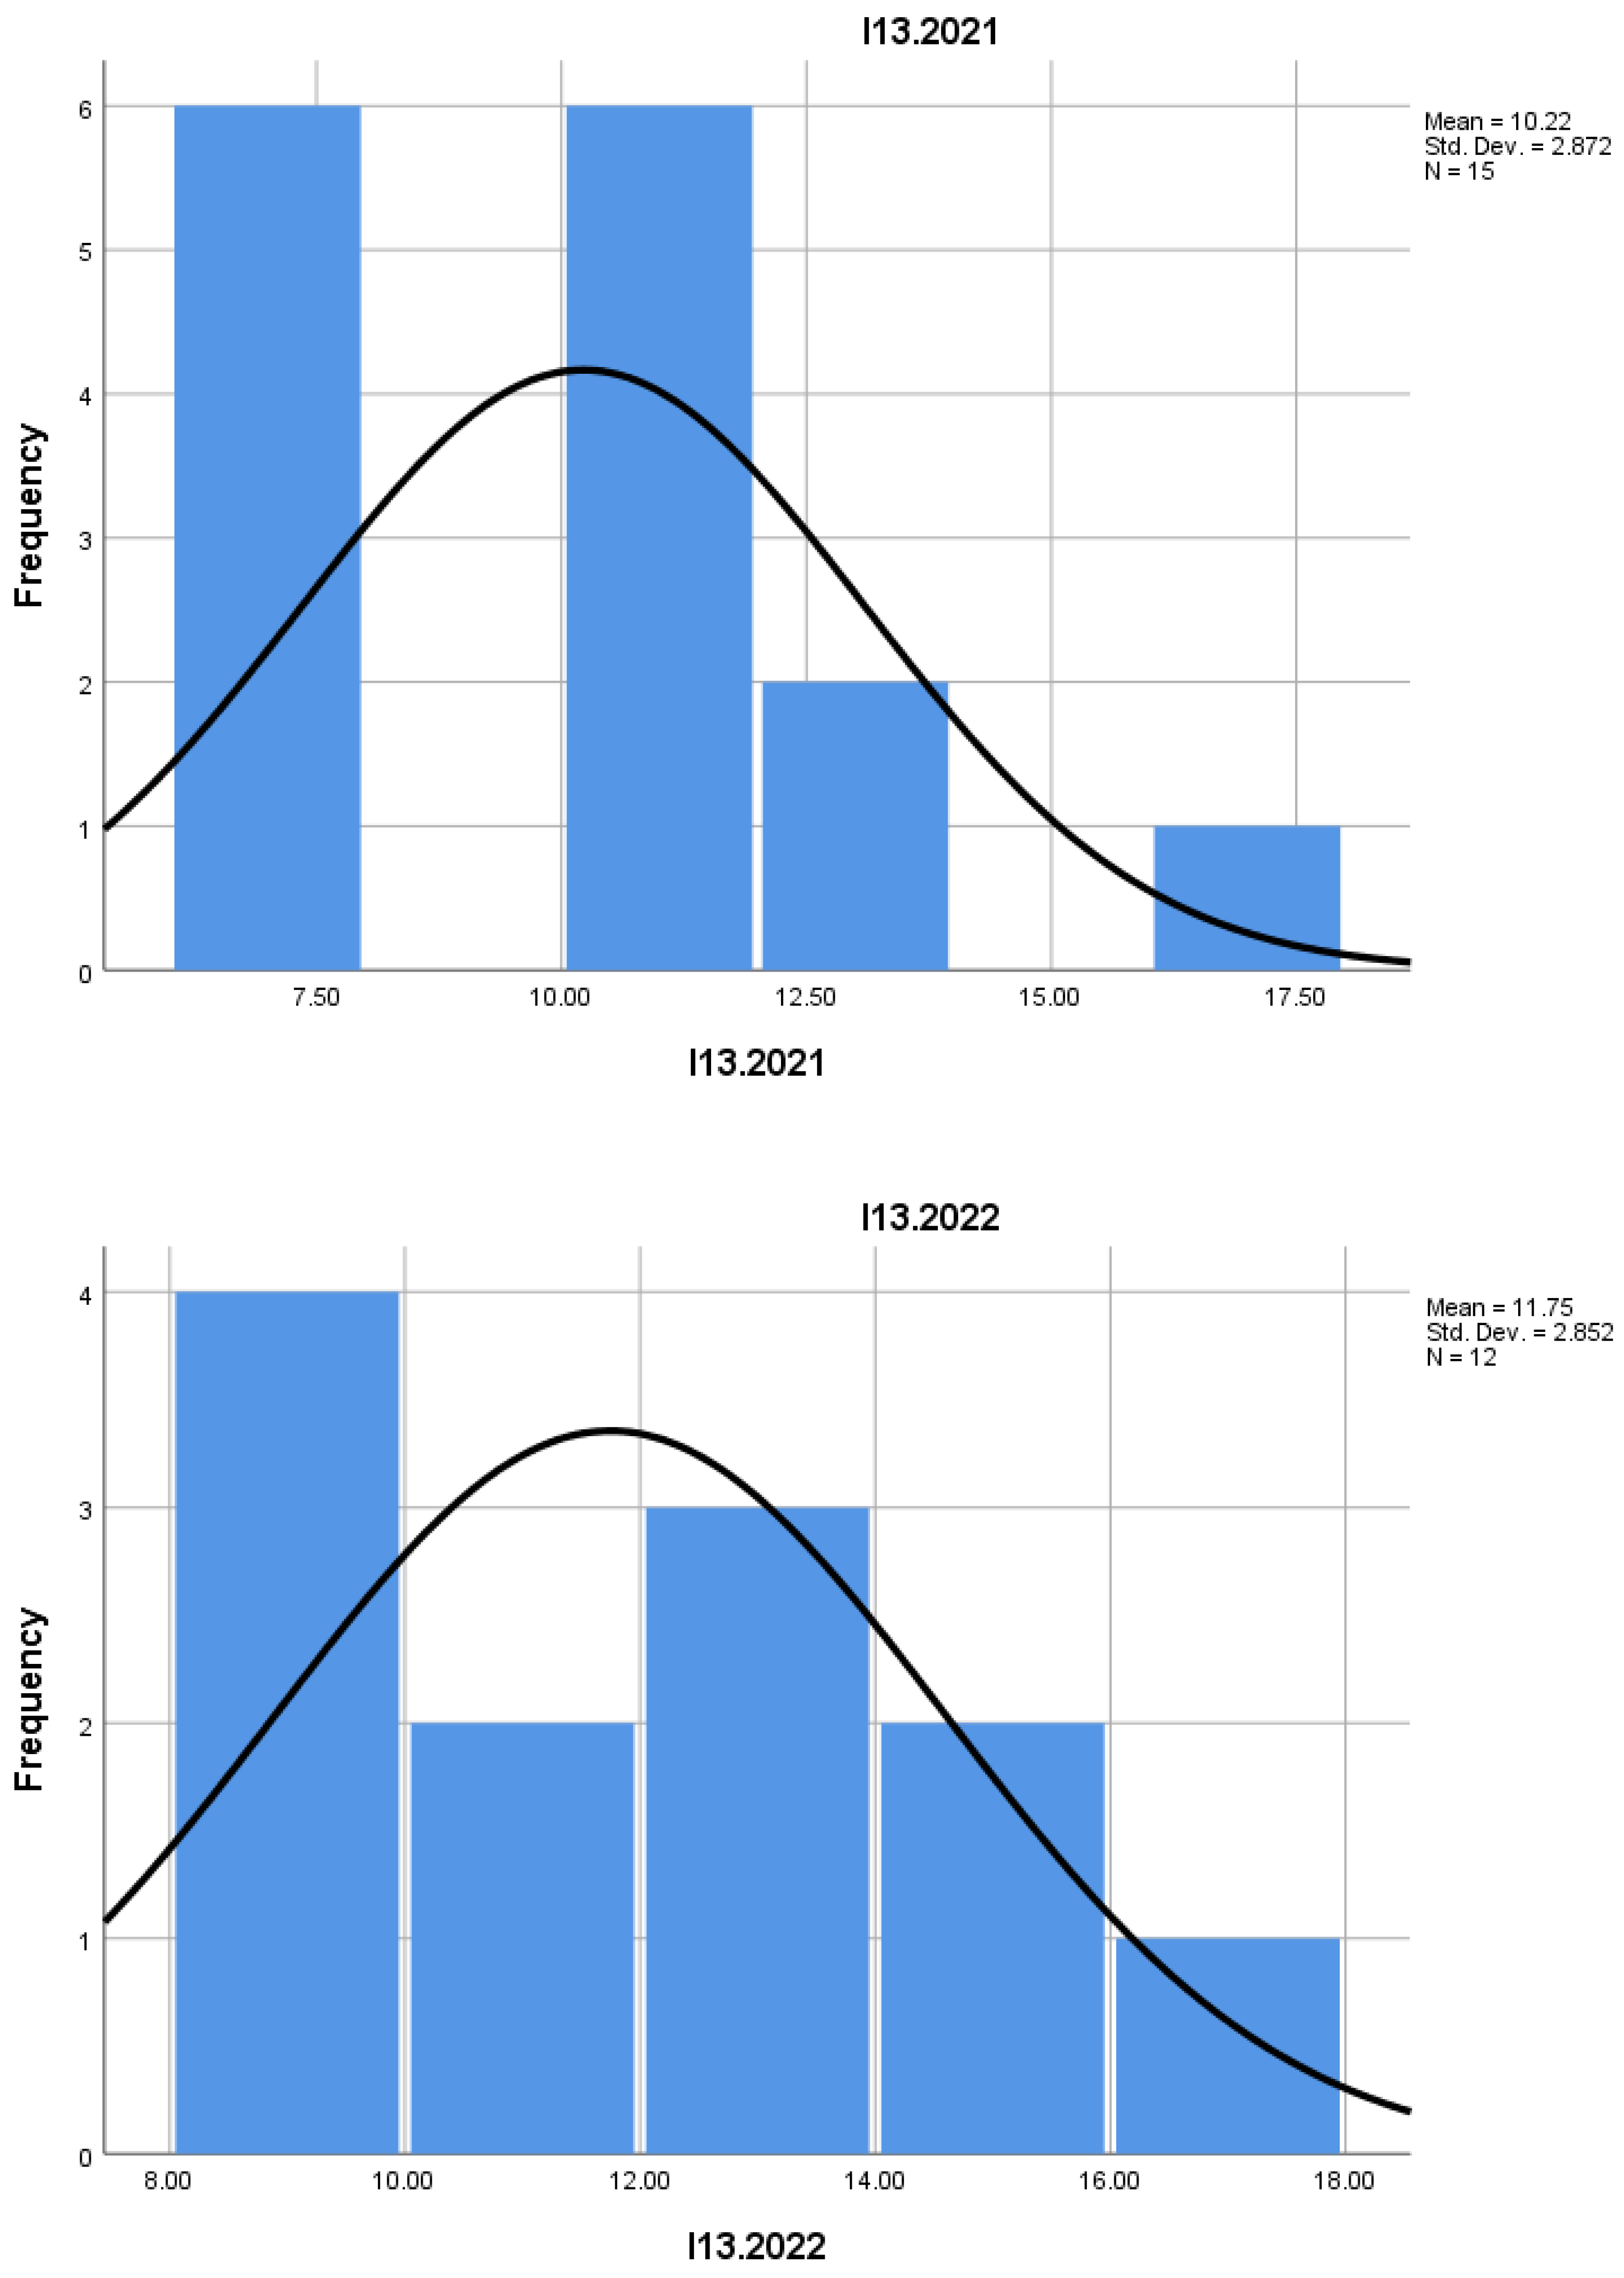
I13: Constant values indicate uniform behavior of enterprises with respect to this indicator, without notable variations between years. The complete stability of the data suggests a predictable framework or a lack of evolution in the measured direction.
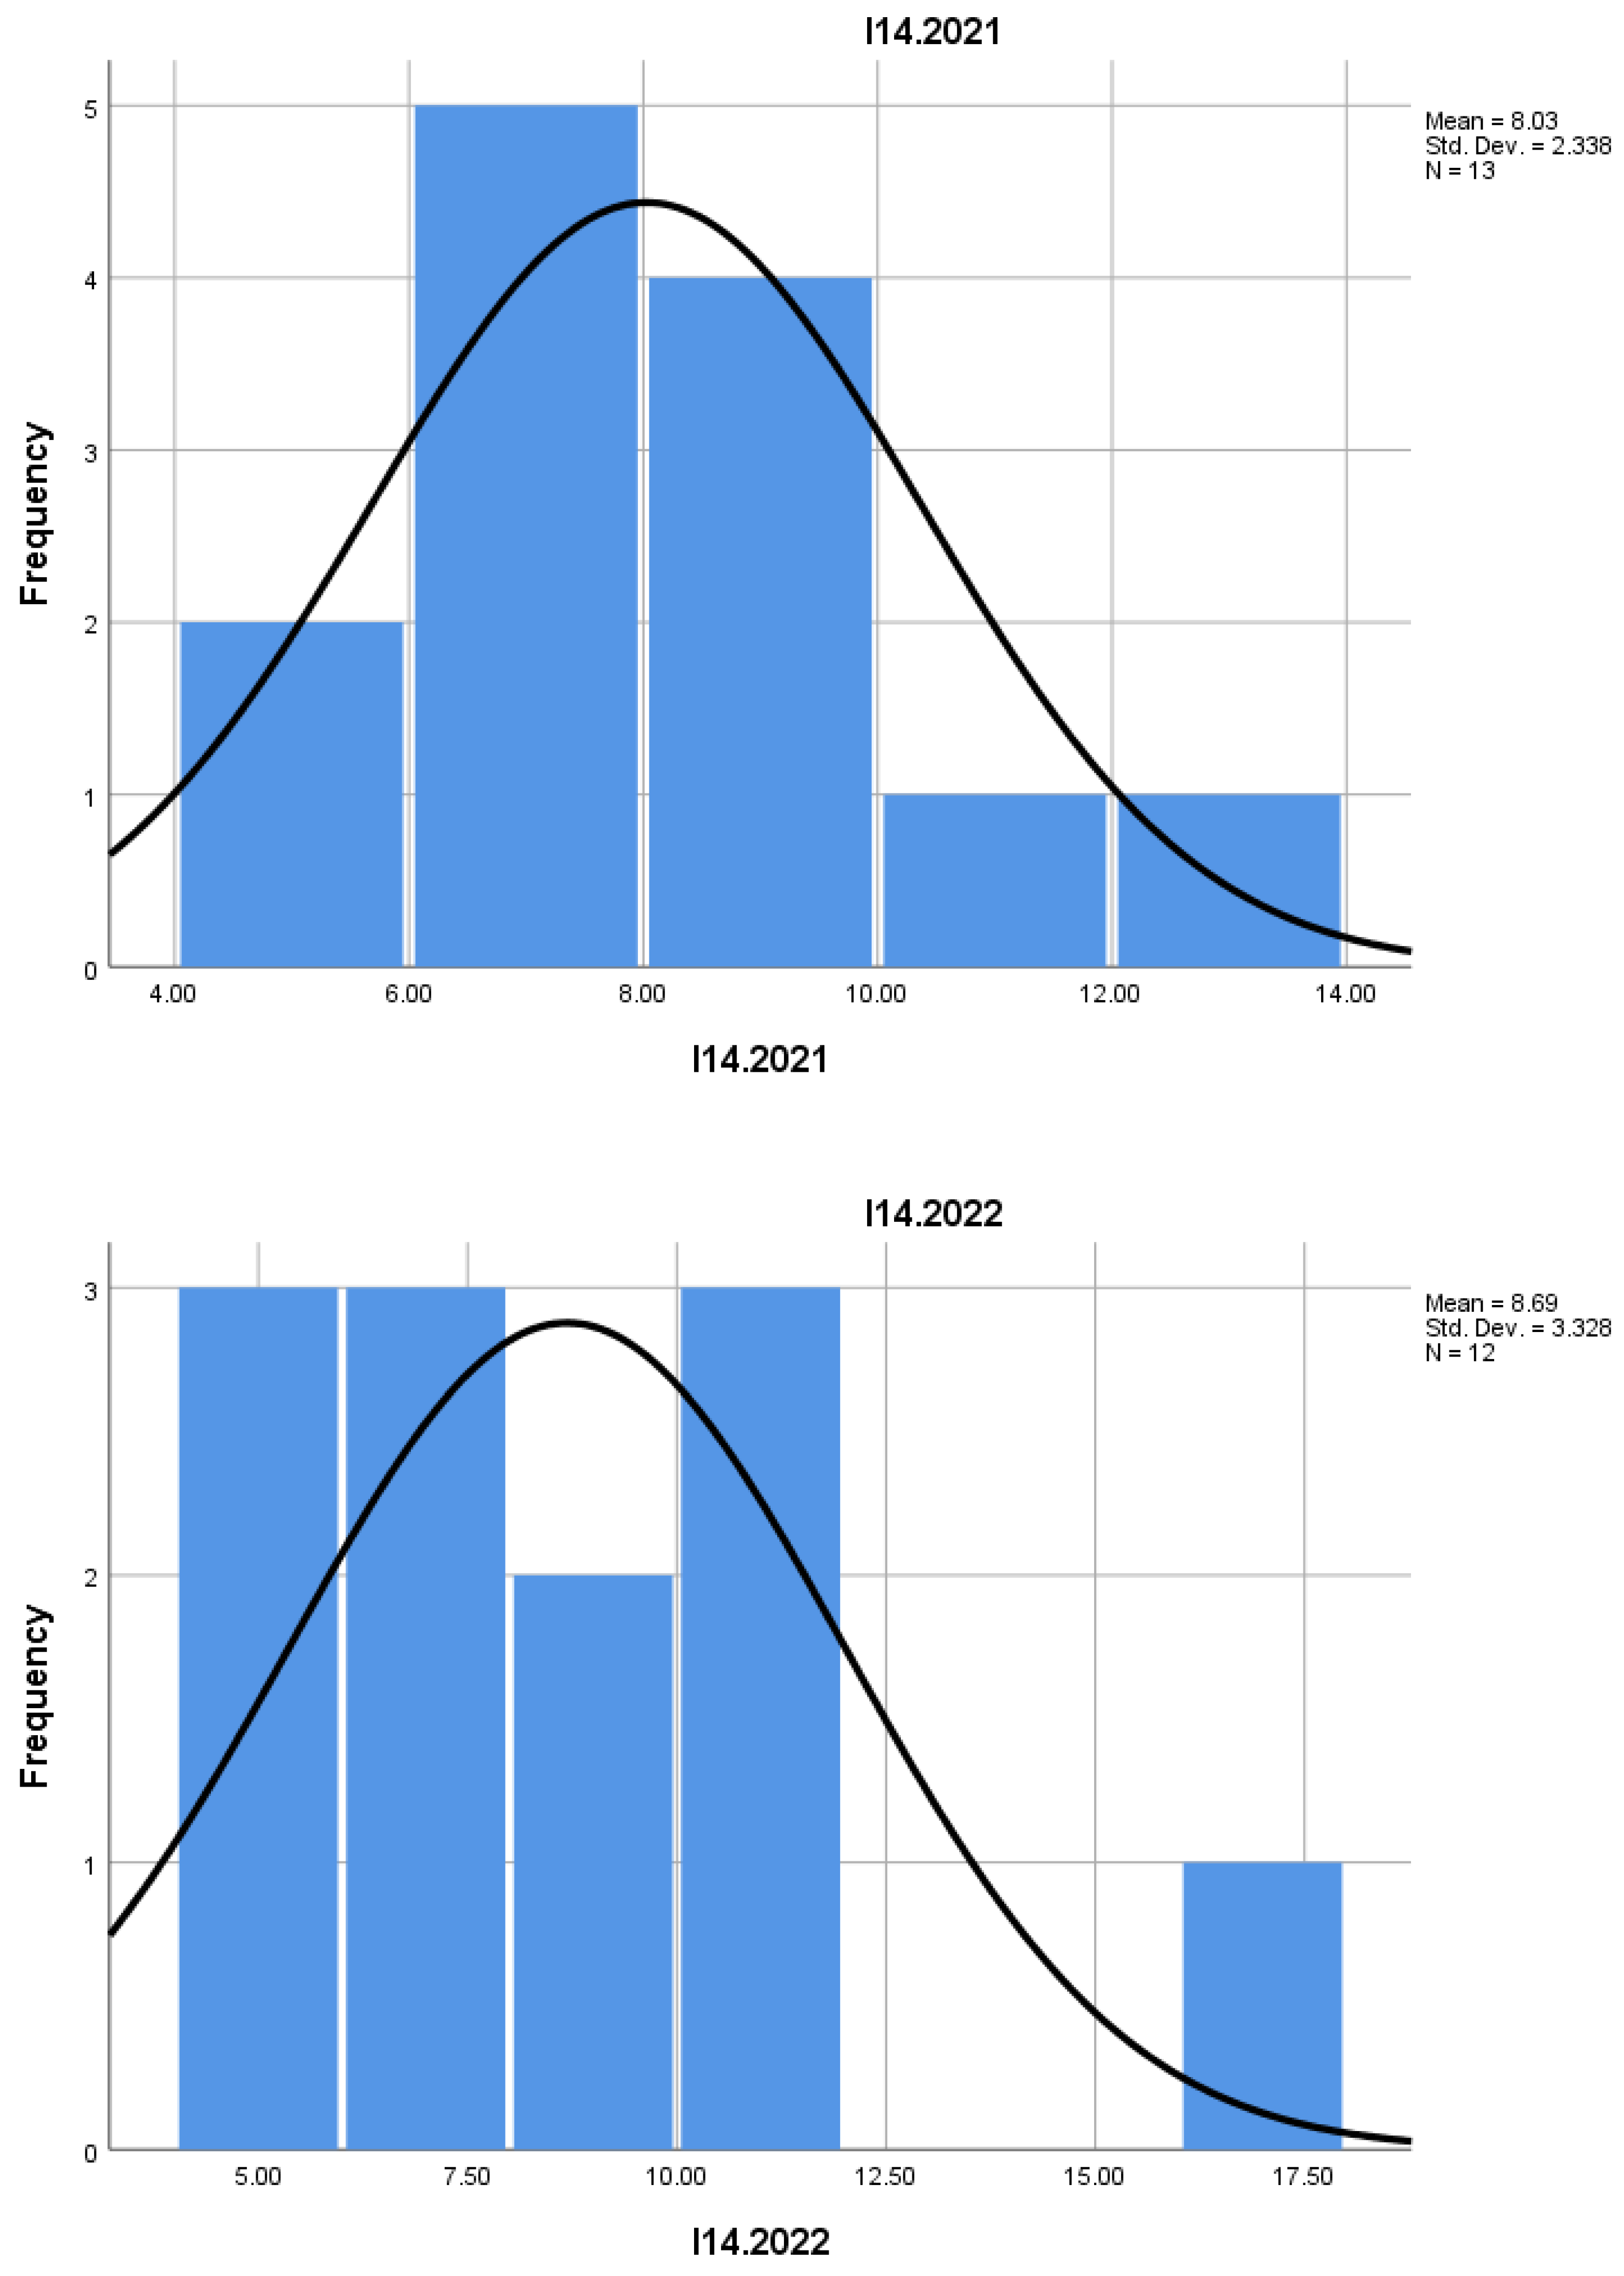
I14: Even in the case of this indicator, constant values express a lack of diversity or change among enterprises. This uniformity may be a sign of structural maturity or stagnation in innovation.
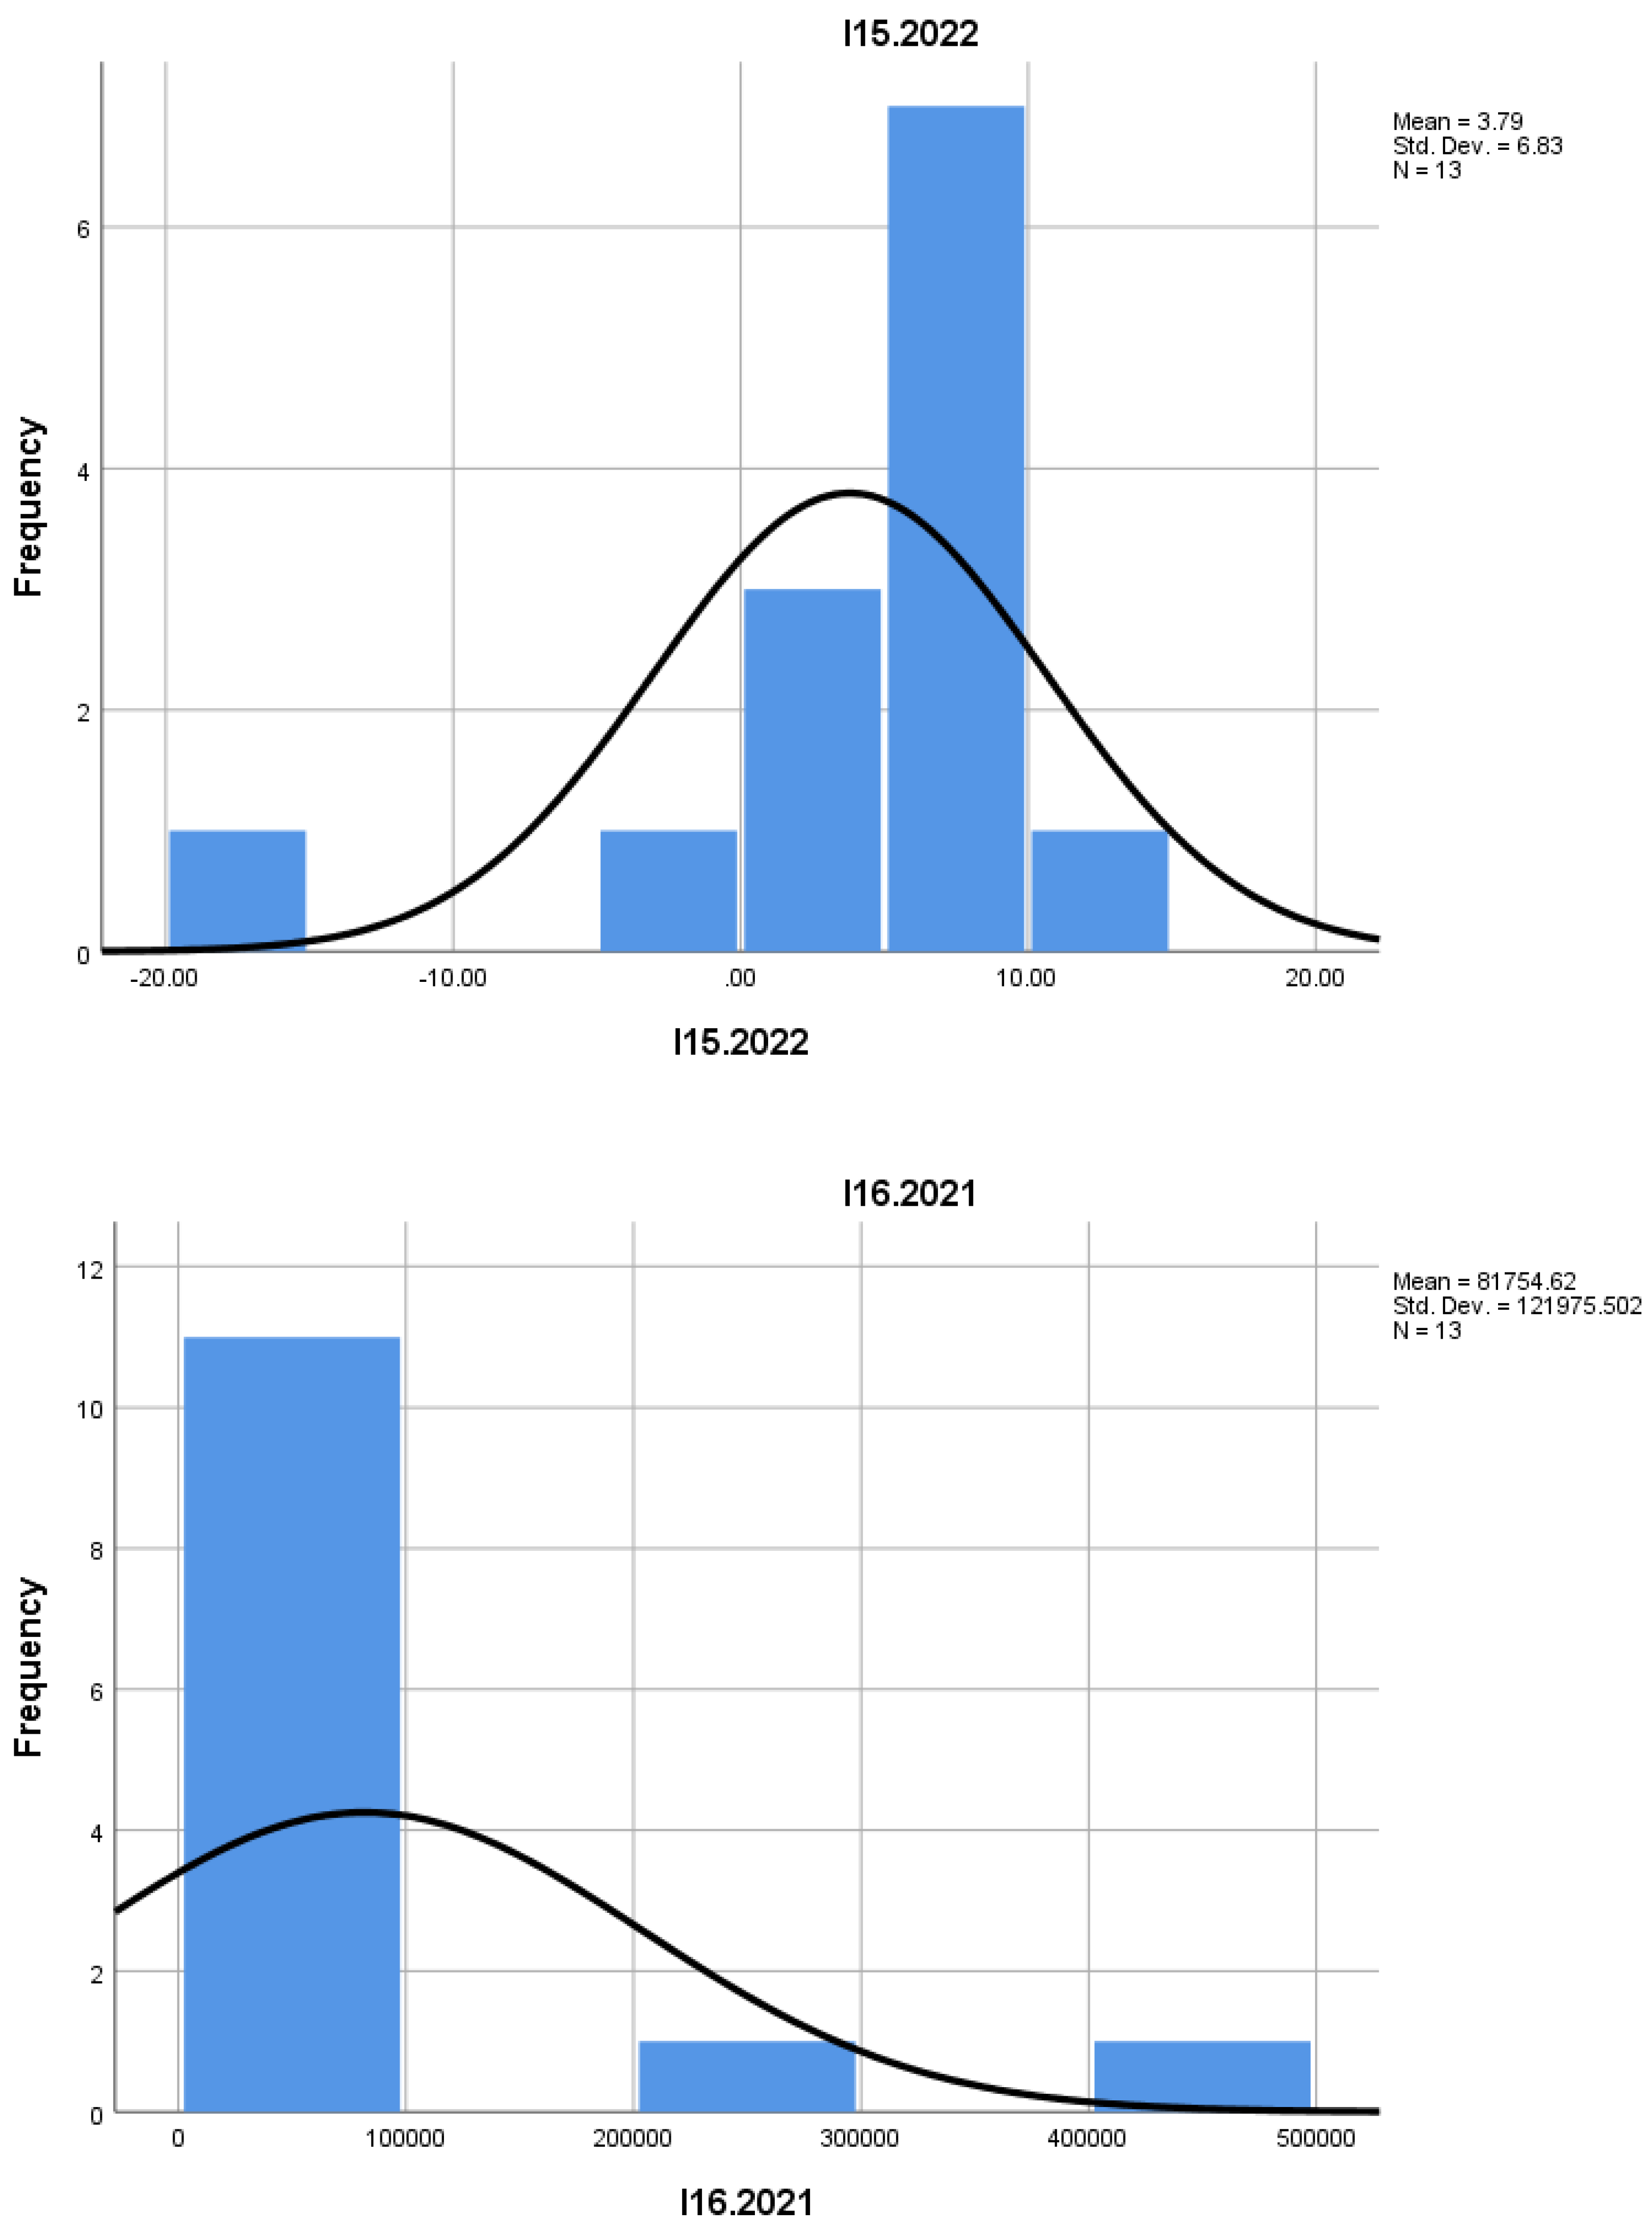
I15: The value distribution denotes a large disparity between enterprises, with a small number of very high-performing entities. Positive skewness and high kurtosis indicate the presence of performance peaks that pull the average upwards.
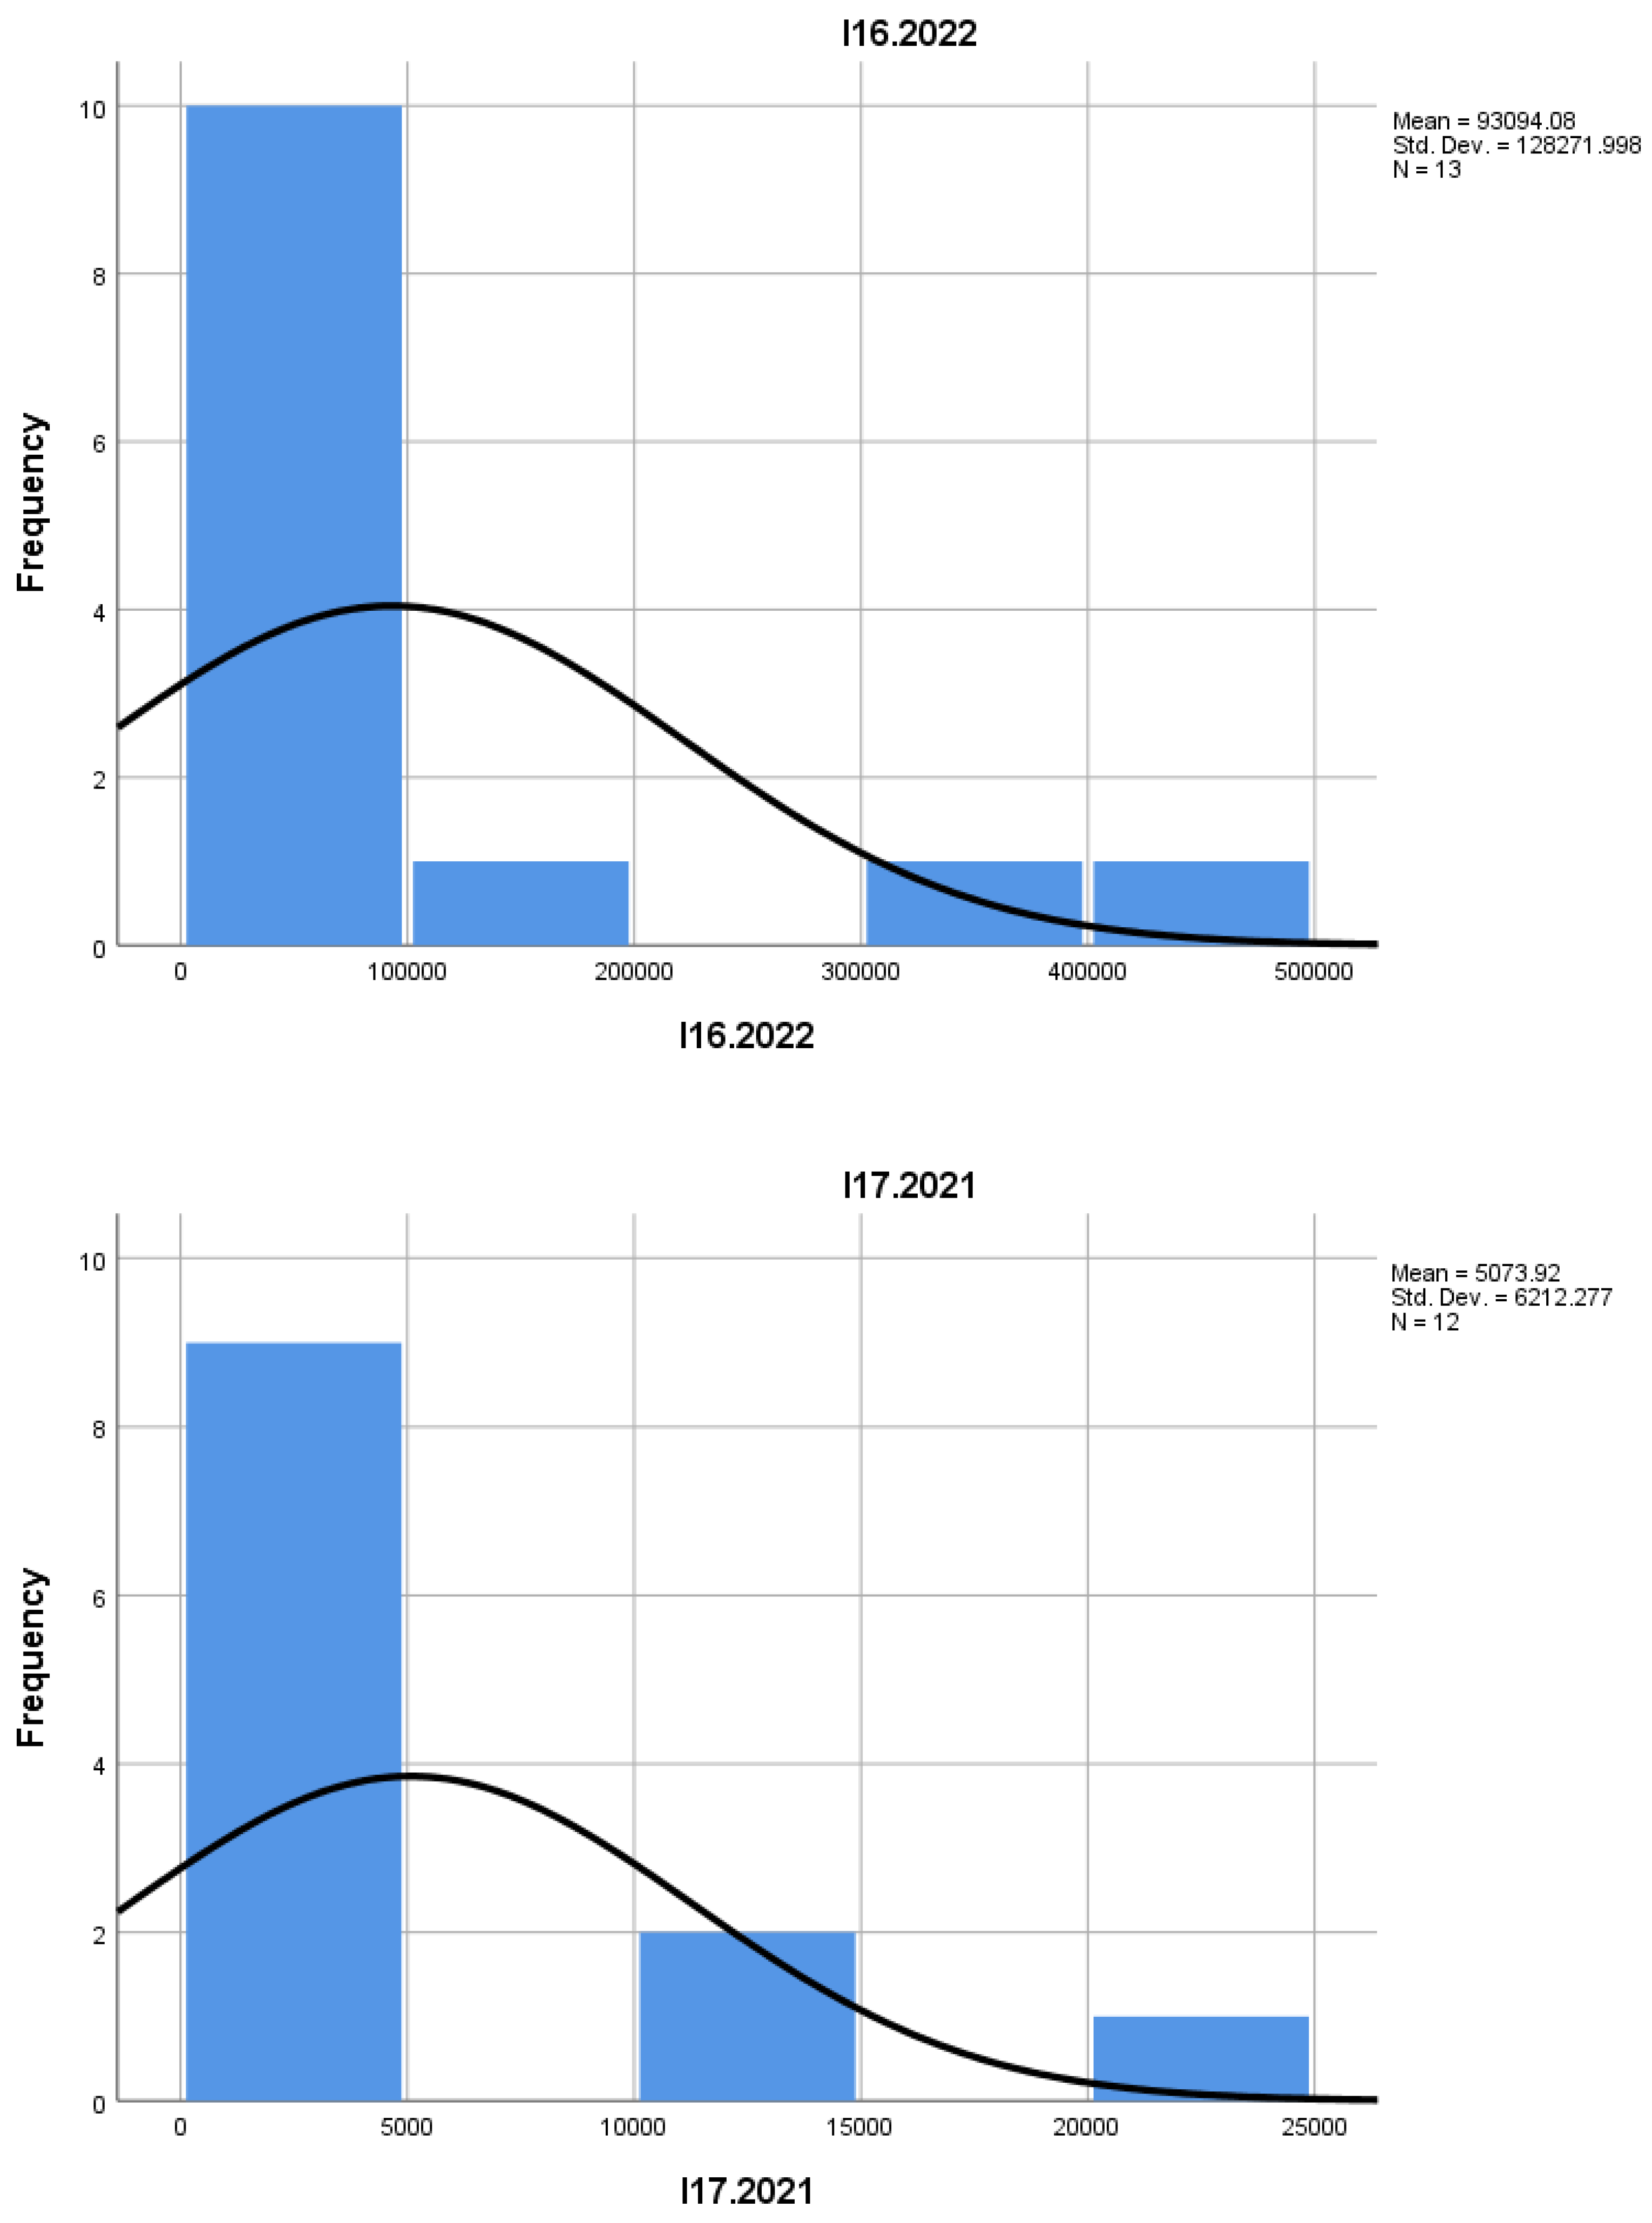
I16: This indicator shows an overall increase but also a very high variability between entities, suggesting an imbalanced market. Pressure is likely being exerted by a few large enterprises that significantly influence the overall average.
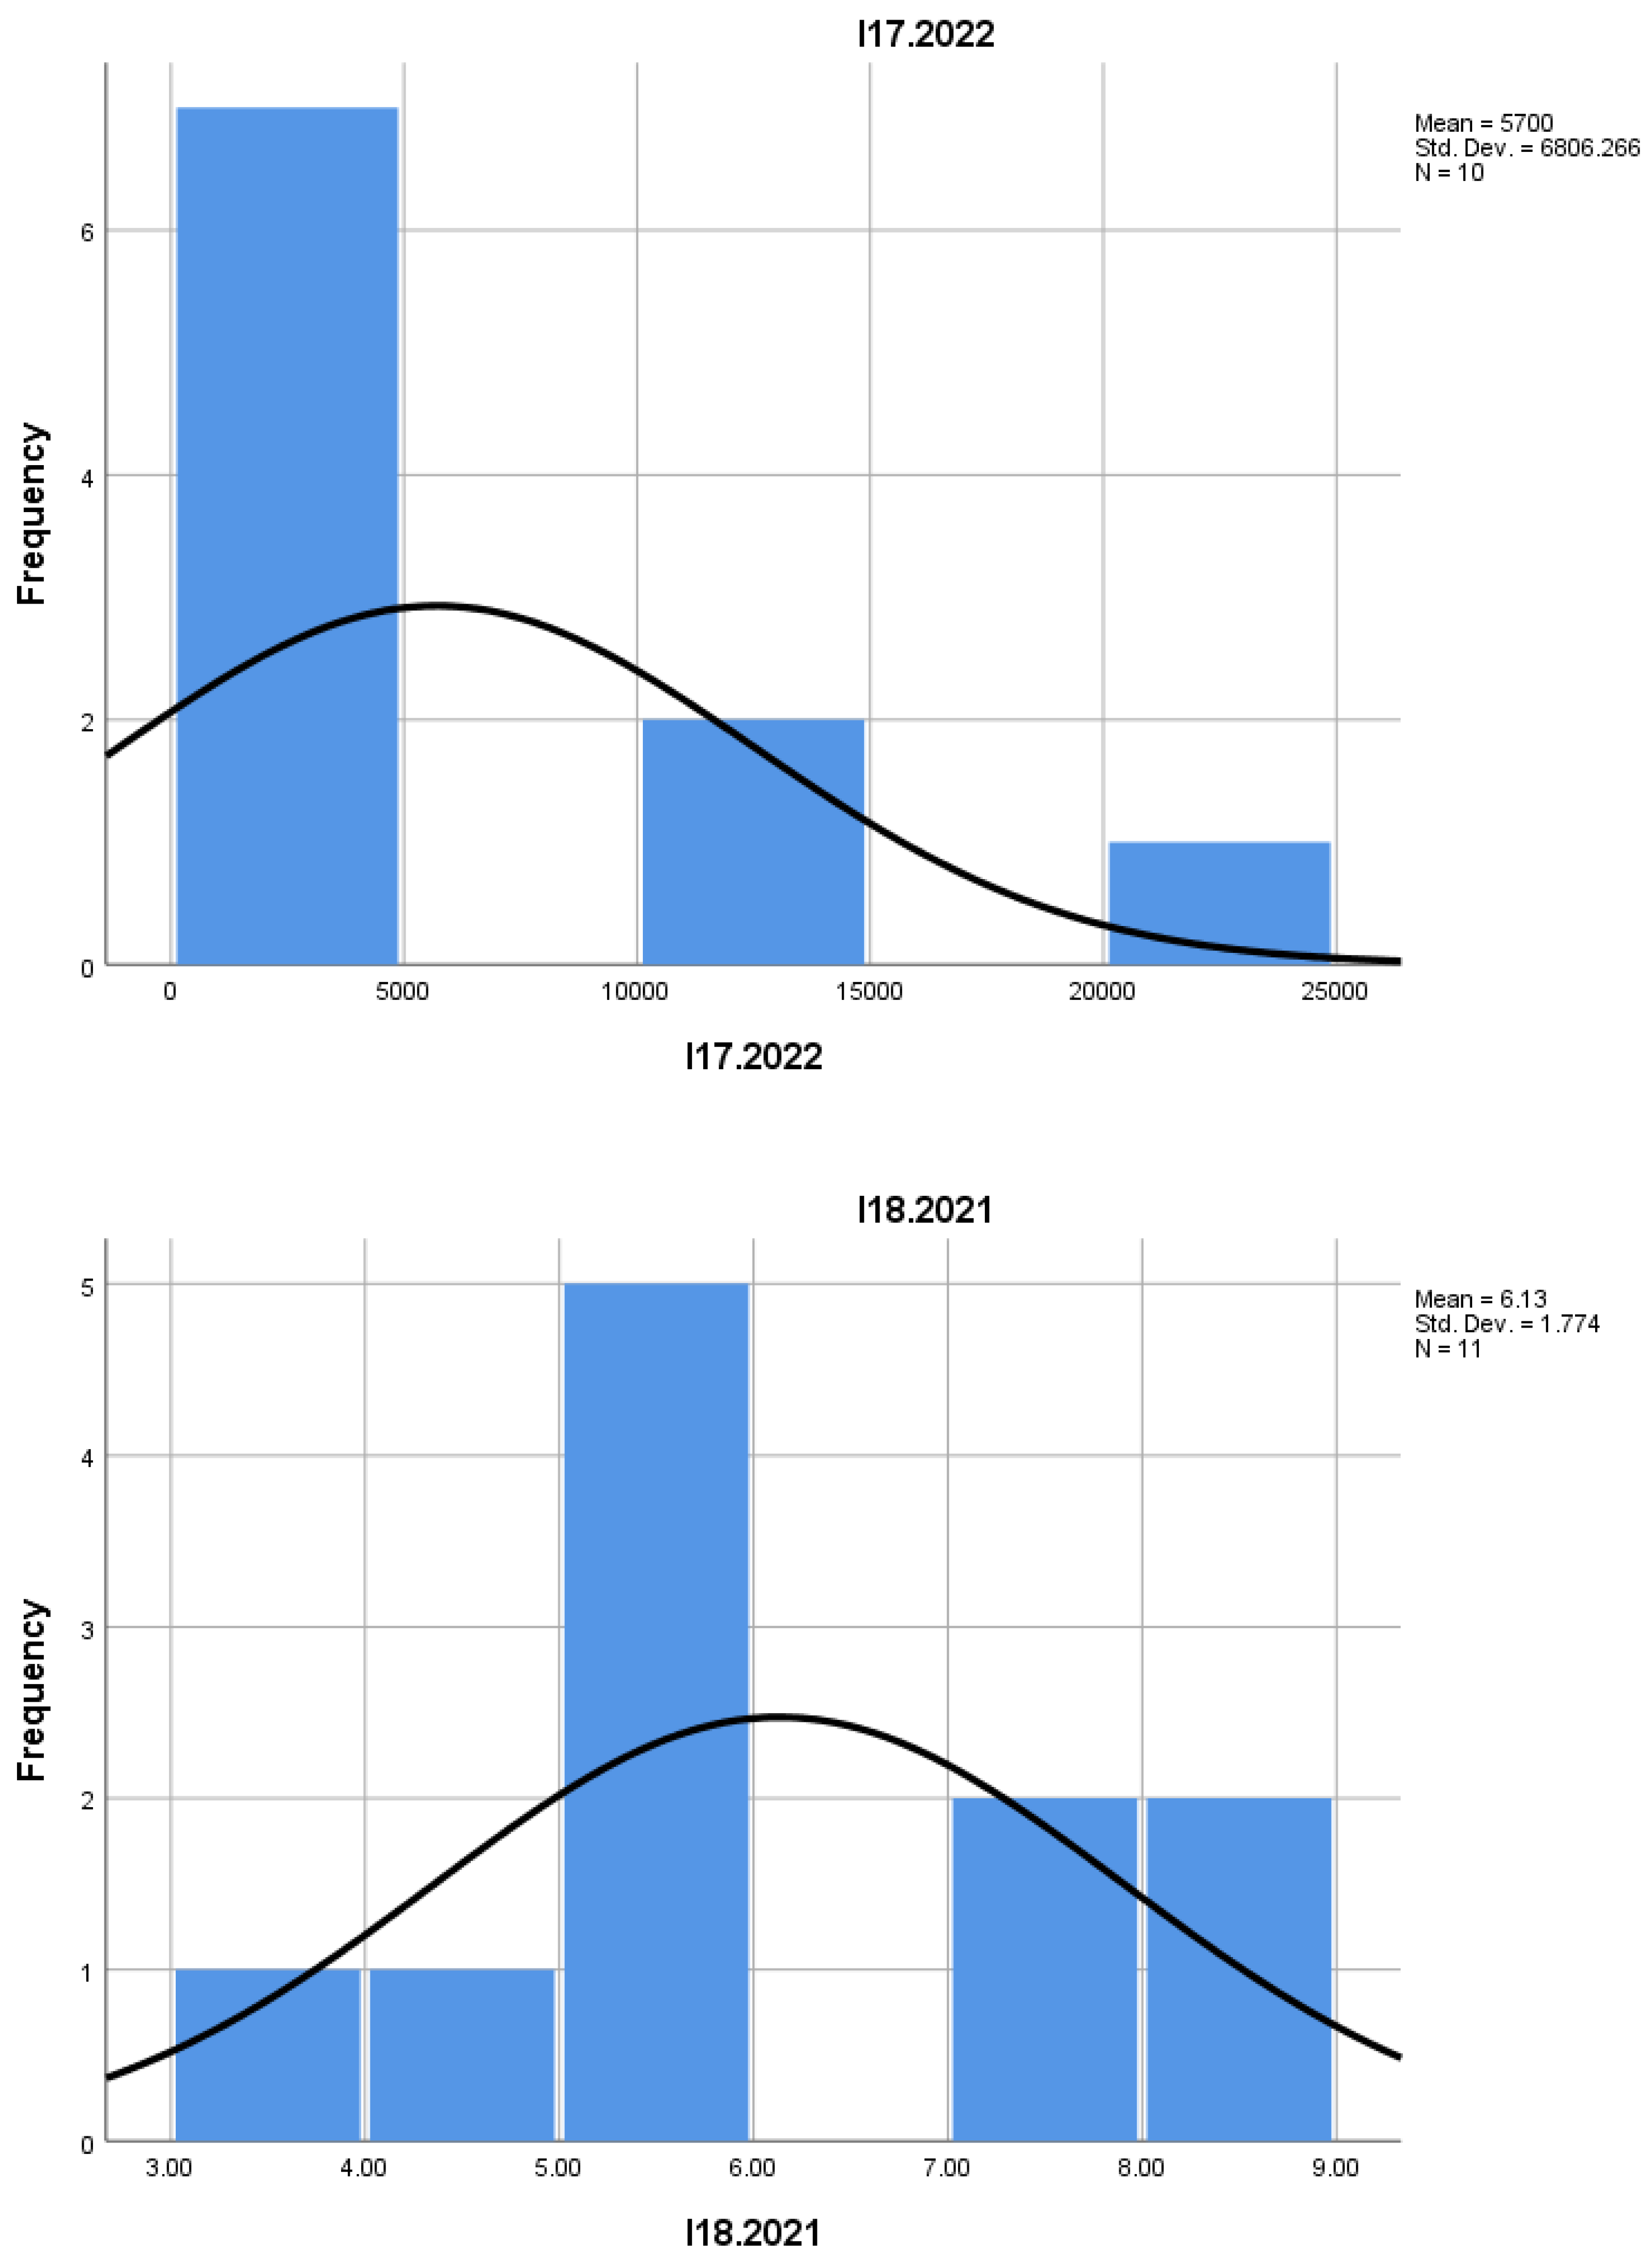
I17: Although the average increases, the distribution remains imbalanced, signaling a sector in which only some firms manage to advance consistently. The high level of skewness indicates the existence of extremes, making it difficult to formulate general policies applicable to all.
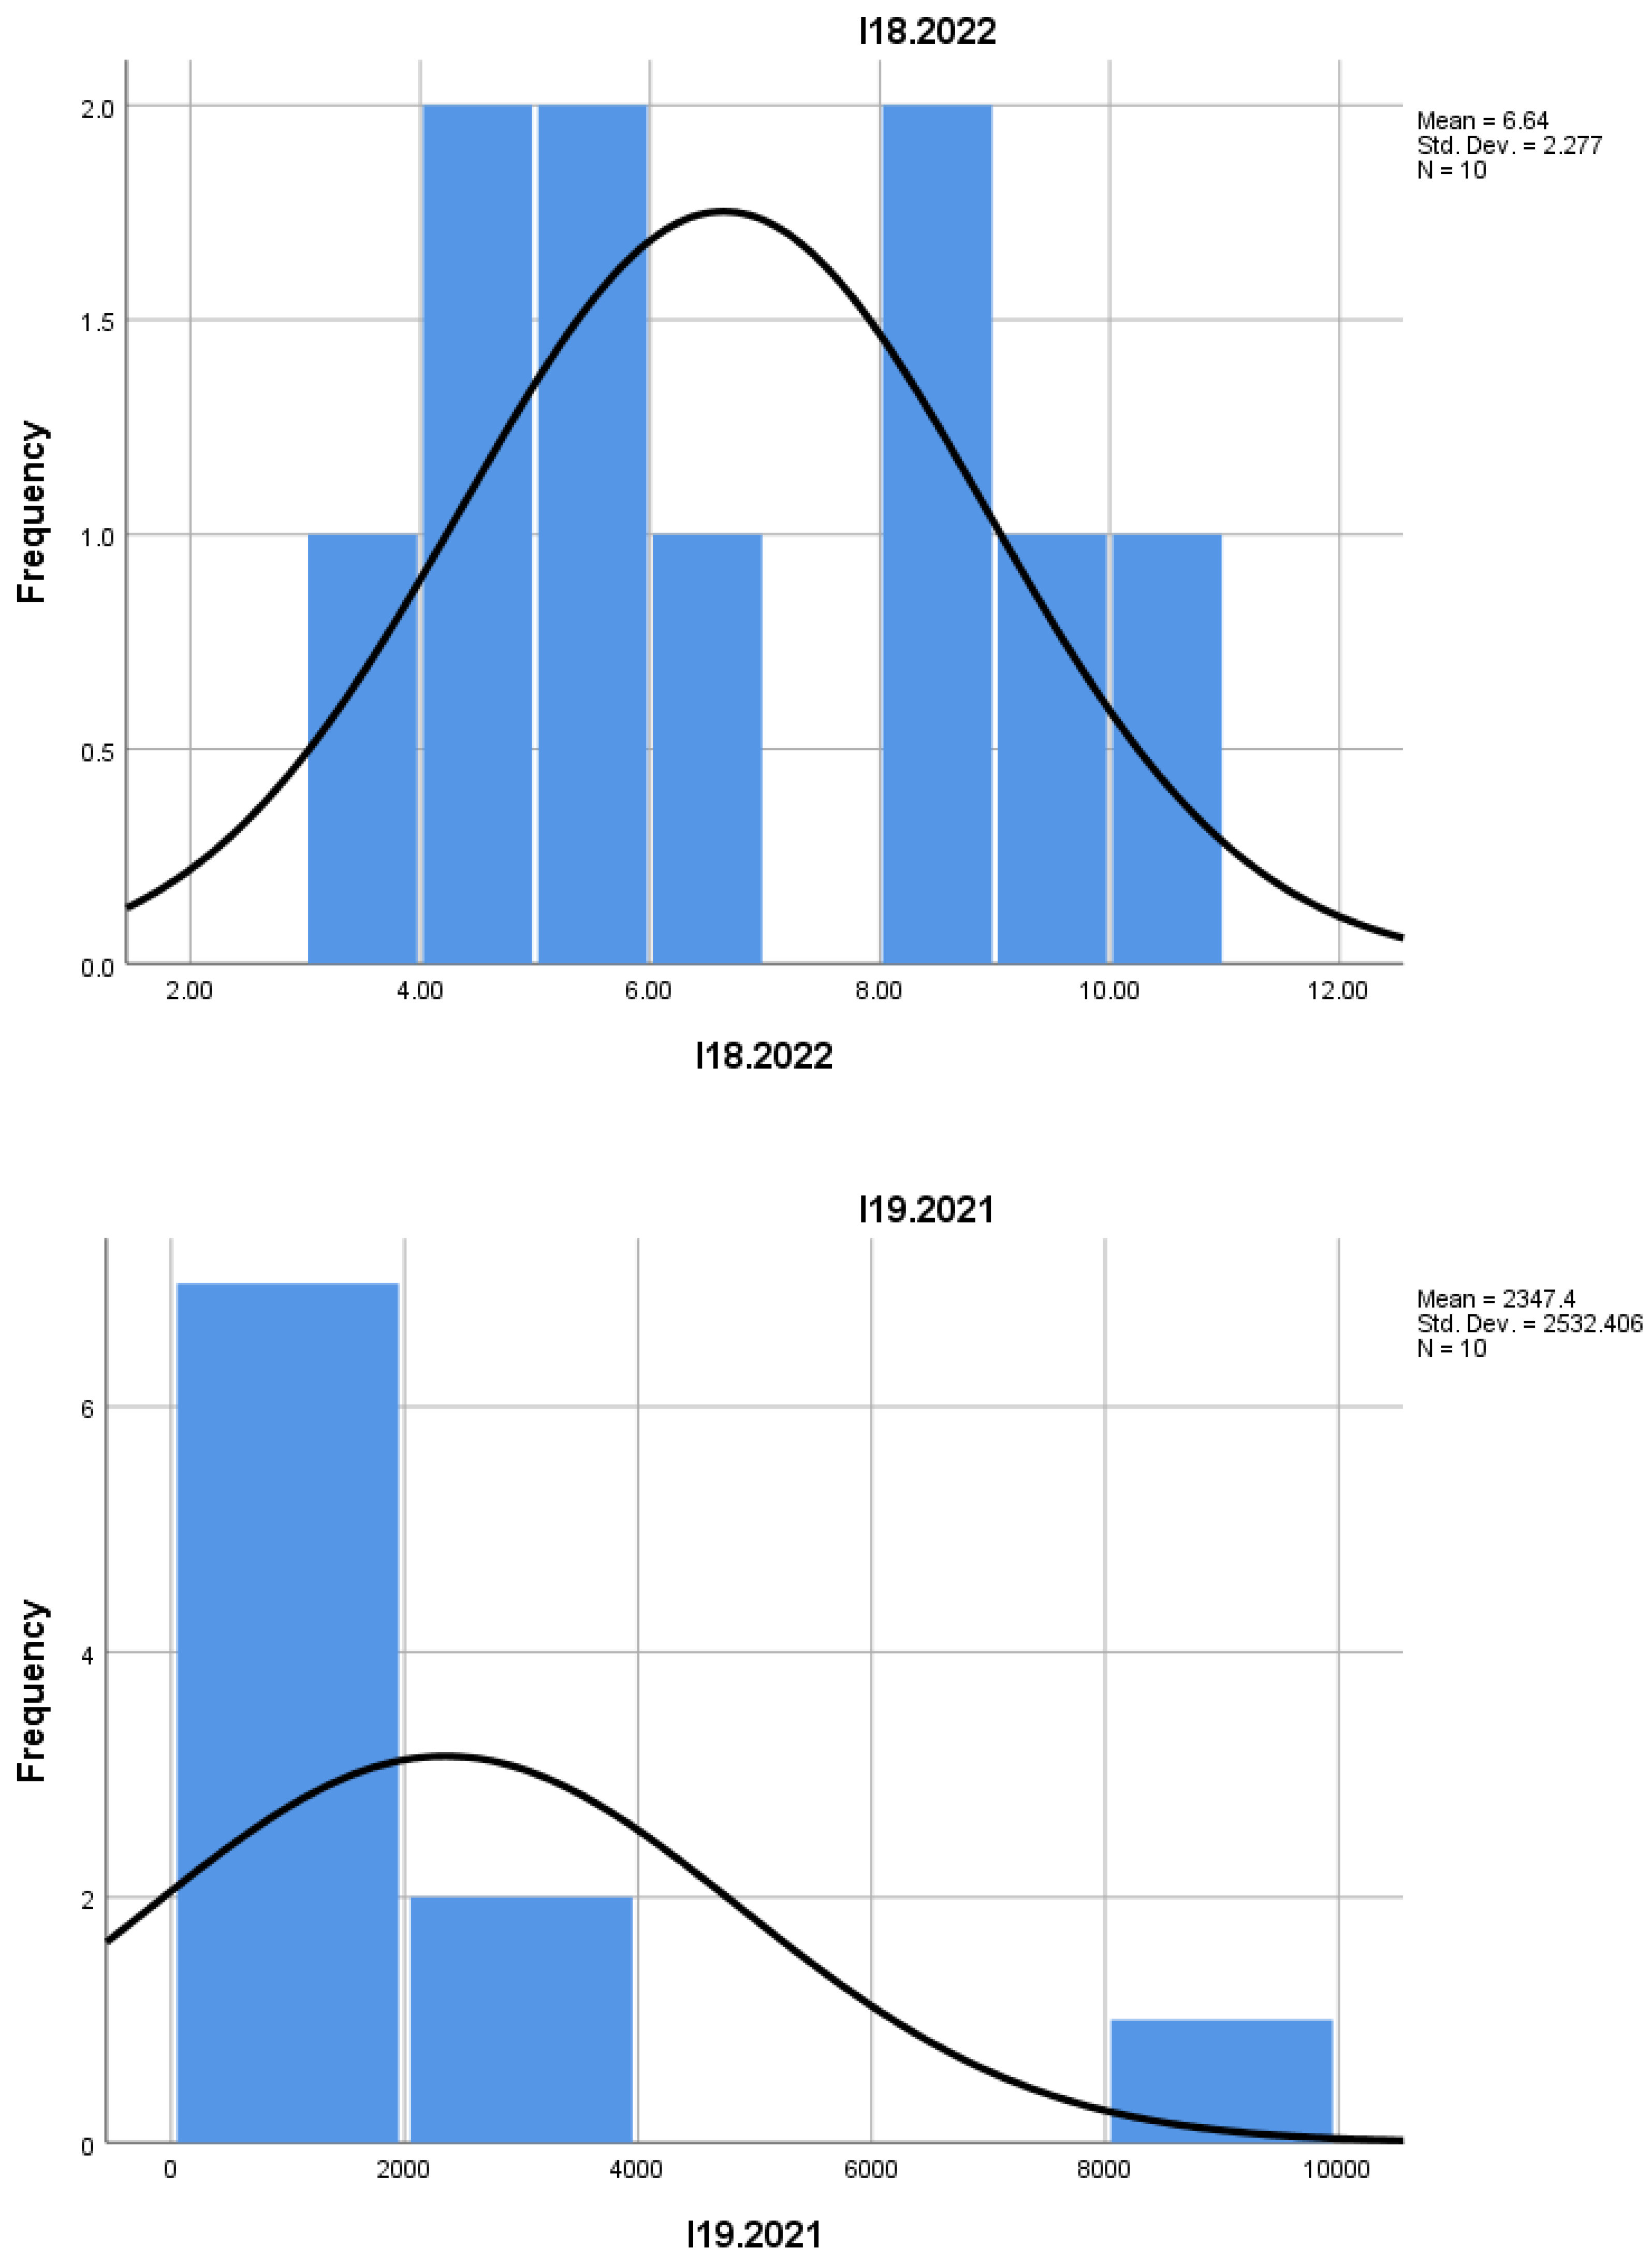
I18: The increase in the average suggests a positive evolution in the involvement or activity of mountain enterprises in the field. However, the high dispersion maintains uncertainty regarding long-term stability.
I19: The values signal significant expansion, but at the same time, an intensification of inequalities between enterprises. The pronounced skewness indicates the presence of entities with spectacular growths, which do not reflect the general trend of the sector.
Overall, for indicators I10-I19, a moderate increase in the number of enterprises and employees in the mountain art and entertainment sector is observed, with slightly higher employment values in 2022 compared to 2021. There is considerable volatility in the growth and closure of enterprises (birth and death rates), with significant fluctuations in the number of people employed by these enterprises.
Although some high-growth enterprises exist, most remain small and fail to reach sustained long-term growth thresholds.
I20: The values indicate a slight decrease in the average, which may signal lower efficiency or a limitation in growth capacity for some firms. The extremely asymmetric distribution and high kurtosis suggest the presence of enterprises with performance significantly different from the rest.
I21: The increase in the average reflects a positive development among some enterprises, possibly in the direction of innovation or business expansion. However, the strong skewness and high dispersion confirm the existence of a pronounced polarization within the sector.
I22: The indicator remains at a low level, suggesting that this type of activity or characteristic is underrepresented in the sector. However, the extreme values and high skewness indicate the presence of notable exceptions, likely niche enterprises with an innovative profile.
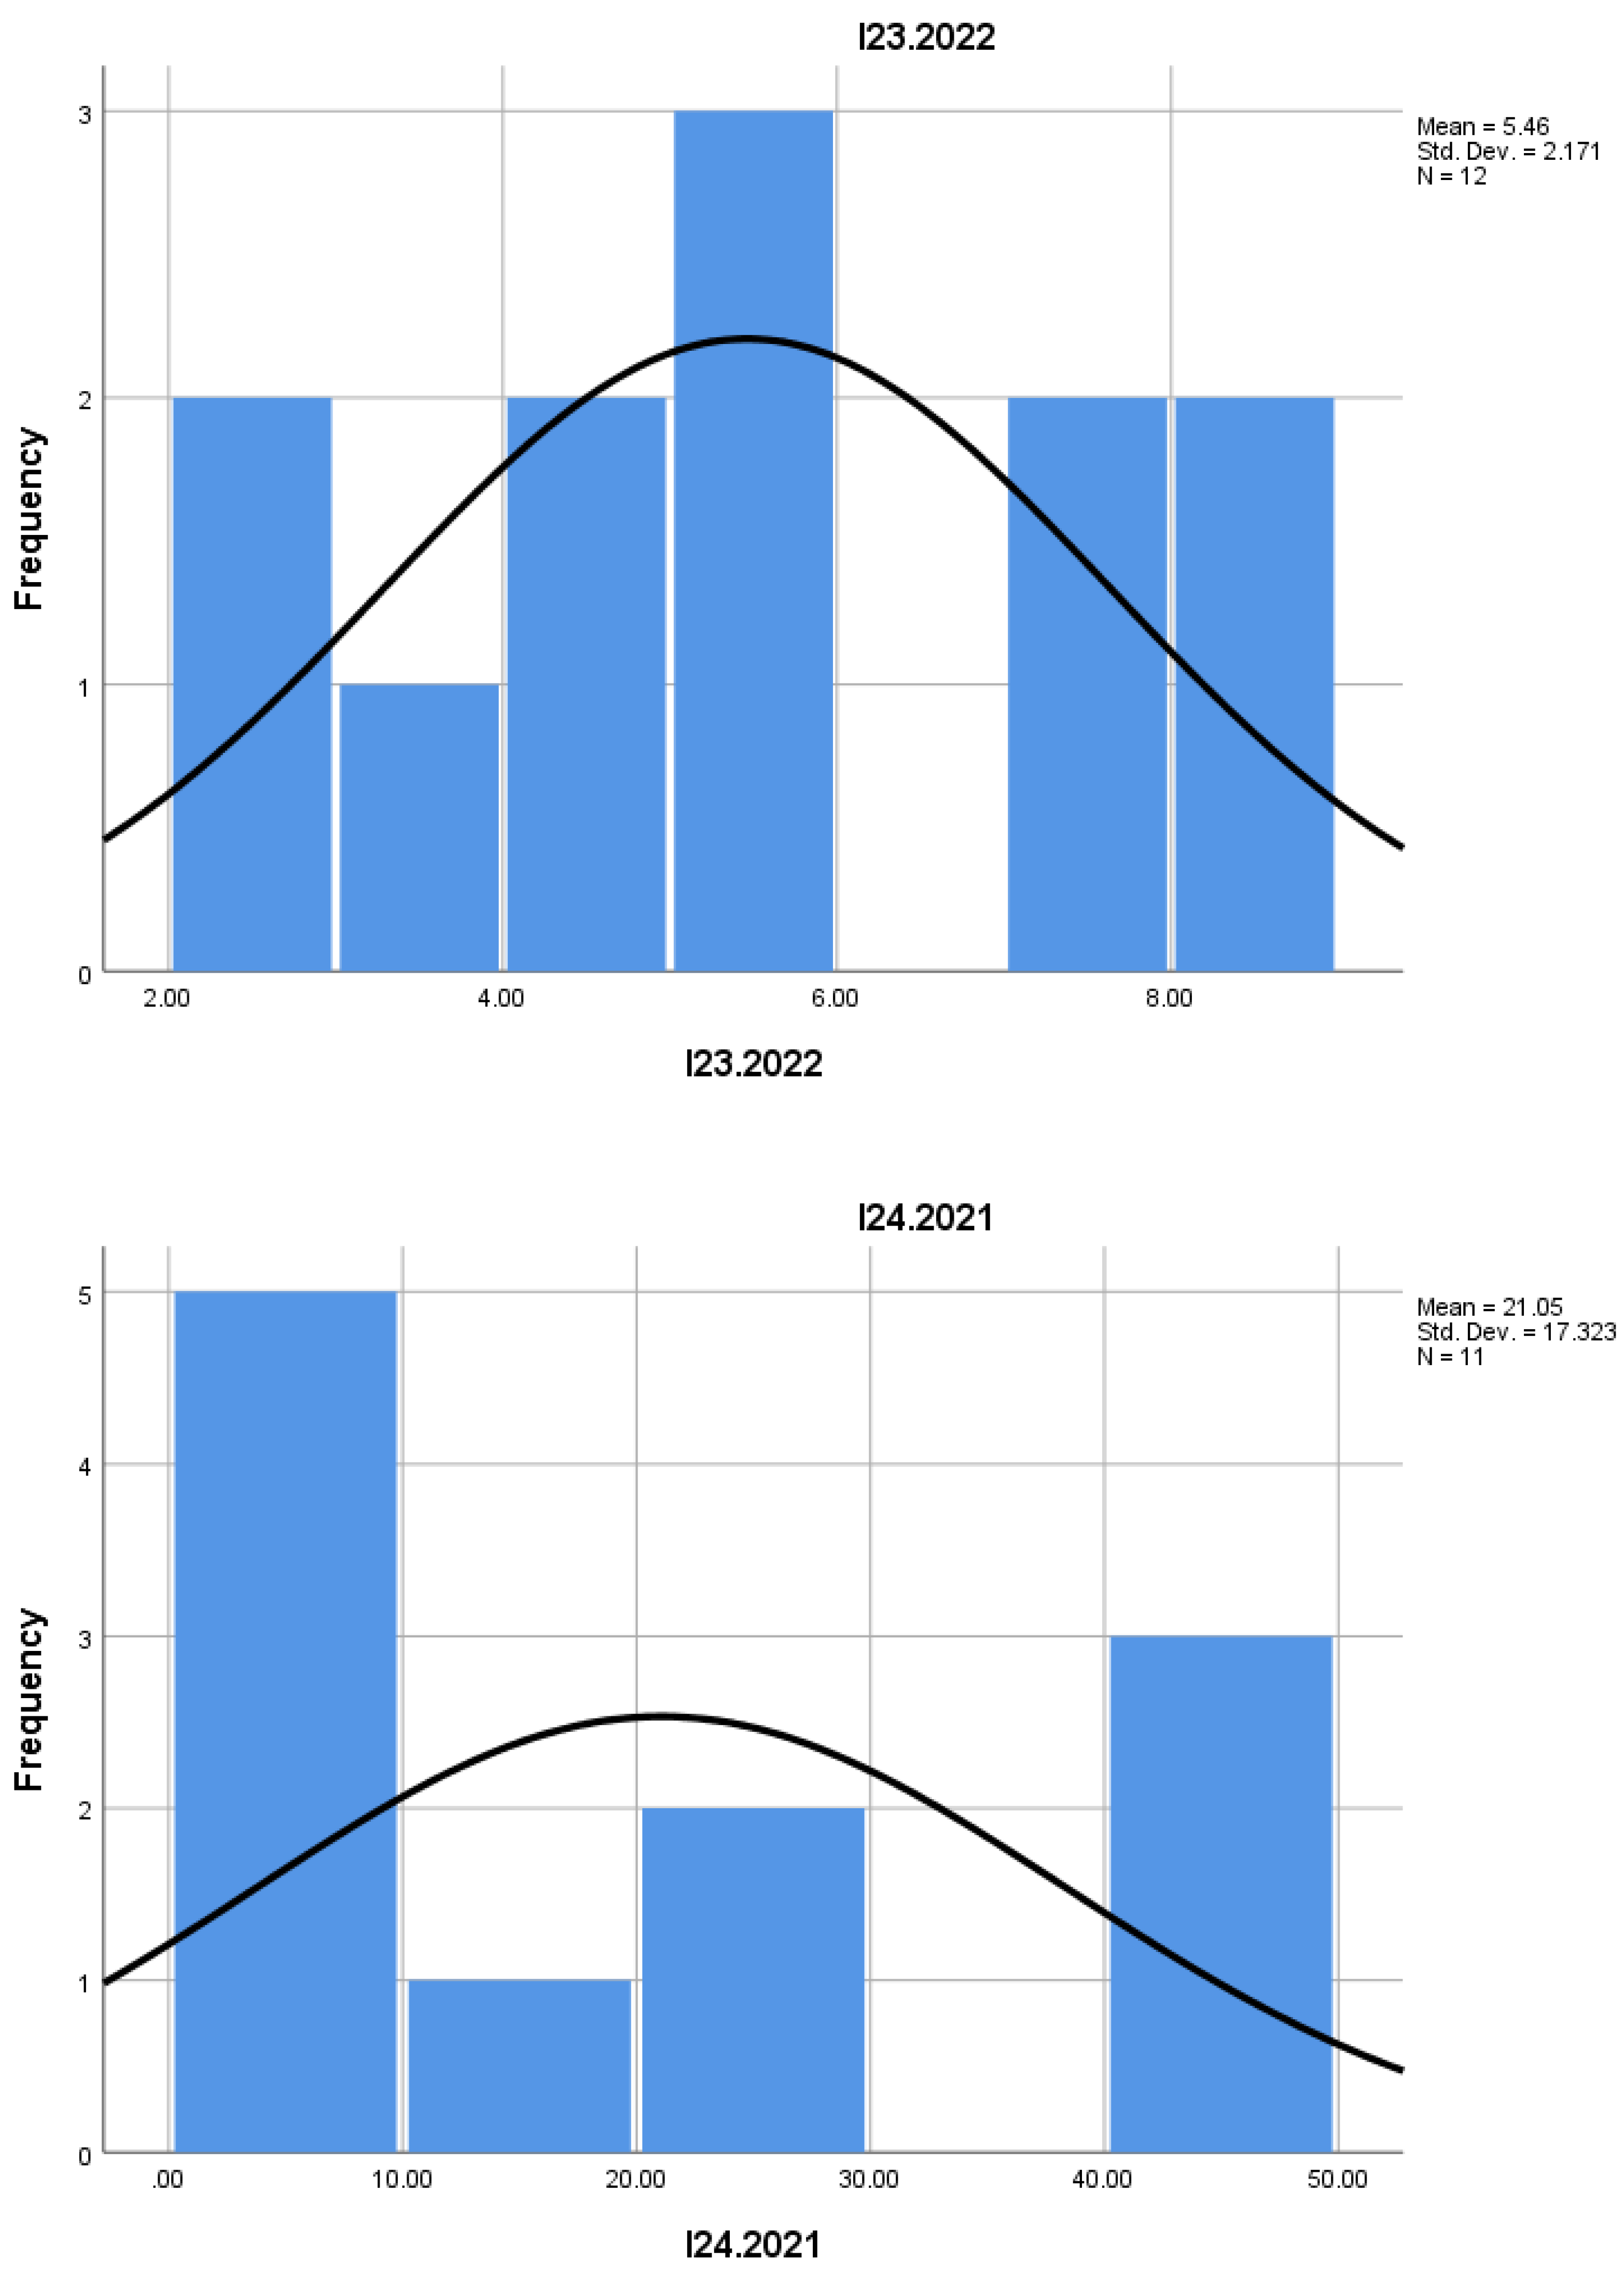
I23: The slight decrease in the average may signal a trend toward standardization or process optimization. The moderate skewness suggests that most enterprises are grouped around the lower to mid-range values.
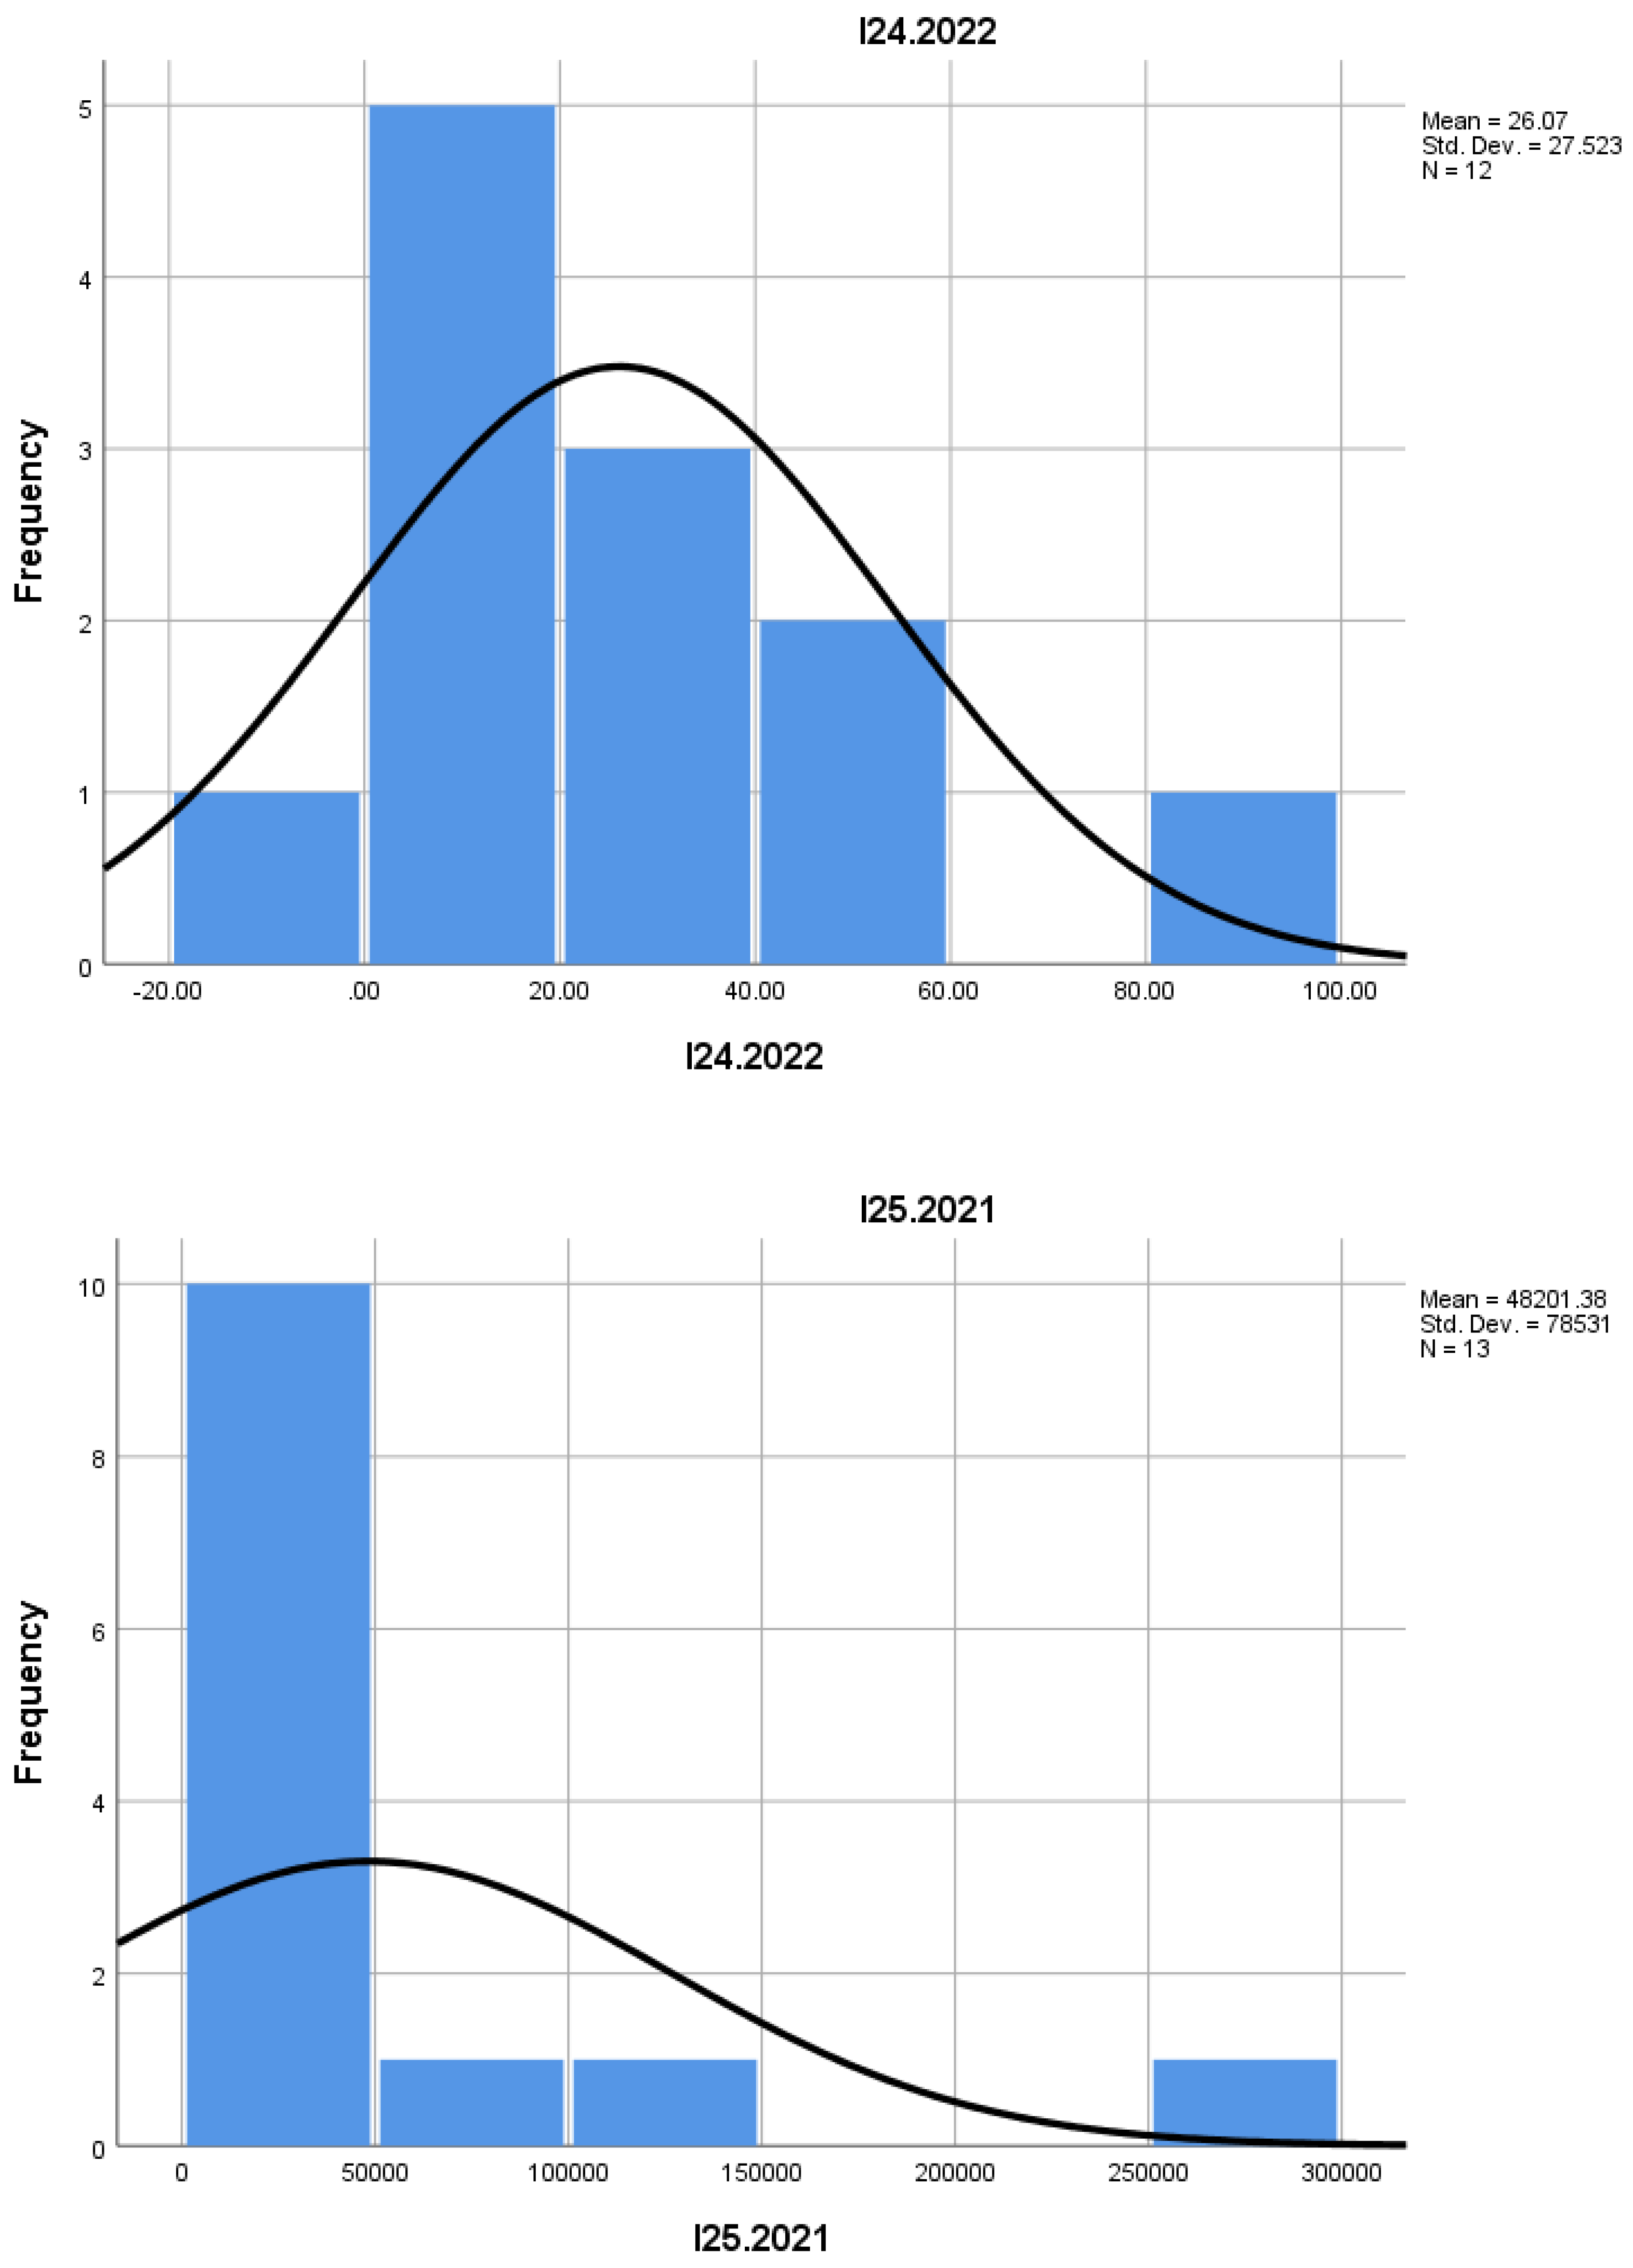
I24: The slight increase in the average and the reduction in variation suggest an overall improvement in the ability of enterprises to stay in the market. The stability of this indicator denotes a relative balance between survival and exit in the sector.
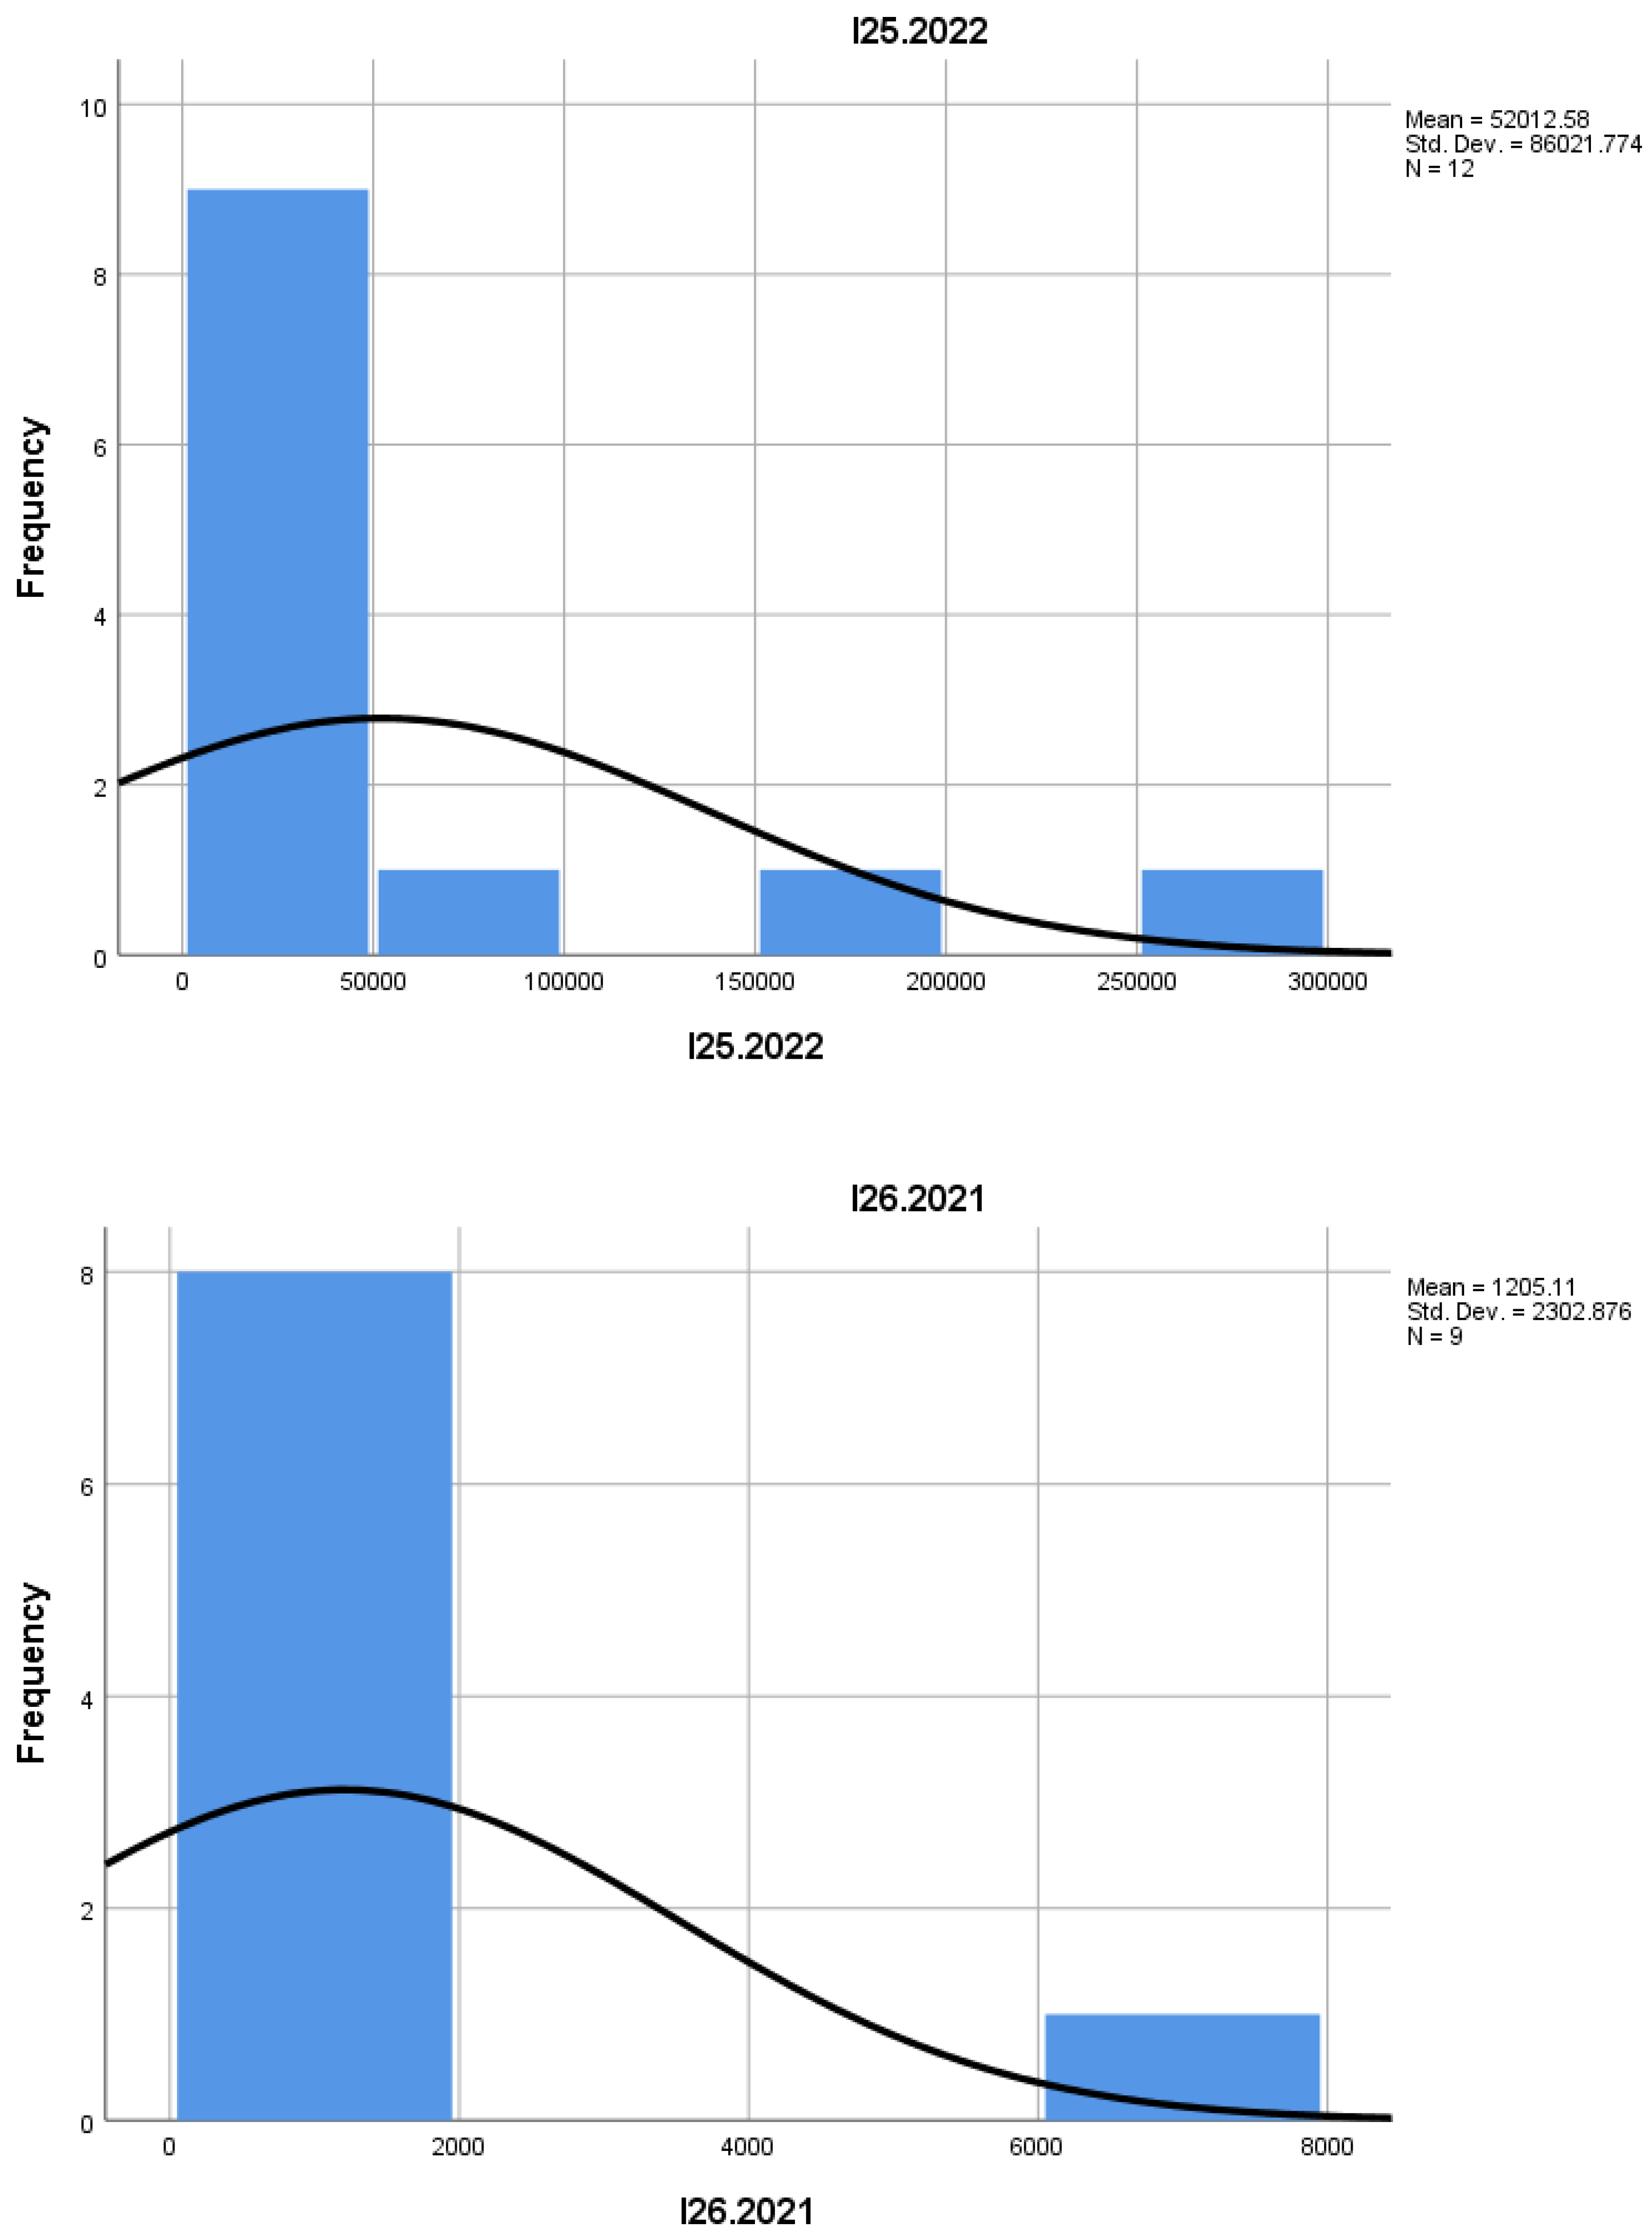
I25: A slight increase in performance is observed, along with significant dispersion between enterprises. The almost symmetric distribution, but with a slight positive skew, suggests a mild favorable polarization among firms.
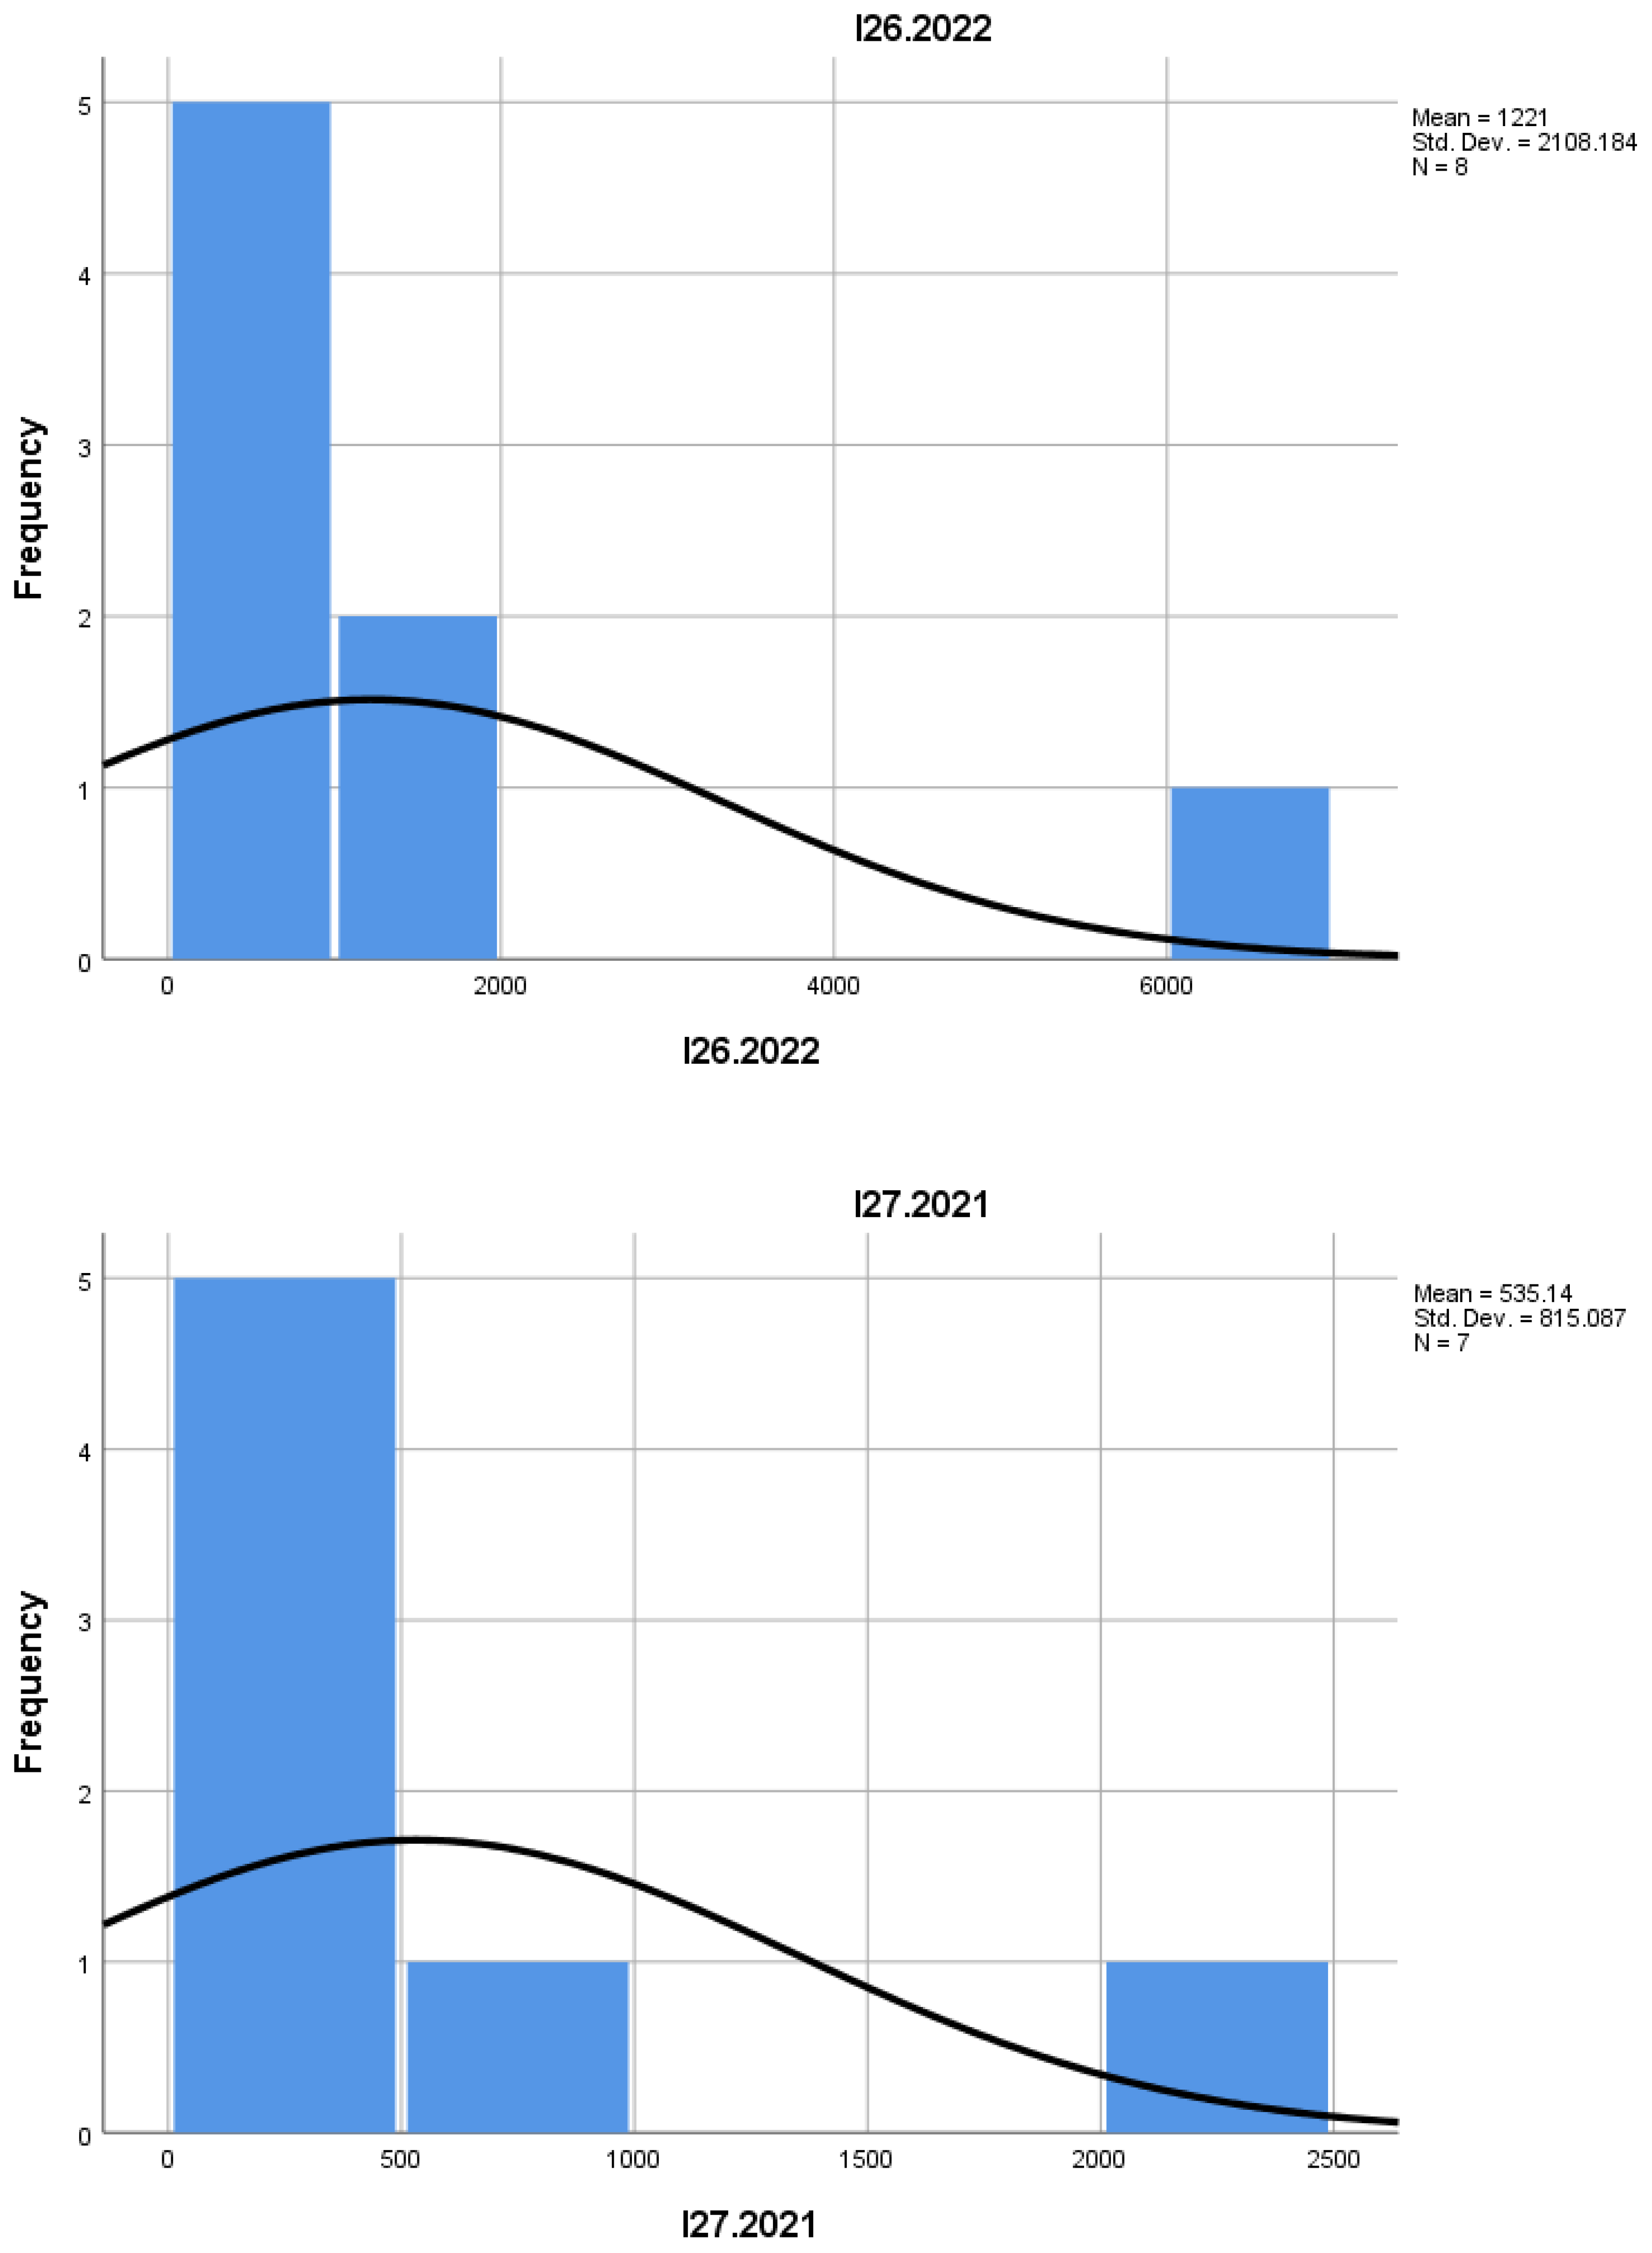
I26: The indicator shows a sustained increase in the share of employment, which indicates a strengthening of the sector's ability to generate jobs. The values distributed nearly normally suggest greater consistency among enterprises.
I27: Stable values, but with a slight increase, may reflect a slow but steady expansion of economic activities. The positive skewness shows that some enterprises perform better than the average, but they remain a minority.
I28: Although the values remain modest, the increase in the average may indicate heightened involvement in innovation or creative development. However, the very high dispersion and skewness highlight the exceptional nature of these innovative enterprises, which do not yet represent a widespread trend.
Based on the analysis of indicators I20–I28, the following conclusions can be drawn:
- High-growth enterprises continue to represent a small fraction of the total number of businesses in the sector. However, they contribute significantly to employment generation. This group is characterized by high volatility, indicating that while some firms scale rapidly, the majority remain relatively stagnant or face challenges in achieving sustainable growth.
- The pace of new business creation was slightly slower in 2022 compared to 2021. Despite this, the medium- and long-term survival rate of businesses remained stable, showing a slight improvement. This may suggest that while fewer new firms emerged, those that were established had better chances of stability and endurance.
- Failure rates appear to be relatively stable; however, a slightly increasing trend in business closures was observed. This may be reflective of a more competitive market environment, where only the most adaptable and resilient businesses manage to survive.
- The average firm size remained relatively constant over the two years, indicating that there were no major shifts in the structural scale of enterprises. At the same time, innovation remained limited to a small subset of companies. Most businesses in the sector are not significantly investing in research, product development, or other innovative processes, which could potentially hinder long-term competitiveness and sectoral advancement.
In summary, the sector shows signs of cautious growth and improved business endurance, but also highlights areas requiring targeted support—particularly in fostering innovation, reducing firm volatility, and enhancing the capacity of startups to scale sustainably.
Conclusion
The analysis of economic data and relevant indicators from the mountain entrepreneurship sector in the field of arts and entertainment reveals a complex dynamic. During the 2021–2022 period, there was a slight increase in the number of active enterprises, although seasonal fluctuations and economic factors led to significant disparities in their performance.
The indicators analyzed—such as the number of newly established and closed businesses, employment trends, and revenue variability—suggest that while there is significant development potential, most businesses remain small and have not yet achieved sustained long-term growth.
Moreover, the sector displays a high degree of volatility in terms of business success and failure, with a trend toward consolidation among the most successful companies. At the same time, there is considerable diversity in terms of business stability and sustainability.
In conclusion, greater attention is needed to support mountain entrepreneurship, with a focus on developing public policies and strategies that assist small businesses and ensure sustainable long-term growth.
During the preparation of this manuscript, the authors utilized artificial intelligence tools for assistance in statistical analysis and data interpretation. Following this, the authors rigorously reviewed, validated, and refined all results, ensuring accuracy and coherence. The final content reflects the authors' independent analysis, critical revisions, and scholarly judgment. The authors assume full responsibility for the integrity and originality of the published work.
References
- Antonescu, D. (2023). Analiza SWOT la nivel teritorial – instrument de sprijin al planificării strategice și al managementului sistemelor teritoriale complexe din zona montană. Studiu de caz: Bioaria Bazinul Dornelor. Available online: https://mpra.ub.uni-muenchen.de/119528/1/MPRA_paper_119528.pdf.
- Antonescu, D., Apetrei, M., & Surdu, I. (2022). The dimension of food waste phenomena in Romania. Case-study: Agro-mountain pensions.
- Avădănei, V., & Avădănei, L. (2022). Ia-ADN-ul civilizației montane românești.
- Avădănei, V. (2010). SCISRLP Neamţ. Buletinul AGIR. Available online: https://www.agir.ro.
- Bolboceanu, Z. (n.d.). Între tradiţie şi modernitate.
- Cai, Z., Fang, C., Zhang, Q., & Chen, F. (2021). Joint development of cultural heritage protection and tourism: The case of Mount Lushan cultural landscape heritage site. Heritage Science, 9(1), 86.
- Constantin, F. V. (n.d.). Studii și cercetări academice. Available online: https://www.studii-cercetari-academice.org.
- Eurostat. (2025). Business demography and high growth enterprises by NACE Rev. 2 activity and other typologies [urt_bd_hgn__custom_15325082].
- Kelfaoui, A., Rezzaz, M. A., & Kherrour, L. (2021). Revitalization of mountain rural tourism as a tool for sustainable local development in Kabylie (Algeria). The case of Yakouren municipality. Geo Journal of Tourism and Geosites, 34(1), 112–125.
- Matei, D. (n.d.). Turismul rural: Teorie şi realitate.
- Müller, E. M., & Quendler, C. (2021). Mediating Mountains: Introduction to the Special Issue. JAAAS: Journal of the Austrian Association for American Studies, 2(2), 105–114. [CrossRef]
- Rey, R. (2020). O viziune de dezvoltare sustenabilă–montană–axată pe valorificarea „produselor montane”, de calitate. Creșterea importanței zonelor montane în conjunctura post-coronavirus. Centrul de Economie Montană al Academiei Române.
- Rey, R. (2024). Integrated territorial planning of a complex mountain system. Dornelor Basin Microregion. Logos Universality Mentality Education Novelty: Social Sciences, 13(2).
- Sax, J. L. (2018). Mountains without handrails: Reflections on the national parks. University of Michigan Press.
- Sterpu, B. (2019). Antreprenoriatul, suport al dezvoltării umane: Studiu de caz privind activitățile administrative și de suport și activitățile. Jurnalul Libertății de Conștiință. Available online: https://www.ceeol.com.
- Watroba, K. (2023). Mann's Magic Mountain: World Literature and Closer Reading. Oxford University Press.
Disclaimer/Publisher’s Note: The statements, opinions and data contained in all publications are solely those of the individual author(s) and contributor(s) and not of MDPI and/or the editor(s). MDPI and/or the editor(s) disclaim responsibility for any injury to people or property resulting from any ideas, methods, instructions or products referred to in the content. |
© 2025 by the authors. Licensee MDPI, Basel, Switzerland. This article is an open access article distributed under the terms and conditions of the Creative Commons Attribution (CC BY) license (http://creativecommons.org/licenses/by/4.0/).
Copyright: This open access article is published under a Creative Commons CC BY 4.0 license, which permit the free download, distribution, and reuse, provided that the author and preprint are cited in any reuse.


