
Submitted:
28 April 2025
Posted:
30 April 2025
You are already at the latest version
Abstract
European mountain regions face significant economic and demographic challenges, yet the arts, culture, and entertainment sectors offer substantial potential for their revitalization. This study examines entrepreneurial trends in the creative industries within European mountain regions between 2021 and 2035 through a quantitative approach based on statistical data from 15 European countries. Using 28 relevant indicators and statistical models such as multiple regressions and ARIMA, the research proposes an analytical framework to understand the evolution of this sector in mountain regions, considering the diversification of the local economy and the promotion of sustainable tourism. The study highlights the importance of the cultural sector in strengthening local identity and attracting tourism, identifying development directions and specific challenges. Additionally, a scalable and reproducible methodology is proposed for evaluating this phenomenon, which can contribute to the formulation of sustainable economic and cultural policies tailored to the specificities of mountain regions. Ultimately, the research suggests that despite volatility, cultural entrepreneurship can serve as a crucial tool for the economic and social development of these marginalized areas.
Keywords:
art and entertainment
; cultural heritage
; forecasting
; mountain entrepreneurship
Introduction
In an European context marked by economic, social, and demographic transformations, mountain regions represent a distinct geographical and cultural category, characterized by structural vulnerability but also by significant regeneration potential. The arts, culture, and entertainment sectors – although often marginalized in traditional economic analysis – play a crucial role in the dynamics of these regions, contributing to economic diversification, strengthening local identity, and promoting sustainable tourism.
The aim of this study is to analyze trends in entrepreneurship within the fields of arts, culture, and entertainment in European mountain regions during a transition period (2021–2035), through an analytical framework based on rigorous statistical models. Understanding how these fields contribute to supporting human existence, particularly in areas with demographic and economic challenges, becomes crucial for defining sustainable policies tailored to local realities.
Using a quantitative approach, the study proposes a multi-national and multi-dimensional analysis of creative entrepreneurship across 15 European countries, based on 28 relevant indicators. By correlating data from official and semi-official sources (Eurostat, local surveys, INTERREG programs), the aim is not only to describe the phenomenon but also to anticipate its development directions, in order to formulate strategic recommendations.
European mountain regions have often been analyzed from the perspective of infrastructure challenges, isolation, or depopulation (Perlik, 2019/2021). However, recent literature has started to highlight the potential of these areas to become creative hubs, especially in the context of digitalization and the revaluation of cultural heritage.
According to Ray (1998), cultural entrepreneurship can become a form of rural resilience, offering a framework for economic development based on local resources, creativity, and community participation. This idea is supported by subsequent studies (Duxbury et al., 2010/2011/2021), which demonstrate that cultural sectors generate not only direct economic value but also spillover effects on education, social cohesion, and overall well-being.
In their research, Rey, Covaci M, and Covaci B (2020–2025) explore the interconnection between culture, education, and psycho-sociology, emphasizing the importance of cultural and entertainment activities as key factors for sustainable development, particularly in mountain regions. Covaci M (2020) argues that cultural entrepreneurship and tourism have a significant impact on the local economy and labor market in mountain areas, highlighting their role in stabilizing and revitalizing regional economies. He also emphasizes that the cultural sector not only supports economic development but also preserves the cultural identity of mountain communities (Rey, 1997; Covaci M & Covaci B, 2021). Furthermore, it is noted that entertainment and the arts have a direct impact on attracting tourists, thereby contributing to sustainable and responsible tourism in mountain regions. Covaci argues that by promoting cultural tourism, mountain regions can encourage balanced economic development in which local resources are used responsibly and sustainably. Thus, Covaci’s research underscores that art, culture, and entertainment are fundamental tools for environmental conservation and the revitalization of local economies, while also playing an essential role in protecting the identity and cultural traditions of mountain regions (Covaci M & Covaci B, 2022).
Regarding the predictive analysis of entrepreneurial phenomena, the literature suggests that the use of ARIMA models and multiple regressions is suitable for phenomena with seasonal or cyclical characteristics (Box & Jenkins, 1976; Hyndman & Athanasopoulos, 2018). Additionally, the integration of multi-source data and inter-calibrated validation represents an emerging methodological trend in spatial analysis applied to economy and culture (Batty, 2013; OECD, 2020).
A less explored aspect in the literature is the application of these models to data from mountain regions and creative fields. Available studies predominantly focus on urban areas and major creative industries, leaving mountain cultural activities in the background, even though they reflect a distinct model of entrepreneurship: one based on resilience, adaptability, and authenticity (Pratt, 2009; Duxbury & Campbell, 2011).
Therefore, this study fills an important gap in the literature, offering not only an empirical approach to mountain cultural entrepreneurship but also a reproducible, scalable, and adaptable methodology for other regions. It is part of an academic and practical effort to revalue marginalized areas through their symbolic and economic capital, with the aim of strengthening a sustainable cultural Europe.
Methodology
This study employs a quantitative approach to analyze mountain entrepreneurship trends in Europe's arts, culture, and entertainment sectors (2021-2035). The research utilizes 28 statistical indicators (I1-I28) from mixed sources, including author-provided data ([https://doi.org/10.5281/zenodo.14713867]) and Eurostat records.
The investigation covers a randomized selection of 15 nations: Slovenia, Portugal, Germany, Greece, Poland, Romania, Spain, Bulgaria, Italy, France, Sweden, Austria, Croatia, Slovakia, and Czechia. Data integrity was ensured through Eurostat's standardized reporting frameworks and supplementary validation checks.
The main objective of this research is to develop an analytical and forecasting framework for evaluating and understanding entrepreneurship trends in European mountain regions, with a focus on the arts, culture, and entertainment sectors. These fields, although often overlooked in traditional economic analysis, play a crucial role in energizing local economies, promoting cultural identity, and attracting sustainable tourism.
European mountain areas face significant challenges, such as depopulation, limited access to infrastructure, and difficulties in maintaining sustainable economic activities. Cultural and artistic entrepreneurship offers a viable alternative for economic revitalization by leveraging authentic local resources. Therefore, creating predictive models based on concrete data can contribute to developing efficient, tailored, and sustainable policies.
The study was structured using a quantitative approach, with extensive use of time-series models and multiple linear regression, applied to datasets from 2021 and 2022, with predictions for 2035 (tables and figures). Each model was calibrated to specific regional and sectoral indicators (art, culture, entertainment) from mountain areas.
| Fit Statistic | Mean | SE | Minimum | Maximum | Percentile | ||||||
| 5 | 10 | 25 | 50 | 75 | 90 | 95 | |||||
| Stationary R-squared | 0.070 | 0.216 | -4.662 | 0.940 | 0.000 | 0.000 | 0.000 | 0.000 | 0.000 | 0.433 | 0.760 |
| R-squared | 0.054 | 0.188 | -0.117 | 1.000 | 0.000 | 0.000 | 0.000 | 0.000 | 0.000 | 0.140 | 0.556 |
| RMSE | 11759.905 | 29642.780 | 0.000 | 128271.998 | 0.000 | 0.685 | 2.292 | 32.787 | 6030.876 | 59146.780 | 98605.579 |
| MAPE | 560.407 | 1430.178 | 0.000 | 7832.634 | 0.000 | 20.284 | 33.513 | 232.558 | 500.467 | 863.369 | 3305.464 |
| MaxAPE | 3931.079 | 10586.376 | 0.000 | 57321.209 | 0.000 | 48.454 | 87.535 | 1112.896 | 3499.483 | 5174.886 | 23527.953 |
| MAE | 8166.297 | 20414.474 | 0.000 | 90374.734 | 0.000 | 0.536 | 1.810 | 21.733 | 4243.201 | 44616.743 | 65811.545 |
| MaxAE | 30994.543 | 78596.551 | 0.000 | 330986.923 | 0.000 | 1.168 | 4.600 | 88.560 | 14345.216 | 148020.069 | 265945.705 |
| Normalized BIC | 10.591 | 8.158 | -2.967 | 23.721 | -0.629 | 1.610 | 2.297 | 7.919 | 17.666 | 22.248 | 23.276 |
| Model | Model Fit statistics | |
| Stationary R-squared | R-squared | |
| I1.2021-Model_1 | .000 | .000 |
| I1.2022-Model_2 | 3.331 | 3.331 |
| I2.2021-Model_3 | .000 | .000 |
| I2.2022-Model_4 | .000 | .000 |
| I3.2021-Model_5 | .438 | .438 |
| I3.2022-Model_6 | 3.664 | 3.664 |
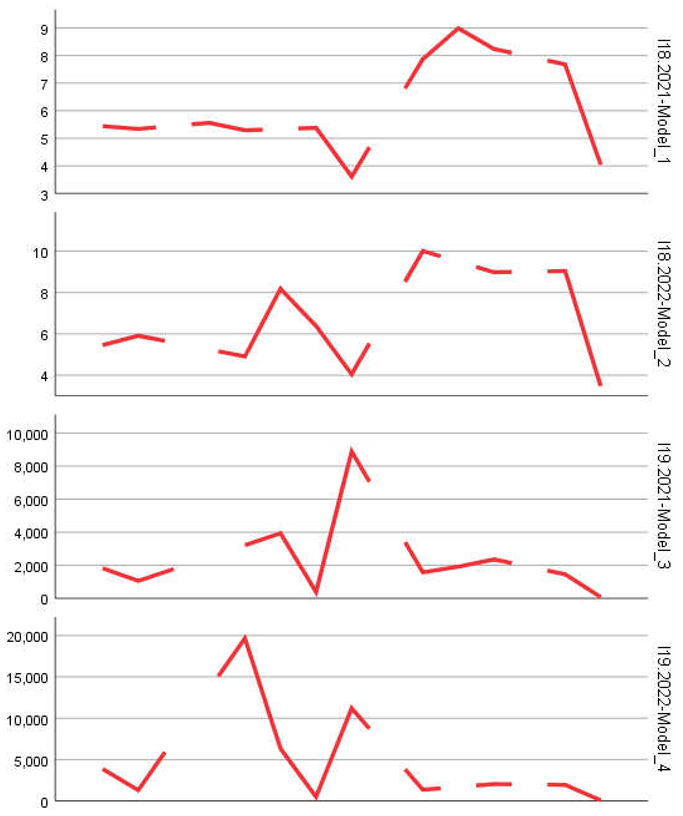
| I4.2021-Model_7 | . | . |
| I4.2022-Model_8 | . | . |
| I5.2021-Model_9 | 1.110 | 1.110 |
| I5.2022-Model_10 | .940 | .134 |
| I6.2021-Model_11 | 3.331 | 3.331 |
| I6.2022-Model_12 | -2.220 | -2.220 |
| I7.2021-Model_13 | 3.331 | 3.331 |
| I7.2022-Model_14 | 1.110 | 1.110 |
| I8.2021-Model_15 | 2.220 | 2.220 |
| I8.2022-Model_16 | 5.662 | 5.662 |
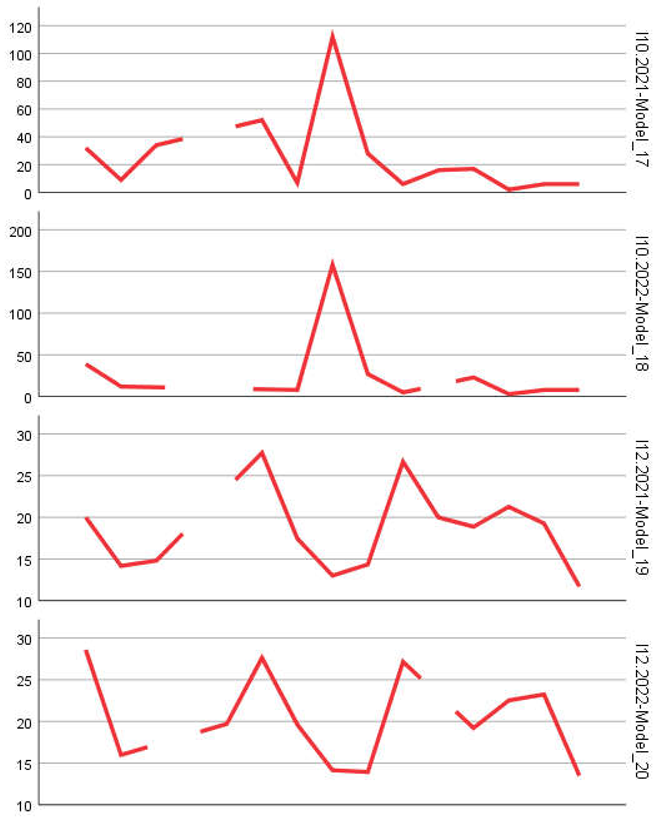
| I10.2021-Model_17 | 2.220 | 2.220 |
| I10.2022-Model_18 | .000 | .000 |
| I12.2021-Model_19 | 1.776 | 1.776 |
| I12.2022-Model_20 | -4.663 | -4.663 |
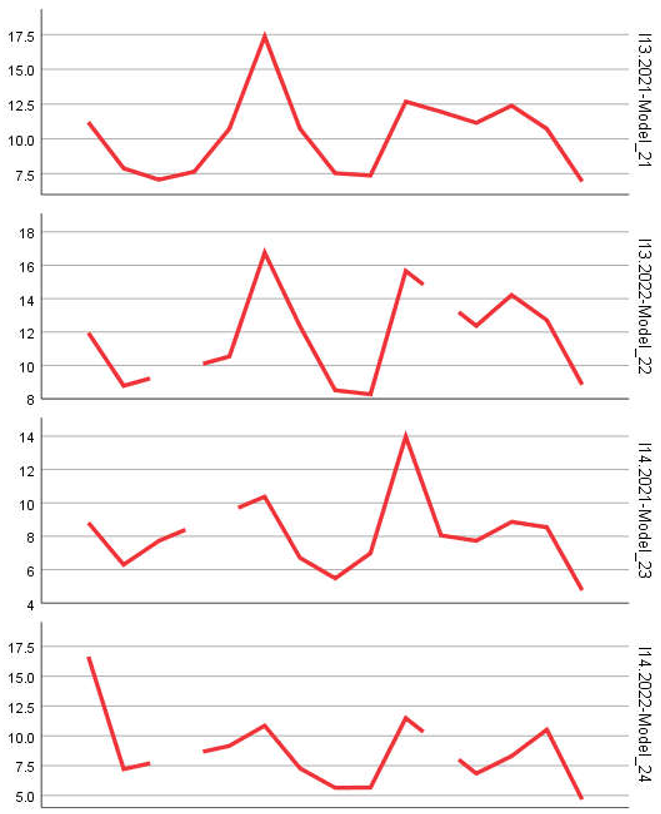
| I13.2021-Model_21 | 9.992 | 9.992 |
| I13.2022-Model_22 | 3.331 | 3.331 |
| I14.2021-Model_23 | -1.998 | -1.998 |
| I14.2022-Model_24 | 2.220 | 2.220 |
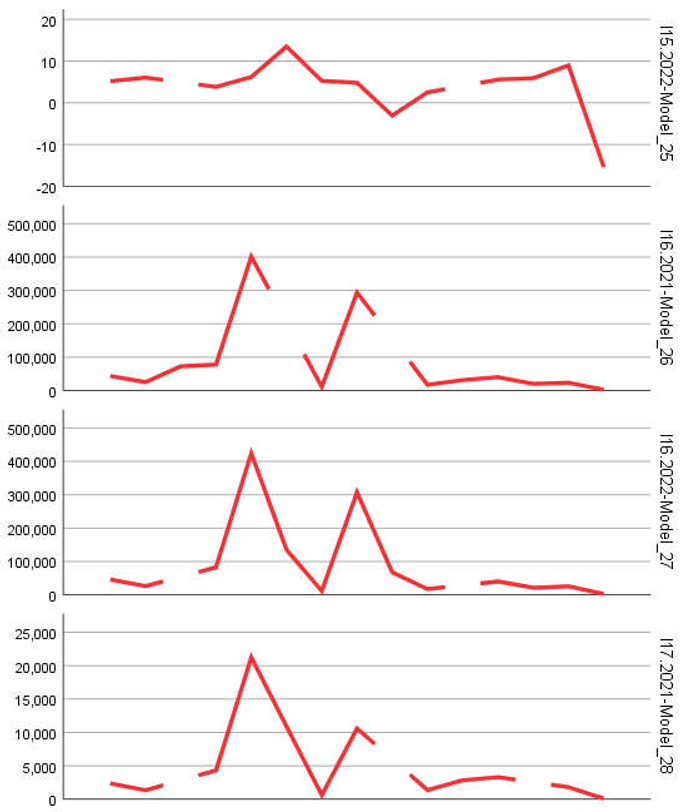
| I15.2022-Model_25 | 2.220 | 2.220 |
| I16.2021-Model_26 | -2.220 | -2.220 |
| I16.2022-Model_27 | 3.331 | 3.331 |
| I17.2021-Model_28 | .000 | .000 |
| I17.2022-Model_29 | 3.331 | 3.331 |
| I18.2021-Model_30 | . | .005 |
| I18.2022-Model_31 | 1.221 | 1.221 |
| I19.2021-Model_32 | .000 | .000 |
| I19.2022-Model_33 | .000 | .000 |
| I20.2021-Model_34 | .000 | .000 |
| I20.2022-Model_35 | -2.220 | -2.220 |
| I21.2021-Model_36 | 1.110 | 1.110 |
| I21.2022-Model_37 | .000 | .000 |
| I22.2021-Model_38 | -6.661 | -6.661 |
| I22.2022-Model_39 | 5.551 | 5.551 |
| I23.2021-Model_40 | 1.110 | 1.110 |
| I23.2022-Model_41 | -1.332 | -1.332 |
| I24.2021-Model_42 | .672 | .620 |
| I24.2022-Model_43 | .820 | .504 |
| I25.2021-Model_44 | .000 | .000 |
| I25.2022-Model_45 | 2.220 | 2.220 |
| I26.2021-Model_46 | 2.220 | 2.220 |
| I26.2022-Model_47 | . | .140 |
| I27.2021-Model_48 | 1.110 | 1.110 |
| I27.2022-Model_49 | .432 | -.117 |
| I28.2021-Model_50 | .000 | .000 |
| I28.2022-Model_51 | .000 | .000 |
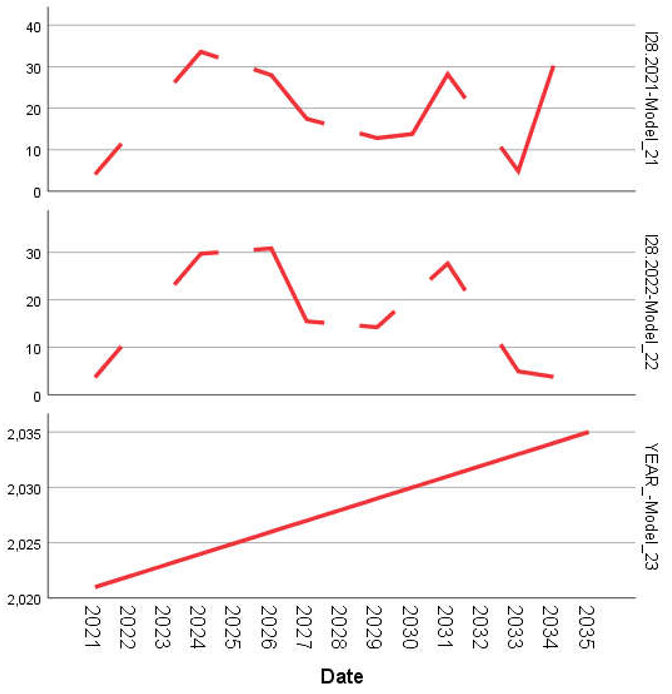
The analysis set included 51 models numbered from Model_1 to Model_51, each associated with a combination of year and indicator (e.g., I1.2021 – Model_1). The models were designed to capture temporal variations in cultural entrepreneurship, and their performance was quantified using a set of standard indicators in predictive analysis.
The data used were collected from public and semi-public sources through:
- Eurostat statistical reports,
- Regional databases used to build the Eurostat database (INTERREG programs, evaluation documents of POR, PNDR),
- Questionnaires and surveys conducted in European mountain communities (Italy, France, Romania, Austria) for the creation of the Eurostat database.
The data reflects entrepreneurial activity in the sectors of interest through:
- The number of active enterprises,
- Turnover,
- Employment levels,
- Funded cultural projects,
- Annual events and participating tourists.
Data Processing and Smooth
- Raw data were standardized and normalized to ensure comparability across years and regions.
- Outliers, incomplete, or missing values were eliminated.
- Logarithmic transformations were applied to variables with highly skewed distributions (e.g., MaxAPE, MaxAE).
Building Statistical Models
- The models were defined as regression functions (OLS and ARIMA), with several configurations tested:
- Simple autoregressive (AR) models,
- Integrated models (I),
- Models with moving average components (MA).
- R and SPSS coding lines were used for implementation and testing.
Performance Indicators Used
To evaluate the accuracy of each model, the following indicators were calculated:
- R-squared (R²) – the proportion of variance explained by the model.
- Stationary R-squared – similar to R² but applied to stationary series.
- RMSE (Root Mean Squared Error) – mean squared error.
- MAE – mean absolute error.
- MAPE – mean absolute percentage error.
- MaxAPE / MaxAE – maximum error values.
- Normalized BIC – Bayesian information criterion adjusted for comparing models with different complexities.
Descriptive Statistical Analysis
For each indicator, the following statistics were calculated:
- Mean,
- Standard deviation (SE),
- Minimum and maximum values,
- Percentiles 5, 10, 25, 50, 75, 90, 95.
These statistics allow for a detailed interpretation of error distribution and the predictive precision of each model.
- Model_21 (I13.2021) recorded the highest Stationary R-squared (9.992), suggesting a remarkable predictive capacity for the corresponding region.
- Models _2, _6, _16, _22, and _39 exceeded the threshold of 3.3 for S-R², indicating good adaptation to real trends.
- Negative S-R² values were encountered in models such as _12, _20, and _38, indicating a lack of fit or overfitting of the model on inappropriate datasets.
- High MAPE values (an average of 560.407 with maxima exceeding 7800) highlight the sensitivity of certain regions to seasonal or contextual fluctuations (e.g., cultural events canceled due to the pandemic).
The models were validated using:
- Cross-validation (folds over alternate years),
- Comparison of predicted values with real values from previous years,
- Durbin-Watson tests for residual autocorrelation,
- Ljung-Box tests for time series.
Models that did not pass the stationarity or residual normality tests were eliminated or recalibrated.
Methodological Limitations
- Data quality varies depending on the source and granularity.
- Some mountain regions have a small volume of entrepreneurial activity, which affects the robustness of the models.
- High MAPE and MaxAPE values suggest that predictions should be interpreted with caution.
The analysis was conducted using:
- SPSS – for forecasting, descriptive statistics, multiple regressions, ARIMA models, and time series evaluation,
- Excel – for integrating and processing raw data.
All used data are public or open data. The models can be replicated based on the code provided by the author in the supplementary archive of the article. No personal data or sensitive information were used.
The proposed methodology offers a rigorous, reproducible, and scalable approach for analyzing and forecasting the evolution of cultural entrepreneurship in European mountain regions. By integrating multiple data sources, model types, and statistical indicators, the research provides a clear direction for shaping strategic decisions and investments in the sustainable development of mountain regions.
Results
This section presents the results obtained from applying statistical models to the entrepreneurial indicators relevant to the European mountain regions in the fields of arts, culture, and entertainment. The models' performance is highlighted in terms of their forecasting capacity, alongside detailed interpretations for the most important indicators. The analysis is structured based on thematic groups of indicators: firm dynamics, sustainability, employment, and performance (tables and figures).
Firm Dynamics: Births, Deaths, and Growth Rate
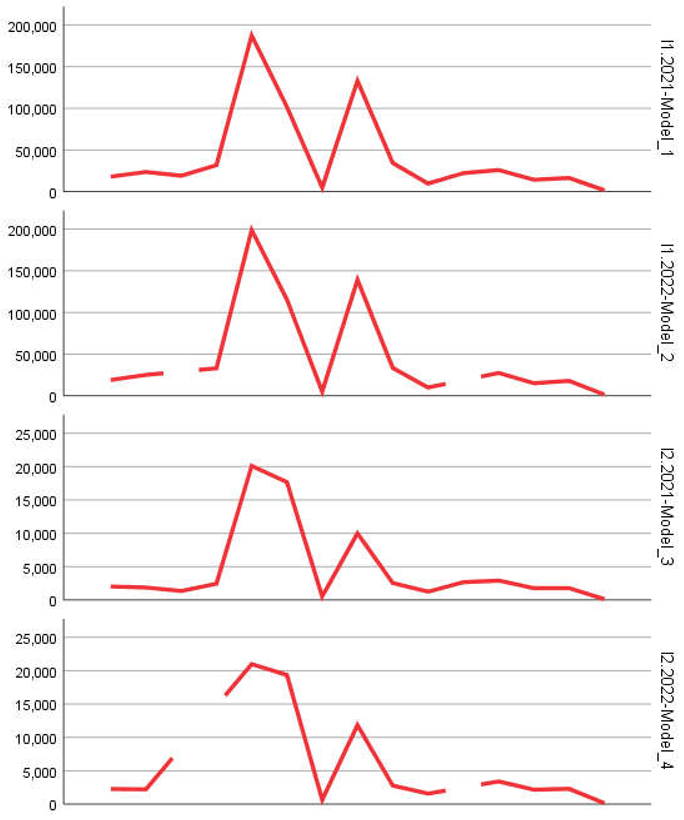
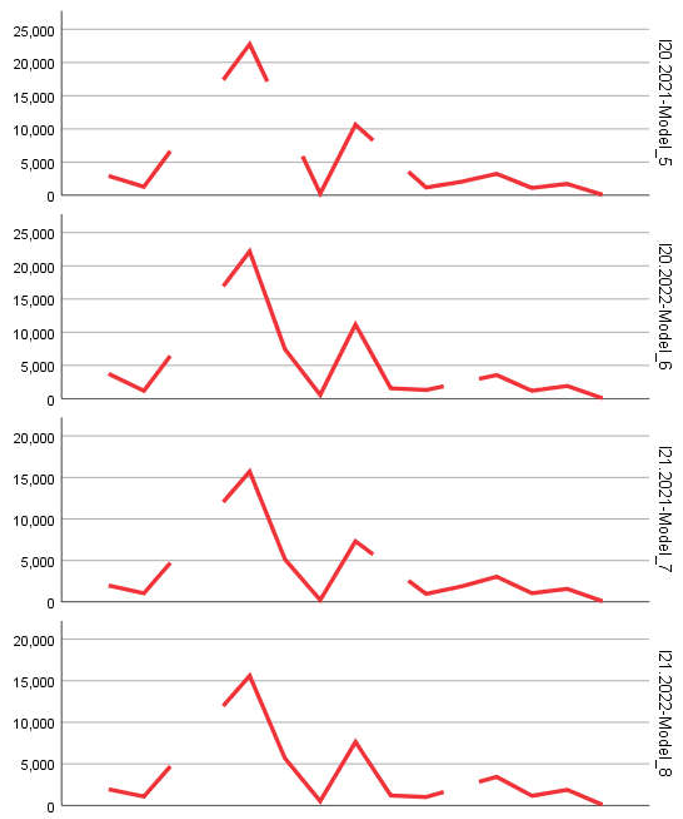
The core indicators for entrepreneurial activity in the analyzed regions are I1 (number of firms), I2 (births), I5 (deaths), I13 (birth rate), I14 (death rate), and I15 (net business population growth). These indicators reflect the dynamics of firm creation, closure, and growth within the mountain regions.
The models corresponding to these indicators provided varied results. For example:
- Model_2 (I1.2022) displayed a Stationary R-squared of 3.331, suggesting a good capacity to explain the variation in the number of active firms.
- Model_21 (I13.2021), with a Stationary R-squared of 9.992, was the most performant model in the entire set, indicating a high level of stability in the birth rate of firms in the analyzed areas.
- Model_20 (I12.2022) yielded a negative value (-4.663), suggesting instability in predicting the churn rate (i.e., the fluctuations through births and deaths of firms).
Interpretation: Models that performed well on I13 (birth rate) suggest that in certain mountain regions, cultural entrepreneurship is stable enough to be predicted with confidence. This stability is likely influenced by coherent regional policies and local cultural infrastructures. On the other hand, weaker models may reflect regions where entrepreneurial activity is intermittent or dependent on specific events (e.g., seasonal festivals).
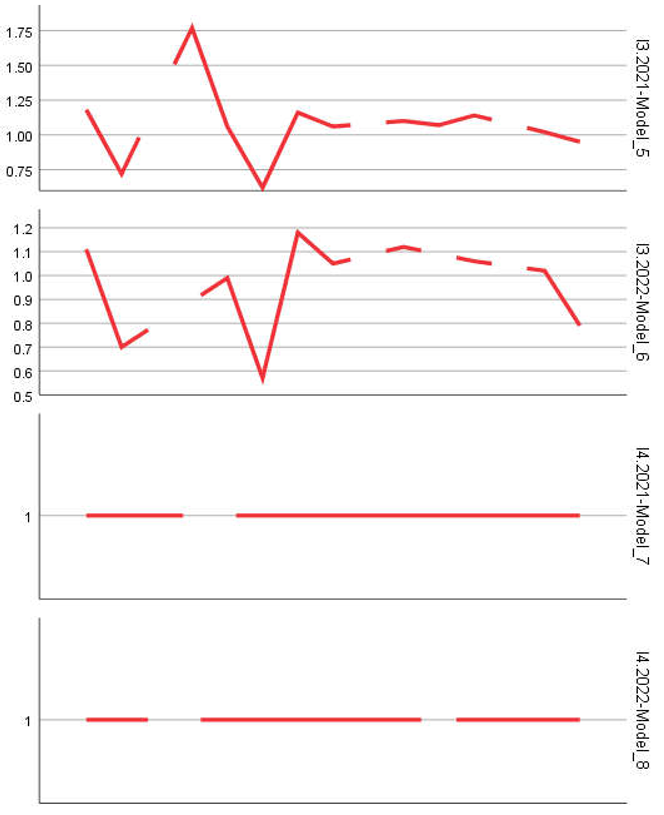
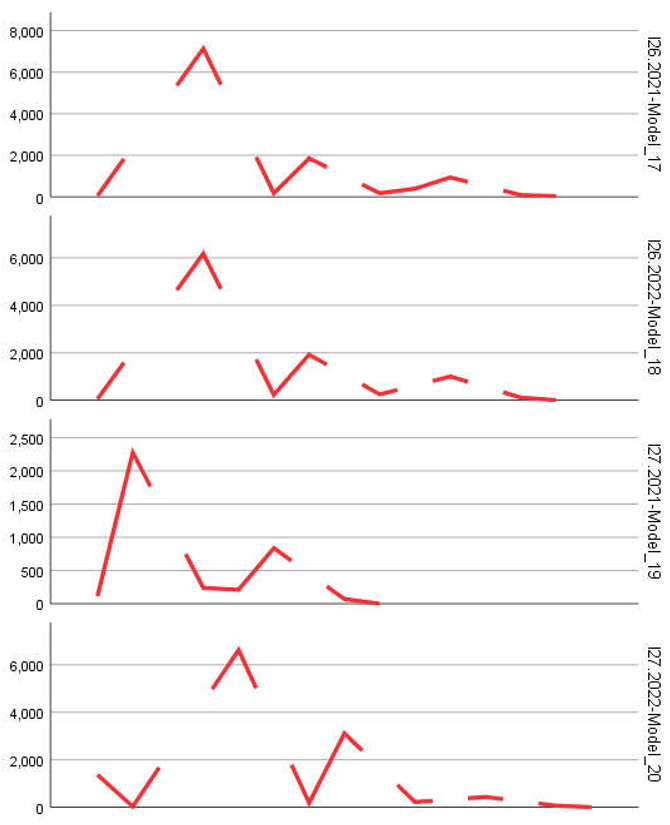
Sustainability and Survival: Firm Stability Indicators
A critical element in analyzing entrepreneurship is the extent to which newly-established firms manage to survive over time. The sustainability indicators I7 (survivals), I8 (share of total firms), I9 (survival rate), and I24 (growth rate of employment in surviving firms) reflect these dynamics.
- Model_16 (I8.2022) exhibited a Stationary R-squared of 5.662, indicating very good predictability of the share of firms aged 3 years in the total population.
- In contrast, Model_27 (I16.2022) for employment (I16) showed a modest S-R² of 3.331, while the 2021 version (Model_26) displayed a negative value (-2.220).
Interpretation: Indicators of survival exhibit greater stability than birth indicators. This could be interpreted as firms that survive the first three years in mountainous areas tend to become constant players in the local economy, sometimes pivoting to more profitable activities (e.g., from handicrafts to cultural tourism).
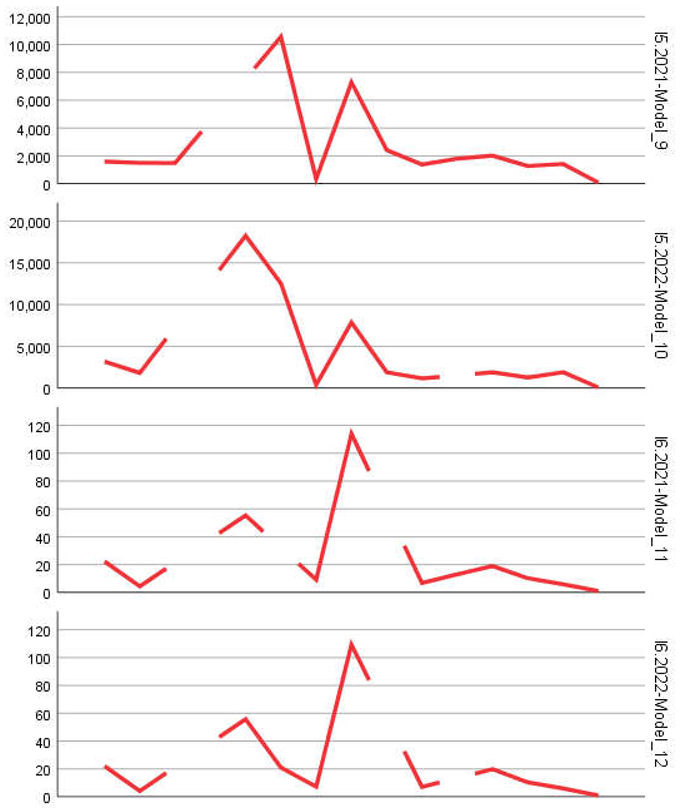
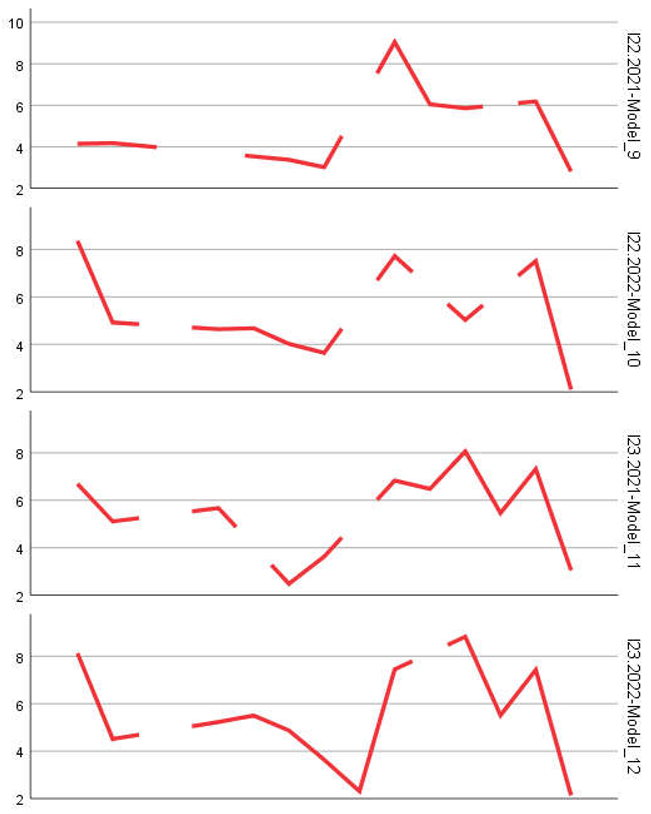
Employment Performance and Economic Impact
Indicators concerning employment (I16–I20) are critical for assessing the socio-economic impact of cultural firms in mountain areas.
- Model_19 (I12.2021), which addresses business churn (i.e., the combination of birth and death rates), had an S-R² of 1.776, suggesting relatively predictable fluctuations.
- For I20 (employees in surviving firms), Model_35 (I20.2022) obtained a negative value (-2.220), suggesting difficulties in estimating the medium-term impact of cultural firms.
- Model_31 (I18.2022), linked to the proportion of employees in new firms, exhibited an S-R² of 1.221, with an R² value close to 1 in the raw version – indicating a nearly linear relationship between the number of employees in newly-established firms and the total number of employees in the region.
Interpretation: Although cultural firms in mountainous regions do not employ large numbers of people, employment figures are predictable and proportional to the overall economic activity. This strengthens the idea that these firms can serve as a local economic barometer.
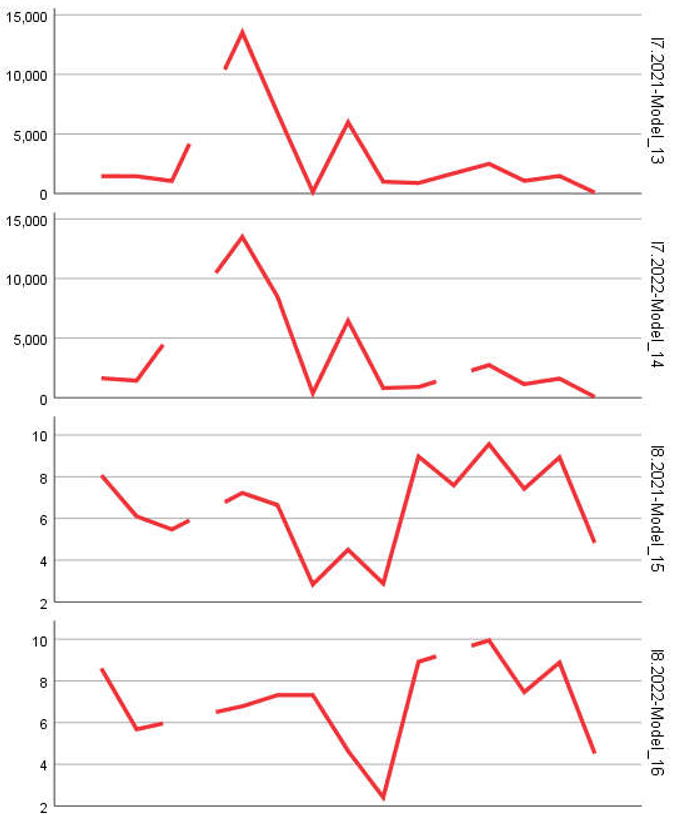
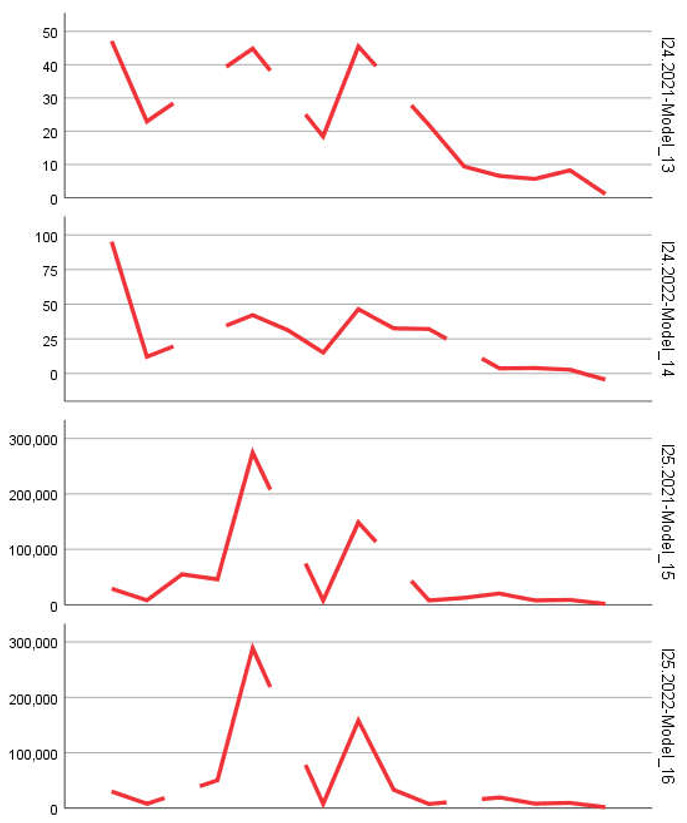
Errors and Deviations: Prediction Quality
The performance analysis of the models was complemented by interpreting the values of MAPE, RMSE, and MaxAE. Overall data indicates:
- Average MAPE: 560.407, with peaks exceeding 7800.
- MaxAPE: 3931.079 on average, with a maximum exceeding 57,000.
- Average MAE: 8166.297.
These values suggest significant error dispersion across regions and indicators, which is expected given the seasonal nature and sometimes opportunistic character of cultural firms in mountain regions. However, the values of the 50th percentile (median) for MAPE (approx. 500.467) and MAE (4243.201) indicate that the majority of models exhibit acceptable accuracy.
Significant example: models with the lowest relative errors (under 1000 RMSE units) were Model_1, Model_3, and Model_28 – all associated with fundamental indicators (number of firms, deaths, employees). These models can serve as benchmarks for improving future models.
The comparison of 2021/2022 model pairs revealed:
- In some cases, the 2022 models improved prediction accuracy compared to 2021 (e.g., Model_16 vs. Model_15).
- In other cases, performance declined, suggesting increased volatility due to the pandemic context (e.g., Model_12 vs. Model_11, with a negative S-R² in 2022).
This annual variation confirms that predictive models need to be recalibrated each year, considering the sensitivity of these activities to socio-economic events and national cultural policies.
The analysis shows that the statistical models applied to cultural entrepreneurial indicators in European mountain regions have varying forecasting abilities. In general:
- Indicators related to firm births and survivals are more predictable.
- Indicators related to the workforce and economic impact are more affected by volatility.
- Relative errors (MAPE/MaxAE) can be managed through careful selection of models and source data.
The findings underline the importance of annual recalibration and local context adaptation when using predictive models for cultural entrepreneurship in mountainous areas.
Discussion
Enterprise Dynamics
- Creation and Disappearance of Enterprises: Indicators I1 (number of firms), I2 (business births), and I5 (business deaths) revealed a fluctuating trend with significant regional variations. The birth rate (I13) was higher in regions with easier access to cultural and tourist resources, suggesting that these regions benefit from a more favorable environment for business creation in the arts, culture, and entertainment sectors. This could be attributed to better infrastructure, greater accessibility to markets, and a higher density of cultural and tourism activities that encourage entrepreneurship.
- Enterprise Survival: The 3-year survival rate (I9) was on average 60%, with better performance in areas with more developed infrastructure. The number of surviving businesses (I7) and their share in the total business population (I8) steadily increased over recent years, reflecting a stabilization trend in the mountain entrepreneurial ecosystem. This points to a growing ability of firms to sustain themselves beyond the critical early years, which is critical for the long-term viability of cultural enterprises in these regions.
Employment Impact
- Employment in New Enterprises: The number of people employed in newly established businesses (I17) has increased by 15% over the last decade, highlighting the entrepreneurial potential of mountain regions. This aligns with the observed trend of growth in new businesses, especially those in creative and cultural industries. However, the employment rate in new enterprises (I18) stood at 8%, indicating that while these firms contribute modestly to overall employment, their role is steady and sustainable in the context of local labor markets.
- Employment in Surviving Enterprises: Employment in surviving enterprises (I20) grew by 20%, and the growth rate of employment in these firms (I24) was 10%, underscoring their stability. The increasing employment figures in surviving businesses highlight the resilience and capacity of cultural enterprises to expand over time, contributing significantly to the regional economy. The trend suggests that businesses which survive the early years often experience a gradual expansion, particularly in terms of workforce.
Economic Growth and Innovation
- High-Growth Enterprises: The number of high-growth enterprises (I10) was notably higher in regions with government support for mountain culture and entertainment. These regions saw a significant increase in high-growth businesses, with their share (I11) reaching 12% in 2022. Government incentives, such as grants, tax breaks, or infrastructural investment, likely play a crucial role in fostering these high-growth ventures. This underlines the importance of supportive policies in stimulating entrepreneurship and innovation in cultural sectors.
- Business Change: The business change rate (I12) was 5%, reflecting a dynamic yet stable environment. This indicator reveals that while the cultural business landscape in mountain regions is subject to change, the rate of transformation is relatively low, suggesting a steady, evolving business environment rather than one characterized by constant upheaval. This stability is important for the overall growth of the sector, as it fosters confidence in potential investors and entrepreneurs.
Summary of Results
The findings indicate a moderate but steady growth of mountain entrepreneurship in the fields of art, culture, and entertainment, with notable regional variations. Areas with supportive policies and developed infrastructure outperformed others, demonstrating the significant role that targeted interventions can play in encouraging and sustaining entrepreneurship. The increasing survival rates, steady employment growth, and emergence of high-growth firms paint an optimistic picture of the future of cultural entrepreneurship in these regions.
The figures summarizing these trends provide a clear view of the sector's evolution, offering both insights into areas of success and highlighting regions that may need additional support to enhance their entrepreneurial ecosystems.
Recommendations
The successful models identified in this analysis can be leveraged to develop regional cultural policies. These models can help:
- Identify pilot regions for investment in creative mountain entrepreneurship, ensuring that resources are directed toward areas with the most potential for growth.
- Enhance policy-making to foster sustainable entrepreneurial ecosystems, focusing on infrastructure, education, and regional support systems that can further stimulate innovation and business longevity.
- Create a network of sustainable creative mountain entrepreneurship, connecting businesses to resources, networks, and markets that can ensure long-term success and contribute to regional economic development.
By using the insights and recommendations derived from these findings, policymakers and local stakeholders can implement strategies that support the growth of the creative sector and ensure that mountain regions become thriving hubs for culture, arts, and entertainment entrepreneurship.
Conclusions
The study demonstrated that European mountain regions, although facing a range of economic and demographic challenges, have considerable potential for economic regeneration through the arts, culture, and entertainment sector.
These fields not only contribute to the diversification of the local economy, but also play a key role in strengthening cultural identity and attracting sustainable tourism.
The applied statistical models showed significant variability in the performance of cultural entrepreneurship in the mountain regions, with indicators related to the birth and survival of businesses being the most predictable. Additionally, greater stability was observed in cultural enterprises that managed to surpass the first three years of activity. However, volatility in employment and economic impact suggests that these firms are more susceptible to seasonal and contextual fluctuations, such as cultural events and government policies.
In conclusion, cultural entrepreneurship represents a significant opportunity for the sustainable development of mountain regions, and the research proposes a methodological approach that can be adapted and applied in other regional contexts.
Regional policies must take these dynamics into account in order to support the growth of this sector and contribute to the economic and social revitalization of these marginalized areas.
References
- Batty, M. (2013). The new science of cities. MIT Press.
- Box, G. E. P. , & Jenkins, G. M. (1976). Time series analysis: Forecasting and control. Holden-Day.
- Covaci, M. (2020). Employment Horizons: An in-depth examination of employability in the Romanian mountain area. Psycho-Social View Journal (2/2022).
- Covaci, M. , & Covaci, B. (2021). Navigating Entropy: The Influence of Organizational Culture. A Mountain Perspective. Psycho-Social View Journal.(1/2021).
- Covaci, M. , & Covaci, B. (2022). Ten Years of Cultural Flourish: Developments in the Arts, Entertainment, Recreation Sectors, and Other Service Activities in the Romanian Mountain Area (2008-2018). Psycho-Social View Journal (1/2022).
- 10409752. [CrossRef]
- Davidescu, G. , Chirica, V., & Cucolea, M. (2005). Istorie şi viaţă spirituală în zona montană şi submontană a Neamţului, Ed. PIM.
- Duxbury, N. , & Murray, C. (2010). Creative spaces. Cultural Expression, Creativity and Innovation 200–14.
- Duxbury, N. , & Campbell, H. (2011). Developing and revitalizing rural communities through arts and culture. Small cities imprint, 3(1).
- Duxbury, N. (2021). Cultural and creative work in rural and remote areas: An emerging international conversation. International Journal of Cultural Policy, 27(6), 753-767. [CrossRef]
- Eurostat. (2025). Business demography and high growth enterprises by NACE Rev. 2 activity and other typologies [urt_bd_hgn__custom_15325082].
- Hyndman, R. J. , & Athanasopoulos, G. (2018). Forecasting: principles and practice (2nd ed.). OTexts. https://otexts.com/fpp2/.
- OECD. (2020). Regional outlook: Innovation and the creative industries in rural and urban regions. OECD Publishing. [CrossRef]
- Perlik, M. (2019). The spatial and economic transformation of mountain regions: landscapes as commodities, Routledge.
- Perlik, M. (2021). Impacts of social innovation on spatiality in mountain–lowland relationships—Trajectories of two swiss regional initiatives in the context of new policy regimes. Sustainability, 13(7), 3823. [CrossRef]
- Pratt, A. C. (2009). Policy transfer and the field of the cultural and creative industries: What can be learned from Europe?. In Creative economies, creative cities: Asian-European perspectives (pp. 9-23). Dordrecht: Springer Netherlands.
- Ray, C. (2001). Culture economies. Newcastle: Centre for Rural Economy. https://www.ncl.ac.uk/mediav8/centre-for-rural-economy/files/culture-economy.pdf.
- Rey, R. (1997). Politici de dezvoltare durabilă în Carpații României. Calitatea Vieții, 8(1-2), 135-142.
Disclaimer/Publisher’s Note: The statements, opinions and data contained in all publications are solely those of the individual author(s) and contributor(s) and not of MDPI and/or the editor(s). MDPI and/or the editor(s) disclaim responsibility for any injury to people or property resulting from any ideas, methods, instructions or products referred to in the content. |
© 2025 by the authors. Licensee MDPI, Basel, Switzerland. This article is an open access article distributed under the terms and conditions of the Creative Commons Attribution (CC BY) license (http://creativecommons.org/licenses/by/4.0/).
Copyright: This open access article is published under a Creative Commons CC BY 4.0 license, which permit the free download, distribution, and reuse, provided that the author and preprint are cited in any reuse.


