
Submitted:
24 April 2025
Posted:
25 April 2025
You are already at the latest version
Abstract
The utilization of Virtual Reality (VR) in safety training in the construction industry is increasingly being necessitated by a requirement to enhance the level of safety and the effectiveness of safety training in the construction industry. The research takes a quantitative approach toward the determination and exploration of the determinants for VR uptake for safety training. Standardized questionnaires were distributed to sample a cross-section of Ghanaian construction professionals to find areas of commonality regarding drivers for the use of VR in the safety training of the construction. Technological advancement and boosting the culture of safety were found to be the highest drivers based on exploratory factor analysis (EFA). Technological advancement and boosting safety culture are the two highest drivers the research recommends. Technological advancements facilitate the creation of realistic simulation and training environments, significantly enhancing the learning process. The improvement in safety culture is facilitated by VR-based training, which renders safety proactive and enables a higher level of knowledge retentiveness through frequent safety-free simulations. This study provides industry stakeholders with valuable insights into how the advantages of VR applications should be maximized to enhance the level of safety standards and train efficiency. The findings are a foundation upon which new ways of utilizing VR effectively in the safety training course of developing nations' construction industry are to be formulated.
Keywords:
Virtual Reality
; Construction Industry
; Safety Training
; Training Effectiveness
; Data-Driven Insights
; EFA
1. Introduction
The use of Virtual Reality (VR) in safety training has been a groundbreaking innovation in various industries, transforming the traditional training model [1]. The relevance of VR technology lies in its ability to deliver an immersive and interactive learning experience that surpasses the limitations of traditional methods, enabling trainees to interact with real-world environments and hazardous conditions without physical risk [2]. Such an ability enhances engagement and ensures standardized learning outcomes for every trainee, a valuable factor in domains where standardized safety protocols are a necessity. The development of VR platforms has added more functionality with the technology becoming less expensive and more accessible [1]. Combining this with the ability to mimic risky situations in a controlled environment provides more and better training in which the employees are well-positioned to deal with real-world situations. Regulations from the government and institutions make it a requirement that safety training be done using VR technology, as adherence to proper procedures will prevent accidents from occurring in the workplace [3,4]. Compliance with the law is therefore possible through the simulation of dangerous situations in a safe environment that provides maximum training efficacy. Financial incentives, especially subsidies and tax relief, facilitate investment towards the use of VR technologies, initial shock, and break into popularity in all other sectors [5,6]. Such poor performance also incorporates low safety statistics mainly resulting from previous training methods in all high-risk sectors such as construction and manufacturing businesses [7,8]. It is such loopholes that VR simulation fills in order to make workers adequately trained in decision-making and sensitivity to the safety environment, thus lowering the accident rate and guaranteeing workplace safety standards [9. 10]. Cost-effectiveness is also an aspect that makes the application of VR in safety training. In contrast to the traditional practices involving huge investments in materials and logistics, the VR module can be scaled up with the potential of reducing operation costs in the long run [9,11]. Though initially designed, the modules can be recycled in other locations and sessions without an extra downtime cost, thereby maximizing training efficiency to the maximum. Stakeholder pressure, i.e., investor pressure, customer pressure, and regulatory pressure, is of central importance to compel organizations to adopt novel solutions like VR [12,13,14]. By displaying evidence of investment in technology and safety, businesses can enhance business reputation and competitiveness, particularly for firms in which the record of safety is a determinant of business success [13]. High-fidelity simulation realism and virtual worlds enhance training efficiency because it can transfer muscle memory and skills by hand in a secure learners' environment [15,16]. The immediate feedback mechanisms in VR systems help with continuous improvement, enabling trainees to develop their skills rapidly and efficiently [17,18]. Moreover, through the use of information from VR training, organizations are enabled to tailor the training intervention, improve performance, and sustain employee competencies continuously [19,20]. Another advantage of VR being accessible has been extended to distant or geographically dispersed teams with an impartial training experience [21,22]. Individualized training schedules are provided to accommodate various job positions and learning styles. This results in increased interest and retention of safety practices. The scalability of VR training programs allows organizations to expand their training programs without any corresponding increase in the logistical needs or costs incurred [23,24]. Simulation of emergencies in VR trains employees to handle emergencies with ease, enhancing readiness and confidence without ever being placed at risk [25,26]. Such ability not only enhances performance at the individual level but also enhances organizations' safety culture resilience. Bringing safety awareness into a daily practice routine through immersive training, VR creates an organizational culture with safety in all layers. One can say that the concept of employing VR in safety training is a benchmark over the others with unmatched benefits towards engagement, effectiveness, and thriftiness. For organizations with a strong emphasis on safety and operational performance, VR can be viewed as an enabling technology that not only meets regulatory requirements but also maintains organizational competitiveness and resilience in the innovation-based world market on the basis of safety standards. Table 1 provides an overview of the literature on potential drivers for VR in construction safety training.
2. Materials and Methods
To ensure the accomplishment of the goals of this research, the research strategy used was a questionnaire survey. The survey conducted a test of the consensus among Ghanaian professionals regarding the hindrances to undertaking virtual reality (VR) safety training. Figure 1 illustrates that the research process of this research included four major steps: literature review, questionnaire design and administration, collection and analysis of questionnaire data, and reporting results.
The study initially identified drivers through an extensive literature review. It was quantitative, employing questionnaire surveys to gather numerical data for in-depth analysis [45]. From the literature, a structured questionnaire was developed based on a 5-point Likert scale, which is renowned for being capable of eliciting participant opinions [46]. Construction experts in Accra, Koforidua, and Kumasi were selected randomly depending on their willingness and availability to participate in the study. Purposive sampling was employed to select participants deliberately who would be in a position to provide meaningful information regarding VR safety training in the Ghanaian construction industry. The population under study consisted of a combination of professionals including project managers, builders, masons, electricians, plumbers, carpenters, site supervisors, contractors, health and safety officers, site inspectors, civil engineers, architects, and quantity surveyors. Electronic questionnaires were distributed by means of email invitations and Google Forms, with paper-based copies provided for those without electronic access. 180 questionnaires were distributed, and 153 were returned completely filled in, providing an approximate response rate of 85%, which gives robust data for analysis [46]. Data analysis was conducted using IBM SPSS version 27 with descriptive and inferential statistics. Reliability was determined using Cronbach's alpha, and a value of 0.70 was employed as the cut-off for good internal consistency [47]. MIS was utilized for ranking drivers in virtual reality (VR) usage in safety training by means of participant rating and n1 through n5 to denote 'Strongly Disagree' through to 'Strongly Agree'. Criteria ranked via MIS with the order of ranking starting from greatest significance. For further examining the data, a one-sample t-test was employed to contrast mean responses with a specified test value and determine whether there were statistically significant differences. ANOVA was also used to assess differences between different groups, examining whether the means of multiple groups differed significantly from each other. Factor analysis was used to identify and categorize VR safety training drivers according to their shared relationship since this provided the chance to identify key elements that determine the training. Factor analysis, as a statistical method of condensing study variables by identifying correlated components [48,49], utilizes exploratory factor analysis (EFA). Factors with eigenvalues >1.0 were used, excluding factor loadings <0.5. SPSS 27 conducted EFA using principal axis factoring to extract data and varimax Kaiser normalization to first rotate, and direct oblimin Kaiser normalization in further second-order factor analysis. Validity ensured the questionnaire survey results had high levels of validity as measured by a validity test that tested measurement precision [50]. Reliability-checked data collection tool consistency, where Cronbach's alpha coefficient >0.7 ensured reliability [51]. Non-parametric tests resolved data that did not meet parametric assumptions [48]; one-way ANOVA contrasted mean differences between independent groups [52], with statistical significance at p<0.05.
3. Results
3.1. Characteristics of Respondents
Table 2 (Appendix A) presents the profile of the respondents by occupation, academic qualification level, and years of experience. The most frequent category, 20.9%, was site supervisors, and most of them were directly involved in the management of construction sites. The second largest group was builders who made up 20.3% of the respondents, indicating their central role in construction work. The civil engineers made up 9.2% of the survey, highlighting their important position in structural and technical building design. The quantity surveyors and project managers made up 7.8% each, reflecting their worth in providing project delivery and cost planning, respectively. 5.2% of the survey were masons, highlighting the continued presence of skilled manual labor in the construction sector. Contractors and plumbers accounted for 7.2% and 4.6% of the respondents, respectively, again showing the broad range of functions needed to facilitate effective completion of projects. Health and safety officers also accounted for 4.6% of the respondents, demonstrating the priority afforded to maintaining safety standards on construction sites. The rest of the occupations, including electricians, carpenters, site inspectors, and architects, were all represented between 2.6% and 3.3%, and these covered a variety of occupations across the construction industry. By educational qualifications, the evidence indicates that the largest number of respondents, at 43.8%, possess Higher National Diplomas, which indicates a good standard of technical education. BTECH degree holders constituted 22.2% of the respondents, once more indicating the level of technical specialty knowledge among the respondents. 11.1% of the respondents also possessed a bachelor's degree, and 5.2% with master's degrees, indicating a very high level of higher education among the respondents. Respondents with WASSCE constituted 7.2%, and 5.2% had certificates such as CTC or EET. The diploma holders accounted for 2.6% of the respondents, and a minority, 1.3%, were PhD holders, indicating highly specialized individuals in the industry. Concerning work experience, the statistics indicate that 47.1% of the respondents have 1 to 5 years of experience, indicating a young and vibrant workforce. The less than 1 year experience group accounted for 31.4%, which shows a tremendous amount of new professionals entering the field. The 6 to 10 years experience group accounted for 12.4%, showing a stable group with middle years of experience. Those who have 11 to 15 years and 16 to 20 years of experience make up 3.3% of the respondents, and the lowest in the group, 2.6%, is those who have more than 20 years of experience, showing very few experienced professionals. The representation is a wide young workforce with a mix of new and experienced professionals being an advantage for this research.
3.2. Ranking Drivers for Virtual Reality Integration in the Construction Industry Safety Training
Table 3 illustrates the ranking of drivers for integrating virtual reality (VR) into construction industry safety training, based on mean scores in descending order. The analysis shows that the majority of these drivers are statistically significant (p < 0.05), as indicated by the one-sample t-test value of 3.5. The mean scores of drivers fall between 3.50 and 4.03, denoting different degrees of importance according to the respondents. The most highly rated driver is "Technological Advancements in the Industry" (mean = 4.03; SD = 0.98; t(152) = 6.643; p < 0.001), highlighting the central role played by technological innovation for VR adoption. Similarly, "Improvement in Safety Culture" (mean = 4.03; SD = 0.90; t(152) = 7.208; p < 0.001) ranks second, reflecting the possibility of VR facilitating a stronger safety-focused culture in the sector. "Improved Accessibility for Remote or Distributed Teams" (mean = 3.86; SD = 0.88; t(152) = 5.026; p < 0.001) ranks third, reflecting the flexibility enabled by VR for teamwork in remote environments. The fourth driver, "Engagement and Retention of Training Content" (mean = 3.84; SD = 0.90; t(152) = 4.695; p < 0.001), indicates the value of VR in driving learning outcomes. "Customization and Personalization of Training Programs" (mean = 3.81; SD = 0.94; t(152) = 4.098; p < 0.001) is fifth showing the importance of creating VR training to the individualized needs of workers. The remaining two high drivers are "Competitive Advantage" (mean = 3.80; SD = 0.96; t(152) = 3.851; p < 0.001) and "Risk-free Environment Compared to Real-World Training" (mean = 3.80; SD = 1.04; t(152) = 3.534; p < 0.001), both of which indicate the ability of VR to provide risk-free, cost-effective training environments that translate into a strategic advantage. "Data-Driven Insights" (mean = 3.78; SD = 0.97; t(152) = 3.640; p < 0.001) and "Realistic Training Environments and High-Quality Simulations" (mean = 3.76; SD = 0.94; t(152) = 3.493; p < 0.001) follow closely, demonstrating the value of VR’s detailed feedback mechanisms and immersive simulations. The scalability of training programs (mean = 3.76; SD = 0.90; t(152) = 3.564; p < 0.001) and real-time performance tracking (mean = 3.75; SD = 1.00; t(152) = 3.021; p = 0.003) are also significant, illustrating the efficiency and adaptability of VR-based training methods. Drivers with low statistical significance were "Simulation of Rare or High-Risk Scenarios" (mean = 3.66; SD = 0.98; t(152) = 2.019; p = 0.045), "Cost of Safety Training" (mean = 3.63; SD = 0.93; t(152) = 1.693; p = 0.092), and "Reduction in Training Time" (mean = 3.62; SD = 1.09; t(152) = 1.367; p = 0.174), among others. The findings provide valuable insight into the strongest drivers for the adoption of VR in construction safety training, with particular emphasis on technological advancement, safety culture, and improved accessibility.
3.3. Kruskal Wallis (One-Way Analysis of Variance ANOVA) Test in Examining Differences in Respondents' Perceptions of Drivers for VR Integration in Safety Training
A Kruskal-Wallis one-way analysis of variance (ANOVA) test was employed to examine the variation in perceptions of respondents from various professional backgrounds regarding the drivers for virtual reality (VR) adoption in construction industry safety training. The test hypothesis was that there were no variations in perceptions between professions. The significance level of the analysis was 0.05, and Table 4 (See Appendix B) presents the results. The data was not normally distributed, as determined by the Kolmogorov–Smirnov test. Nevertheless, the Kruskal-Wallis test was used because it is suitable for use with non-parametric data. Table 4 (See Appendix B) indicates that there were statistically significant differences in perception among drivers based on various professional backgrounds (p < 0.05), whereas in others there were no statistical differences, depicting divergence in evaluation of the significance of these drivers by professionals from various roles of the construction industry. Health and Safety Officers ranked "Technological Advancements in the Industry" (mean = 108.57) and "Improvement in Safety Culture" (mean = 98.36) as the key drivers facilitating the use of virtual reality in a systematic way, thus emphasizing the significance of technology development and robust safety culture from their professional viewpoint. Conversely, Project Managers ranked "Real-time/Immediate Training Feedback and Performance Tracking" (mean = 97.50) and "Technological Advancements in the Industry" (mean = 92.38) as a top priority, which is due to their focus on leveraging virtual reality to optimize the performance of employees and monitor progress more effectively in real-time. Quantity Surveyors place high emphasis on "Technological Advancements within the Industry" (mean = 92.46), reflecting the views of Project Managers and Health and Safety Officers. However, they positioned a lesser extent of importance for "Competitive Advantage" (mean = 80.79), indicating a more conservative approach to the strategic advantages associated with virtual reality implementation. On the other hand, contractors ranked "Technological Advancements" (mean = 86.68) at a moderate level of priority, and they gave higher priority to "Customization and Personalization of Training Programs" (mean = 83.29), consistent with their training solution emphasis on very customized solutions that address the unique needs of on-site settings. Masons and Electricians also had different priorities, with Masons ranking "Real-time/Immediate Training Feedback" lowest (mean = 79.56) of the other groups and perhaps having lower use of feedback mechanisms in their work. Electricians, however, marked "Cost of Safety Training" highest (mean = 95.60), suggesting financial motivations as a blanket motivator for opting to use VR for safety training. Electricians also marked "Technological Advancements" highest (mean = 90.30), suggesting staying updated with the current technologies in their field of work. Interestingly, Carpenters rated "Cost of Safety Training" (mean = 104.70) and "Competitive Advantage" (mean = 104.70) as most important, indicating the factor of virtual reality being cost-effective and leading to competitive advantage. This finding concurs with the financial issues expressed by other industries; however, their assessment of the other drivers, like "Technological Advancements" (mean = 62.60), was quite conservative, echoing the preference for the cost factors over technological innovations. Site Supervisors were more balanced in their perspective, showing moderate judgments across various influencing factors. The participants ranked "Technological Advancements" (mean = 82.27) and "Real-time/Immediate Training Feedback" (mean = 73.64) with high importance, but their rankings were more towards the middle range, suggesting a balanced strategy towards the adoption of virtual reality (VR). Contractors also demonstrated intermediate ratings, with the highest rating awarded to "Technological Advancements" (mean = 91.21) and "Real-time Feedback" (mean = 84.21), reflecting an overall perception of the advantages of VR. Architects and Civil Engineers displayed some variation in priorities. Architects placed "Customization and Personalization of Training Programs" (mean = 103.80) and "Technological Advancements" (mean = 93.60) as leading drivers, indicating strong interest in customized solutions and remaining abreast of industry innovation. Conversely, Civil Engineers placed "Technological Advancements" much lower (mean = 48.04), indicating relatively less focus on this factor. Civil Engineers, on the other hand, showed a moderate level of concern towards "Real-time/Immediate Feedback" (mean = 60.96) and "Risk-free Training Environments" (mean = 48.04), reflecting perhaps their focus on practicality and safety issues in training environments. Site Inspectors rated "Technological Advancements" lower (mean = 66.38) than Health and Safety Officers and Project Managers but highly rated "Customization and Personalization of Training Programs" (mean = 95.63), indicating concern for flexible training programs to meet specific safety issues on-site. The findings from the Kruskal-Wallis test indicate that, although there are some variations in the perceptions of respondents from various professional groups regarding the determinants underlying the integration of VR, there is a general agreement on the relevance of major factors such as technological innovation, individualization of training programs, and providing feedback in real-time. Yet, economic factors, including the costs of training and the pursuit of competitive advantage, are far more prominent in some professions, such as carpenters and Electricians. The general differences in perception based on job role validate the importance of individually tailored strategies when promoting VR adoption in safety training in the construction industry.
3.4. Exploratory Factor Analysis on the Drivers for Virtual Reality Integration in Safety Training Within the Construction Industry
The responses were also analyzed through Exploratory Factor Analysis (EFA). The appropriateness of the data was checked by finding the correlation matrix, wherein values of 0.3 and above fell within the factor analysis requirement limit. Table 5 shows the Kaiser-Meyer-Olkin (KMO) measure was 0.872, much above the threshold of 0.6. In addition, Bartlett's test of sphericity also confirmed statistical significance on all the variables with a p-value of 0.001, which is far less than 0.050, confirming factorability. The correlation matrix also confirmed data suitability for factor analysis as it displayed correlation coefficients higher than 0.3, confirming findings of KMO and Bartlett's tests. Table 6 indicates the total variance explained by all the variables, whose eigenvalues were determined applying Kaiser's criterion. As evident from the table, the first four components with eigenvalues greater than 1.0, in the initial eigenvalue column, are meaningful because they have their eigenvalues considerably above 1.0 and in combination explain the cumulative percentage of 56.780% of the total variance. The first component explains 35.654% of variance, followed by the second 7.529%, third 7.041%, and fourth 6.555%. The total percentage reveals that these components explain a large percentage of variability in the data and hence are of tremendous significance in determining the structure of the data.
Factor Cluster Report
Table 7 presents the pattern matrix derived from Principal Component Analysis (PCA) with Varimax rotation, which extracted four factors with eigenvalues greater than 1. These factors represent clusters of variables explaining a great percentage of the data variance. Based on the variable relationships, the interpretations were as follows:
The first factor, "Technological and Safety Enhancements", includes six variables: 'Technological Advancements in the Industry' (loading = 0.520), 'Competitive Advantage' (loading = 0.446), 'Realistic Training Environments and High-Quality Simulations' (loading = 0.732), 'Risk-Free Environment Compared to Real-World Training' (loading = 0.654), 'Real-Time/Immediate Training Feedback and Performance Tracking for Workers' (loading = 0.608), and 'Improvement in Safety Culture' (loading = 0.613). This explains the highest proportion of the variance, citing technological advancement and safety improvement as the most important factors to enable VR adoption in safety training.
The second factor, "Regulatory and Financial Drivers", includes five variables: 'Government/Organizational Regulations and Policies' (loading = 0.611), 'Under-Performance of Safety Statistics' (loading = 0.506), 'Cost of Safety Training' (loading = 0.731), 'Stakeholder Pressure' (loading = 0.791), and 'Data-Driven Insights' (loading = 0.447). This factor highlights the impact of regulatory climates, fiscal pressures, and external pressures on the implementation of VR in safety training.
The third factor, "Customization and Accessibility," includes four variables: 'Enhanced Accessibility for Remote or Distributed Teams' (loading = 0.532), 'Customization and Personalization of Training Programs' (loading = 0.659), 'Engagement and Retention of Training Content' (loading = 0.734), and 'Scalability of Training Programs' (loading = 0.759). The factor captures focus on creating flexible, engaging, and scalable training solutions that can meet different team requirements.
The fourth dimension, labeled "Operational Efficiency and Risk Management," includes two indicators: 'Reduction in Training Time' (loading = 0.850) and 'Simulation of Rare or High-Risk Scenarios' (loading = 0.758). The dimension emphasizes the effectiveness of VR training in reducing training time and its use in subjecting workers to rare or high-risk situations.
The Cronbach's Alpha coefficients also determined the reliability of clusters created (See Table 7). "Technological and Safety Features" also yields the highest consistency, at Cronbach's Alpha = 0.792, which implies very high internal consistency between variables within this factor. "Customization and Accessibility" then follows at a score of Alpha = 0.758, indicating reasonable reliability between variables under customization and accessibility. "Regulatory and Financial Drivers" also provides a Cronbach's Alpha = 0.719, far above the acceptable limit, in support of internal consistency among regulatory and financial drivers. "Operational Efficiency and Risk Management" has an Alpha of 0.715, which indicates high internal consistency among variables that deal with efficiency and risk management. These reliability coefficients ensure that the clusters obtained are consistent in terms of measuring the constructs under them, and one can be sure of the result of the analysis.
4. Discussion
To ascertain the drivers for virtual reality (VR) integration for construction industry safety training, exploratory factor analysis was employed to generate five clusters. Every cluster is a combination of similar drivers, providing a comprehensive overview of the drivers for VR adoption. The clusters are described extensively to elicit the distinguishing features in each cluster and their implications for VR integration in the construction.
4.1. Cluster One - Technological and Safety Enhancements
This cluster, accounting for 35.654% of the explained variance, has six underlying variables: 'Technological Advances in Industry' (0.520), 'Competitive Advantage' (0.446), 'High-Quality Simulations and Realistic Training Environments' (0.732), 'Risk-Free Environment in Comparison to Real-World Training' (0.654), 'Real-Time/Immediate Training Performance Monitoring and Feedback for Workers' (0.608), and 'Enhanced Improvement in Safety Culture' (0.613). The high variance accounted for by this cluster indicates the key role played by technology and advancements in safety in driving VR adoption among construction companies. The dimension of 'Technological Advancements in Industry' refers to the growing concern by the industry to adopt advanced technologies in order to stay competitive and improve safety protocols. VR's capability for 'Realistic Training Environments and High-Quality Simulations' is especially valued, as it provides employees with immersive, realistic training sessions that replicate actual work activities without incurring risks present on actual worksites. This supports [2,21] assertions that highlight the importance of VR as an insurer of safe, immersive training. Moreover, variables 'Risk-Free Environment Compared to Real-World Training' and 'Real-Time/Immediate Training Feedback and Performance Tracking for Workers' underscore VR's ability to reduce the risk involved with training while giving immediate, actionable feedback—a key consideration in the development of reinforcement learning and allowing workers to make mistakes in a risk-free environment before practicing in the real world. Lastly, 'Improvement in Safety Culture' resonates with a movement within the industry to prioritize safety, positioning VR as a key tool for building a robust safety culture. The application of VR not only introduces new technology but also a shift in the manner safety is thought about and implemented within the industry, something endorsed by [1,53], who identify that advances in safety technology are responsible for enhancing the safety culture of the construction industry.
4.2. Cluster Two - Regulatory and Financial Drivers
This cluster, accounting for 16.520% of the variance, comprises the variables: 'Government/Organizational Regulations and Policies' (0.611), 'Under-Performance of Safety Statistics' (0.506), 'Cost of Safety Training' (0.731), 'Stakeholder Pressure' (0.791), and 'Data-Driven Insights' (0.447). This cluster's influence shows the firm influence on regulatory mechanisms, cost implications, and pressure from external actors on opting to use VR for safety training. Interventions such as 'Government/Organizational Regulations and Policies' and 'Stakeholder Pressure' suggest that compliance with regulatory requirements and stakeholder demands are primary drivers towards VR adoption. Since construction companies are under stringent safety legislation, VR can meet such requirements and avoid legal or financial sanctions. [3,12] also point out how external forces, particularly in safety-critical industries, can accelerate the adoption of technology. The addition of 'Cost of Safety Training' embodies the cost consideration of deploying VR. Even as VR can come with significant initial expenses, the future dividends that it generates through improved safety performance and decreased accidents make it an economic choice for organizations. [11] align with this viewpoint by stressing the cost-effectiveness of VR as a vital aspect of its implementation in safety training. In conclusion, the addition of 'Data-Driven Insights' to the category reflects increasing reliance on data to enhance and optimize training initiatives. By using data analytics, companies can continuously refine their training programs to make them both effective and pertinent. This trend toward practice based on data is in keeping with the broader industry trend towards using analytics to improve operational performance, as Chan et al. [19] and Rosen et al. [34] document. The difference in perception of the relevance of data-driven insights among industry segments, as evident from the Kruskal-Wallis test, suggests that while some segments of the industry are embracing data analytics in training, others may need further advice and support in adopting this practice completely.
4.3. Cluster Three - Customization and Accessibility
This component, which explains 14.481% of the variance, includes four variables: 'Augmented Accessibility for Remote or Distributed Teams' (loading = 0.532), 'Personalization and Customization of Training Programs' (loading = 0.659), 'Training Content Engagement and Retention' (loading = 0.734), and 'Training Program Scalability' (loading = 0.759). The focus of this cluster is on the flexibility, extent, and effectiveness of VR training, particularly in the context of a globalized and more heterogeneous workforce. Reference to 'Improved Accessibility for Remote or Distributed Teams' highlights the need to make training available to all, especially in the construction industry, where teams are typically spread across multiple sites. The ability of VR to provide uniform and quality training to remote workers ensures that each worker, far or near, is exposed to consistent learning. This concurs with studies conducted by [21,22], who establish that VR can bridge disparities between remote groups. 'Customization and Personalization of Training Programs' is a reflection of the growing demand for adaptive training solutions that respond to the specific requirements of different individuals and groups. The adaptability of VR as a modality allows it to develop tailored training modules addressing the specific issues of various workers, thus improving the effectiveness of the overall training. [36,54] also mention the increasing need for workplace individualization, which VR is architected to provide. Both variables 'Engagement and Retention of Training Content' and 'Scalability of Training Programs' highlight VR's value in providing highly engaging training that not only captures workers' attention but also increases their own retention of critical safety information. The scalability of VR training solutions also allows organizations to deploy these solutions uniformly to groups of employees by the thousands, providing high-quality, consistent learning experience. [24,37] underscore the engagement and retention function of training, noting that the immersion capabilities of VR significantly enhance these functions compared to traditional solutions.
4.4. Cluster Four – Operational Efficiency and Risk Management
The final cluster, accounting for 10.582% of the variance, comprises the two most significant variables: 'Reduction in Training Time' (loading = 0.850) and 'Simulation of Rare or High-Risk Scenarios' (loading = 0.758). The cluster here deals with the operational benefits of VR training, particularly concerning efficiency and risk management. 'Reduction in Training Time' indicates one of the largest strengths of VR—its ability to cut the training process. VR allows workers to undergo targeted, intense training sessions, learning more content in less time than traditional methods. This increased productivity is particularly beneficial in the construction industry, where downtime must be kept to a minimum. [39,40] seconds, this observation notes that VR cuts employee training time by a significant amount. The 'Simulation of Rare or High-Risk Situations' factor emphasizes VR's unique ability to simulate dangerous situations that would be difficult or impossible to recreate in real life. Through this capability, employees can practice responding to emergencies and other high-risk scenarios without endangering themselves, thus becoming better prepared and confident. [25,26] highlight the imperative role of VR in risk management, particularly in training for improbable but potentially catastrophic events.
4.5. Substantial Contributions and Implications
This study makes significant contributions by identifying and organizing the most compelling drivers for VR adoption in construction safety training. It is the first contribution that technological innovation and safety improvement are the primary drivers towards VR adoption. These findings offer a structured view of VR drivers of adoption, particularly with an emphasis on the application of immersive and accessible training in the construction sector. Moreover, this research adds to the literature on the application of VR in the construction sector, particularly in developing economies such as Ghana, where such technologies are emerging. This study provides a brief distinction of the key drivers with positive implications for industry stakeholders wanting to improve safety training through VR.
4.6. Practical Implications
The study offers a few practical implications from the findings, especially for industry actors with an interest in implementing VR in their safety training programs:
- Investment in Technology: The leading position of technological advances means that construction firms need to prioritize investment in cutting-edge VR technologies. This includes the purchase of VR hardware and software, allowing for the creation of realistic, high-quality simulations that can be used to support immersive and safe training exercises. Organizations that continue to be technologically up-to-date will experience improved training outcomes and more effective safety cultures.
- Enhancing Safety Culture: The study highlights the necessity of VR in developing a stronger safety culture within the construction industry. The integration of VR allows companies to promote better safety behaviors by providing immersive training that effectively simulates actual hazards in real-life settings without risking the workers with actual danger. Industry captains need to stress promoting VR as a method of inculcating a safety-first culture across all levels of employees.
- Scalable and Customizable Training Solutions: The ability of VR to provide personalized training experiences based on specific learning needs is of utmost importance. Construction companies should design VR modules addressing the distinctive challenges of different tasks and roles in the industry so that training is current and engaging. In addition, the scalability of VR allows it to be implemented with huge, geographically dispersed teams, making it an ideal solution for companies with dispersed or remote operations.
- Focus on Engagement and Retention: One of the greatest advantages of VR is its potential for increasing engagement and retention of learning content. Businesses must emphasize the experiential capacity of VR as a way of enhancing employee participation, with the effect of enhanced retention and a better workforce. Integrating VR as part of safety training can result in enhanced training systems that are more enjoyable yet simultaneously bring about lasting transformations in labor performance and work safety.
- Collaboration of Industry Players: Industry players such as construction companies, training providers, and technology firms need to collaborate to create quality VR training programs. This can lead to pooled resources, better content creation, and more affordable access to VR equipment for small businesses. Standardization of VR training programs and ensuring alignment with industry requirements through collaboration will make them more effective.
4.7. Recommendations
Based on the findings, several recommendations are made for industry operators to promote the use of VR in construction safety training:
- Enhance Technological Infrastructure: Construction companies must invest heavily in VR technology to create and enhance their training facilities. These involve buying VR headsets, designing in-house training modules, and entering into collaborations with vendors of VR software to create training programs specific to the industry's needs.
- Creating a Strong Safety Culture Through VR: In order to improve safety measures, businesses must integrate VR into their safety procedures and make it a part of the training process. Simulating real-world dangers in a secure environment, VR enables employees to learn more about safety procedures.
- Tailoring Training for Different Roles: VR's flexibility facilitates the development of customized training to suit the singular needs of varying construction roles. Companies need to develop VR modules tailored to various tasks and skill levels, ensuring that training remains effective and relevant throughout the workforce.
- Collaboration of Industry Players: In order to make VR adoption more convenient, industry players like large building firms, small contractors, and technology providers should collaborate. Mutual sharing of knowledge and resources enables companies to lower the costs associated with integrating VR and develop communal training programs for the benefit of the entire sector.
- Remote Team Accessibility Enhanced: Construction companies can leverage the ability of VR to train remote or distributed teams. Giving employees, wherever they may be located, access to the same top-quality training will improve consistency and raise safety levels across the industry.
Implementing these steps will enable the construction industry to implement VR technology effectively in safety training programs, enhancing training outcomes and creating a safer, more productive workforce.
5. Conclusions
This study has tabulated the findings of a survey for establishing the most crucial drivers for Virtual Reality (VR) safety training adoption in the Ghanaian construction industry. The most notable drivers, in descending order, are technological innovation in the sector, enhancing safety culture, easier access for physically scattered or remote personnel, training content maintenance and retention, and customizing and tailoring training modules. These drivers point to the role of modern technology, flexible and scalable training methods, and the need for improved safety protocols. Four primary factors influencing the adoption of VR were revealed through factor analysis: Technological and Safety Enhancements, Regulative and Economic Drivers, Customization and Accessibility, and Operational Efficiency and Risk Mitigation. These factors determine the drivers of VR adoption in construction safety training, providing insights into how the industry can benefit from VR to enhance training efficacy and safety levels.
Appendix A

Table 2.
Respondents’ demographic profile.
| Demographic Information | No. of Respondents | % | Cumulative |
|---|---|---|---|
| Professional background | |||
| Project manager | 12 | 7.8 | 7.8 |
| Builder | 31 | 20.3 | 28.1 |
| Mason | 8 | 5.2 | 33.3 |
| Electrician | 5 | 3.3 | 36.6 |
| Plumber | 11 | 7.2 | 43.8 |
| Carpenter | 5 | 3.3 | 47.1 |
| Site Supervisor | 32 | 20.9 | 68.0 |
| Contractor | 7 | 4.6 | 72.5 |
| Health and Safety Officer | 7 | 4.6 | 77.1 |
| Site Inspector | 4 | 2.6 | 79.7 |
| Civil Engineer | 14 | 9.2 | 88.9 |
| Architect | 5 | 3.3 | 92.2 |
| Quantity Surveyor | 12 | 7.8 | 100.0 |
| Academic qualification | |||
| BECE | 2 | 1.3 | 1.3 |
| WASSCE | 11 | 7.2 | 8.5 |
| BSc Degree | 17 | 11.1 | 19.6 |
| BTECH | 34 | 22.2 | 41.8 |
| Certificate (CTC, EET) | 8 | 5.2 | 47.0 |
| Diploma | 4 | 2.6 | 49.6 |
| Higher National Diploma | 67 | 43.8 | 93.4 |
| Master's Degree | 8 | 5.2 | 98.6 |
| PhD | 2 | 1.3 | 100 |
| Years of Experience | |||
| Less than 1 year | 48 | 31.4 | 31.4 |
| 1-5 years | 72 | 47.1 | 78.4 |
| 6- 10 years | 19 | 12.4 | 90.8 |
| 11-15 years | 5 | 3.3 | 94.1 |
| 16-20 years | 5 | 3.3 | 97.4 |
| More than 20 years | 4 | 2.6 | 100.0 |
Source: Authors’ Construct.
Appendix B
Table 4.
One-way analysis of variance (ANOVA) to examine any differences in the perceptions of the respondent professional background.
Table 4.
One-way analysis of variance (ANOVA) to examine any differences in the perceptions of the respondent professional background.
| Drivers | DR-1 | DR-2 | DR-3 | DR-4 | DR-5 | DR-6 | DR-7 | DR-8 | DR-9 | DR-10 | DR-11 | DR-12 | DR-13 | DR-14 | DR-15 | DR-16 | DR-17 | |
| Project manager | Rank | 4 | 9 | 2 | 5 | 5 | 8 | 3 | 3 | 2 | 2 | 6 | 3 | 5 | 6 | 2 | 4 | 4 |
| Mean | 86.92 | 67.92 | 93.29 | 86.58 | 86.79 | 79.88 | 92.38 | 90.50 | 97.50 | 88.67 | 80.13 | 91.92 | 81.63 | 81.17 | 91.46 | 95.88 | 82.00 | |
| Builder | Rank | 5 | 3 | 6 | 6 | 8 | 6 | 8 | 8 | 8 | 8 | 10 | 4 | 6 | 8 | 7 | 10 | 9 |
| Mean | 86.68 | 88.60 | 80.27 | 79.76 | 79.32 | 81.68 | 72.61 | 73.55 | 68.31 | 74.23 | 74.60 | 83.29 | 78.97 | 75.74 | 74.82 | 67.47 | 70.87 | |
| Mason | Rank | 7 | 13 | 13 | 13 | 13 | 13 | 10 | 2 | 12 | 5 | 8 | 10 | 9 | 7 | 10 | 7 | 10 |
| Mean | 76.50 | 42.69 | 45.25 | 51.31 | 40.75 | 52.56 | 63.06 | 98.38 | 79.56 | 68.56 | 75.00 | 58.13 | 74.75 | 77.06 | 70.19 | 74.31 | 69.56 | |
| Electrician | Rank | 3 | 12 | 10 | 1 | 1 | 10 | 4 | 7 | 6 | 10 | 4 | 8 | 11 | 11 | 6 | 13 | 12 |
| Mean | 90.30 | 56.50 | 64.60 | 95.60 | 105.80 | 67.00 | 90.70 | 77.10 | 67.50 | 78.20 | 87.80 | 67.00 | 65.80 | 70.50 | 82.10 | 62.20 | 67.60 | |
| Plumber | Rank | 2 | 5 | 7 | 10 | 10 | 4 | 5 | 6 | 7 | 3 | 5 | 2 | 4 | 2 | 1 | 8 | 6 |
| Mean | 95.55 | 86.09 | 75.82 | 67.91 | 74.32 | 92.86 | 84.82 | 80.91 | 93..45 | 75.09 | 81.95 | 92.82 | 81.64 | 91.45 | 98.50 | 71.73 | 75.27 | |
| Carpenter | Rank | 11 | 7 | 12 | 3 | 2 | 1 | 11 | 1 | 3 | 12 | 12 | 12 | 12 | 5 | 8 | 6 | 8 |
| Mean | 64.20 | 75.30 | 62.20 | 93.30 | 103.90 | 104.70 | 62.60 | 103.20 | 63.10 | 84.40 | 71.00 | 51.80 | 48.20 | 81.30 | 70.90 | 80.70 | 73.70 | |
| Site Supervisor | Rank | 1 | 6 | 9 | 8 | 7 | 9 | 6 | 12 | 5 | 7 | 9 | 6 | 7 | 4 | 9 | 11 | 7 |
| Mean | 69.44 | 79.19 | 69.80 | 78.39 | 80.64 | 70.53 | 82.27 | 68.59 | 73.64 | 78.95 | 74.66 | 79.41 | 77.41 | 82.53 | 70.64 | 67.17 | 74.38 | |
| Contractor | Rank | 10 | 4 | 3 | 9 | 3 | 5 | 7 | 10 | 1 | 4 | 11 | 9 | 13 | 9 | 13 | 12 | 2 |
| Mean | 68.50 | 88.07 | 91.86 | 77.50 | 91.21 | 82.71 | 77.00 | 70.43 | 84.21 | 99.00 | 74.00 | 60.71 | 47.21 | 75.57 | 56.64 | 65.07 | 86.07 | |
| Health and Safety Officer | Rank | 8 | 1 | 1 | 12 | 9 | 2 | 1 | 4 | 4 | 1 | 2 | 1 | 2 | 10 | 4 | 1 | 3 |
| Mean | 74.79 | 94.50 | 112.21 | 62.64 | 77.79 | 98.36 | 108.57 | 88.64 | 119.17 | 84.36 | 97.50 | 105.71 | 97.50 | 70.57 | 89.93 | 104.71 | 86.07 | |
| Site Inspector | Rank | 9 | 8 | 8 | 2 | 7 | 11 | 9 | 13 | 11 | 11 | 3 | 13 | 3 | 3 | 3 | 2 | 11 |
| Mean | 112.13 | 73.88 | 73.00 | 95.50 | 87.25 | 64.50 | 66.38 | 67.38 | 65.88 | 71.50 | 95.63 | 51.50 | 95.50 | 87.50 | 90.50 | 103.00 | 68.50 | |
| Civil Engineer | Rank | 13 | 11 | 5 | 11 | 12 | 12 | 12 | 9 | 10 | 13 | 13 | 11 | 10 | 13 | 11 | 5 | 5 |
| Mean | 56.71 | 64.82 | 82.57 | 65.07 | 54.14 | 55.00 | 48.04 | 70.82 | 60.96 | 73.71 | 56.57 | 54.64 | 69.46 | 58.75 | 69.29 | 80.96 | 80.07 | |
| Architect | Rank | 6 | 2 | 4 | 4 | 6 | 3 | 13 | 5 | 13 | 9 | 1 | 7 | 1 | 1 | 12 | 9 | 13 |
| Mean | 81.80 | 89.70 | 91.60 | 87.80 | 81.20 | 93.60 | 47.70 | 87.20 | 68.00 | 42.80 | 103.80 | 72.60 | 103.90 | 92.70 | 66.00 | 70.40 | 67.60 | |
| Quantity Surveyor | Rank | 12 | 10 | 11 | 7 | 11 | 7 | 2 | 11 | 9 | 6 | 7 | 5 | 8 | 12 | 5 | 3 | 1 |
| Mean | 61.58 | 67.38 | 64.58 | 78.83 | 67.67 | 80.79 | 92.46 | 69.25 | 75.42 | 73.88 | 77.38 | 81.33 | 76.96 | 65.79 | 83.79 | 100.46 | 99.25 |
Source: Authors’ Construct.
References
- Onyesolu, M. O., & Eze, F. U. (2011). Understanding virtual reality technology: advances and applications. Adv. Comput. Sci. Eng, 1, 53-70.
- González-Franco, M., & Lanier, J. (2017). Model of illusions and virtual reality. Frontiers in Psychology, 8, 1125. [CrossRef]
- Dhalmahapatra, K., Maiti, J., & Krishna, O. B. (2021). Assessment of virtual reality-based safety training simulator for electric overhead crane operations. Safety science, 139, 105241. [CrossRef]
- Torres-Guerrero, F., Sanchez, R., & Neira-Tovar, L. (2020, September). Virtual Reality Trainer in the Evaluation of International Safety Standards in Fire Situations. In 2020 IEEE Games, Multimedia, Animation and Multiple Realities Conference (GMAX) (pp. 1-4). IEEE. [CrossRef]
- Shi, C., Miao, X., Liu, H., Han, Y., Wang, Y., Gao, W., Liu, G., Li, S., Lin, Y., Wei, X., & Xu, T. (2023). How to promote the sustainable development of virtual reality technology for training in construction filed: A tripartite evolutionary game analysis. Plos one, 18(9), e0290957. [CrossRef]
- Wahidi, M. M., Khan, Y. A., Ong, C. S., & Annabi, M. A. (2022). The role of virtual reality in medical education: A focus on cardiothoracic surgery training. Journal of Thoracic Disease, 14(9), 3488-3499. [CrossRef]
- Nickel, P. E., Lungfiel, A. N., Nischalke-Fehn, G. E., & Trabold, R. J. (2013). A virtual reality pilot study towards elevating work platform safety and usability in accident prevention. Safety Science Monitor, 17(2), 10-17.
- Sacks, R., Perlman, A., & Barak, R. (2013). Construction safety training using immersive virtual reality. Construction Management and Economics, 31(9), 1005-1017. [CrossRef]
- Avveduto, G., Tanca, C., Lorenzini, C., Tecchia, F., Carrozzino, M., & Bergamasco, M. (2017). Safety training using virtual reality: A comparative approach. In Augmented Reality, Virtual Reality, and Computer Graphics: 4th International Conference, AVR 2017, Ugento, Italy, June 12-15, 2017, Proceedings, Part I 4 (pp. 148-163). Springer International Publishing. [CrossRef]
- Huang, D., Wang, X., Liu, J., Li, J., & Tang, W. (2022). Virtual reality safety training using deep EEG-net and physiology data. The visual computer, 38(4), 1195-1207. [CrossRef]
- Pedram, S., Ogie, R., Palmisano, S., Farrelly, M., & Perez, P. (2021). Cost–benefit analysis of virtual reality-based training for emergency rescue workers: a socio-technical systems approach. Virtual Reality, 25(4), 1071-1086. [CrossRef]
- Mossel, A., Peer, A., Göllner, J., & Kaufmann, H. (2015). Requirements analysis on a virtual reality training system for CBRN crisis preparedness. In Proceedings of the 59th Annual Meeting of the ISSS-2015 Berlin, Germany (Vol. 1, No. 1).
- Lawson, G., Salanitri, D., & Waterfield, B. (2015). The future of Virtual Reality in the automotive industry. In VR Processes in the Automotive Industry, 17th International Conference, HCI International 2015, Los Angeles, CA.
- Ghobadi, M., & Sepasgozar, S. M. (2020). An investigation of virtual reality technology adoption in the construction industry (pp. 1-35). London, UK: IntechOpen.
- Smith, J., Jones, A., & Brown, L. (2020). Enhancing Remote Training through Virtual Reality. Journal of Occupational Safety, 15(4), 233-245.
- Johnson, M., & Brown, C. (2021). Virtual reality in healthcare education: A systematic review. Nurse Education Today, 97, 104652.
- Bell, B. S., & Federman, J. E. (2013). E-learning in postsecondary education. The Future of Children, 23(1), 165-185.
- Boud, D., & Molloy, E. (2013). Feedback in Higher and Professional Education: Understanding It and Doing It Well. Routledge.
- Chan, S., Huang, Y. M., & Chang, C. S. (2010). A case study on the relationship between computer self-efficacy and behavior intention toward using augmented reality in nursing education. Nurse Education Today, 30(5), 499-505.
- Rosen, M. A., Salas, E., Silvestri, S., Wu, T. S., & Lazzara, E. H. (2008). The role of teamwork in healthcare: Promoting high-reliability and teamwork in healthcare systems. Human Resource Management Review, 18(3), 207-216.
- Smith, J., Jones, A., & Brown, L. (2020). Enhancing Remote Training through Virtual Reality. Journal of Occupational Safety, 15(4), 233-245.
- Johnson, R., & Miller, T. (2021). Virtual Reality in Workplace Safety Training: Bridging the Gap for Remote Teams. International Journal of Safety and Ergonomics, 27(2), 120-130.
- Huang, H., & Liaw, S. (2018). Scaling Up Workplace Safety Training with Virtual Reality. International Journal of Training Research, 16(3), 242-255.
- Patel, K., Jain, M., & Desai, V. (2019). The Economics of VR in Large-Scale Safety Training Programs. Journal of Safety Research, 70, 123-134.
- Rizzo, A., Buckwalter, J. G., & Van der Zaag, C. (2017). Virtual Reality for Training: Current Status and Future Prospects. Journal of Occupational Safety and Ergonomics, 23(2), 213-229.
- Bruder, R., & Uhl, A. (2019). Simulating High-Risk Scenarios in VR for Safety Training. International Journal of Environmental Research and Public Health, 16(20), 3841.
- Shi, C., Miao, X., Liu, H., Han, Y., Wang, Y., Gao, W., Liu, G., Li, S., Lin, Y., Wei, X., & Xu, T. (2023). How to promote the sustainable development of virtual reality technology for training in construction filed: A tripartite evolutionary game analysis. Plos one, 18(9), e0290957. [CrossRef]
- Wahidi, M. M., Khan, Y. A., Ong, C. S., & Annabi, M. A. (2022). The role of virtual reality in medical education: A focus on cardiothoracic surgery training. Journal of Thoracic Disease, 14(9), 3488-3499. [CrossRef]
- Nickel, P. E., Lungfiel, A. N., Nischalke-Fehn, G. E., & Trabold, R. J. (2013). A virtual reality pilot study towards elevating work platform safety and usability in accident prevention. Safety Science Monitor, 17(2), 10-17.
- Baceviciute, S., Cordoba, A. L., Wismer, P., Jensen, T. V., Klausen, M., & Makransky, G. (2022). Investigating the value of immersive virtual reality tools for organizational training: An applied international study in the biotech industry. Journal of Computer Assisted Learning, 38(2), 470-487. [CrossRef]
- Bao, Q. L., Tran, S. V. T., Yang, J., Pedro, A., Pham, H. C., & Park, C. (2024). Token incentive framework for virtual-reality-based construction safety training. Automation in Construction, 158, 105167. [CrossRef]
- Mikropoulos, T. A., & Natsis, A. (2011). Educational virtual environments: A ten-year review of empirical research (1999–2009). Computers & Education, 56(3), 769-780. [CrossRef]
- Bell, B. S., & Federman, J. E. (2013). E-learning in postsecondary education. The Future of Children, 23(1), 165-185.
- Rosen, M. A., Salas, E., Silvestri, S., Wu, T. S., & Lazzara, E. H. (2008). The role of teamwork in healthcare: Promoting high-reliability and teamwork in healthcare systems. Human Resource Management Review, 18(3), 207-216.
- Anderson, P., Williams, K., & Thompson, H. (2019). Customizing Safety Training with Virtual Reality. Journal of Occupational Health and Safety, 14(3), 198-210.
- Lee, S., & Kim, J. (2020). Personalized VR Training for Enhanced Workplace Safety. International Journal of Training and Development, 24(1), 45-58.
- Bailenson, J., Yee, N., & Blascovich, J. (2018). The Impact of Virtual Reality on Learning: A Comprehensive Study. Educational Technology Research and Development, 66(2), 321-340.
- Fernandez, M. (2019). Enhancing Engagement in Safety Training through VR Gamification. Journal of Workplace Learning, 31(5), 354-370.
- Waller, M., & Cannon-Bowers, J. A. (2019). Training via Simulation: A Review of Virtual Environments and Their Impact on Skill Acquisition. Simulation & Gaming, 50(5), 607-636.
- Buttussi, F., & Chittaro, L. (2018). Effects of Different Types of Virtual Reality Display on Presence and Learning in a Safety Training Scenario. IEEE Transactions on Visualization and Computer Graphics, 24(2), 1063-1076. [CrossRef]
- Kothgassner, O. D., Felnhofer, A., Hauk, N., Kastenhofer, E., & Kryspin-Exner, I. (2019). The Potential of Virtual Reality for Safety Training in the Construction Sector. Journal of Safety Research, 69, 41-50.
- Dede, C. (2009). Immersive Interfaces for Engagement and Learning. Science, 323(5910), 66-69. [CrossRef]
- Bohle, P., & Quinlan, M. (2020). The Role of Virtual Reality in Enhancing Safety Culture. Safety Science, 127, 104706.
- Lucas, J., Bell, R., & Sutherland, D. (2018). Virtual Reality as a Tool for Improving Safety Culture in the Workplace. Journal of Safety Research, 67, 35-44.
- Kothari, C. R. (2004). Research Methodology: Methods and Techniques (2nd ed.). New Age International Publishers.
- Collins, H. (2010). Creative Research: The Theory and Practice of Research for the Creative Industries. AVA Publishing.
- Nunnally, J. C., & Bernstein, I. H. (1994). Psychometric Theory (3rd ed.). McGraw-Hill.
- Pallant, J. (2016). SPSS Survival Manual (6th ed.). McGraw-Hill Education.
- Aigbavboa, Clinton Ohis, John Edward Cobbina, Simon Ofori Ametepey, and Wellington Didibhuku Thwala. "A Quantitative Study of Sustainable Urban Transformation in Developing Countries: Results from Ghana." In Urban Alchemy: A Governance and Planning Framework for Sustainable Urban Transformation in Developing Economies, pp. 95-154. Emerald Publishing Limited, 2025.
- Kumar, R. (2011). Research Methodology: A Step-by-Step Guide for Beginners (3rd ed.). SAGE Publications.
- DeVellis, R. F. (2016). Scale Development: Theory and Applications (4th ed.). SAGE Publications.
- McCormick, K., Salcedo, J., & Poh, A. (2015). SPSS Statistics for Dummies (3rd ed.). Wiley.
- Bohle, P., & Quinlan, M. (2020). The Role of Virtual Reality in Enhancing Safety Culture. Safety Science, 127, 104706.
- Anderson, P., Williams, K., & Thompson, H. (2019). Customizing Safety Training with Virtual Reality. Journal of Occupational Health and Safety, 14(3), 198-210.
Figure 1.
Research Process. Source: Authors’ Construct.
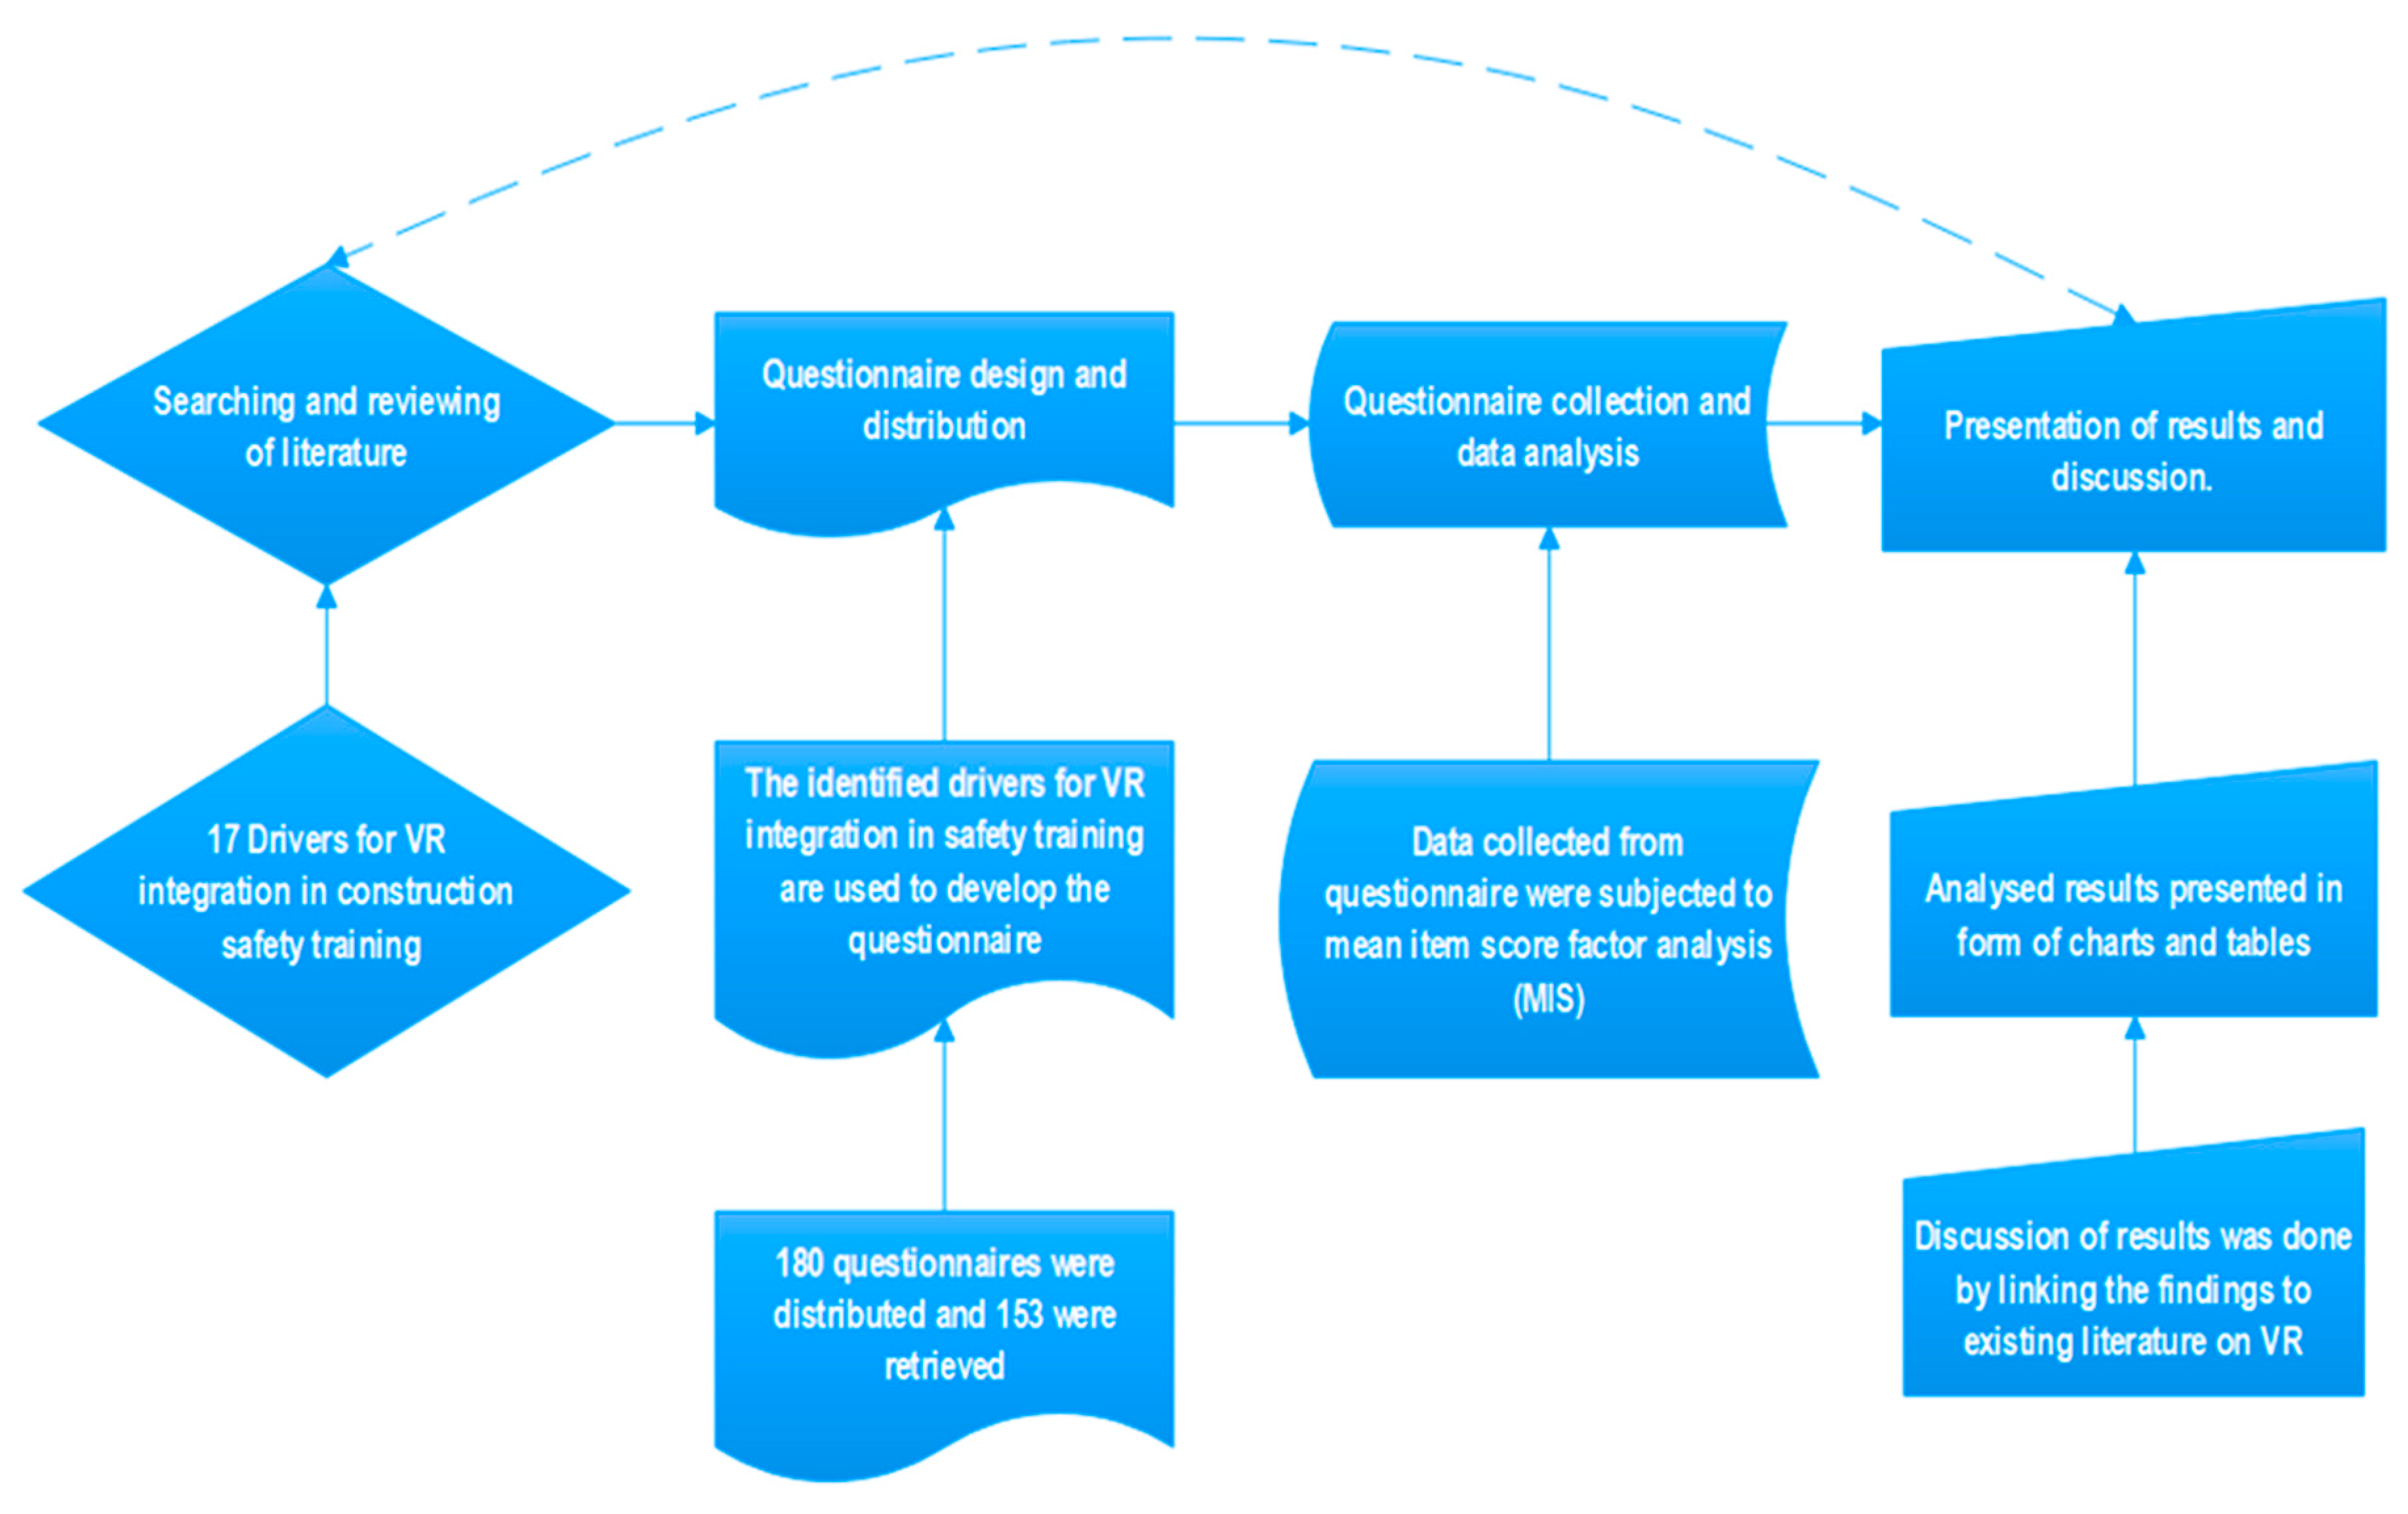
Table 1.
Summary of literature on drivers for VR integration in construction safety training. S/N.
| Drivers for VR Integration for Safety Training in the Construction Industry | Authors | |
|---|---|---|
| 1 | Technological Advancements in industry | Onyesolu & Eze, 2011 [1] |
| 2 | Government/Organizational Regulations and policies | Dhalmahapatra et al., 2022, Torres-Guerrero et al., 2020, Shi et al., 2023, Wahidi et al., 2022 [3,4,27,28] |
| 3 | Under-performance of Safety Statistics (number of injuries to enforce improved training standards) | Nickel et al., 2013, Sacks et al., 2013, Avveduto et al., 2017, Huang et al., 2022 [8,9,10,29] |
| 4 | Cost of Safety Training | Pedram et al., 2021, Avveduto et al., 2017 [9,11] |
| 5 | Stakeholder Pressure | Mossel et al., 2015, Lawson et al., 2015, Ghobadi & Sepasgozar, 2020 [12,13,14] |
| 6 | Competitive Advantage | Baceviciute et al., 2022, Bao et al., 2024 [30,31] |
| 7 | Realistic training environments and high-quality simulations | Smith et al., 2020, Johnson & Brown, 2021, Lee et al., 2019 [16,21] |
| 8 | Risk- free environment as compared to real world training | González-Franco & Lanier, 2017, Mikropoulos & Natsis, 2011 [2,32] |
| 9 | Real-time/immediate training feedback and performance tracking for workers | Bell & Federman, 2013, Boud & Molloy, 2013 [18,33] |
| 10 | Data-Driven Insights | Chan et al., 2010, Rosen et al., 2008 [19,34] |
| 11 | Enhanced Accessibility for Remote or Distributed Teams | Smith et al., 2020; Johnson & Miller, 2021 [21,22] |
| 12 | Customization and Personalization of Training Programs | Anderson et al., 2019, Lee & Kim, 2020 [35,36] |
| 13 | Engagement and Retention of Training Content | Bailenson et al., 2018, Fernandez, 2019 [37,38] |
| 14 | Scalability of Training Programs | Huang & Liaw, 2018; Patel et al., 2019 [23,24] |
| 15 | Reduction in Training Time | Waller & Cannon-Bowers, 2019, Buttussi & Chittaro, 2018, Kothgassner et al., 2019, Dede, 2009 [39,40,41,42] |
| 16 | Simulation of Rare or High-Risk Scenarios | Rizzo et al., 2017, Bruder et al., 2019 [25,26] |
| 17 | Improvement in Safety Culture | Bohle & Quinlan, 2020, Lucas et al., 2018 [43,44] |
Table 3.
Ranking the drivers for virtual reality integration in construction industry safety training.
Table 3.
Ranking the drivers for virtual reality integration in construction industry safety training.
| S/N | Drivers for Virtual Reality Integration in Safety Training Within the Construction Industry | Mean | Std. | t-Value (μ = 3.5) | df | Sig.(2-Tailed) | Mean Difference | Rank | Significant (p< 0.05) |
|---|---|---|---|---|---|---|---|---|---|
| DR-1 | Technological Advancements in the industry | 4.03 | 0.980 | 6.643 | 152 | .001 | .526 | 1 | Yes |
| DR-17 | Improvement in Safety Culture | 4.03 | 0.903 | 7.208 | 152 | .001 | .526 | 2 | Yes |
| DR-11 | Enhanced Accessibility for Remote or Distributed Teams | 3.86 | 0.877 | 5.026 | 152 | .001 | .356 | 3 | Yes |
| DR-13 | Engagement and Retention of Training Content | 3.84 | 0.904 | 4.695 | 152 | .001 | .343 | 4 | Yes |
| DR-12 | Customization and Personalization of Training Programs | 3.81 | 0.937 | 4.098 | 152 | .001 | .310 | 5 | Yes |
| DR-6 | Competitive Advantage | 3.80 | 0.955 | 3.851 | 152 | .001 | .297 | 6 | Yes |
| DR-8 | Risk-free environment as compared to real-world training | 3.80 | 1.041 | 3.534 | 152 | .001 | .297 | 7 | Yes |
| DR-10 | Data-Driven Insights | 3.78 | 0.966 | 3.640 | 152 | .001 | .284 | 8 | Yes |
| DR-7 | Realistic training environments and high-quality simulations | 3.76 | 0.937 | 3.493 | 152 | .001 | .265 | 9 | Yes |
| DR-14 | Scalability of Training Programs | 3.76 | 0.896 | 3.564 | 152 | .001 | .258 | 10 | Yes |
| DR-9 | Real-time/immediate training feedback and performance tracking for workers | 3.75 | 1.003 | 3.021 | 152 | .003 | .245 | 11 | Yes |
| DR-16 | Simulation of Rare or High-Risk Scenarios | 3.66 | 0.981 | 2.019 | 152 | .045 | .160 | 12 | No |
| DR-4 | Cost of Safety Training | 3.63 | 0.931 | 1.693 | 152 | .092 | .127 | 13 | No |
| DR-15 | Reduction in Training Time | 3.62 | 1.094 | 1.367 | 152 | .174 | .121 | 14 | No |
| DR-3 | Under-performance of Safety Statistics (number of injuries to enforce improved training standards) | 3.61 | 1.040 | 1.361 | 152 | .176 | .114 | 15 | No |
| DR-2 | Government/Organizational Regulations and Policies | 3.56 | 0.979 | .785 | 152 | .434 | .062 | 16 | No |
| DR-5 | Stakeholder Pressure | 3.50 | 1.027 | -.039 | 152 | .969 | -.003 | 17 | No |
Table 5.
KMO and Bartlett's Test.
| Kaiser-Meyer-Olkin Measure of Sampling Adequacy. | .872 | |
|---|---|---|
| Bartlett's Test of Sphericity | Approx. Chi-Square | 891.894 |
| df | 136 | |
| Sig. | <.001 | |
Table 6.
Total variance explained.
| Component | Initial Eigenvalues | Extraction Sums of Squared Loadings | Rotation Sums of Squared Loadings | ||||||
|---|---|---|---|---|---|---|---|---|---|
| Total | % of Variance | Cumulative % | Total | % of Variance | Cumulative % | Total | % of Variance | Cumulative % | |
| 1 | 6.061 | 35.654 | 35.654 | 6.061 | 35.654 | 35.654 | 2.808 | 16.520 | 16.520 |
| 2 | 1.280 | 7.529 | 43.183 | 1.280 | 7.529 | 43.183 | 2.583 | 15.196 | 31.716 |
| 3 | 1.197 | 7.041 | 50.224 | 1.197 | 7.041 | 50.224 | 2.462 | 14.481 | 46.198 |
| 4 | 1.114 | 6.555 | 56.780 | 1.114 | 6.555 | 56.780 | 1.799 | 10.582 | 56.780 |
| 5 | .985 | 5.795 | 62.575 | ||||||
| 6 | .945 | 5.559 | 68.134 | ||||||
| 7 | .884 | 5.199 | 73.333 | ||||||
| 8 | .663 | 3.900 | 77.233 | ||||||
| 9 | .617 | 3.630 | 80.863 | ||||||
| 10 | .570 | 3.353 | 84.216 | ||||||
| 11 | .490 | 2.884 | 87.100 | ||||||
| 12 | .453 | 2.666 | 89.766 | ||||||
| 13 | .436 | 2.566 | 92.332 | ||||||
| 14 | .393 | 2.310 | 94.642 | ||||||
| 15 | .333 | 1.958 | 96.600 | ||||||
| 16 | .314 | 1.845 | 98.444 | ||||||
| 17 | .264 | 1.556 | 100.000 | ||||||
Extraction Method: Principal Component Analysis.
Table 7.
Pattern matrix.
| Component | Cronbach’s Alpha Coefficient | |||||
|---|---|---|---|---|---|---|
| 1 | 2 | 3 | 4 | |||
| Technological and Safety Enhancements (6) | Technological Advancements in the industry | .520 | 0.792 | |||
| Competitive Advantage | .446 | |||||
| Realistic training environments and high-quality simulations | .732 | |||||
| Risk- free environment as compared to real-world training | .654 | |||||
| Real-time/immediate training feedback and performance tracking for workers | .608 | |||||
| Improvement in Safety Culture | .613 | |||||
| Regulatory and Financial Drivers (5) | Government/Organizational Regulations and Policies | .611 | 0.719 | |||
| Under-performance of Safety Statistics (number of injuries to enforce improved training standards) | .506 | |||||
| Cost of Safety Training | .731 | |||||
| Stakeholder Pressure | .791 | |||||
| Data-Driven Insights | .447 | |||||
| Customization and Accessibility (4) | Enhanced Accessibility for Remote or Distributed Teams | .532 | 0.758 | |||
| Customization and Personalization of Training Programs | .659 | |||||
| Engagement and Retention of Training Content | .734 | |||||
| Scalability of Training Programs | .759 | |||||
| Operational Efficiency and Risk Management (2) | Reduction in Training Time | .850 | 0.715 | |||
| Simulation of Rare or High-Risk Scenarios | .758 | |||||
Disclaimer/Publisher’s Note: The statements, opinions and data contained in all publications are solely those of the individual author(s) and contributor(s) and not of MDPI and/or the editor(s). MDPI and/or the editor(s) disclaim responsibility for any injury to people or property resulting from any ideas, methods, instructions or products referred to in the content. |
© 2025 by the authors. Licensee MDPI, Basel, Switzerland. This article is an open access article distributed under the terms and conditions of the Creative Commons Attribution (CC BY) license (http://creativecommons.org/licenses/by/4.0/).
Copyright: This open access article is published under a Creative Commons CC BY 4.0 license, which permit the free download, distribution, and reuse, provided that the author and preprint are cited in any reuse.


