
Submitted:
24 April 2025
Posted:
24 April 2025
You are already at the latest version
Abstract
Toxic Oil Syndrome (TOS) was a major food-borne epidemic in Spain in May 1981, caused by the ingestion of rapeseed oil adulterated with aniline. While somatic sequelae have been widely documented, little is known about the long-term cognitive consequences more than four decades after exposure. This case-control study compared 50 individuals with clinically confirmed TOS to 50 age-, sex-, and education-matched healthy controls. Participants completed a standardized neuropsychological assessment and validated questionnaires for fatigue, anxiety, depression, and health-related quality of life. Multivariate regression models, adjusted for demographic and vascular risk factors, showed that TOS patients had significantly poorer performance in attention, executive function, processing speed, and global cognition. However, when mood symptoms, fatigue, and central nervous system-acting medication use were included in the models, these group differences were no longer significant. Structural equation modeling demonstrated that affective symptoms—particularly fatigue—mediated a substantial portion of the association between TOS and cognitive function. The cognitive profile observed resembles that of disorders with subcortical involvement and disrupted neural connectivity, such as multiple sclerosis and vascular cognitive impairment. While postmortem studies have not revealed overt white matter lesions in early TOS cases, the observed patterns may reflect long-term alterations in neural networks, potentially involving both white and gray matter substrates. These findings underscore the importance of accounting for mood and fatigue symptoms in the cognitive evaluation of TOS survivors and raise questions about the diffuse and possibly persistent neurobiological impact of the original toxic exposure.
Keywords:
Toxic Oil Syndrome
; cognitive impairment
; case-control study
; long-term effects
; fatigue
; depression
; anxiety
; neurotoxicity
1. Introduction
Toxic oil syndrome (TOS) emerged as one of the most devastating public health crises in contemporary Spanish History, first identified in May 1981 during a massive outbreak of food poisoning. The source was traced to rapeseed oil denatured with aniline—intended for industrial use but fraudulently marketed as olive oil for human consumption [1,2]. The epidemic affected over 20,000 individuals and resulted in more than 300 deaths within the first year alone [2,3] Survivors experienced a wide range of chronic, multisystemic sequelae, the most prominent being muscle atrophy, typically secondary to an eosinophilic inflammatory myopathy [3,4,5,6]. Other long-term complications included myalgias, muscle cramps [7] severe weight loss, pulmonary hypertension, scleroderma-like syndromes, joint contractures, Sjögren’s syndrome, alopecia, pruritus, and chronic hepatitis [3].
Neurological involvement has been consistently observed in this population and can be divided into two major domains. The first involves the peripheral nervous system, with symptoms such as numbness, paresthesia, and hypoesthesia attributed to inflammatory neuropathy and perineural fibrosis [4,5,7]. The second includes central nervous system manifestations—insomnia, chronic headache, and memory disturbances—suggesting a potential central neurotoxic process [7,8].
Cognitive impairment has been one of the most functionally impactful sequelae in TOS survivors and was evident even in the early stages of the disease. Impairments have been documented in short- and long-term memory, particularly affecting semantic and episodic memory in both verbal and non-verbal formats [8]. Patients frequently display reduced attention, poor concentration, mental fatigue, and psychomotor slowing, with slower processing speeds and delayed reaction times [7,8]. While some of these deficits may appear mild, their cumulative effect can significantly impair daily functioning, supporting the hypothesis of persistent central nervous system involvement [7,8].
Despite the magnitude of the epidemic and the chronicity of its effects, the long-term cognitive trajectory of TOS survivors has been poorly characterized. Indeed, no studies have evaluated cognitive function in this population more than four decades after the exposure.
In this context, the present study aims to assess whether individuals affected by TOS continue to exhibit measurable cognitive deficits 43 years after the outbreak. While earlier studies have identified neurocognitive alterations in this population [7,8], it remains unclear whether these impairments persist, progress, or resolve over time when compared to demographically matched individuals from the general population.
2. Methods
2.1. Standard Protocol Approvals, Registrations, and Patient Consents.
The ethical standards committees approved all procedures on human experimentation at the University Hospital "12 de Octubre," Spain (CEIC codes: 17/035 and 23/616). We obtained written (signed) informed consent from all participants.
2.2. Study Design and Setting
Between April and June 2024, all TOS case participants and healthy controls were recruited from the province of Madrid, one of the regions most severely affected during the 1981 epidemic.
We designed the study as a case-control study, with the exposed group consisting of individuals diagnosed with toxic oil syndrome and the unexposed group comprising healthy controls. All interviews, cognitive assessments, and study procedures were conducted at the 12 de Octubre University Hospital in Madrid, Spain.
2.3. Participants
TOS cases were defined using the same diagnostic criteria applied in previous studies [9]. Eligible participants included individuals who had experienced either the acute or chronic phase of the disease. The acute phase was characterized by alveolar-interstitial pulmonary infiltrates and/or pleural effusion in the presence of absolute eosinophilia (>500 cells/mm³). The chronic phase was defined by the presence of myalgia and eosinophilia and/or one or more of the following clinical features clearly attributable to TOS: scleroderma-like skin changes, peripheral neuropathy, pulmonary hypertension, or hepatopathy.
We recruited TOS patients from the monographic clinical unit dedicated to toxic oil syndrome at the 12 de Octubre University Hospital in Madrid—currently, the only specialized unit in Spain exclusively devoted to the long-term management of these patients.
Patients were contacted consecutively until the target sample size of 50 participants was achieved. The referent (unexposed) group was recruited from friends and acquaintances residing in the same geographic area. The exposed group included 50 adults who had been exposed to toxic oil 43 years earlier and had developed clinically confirmed TOS. These individuals were frequency-matched to 50 unexposed referents by age (±5 years), sex, and educational level.
A post hoc power analysis indicated that the sample size (n = 50 per group) achieved 87.85% power to detect a standardized mean difference of 0.4 (two-tailed α = 0.05), observed in the Global Cognitive Score, the study’s primary cognitive outcome.
Patients were excluded if they had a diagnosis of neurodegenerative disorders (e.g., Alzheimer’s disease, Parkinson’s disease) with worse cognitive performance, renal disease, cerebrovascular accidents, chronic alcoholism, or any traumatic injury involving the brain, spinal cord, or peripheral nervous system. Referent (control) participants were required to meet the same exclusion criteria as the exposed group.
2.4. Measurements
2.4.1. Demographic and Clinical Data
Peronsal data—including age, sex, educational attainment, medical history, and current treatments—were collected using a standardized questionnaire. Educational level was initially recorded in four categories: “incomplete primary,” “primary,” “secondary or higher,” and “university.” For analytical purposes, these were subsequently dichotomized as “primary or below” (including those with completed primary and those with no formal or incomplete primary schooling) versus “secondary or higher education”. Particular attention was paid to the documentation of medications with potential cognitive effects, specifically central nervous system (CNS)-acting drugs, including anxiolytics, stimulants, antipsychotics, antidepressants, antihistamines, and antiepileptic medications.
2.4.2. Fatigue Measurement
Fatigue was assessed using the Fatigue Impact Scale for Daily Use (D-FIS), a brief eight-item self-report questionnaire specifically designed to evaluate the perceived impact of fatigue on daily functioning [10,11]. Each item is rated on a 5-point scale ranging from 0 (“no problem”) to 4 (“extreme problem”), with higher total scores indicating greater fatigue-related interference [10,11].
2.4.3. Health-Related Quality of Life Assessment
Health-related quality of life was measured using the EuroQol instrument, a well-established and validated generic tool designed to assess perceived health status in healthy individuals and patients with a wide range of medical conditions [12]. The EuroQol consists of two components [12]. The first, known as the EQ-5D descriptive system, includes five items that assess current health problems across five dimensions: mobility, self-care, usual activities, pain/discomfort, and anxiety/depression. Each dimension is rated using three ordinal response levels: (1) no problems, (2) moderate problems, and (3) severe problems. These responses yield a health profile that can describe up to 243 unique health states. EQ-5D index values are calculated according to standardized European algorithms [12], producing a single utility score where 1 indicates full health, 0 represents death, and negative values (with a minimum of −0.109) reflect health states perceived as worse than death. The second component of the EuroQol is the EQ visual analog scale (EQ VAS), a vertical scale ranging from 0 (worst imaginable health state) to 100 (best imaginable health state), on which respondents provide a subjective rating of their overall health status.
2.4.4. Depressive Symptoms
Depressive symptoms were assessed using the Beck Depression Inventory-II (BDI-II) [13], a validated self-report instrument designed to measure the severity of depression in adults. It consists of 21 items, each reflecting a symptom or attitude associated with depression (e.g., sadness, pessimism, fatigue, changes in sleep or appetite). Respondents rate each item on a 4-point scale ranging from 0 (no symptom) to 3 (severe symptom) based on their experiences over the previous two weeks. Total scores range from 0 to 63, with higher scores indicating greater symptom severity [13].
2.4.5. Anxiety Symptoms
Anxiety symptoms were assessed using the Beck Anxiety Inventory (BAI) [14], a widely used self-report questionnaire designed to evaluate the severity of common anxiety symptoms. Respondents rate how much they have been bothered by each symptom over the past week on a 4-point scale, from 0 ("not at all") to 3 ("severely—I could barely stand it"). The total score ranges from 0 to 63, with higher scores indicating more severe anxiety [14].
2.4.6. Cognitive Performance
Cognitive functioning was assessed using NeuroTrax™ digital testing [15,16,17]. This digital platform enables standardized, comprehensive cognitive testing in clinical settings and has demonstrated validity and reliability across a range of populations [15,16,18,19]. Due to time constraints, testing was limited to specific cognitive domains: memory (verbal and non-verbal), attention (Go-NoGo and Stroop Interference tasks), information processing speed, executive function (Go-NoGo, Stroop Interference, and Catch Game). All test instructions were delivered in Spanish, the participants’ primary language [20,21]
2.5. Statistical Analyses
All statistical analyses and figure generation were performed using Python (version 3.12.2) and R (version 4.4.2). The following Python packages were used: pandas (v2.2.3) for data handling, TableOne (v0.9.1) for descriptive statistics, statsmodels (v0.14.4) for regression modeling, and semopy (v2.3.11) for structural equation modeling.
In this study, cognitive scores were normalized using the mean and standard deviation of the control group. The same approach was applied to depression, anxiety, and fatigue scales. Z-scores were calculated for each participant in both groups. As in prior studies using NeuroTrax™, normalized scores from individual test measures (e.g., accuracy, response time) were then averaged to generate domain-specific index scores, which were subsequently averaged to produce a global cognitive score [15,16,17].
First, a descriptive analysis of the study population was conducted. Group homogeneity was assessed using appropriate parametric or non-parametric tests based on variable distribution. Subsequently, univariate analyses were performed to compare the two groups on the BDI-II, BAI, D-FIS, and EQ-5D index values, as well as on each NeuroTrax™ cognitive domain index and global cognitive score derived from the battery.
A series of multivariate models were constructed to assess the impact of different variables on cognitive performance. Initially, well-established confounders from previous literature were included [22,23,24,25] followed by the incorporation of intermediate clinical variables such as hypertension and diabetes. In a final model, affective variables (BDI-II and BAI) and fatigue (D-FIS) were added. A structural equation modeling approach was applied to estimate both the direct and indirect effects of these variables on cognitive outcomes.
3. Results
Data from 50 patients with TOS) and 50 matched healthy controls were analyzed (Table 1). No statistically significant differences were observed between the two groups in terms of sex distribution, age, or educational level. However, TOS patients had a significantly higher prevalence of arterial hypertension (66% vs. 18%; p < 0.001) and diabetes mellitus (24% vs. 6%; p = 0.025), as well as a greater use of CNS-acting medications (58% vs. 20%; p < 0.001).
Regarding affective symptoms (Figure 1), patients reported more symptoms on all scales: BDI-II (median 19.0 [IQR 12.2–27.8] vs. 5.5 [IQR 2.0–13.8]; p < 0.001; Figure 1A), BAI (median 22.5, interquartile range [IQR] 14.2–30.8 vs. 4.0 [IQR 1.2–10.8]; p < 0.001; Figure 1B), and D-FIS (mean 19.7 ± 8.5 vs. 5.2 ± 6.3; p < 0.001; Figure 1C). Their health-related quality of life, as assessed by the EQ-5D index, was significantly poorer (median 0.4 [IQR 0.1–0.8] vs. 0.9 [IQR 0.7–1.0]; p < 0.001; Figure 1D). A summary of the demographic and clinical characteristics is provided in Table 1.
Among the cognitive scores, no statistically significant differences were found for memory (median z-score: –0.1 [IQR –0.9 to 0.4] vs. 0.3 [IQR –0.4 to 0.6]; p = 0.07; Figure 2A) irrespective of whether immediate and delayed portions were combined or analyzed separately. However, TOS patients exhibited significantly poorer performance in executive function (mean z-score: –0.4 ± 1.0 vs. 0.0 ± 0.8; p = 0.036; Figure 2B), attention (median z-score: –0.2 [IQR –1.3 to 0.3] vs. 0.1 [IQR –0.3 to 0.5]; p = 0.024; Figure 2C), information processing speed (mean z-score: –0.6 ± 1.0 vs. 0.0 ± 0.8; p = 0.002; Figure 2D), and on the global cognitive score (mean z-score: –0.48 ± 0.18 vs. 0.05 ± 0.20; p < 0.001; Figure 2E), compared to controls. The distribution of these cognitive outcomes is illustrated in Figure 2 and Table 1.
The models were adjusted for demographic variables (age, age squared, sex, educational level) and relevant medical history (arterial hypertension, diabetes mellitus), consistent with previous evidence linking these factors to cognitive outcomes [26,27,28]. The inclusion of arterial hypertension and diabetes mellitus was further justified by their higher prevalence in our sample, as well as in the broader population affected by TOS [29,30].
The multivariate models (Table 2) revealed significant associations between TOS diagnosis and reduced cognitive performance. Specifically, TOS was associated with poorer memory scores (β = -0.307, p = 0.050) and information processing speed (β = -0.606, p = 0.002) as well as lower global cognitive scores (β = -0.382, p = 0.006).
In a subsequent step, additional variables—including fatigue (D-FIS), depressive symptoms (BDI-2), anxiety (BAI), and the use of central nervous system (CNS)-acting medications—were incorporated to assess potential confounding effects.
Multicollinearity among the independent variables was evaluated using the variance inflation factor. No evidence of severe multicollinearity was found among the affective variables; however, a variance inflation factor of 6.77 between BAI and BDI-2 suggested moderate collinearity. Pearson correlation analyses revealed a strong positive correlation between fatigue and BAI (ρ = 0.72) and between fatigue and BDI-2 (ρ = 0.72). Additionally, Spearman correlation coefficients between CNS-acting medication use and the affective scales indicated moderate associations: ρ = 0.36 with fatigue, ρ = 0.38 with depression, and ρ = 0.32 with anxiety.
To minimize collinearity issues, we derived a composite variable from the BAI and BDI-2 scores using principal component analysis. This principal component accounted for 90.9% of the shared variance between the two scales, capturing the underlying affective dimension. This composite variable, together with the D-FIS, was incorporated into separate structural equation models for each cognitive domain score. The resulting models are depicted in Figure 3.
To explore the relationships among variables and construct the structural equation models, multiple linear regression analyses were performed using the composite depression/anxiety variable, D-FIS, and the use of CNS-acting medications as independent variables. The results of these models are shown in Table 3.

Table 3.
Associations of Clinical and Demographic Variables with Affective Symptoms, Fatigue, and CNS-Acting Medication Use.
Table 3.
Associations of Clinical and Demographic Variables with Affective Symptoms, Fatigue, and CNS-Acting Medication Use.
| Predictor Variable | Depression/Anxiety Composite Coefficient | pvalue | Fatigue Impact Scale for Daily Use Coefficient | pvalue | Use of Central Nervous System-Acting Medications Coefficient | pvalue |
| Diabetes mellitus | 0.590 | 0.187 | 4.561 | 0.042 | 0.102 | 0.457 |
| Educational level | 0.020 | 0.951 | 2.620 | 0.108 | –0.067 | 0.502 |
| Age | –0.003 | 0.900 | 0.020 | 0.843 | 0.002 | 0.742 |
| Arterial hypertension | –0.003 | 0.994 | 1.345 | 0.445 | 0.024 | 0.824 |
| Sex (female) | 0.040 | 0.902 | 1.304 | 0.418 | 0.117 | 0.243 |
| Toxic oil syndrome diagnosis | 1.695 | <0.001 | 13.062 | <0.001 | 0.328 | 0.003 |
Coefficients and p-values from linear regression models evaluating the associations of clinical and demographic predictors (diabetes mellitus, educational level, age, arterial hypertension, sex, and toxic oil syndrome diagnosis) with three outcomes: composite depression/anxiety score, Fatigue Impact Scale for Daily Use, and central nervous system-acting medications.
In these models (Figure 3), the previously observed significant impact of a TOS diagnosis on cognitive performance disappeared. However, affective variables emerged as significant predictors across various cognitive domains. Fatigue showed a significant association with attention, executive function, information processing speed, and the global cognitive score (all p < 0.01), whereas the composite depression/anxiety variable was significantly associated with memory performance (p < 0.01). Notably, the use of CNS-acting medications did not have a direct significant effect on cognitive function in any of the models.
In the mediation analysis of these models (Table 4), mediated proportions near or exceeding 1 were observed, suggesting that the effects of these confounding variables largely account for the association between TOS and cognitive performance.
The mediation effect of affective variables on information processing speed was comparatively lower (72.9%) than that of other cognitive subscales, with fatigue accounting for most of the effect (66.3% of the total). Notably, the direct influence of TOS was not statistically significant in this model.
4. Discussion
After adjusting for demographics and clinical variables, TOS survivors demonstrated significantly poorer cognitive performance than matched controls. However, these group differences were no longer significant when affective symptoms (depression and anxiety), fatigue, and the use of CNS-acting medications were included in the models.
These findings suggest that persistent cognitive impairment in TOS may be more strongly influenced by long-term psychological and functional sequelae—such as fatigue and mood symptoms—than by overt structural damage detectable through conventional neuroimaging. However, these sequelae may themselves reflect subtle or diffuse alterations in brain connectivity, potentially linked to the original toxic exposure. Consistent with prior studies on the neuropsychiatric aftermath of TOS[29], patients exhibited significantly higher levels of depression, anxiety, and fatigue. Importantly, structural equation modeling showed that affective symptoms, particularly fatigue, mediated the majority of the association between TOS and cognitive outcomes.
The observed cognitive profile—notably deficits in processing speed, executive function, and attention—closely resembles that seen in neurological conditions with subcortical involvement, including multiple sclerosis [31,32], CADASIL [33,34], vascular cognitive impairment [35], and mild traumatic brain injury [36,37,38]. Such convergence may reflect common neurobiological mechanisms. Affective symptoms, especially depression and fatigue, have well-documented cognitive consequences across clinical populations [39,40], with depression identified as a risk factor for Alzheimer’s disease [41,42] and vascular dementia [41].
In our study, the mediation pattern of processing speed was particularly notable. Although not statistically significant as a direct effect, a large proportion of its variance was explained by affective symptoms—mainly fatigue. This supports a mechanism involving network inefficiency and impaired brain connectivity, both of which have been implicated in mood disorders [43]. Recent research highlights differential cognitive effects of affective symptoms: fatigue predominantly impacts attention and processing speed, as shown by Martin et al. [44] in post-COVID syndrome patients, where reduced alertness was strongly correlated with elevated fatigue. In contrast, depression and anxiety are more consistently associated with episodic and working memory impairments. Kushwaha et al. [45] confirmed this across psychiatric disorders, and Delgado-Alonso et al. [46] demonstrated that COVID-19 patients with high affective burden exhibited both cognitive complaints and measurable deficits in multiple domains. These findings support the notion of distinct, though overlapping, neurobiological pathways mediating the cognitive effects of fatigue, depression, and anxiety.
Neuropathological studies in TOS have revealed central chromatolysis in anterior horn cells and brainstem nuclei—consistent with peripheral nervous system involvement [5,47]. However, alterations in central brain structures (e.g., locus coeruleus, midline raphe, basis pontis, medullary reticular formation, and cuneate nuclei) and the presence of non-necrotizing vasculitis suggest broader CNS involvement. In severe cases, prothrombotic states and hypoxia may have contributed to focal ischemic lesions and anoxic encephalopathy [4,5,47]
Cognitive dysfunction linked to small vessel disease typically manifests as slowed processing speed and executive deficits [35,48], generally attributed to white matter lesions and brain atrophy[28]. However, emerging evidence underscores the importance of gray matter involvement in structural and functional network disruption [49]. Cognitive deficits rarely occur without visible magnetic resonance imaging abnormalities, highlighting the crucial role of both white and gray matter integrity in maintaining cognitive performance [50].
In this context, cognitive dysfunction in TOS may reflect long-term disruption in brain connectivity—a feature shared with CADASIL [51], vascular dementia [52], multiple sclerosis [53], and traumatic brain injury (particularly through diffuse axonal injury) [38]. These conditions frequently involve deep gray matter structures, either through ischemia [48,50,54] or progressive atrophy [32,55].
Altered brain connectivity is also well recognized in depression involving cortical areas such as the dorsolateral and ventromedial prefrontal cortices [56,57], hippocampus [58], anterior cingulate cortex [59], and insula [43] as well as subcortical regions like the amygdala [60], putamen [61], and thalamus/pulvinar [59].
In our analysis, fatigue emerged as the strongest mediator of the relationship between TOS exposure and cognitive performance. Fatigue is highly prevalent in other subcortical disorders like multiple sclerosis, CADASIL, and traumatic brain injury, where it often overlaps with depression in a bidirectional manner [34,40]. Our findings align with prior research showing that fatigue detrimentally affects processing speed [32,37,40], executive function [39], and attention [32].
While the absence of significant group-level cognitive differences after adjusting for affective factors might suggest a psychological origin, it is more plausible that these symptoms reflect downstream consequences of chronic toxic exposure involving neurobiological pathways that disrupt large-scale brain networks. Although postmortem studies in early TOS cases did not show overt white matter pathology [4,5,47], the persistence of cognitive impairment decades later suggests a mechanism beyond focal structural lesions.
This study has limitations. Its cross-sectional design precludes causal inferences about the relationships among affective symptoms, fatigue, and cognition. Longitudinal data are needed to determine the directionality of these associations. Second, the lack of neuroimaging limits our ability to directly link cognitive outcomes to underlying structural or functional brain changes. Future research incorporating multimodal imaging is needed. Third, multicollinearity among fatigue, anxiety, depression, and health-related quality of life may have biased estimates in domains like attention and processing speed, which are especially sensitive to central fatigue. Although we addressed this via separate models and principal component analysis, residual confounding remains possible. Fourth, some mediation models yielded proportions exceeding 100%, which may reflect suppressor effects, model misspecification, or unmeasured confounders. Finally, the modest sample size may have limited our ability to detect smaller cognitive differences.
In summary, TOS survivors continue to exhibit cognitive deficits more than four decades after exposure, particularly in attention, executive function, and processing speed. These impairments appear to be substantially mediated by chronic fatigue and mood symptoms. However, these mediators may themselves represent downstream consequences of the original toxic exposure, reflecting a complex interplay of neurotoxic, vascular, and neuropsychiatric mechanisms. Emerging evidence supports the hypothesis that long-term disruption in brain connectivity—rather than isolated structural lesions—may underlie enduring cognitive dysfunction in TOS, as observed in other subcortical pathologies. Future research incorporating neuroimaging, eye trackers, larger sample sizes, and longitudinal designs will be essential to disentangle these interconnected effects and clarify their underlying neurobiological substrates.
Author Contributions
José Lapeña-Motilva collaborated with 1) the conception, organization, and execution of the research project; 2) the statistical analysis design; and 3) the writing of the manuscript's first draft and the review and critique of the manuscript. Mariano Ruiz-Ortiz collaborated with 1) the conception, organization, and execution of the research project; and 2) the writing of the manuscript's first draft and the review and critique of the manuscript. Glen M. Doniger collaborated with 1) the conception, organization, and execution of the research project; and 2) the writing of the manuscript's first draft and the review and critique of the manuscript. María Antonia Nogales collaborated with 1) the conception, organization, and execution of the research project and 2) the review and critique of the manuscript. Verónica Giménez de Bejar collaborated with 1) the conception, organization, and execution of the research project and 2) the review and critique of the manuscript. Sonia Alvarez-Sesmero collaborated with 1) the conception, organization, and execution of the research project and 2) the review and critique of the manuscript. Montserrat Morales collaborated with 1) the conception, organization, and execution of the research project and 2) the review and critique of the manuscript. Fernando Bartolomé collaborated with 1) the conception, organization, and execution of the research project and 2) the review and critique of the manuscript. Carolina Alquézar collaborated with 1) the conception, organization, and execution of the research project and 2) the review and critique of the manuscript. Cecilia García-Cena collaborated with 1) the conception, organization, and execution of the research project and 2) the writing of the manuscript's first draft and the review and critique of the manuscript. Julián Benito-León collaborated with 1) the conception, organization, and execution of the research project and 2) the review and critique of the manuscript.
Acknowledgments
We gratefully acknowledge all participating patients for their time, trust, and commitment to this study. Their collaboration made this research possible. José Lapeña-Motilva, Mariano Ruiz-Ortiz, Verónica Giménez de Bejar, and Julián Benito-León are supported by the Recovery, Transformation, and Resilience Plan of the Spanish Ministry of Science and Innovation (grants TED2021-130174B-C33, NETremor, and PID2022-138585OB-C33, Resonate). Mariano Ruiz-Ortiz is additionally supported by the Recovery, Transformation, and Resilience Plan of the Spanish Ministry of Science and Innovation (grant PID2022-138585OB-C33, Resonate) and through a Río Hortega contract (CM22/00183). Julián Benito-León is also supported by the National Institutes of Health (NINDS R01 NS39422 and R01 NS094607). Fernando Bartolomé receives support from the Instituto de Salud Carlos III (CP20/00009, PI21/00183, and PI24/00099) and the Spanish Ministry of Science and Innovation (RED2022-134774-T). Carolina Alquézar is supported by the Instituto de Salud Carlos III (CP21/00049 and PI22/00345), the Spanish Ministry of Science and Innovation (RED2022-134774-T and CNS2024-154198), the Eugenio Rodríguez Pascual Foundation (FERP-2022-5), and the Fundación Luzón (Ayudas Unzué Luzón 2024). Cecilia E. Garcia Cena is supported by iRoboCity2030-CM, Intelligent Robotics for Sustainable Cities (TEC-2024/TEC-62), funded by the R&D Activity Programs in Technologies of the Community of Madrid.
Disclosures
Dr. José Lapeña-Motilva (jose.lapena@salud.mdarid.org) reports no relevant disclosures. Dr. Mariano Ruiz-Ortiz (mariano.ruiz.ortiz@gmail.com) reports no relevant disclosures. Dr. Glen M. Doniger (glen.doniger@neurotrax.com) is an employee of NeuroTrax Corporation. Dr. María Antonia Nogales (mariaantonia.nogales@salud.madrid.org) reports no relevant disclosures. Dr. Verónica Giménez de Bejar (neuro.gimenezdebejar@gmail.com) reports no relevant disclosures. Dr. Sonia Alvarez-Sesmero (sasesmero@gmail.com) reports no relevant disclosures. Dr. Montserrat Morales (montserrat.morales@salud.madrid.org) reports no relevant disclosures. Dr. Fernando Bartolomé (fbartolome.imas12@h12o.es) reports no relevant disclosures. Dr. Carolina Alquézar (carolinaalquezar.imas12@h12o.es) reports no relevant disclosures. Dr. Cecilia García-Cena (cecilia.garcia@upm.es) reports no relevant disclosures. Dr. Julián Benito-León (jbenitol67@gmail.com) reports no relevant disclosures.
References
- Manuel Tabuenca J. Toxic-allergic syndrome caused by ingestion of rapeseed oil denatured with aniline. Lancet. 1981;2:567–8. [CrossRef]
- Posada De La Paz M, Philen RM, Borda IA. Toxic Oil Syndrome: The Perspective after 20 Years. 2001.
- Kilbourne EM, De La Paz MP, Borda IA, et al. Toxic oil syndrome: A current clinical and epidemiologic summary, including comparisons with the eosinophilia-myalgia syndrome. J Am Coll Cardiol. 1991;18:711–7. [CrossRef]
- Martinez-Tello F, Navas-Palacios J, Ricoy J, et al. Pathology of a New Toxic Syndrome Caused by Ingestion of Adulterated Oil in Spain. Virchows Arch [Pathol Anat]. 1982;397:261–85.
- Ricoy JR, Cabello A, Rodriguez J, et al. NEUROPATHOLOGICAL STUDIES ON THE TOXIC SYNDROME RELATED TO ADULTERATED RAPESEED OIL IN SPAIN. 1983.
- Alonso-Ruiz A, Calabozo M, Perez-Ruiz F, et al. Toxic oil syndrome. A long-term follow-up of a cohort of 332 patients. Medicine. 1993;72:285–95. [CrossRef]
- Posada de la Paz M, Philen RM, Gerr F, et al. Neurologic outcomes of toxic oil syndrome patients 18 years after the epidemic. Environ Health Perspect. 2003;111:1326–34. [CrossRef]
- del Ser T, Espasandín P, Cabetas I, et al. [Memory disorders in the toxic oil syndrome (TOS)]. Arch Neurobiol (Madr). 1986;49:19–39.
- Ladona MG, Izquierdo-Martinez M, Posada De La Paz M, et al. Pharmacogenetic profile of xenobiotic enzyme metabolism in survivors of the Spanish toxic oil syndrome. Environ Health Perspect. 2001;109:369–75. [CrossRef]
- Benito-León J, Martínez-Martín P, Frades B, et al. Impact of fatigue in multiple sclerosis: the Fatigue Impact Scale for Daily Use (D-FIS). Mult Scler. 2007;13:645–51. [CrossRef]
- Martinez-Martin P, Catalan MJ, Benito-Leon J, et al. Impact of fatigue in Parkinson’s disease: the Fatigue Impact Scale for Daily Use (D-FIS). Qual Life Res. 2006;15:597–606. [CrossRef]
- Badia X, Roset M, Herdman M, et al. A comparison of United Kingdom and Spanish general population time trade-off values for EQ-5D health states. Med Decis Making. 2001;21:7–16. [CrossRef]
- Beck AT, Steer RA, Brown G. Beck Depression Inventory–II. PsycTESTS Dataset. Published Online First: 12 September 2011. [CrossRef]
- Beck AT, Epstein N, Brown G, et al. An inventory for measuring clinical anxiety: psychometric properties. J Consult Clin Psychol. 1988;56:893–7. [CrossRef]
- Dwolatzky T, Whitehead V, Doniger GM, et al. Validity of a novel computerized cognitive battery for mild cognitive impairment. BMC Geriatr. 2003;3:1–12. [CrossRef]
- Doniger GM, Zucker DM, Schweiger A, et al. Towards Practical Cognitive Assessment for Detection of Early Dementia: A 30-Minute Computerized Battery Discriminates as Well as Longer Testing. 2005.
- Schweiger A, Abramovitch A, Doniger GM, et al. A clinical construct validity study of a novel computerized battery for the diagnosis of ADHD in young adults. J Clin Exp Neuropsychol. 2007;29:100–11. [CrossRef]
- Golan D, Wilken J, Doniger GM, et al. Validity of a multi-domain computerized cognitive assessment battery for patients with multiple sclerosis. Mult Scler Relat Disord. 2019;30:154–62. [CrossRef]
- Doniger GM, Jo MY, Simon ES, et al. Computerized cognitive assessment of mild cognitive impairment in urban African Americans. Am J Alzheimers Dis Other Demen. 2009;24:396–403. [CrossRef]
- Cohen-Manheim I, Sinnreich R, Doniger GM, et al. Fasting plasma glucose in young adults free of diabetes is associated with cognitive function in midlife. Eur J Public Health. 2018;28:496–503. [CrossRef]
- Cohen-Manheim I, Doniger GM, Sinnreich R, et al. Body mass index, height and socioeconomic position in adolescence, their trajectories into adulthood, and cognitive function in midlife. Journal of Alzheimer’s Disease. 2017;55:1207–21. [CrossRef]
- Fjell AM, Walhovd KB, Westlye LT, et al. When does brain aging accelerate? Dangers of quadratic fits in cross-sectional studies. Neuroimage. 2010;50:1376–83. [CrossRef]
- Roe CM, Xiong C, Miller JP, et al. Education and Alzheimer disease without dementia: support for the cognitive reserve hypothesis. Neurology. 2007;68:223–8. [CrossRef]
- Seblova D, Berggren R, Lövdén M. Education and age-related decline in cognitive performance: Systematic review and meta-analysis of longitudinal cohort studies. Ageing Res Rev. 2020;58.
- Wilson RS, Yu L, Lamar M, et al. Education and cognitive reserve in old age. Neurology. 2019;92:E1041–50. [CrossRef]
- Bangen KJ, Werhane ML, Weigand AJ, et al. Reduced regional cerebral blood flow relates to poorer cognition in older adults with type 2 diabetes. Front Aging Neurosci. 2018;10:390812. [CrossRef]
- Petrova M, Prokopenko S, Pronina E, et al. Diabetes type 2, hypertension and cognitive dysfunction in middle age women. J Neurol Sci. 2010;299:39–41. [CrossRef]
- Muela HCS, Costa-Hong VA, Yassuda MS, et al. Hypertension severity is associated with impaired cognitive performance. J Am Heart Assoc. 2017;6. [CrossRef]
- Polentinos-Castro E, Biec-Amigo T, Delgado-Magdalena M, et al. Enfermedades crónicas y multimorbilidad en pacientes con Síndrome de Aceite Tóxico: estudio comparativo con población general. Rev Esp Salud Pública. 2021;95.
- García de Aguinaga ML, Posada de la Paz M, Estirado de Cabo E, et al. High prevalence of cardiovascular risk in patients with toxic oil syndrome: A comparative study using the general Spanish population. Eur J Intern Med. 2008;19:32–9. [CrossRef]
- Kouvatsou Z, Masoura E, Kiosseoglou G, et al. Evaluating the relationship between working memory and information processing speed in multiple sclerosis. Applied Neuropsychology:Adult. 2022;29:695–702. [CrossRef]
- Slavomira K, Petra H, Daniel C, et al. Information-processing speed in mildly disabled relapsingremitting multiple sclerosis patients correlates with volumetry of optic chiasma and subcortical grey matter nuclei. Bratislava Medical Journal. 2022;123:678–84. [CrossRef]
- Chabriat H, Lesnik Oberstein S. Cognition, mood and behavior in CADASIL. Cereb Circ Cogn Behav. 2022;3. [CrossRef]
- Jolly AA, Anyanwu S, Koohi F, et al. Prevalence of Fatigue and Associations With Depression and Cognitive Impairment in Patients With CADASIL. Neurology. 2025;104. [CrossRef]
- O’Brien JT, Erkinjuntti T, Reisberg B, et al. Vascular cognitive impairment. Lancet Neurology. 2003;2:89–98. [CrossRef]
- Katz DI, Cohen SI, Alexander MP. Mild traumatic brain injury DEFINITIONS AND DIAGNOSTIC CRITERIA Mild traumatic brain injury. 2015.
- Anderson JFI, Cockle E. Investigating the effect of fatigue and psychological distress on information processing speed in the postacute period after mild traumatic brain injury in premorbidly healthy adults. Archives of Clinical Neuropsychology. 2021;36:918–29. [CrossRef]
- Bai L, Bai G, Wang S, et al. Strategic white matter injury associated with long-term information processing speed deficits in mild traumatic brain injury. Hum Brain Mapp. 2020;41:4431–41. [CrossRef]
- Nuño L, Gómez-Benito J, Carmona VR, et al. A systematic review of executive function and information processing speed in major depression disorder. Brain Sci. 2021;11:1–18.
- Biasi MM, Manni A, Pepe I, et al. Impact of depression on the perception of fatigue and information processing speed in a cohort of multiple sclerosis patients. BMC Psychol. 2023;11. [CrossRef]
- Diniz BS, Butters MA, Albert SM, et al. Late-life depression and risk of vascular dementia and Alzheimer’s disease: Systematic review and meta-analysis of community-based cohort studies. British Journal of Psychiatry. 2013;202:329–35.
- Yang L, Deng YT, Leng Y, et al. Depression, Depression Treatments, and Risk of Incident Dementia: A Prospective Cohort Study of 354,313 Participants. Biol Psychiatry. 2023;93:802–9. [CrossRef]
- Brakowski J, Spinelli S, Dörig N, et al. Resting state brain network function in major depression – Depression symptomatology, antidepressant treatment effects, future research. J Psychiatr Res. 2017;92:147–59.
- Martin EM, Srowig A, Utech I, et al. Persistent cognitive slowing in post-COVID patients: longitudinal study over 6 months. J Neurol. 2024;271:46–58. [CrossRef]
- Kushwaha A, Basera DS, Kumari S, et al. Assessment of memory deficits in psychiatric disorders: A systematic literature review. J Neurosci Rural Pract. 2024;15:182–93. [CrossRef]
- Delgado-Alonso C, Valles-Salgado M, Delgado-Álvarez A, et al. Cognitive dysfunction associated with COVID-19: A comprehensive neuropsychological study. J Psychiatr Res. 2022;150:40–6. [CrossRef]
- Tellez I, Cabello A, Franeh O, et al. Acta Heuropathologica Chromatolytic changes in the central nervous system of patients with the toxic oil syndrome*. 1987.
- Zanon Zotin MC, Sveikata L, Viswanathan A, et al. Cerebral small vessel disease and vascular cognitive impairment: From diagnosis to management. Curr Opin Neurol. 2021;34:246–57.
- Benito-León J, Sanz-Morales E, Melero H, et al. Graph theory analysis of resting-state functional magnetic resonance imaging in essential tremor. Hum Brain Mapp. 2019;40:4686–702. [CrossRef]
- Chabriat H, Joutel A, Dichgans M, et al. CADASIL. Lancet Neurol. 2009;8:643–53.
- Su J, Ban S, Wang M, et al. Reduced resting-state brain functional network connectivity and poor regional homogeneity in patients with CADASIL. J Headache Pain. 2019;20. [CrossRef]
- Cheung EYW, Shea YF, Chiu PKC, et al. Diagnostic Efficacy of Voxel-Mirrored Homotopic Connectivity in Vascular Dementia as Compared to Alzheimer’s Related Neurodegenerative Diseases-A Resting State fMRI Study. Life (Basel). 2021;11. [CrossRef]
- Kampaite A, Gustafsson R, York EN, et al. Brain connectivity changes underlying depression and fatigue in relapsing-remitting multiple sclerosis: A systematic review. PLoS One. 2024;19. [CrossRef]
- Hainsworth AH, Markus HS, Schneider JA. Cerebral Small Vessel Disease, Hypertension, and Vascular Contributions to Cognitive Impairment and Dementia. Hypertension. 2024;81:75–86.
- Batista S, Zivadinov R, Hoogs M, et al. Basal ganglia, thalamus and neocortical atrophy predicting slowed cognitive processing in multiple sclerosis. J Neurol. 2012;259:139–46. [CrossRef]
- Drysdale AT, Grosenick L, Downar J, et al. Resting-state connectivity biomarkers define neurophysiological subtypes of depression. Nat Med. 2017;23:28–38. [CrossRef]
- Gusnard DA, Akbudak E, Shulman GL, et al. Medial prefrontal cortex and self-referential mental activity: Relation to a default mode of brain function.
- Chen B, Yang M, Zhong X, et al. Disrupted dynamic functional connectivity of hippocampal subregions mediated the slowed information processing speed in late-life depression. Psychol Med. 2023;53:6500–10. [CrossRef]
- Greicius MD, Flores BH, Menon V, et al. Resting-State Functional Connectivity in Major Depression: Abnormally Increased Contributions from Subgenual Cingulate Cortex and Thalamus.
- Han K, Chapman SB, Krawczyk DC. Altered amygdala connectivity in individuals with chronic traumatic brain injury and comorbid depressive symptoms. Front Neurol. 2015;6. [CrossRef]
- Anderson AJ, Ren P, Baran TM, et al. Insula and putamen centered functional connectivity networks reflect healthy agers’ subjective experience of cognitive fatigue in multiple tasks. Cortex. 2019;119:428–40. [CrossRef]
Figure 1.
Group differences between patients and controls on the Beck Depression Inventory-II (BDI-II), Beck Anxiety Inventory (BAI), Fatigue Impact Scale for Daily Use (D-FIS), and EQ-5D. Data are visualized using swarm plots overlaid with medians and interquartile ranges (Q1–Q3). Higher scores on BDI-2, BAI, and D-FIS indicate greater symptom severity, while lower EQ-5D index values reflect poorer health-related quality of life.
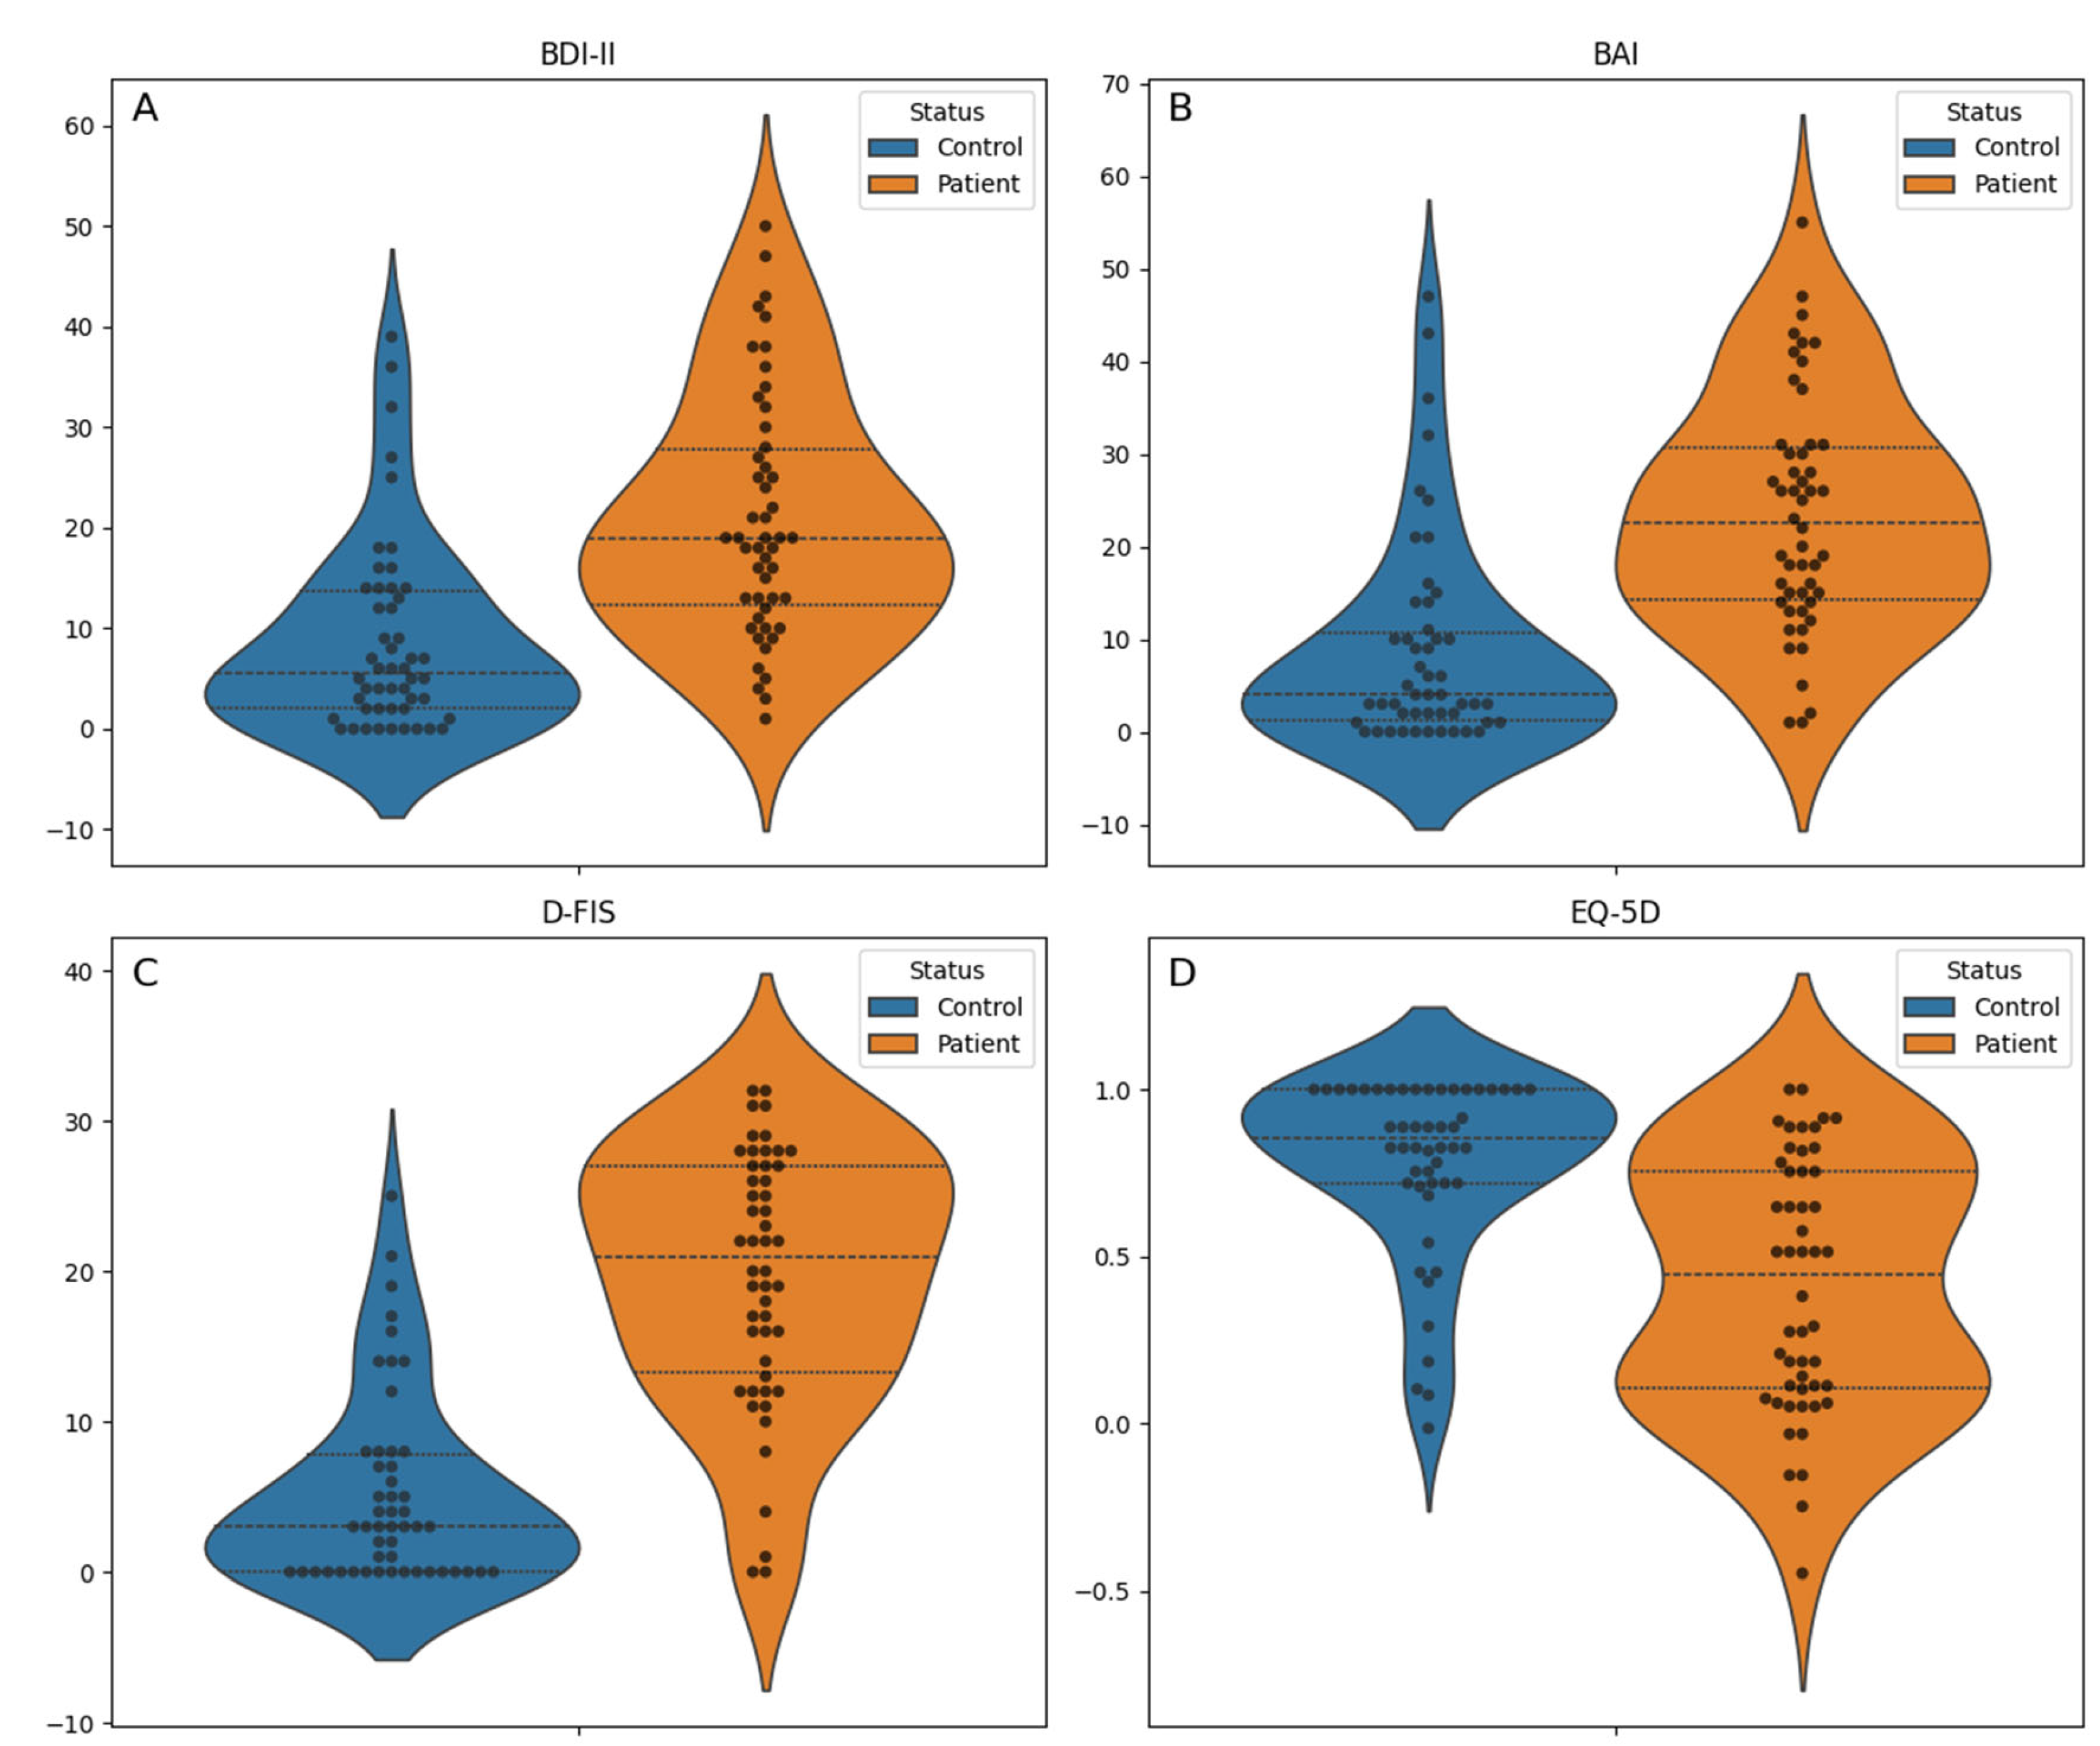
Figure 2.
Comparison of cognitive performance between groups (toxic oil syndrome patients and controls). Individual test scores were transformed into z-scores using the mean and standard deviation of the control group as the reference. Domain index scores were calculated by averaging the contributing standardized test scores, and the global cognitive score was calculated as the average of all domain index scores (see Methods). Boxplots display the median and interquartile range (IQR; Q1 to Q3), with overlaid swarm plots to illustrate individual data points. Higher z-scores reflect better cognitive performance.
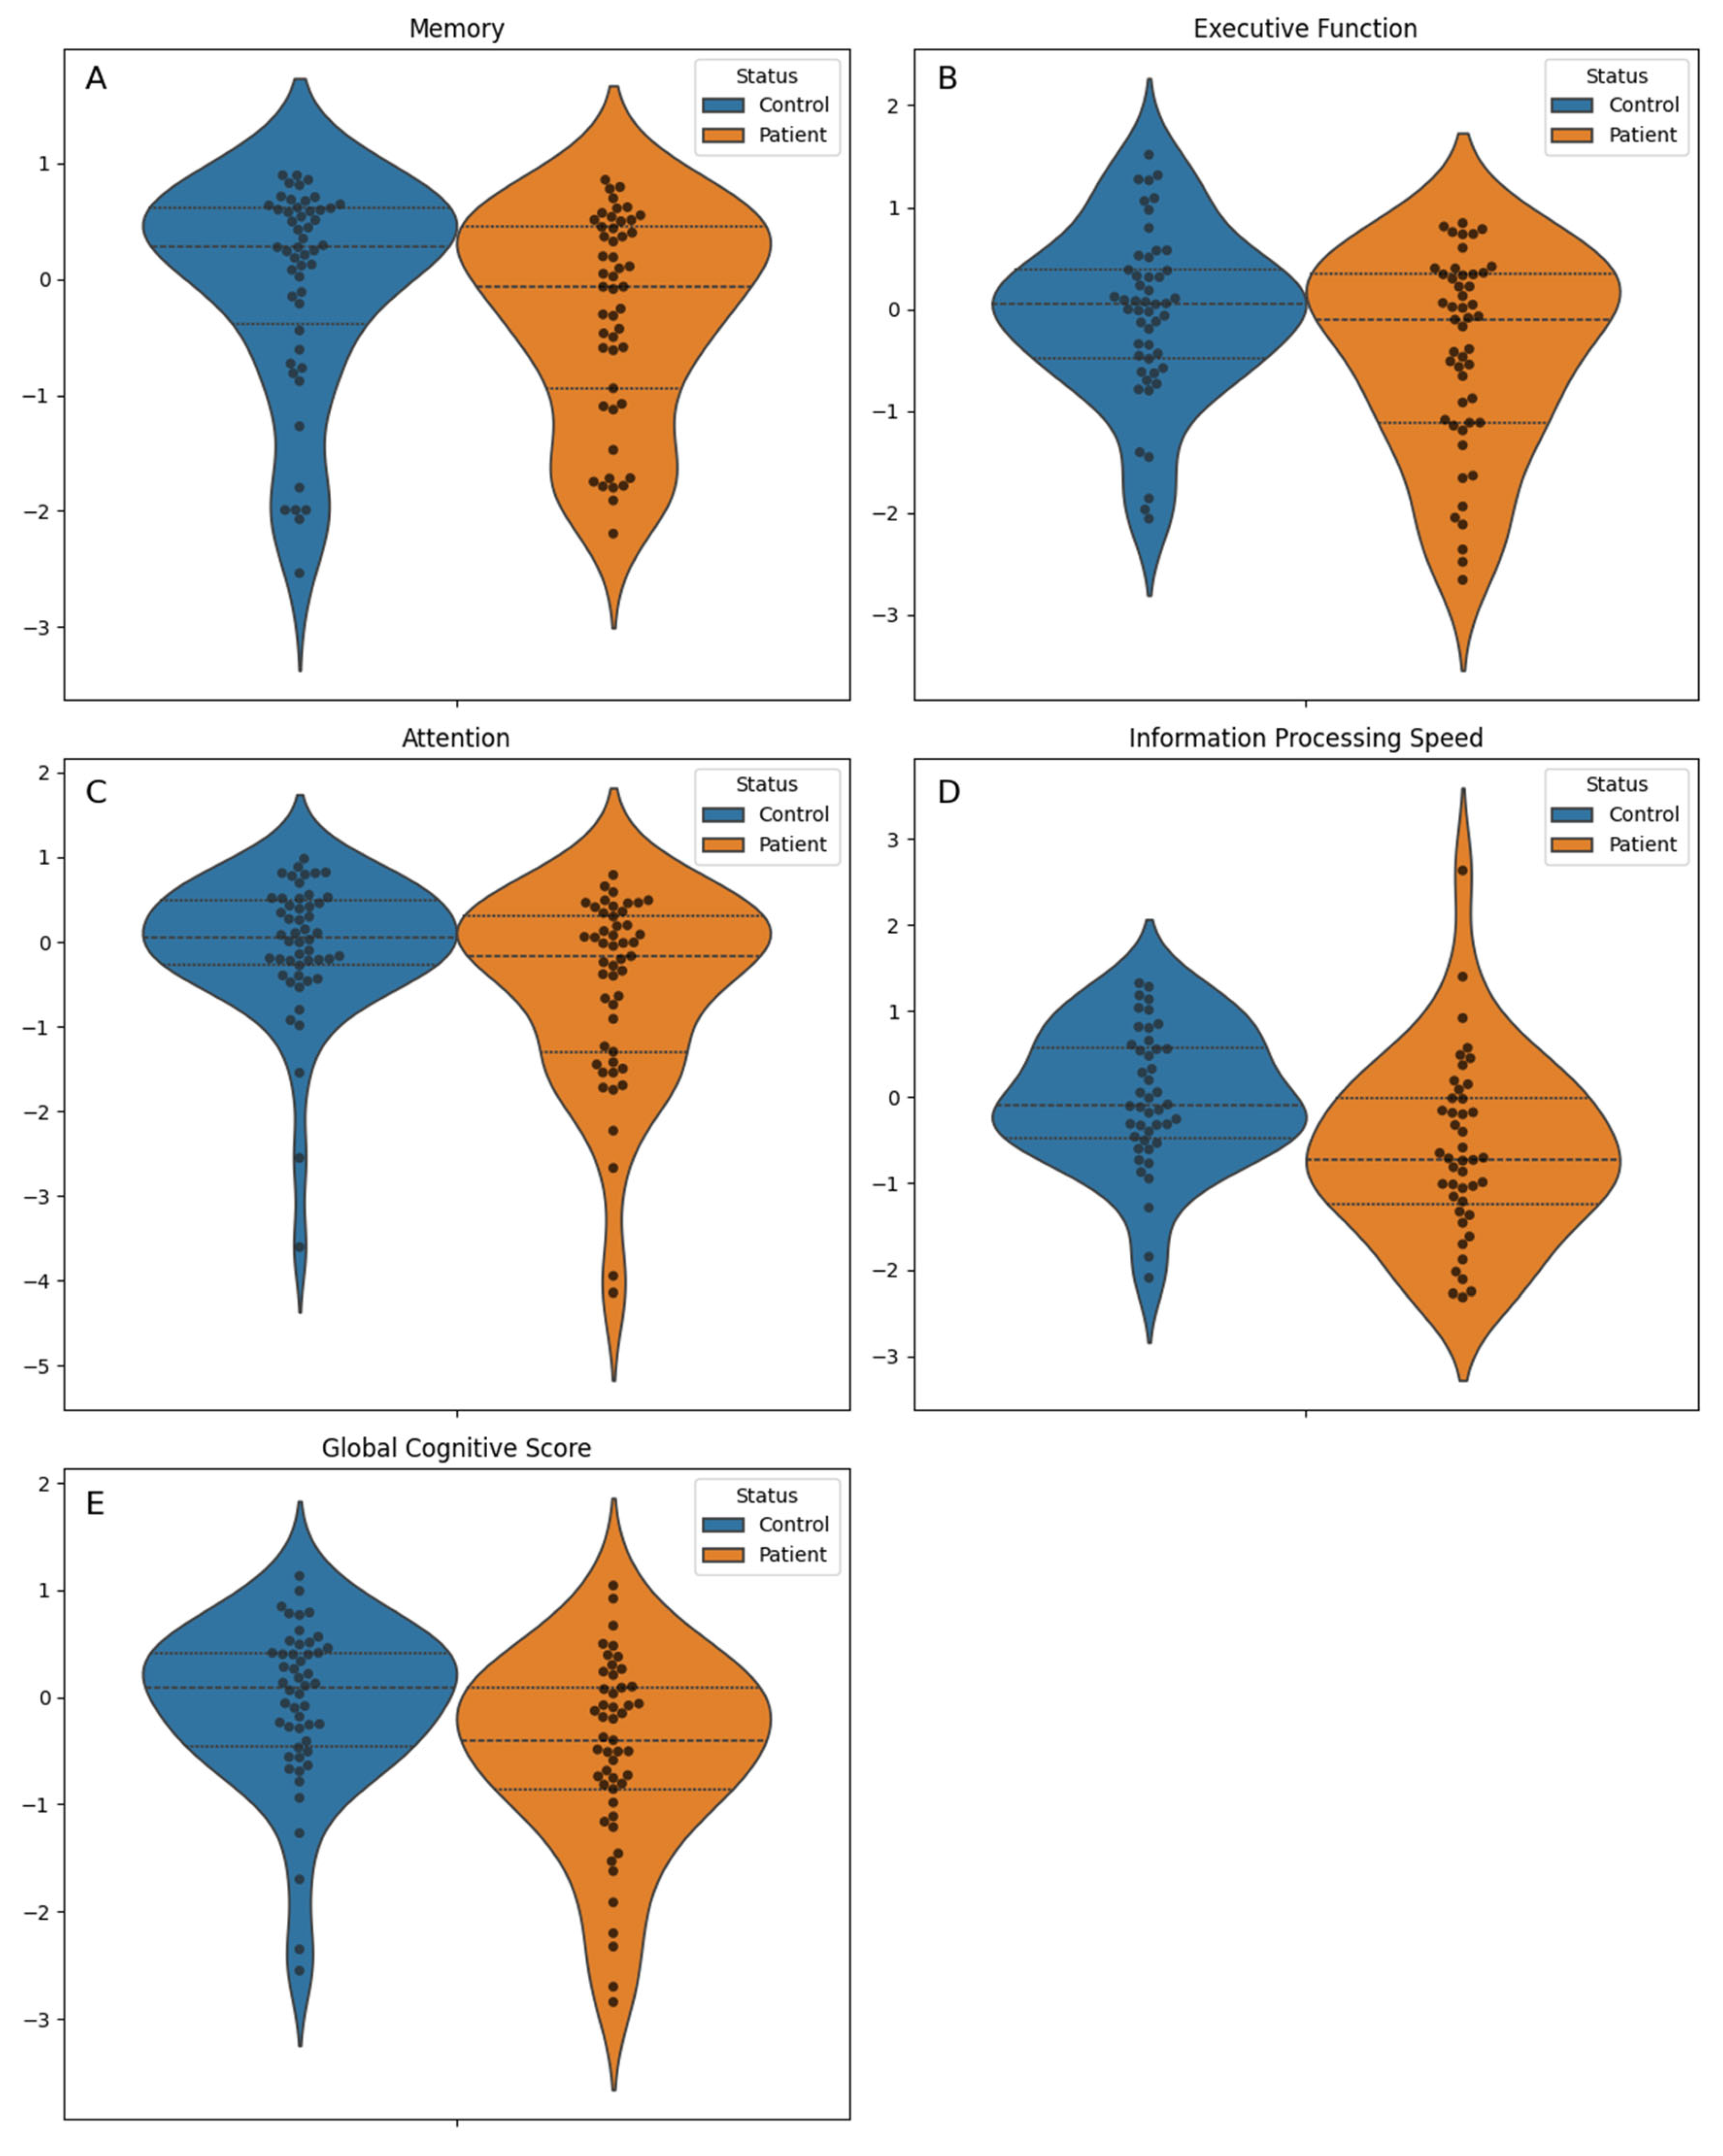
Figure 3.
Structural equation modeling diagrams illustrating the relationships between toxic oil syndrome (TOS) and performance on five cognitive outcomes: A) memory, B) attention, C) executive function, D) information processing speed, and E) global cognitive score. The models include the following predictors: TOS diagnosis, sex (female), use of central nervous system–acting medications (CNS Drugs), composite variable for depression and anxiety (CVDA), and Fatigue Impact Scale for Daily Use (D-FIS). Direct and indirect effects are shown, with uncorrected p-values reported for each path.
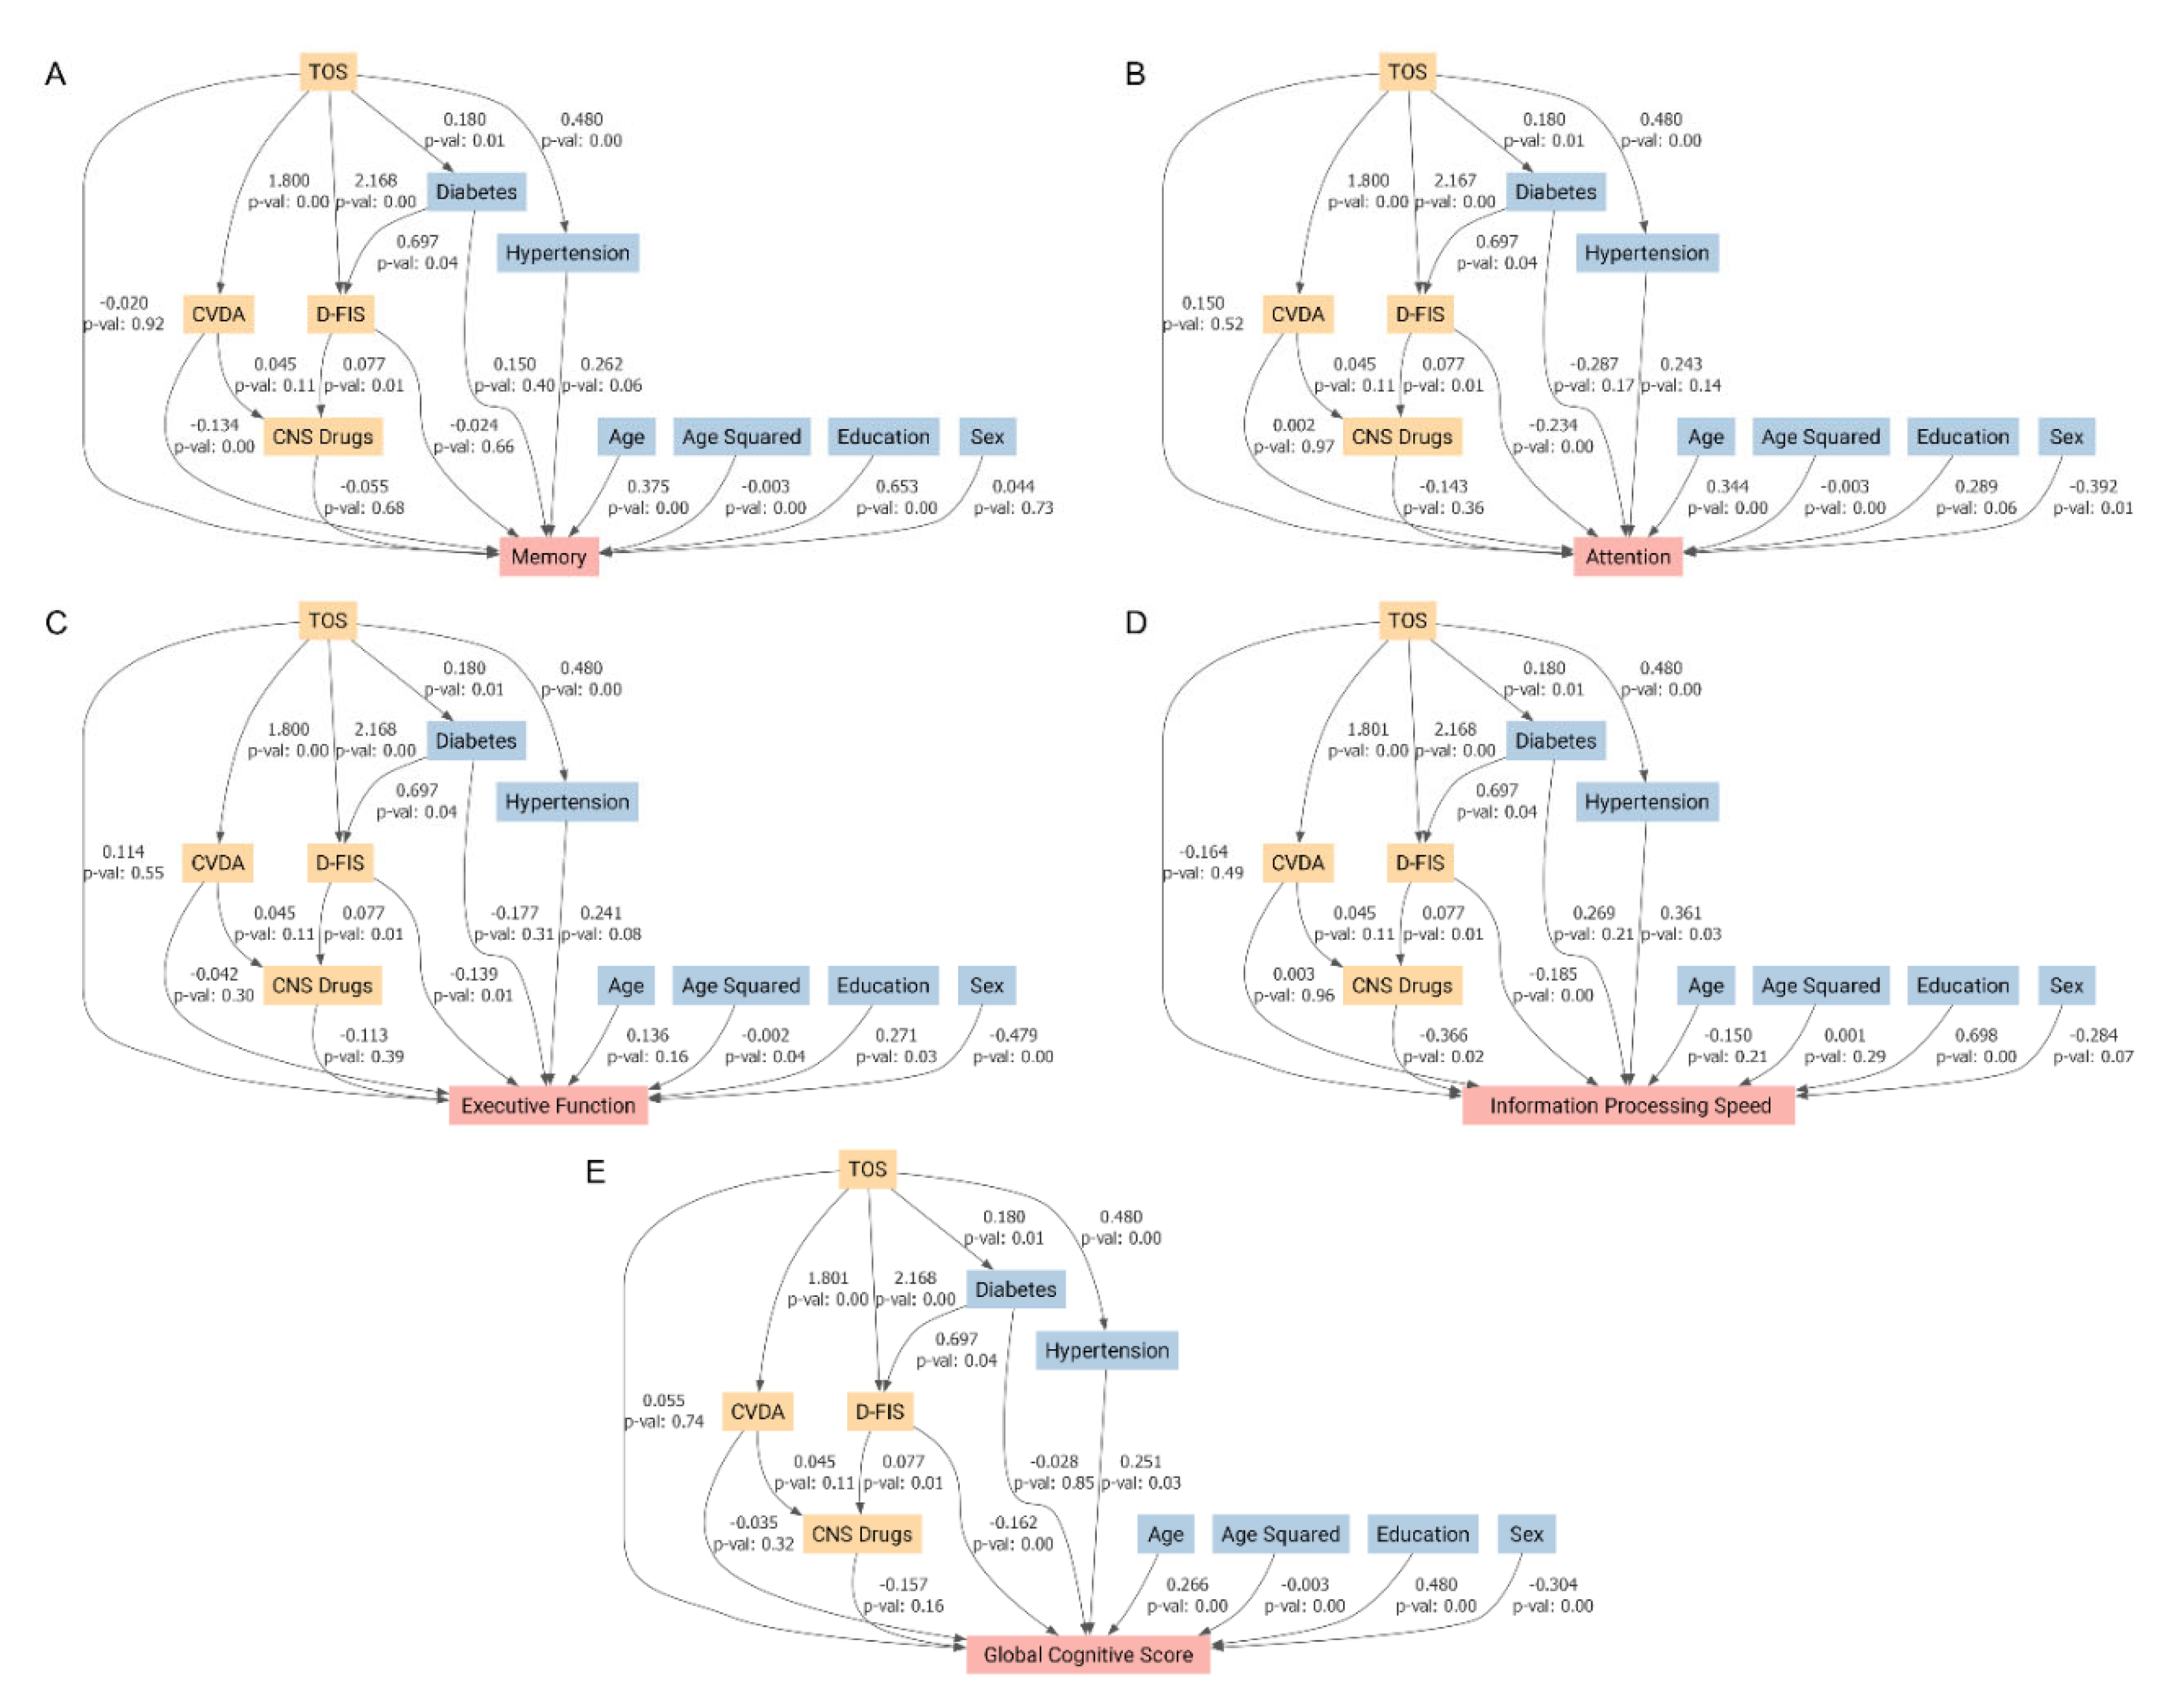
Table 1.
Demographic, clinical, and neuropsychological characteristics of study participants.
| Variable | Overall (N = 100) | Control (N = 50) | Patient (N = 50) | P value |
| Sex, n (%) | 0.284 a | |||
| Male | 32 (32.0) | 19 (38.0) | 13 (26.0) | |
| Female | 68 (68.0) | 31 (62.0) | 37 (74.0) | |
| Age, mean (standard deviation) | 59.3 (8.0) | 58.7 (8.2) | 59.9 (7.8) | 0.449 b |
| Education, n (%) | 0.546 a | |||
| Illiterate or primary studies | 44 (44.0) | 20 (40.0) | 24 (48.0) | |
| Secondary or higher | 56 (56.0) | 30 (60.0) | 26 (52.0) | |
| Central nervous system-acting medications, N (%) | 39 (39.0) | 10 (20.0) | 29 (58.0) | <0.001 a |
| Arterial hypertension, N (%) | 42 (42.0) | 9 (18.0) | 33 (66.0) | <0.001 a |
| Diabetes mellitus, N (%) | 15 (15.0) | 3 (6.0) | 12 (24.0) | 0.025 a |
| EQ-5D index, median [Q1, Q3] | 0.7 [0.3, 0.9] | 0.9 [0.7,1.0] | 0.4 [0.1, 0.8] | <0.001 c |
| Fatigue Impact Scale for Daily Use, mean (standard deviation) | 12.4 (10.4) | 5.2 (6.3) | 19.7 (8.5) | <0.001 b |
| Beck Anxiety Inventory, median [Q1, Q3] | 14.0 [3.0, 26.0] | 4.0 [1.2,10.8] | 22.5 [14.2, 30.8] | <0.001 c |
| Beck Depression Inventory, median [Q1, Q3] | 13.0 [4.8, 21.0] | 5.5 [2.0,13.8] | 19.0 [12.2, 27.8] | <0.001 c |
| Global Cognitive Score, mean (standard deviation) | -0.3 (0.9) | -0.1 (0.8) | -0.5 (0.9) | 0.010 b |
| Cognitive domains | ||||
| Memory, median [Q1, Q3] | 0.2 [-0.6, 0.5] | 0.3 [-0.4, 0.6] | -0.1 [-0.9, 0.4] | 0.070 c |
| Executive function, mean (standard deviation) | -0.2 (0.9) | -0.0 (0.8) | -0.4 (1.0) | 0.036 b |
| Attention, median [Q1, Q3] | -0.0 [-0.5, 0.4] | 0.1 [-0.3, 0.5] | -0.2 [-1.3, 0.3] | 0.024 c |
| Information processing speed, mean (standard deviation) | -0.3 (1.0) | -0.0 (0.8) | -0.6 (1.0) | 0.002 b |
a Chi-square test; b Student t test; c Mann-Whitney U test.
Table 2.
Multivariable Linear Regression Models Examining the Association of Toxic Oil Syndrome Diagnosis with Cognitive Performance, Adjusted for Demographic and Clinical Covariates.
Table 2.
Multivariable Linear Regression Models Examining the Association of Toxic Oil Syndrome Diagnosis with Cognitive Performance, Adjusted for Demographic and Clinical Covariates.
| Predictor Variable | Global Cognitive Score Coefficient (p value) | Memory Coefficient (p value) | Executive Function Coefficient (p value) | Attention Coefficient (p value) | Information Processing Speed Coefficient (p value) |
| Diabetes mellitus | –0.183 (0.294) | 0.044 (0.824) | –0.318 (0.107) | –0.472 (0.050) | 0.170 (0.523) |
| Educational level | 0.437 (0.001) | 0.657 (<0.001) | 0.229 (0.119) | 0.213 (0.231) | 0.644 (0.001) |
| Age squared | –0.002 (0.019) | –0.003 (0.004) | –0.001 (0.271) | –0.003 (0.021) | –0.000 (0.910) |
| Age | 0.176 (0.071) | 0.284 (0.012) | 0.057 (0.603) | 0.254 (0.058) | –0.020 (0.904) |
| Arterial hypertension | 0.220 (0.115) | 0.262 (0.101) | 0.218 (0.164) | 0.199 (0.295) | 0.215 (0.273) |
| Sex (female) | –0.356 (0.006) | 0.025 (0.864) | –0.517 (<0.001) | –0.453 (0.010) | –0.439 (0.018) |
| Toxic oil syndrome diagnosis | –0.382 (0.006) | –0.307 (0.050) | –0.274 (0.074) | –0.369 (0.048) | –0.606 (0.002) |
Coefficients and p-values from multivariable linear regression models assessing the association of demographic and clinical variables (diabetes mellitus, educational level, age squared, age, arterial hypertension, sex, toxic oil syndrome diagnosis) with five cognitive measures: global cognition, memory, executive function, attention, and information processing speed. All models were adjusted for the full set of listed covariates.
Table 4.
Mediation Effects of Affective Variables, Fatigue, and CNS-Acting Medications on the Relationship Between TOS and Cognitive Performance.
Table 4.
Mediation Effects of Affective Variables, Fatigue, and CNS-Acting Medications on the Relationship Between TOS and Cognitive Performance.
| Global Cognitive Score | Memory | Attention | Executive Function | Information Processing Speed | |
| Average Direct Effect | 0.055 | -0.02 | 0.15 | 0.114 | -0.164 |
| Average Causal Mediation Effects (composite variable of depression/anxiety ) | -0.062 | -0.241 | 0.003 | -0.076 | 0.005 |
| Average Causal Mediation Effects (Fatigue Impact Scale for Daily Use) | -0.351 | -0.051 | -0.508 | -0.302 | -0.402 |
| Average Causal Mediation Effects (Central Nervous System-Acting Medications) | -0.019 | -0.007 | -0.018 | -0.014 | -0.045 |
| Total Effect | -0.377 | -0.318 | -0.372 | -0.278 | -0.606 |
| Mediated proportion | 1.146 | 0.938 | 1.404 | 1.409 | 0.729 |
Average Direct Effect, Average Causal Mediation Effects, total effect, and mediated proportion of the association between toxic oil syndrome and cognitive performance, considering mediation through three variables: the composite depression/anxiety score, fatigue (Fatigue Impact Scale for Daily Use), and central nervous system–acting medications. Cognitive outcomes include global cognitive score, memory, attention, executive function, and information processing speed. Negative values indicate poorer performance.
Disclaimer/Publisher’s Note: The statements, opinions and data contained in all publications are solely those of the individual author(s) and contributor(s) and not of MDPI and/or the editor(s). MDPI and/or the editor(s) disclaim responsibility for any injury to people or property resulting from any ideas, methods, instructions or products referred to in the content. |
© 2025 by the authors. Licensee MDPI, Basel, Switzerland. This article is an open access article distributed under the terms and conditions of the Creative Commons Attribution (CC BY) license (http://creativecommons.org/licenses/by/4.0/).
Copyright: This open access article is published under a Creative Commons CC BY 4.0 license, which permit the free download, distribution, and reuse, provided that the author and preprint are cited in any reuse.


