
Submitted:
23 April 2025
Posted:
24 April 2025
You are already at the latest version
Abstract
This study’s objective was to determine the effects of two levels of a precision biotic (PB) within a reduced CP diet for performance parameters, digestibility, and blood biomarkers in Dekalb White laying hens from 24 to 42 weeks of age. A total of four diets were fed: 1) an industry standard positive control (PC) diet with a formulated CP level of 17.5%; 2) a negative control (NC) diet with a formulated CP level of 15.5%; 3) NC with 0.5 kg/MT PB (PB1) and 4) NC with 0.7 kg/MT PB (PB2). The NC diet had decreased hen day egg production compared to the PC diet and supplementation with both levels of PB led to intermediate levels of production. There was a similar trend for kilograms of feed per dozen eggs. Feed cost was lower in the reduced CP diets compared to PC. Apparent total tract digestibility was decreased with PB supplementation without differences in apparent ileal digestibility. Increased plasma uric acid levels in the PB2 group suggest a shift in protein metabolism toward higher efficiency in ammonia detoxification. While more research is needed on PB, this research suggests that supplementation with PB in laying hens could potentially improve performance parameters.
Keywords:
egg mass
; feed conversion
; hen day egg production
; laying hen
; precision biotic
1. Introduction
The current study looked at the use of a precision biotic (PB) when implemented in a diet with industry-standard crude protein (CP) and a diet with reduced CP. The reduction of CP in layer diets can result in decreased nitrogen excretion [1,2]. High levels of nitrogen output are of environmental concern due to the potential of concentrated ammonia production [3]. Furthermore, reducing CP in layer diets can decrease feed costs, however, it may also result in significantly decreased profits [4,5]. Some studies have found that when the CP of diets is reduced it can result in increased CP digestibility [6,7,2]. This is potentially an adaptive process to make up for the lower protein in the diet. However, if a reduced CP diet is not supplemented with synthetic AA, it can still result in lowered performance parameters such as average egg weight, hen-day-egg production, and feed conversion ratio [4,8]. Therefore, supplementing feed additives that may further improve protein digestion could be economically and environmentally beneficial in a reduced CP diet.
Conventional prebiotics supplementation can lead to improved performance and decreased incidence of disease in both layers and broilers, but there may be some limitations for prebiotic efficacy in the poultry gut [9,10]. Specific prebiotics directly affect certain bacteria in the microbiome; for example, addition of galactooligosaccharides in the diet primarily increases Bifidobacteria and Lactobacilli [11]. While these are considered beneficial bacteria, they can vary greatly among individual birds. A study conducted in humans and published by The Human Microbiome Project Consortium found that the taxonomic composition of the microbiome between healthy individuals can vary widely depending on location and living conditions [12]. Interestingly, despite the vast differences in the bacterial taxonomy, the functional profile of the microbiome, as measured by its metagenome, showed to be much more stable.
Precision biotic (PB) is a feed additive that has been developed within the last few years and falls under a new classification of gut health supplement. Different from conventional prebiotics, PB can specifically modulate microbiome pathways of interest, such as short-chain fatty acid (SCFA) production, and nitrogen metabolism [13,14,15]. In this sense, PB could be fed to poultry flocks to target not only performance parameters but other beneficial outcomes such as welfare and sustainability attributes as well [14,16,17]. Therefore, given the variations in bacteria that may be present in the gut, in conjunction with the selective nature of prebiotics, it is reasonable to conclude that the use of PB will deliver higher consistency in terms of beneficial outcomes.
To harness the full potential of the microbiome functions, in comparison to a varying microbiome composition, PB were designed to act as modulators of specific pathways, such as those of SCFA, branched chain fatty acids (BCFA), and nitrogen containing compounds. Examples of these include modulation of assimilation pathways for amino acids (AA) and putrefactive pathways for ammonia [14,18]. Current PB are composed of a selected group of synthesized glycans that act as metabolic modulators. When an animal consumes carbohydrates, oligosaccharides are broken down into glycans which are sugar-based intermediates used in a variety of biological functions, including glycoprotein synthesis [19]. By providing the intermediates necessary for further bacterial involvement in these pathways, PB may more efficiently modulate bacterial genes responsible for specific metabolic function [20]. This has the potential to lead to increased production and efficiency in the bird, better protein utilization, as well as a decrease in ammonia concentrations due to greater nitrogen incorporation [21]. Several studies conducted in broilers on the components of the PB studied herein, or the actual PB itself, showed that its supplementation increased SCFA production and decreased litter pH and ammonia production [14,15]. Supplementation also increased arginine-N-succinyl transferase suggesting improved AA catabolism, improved body weight gain, feed intake, and feed conversion ratio [13,14,15,18]. Prior to this research being conducted, there had been no published studies done with PB in laying hens, but since then, a study in which 0.9 kg/MT of PB was supplemented to free-range laying hens from 17 to 72 weeks of age has been published. The authors found that supplementation with PB resulted in lower mortality rates, better feed conversion, and improved gut integrity in early and mid-lay phases [17].
While PB has been evaluated in standard broiler diets, there have been no published studies evaluating their effects in reduced CP diets in laying hens on digestibility and blood biomarker parameters. Therefore, the objectives of this study were to determine the effect of two levels of PB in conjunction with a reduced CP diet for performance parameters, CP digestibility, and blood biomarkers in laying hens from 24 to 42 weeks of age using Dekalb White layers in the layer 1 phase. The hypothesis of this study was that supplementation of precision biotics in a reduced crude protein diet would improve egg production and influence feed efficiency in Dekalb White laying hens.
2. Materials and Methods
All animal care procedures were approved by the Mississippi State University Institution of Animal Care and Use Committee. (IACUC #22-366).
2.1. Pre-Experimental Period
A total of 448 22-week-old Dekalb pullets were obtained from chicks hatched at a commercial hatchery and raised at a commercial table egg facility. Hens were transported from the facility to the Mississippi State Poultry Research Unit at 17 weeks of age. After adapting to feed and environment for five weeks, hens were further adapted for a two-week pre-experimental period before the start of feeding experimental diets. Each cage (758 cm2) was stocked with four pullets as per the Mississippi State University animal welfare guideline policy. During this period, feed and water were provided ad libitum. A standard layer one mash diet formulated according to the Dekalb White Management Guideline was fed. Egg production was recorded once daily and, at the start of the second week, average egg weight (AEW) was recorded to obtain a baseline comparison between the different treatment groups.
2.2. Experiment Design, Birds, and Feed
The experiment was conducted in a randomized block design where location of cage both within the house and on the levels of the A-frame were considered as the blocking factors. Each of the cages was considered an experimental unit with four birds per cage. In total, there were 112 hens per treatment allocated into fourteen blocks, each containing two replicates of each of the four treatments. Thus, there was a total of 28 replicating cages per treatment. Within the blocks, one of each of the treatment replications was on a top-level cage and the other was on a bottom level.
Four dietary treatments were evaluated in this experiment. The results reported in this paper are part of a larger experiment containing nine dietary treatments. Feed was formulated as a layer one mash diet throughout the experimental period. Diets, calculated values, and analyzed values are outlined in Table 1. Feed was formulated based on NIR analysis of ingredients, and analyzed values for feed were reported using proximate analysis. Specifications met or exceeded the Dekalb White Management Guideline for all nutrients except CP and digestible amino acids (dAA). Most of the limiting AA (Trp, Thr, Arg, Ile, TSAA, Met, Val) were formulated on the ratio of dLys. Treatment 1 was designated as the positive control diet (PC) which was an industry-standard diet formulated to 17.5% CP and 0.90% dLys that met all AA recommendations. The other three treatments were based on a reduced CP diet that was formulated to 15.5% CP and 0.85% dLys without or with PB (Symphiome®, dsm-firmenich). In the reduced CP diets, all AA were balanced and expressed as the ratio of dLys. The reduced CP diet without any PB supplementation was considered the negative control (NC; treatment 2). The other two reduced CP diets were supplemented with either 0.5 (treatment 3) or 0.7 kg/MT (treatment 4) of PB and were considered as PB1 and PB2 respectively. Treatment diets were fed between 24 to 42 weeks of age following the adaptation period from 22 to 24 weeks of age.
The birds were weighed at the beginning of the trial period and the end of the experimental period. Change in body weight (CBW) was calculated by finding the difference between the ending body weight to the beginning body weight in grams. Birds were given ad libitum access to water. Every pen had a corresponding feed bucket of known weight that was filled with enough feed to last a week at a calculated feed intake of ~115 grams per bird per day. Feed was added from the bucket to customized feeders four times a week (Monday, Wednesday, Friday, and Saturday). The remaining feed at the end of the week was weighed back every Wednesday at 7:00 am and all feed weigh back was completed within a two-hour window. Feed intake was calculated weekly by taking the difference between the beginning and ending bucket weight in grams. Feed intake was reported in terms of both grams per bird per day (g/b/d) and pounds per hundred birds per day (lbs/100). The equation for g/b/d is shown below:
The equation for lbs/100 is shown below:
2.3. Egg Production and Performance Data
Egg data was collected daily at 3:30 pm within an hour window. The number of eggs and external egg flaws were recorded daily for each cage. To calculate production, weekly hen-day egg production (HDEP) was used. The number of eggs produced in each cage in a week was divided by the total number of hen-days within that cage during that week. The equation for weekly HDEP is shown below:
HDEP = total # of eggs for the week/(# of hens ∗ 7 days)
Egg flaws were recorded as unsalable eggs (UE) and included any egg that was shell-less or soft-shelled, extremely small, extremely large, dirty, cracked, bloody, or had very visible ridges or calcium deposits. Average egg weight (AEW) was calculated weekly for each experimental unit. Every Wednesday, eggs from each cage were weighed together on a tared egg flat to find the total egg weight for that cage. The total weight was divided by the number of eggs collected to find the AEW. Feed conversion ratio was calculated in terms of both grams of feed per gram of egg (gf/ge) and kilograms of feed per dozen eggs (kg/doz). The equation for gf/ge is shown below:
The equation for kg/doz is shown below:
2.4. Apparent Total Tract Digestibility and Apparent Ileal Digestibility of CP
One week prior to the end of the study, one bird from one replication for seven blocks was randomly selected and placed into an individual cage for excreta collection within the same house. One replication from each treatment was chosen from seven blocks at random to receive their feed with a 0.5% titanium dioxide (TiO2) marker. Feeding and egg collecting schedules remained the same. Fecal collection trays were placed underneath the cages of the birds. The feed with the marker was supplied for a total of 10 hours, after which, the excreta was collected from the trays. The excreta samples were later weighed, oven-dried for 24 hours at 105 °C, and then re-weighed to find moisture content. The dried excreta samples along with the feed samples containing TiO2 were shipped to an outside lab (ATC Scientific, North Little Rock, AR) for analysis of crude protein, as well as TiO2. The apparent total tract digestibility (ATTD) of crude protein was calculated by the following equation [22].
Digesta samples were collected from the birds that received the TiO2 feed. Hens were euthanized by CO2 inhalation and ileum samples were collected for CP and AA analysis.
Ileal contents were collected beginning at the distal end of the ileum from approximately three cm below the Meckel’s diverticulum to approximately three cm proximal to the ileocecal junction. The digesta was gently flushed from the ileum with distilled water, frozen, then freeze-dried. The freeze-dried samples along with the feed samples containing TiO2 were sieved and shipped to an outside lab (ATC Scientific, North Little Rock, AR) for analysis of CP and TiO2. Crude protein was analyzed according to the methodology described in AOAC 968.06 [23]. Titanium dioxide was analyzed according to a modification of the method described in AOAC 2006.03 [24]. The apparent ileal digestibility (AID) of CP was calculated by the following equation [22].
2.5. Blood Biomarkers
At 42 weeks of age, Lithium-Heparin syringes were used to draw 1 mL of blood from the wing vein of each of the birds that had been given titanium dioxide feed (seven birds per treatment). The blood was then injected into an avian/reptilian Vetscan cartridge and was analyzed by a Vetscan VS2 machine (Abaxis, Inc., Union City, CA) with the avian/reptilian profile according to the manufacturer’s instructions. Levels of plasma sodium (Na), potassium (K), phosphorus (P), aspartate aminotransferase (AST), uric acid (UA), globulins (Glob), albumins (ALB), total protein (TP), glucose (Glu), and creatine kinase (CK) were determined.
2.6. Economic Analysis
Economic analysis was done from 24 to 41 weeks of age. The cost of feed was held constant throughout the study period and the values per ton are as follows: PC = $556.75; NC = $531.51; PB1 = $533.24; PB2 = $533.93. Prices for table eggs which included weight grades of extra-large, large, and medium were obtained weekly starting from October 14 to February 10 from the United States Department of Agriculture Agricultural Marketing Service shell eggs report for the southeast region [25]. Eggs that fell outside this range were considered discarded. The cost per hundred hens per day was determined by multiplying the cost of a pound of feed for the respective treatment by lbs./100. Then income per hundred hens per day was found by first finding the weight grades of the eggs for each pen using the AEW, then multiplying the HDEP by the price for the respective grade. The cost was subtracted from income. Values were reported in dollars per hundred hens per day ($/100/d).
2.7. Statistical Analysis
Outliers for performance data were removed using Cook’s D-Value. The production data and economic analysis data were analyzed in a mixed model using the PROC GLIMMIX procedure of SAS 9.4 (SAS Institute Inc., Cary, NC). The data was analyzed as repeated measures where the type of variance-covariance structure was defined as unstructured. Degrees of freedom were determined using the Kenward Roger estimation and least significant means for each treatment were analyzed for each treatment overall and within each week with adjustments by the Tukey-Kramer procedure. The following population model was used to analyze the production data:
where:
γijk = production data
μ = mean of the whole population
τi = effect of treatment
tk=effect of weekly measurement from 24 – 41 weeks
(τ * t)ik = effect of interaction between treatment and week
δτ(i)j = random error of repeated measurements with mean 0 and covariance σij
ε′ijk = random error with mean 0 and variance σi2
The model was constructed under the assumption that these data are normally distributed. The total variation of the model was composed of variation due to repeated measurements and variation due to random error. The adaptation, digestibility, and blood biomarker data were analyzed in a one-way ANOVA based on a two-sided alternative hypothesis using the PROC GLM procedure of SAS 9.4 (SAS Institute Inc., Cary, NC). Means with significant (P≤0.05) treatment effects in ANOVA were subject to post hoc means separation using Fisher’s Least Significant Difference. Pairwise comparisons using Student’s t test are displayed for digestibility and blood biomarker data.
3. Results
3.1. Egg Production and Performance Data
For the adaptation period, there were no differences between treatments. However, to ensure that there was no covariance, a mixed model with repeated measures was utilized to analyze the production data. Egg production data analyzed from the entire study are presented in Table 2. The lowest HDEP was observed among hens fed the NC diet of 15.5% CP without PB.
Both inclusion levels of PB had production that was not significantly different compared to the NC diet (98.04% and 98.20% compared to 97.58%), nor from the PC diet (98.75%). However, the HDEP for the PC diet was significantly higher than that of the NC diet (P=0.0028). There was a trend in AEW in which the PC diet had the highest AEW (59.17 g) and NC had the lowest (58.26 g) compared to the other treatments (P=0.0935). There were no significant differences for UE (P=0.8631).
3.2. Feed Intake, Feed Conversion Ratio, and Body Weight
Feed intake (g/b/d and lbs/100) and FCR (gf/ge and kg/doz) data for the entire study are presented in Table 3. There were no significant differences between treatments for gf/ge (P=0.2355). However, there was a significant interaction between treatment and week (Figure 1 and Table 4; P=0.0334). All treatments had the highest gf/ge from 25 to 27 weeks of age (WOA). Over time, the PC group had the greatest number of weeks with different gf/ge compared to the week with the highest value (2.327), while NC, PB1, and PB2 had means that remained similar throughout the rest of the study to the highest mean observed (2.250; 2.224; 2.204). There was a trend towards significance in kg/doz in which PC had the lowest FCR and NC had the highest compared to the other treatments (P=0.0624). There was a significant interaction between treatment and week for kg/doz as presented in Figure 2 and Table 5 (P=0.0012). At 28 WOA, kg/doz was greater for NC (1.473) than for PB1 (1.371). The highest reported kg/doz for all treatments was at 27 WOA. Over time, PC had the greatest number of weeks with different kg/doz than the highest value (1.558), while NC had the least number of weeks different than 27 WOA (1.543).
There were no significant differences between treatments for g/b/d or lbs/100 throughout the study (P=0.7042; P=0.7043). However, there was an influence of week on treatment for both of these parameters (P=0.0111; Figure 3 and Figure 4 and Table 6 and Table 7). All treatments had the lowest feed intake at 24 WOA and the highest recorded feed intake at 27 WOA. Feed intake decreased from 27 WOA (129.09 g) for PC throughout the rest of the study while there were no significant decreases for NC from 27 WOA (124.98). Both PB1 and PB2 had weeks with decreased feed intake from 27 WOA (125.35; 125.66). The large fluctuations in feed intake between 24 and 27 WOA may be explained by the process of learning what the flock’s ideal feed intake was, as well as issues with feed wastage. Given that there were no significant differences between treatments for these weeks, these week-to-week fluctuations are not believed to have influenced the data regarding the treatments’ effects on any of the given parameters.
3.3. Apparent Total Tract Digestibility and Apparent Ileal Digestibility of CP
Results for digestibility are presented in Table 8. No significant differences were seen between treatments for the AID of CP (P=0.2651). However, the NC diet (55.95%) had the highest ATTD of CP followed by PC (43.15%; P=0.0462). Supplementation with both levels of PB (41.32%; 37.69%) decreased the ATTD of CP from the high levels shown with NC and brought it to similar levels as PC, suggesting the potential for PB to help adapt digestibility in a reduced CP diet by modulating microbial pathways in the ceca related to nitrogen utilization [26].
We hypothesized that HDEP and AEW would increase with supplementation of PB in a reduced CP diet due to increased CP digestibility. However, while HDEP was numerically increased, there were no differences in the AID of CP, which is supported by research in broilers supplemented with 0.9 kg/MT [26]. Additionally, the ATTD of CP was increased in the NC diet compared to those supplemented with PB. The digestibility of CP in a decreased CP diet has shown mixed results in the literature [27,2,7]. Most studies in poultry have looked exclusively at AID due to the demonstrated variability that arises in ATTD values from bacterial fermentation in the ceca [22]. However, Ding et al. (2016) reported that in broilers the ATTD of CP was decreased with decreased CP levels [27]. Conversely, increased ATTD of CP in a decreased CP diet was reported by Heo et al. (2023) [2]. Similarly, Awad et al. (2015) reported that AID was significantly increased when the CP of a diet was reduced from 19.5% to 13.5% but was fortified with crystalline AA [7]. The authors suggested that this could have been due to either improved AA digestibility or because of improved efficiency. In the standard CP diet, AA in excess of the birds’ requirements may have ended up being excreted.
It was expected that PB would increase digestibility of CP due to an increase in nitrogen assimilation into products such as SCFA, BCFA, and others. Two previous studies have calculated the microbiome protein metabolism index (MPMI) of the microbiome which gives a ratio of the metabolic processes of beneficial microbial protein assimilation to the metabolic processes of undesired protein putrefaction. In both these studies, the MPMI index was increased by PB supplementation suggesting improved protein assimilation [15,18]. In this research, the significant decreases in ATTD from NC when PB was added along with the lack of differences of AID suggests that supplementation of PB increased endogenous production of protein, specifically after the ileocecal junction, or microbial protein production in the caeca.
It is possible that the increased endogenous production of protein in the small intestine is due to increased production of SCFA promoted by PB. Previous work by Bortoluzzi et al. (2023) evaluated the cecal SCFA of birds fed PB compared to those not fed PB [15]. Propionic acid and butyric acid in the ceca were only detected in the group with the PB, which also increased the concentration of all SCFA. Furthermore, Walsh et al. (2021) described an increase in the abundance of genes involved in propionate production in birds treated with PB [13]. It has been shown that increased SCFA increases glycoprotein secretion such as mucins [28]. This may account for the lowered ATTD of CP as the PB acts in the ceca to increase production of SCFA leading to secretion and eventual excretion of mucins.
The PC group had improved HDEP compared to the NC which may be explained by the fact that excess CP that is not absorbed as AA is broken down into BCFA by proteolytic enzymes [29]. BCFA are first alpha-oxidized, then beta-oxidized to form acetic acid, an important component for the Krebs Cycle to produce ATP [30]. While the NC diet may have met AA requirements, lower energy production from protein may have resulted in lower HDEP. When the PB was supplemented, potential increases in SCFA such as acetic acid may have led to an increase in the production of ATP and other metabolites from the Krebs cycle which may have influenced the production capabilities of the hens [29,30].
3.4. Blood Biomarkers
Results for blood biomarkers are found in Table 9. Treatment with PB2 resulted in higher UA (2.900 mg/dL) than PC, NC, and PB1 (1.972; 1.644; 1.779; P=0.0312). Similarly, PB2 had higher P (4.885 mg/dL) compared to PC, NC, and PB1 (3.971; 3.851; 3.420; P=0.0375).
The elevated uric acid levels in a lower CP diet with lower digestibility, along with a similar feed intake among all groups, suggest that the conversion of ammonia to uric acid was increased in the PB2 birds [31]. Uric acid is an antioxidant and is part of the nitrogen excretion system employed by birds [32]. It is known that both increased heat and increased cold conditions can lead to oxidative stress [33,34]. Feed conversion for kg/doz showed the greatest differences across weeks within treatments when the birds were between 32 and 39 weeks of age as seen in Figure 2. This happened to coincide from the middle of December through the last week of January. The hens were housed in a barn that was not completely climate controlled and during these months may have experienced more temperature fluctuations than during the rest of the study as seen in Figure 5. Petranyi et al. (2024) reported laying hen mortality due to smothering was significantly decreased in a test group supplemented with 0.9 kg/MT PB compared to a control group, which may suggest that these birds were better able to tolerate smothering-associated stressors [17]. It should be noted however, that a recent study with broilers found that those given PB at 0.9 kg/MT from the starter through the finisher phase had lower plasma UA concentrations than those fed a control diet. However, the average level of UA in the broilers supplemented with PB was nearly identical (2.91 mg/dL) to the UA level of the hens supplemented in our study (2.90 mg/dL), and Bortoluzzi et al. (2024) tested PB supplementation in starter, grower, and finisher diets with recommended CP levels (21%; 19%; 18%) [26]. Additionally, Bortoluzzi et al. (2024) found that supplementation with PB in broilers fed a corn-based diet altered the abundance of genes related to nitrogen metabolism [26]. A possible explanation for the differences in UA results between this study and Bortoluzzi et al. (2024) is that levels of 0.7 to 0.9 kg/MT PB helped modulate nitrogen metabolism to result in similar levels of UA regardless of dietary protein content [26]. Further research in this area may include testing how supplementation of the PB affects performance when the birds are exposed to environmental stressors such as heat or cold compared to a control and testing the difference between PB supplementation in both full and reduced CP diets. The other blood biomarker that was significantly different between treatments was plasma P. Like the plasma UA, it was increased in PB2 without also showing increased feed intake suggesting improved phosphorus metabolism. Certain bacteria have roles in phosphorus release, so it is possible that the PB was able to modulate pathways relating to these bacteria [35]. However, more research is needed in this area.
There are a couple of different interpretations that can be considered as to why the CK levels of PB2 may be numerically elevated in comparison to NC. The only biomarker that is outside the reference range established by Board et al. (2018) is CK [36]. Elevated CK levels, especially in conjunction with elevated AST levels, may be indicative of muscle metabolism [37]. In the absence of sufficient dietary protein, hens may break down muscle tissue for egg production [38,39]. While the NC group slowed egg production to match the reduced CP in their diet, HDEP production of PB1 and PB2 was not significantly different than PC. Furthermore, the ATTD of CP results suggest that the addition of PB to a reduced CP diet may decrease digestibility in the lower intestinal tract in comparison to a reduced CP diet alone. However, even though the birds fed 0.7 kg/MT PB may have had lower CP digestibility but maintained a high level of production, it should not be assumed that the birds depleted muscle to maintain production, as this is not necessarily reflected in the body weight data. There were no significant differences in body weight between NC and PB2 as shown in Table 3. In fact, numerically, PB2 had a greater increase in body weight compared to NC. Additionally, the levels of AST, a marker of muscle deterioration, for both NC and PB2 are well within the reference range established by Board et al. (2018) [36]. Given the limited sample size for the blood biomarker data, it is possible that these differences within the normal range are due to normal variation among birds, therefore, it is difficult to make conclusive statements regarding how the biomarkers were elevated. Further research in this area could include a comparison of the ratio of breast muscle weight to body weight across treatments and/or weekly measurements of changes in body weight over a longer trial period to better determine if PB may impact muscle metabolism.
3.5. Economic Analysis
The results of the economic analysis are shown in Table 10. Both PB1 and PB2 had significantly decreased feed costs from PC by -0.28 $/100/d and -0.24 $/100/d respectively (P<0.0001). There were no significant differences for income or for feed cost subtracted from income. Based on the numerically decreased kg/doz and the economic analysis data, supplementation with PB may have the ability to help producers save on costs, however, more research needs to be done.
4. Conclusions
The reduced CP diet had lower HDEP than the standard CP diet, but supplementation of PB in the reduced CP diet resulted in HDEP that was not different than that of the standard CP diet. PB numerically decreased kg/doz in a reduced CP diet. There were no significant differences between PB1 and PB2 for any of the parameters measured except for the blood biomarkers. Supplementation of PB decreased ATTD of CP which goes against our hypothesis, however, it also promoted higher concentrations of plasma uric acid and plasma phosphorus, which may indicate more efficient metabolic pathways for ammonia excretion. While more research is needed on PB, this research suggests that supplementation with PB in laying hens has the potential to be economically advantageous.
Author Contributions
Conceptualization, P. Adhikari and B. Jasek; methodology, P. Adhikari, B. Jasek and E. Rodewald; software, E. Rodewald; validation, P. Adhikari, E. Rodewald, L. Zhang, B. Jasek, C. Bortoluzzi; formal analysis, E. Rodewald; investigation, P. Adhikari; resources, P. Adhikari, C. Bortoluzzi, B. Jasek and S. Roberts; data curation, E. Rodewald, P. Adhikari; writing—original draft preparation, E. Rodewald; writing—review and editing, P. Adhikari, L. Zhang, S. Roberts, B. Jasek, C. Bortoluzzi; visualization, P. Adhikari; supervision, P. Adhikari; project administration, P. Adhikari; funding acquisition, P. Adhikari. All authors have read and agreed to the published version of the manuscript.
Funding
This research was funded by dsm-firmenich. The publication is a part of Cris-Hatch Multistate Research program under Mississippi Agriculture and Forestry Experiment Station (MAFES) Cris number MS-329360.
Institutional Review Board Statement
The animal study protocol was approved by the Mississippi State University Institution of Animal Care and Use Committee (protocol code IACUC #22-366 and date of approval was July 15, 2022).
Data Availability Statement
The original contributions presented in the study are included in the article; further inquiries can be directed to the corresponding author.
Acknowledgments
The authors acknowledge the Mississippi State University Poultry Research Unit farm staff, faculty, graduate students, and research assistants for their help in data collection and sampling.
Conflicts of Interest
B. Jasek and C. Bortoluzzi are employed by dsm-firmenich and were employed at the time the experiment was conducted. They had roles in the design of the study, in the writing of the manuscript, and in the decision to publish the results. The other authors declare no conflicts of interest.
References
- Roberts, S.A.; Xin, H.; Kerr, B.J.; Russell, J.R.; Bregendahl, K. Effects of dietary fiber and reduced crude protein on ammonia emission from laying-hen manure. Poult. Sci. 2007, 86, 1625–1632. [Google Scholar] [CrossRef]
- Heo, Y.; Park, J.; Kim, Y.; Kwon, B.; Kim, D.; Song, J.; Lee, K. Effects of dietary protein levels on performance, nitrogen excretion, and odor emission of growing pullets and laying hens. Poult. Sci. 2023, 102, 102798. [Google Scholar] [CrossRef] [PubMed]
- Strock, J.S. Ammonification in Encyclopedia of Ecology; Jørgensen, S.E., Fath, B.D., Eds.; Acad. Press, 2008; pp. 162–165. [Google Scholar] [CrossRef]
- Burley, H.K.; Patterson, P.H.; Elliot, M.A. Effect of a reduced crude protein, amino acid-balanced diet on hen performance, production costs, and ammonia emissions in a commercial laying hen flock. J. Appl. Poult. Res. 2013, 22, 217–228. [Google Scholar] [CrossRef]
- Poudel, I.; Hodge, V.R.; Wamsley, K.G.S.; Roberson, K.D.; Adhikari, P.A. Effects of protease enzyme supplementation and varying levels of amino acid inclusion on productive performance, egg quality, and amino acid digestibility in laying hens from 30 to 50 weeks of age. Poult. Sci. 2023, 102, 102465. [Google Scholar] [CrossRef]
- Hernández, F.; López, M.; Martínez, S.; Megías, M.D.; Catalá, P.; Madrid, J. Effect of low-protein diets and single sex on production performance, plasma metabolites, digestibility, and nitrogen excretion in 1- to 48-day-old broilers. Poult. Sci. 2012, 91, 683–692. [Google Scholar] [CrossRef] [PubMed]
- Awad, E.; Zulkifli, I.; Farjam, A.; Chwen, L.; Hossain, M.; Aljuobori, A. Effect of low-protein diet, gender and age on the apparent ileal amino acid digestibility in broiler chickens raised under hot-humid tropical condition. Indian J. Anim. Sci. 2015, 86, 696–701. [Google Scholar] [CrossRef]
- Parenteau, I.A.; Stevenson, M.; Kiarie, E.G. Egg production and quality responses to increasing isoleucine supplementation in Shaver White hens fed a low crude protein corn-soybean meal diet fortified with synthetic amino acids between 20 and 46 weeks of age. Poult. Sci. 2020, 99, 1444–1453. [Google Scholar] [CrossRef]
- Ducatelle, R.; Eeckhaut, V.; Haesebrouck, F.; van Immerseel, F. A review on prebiotics and probiotics for the control of dysbiosis: Present status and future perspectives. Animals 2014, 9, 43–48. [Google Scholar] [CrossRef]
- Yaqoob, M.U.; Abd El-Hack, M.E.; Hassan, F.; El-Saadony, M.T.; Khafaga, A.F.; Batiha, G.E.; Yehia, N.; Elnesr, S.S.; Alagawany, M.; El-Tarabily, K.A.; et al. The potential mechanistic insights and future implications for the effect of prebiotics on poultry performance, gut microbiome, and intestinal morphology. Poult. Sci. 2021, 100, 101143. [Google Scholar] [CrossRef]
- Davani-Davari, D.; Negahdaripour, M.; Karimzadeh, I.; Seifan, M.; Mohkam, M.; Masoumi, S.; Berenjian, A.; Ghasemi, Y. Prebiotics: Definition, Types, Sources, Mechanisms, and Clinical Applications. Foods 2019, 8, 92. [Google Scholar] [CrossRef]
- The Human Microbiome Project Consortium. Structure, function and diversity of the healthy human microbiome. Nature. 2012, 486, 207–214. [Google Scholar] [CrossRef] [PubMed]
- Walsh, M.C.; Jacquier, V.; Schyns, G.; Claypool, J.; Tamburini, I.; Blokker, B.; Geremia, J.M. A novel microbiome metabolic modulator improves the growth performance of broiler chickens in multiple trials and modulates targeted energy and amino acid metabolic pathways in the cecal metagenome. Poult Sci. 2021, 100, 100800. [Google Scholar] [CrossRef] [PubMed]
- Jacquier, V.; Walsh, M.C.; Schyns, G.; Claypool, J.; Blokker, B.; Bortoluzzi, C.; Geremia, J. Evaluation of a Precision Biotic on the Growth Performance, Welfare Indicators, Ammonia Output, and Litter Quality of Broiler Chickens. Animals 2022, 12, 231. [Google Scholar] [CrossRef]
- Bortoluzzi, C.; Tamburini, I.; Geremia, J. Microbiome modulation, microbiome protein metabolism index, and growth performance of broilers supplemented with a precision biotic. Poult. Sci. 2023, 102, 102595. [Google Scholar] [CrossRef] [PubMed]
- Leone, F.; Ferrante, V. Effects of prebiotics and precision biotics on performance, animal welfare and environmental impact. A review. Sci. Total Environ. 2023, 901, 165951. [Google Scholar] [CrossRef]
- Petranyi, F.; Whitton, M.M.; Lobo, E.; Ramirez, S.; Radovanović, A.; Bajagai, Y.S.; Stanley, D. Precision glycan supplementation: A strategy to improve performance and intestinal health of laying hens in high-stress commercial environments. J. Anim. Physiol. Anim. Nutr. 2024. [Google Scholar] [CrossRef]
- Yan, L.; Chu, T.; Zhang, Q.; Blokker, B.; Lv, Z.; Geremia, J.; Bortoluzzi, C. Microbiome modulation by a precision biotic in broilers chickens: A commercial study validation. Poult. Sci. 2023, 102, 102596. [Google Scholar] [CrossRef]
- Conte, F.N.; van Buuringen, N.; Voermans, N.C.; Lefeber, D.J. Galactose in human metabolism, glycosylation and congenital metabolic diseases: Time for a closer look. Biochimica et Biophysica Acta Gen Subj. 2021, 1865, 129898. [Google Scholar] [CrossRef]
- Jiang, Y.; Xiong, X.; Danska, J.; Parkinson, J. Metatranscriptomic analysis of diverse microbial communities reveals core metabolic pathways and microbiome specific functionality. Microbiome 2016, 4. [Google Scholar] [CrossRef]
- Cummings, J.H.; Macfarlane, G.T. The control and consequences of bacterial fermentation in the human colon. J. Appl. Bacteriol. 1991, 70, 443–459. [Google Scholar] [CrossRef]
- Ravindran, V.; Hew, L.I.; Ravindran, G.; Bryden, W.L. A comparison of Ileal Digesta and excreta analysis for the determination of amino acid digestibility in food ingredients for poultry. Br. Poult. Sci. 1999, 40, 266–274. [Google Scholar] [CrossRef] [PubMed]
- Other Elements in Official Methods of Analysis of AOAC INTERNATIONAL, 22nd ed.; Kane, P.F., Latimer, G.W., Jr., Eds.; Oxford University Press: New York, NY, USA, 2023. [Google Scholar] [CrossRef]
- Protein in Official Methods of Analysis of AOAC INTERNATIONAL, 22nd ed.; Wendt Thiex, N.J., Latimer, G.W., Jr., Eds.; Oxford University Press: New York, NY, USA, 2023. [Google Scholar] [CrossRef]
- United States Department of Agriculture, Agricultural Marketing Service. ReportShell Eggs: Daily Southeast Regional Eggs AJ_PY008. 2023. Available online: https://mymarketnews.ams.usda.gov/viewReport/2736.
- Bortoluzzi, C.; Segura-Wang, M.; Aureli, R.; Leduc, A.; Iuspa, M.A.; Cowieson, A.J. Supplementation of precision biotic leads to improved growth performance by modulating the microbiome of broiler chickens fed corn or wheat-based diets. Poult. Sci. 2024, 103, 104451. [Google Scholar] [CrossRef] [PubMed]
- Ding, X.M.; Li, D.D.; Li, Z.R.; Wang, J.P.; Zeng, Q.F.; Bai, S.P.; Su, Z.W.; Zhang, K.Y. Effects of dietary crude protein levels and exogenous protease on performance, nutrient digestibility, trypsin activity and intestinal morphology in broilers. Livest. Sci. 2016, 193, 26–31. [Google Scholar] [CrossRef]
- Gaudier, E.; Jarry, A.; Blottière, H.M.; de Coppet, P.; Buisine, M.P.; Aubert, J.P.; Laboisse, C.; Cherbut, C.; Hoebler, C. Butyrate specifically modulates MUC gene expression in intestinal epithelial goblet cells deprived of glucose. Am. J. Physiol. Gastrointest. Liver Physiol. 2004, 287, G1168–G1174. [Google Scholar] [CrossRef] [PubMed]
- Kaneda, T. Iso- and anteiso-fatty acids in bacteria: Biosynthesis, function, and taxonomic significance. Microbiol Rev. 1991, 55, 288–302. [Google Scholar] [CrossRef]
- Avigan, J.; Steinberg, D.; Gutman, A.; Mize, C.E.; Milne, G.W.A. Alphadecarboxylation, an important pathway for degradation of phytanic acid in animals. Biochem. Biophys. Res. Commun. 1966, 24, 838–844. [Google Scholar] [CrossRef]
- Salway, J. The Krebs Uric Acid Cycle: A Forgotten Krebs Cycle. Trends. Biochem. Sci. 2018, 43, 847–849. [Google Scholar] [CrossRef]
- Simoyi, M.F.; Van Dyke, K.; Klandorf, H. Manipulation of plasma uric acid in broiler chicks and its effect on leukocyte oxidative activity. Am. J. Physiol. Regul. Integr. Comp. Physiol. 2002, 282, R791–R796. [Google Scholar] [CrossRef]
- Wei, H.; Zhang, R.; Su, Y.; Bi, Y.; Li, X.; Zhang, X.; Li, J.; Bao, J. Effects of Acute Cold Stress After Long-Term Cold Stimulation on Antioxidant Status, Heat Shock Proteins, Inflammation and Immune Cytokines in Broiler Heart. Front. Physiol. 2018, 9, 1589. [Google Scholar] [CrossRef]
- Altan, Ö.; Pabuçcuoǧlu, A.; Altan, A.; Konyalioǧlu, S.; Bayraktar, H. Effect of heat stress on oxidative stress, lipid peroxidation and some stress parameters in broilers. Br. Poult. Sci. 2003, 44, 545–550. [Google Scholar] [CrossRef]
- Li, C.; Cai, H.; Li, S.; Liu, G.; Deng, X.; Bryden, W.; Zheng, A. Comparing the potential of Bacillus amyloliquefaciens CGMCC18230 with antimicrobial growth promoters for growth performance, bone development, expression of phosphorus transporters, and excreta microbiome in broiler chickens. Poult. Sci. 2022, 101, 102126. [Google Scholar] [CrossRef] [PubMed]
- Board, M.M.; Crespo, R.; Shah, D.H.; Faux, C.M. Biochemical Reference Intervals for Backyard Hens. J. Avian med. Surg. 2018, 32, 301. [Google Scholar] [CrossRef] [PubMed]
- Harr, K.E. Diagnostic Value of Biochemistry. In Clinical Avian Medicine; Harrison, G.J., Lightfoot, T.L., Eds.; Spix Publishing, 2006; pp. 616–623. [Google Scholar]
- Cottam, M.; Houston, D.; Lobley, G.; Hamilton, I. The use of muscle protein for egg production in the Zebra Finch Taeniopygia guttata. Ibis. 2002, 144, 210–217. [Google Scholar] [CrossRef]
- Vignale, K.; Caldas, J.V.; England, J.A.; Boonsinchai, N.; Sodsee, P.; Pollock, E.D.; Coon, C.N. The effect of sexual maturity and egg production on skeletal muscle (pectoralis major and gastrocnemius) protein turnover in broiler breeder pure lines. Poult. Sci. 2018, 97, 531–539. [Google Scholar] [CrossRef]
Figure 1.
Weekly effect of varying levels of a precision biotic in a reduced crude protein diet on grams of feed per gram of egg. Bolded P-values are significant. Abbreviations: gf/ge = grams of feed per gram of egg; PC = 17.5% crude protein (CP); NC = 15.5% CP; PB1 = 15.5% CP + 0.5 kg/MT precision biotic (PB); PB2 = 15.5% CP + 0.7 kg/MT PB.
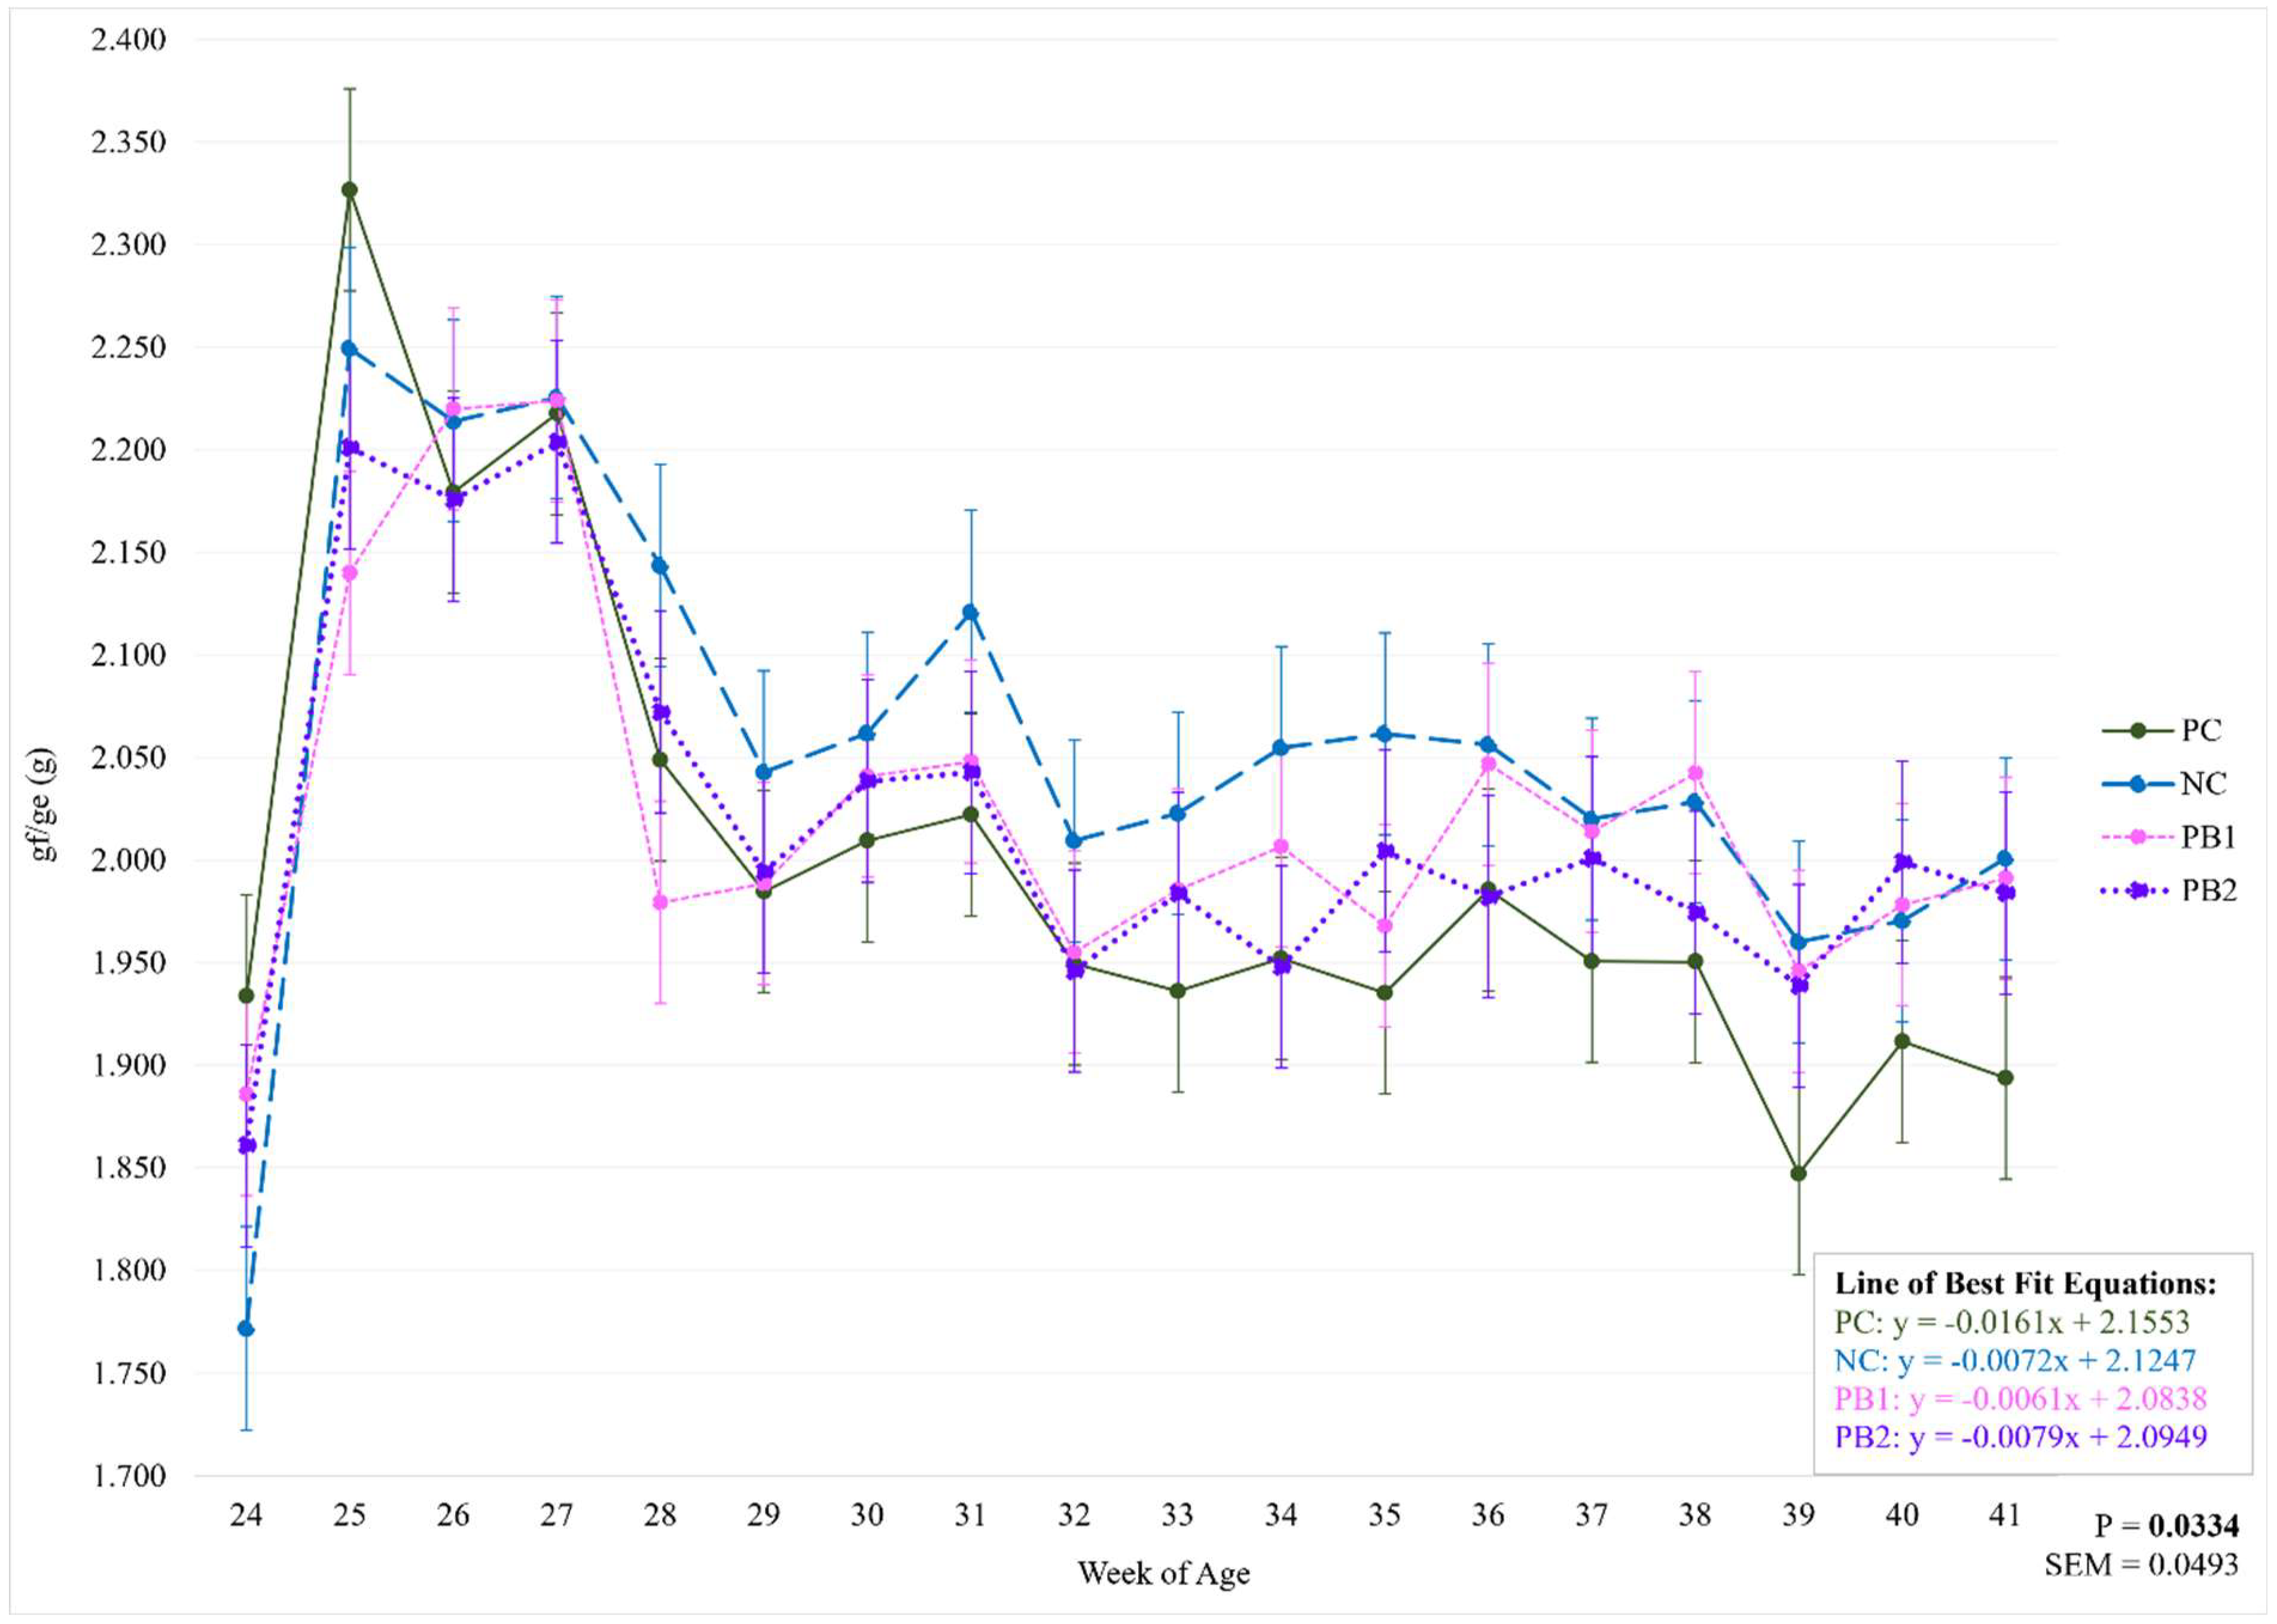
Figure 2.
Weekly effect of varying levels of a precision biotic in a reduced crude protein diet on kilograms of feed per dozen eggs. Bolded P-values are significant. Asterisks denote a significant difference between treatments. Abbreviations: kg/doz = kilograms of feed per dozen eggs; PC = 17.5% crude protein (CP); NC = 15.5% CP; PB1 = 15.5% CP + 0.5 kg/MT precision biotic (PB); PB2 = 15.5% CP + 0.7 kg/MT PB.
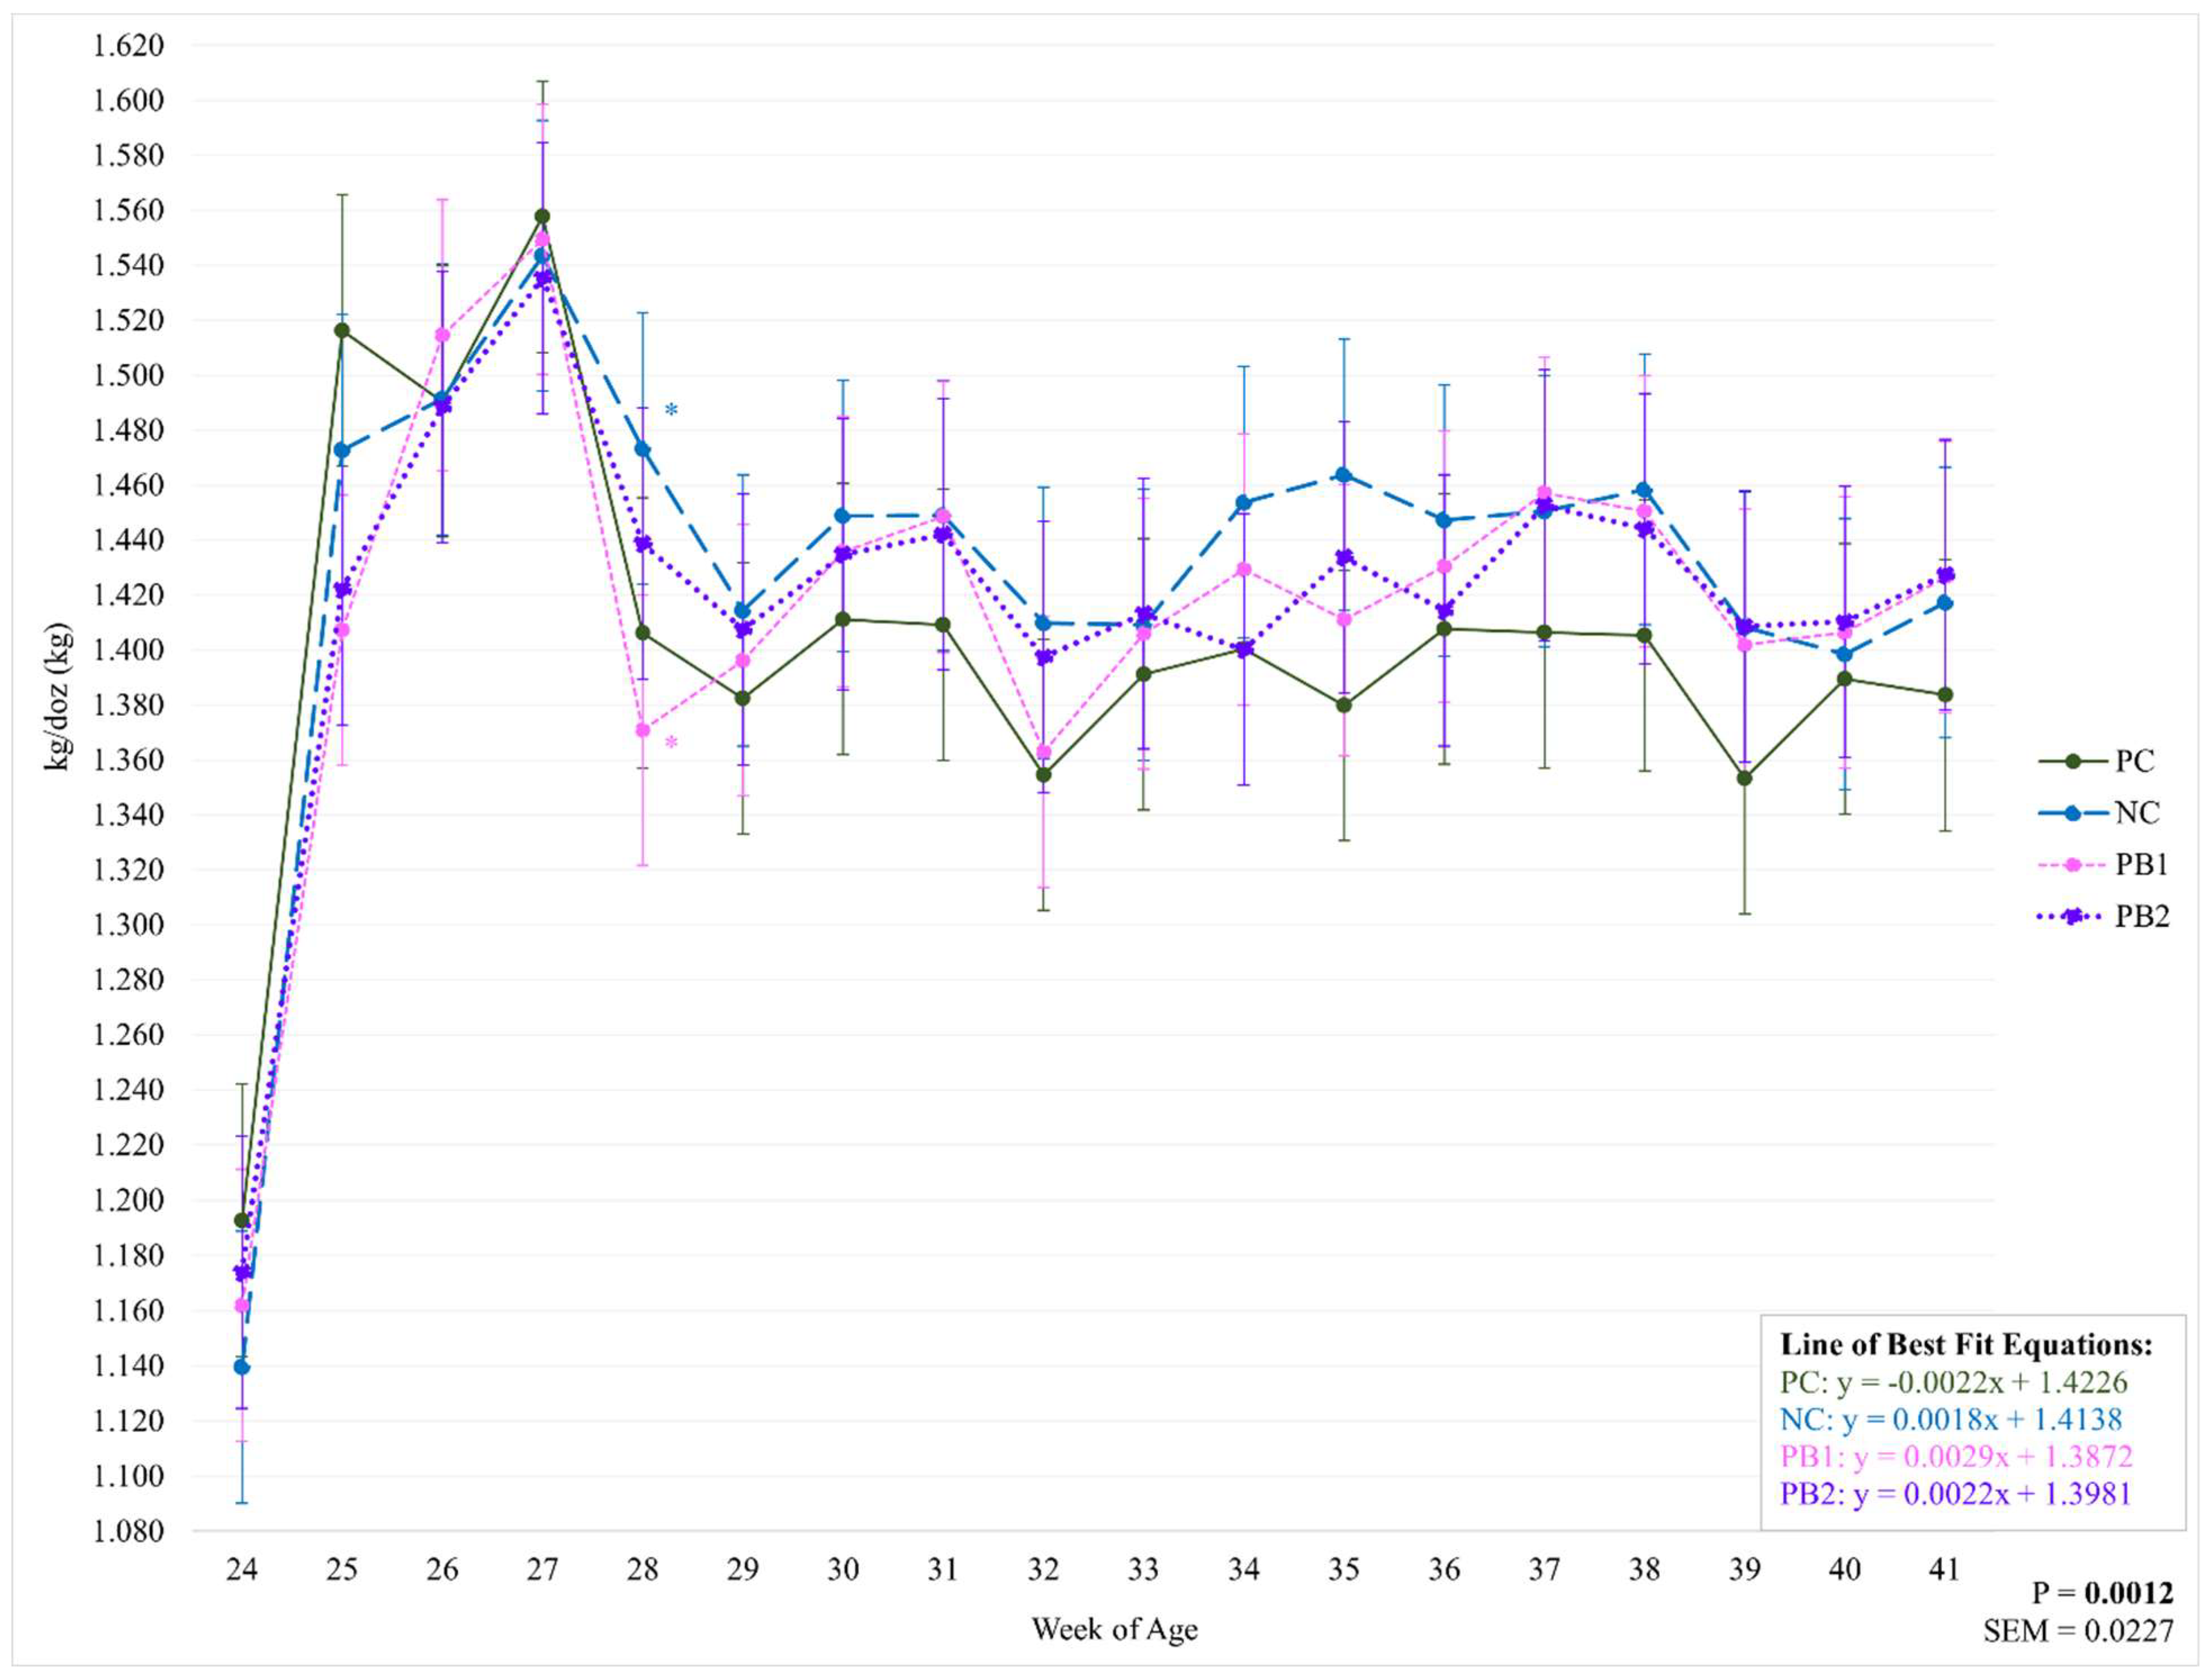
Figure 3.
Weekly effect of varying levels of a precision biotic in a reduced crude protein diet on grams of feed per bird per day. Bolded P-values are significant. Abbreviations: g/b/d = grams of feed per bird per day; PC = 17.5% crude protein (CP); NC = 15.5% CP; PB1 = 15.5% CP + 0.5 kg/MT precision biotic (PB); PB2 = 15.5% CP + 0.7 kg/MT PB.
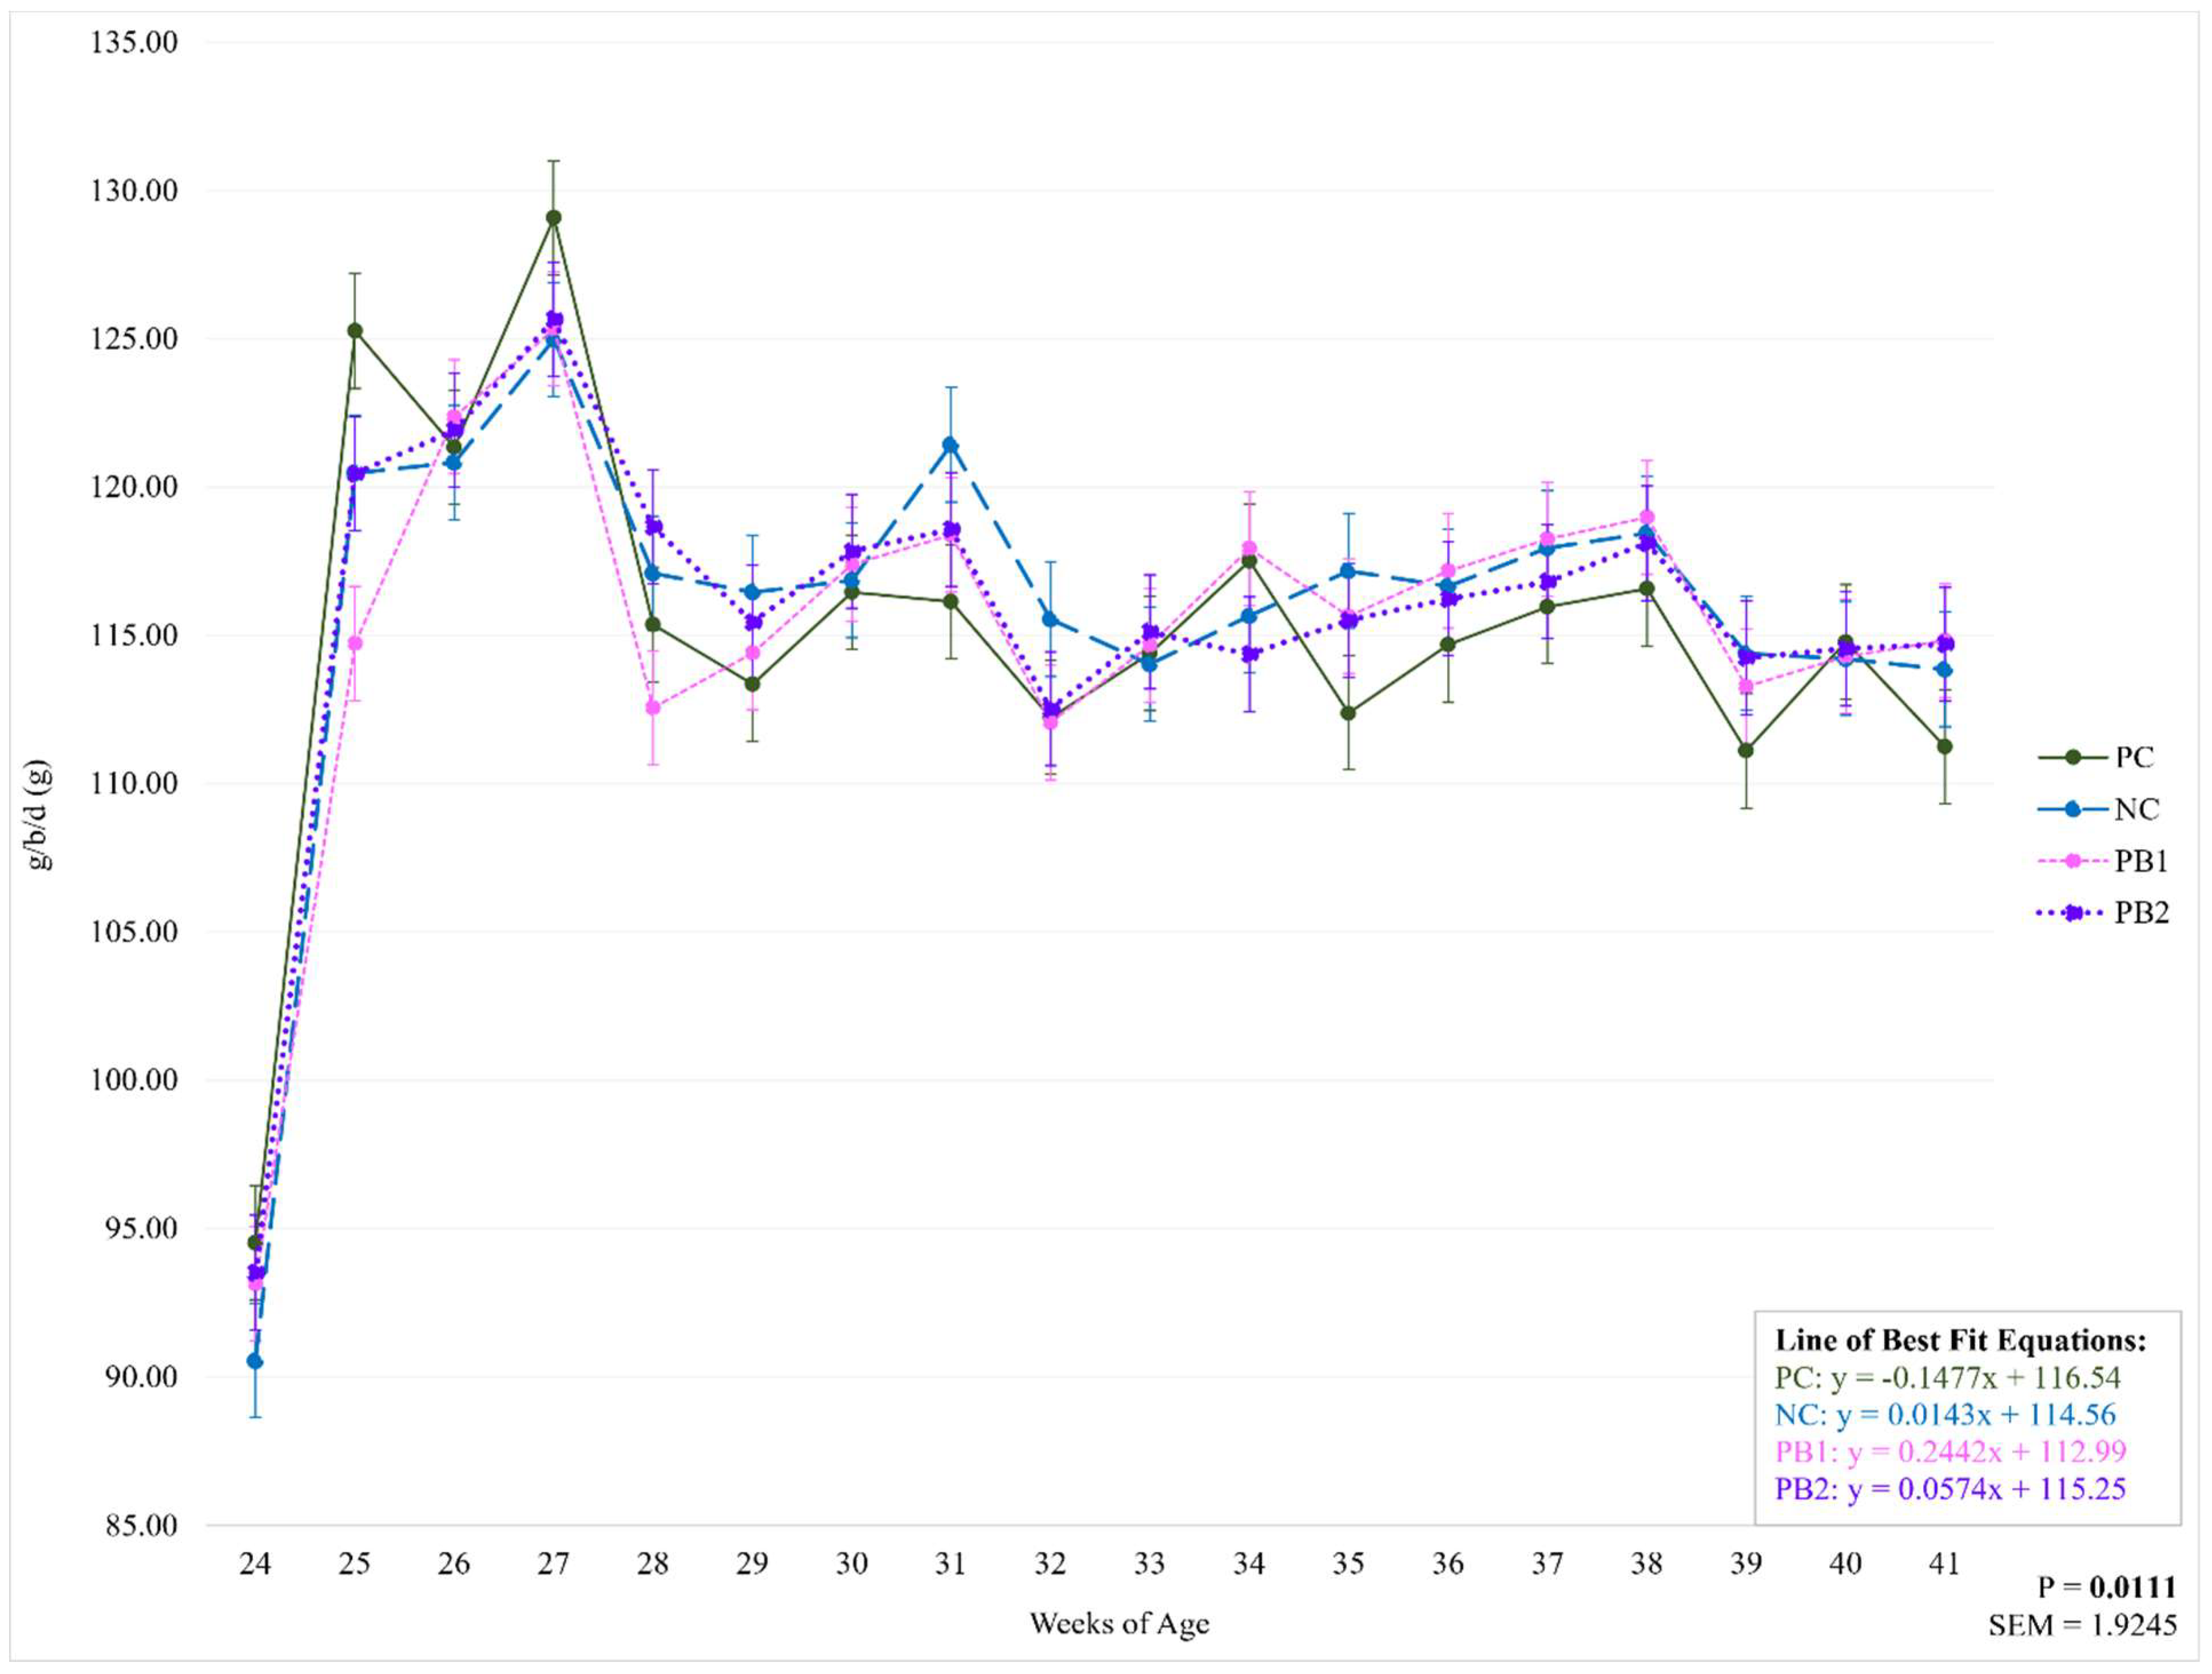
Figure 4.
Weekly effect of varying levels of a precision biotic in a reduced crude protein diet on pounds of feed per hundred birds per day. Bolded P-values are significant. Abbreviations: lbs/100 = pounds of feed per hundred birds per day; PC = 17.5% crude protein (CP); NC = 15.5% CP; PB1 = 15.5% CP + 0.5 kg/MT precision biotic (PB); PB2 = 15.5% CP + 0.7 kg/MT PB.
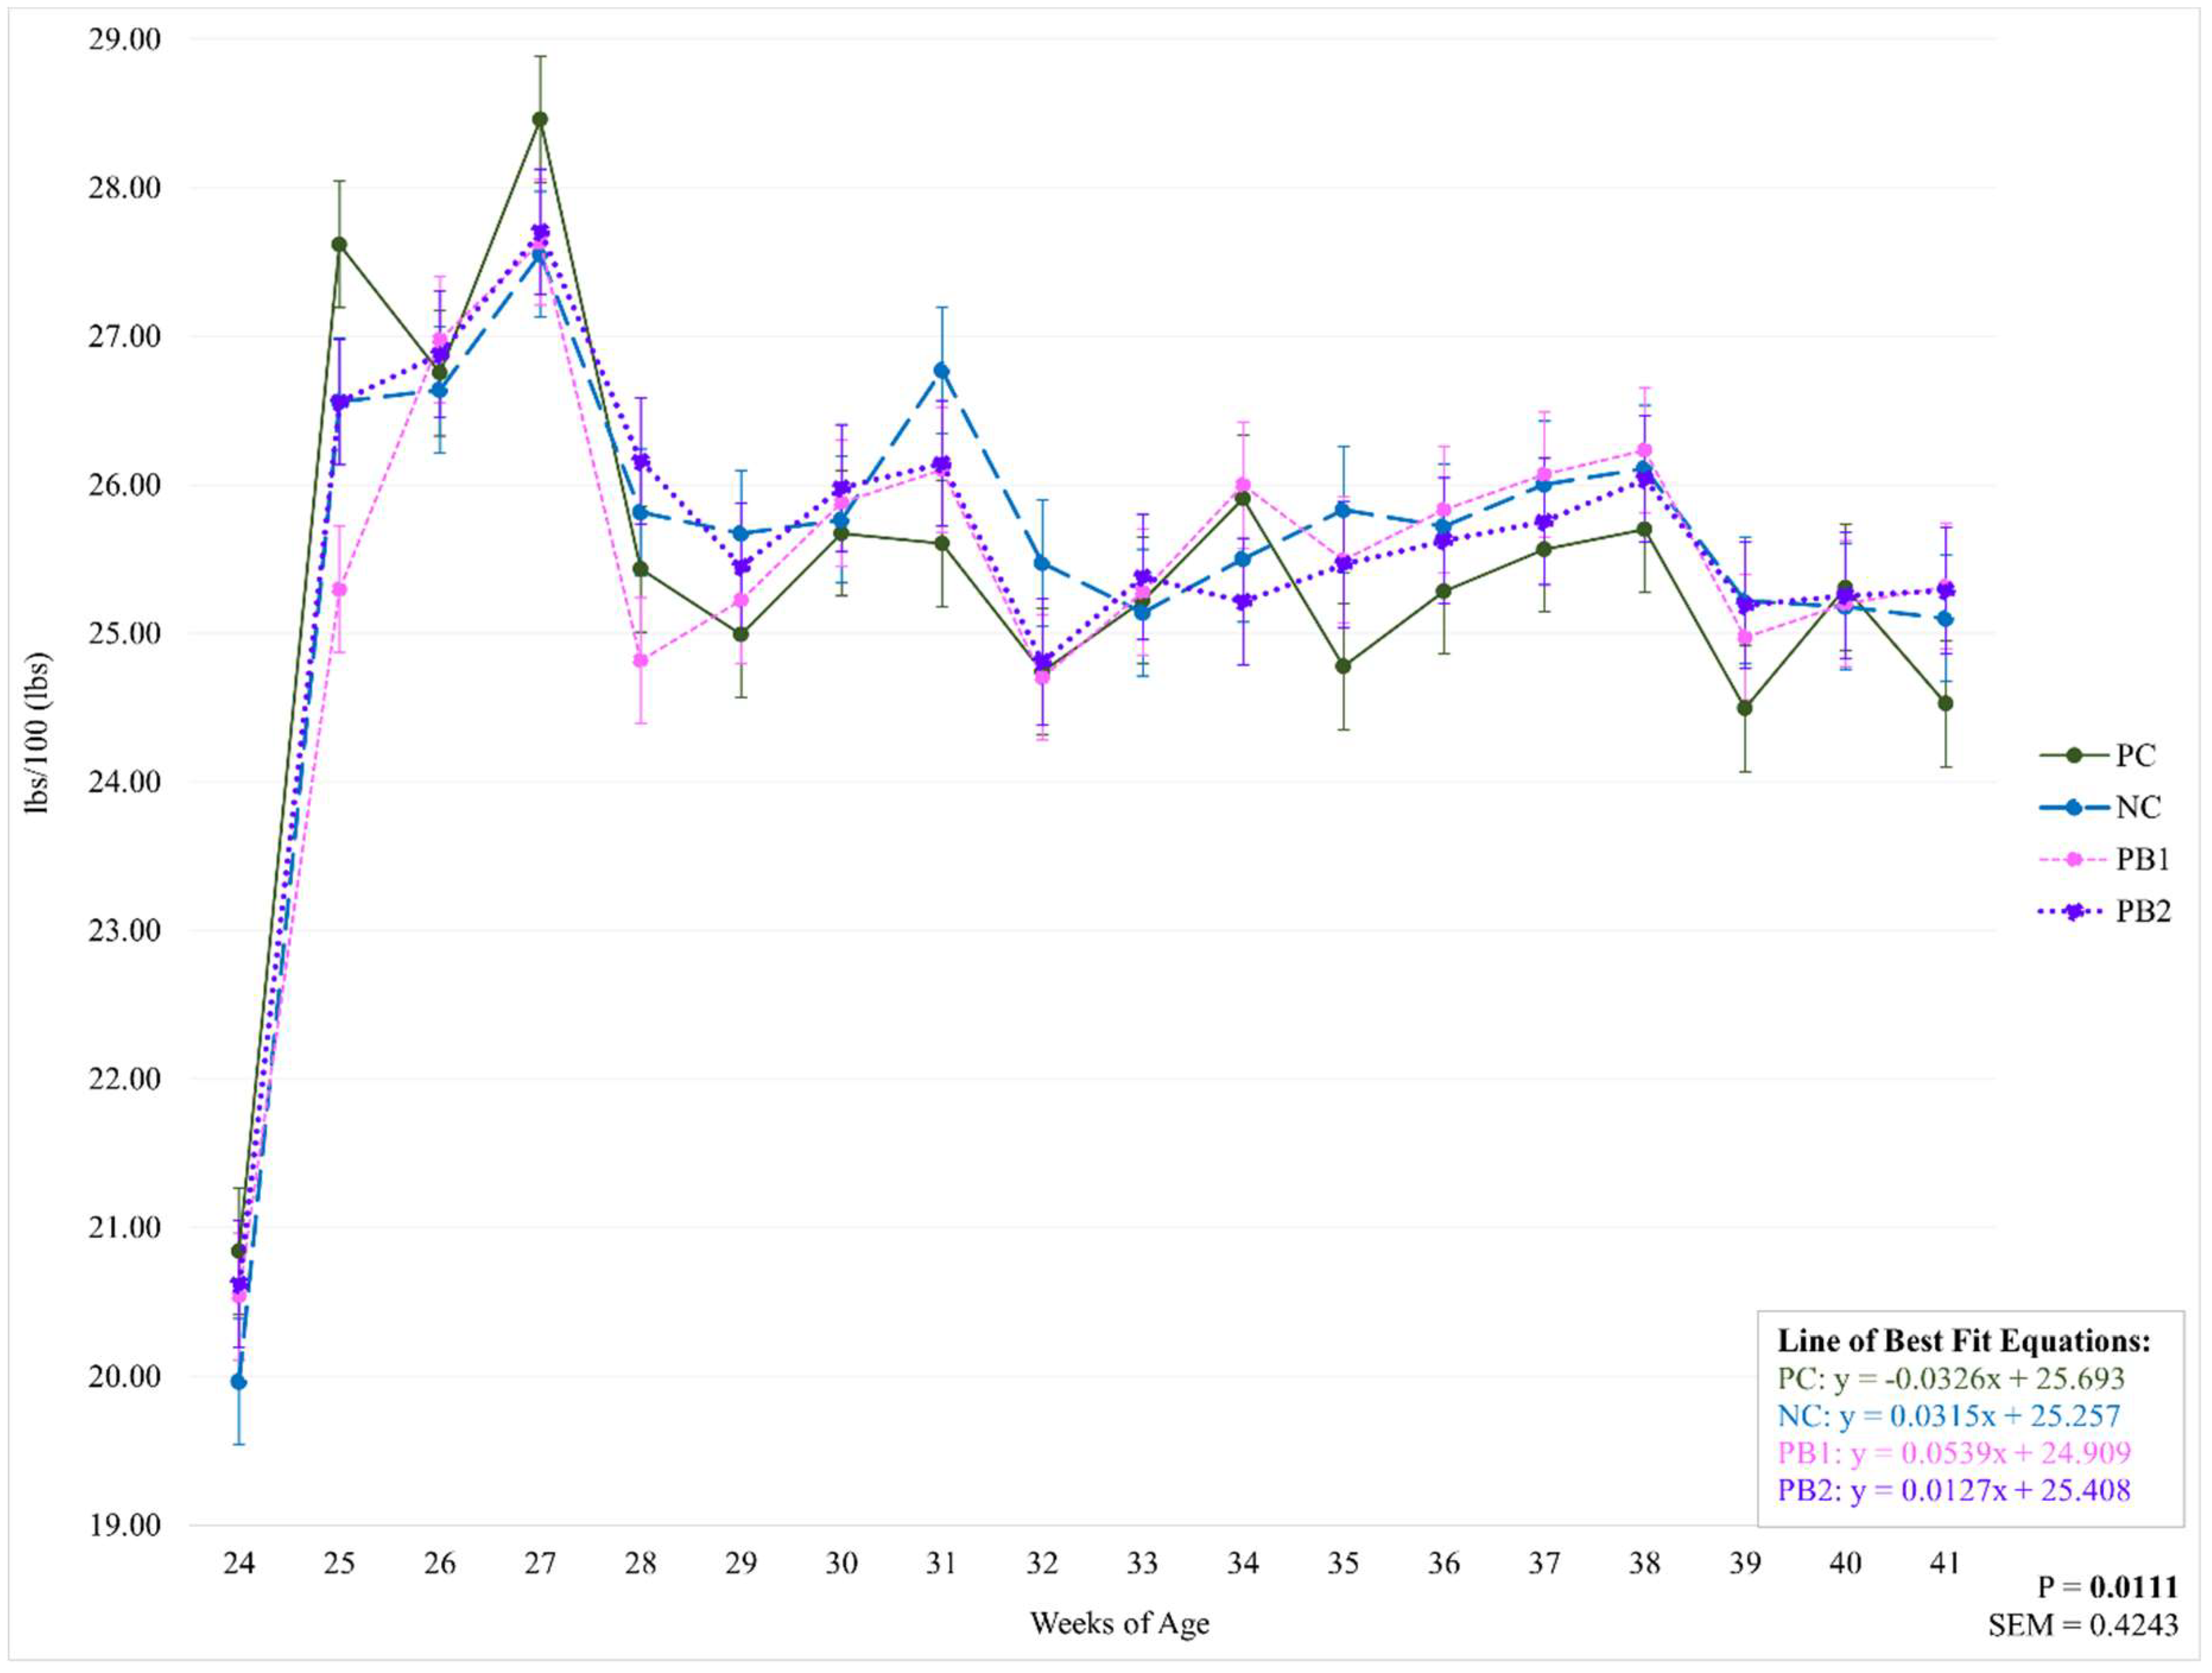
Figure 5.
Recorded average weekly temperatures in the cage house.
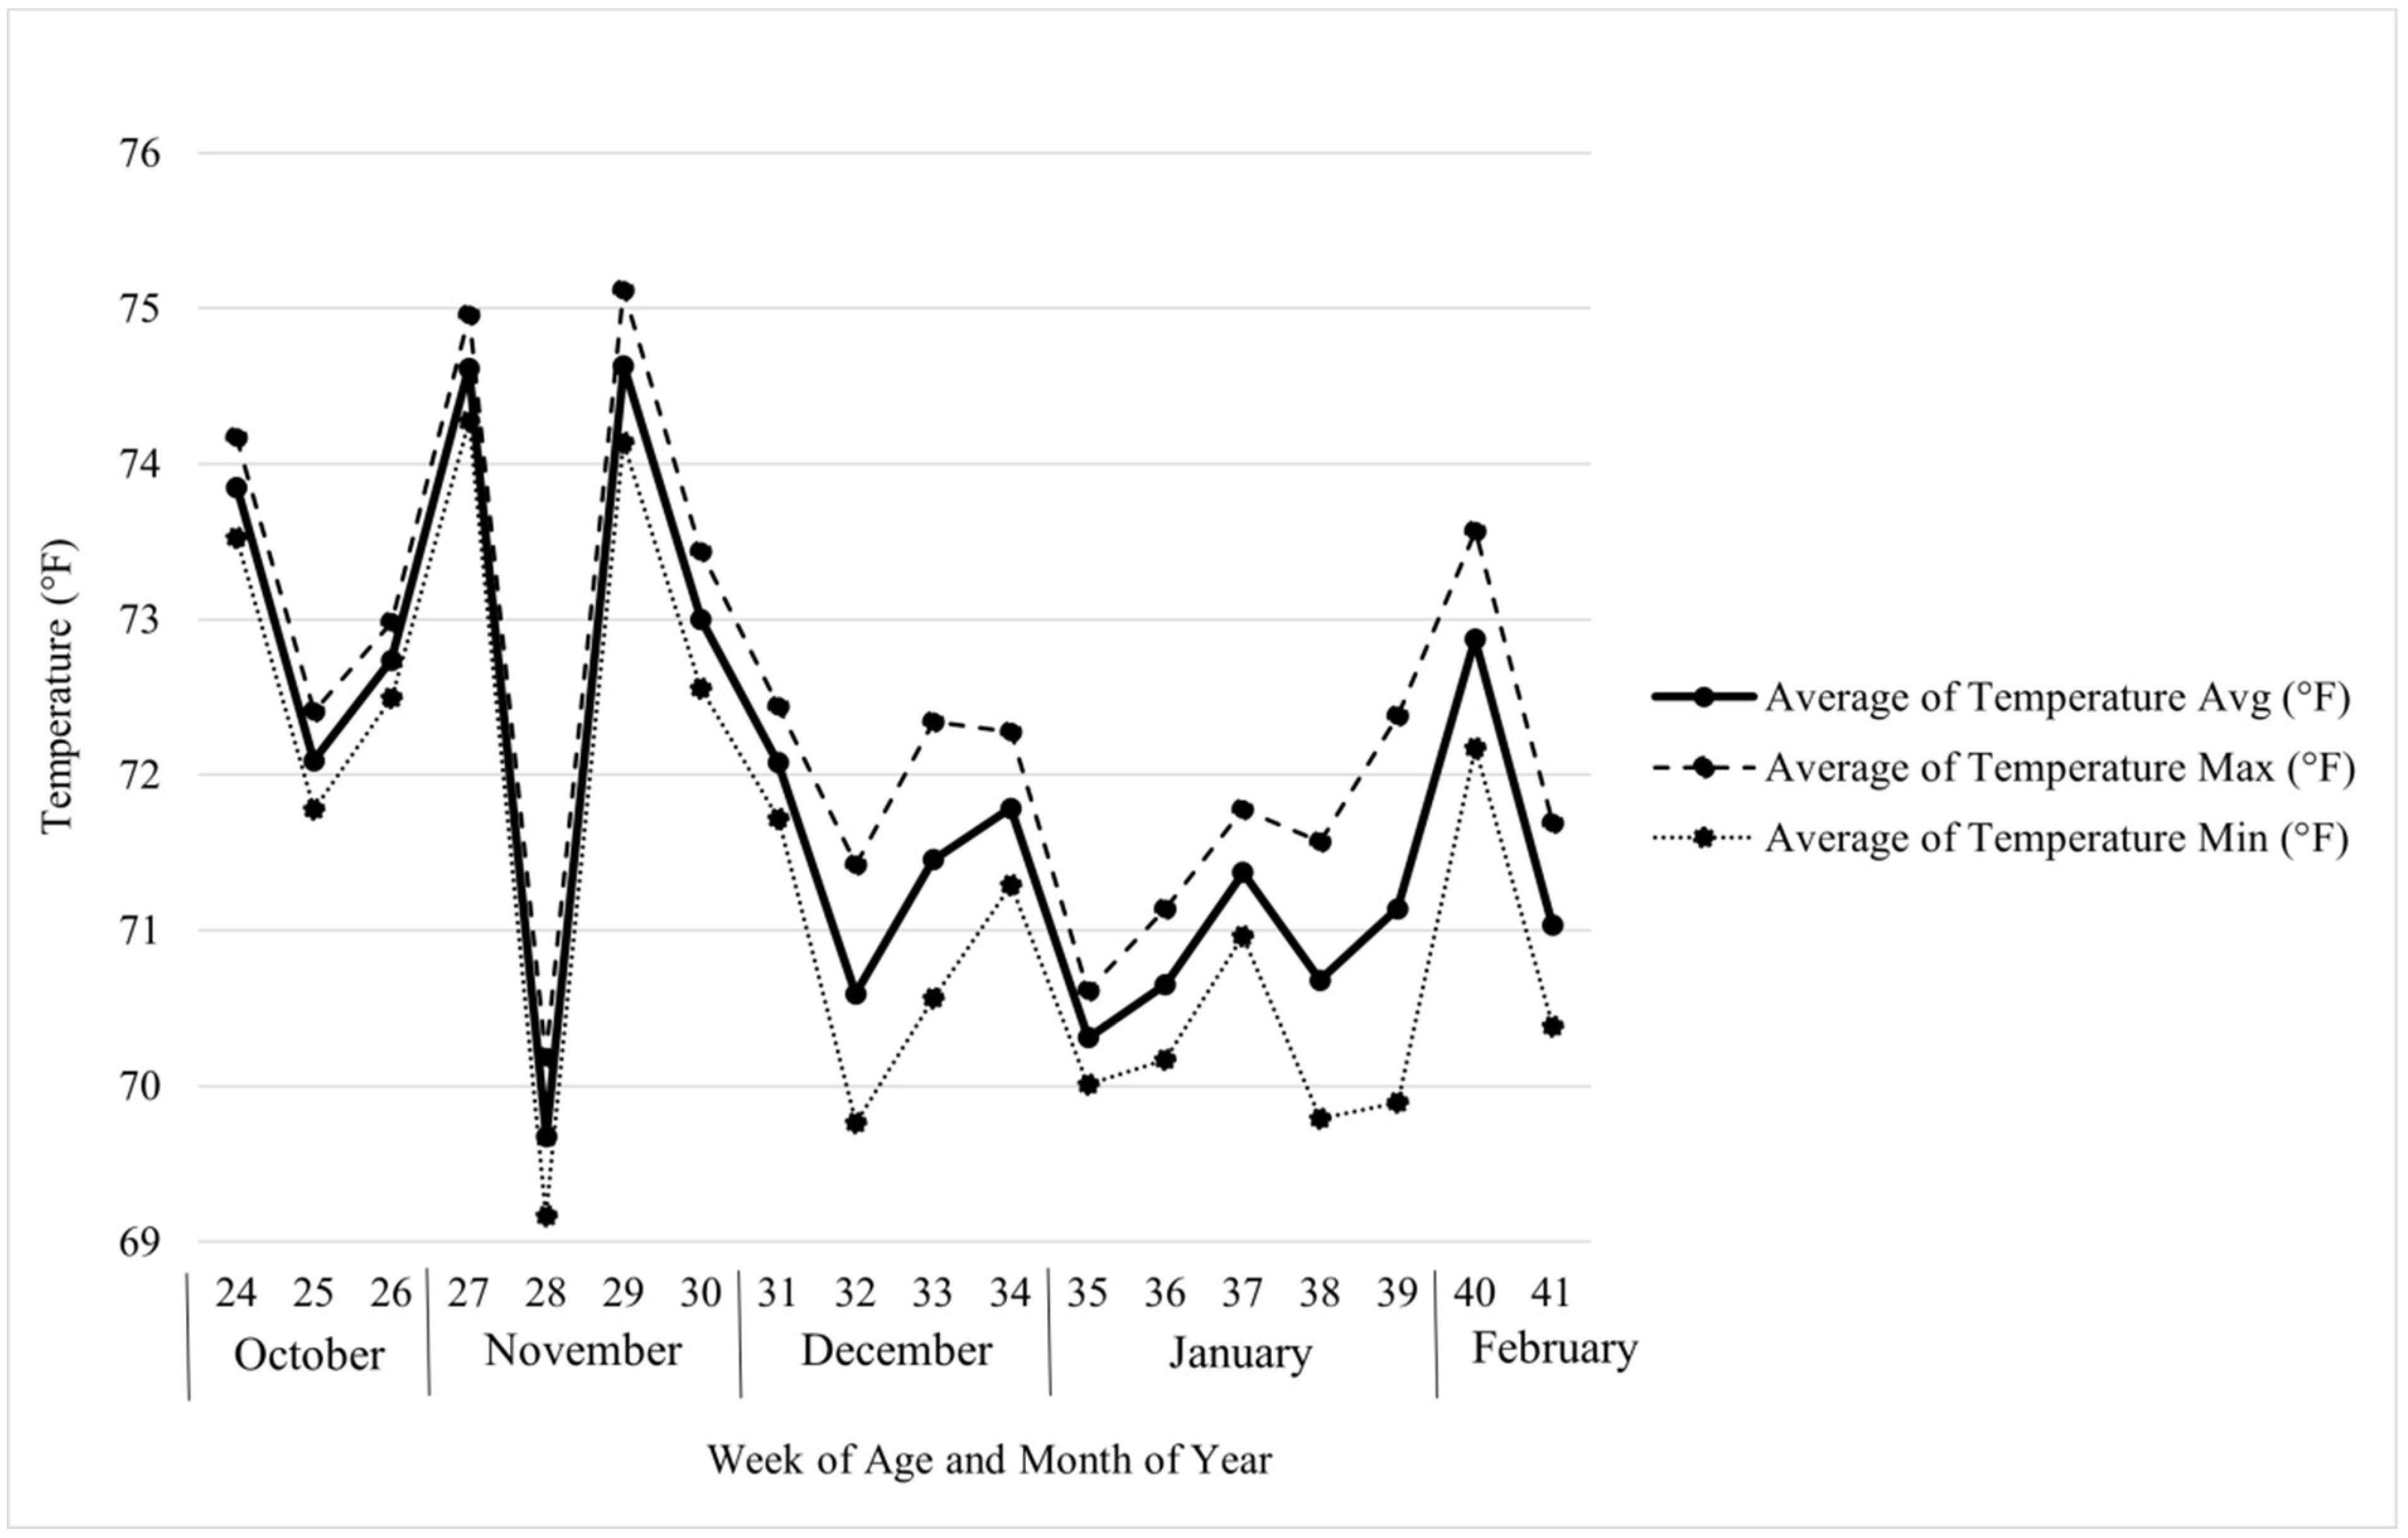

Table 1.
Ingredient percentages and calculated values for the treatment diets.
| Treatments1 | ||||
|---|---|---|---|---|
| Ingredients (%) | PC | NC | PB1 | PB2 |
| Corn | 57.88 | 66.06 | 66.01 | 65.99 |
| Soybean Meal, Dehulled solvent | 23.07 | 18.59 | 18.59 | 18.59 |
| Calcium Carbonate | 9.83 | 9.80 | 9.80 | 9.80 |
| Dried Distillers Grains and Solubles | 5.00 | 2.56 | 2.56 | 2.56 |
| Animal Fat | 2.28 | 0.73 | 0.73 | 0.73 |
| Dicalcium Phosphorus | 1.01 | 1.13 | 1.13 | 1.13 |
| Salt | 0.326 | 0.349 | 0.349 | 0.349 |
| DL-Methionine 98.5% | 0.217 | 0.223 | 0.223 | 0.223 |
| L-Lysine 78.8% | 0.168 | 0.254 | 0.254 | 0.254 |
| DSM Trace Mineral Premix2 | 0.120 | 0.120 | 0.120 | 0.120 |
| L-Threonine 98.5% | 0.048 | 0.091 | 0.091 | 0.091 |
| DSM Vitamin Premix3 | 0.038 | 0.038 | 0.038 | 0.038 |
| L-Valine | 0.010 | 0.059 | 0.059 | 0.059 |
| Precision biotic (kg/MT) | 0.00 | 0.00 | 0.500 | 0.700 |
| Calculated Values (%) [dAmino Acids:dLysine] | ||||
| Metabolizable Energy (kcal/lb.) | 1,290 | 1,290 | 1,290 | 1,290 |
| Moisture | 10.97 | 11.21 | 11.21 | 11.21 |
| Crude Protein | 17.50 | 15.50 | 15.50 | 15.50 |
| Crude Fat | 4.96 | 3.49 | 3.49 | 3.49 |
| Calcium | 4.20 | 4.20 | 4.20 | 4.20 |
| Crude Fiber | 2.15 | 2.02 | 2.02 | 2.02 |
| Available Phosphorus | 0.45 | 0.45 | 0.45 | 0.45 |
| Choline (mg/lb.) | 694.55 | 625.28 | 625.28 | 625.28 |
| Dig. Lys | 0.90 | 0.85 | 0.85 | 0.85 |
| Dig. Arg | 0.99 [110.09] | 0.85 [100.00] | 0.85 [100.00] | 0.85 [100.00] |
| Dig. TSAA | 0.72 [80.00] | 0.68 [80.00] | 0.68 [80.00] | 0.68 [80.00] |
| Dig. Val | 0.72 [80.00] | 0.68 [80.00] | 0.68 [80.00] | 0.68 [80.00] |
| Dig. Ile | 0.64 [70.66] | 0.55 [64.67] | 0.55 [64.67] | 0.55 [64.67] |
| Dig. Thr | 0.60 [66.67] | 0.57 [67.06] | 0.57 [67.06] | 0.57 [67.06] |
| Dig. Met | 0.47 [52.62] | 0.45 [53.45] | 0.45 [53.45] | 0.45 [53.45] |
| Dig. Trp | 0.17 [19.04] | 0.15 [17.07] | 0.15 [17.07] | 0.15 [17.07] |
| Analyzed Values (%) | ||||
| Moisture | 10.55 | 10.55 | 10.49 | 10.83 |
| Crude Protein | 16.50 | 14.68 | 14.88 | 14.71 |
| Crude Fat | 5.30 | 3.71 | 3.92 | 3.98 |
| Crude Fiber | 2.47 | 2.24 | 2.09 | 2.43 |
1 Treatments: PC = 17.5% crude protein (CP); NC = 15.5% CP; PB1 = 15.5% CP + 0.5 kg/MT precision biotic (PB); PB2 = 15.5% CP + 0.7 kg/MT PB. 2 Manganese - 75 mg/kg; Zinc – 65 mg/kg; Iron – 50 mg/kg; Selenium – 250 ppm; Copper – 7000 ppm; Iodine – 1000 ppm. 3 Contains 3.97x10⁷ IU/kg Vitamin A, 1.32x10⁵ IU/kg Vitamin E, and 1.20x10⁶ FYT/kg Phytase; also contains Biotin, Folic Acid, Menadione, Niacin, d-Pantothenic Acid, Riboflavin, Thiamine, Vitamin B6, Vitamin B12, and Vitamin D3.
Table 2.
Effect of varying levels of a precision biotic in a reduced crude protein diet on egg performance data.
Table 2.
Effect of varying levels of a precision biotic in a reduced crude protein diet on egg performance data.
| Trt1 | HDEP2 (%) | AEW3 (g) | UE4 (%) |
|---|---|---|---|
| PC | 98.75 a | 59.17 | 4.81 |
| NC | 97.52 b | 58.26 | 5.14 |
| PB1 | 97.92 ab | 58.64 | 5.06 |
| PB2 | 98.19 ab | 58.70 | 4.58 |
| SEM5 | 0.2289 | 0.2528 | 0.5140 |
| P-value | 0.0028 | 0.0935 | 0.8631 |
a-bMeans within a column lacking a common superscript differ (P ≤ 0.05) as per least significant difference. Abbreviations: 1Trt = treatment, PC = 17.5% CP, NC = 15.5% CP, PB1 = 15.5% CP + 0.5 kg/MT precision biotic (PB), PB2 = 15.5% CP + 0.7 kg/MT PB; 2HDEP = hen-day egg production; 3AEW = average egg weight; 4UE = unsalable eggs (shell-less or soft-shelled, extremely small, extremely large, dirty, cracked, bloody, or had very visible ridges or calcium deposits; 5SEM = standard error of means.
Table 3.
Effect of varying levels of a precision biotic in a reduced crude protein diet on feed conversion data.
Table 3.
Effect of varying levels of a precision biotic in a reduced crude protein diet on feed conversion data.
| Trt1 | gf/ge2 (g) | kg/doz3 (kg) | g/b/d4 (g) | lbs/1005 (lbs) | CBW6 (g) |
|---|---|---|---|---|---|
| PC | 2.002 | 1.402 | 115.14 | 25.38 | 564.95 |
| NC | 2.056 | 1.431 | 115.92 | 25.56 | 377.36 |
| PB1 | 2.026 | 1.415 | 115.31 | 25.42 | 479.18 |
| PB2 | 2.020 | 1.419 | 115.79 | 25.53 | 478.29 |
| SEM7 | 0.0226 | 0.0074 | 0.5520 | 0.1217 | 54.71 |
| P-value | 0.2355 | 0.0624 | 0.7042 | 0.7043 | 0.2473 |
Abbreviations: 1Trt = treatment, PC = 17.5% CP, NC = 15.5% CP, PB1 = 15.5% CP + 0.5 kg/MT precision biotic (PB), PB2 = 15.5% CP + 0.7 kg/MT PB; 2gf/ge = grams of feed consumed per gram of egg produced; 3kg/doz = kilograms of feed consumed per dozen eggs produced; 4g/b/d = grams of feed per bird per day; 5lbs/100 = pounds of feed per hundred birds per day; 6CBW = change in body weight; 7SEM = standard error of means.
Table 4.
Weekly effect of varying levels of a precision biotic in a reduced crude protein diet on grams of feed per gram of egg (gf/ge).
Table 4.
Weekly effect of varying levels of a precision biotic in a reduced crude protein diet on grams of feed per gram of egg (gf/ge).
| Week of Age | PC1 | NC2 | PB13 | PB24 |
|---|---|---|---|---|
| 24 | 1.934bcd | 1.772d | 1.886bcd | 1.861cd |
| 25 | 2.327a | 2.250ab | 2.140abc | 2.201abc |
| 26 | 2.180abc | 2.214ab | 2.220ab | 2.176abc |
| 27 | 2.218ab | 2.225ab | 2.224ab | 2.204ab |
| 28 | 2.049abcd | 2.144abc | 1.979bcd | 2.072abcd |
| 29 | 1.985bcd | 2.043abcd | 1.989bcd | 1.994bcd |
| 30 | 2.010bcd | 2.062abcd | 2.041abcd | 2.039abcd |
| 31 | 2.022abcd | 2.121abc | 2.048abcd | 2.043abcd |
| 32 | 1.949bcd | 2.009bcd | 1.955bcd | 1.946bcd |
| 33 | 1.936bcd | 2.023abcd | 1.985bcd | 1.984bcd |
| 34 | 1.952bcd | 2.055abcd | 2.007bcd | 1.948bcd |
| 35 | 1.935bcd | 2.062abcd | 1.968bcd | 2.004bcd |
| 36 | 1.986bcd | 2.056abcd | 2.047abcd | 1.982bcd |
| 37 | 1.951bcd | 2.020bcd | 2.014bcd | 2.001bcd |
| 38 | 1.951bcd | 2.029abcd | 2.043abcd | 1.975bcd |
| 39 | 1.847d | 1.960bcd | 1.946bcd | 1.939bcd |
| 40 | 1.912bcdb | 1.971bcd | 1.978bcd | 1.999bcd |
| 41 | 1.894bcdb | 2.001bcd | 1.991bcd | 1.984bcd |
a-dMeans within a column lacking a common superscript differ (P ≤ 0.05) as per least significant difference. Means are expressed in grams. 1PC = 17.5% CP; 2NC = 15.5% CP 3PB1 = 15.5 % CP +0.5 kg/MT PB; 4PB2 = 15.5% CP + 0.7 kg/MT PB.
Table 5.
Weekly effect of varying levels of a precision biotic in a reduced crude protein diet on kilograms of feed per dozen eggs (kg/doz).
Table 5.
Weekly effect of varying levels of a precision biotic in a reduced crude protein diet on kilograms of feed per dozen eggs (kg/doz).
| Week of Age | PC1 | NC2 | PB13 | PB24 |
|---|---|---|---|---|
| 24 | 1.193d | 1.140d | 1.162d | 1.174d |
| 25 | 1.516ab | 1.473abc | 1.407abc | 1.422abc |
| 26 | 1.490ab | 1.491ab | 1.515ab | 1.488ab |
| 27 | 1.558a | 1.543a | 1.549a | 1.535a |
| 28 | 1.406bc | 1.473ab | 1.371c | 1.439abc |
| 29 | 1.383bc | 1.414abc | 1.396bc | 1.408abc |
| 30 | 1.411abc | 1.449abc | 1.436abc | 1.435abc |
| 31 | 1.409abc | 1.449abc | 1.449abc | 1.442abc |
| 32 | 1.355c | 1.410abc | 1.363c | 1.398bc |
| 33 | 1.391bc | 1.409abc | 1.406bc | 1.413abc |
| 34 | 1.400bc | 1.454abc | 1.429abc | 1.400bc |
| 35 | 1.380bc | 1.464abc | 1.411abc | 1.434abc |
| 36 | 1.408abc | 1.447abc | 1.430abc | 1.414abc |
| 37 | 1.407bc | 1.451abc | 1.457abc | 1.453abc |
| 38 | 1.405bc | 1.458abc | 1.451abc | 1.444abc |
| 39 | 1.353c | 1.408abc | 1.402bc | 1.409abc |
| 40 | 1.390bc | 1.399bc | 1.406bc | 1.410abc |
| 41 | 1.384bc | 1.417abc | 1.427abc | 1.427abc |
a-dMeans within a column lacking a common superscript differ (P ≤ 0.05) as per least significant difference. Means are expressed in grams. 1PC = 17.5% CP; 2NC = 15.5% CP 3PB1 = 15.5 % CP +0.5 kg/MT PB; 4PB2 = 15.5% CP + 0.7 kg/MT PB.
Table 6.
Weekly effect of varying levels of a precision biotic in a reduced crude protein diet on grams of feed per bird per day (g/b/d).
Table 6.
Weekly effect of varying levels of a precision biotic in a reduced crude protein diet on grams of feed per bird per day (g/b/d).
| Week of Age | PC1 | NC2 | PB13 | PB24 |
|---|---|---|---|---|
| 24 | 94.53f | 90.56f | 93.16f | 93.53f |
| 25 | 125.27abc | 120.47abcde | 114.73bcde | 120.46abcde |
| 26 | 121.35abcd | 120.83abcd | 122.37abc | 121.92abc |
| 27 | 129.09a | 124.98abc | 125.35ab | 125.66ab |
| 28 | 115.36bcde | 117.10bcde | 112.57cde | 118.66abcde |
| 29 | 113.36cde | 116.45bcde | 114.42cde | 115.45bcde |
| 30 | 116.46bcde | 116.86bcde | 117.39bcde | 117.84bcde |
| 31 | 116.14bcde | 121.43abcd | 118.39abcde | 118.58abcde |
| 32 | 112.23de | 115.54bcde | 112.06de | 112.53cde |
| 33 | 114.39cde | 114.04cde | 114.66cde | 115.12bcde |
| 34 | 117.52bcde | 115.67bcde | 117.93bcde | 114.37cde |
| 35 | 112.39cde | 117.17bcde | 115.64bcde | 115.51bcde |
| 36 | 114.69cde | 116.66bcde | 117.18bcde | 116.23bcde |
| 37 | 115.97bcde | 117.95bcde | 118.25bcde | 116.81bcde |
| 38 | 116.57bcde | 118.44bcde | 118.99abcde | 118.11bcde |
| 39 | 111.11e | 114.40cde | 113.28cde | 114.25cde |
| 40 | 114.79bcde | 114.22cde | 114.30cde | 114.55cde |
| 41 | 111.25de | 113.85cde | 114.83bcde | 114.70cde |
a-dMeans within a column lacking a common superscript differ (P ≤ 0.05) as per least significant difference. Means are expressed in grams. 1PC = 17.5% CP; 2NC = 15.5% CP 3PB1 = 15.5 % CP +0.5 kg/MT PB; 4PB2 = 15.5% CP + 0.7 kg/MT PB.
Table 7.
Weekly effect of varying levels of a precision biotic in a reduced crude protein diet on pounds of feed per hundred birds per day (lbs/100).
Table 7.
Weekly effect of varying levels of a precision biotic in a reduced crude protein diet on pounds of feed per hundred birds per day (lbs/100).
| Week of Age | PC1 | NC2 | PB13 | PB24 |
|---|---|---|---|---|
| 24 | 20.84f | 19.96f | 20.54f | 20.62f |
| 25 | 27.62abc | 26.56abcde | 25.29bcde | 26.56abcde |
| 26 | 26.75abcd | 26.64abcd | 26.98abc | 26.88abc |
| 27 | 28.46a | 27.55abc | 27.63ab | 27.70ab |
| 28 | 25.43bcde | 25.82bcde | 24.82cde | 26.16abcde |
| 29 | 24.99cde | 25.67bcde | 25.22cde | 25.45bcde |
| 30 | 25.67bcde | 25.76bcde | 25.88bcde | 25.98bcde |
| 31 | 25.60bcde | 26.77abcd | 26.10abcde | 26.14abcde |
| 32 | 24.74de | 25.47bcde | 24.70de | 24.81cde |
| 33 | 25.22cde | 25.14cde | 25.28cde | 25.38bcde |
| 34 | 25.91bcde | 25.50bcde | 26.00bcde | 25.22cde |
| 35 | 24.78cde | 25.83bcde | 25.49bcde | 25.47bcde |
| 36 | 25.28cde | 25.72bcde | 25.83bcde | 25.62bcde |
| 37 | 25.57bcde | 26.00bcde | 26.07bcde | 25.75bcde |
| 38 | 25.70bcde | 26.11abcde | 26.23abcde | 26.04bcde |
| 39 | 24.50e | 25.22cde | 24.97cde | 25.19cde |
| 40 | 25.31bcde | 25.18cde | 25.20cde | 25.26cde |
| 41 | 24.53de | 25.10cde | 25.32bcde | 25.29cde |
a-dMeans within a column lacking a common superscript differ (P ≤ 0.05) as per least significant difference. Means are expressed in grams. 1PC = 17.5% CP; 2NC = 15.5% CP 3PB1 = 15.5 % CP +0.5 kg/MT PB; 4PB2 = 15.5% CP + 0.7 kg/MT PB.
Table 8.
Effect of varying levels of a precision biotic in a reduced crude protein diet on digestibility of crude protein and nitrogen.
Table 8.
Effect of varying levels of a precision biotic in a reduced crude protein diet on digestibility of crude protein and nitrogen.
| Trt1 | AID2 of CP (%) | ATTD3 of CP (%) | |
|---|---|---|---|
| PC | 58.05 | 43.15ab | |
| NC | 73.71 | 55.95a | |
| PB1 | 72.18 | 41.32b | |
| PB2 | 70.78 | 37.69b | |
| SEM4 | 7.935 | 5.833 | |
| P-value | 0.2651 | 0.0462 | |
| Pairwise Comparisons (P-Values) | |||
| PC vs | NC PB1 |
0.0813 0.1130 |
0.0549 0.7726 |
| PB2 | 0.1507 | 0.3930 | |
| NC vs | PB1 | 0.8589 | 0.0306 |
| PB2 | 0.7337 | 0.0090 | |
| PB1 vs | PB2 | 0.8707 | 0.5678 |
a-bMeans within a column lacking a common superscript differ (P ≤ 0.05) as per least significant difference. Bolded P-values are significant. Abbreviations: 1Trt = treatment, PC = 17.5% CP, NC = 15.5% CP, PB1 = 15.5% CP + 0.5 kg/MT precision biotic (PB), PB2 = 15.5% CP + 0.7 kg/MT PB; 2AID = apparent ileal digestibility; 3ATTD = apparent total tract digestibility; 4SEM = standard error of means.
Table 9.
Effect of varying levels of a precision biotic in a reduced crude protein diet on concentration of plasma blood biomarkers.
Table 9.
Effect of varying levels of a precision biotic in a reduced crude protein diet on concentration of plasma blood biomarkers.
| Trt1 | TP2 (g/dL) |
AST3 (U/L) | CK4 (U/L) | UA5 (mg/dL) |
Glu6 (mg/dL) |
P7 (mg/dL) |
Alb8 (g/dL) | Glob9 (g/dL) | K10 (mmol/L) |
Na11 (mmol/L) |
|
|---|---|---|---|---|---|---|---|---|---|---|---|
| Reference | 3.9 – 7.013 | 118 – 29813 |
107 – 178013 |
0.9 – 8.913 | 208 – 27914 |
1.6 – 7.213 | 1.5 – 3.313 | 1.6 – 4.313 | 3.9 – 6.514 | 141 – 15914 |
|
| PC | 5.414 | 185.9 | 1215 | 1.972b | 235.2 | 3.971b | 2.617 | 2.737 | 5.258 | 148.7 | |
| NC | 5.355 | 161.3 | 804 | 1.644b | 250.4 | 3.851b | 2.795 | 2.547 | 5.003 | 147.7 | |
| PB1 | 5.319 | 179.0 | 1338 | 1.779b | 236.9 | 3.420b | 2.543 | 2.782 | 5.038 | 147.0 | |
| PB2 | 5.443 | 197.5 | 1816 | 2.900a | 244.4 | 4.885a | 2.631 | 2.823 | 5.243 | 148.3 | |
| SEM12 | 0.175 | 13.24 | 287.1 | 0.311 | 6.300 | 0.338 | 0.082 | 0.129 | 0.147 | 1.505 | |
| P-value | 0.9550 | 0.2901 | 0.1262 | 0.0312 | 0.3699 | 0.0375 | 0.3416 | 0.5240 | 0.4605 | 0.8663 | |
| Pairwise Comparisons (P-Values) | |||||||||||
| PC vs | NC | 0.8127 | 0.2054 | 0.3282 | 0.4659 | 0.1058 | 0.8044 | 0.1436 | 0.3128 | 0.2345 | 0.6276 |
| PB1 | 0.7173 | 0.7290 | 0.7719 | 0.6806 | 0.8553 | 0.2855 | 0.5495 | 0.8128 | 0.3257 | 0.4588 | |
| PB2 | 0.8986 | 0.4980 | 0.1119 | 0.0318 | 0.2669 | 0.0485 | 0.8917 | 0.5985 | 0.9394 | 0.8240 | |
| NC vs | PB1 | 0.9074 | 0.4508 | 0.3045 | 0.8059 | 0.2343 | 0.4722 | 0.0964 | 0.3123 | 0.8897 | 0.8099 |
| PB2 | 0.7258 | 0.0706 | 0.0256 | 0.0117 | 0.5026 | 0.0458 | 0.1763 | 0.1512 | 0.2606 | 0.7740 | |
| PB1 vs | PB2 | 0.6382 | 0.3585 | 0.2681 | 0.0273 | 0.4356 | 0.0100 | 0.4761 | 0.8299 | 0.3572 | 0.5793 |
Means within a column lacking a common superscript differ (P ≤ 0.05) as per least significant difference. Bolded P-values are significant. Abbreviations: 1Trt = treatment, PC = 17.5% CP, NC = 15.5% CP, PB1 = 15.5% CP + 0.5 kg/MT precision biotic (PB), PB2 = 15.5% CP + 0.7 kg/MT PB; 2TP = Total protein; 3AST = Aspartate aminotransferase; 4CK = Creatine kinase; 5UA = Uric acid; 6Glu = Glucose; 7P = Phosphorus; 8Alb = Albumen; 9Glob = Globulin; 10K = Potassium; 11Na = Sodium; 12SEM = standard error of means; 13Board et al., 2018; 14Sauer et al., 2019.
Table 10.
Economic analysis for varying precision biotic levels in a reduced crude protein diet.
| Trt1 | Feed Cost ($/100/d)2 | Income ($/100/d) | Income-Feed Cost ($/100/d) |
|---|---|---|---|
| PC | 7.06a | 29.38 | 22.33 |
| NC | 6.79b | 28.81 | 22.02 |
| PB1 | 6.78b | 29.14 | 22.36 |
| PB2 | 6.82b | 29.40 | 22.58 |
| SEM3 | 0.0324 | 0.4200 | 0.4328 |
| P-value | <0.0001 | 0.7381 | 0.8384 |
a-cMeans within a column lacking a common superscript differ (P ≤ 0.05) as per least significant difference. Bolded P-values are significant. Abbreviations: 1Trt = treatment, PC = 17.5% CP, NC = 15.5% CP, PB1 = 15.5% CP + 0.5 kg/MT precision biotic (PB), PB2 = 15.5% CP + 0.7 kg/MT PB; 2$/100/d = dollars per hundred birds per day; 3SEM = pooled standard error of means.
Disclaimer/Publisher’s Note: The statements, opinions and data contained in all publications are solely those of the individual author(s) and contributor(s) and not of MDPI and/or the editor(s). MDPI and/or the editor(s) disclaim responsibility for any injury to people or property resulting from any ideas, methods, instructions or products referred to in the content. |
© 2025 by the authors. Licensee MDPI, Basel, Switzerland. This article is an open access article distributed under the terms and conditions of the Creative Commons Attribution (CC BY) license (http://creativecommons.org/licenses/by/4.0/).
Copyright: This open access article is published under a Creative Commons CC BY 4.0 license, which permit the free download, distribution, and reuse, provided that the author and preprint are cited in any reuse.


