Submitted:
22 April 2025
Posted:
24 April 2025
You are already at the latest version
Abstract
This study investigated the structural characteristics, bioavailability, and metabolism of lotus plumule flavonoid C-glycosides (LPF C-Gly), lotus plumule flavonoid O-glycosides (LPF O-Gly), and lotus leaf flavonoids (LLF). Through preparative chromatography isolation, we found that LLF primarily consisted of quercetin-O-glycosides, while LPF O-Gly was predominantly composed of quercetin and luteolin derivatives, and LPF C-Gly mainly contained apigenin and luteolin glycosides. In vitro digestion and fermentation tests demonstrated that during the digestion process, the antioxidant activity of LPF O-Gly decreased to a level comparable to that of LPF C-Gly. After 48 hours of fermentation, the retention rate of LPF C-Gly (89.19%) was significantly higher than that of LPF O-Gly (19.39%) and LLF (9.42%). Animal experiments demonstrated that LPF C-Gly exhibited significantly higher activity in urine during 12-24 h compared to LLF and LPF O-Gly,explain the stability of C-glycosides metabolism. It significantly enhanced the α-diversity of intestinal microbiota, increased the abundance of Bacteroidetes and Proteobacteria, inhibited pathogen colonization, and demonstrated significant microbiota-modulating effects. Our findings demonstrate that LPF C-Gly modulates gut health through the microbiota-metabolite axis, whereas LPF O-Gly acts as a systemic bioactive regulator during in vitro digestion and fermentation processes, highlighting their distinct roles in health modulation.
Keywords:
lotus
; flavonoid C-glycosides
; flavonoid O-glycosides
; metabolic
; bioavailability
1. Introduction
Lotus leaves and lotus plumules are highly valued in traditional Chinese medicine due to their diverse natural active compounds and extensive physiological activities. The lotus leaves are particularly rich in flavonoids, alkaloids, volatile oils, organic acids, sterols, lipids, vitamins, polysaccharides, and other bioactive constituents[1]. Nearly all natural flavonoids exist in plants as O-glycosides or C-glycosides[2], In a few cases, they also occur in the form of methylated or acylated derivatives[3]. The flavonoids in lotus leaves primarily consist of monosaccharides or glycosides of quercetin, isorhamnetin, kaempferol, and myricetin, with sugar chains mainly composed of glucose, xylose, rhamnose, and galactose[4,5]. In contrast, the flavonoids in lotus plumules include both O-glycosides and C-glycosides, with C-glycosides being the predominant component[6].
Reactive Oxygen Species(ROS) are crucial participants in cell proliferation, differentiation, migration, apoptosis, and necrosis[7]. Excessive formation of ROS can lead to the disruption of redox homeostasis, resulting in increased oxidative stress. Elevated oxidative stress can have severe impacts on DNA damage (to proteins, nucleic acids, and lipids), thereby negatively affecting health[8,9]. Antioxidants scavenging free radicals is a crucial defensive measure against free radical damage. Therefore, seeking effective antioxidants is essential for delaying aging and preventing various chronic diseases.Ye et al.[10] categorized the antioxidant system into two major classes based on their mechanisms of action: the first class consists of primary antioxidants (i.e., chain-breaking antioxidants) that directly act on free radicals, neutralizing them through electron transfer or hydrogen atom donor mechanisms; the second class includes secondary antioxidants that function indirectly, such as metal chelators and oxygen scavengers, which inhibit the activity of pro-oxidants to block the oxidative chain reaction.
Among various bioactive substances, flavonoid glycosides have garnered significant attention due to their remarkable antioxidant activity, a property that enables them to play crucial roles in multiple physiological processes. It can enhancing neuroprotection and mitochondrial function[11] mproving intestinal barrier function[12], reducing the risk of colitis[13], regulating renal function[14], anti-asthma, anti-depression[15], and alleviating neonatal pain[16]. Current extraction methods for flavonoid glycosides include response surface methodology-optimized ultrasonic-assisted extraction[17,18], ultra-high pressure extraction (UHPE[19], water-based ultrasonic-assisted extraction (UAE)[20], and enzyme-assisted supercritical fluid extraction (EA-SFE)[21]. However, few studies focus on the comparative studies of the bioactivities between flavonoid C-glycosides and O-glycosides in plant materials.
The bioavailability of flavonoids is a critical factor in evaluating their potential health benefits. In vivo digestion within the gastrointestinal tract is considered the most effective approach for assessing the benefits of food intake and its bioavailability[22]. Flavonoids undergo multi-stage metabolism in the body. Studies have shown that the activity of flavonoids is significantly reduced or even eliminated after glucuronidation during the phase II metabolism post-absorption, affecting their availability[23]. The in vitro simulated digestion method, which accurately replicates the physiological conditions of the human mouth, stomach, and small intestine to mimic the digestion process, has been widely adopted. This approach is highly advantageous for investigating the bioavailability of flavonoids embedded in food matrices, these experiments offer valuable insights into the dynamic transformations of compounds, encompassing the release of bioactive constituents from food matrices, their interactions with co-existing compounds, and bioavailability[24,25,26]. For instance, Qin et al. [27]utilized an in vitro digestion model to investigate the effects and mechanisms of pectin on the inhibition of starch digestion by a flavanol mixture. Similarly, Li et al.[28] demonstrated through in vitro simulated digestion experiments that the incorporation of pectin markedly enhanced the bioavailability of flavonoid glycosides in bamboo leaves. Following digestion and absorption in the stomach and small intestine, unabsorbed compounds transit to the colon, where they are further metabolized through fermentation mediated by colonic microbiota[29]. The diversity of gut microbiota directly affects the hydrolysis efficiency of flavonoid glycosides, leading to significant variations in absorption efficiency among individuals. Therefore, in vitro fermentation experiments are employed to simulate the intestinal environment and study the fermentation characteristics of flavonoids. These methods serve as essential tools for predicting the bioavailability of flavonoids and significantly enhance our understanding of their stability in food matrices.
This study first systematically identified the composition of flavonoids in lotus leaves and lotus plumules based on HPLC-QTOF-MS/MS combined with reference standards. On this basis, two characteristic components, LPF C-Gly and LPF O-Gly, were successfully isolated from lotus plumules by preparative liquid chromatography. Furthermore, the differences in the bioavailability of flavonoids with different structures were comparatively analyzed through in vitro simulated digestion and fermentation experiments. Meanwhile, based on an acute experimental model in rats, it revealed the advantages of LLF and LPF over monomeric flavonoid glycosides in regulating the gut microbiota and their metabolic characteristics in vivo. The research findings provide critical scientific evidence for the development and application of active components in the lotus leaves and lotus plumules, offering significant reference value for guiding the research and development of its functional foods or pharmaceuticals.
2. Materials and Methods
2.1. Plant Material
Lotus leaves (Jiangxi Guangchang) and lotus plumules (Jiangxi Guangchang) were freeze-dried, crushed by a universal pulverizer, passed through a 60-mesh sieve, and placed at 4 ℃ for later use.
2.2. Chemicals and Instruments
Luteolin (purity≥98%), Hyperoside (purity≥98%), Orientin (purity≥98%), Isoquercitrin (purity≥98%), and Schaftoside (purity≥98%) were purchased from Beijing Solarbio Biotechnology Co., Ltd. (Beijing, China), Ltd. Rutin (purity≥98%) and Quercetin (purity≥97%) were purchased from Aladdin Reagent Co., Ltd. (Shanghai, China). Quercetin 3-O-glucuronide (purity≥98%) was purchased from Shanghai yuanye Bio-Technology Co., Ltd (Shanghai, China). DPPH, ABTS, TPTZ, AAPH, Trolox, α-amylase (500U/g), pepsin (≥2500U/mg), trypsin (≥3000Umg), formic acid (HPLC gradient) were purchased from Aladdin Reagent Co., Ltd. (Shanghai, China). In addition, bile salts were obtained from Beijing Solarbio Biotechnology Co., Ltd. (Beijing, China). Ultrapure water was purchased from Watsons (Hong Kong, China). Acetonitrile (HPLC gradient) is provided by Thermo Fisher Scientific in Waltham, Massachusetts, USA. T-AOC kits were purchased from Nanjing Jiancheng Bioengineering Institute (Nanjing, China) and Beyotime Biotechnology (Shanghai, China). All other chemicals used for analysis were analytically pure and purchased from Xilong Science.
2.3. Separation of Flavonoids O-Glycosides and C-Glycosides
The flavonoids O-glycosides and C-glycosides were separated using preparative liquid chromatography. The parameters for the liquid chromatography were as follows: chromatographic column: Sepax GP-C18, specifications: 21.2 × 250 mm, 5 μm; mobile phase: acetonitrile (A) and water (B); column temperature: 30 °C; flow rate: 10 ml/min; and detection wavelengths: 254 nm to 360 nm. The gradient elution conditions were set as follows: from 0 to 12 min, 10% to 20% A; from 12 to 18 min, 20% A; from 18 to 25 min, 20% A to 30% A; and from 25 to 40 min, 30% to 60% A. According to the results of compound identification, flavonoid C-glycosides was dominant in the first 25 minutes, while flavonoid O-glycosides was dominant in the latter half of the peak. Consequently, flavonoid O-glycosides and flavonoid C-glycosides can be separated simultaneously. The flavonoids from lotus leaves are primarily O-glycosides, and their peak can be collected. Both O-glycosides and C-glycosides flavonoids were obtained through freeze-drying.
2.4. HPLC-QTOF-MS/ MS Analysis
An Agilent high-performance liquid chromatography (HPLC) column was utilized for the analysis. The chromatographic column type was a ZORBAX Eclipse Plus C18 column (4.6 × 100 mm, 3.5 μm). The mobile phase comprised water with formic acid (A, 1000:1, v/v) and acetonitrile (B). The gradient elution conditions were as follows: from 0 to 12 minutes, 10% B to 20% B; from 12 to 18 minutes, maintained at 20% B; from 18 to 25 minutes, 20% B to 30% B; and from 25 to 40 minutes, 30% B to 60% B. The flow rate was set at 300 μL/min, with a column temperature of 30 °C and an injection volume of 5 μL. A diode array detector (DAD) was employed, with detection wavelengths at 254, 320, and 360 nm. The components separated by liquid chromatography were identified using quadrupole time-of-flight tandem mass spectrometry (Q-TOF/MS). The mass spectrometry conditions included a capillary voltage of +4.0 kV, a drying gas temperature of 350 °C, a drying gas flow rate of 10.0 L/min, a jet flow pressure of 40 psi, and collision energies of 20 eV and 40 eV, with a collision voltage of 135 V. The ESI ion source scanned in the range of m/z 100 to 1200 in negative ion mode.
2.5. In Vitro Simulated Digestion and Fermentation
2.5.1. In Vitro Simulated Digestion
Referring to the standardized in vitro digestion methods proposed by Minekus[26], Brodkorb[30], and Mulet-TCabero[31], the simulated digestive fluids—namely, simulated salivary fluid (SSF), simulated gastric fluid (SGF), and simulated intestinal fluid (SIF)—were prepared according to the components and proportions listed in Table 1.
In the oral digestion stage, the sample was prepared by dissolving it in 70% ethanol to achieve a concentration of 1 mg/mL. To this solution, 1 mL was combined with 0.7 mL of SSF, 0.25 mL of α-amylase (with an enzyme activity of 590 U/mL), 5 μL of CaCl2 (at a concentration of 0.3 M), and 45 μL of distilled water. After thorough mixing using a vortex mixer, the solution was placed in a water bath shaker at 37°C and 120 r/min, where it reacted in the dark for 2 minutes to collect the oral digestive juice. In the gastric digestion stage, 1.5 mL of SGF and 0.32 mL of pepsin (with an enzyme activity of 25,000 U/mL) were added to the oral digestion system, resulting in a final enzyme activity of 2000 U/mL. Additionally, 1 μL of CaCl2 (0.3 M), 40 μL of 1 M HCl, and 139 μL of distilled water were incorporated. The mixture was thoroughly vortexed and then incubated in a water bath shaker at 37°C and 120 r/min for 2 hours to collect the gastric digestive juice. In the intestinal digestion stage, 2.2 mL of SIF, 1 mL of porcine trypsin (800 U/mL), 0.5 mL of bile salt (160 mM), 8 μL of CaCl2 (0.3 M), 30 μL of 1 N NaOH, and 0.262 mL of distilled water were added to the previously prepared oral and gastric digestion system. After complete mixing with a vortex mixer, the mixture was incubated in a water bath shaker at 37 °C and 120 r/min for 2 hours in the dark to collect the intestinal digestive juice.
2.5.2. In Vitro Simulated Fermentation
The 4.83 g MRS broth medium was dissolved in 100 mL of distilled water, sterilized at 120°C for 20 minutes, and subsequently cooled to prepare the MRS broth medium. Six healthy adults were selected as subjects; they had not received any antibiotic injections within the six months prior to sampling and did not have any intestinal diseases. Fresh fecal samples were collected from these individuals and mixed. The samples were then diluted with a 10% (v/v) PBS buffer in an anaerobic environment and filtered through double-layer sterile gauze to obtain a 10% (w/v) fecal bacterial suspension. Following in vitro simulated digestion, the samples were transferred into centrifuge tubes. Each tube contained 0.9 mL of growth medium, 0.9 mL of fecal bacterial suspension, and 0.2 mL of PBS buffer, resulting in a total fermentation volume of 2 mL per sample. The blank control group was substituted with PBS, while all other conditions mirrored those of the sample group. The centrifuge tubes were placed in an anaerobic incubator and cultured at 37°C, with sampling occurring at 0 h, 6 h, 12 h, 24 h, and 48 h. The fermentation broth was collected and stored at -20°C to halt the reaction. The resulting samples were freeze-concentrated, dried, and stored at -80°C for subsequent analysis.
2.5.3. Ethics Statement
Informed consent was obtained for experimentation with human fecal samples.
2.6. Determination of Antioxidant Activity
2.6.1. Determination of Antioxidant Activity by DPPH Method
A specific amount of DPPH powder was weighed and mixed with anhydrous methanol to prepare a 0.26 mM DPPH solution, which was then ultrasonically solubilized for 10 minutes. Once the powder was completely dissolved, the solution was allowed to stabilize in the dark for 30 minutes. Subsequently, 20 μL of either the Trolox standard or the sample solution was added to 96-well plates, followed by the addition of 100 μL of the DPPH solution. After a 30-minute reaction period in the dark, the absorbance at 517 nm was measured using a microplate reader.
In this context, A0 represents the absorbance value of the sample solvent combined with the DPPH solution, A1 denotes the absorbance value of the sample solution mixed with the DPPH solution, and A2 indicates the absorbance value of the sample solution combined with the sample solvent. The results were expressed as millimoles of Trolox equivalent per gram of sample (mM TE/g).
2.6.2. Determination of Antioxidant Activity by ABTS Method
The ABTS radical scavenging activity was slightly modified concerning the method described by Zeng et al. [32]. A 7.4 mmol/L ABTS stock solution and a 140 mmol/L K2S2O8 stock solution were prepared using distilled water. To generate the ABTS + working solution, 5 mL of ABTS was mixed with 88 μL of K2S2O8 and allowed to stand in the dark for 12-16 hours. Before use, the ABTS·+ working solution was diluted 40-50 times with 80% ethanol to achieve an absorbance value of approximately 0.7 at 734 nm, resulting in the preparation of the ABTS·+ diluent. Subsequently, 20 μL of the sample or Trolox standard solution was added to 96-well plates, followed by the addition of 200 μL of the ABTS + diluent. After a 6-minute reaction period in the dark, the absorbance was measured at 734 nm using a microplate reader.
In this context, A0 represents the absorbance value of the sample solvent combined with the DPPH solution, A1 denotes the absorbance value of the sample solution mixed with the DPPH solution, and A2 indicates the absorbance value of the sample solution combined with the sample solvent. The results were expressed as millimoles of Trolox equivalent per gram of sample (mM TE/g).
2.6.3. Determination of Antioxidant Activity by FRAP Method
FRAP assay was modified according to the method described by Ma et al. [33]. Specifically, 0.31 g of sodium acetate trihydrate was weighed, and 1.6 mL of acetic acid was added. The solution was then diluted to a final volume of 100 mL with ultrapure water to create a 300 mM acetate buffer, referred to as FRAP working solution 1. Additionally, 0.312 g of TPTZ was dissolved in a 40 mmol/L hydrochloric acid solution and diluted to 100 mL to prepare a 10 mM TPTZ solution, designated as FRAP working solution 2. Furthermore, 0.54 g of FeCl3·6H2O was weighed and diluted to 100 mL with distilled water to yield a 20 mM FeCl3·6H2O solution, termed FRAP working solution 3. The FRAP solution was prepared by mixing FRAP working solutions 1, 2, and 3 in a volume ratio of 10:1:1 (v/v). Subsequently, 10 μL of the sample or Trolox standard solution was added to 96-well plates, followed by the addition of 300 μL of the FRAP solution. After a 4-minute reaction period in the dark, the absorbance at 593 nm was recorded using a microplate reader. The results were expressed as mM Trolox equivalent per gram of sample (mM TE/g).
2.6.4. Determination of Antioxidant Activity by ORAC Method
Oxygen radical absorption capacity (ORAC) was slightly modified according to the method described by Jakubec et al. [29]. A specific amount of fluorescein sodium was weighed, and a 8.68×10⁻⁵ mM fluorescein (FL) solution was prepared using phosphate-buffered saline (PBS). Subsequently, 207 mg of 2,2'-azobis(2-amidinopropane) dihydrochloride (AAPH) was weighed and diluted to 5 mL with PBS to create a 153 mM AAPH solution. In a black 96-well plate, 25 µL of the sample or Trolox standard solution was added, followed by 150 µL of the FL solution. After incubating at 37°C for 30 minutes, 25 µL of the AAPH solution was rapidly introduced to initiate the reaction. The fluorescence was measured using a microplate reader at 37°C, with an excitation wavelength of 485 nm and an emission wavelength of 538 nm. Fluorescence readings were taken once per minute over a total duration of 120 minutes, with PBS serving as the blank control. The final ORAC value was calculated by determining the difference between the net area under the curve (AUC) for different concentrations of Trolox and the AUC of the blank. The corresponding net AUC for the sample was obtained by subtracting the blank AUC. The ORAC value was expressed as mM Trolox equivalent per gram of sample (mM TE/g).
2.7. Changes in the Stability of LPF C-Gly and LPF O-Gly
High-performance liquid chromatography (HPLC) was employed to analyze the content and structural changes of flavonoid O-glycosides and C-glycosides following digestion and fermentation. An Agilent high-performance liquid chromatography system equipped with a ZORBAX Eclipse Plus C18 column (4.6 mm × 250 mm, 5 µm) was utilized. The mobile phase consisted of water-formic acid (A, 1000:1, v/v) and acetonitrile (B). The gradient elution conditions were as follows: from 0 to 12 minutes, the proportion of B was increased from 10% to 20%; from 12 to 18 minutes, B remained at 20%; from 18 to 25 minutes, B was increased from 20% to 30%; and from 25 to 40 minutes, the flow rate transitioned from 30% to 60% B at a rate of 600 µL/min. The column temperature was maintained at 30 °C, the injection volume was set at 10 µL, and the detection wavelength was 254 nm.
2.8. Animal Experiment
2.8.1. Experimental Animal Grouping
The study utilized male Sprague-Dawley rats (License No.: SCXK (Xiang) 2019-0004), weighing approximately 200-220 g, purchased from Hunan SJA Laboratory Animal Co., Ltd. (Hunan, China). The rats were housed under standard laboratory conditions with temperature maintained at 22-26°C and relative humidity at 40-60%. During the acclimation period, the animals had free access to food and water. All experimental procedures and tests were strictly conducted in accordance with the ethical guidelines of the Jiangxi Provincial Experimental Animal Management Committee (SYXK (Gan) 2017-0004) and relevant national regulations on the use and care of laboratory animals, with approval obtained from the Laboratory Animal Ethics Committee of Nanchang University (Approval No.: 0064257). After a 3-day acclimation period, the rats were fasted for 12 hours prior to administration, with an intragastric dose of 250 mg/kg body weight. Eighty-four rats were randomly divided into 7 groups (n=12 per group): Blank group, Quercetin group, Isoquercitrin group, Orientin group, LLF group, LPFC-Gly group, and LPFO-Gly group. The animal experimental groups are illustrated in Figure 1. Among these, plasma samples were collected from 6 rats in each group, while the remaining 6 rats (individually housed in separate cages) were used for urine collection.
2.8.2. Preparation of Plasma and Urine Samples
Plasma: Blood samples were collected from the orbital vein at 1, 3, and 6 hours following intragastric administration, with 0.5 ml taken at each time point. The samples were placed in heparinized test tubes, centrifuged at 4 °C and 4,500 g for 10 minutes, and the plasma was then extracted. To the plasma, 10 μL of formic acid was added to 100 μL of plasma. After vortexing for 1 minute, 300 μL of acetonitrile was added, followed by vortexing for an additional 3 minutes to precipitate the proteins. The supernatant was centrifuged, and the precipitate was extracted twice more. The supernatants were consolidated and dried under nitrogen. Subsequently, 200 μL of chromatographic grade methanol was added to redissolve the residue. The supernatant was filtered through a 0.22 μm filter membrane, and the sample was analyzed.
Urine: Urine was collected in metabolic cages at intervals of 0-6 hours, 6-12 hours, and 12-24 hours after intragastric administration. A 1 ml aliquot of urine was taken, followed by the addition of 50 μL of formic acid and vortexing for 1 minute. Next, 8 ml of ethyl acetate was added, and the mixture was vortexed for 3 minutes. The solution was then centrifuged at low temperature, and the supernatant was collected. This extraction process was repeated three times, and the supernatants were merged and dried under nitrogen. Finally, 200 μL of chromatographic grade methanol was added to redissolve the residue, which was then passed through a 0.22 μm filter membrane for analysis.
2.8.3. Collection of Cecal Contents
Rats were gavaged with 50 mg / kg BW for 3 days. After 3 days, the rats were sacrificed and the cecal contents were collected for the determination of intestinal flora.
2.8.4. Metabolites Identification
The metabolites in rats were identified using a Thermo quadrupole-electrostatic field orbitrap high-resolution mass spectrometer (Focus). The chromatographic column employed was a Thermo Accucore AQ (150 mm × 2.1 mm, 2.6 μm), with the mobile phase consisting of water-formic acid (A, 1000:1, v/v) and acetonitrile (B). The gradient elution conditions were as follows: from 0 to 5 minutes, 10% B to 30% B; from 5 to 10 minutes, 30% B to 50% B; from 10 to 20 minutes, 50% B to 70% B; from 20 to 30 minutes, 70% B to 100% B; from 30 to 35 minutes, 100% B maintained; and from 35 to 37 minutes, 100% B to 10% B. The flow rate was set at 300 μL/min, the column temperature was maintained at 30 °C, and the injection volume was 5 μL. For mass spectrometry, the collision energies were set at 20 eV and 40 eV, with an ESI ion source scanning range of m/z 100 to 1200, operating in both positive and negative ion modes. Metabolite analysis was conducted using Compound Discoverer 3.1 software.
2.9. Statistical Analysis
One-way analysis of variance (ANOVA) and Duncan multiple tests of SPSS 26.0 statistical analysis software were used for data statistics (p < 0.05). All measurements were repeated 3 times, and the results were expressed as mean ± standard deviation.
3. Results and Discussion
3.1. Identification
As shown in Figure 2 and Table 2, the flavonoids in lotus leaves were identified as predominantly O-glycosylated derivatives of quercetin, kaempferol, and isorhamnetin[34,35]. Notably, quercetin derivatives accounted for over 90% of the total flavonoid content, with quercetin 3-O-glucuronide being the most abundant flavonoid in lotus leaves[36].
Based on standard compound matching and references from Li et al. [34,37,38], the flavonoids present in lotus plumules were identified. The identification results are presented in Figure 3 and Table 3. It is evident that the flavonoids in lotus plumules are primarily glycosylated derivatives of luteolin, apigenin, and quercetin, and they differ significantly from those found in lotus leaves. Notably, the flavonoids in lotus plumules are rich in C-glycosides, exhibiting a greater variety and slightly higher content compared to O-glycosides. This finding is consistent with results reported in the literature[39].
3.2. Quantitative Results of LFF, LPF Gly
Isoquercitrin, rutin, and schaftoside were employed to quantitatively analyze the isolated flavonoids in LFF, LPF C-Gly, and LPF O-Gly, respectively. The results are summarized in Table 4. The predominant LLF was identified as quercetin 3-O-glucuronide. In LPF O-Gly, rutin exhibited the highest concentration, while schaftoside and isoorientin were the most abundant components in LPF C-Gly.
3.3. Separation of LPF C-Gly and LPF O-Gly
As shown in Figure 4. The chromatographic peaks of flavonoid O-glycosides and flavonoid C-glycosides displayed distinct and regular patterns. Due to differences in compound polarity and other influencing factors, LPF C-Gly was concentrated in the front peak, while LPF O-Gly was concentrated in the back peak. Based on this principle, the flavonoid O-glycosides and flavonoid C-glycosides in lotus plumules were successfully isolated simultaneously.
3.4. Antioxidant Activity In Vitro Digestion and Fermentation
3.4.1. Antioxidant Activity In Vitro Digestion
The changes in ABTS, FRAP, and DPPH activities of LFF, LPF C-Gly, and LPF O-Gly during in vitro digestion are presented in Figure 5b, Figure 5c and Figure 5d, respectively. LFF demonstrated significantly higher antioxidant activity compared to both LPF C-Gly and LPF O-Gly, both before and after digestion (p < 0.05). Despite exhibiting marginally higher relative content compared to LPF O-Gly, LPF C-Gly demonstrated significantly reduced antioxidant activity relative to its O-glycoside counterpart. Notably, no statistically significant differences were observed between LPF C-Gly and LPF O-Gly activities during gastric and intestinal digestion phases. This phenomenon may be attributed to the predominant presence of diglycosylated C-glycosides, where multiple sugar substitutions potentially attenuated compound activity. However, the comparable activity retention between flavonoid C- and flavonoid O-glycosides during digestion could be explained by the superior stability of flavonoid C-glycosidic bonds compared to flavonoid O-glycosidic linkages. Furthermore, in the ORAC reaction (Figure 5a), the activity of flavonoids derived from lotus leaves was comparable to that of flavonoids from lotus plumules, which also corroborates the observation that the results of ORAC experiments often differ from those of DPPH and other assays.
3.4.2. Antioxidant Activity In Vitro Fermentation
The changes in DPPH, ABTS, and FRAP activities of LFF, LPF C-Gly and LPF O-Gly after fermentation are presented in Figure 6b, Figure 6c and Figure 6d, respectively. LFF, LPF C-Gly, and LPF O-Gly remained relatively stable during the 0-24 h period but decreased significantly at 48 h. Overall, the antioxidant activity of LLF was significantly higher than LPF C-Gly and LPF O-Gly, while LPF O-Gly exhibited significantly higher activity than LPF C-Gly. This trend is consistent with the activity patterns observed during the digestion process. Furthermore, the activity of LPF C-Gly was significantly lower than LPF O-Gly during the 0-24 h period but became comparable at 48 h. This may be attributed to the structural stability of flavonoid C-glycosides, allowing them to maintain higher content and thus sustain their activity until the end of fermentation. In other words, structure influences activity. The ORAC activity changes are shown in Figure 6a, displaying a gradual declining trend, which slightly differs from the previous three experiments. This discrepancy may arise because ORAC activity is not absolutely correlated with the number of hydroxyl groups or the steric hindrance of the compounds.
3.5. Stability Change of LFF、LPF C-Gly and LPF O-Gly During In Vitro Digestion and Fermentation
3.5.1. Stability Changes of LFF、LPF C-Gly and LPF O-Gly During In Vitro Digestion
Table 5 demonstrates the dynamic changes of LFF during simulated digestion. Experimental data revealed a gradient decreasing trend in total flavonoid content throughout the digestive process, with the characteristic component quercetin 3-O-glucuronide showing a consistent variation pattern with total flavonoids. Although glucuronide structures exhibited slightly lower stability compared to glucosides, all components maintained relatively high retention rates after digestion. Notably, despite all LFF being O-glycosides-type compounds, the quercetin aglycone structure remained detectable after complete gastrointestinal digestion, indicating its certain degree of digestive tolerance.
The content changes of LPF O-Gly during digestion are presented in Table 6. The trend observed was similar to that of LLF. The content gradually decreased during digestion, and the final content post-digestion remained at approximately 50%. Quercetin was detected during the gastric phase, whereas it was not detected in the intestinal phase, likely due to its lower concentration and subsequent degradation.
The changes in the content of LPF C-Gly are presented in Table 7. The content of flavonoid C-glycosides remains relatively stable during the digestion process, with a significant degradation observed only in the oral digestion stage, while the content tends to stabilize in the gastric and intestinal stages. The stability of flavonoid C-glycosides content confirms their structural stability, particularly since LPF C-Gly are predominantly diglycosides, further enhancing their stability.
3.5.2. Stability Changes of LFF、LPF C-Gly and LPF O-Gly During In Vitro Fermentation
The changes in LFF content following fermentation are presented in Table 8. Over the 48-hour period, the levels of the compounds exhibited a decreasing trend, however, a slight increase in compound activity was observed at the 24-hour mark, followed by a significant decline in content at 48 hours. This is because during the fermentation process, the O-glycosidic bonds of lotus leaf flavonoids continued to break, generating higher levels of quercetin.
Table 9 presents the changes in LPF O-Gly content during fermentation. The compound concentrations showed a gradual decline over time. From 12 to 48 hours, the LPF O-Gly content remained consistently higher relative to the levels detected in lotus leaves, demonstrating superior stability of LPF O-Gly when compared with lotus leaf O-glycosides. Nevertheless, LFF displayed significantly stronger antioxidant activity versus LPF O-Gly, since the LFF generated more quercetin compared with those in LPF O-Gly, consequently allowing LFF to sustain enhanced antioxidant capacity.
The changes in LPF C-Gly content during fermentation are presented in Table 10. Notably, the content of LPF C-Gly exhibited a minimal decrease during the fermentation stage, indicating that LPF C-Gly maintained a high degree of stability throughout the fermentation process. Specifically, the content of LPF C-Gly decreased by less than 50% after fermentation. This may be attributed to the fact that lotus plumule flavonoid C-glycosides are predominantly diglycosides, which enhances their stability, allowing them to maintain higher content after fermentation. This is also reflected in the sustained high antioxidant activity of flavonoid C-glycosides during in vitro antioxidant assays throughout the fermentation process.
3.6. Animal Experimental Results
3.6.1. Metabolic Differences Between C-Glycosides and O-Glycosides in Plasma and Urine
Comparison with reference standards was conducted to investigate the metabolic patterns of extracts and individual compounds in vivo. The changes in the total antioxidant capacity of LFF, LPF C-Gly, and LPF O-Gly in plasma and urine are illustrated in Figure 7. Comparative analysis of flavonoid O-glycosides and C-glycosides in lotus leaves and plumules revealed superior plasma activity for O-glycosides relative to C-glycosides at both 1-hour and 3-hour intervals, although the observed difference lacked statistical significance. In urine, flavonoid C-glycosides demonstrated significantly greater activity compared to flavonoid O-glycosides exclusively in the 12-24 hours timeframe. This phenomenon may be attributed to the extensive metabolism of flavonoid O-glycosides in rats, leading to a diverse range of metabolites in plasma[40], in contrast, flavonoid C-glycosides exhibit poor absorption, resulting in fewer metabolites in both plasma and urine. Consequently, flavonoid O-glycosides exhibit higher activity in plasma relative to flavonoid C-glycosides. In urine, while flavonoid O-glycosides undergo catabolism, the prototype compound orientin from flavonoid C-glycosides remains detectable. This explains why the activity of flavonoid C-glycosides in urine surpasses that of flavonoid O-glycosides[41].
The metabolites of LFF, LPF C-Gly and LPF O-Gly are presented in Table 11, Table 12 and Table 13. It is evident that the LLF and LPF O-Gly primarily undergo methylation and glucuronic acid conjugation reactions, with methylation being the most prevalent metabolic pathway. In contrast, the metabolites of LPF C-Gly are quite limited, and its parent compound can still be detected.
3.6.2. Effects of O- Flavonoids and C-Glycosides on Intestinal Flora in Rats
The Alpha diversity analysis of the effects of flavonoid O-glycosides and flavonoid C-glycosides on intestinal flora is presented in Figure 8. Intestinal health is closely linked to microbial composition, and the diversity of microbial flora can be assessed using sparse curves (Figure. 8b). As the total number of randomly selected sequences in the sample increases, the sparse curve gradually flattens, indicating that the sequencing results are sufficient to reflect the diversity of the current sample[42]. This suggests that the sequencing depth is adequate to encompass all species present in the sample. Notably, lotus plumules contained a significantly greater number of flavonoid C-glycoside operational taxonomic units (OTUs) compared with other groups. Additionally, the OTUs of flavonoids and C-glycosides orientin and LLF were also greater than those in other groups. These findings demonstrate that flavonoid C-glycosides exert a more pronounced effect on intestinal flora compared with flavonoid O-glycosides to some extent.
The diversity index of the sample is influenced by both the richness and evenness of the community[39,43]. Figure 8a illustrates the diversity index of intestinal microflora across different groups, revealing a consistent trend among indicators such as Chao1, Faith_pd, Shannon, Pielou_e, and Observed_species. Notably, the diversity indexes for the LPF C-Gly group and the LLF group were significantly higher than those of the blank group. In contrast, the indexes for the quercetin group, isoquercitrin group, orientin group, and LPF O-Gly group showed only slight increases compared to the blank group. This suggests that LPF C-Gly and LLF markedly enhance the diversity of intestinal microflora, while the other groups exert a lesser influence. This effect may be attributed to the fact that the flavonoids derived from lotus leaves and lotus plumules are a complex mixture, which appears to have a more pronounced impact on the intestinal flora than individual compounds.
Figure 9 illustrates the relative abundance of the primary microbial flora components at the phylum level. Firmicutes, Bacteroides, Proteobacteria, and Actinobacillus collectively account for over 95% of the total microbial population, representing the dominant flora in the intestine[44]. In comparison to the blank group, the composition of bacteria in the groups receiving flavonoids from lotus leaves and lotus plumules exhibited significant differences, particularly with an increase in the abundance of Bacteroides and Proteobacteria. The abundance of Bacteroides in the quercetin and isoquercitrin groups was comparable to that in the blank group; while the abundance of Proteobacteria increased significantly. These findings indicate that flavonoids can substantially influence the composition of intestinal flora in rats. LPF-C Gly modulates gut health through the microbiota-metabolite axis, serving as an effective regulator of gut microbiota. Furthermore, standard compounds demonstrate a less pronounced impact on intestinal flora compared to the extracts, presumably attributable to the extracts' rich flavonoid composition that potentiates their health benefits.
4. Conclusions
This study systematically elucidates the structural differences, bioavailability, and metabolism of flavonoid O-glycosides and flavonoid C-glycosides derived from lotus leaves and plumules. The results demonstrate that lotus leaves are predominantly enriched with quercetin O-glycosides, while lotus plumules contain both flavonoid O- and C-glycosides, with flavonoid C-glycosides exhibiting superior structural stability. Moreover, LPF C-Gly and LPF O-Gly were specifically separated based on their polarity differences. Both in vitro digestion/fermentation assays and in vivo rat experiments demonstrated that flavonoid C-glycosides, due to their resistance to enzymatic hydrolysis, remain intact through the gastrointestinal tract and retained in urine and further accumulated in the colon. Comparative studies demonstrated that LPF C-Gly significantly enhanced gut microbial diversity and promoted beneficial bacterial genera including Bacteroidetes and Proteobacteria, when compared with the single C-glycoside orientin. In contrast, flavonoid O-glycosides are rapidly hydrolyzed into bioactive aglycones (e.g., quercetin) during digestion, contributing to systemic antioxidant effects. Despite their lower intrinsic activity, LPF C-Gly modulate gut health via the microbiota-metabolite axis, establishing them as potent regulators of gut microbiota, while flavonoid O-glycosides primarily act as direct antioxidants. These findings highlight the complementary roles of flavonoid O-glycosides and flavonoid C-glycosides in health promotion and provide a scientific basis for developing functional foods or therapeutics tailored to gut health enhancement or systemic antioxidant support.
Author Contributions
Conceptualization, X.L.; methodology, M.S, L.X. and X.Z.; formal analysis and resources, X.L and X.Z.; writing—original draft preparation, M.S.; writing—review and editing, M.S, X.L.and X.Z.; All authors have read and agreed to the published version of the manuscript.
Funding
This research was funded by the National Natural Science Foundation of China (No. 32260565) and National Key Research and Development Program of China (No. 2024YFD1601200).
Institutional Review Board Statement
Not applicable.
Informed Consent Statement
Not applicable.
Data Availability Statement
The data presented in this study are available on request from the corresponding authors.
Conflicts of Interest
The authors declare no conflict of interest.
References
- Wang M, Shen Q, Hu L, et al. Physicochemical Properties, Structure and in Vitro Digestibility on Complex of Starch with Lotus (nelumbo Nucifera Gaertn.) Leaf Flavonoids[J]. Food Hydrocolloids, 2018,81:191-199. [CrossRef]
- Xiao J, Capanoglu E, Jassbi A R, et al. Advance on the Flavonoid C-glycosides and Health Benefits[J]. Crit Rev Food Sci Nutr, 2016,56 Suppl 1:S29-S45. [CrossRef]
- Lin Y, Fang J, Zhang Z, et al. Plant flavonoids bioavailability in vivo and mechanisms of benefits on chronic kidney disease: a comprehensive review[J]. Phytochemistry Reviews, 2023,22. [CrossRef]
- Liu S, Li D, Huang B, et al. Inhibition of pancreatic lipase, α-glucosidase, α-amylase, and hypolipidemic effects of the total flavonoids from Nelumbo nucifera leaves[J]. Journal of ethnopharmacology, 2013,149(1):263-269.
- Tian Y, Du H, Qing X, et al. Effects of picking time and drying methods on contents of eight flavonoids and antioxidant activity of leaves of Diospyros lotus L.[J]. Journal of Food Measurement and Characterization, 2020,14:1461-1469. [CrossRef]
- Chen G, Fan M, Wu J, et al. Antioxidant and anti-inflammatory properties of flavonoids from lotus plumule[J]. Food chemistry, 2019,277:706-712. [CrossRef]
- Jomova K, Raptova R, Alomar S Y, et al. Reactive Oxygen Species, Toxicity, Oxidative Stress, and Antioxidants: Chronic Diseases and Aging[J]. Archives of Toxicology, 2023,97:2499-2574.
- Yu Y, Cui Y, Niedernhofer L J, et al. Occurrence, Biological Consequences, and Human Health Relevance of Oxidative Stress-Induced DNA Damage.[J]. CHEMICAL RESEARCH IN TOXICOLOGY, 2016,29:2008-2039. [CrossRef]
- Salehi B, Selamoglu Z, Sevindik M, et al. Achillea spp.: A comprehensive review on its ethnobotany, phytochemistry, phytopharmacology and industrial applications[J]. CELLULAR AND MOLECULAR BIOLOGY, 2020,66:78.
- Liu L, Yang L, Zhu M, et al. Machine learning-driven predictive modeling for lipid oxidation stability in emulsions: A smart food safety strategy[J]. Trends in Food Science & Technology, 2025,159:104972. [CrossRef]
- Liu Z, Truong T, Bortolasci C, et al. The potential of baicalin to enhance neuroprotection and mitochondrial function in a human neuronal cell model[J]. BIPOLAR DISORDERS, 2024,26:114. [CrossRef]
- Park H, Yu J. Hesperidin enhances intestinal barrier function in Caco-2 cell monolayers via AMPK-mediated tight junction-related proteins[J]. FEBS OPEN BIO, 2023,13(3):532-544.
- Hu Y, Guan X, He Z, et al. Apigenin-7-O-glucoside alleviates DSS-induced colitis by improving intestinal barrier function and modulating gut microbiota[J]. JOURNAL OF FUNCTIONAL FOODS, 2023,104. [CrossRef]
- Zymone K, Benetis R, Trumbeckas D, et al. Different Effects of Quercetin Glycosides and Quercetin on Kidney Mitochondrial Function-Uncoupling, Cytochrome C Reducing and Antioxidant Activity[J]. MOLECULES, 2022,27(19).
- Jin H, Zhou Y, Ye J, et al. Icariin Improves Glucocorticoid Resistance in a Murine Model of Asthma with Depression Associated with Enhancement of GR Expression and Function[J]. PLANTA MEDICA, 2023,89(03):262-272. [CrossRef]
- Guo D, Huang H, Liu H, et al. Orientin Reduces the Effects of Repeated Procedural Neonatal Pain in Adulthood: Network Pharmacology Analysis, Molecular Docking Analysis, and Experimental Validation[J]. PAIN RESEARCH & MANAGEMENT, 2023,2023.
- Dahat Y, Ganguly S, Khan A, et al. Optimizing ultrasonication-assisted comprehensive extraction of bioactive flavonoids from Pterocarpus santalinus leaves using response surface methodology[J]. JOURNAL OF CHROMATOGRAPHY A, 2024,1738. [CrossRef]
- Zhao L, Zhang H, Jiang P, et al. Isoliquiritin counteracts cadmium-induced intestinal damage in mice through enhancing intestinal barrier function and inhibiting apoptosis[J]. FOOD AND CHEMICAL TOXICOLOGY, 2024,186. [CrossRef]
- Zhao J, Su T, Sun Q, et al. Ultrahigh pressure enhances the extraction efficiency, antioxidant potential, and hypoglycemic activity of flavonoids from Chinese sea buckthorn leaves[J]. LWT-FOOD SCIENCE AND TECHNOLOGY, 2024,207.
- Nicolescu A, Babota M, Canada E A, et al. Association of enzymatic and optimized ultrasound-assisted aqueous extraction of flavonoid glycosides from dried Hippophae rhamnoides L. (Sea Buckthorn) berries[J]. ULTRASONICS SONOCHEMISTRY, 2024,108. [CrossRef]
- Miksovsky P, Kornpointner C, Parandeh Z, et al. Enzyme-Assisted Supercritical Fluid Extraction of Flavonoids from Apple Pomace (Malusxdomestica)[J]. CHEMSUSCHEM, 2024,17(7).
- Martínez-Las Heras R, Pinazo A, Heredia A, et al. Evaluation studies of persimmon plant (Diospyros kaki) for physiological benefits and bioaccessibility of antioxidants by in vitro simulated gastrointestinal digestion[J]. Food chemistry, 2017,214:478-485. [CrossRef]
- Zyzynska-Granica B, Gierlikowska B, Parzonko A, et al. The Bioactivity of Flavonoid Glucuronides and Free Aglycones in the Context of Their Absorption, II Phase Metabolism and Deconjugation at the Inflammation Site.[J]. Food and Chemical Toxicology, 2019,135:110929. [CrossRef]
- Bohn T, Carriere F, Day L, et al. Correlation between in vitro and in vivo data on food digestion. What can we predict with static in vitro digestion models?[J]. Critical reviews in food science and nutrition, 2018,58(13):2239-2261. [CrossRef]
- Lucas-González R, Viuda-Martos M, Álvarez J A P, et al. Changes in bioaccessibility, polyphenol profile and antioxidant potential of flours obtained from persimmon fruit (Diospyros kaki) co-products during in vitro gastrointestinal digestion[J]. Food chemistry, 2018,256:252-258. [CrossRef]
- Minekus M, Alminger M, Alvito P, et al. A standardised static in vitro digestion method suitable for food–an international consensus[J]. Food & function, 2014,5(6):1113-1124.
- Qin Y, Zhang Y, Chen X, et al. Synergistic effect of pectin and the flavanols mixture on in vitro starch digestion and the corresponding mechanism[J]. FOOD HYDROCOLLOIDS, 2025,158. [CrossRef]
- LI Z, CAI H, LIANG Y, et al. Effect of Xanthan Gum on Bioaccessibility of Four Bamboo Leaf Flavonoids during Simulated in Vitro Gastrointestinal Digestion[J]. Food Science, 2019,40:58-64.
- Thilakarathna S H, Rupasinghe H V. Flavonoid bioavailability and attempts for bioavailability enhancement[J]. Nutrients, 2013,5(9):3367-3387.
- Brodkorb A, Egger L, Alminger M, et al. INFOGEST static in vitro simulation of gastrointestinal food digestion[J]. Nat Protoc, 2019,14(4):991-1014. [CrossRef]
- Mulet-Cabero A, Egger L, Portmann R, et al. A standardised semi-dynamic in vitro digestion method suitable for food–an international consensus[J]. Food & function, 2020,11(2):1702-1720.
- Zeng Y, Song J, Zhang M, et al. Comparison of in vitro and in vivo antioxidant activities of six flavonoids with similar structures[J]. Antioxidants, 2020,9(8):732. [CrossRef]
- Ma Y, Yang Y, Gao J, et al. Phenolics and antioxidant activity of bamboo leaves soup as affected by in vitro digestion[J]. Food and Chemical Toxicology, 2020,135:110941. [CrossRef]
- Li S, Wu J, Chen L, et al. Biogenesis of C-glycosyl flavones and profiling of flavonoid glycosides in lotus (Nelumbo nucifera)[J]. PLoS One, 2014,9(10):e108860. [CrossRef]
- Zhu M Z, Wu W, Jiao L L, et al. Analysis of Flavonoids in Lotus (Nelumbo nucifera) Leaves and Their Antioxidant Activity Using Macroporous Resin Chromatography Coupled with LC-MS/MS and Antioxidant Biochemical Assays[J]. Molecules, 2015,20(6):10553-10565.
- Liu B, Li J, Yi R, et al. Preventive effect of alkaloids from Lotus plumule on acute liver injury in mice[J]. Foods, 2019,8(1):36. [CrossRef]
- Liu T, Zhu M, Zhang C, et al. Quantitative analysis and comparison of flavonoids in lotus plumules of four representative lotus cultivars[J]. Journal of Spectroscopy, 2017,2017(1):7124354. [CrossRef]
- Zheng J, Tian W, Yang C, et al. Identification of flavonoids in Plumula nelumbinis and evaluation of their antioxidant properties from different habitats[J]. Industrial Crops and Products, 2019,127:36-45. [CrossRef]
- Chen S, Zhao H, Cheng N, et al. Rape bee pollen alleviates dextran sulfate sodium (DSS)-induced colitis by neutralizing IL-1β and regulating the gut microbiota in mice[J]. Food research international, 2019,122:241-251. [CrossRef]
- Valentová K, Vrba J, Bancířová M, et al. Isoquercitrin: Pharmacology, toxicology, and metabolism[J]. Food and Chemical Toxicology, 2014,68:267-282.
- Xie L, Deng Z, Zhang J, et al. Comparison of Flavonoid O-Glycoside, C-Glycoside and Their Aglycones on Antioxidant Capacity and Metabolism during In Vitro Digestion and In Vivo: Foods[Z]. 2022: 11.
- Xu G, Zhong X, Wang Y, et al. An approach to detecting species diversity of microfaunas in colonization surveys for marine bioassessment based on rarefaction curves[J]. Marine pollution bulletin, 2014,88(1-2):268-274. [CrossRef]
- Sengupta A, Dick W A. Bacterial community diversity in soil under two tillage practices as determined by pyrosequencing[J]. Microbial ecology, 2015,70:853-859.
- Zhao L, Zhang Q, Ma W, et al. A combination of quercetin and resveratrol reduces obesity in high-fat diet-fed rats by modulation of gut microbiota[J]. Food & function, 2017,8(12):4644-4656. [CrossRef]
Figure 1.
Animal experiment grouping.
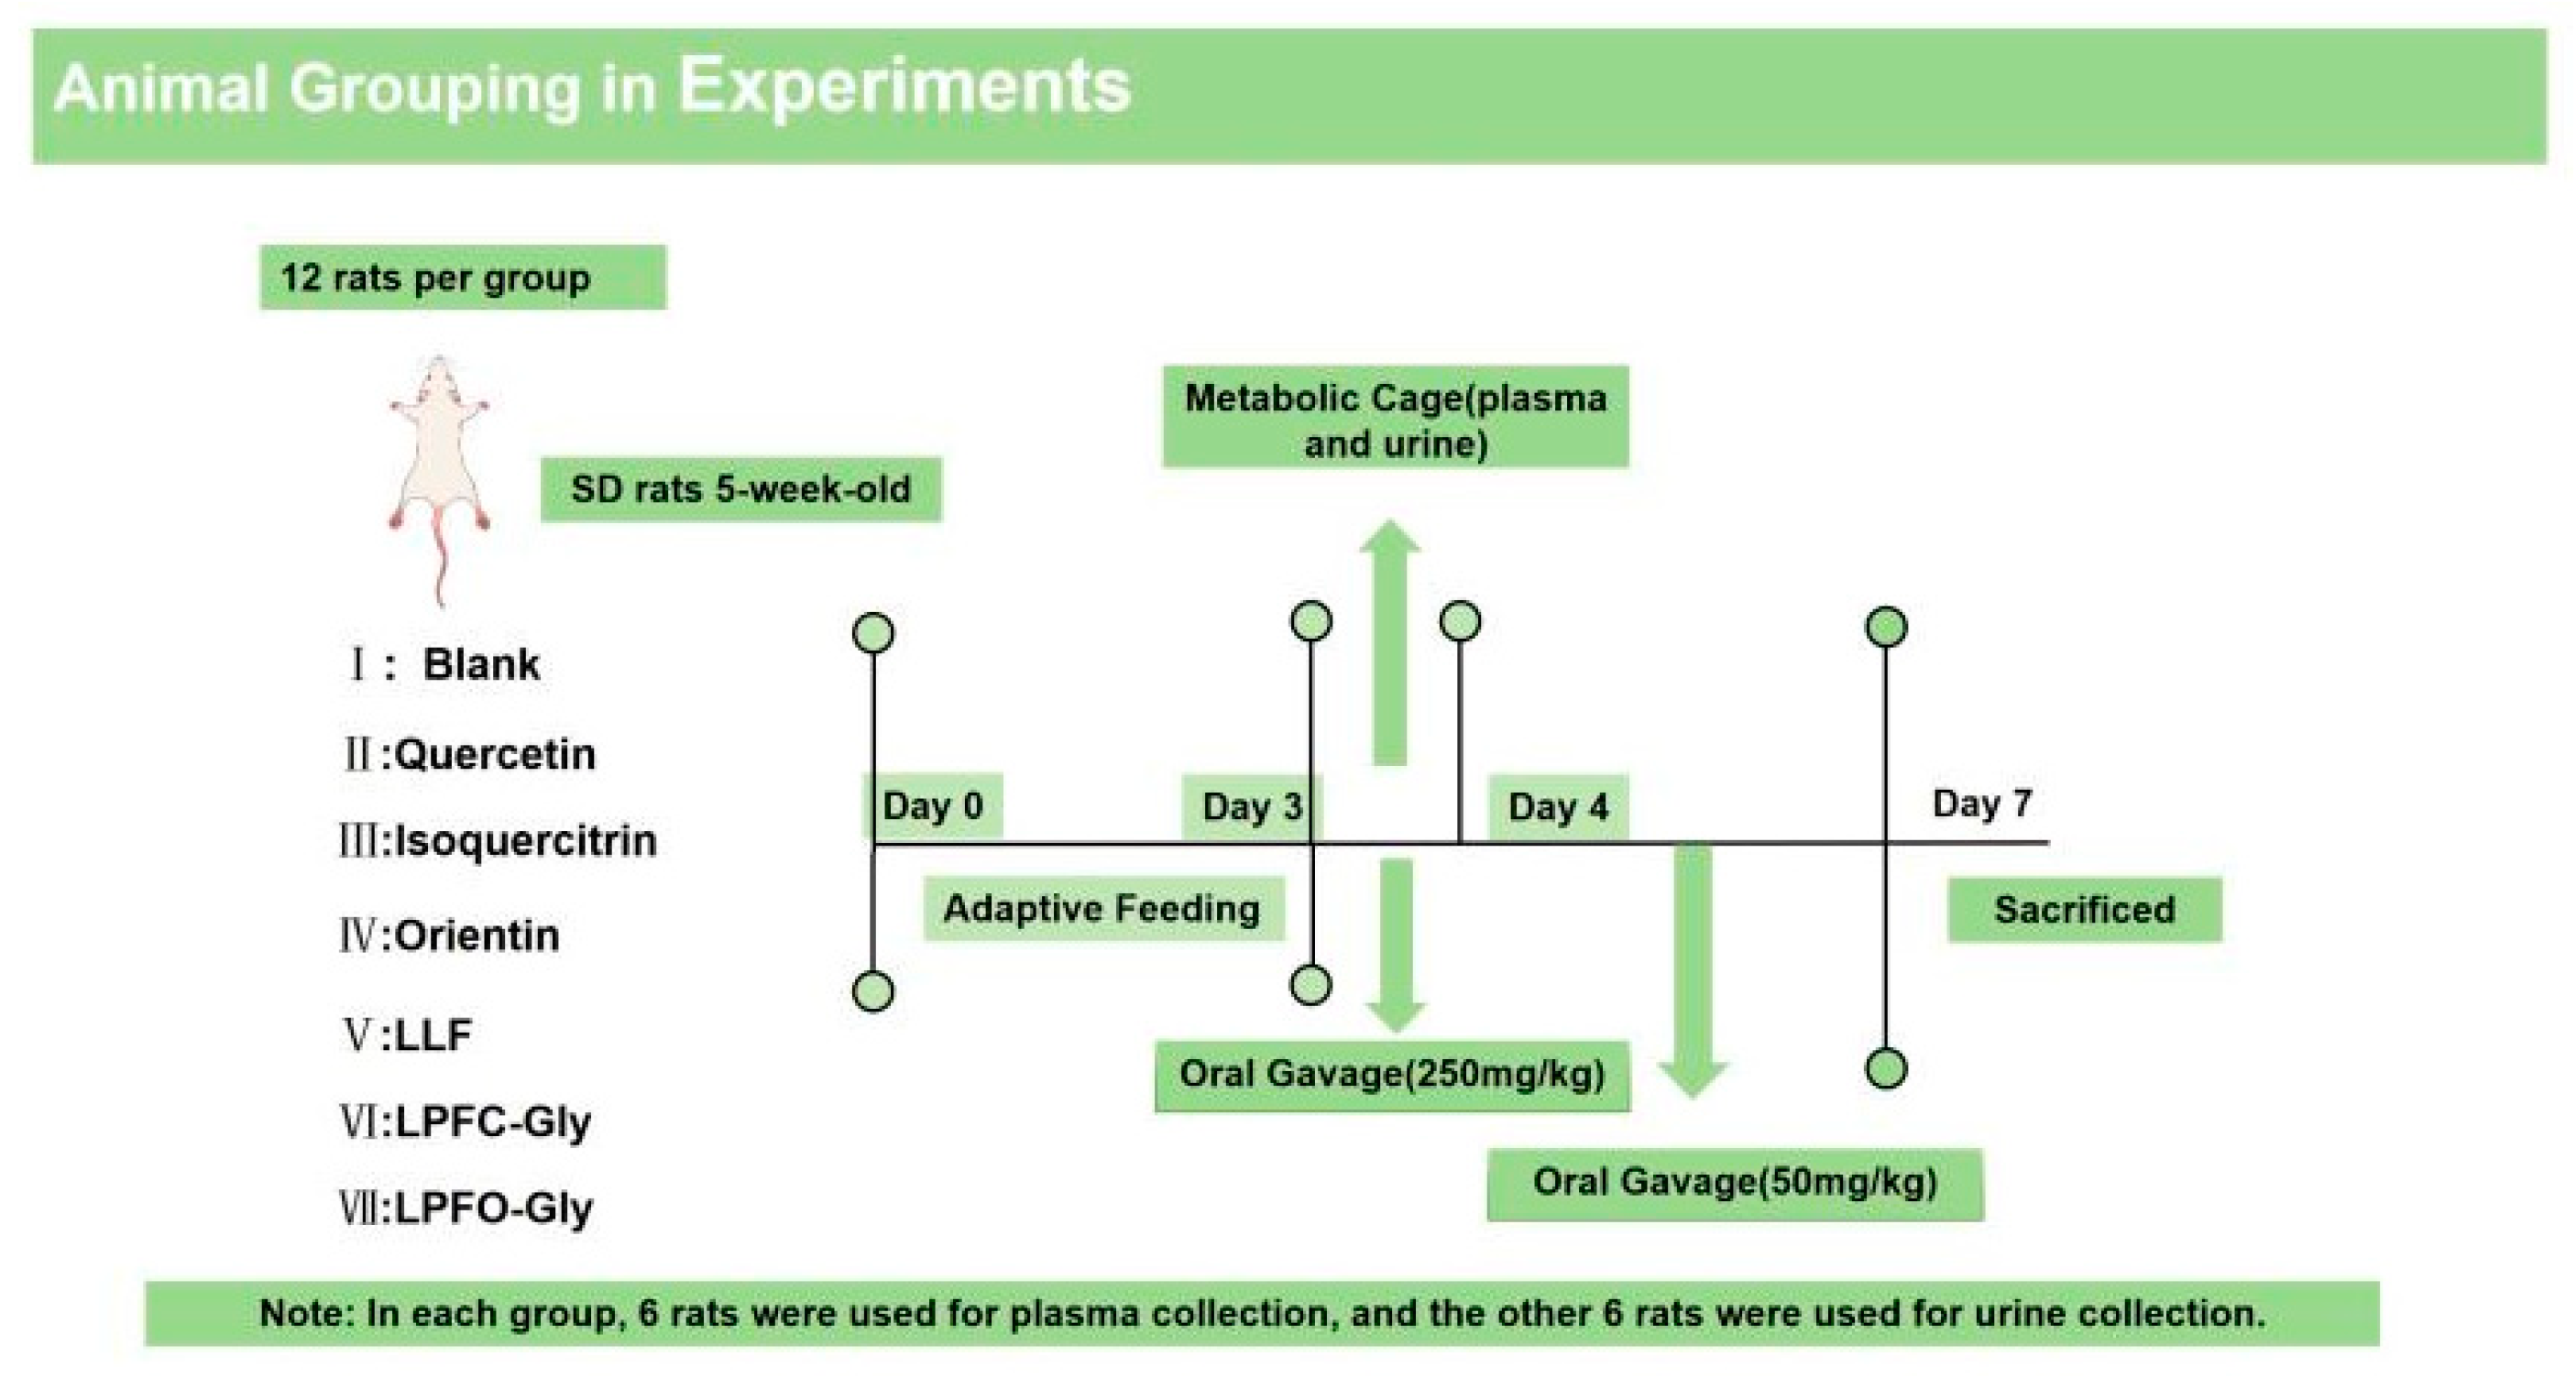
Figure 2.
HPLC profiles of flavonoids of lotus leaves.
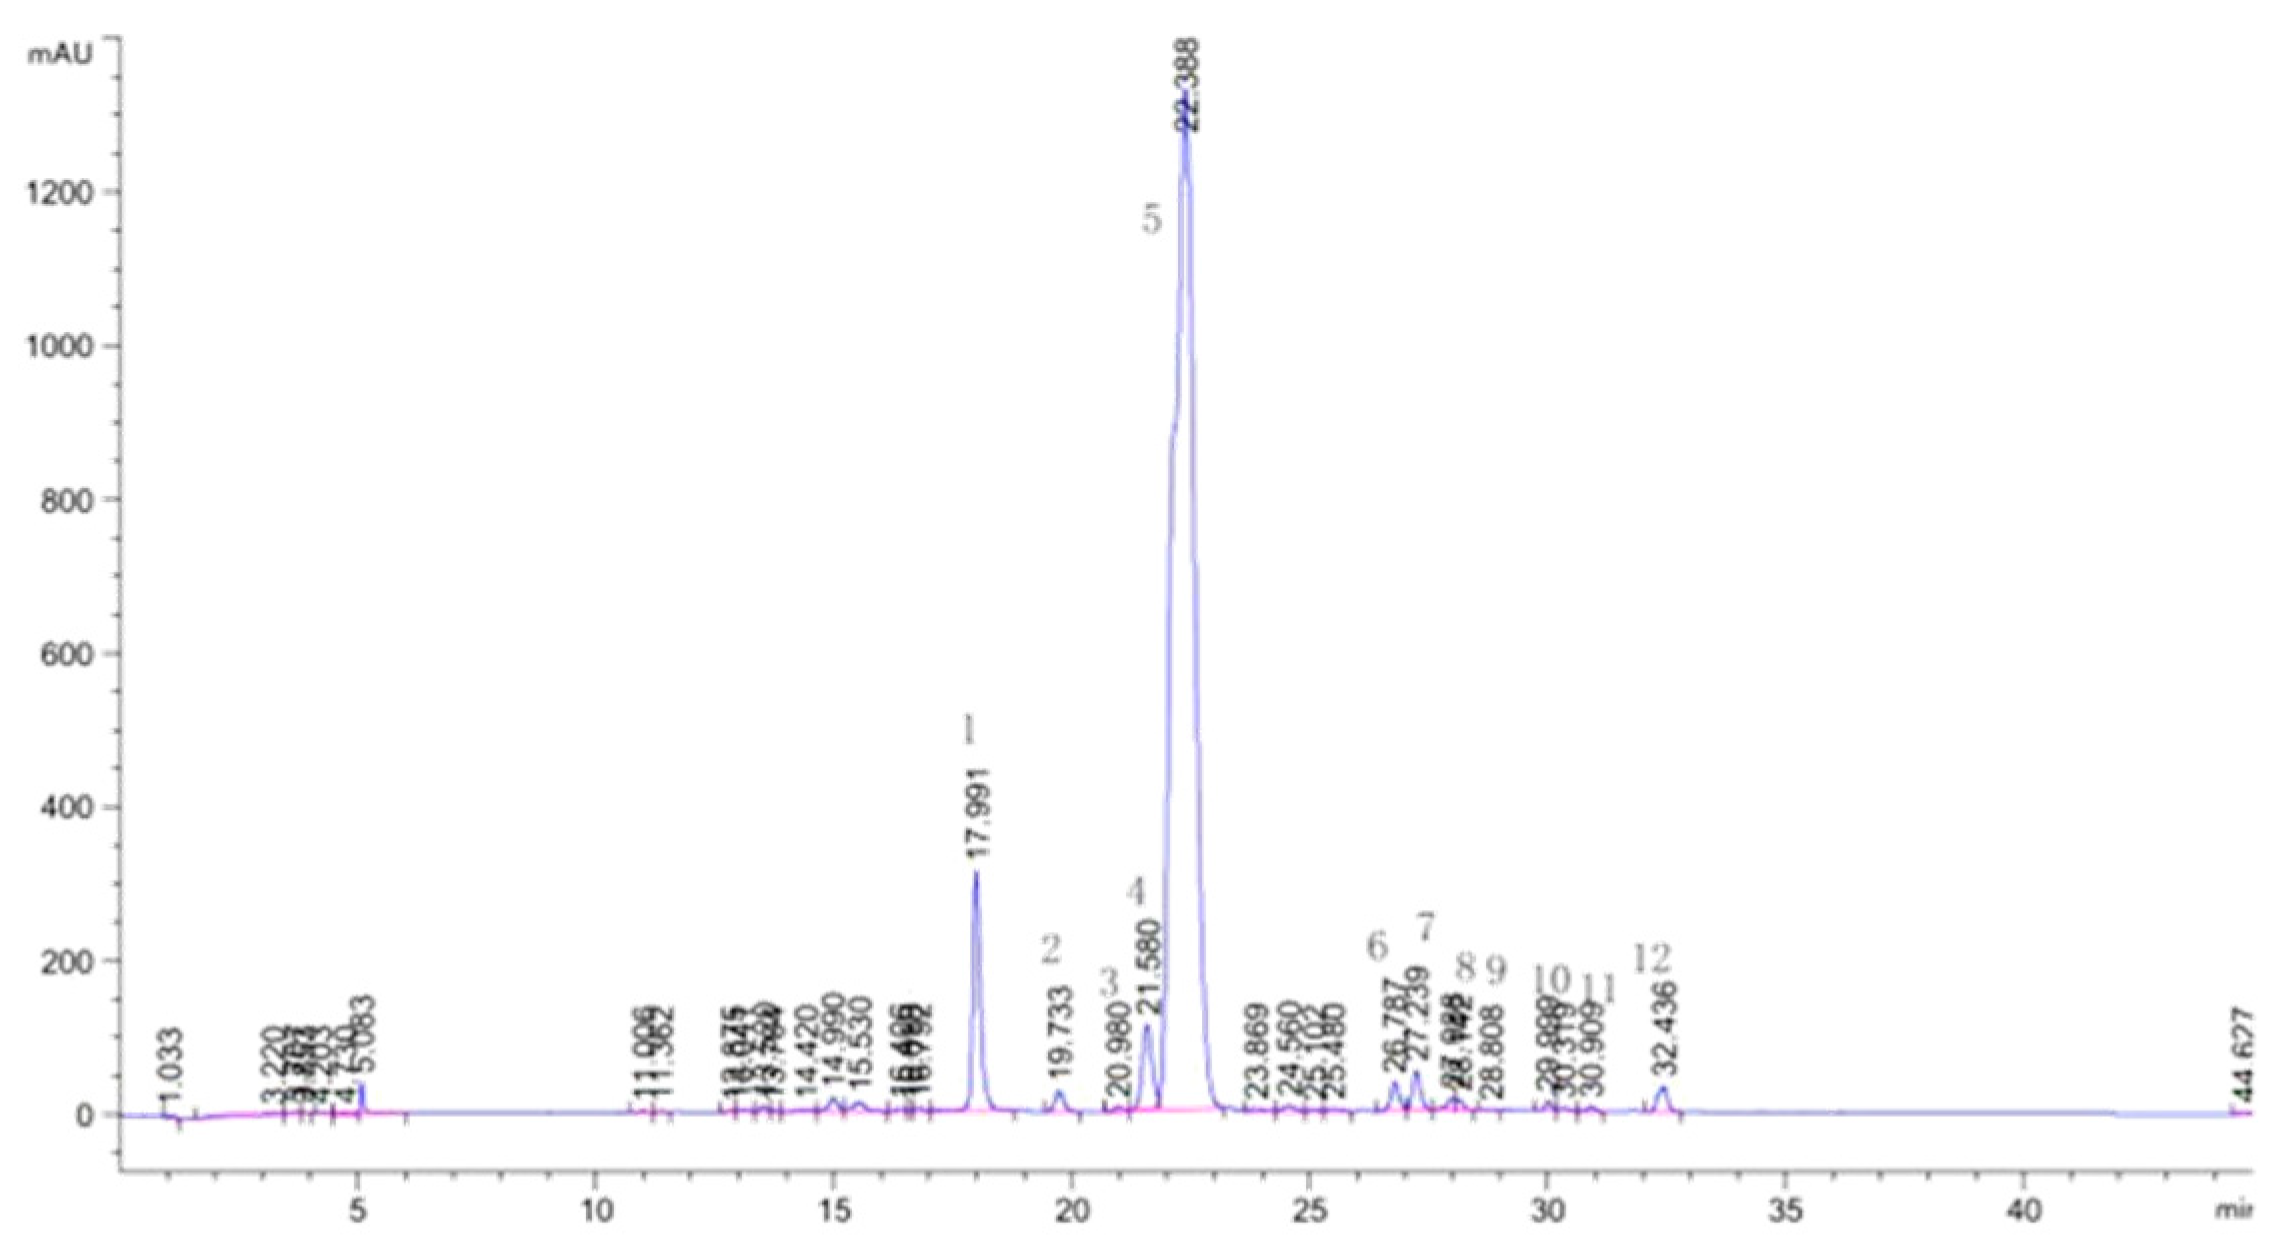
Figure 3.
HPLC profiles of flavonoids of lotus plumules.
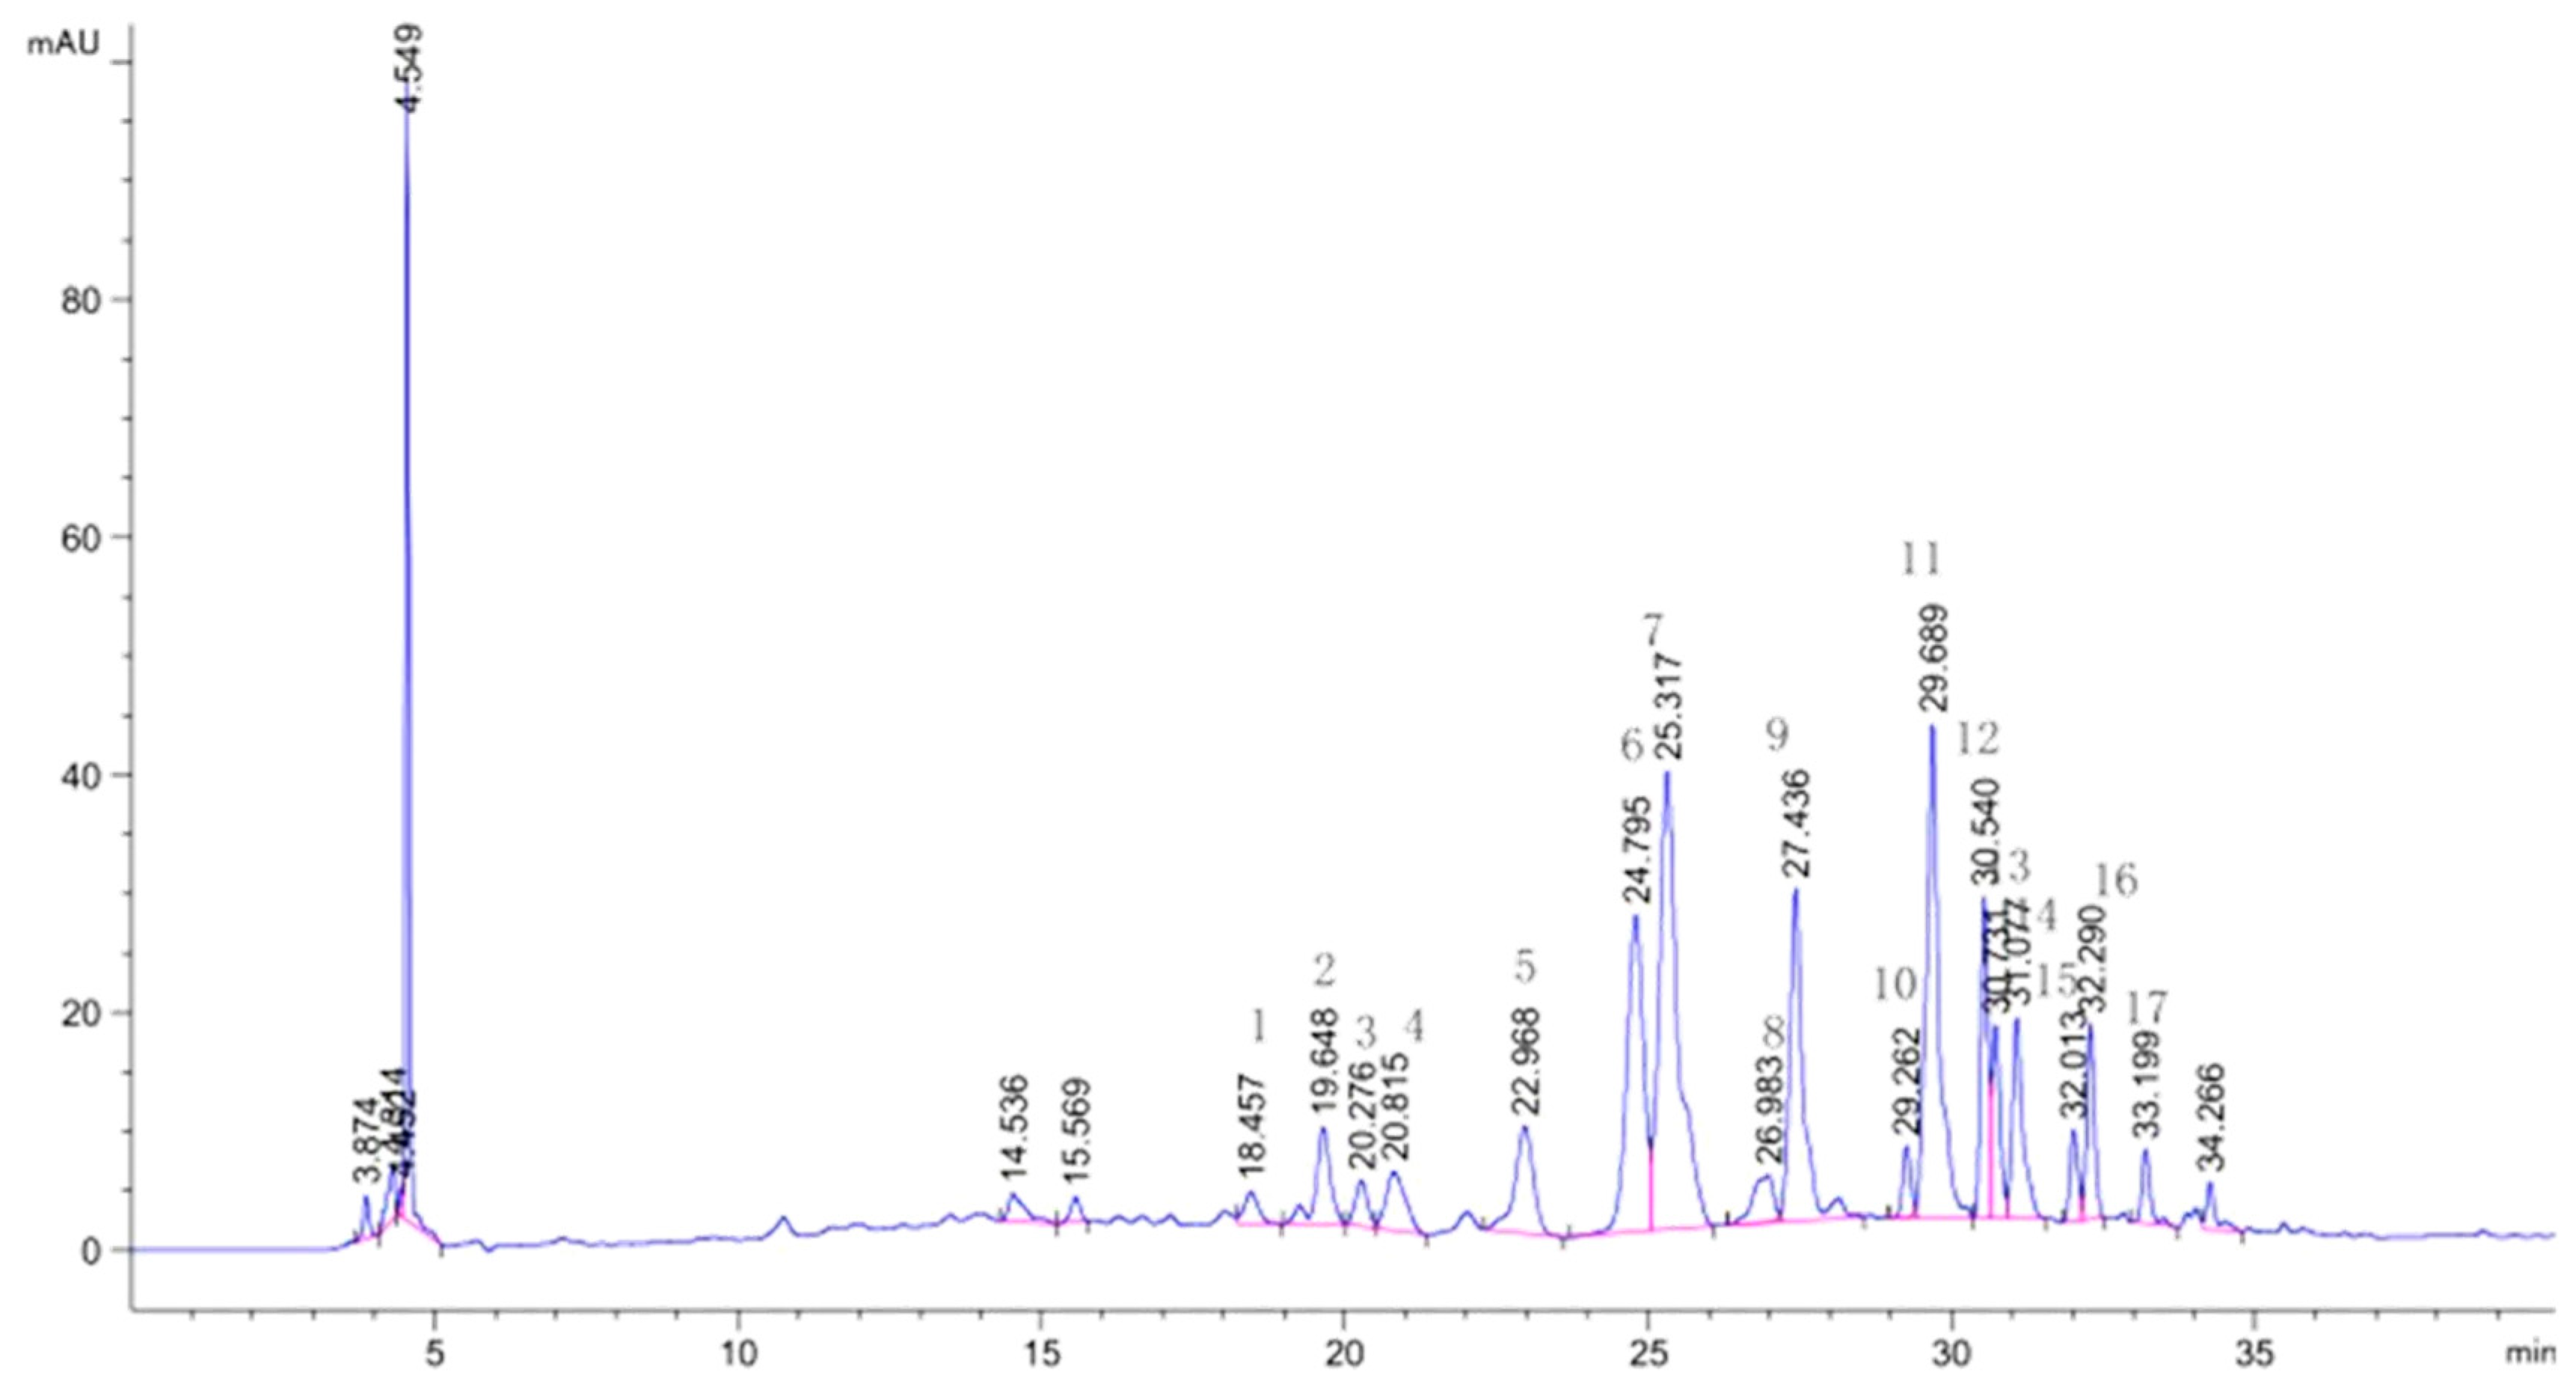
Figure 4.
Flavonoid O-glycosides and flavonoid C-glycosides in lotus plumule.

Figure 5.
Changes of antioxidant activity of LFF、LPF C-Gly and LPF O-Gly during in vitro digestion(a) ORAC activity changes of LFF、LPF C-Gly and LPF O-Gly. (b) ABTS activity changes of LFF、LPF C-Gly and LPF O-Gly(c) FRAP activity changes of LFF、LPF C-Gly and LPF O-Gly(d) DPPH activity Changes of LFF、LPF C-Gly and LPF O-Gly. Different letters in the same line indicate a significant difference (p < 0.05).
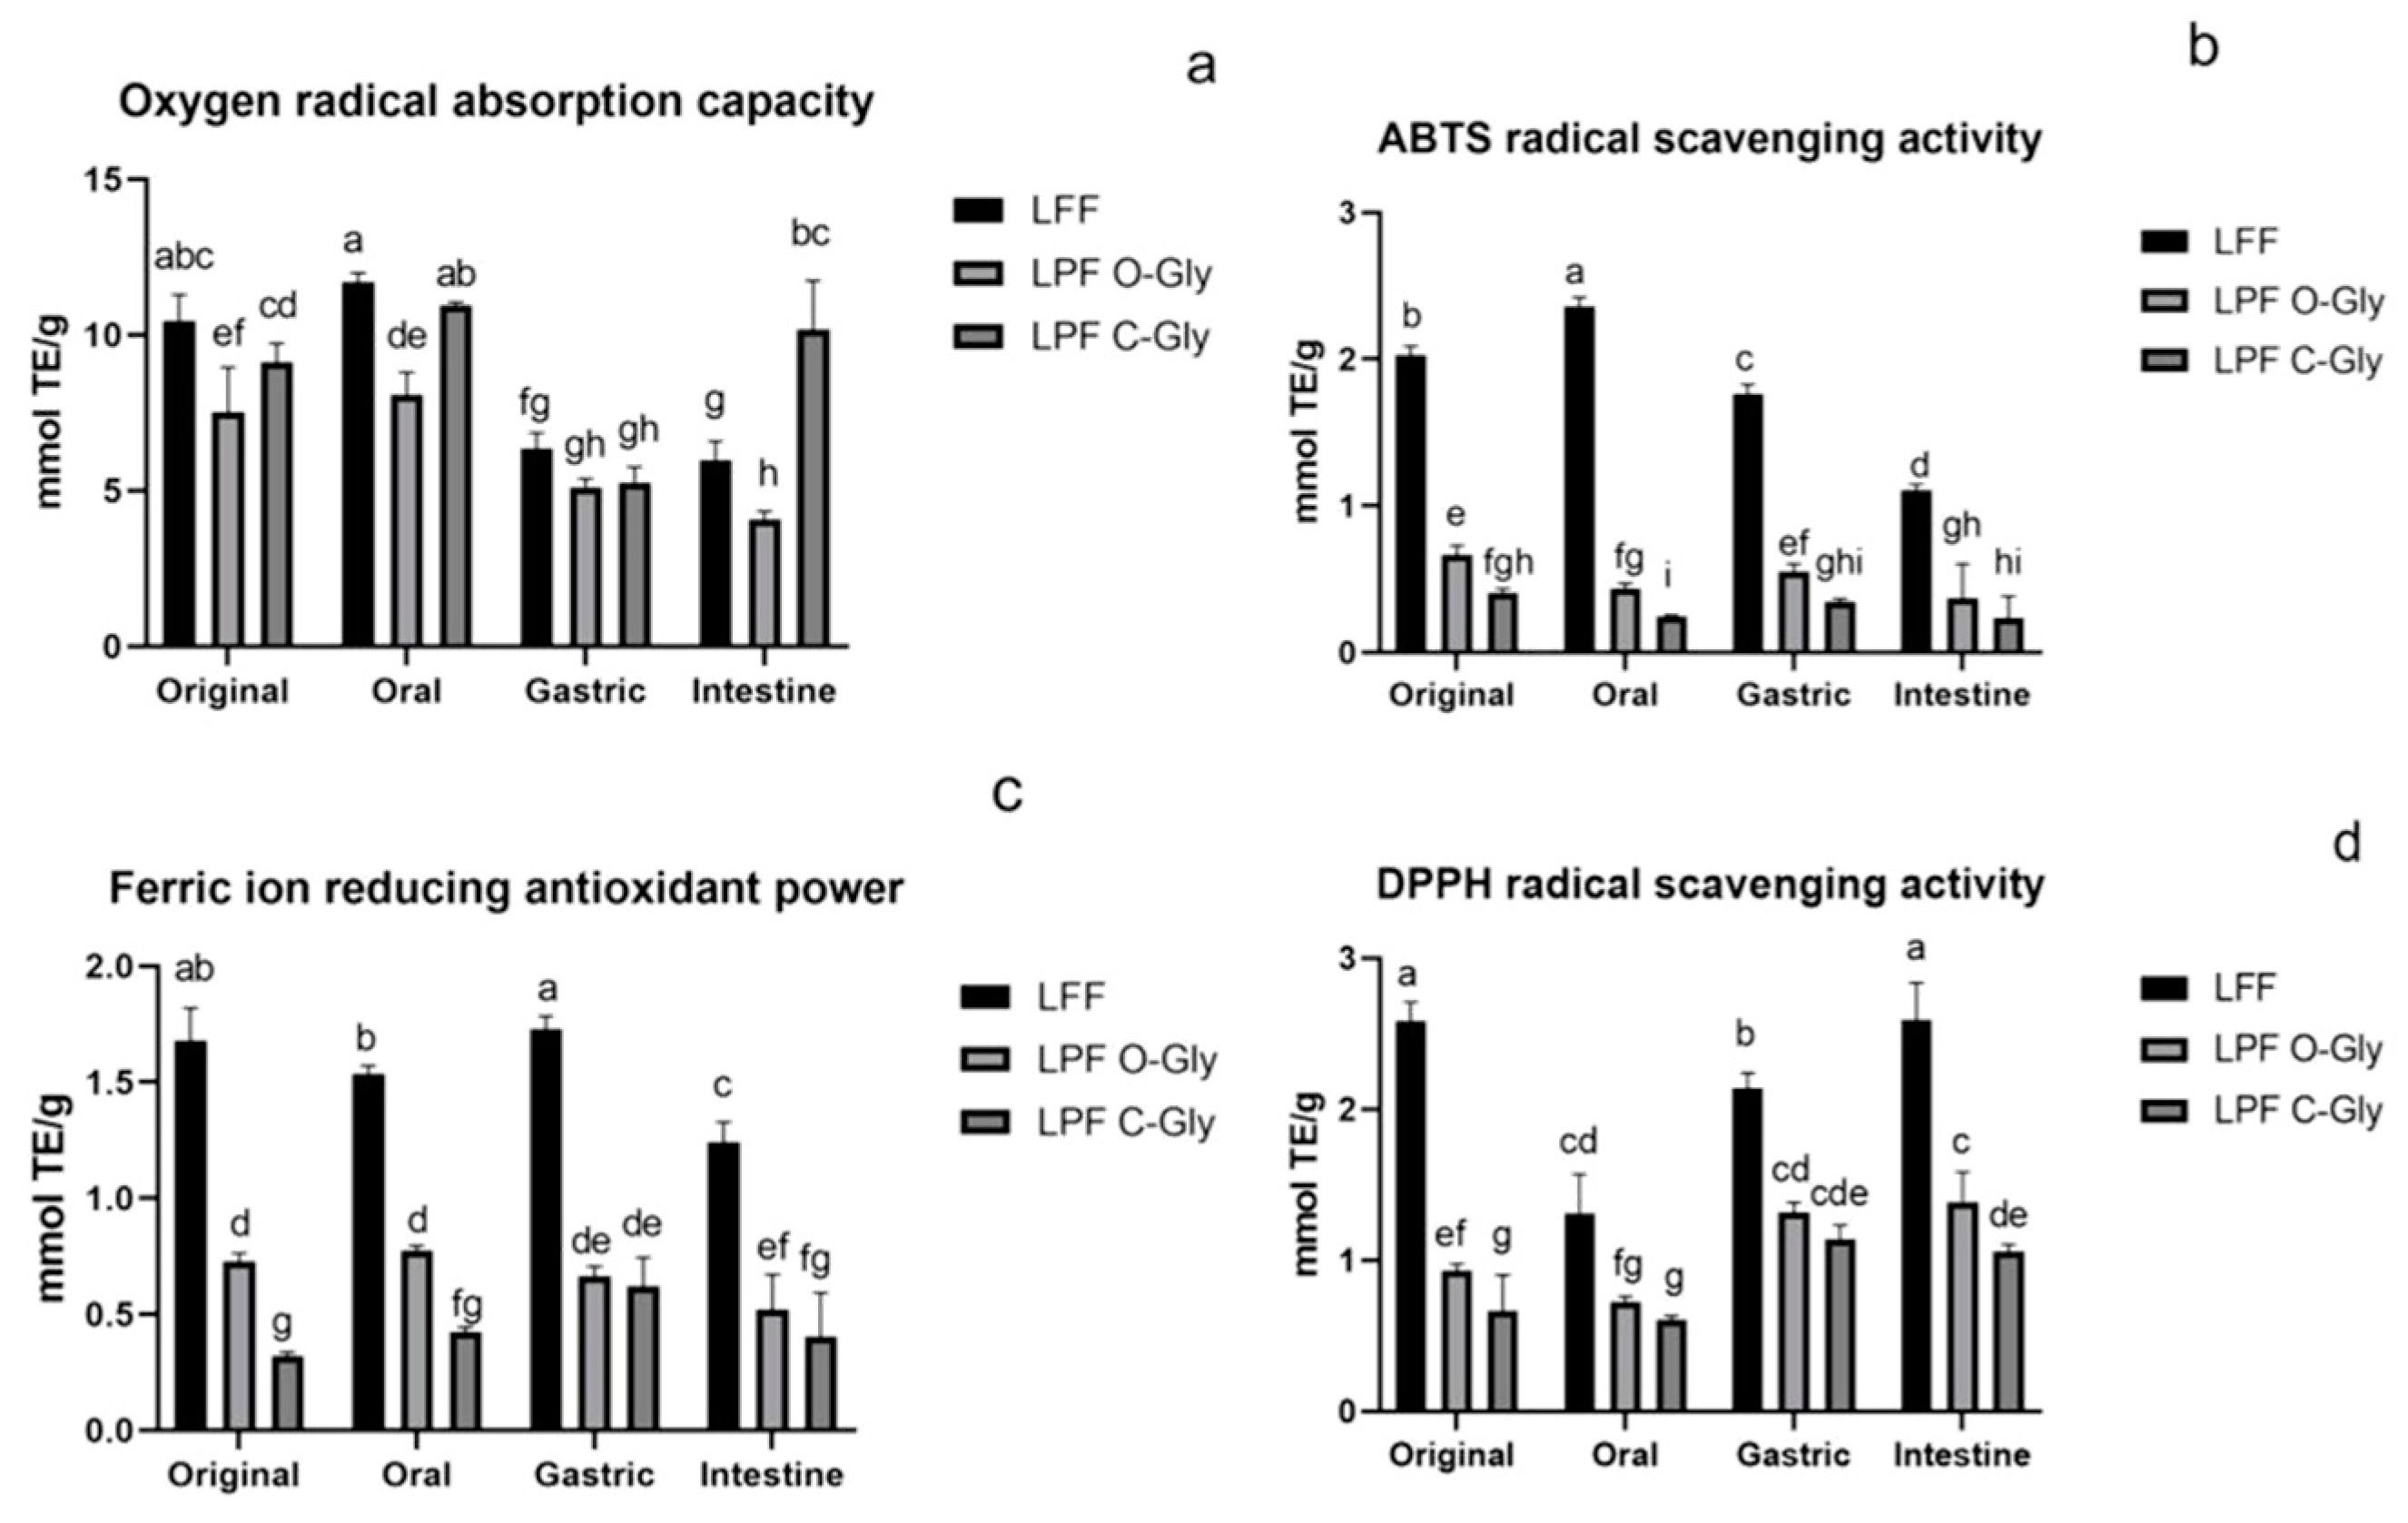
Figure 6.
Changes of antioxidant activity of LFF、LPF C-Gly and LPF O-Gly during fermentation.(a) ORAC activity changes of LFF、LPF C-Gly and LPF O-Gly(b) ABTS activity changes of LFF、LPF C-Gly and LPF O-Gly(c) FRAP activity changes of LFF、LPF C-Gly and LPF O-Gly(d) DPPH activity Changes of LFF、LPF C-Gly and LPF O-Gly. Different letters in the same line indicate a significant difference (p < 0.05).
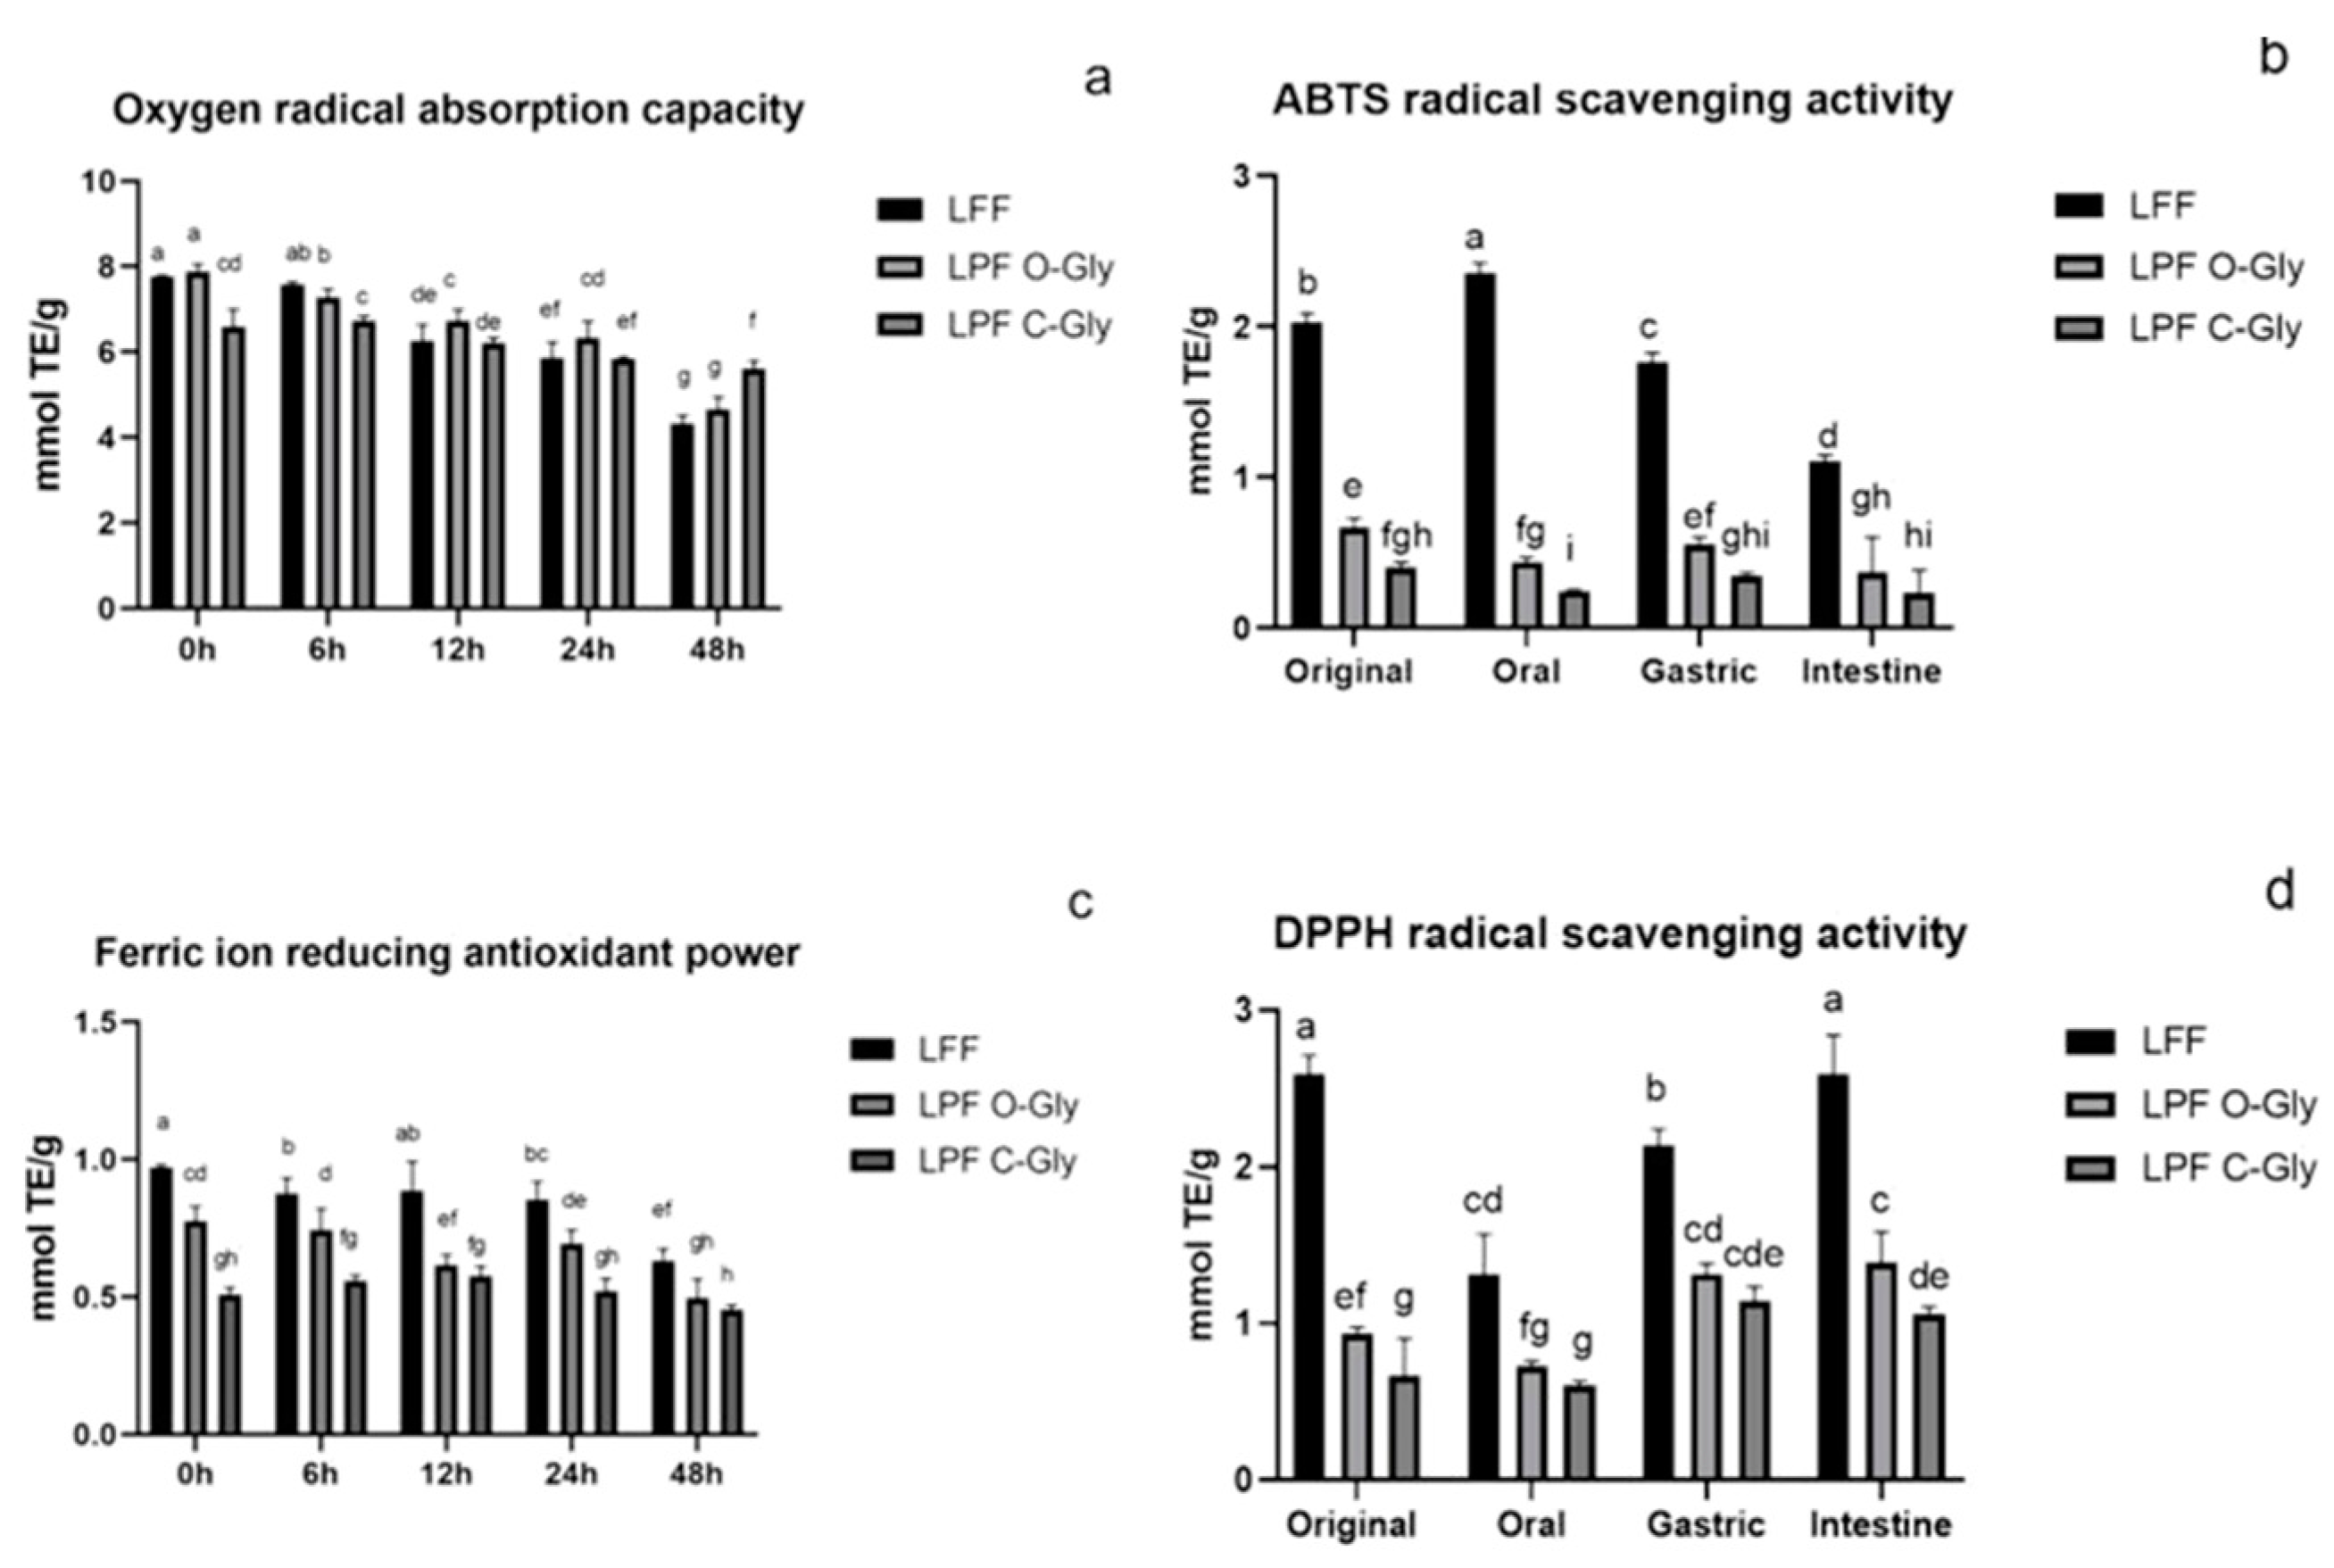
Figure 7.
Total antioxidant capacity of flavonoids O-glycosides and C-glycoside in lotus leaves and lotus plumules in plasma and urine. Note: a: Total antioxidant capacity of O-glycosides and C-glycosides in plasma, b: Total antioxidant capacity of O-glycosides and C-glycosides in urine. Different letters in the same line indicate significant difference (p < 0.05).
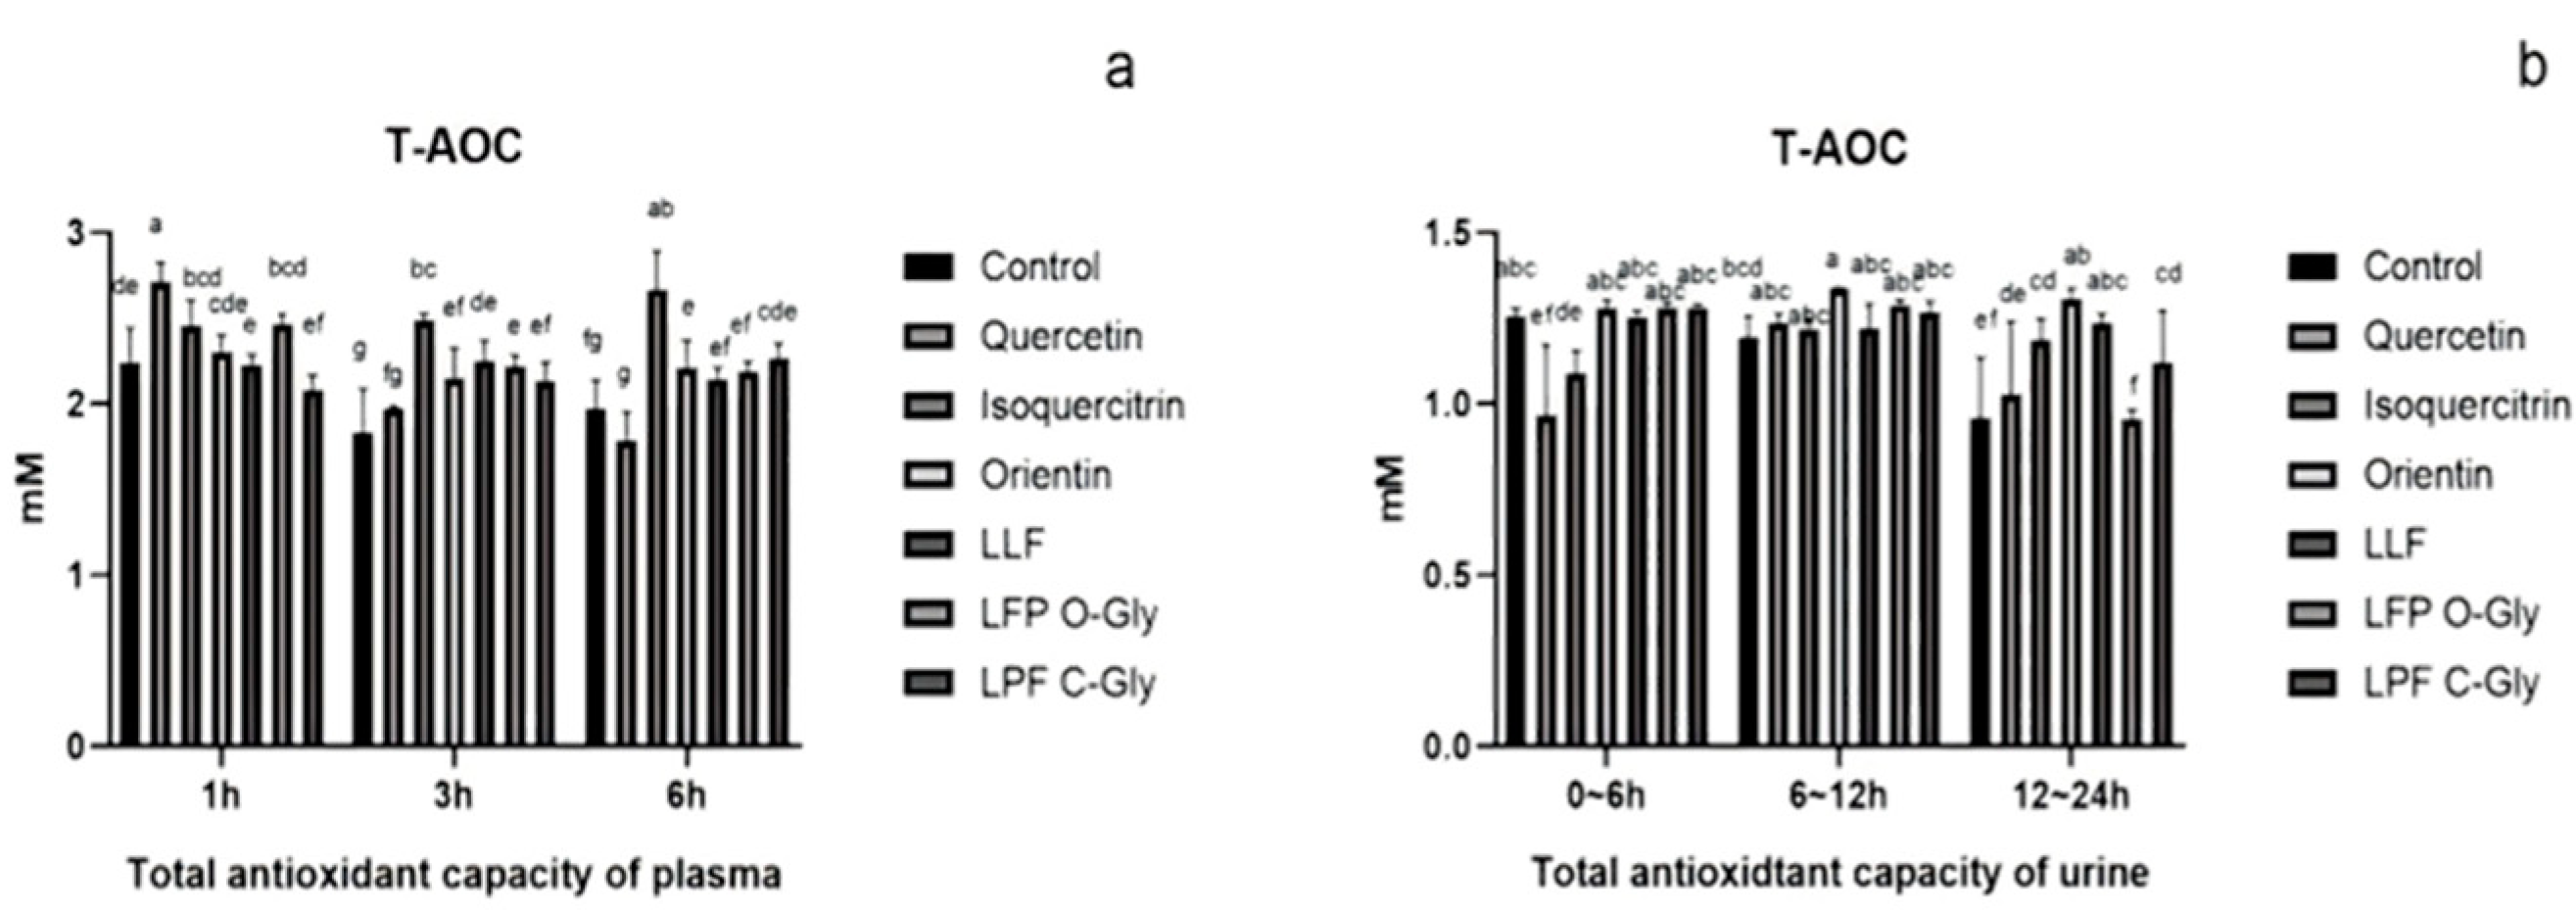
Figure 8.
Alpha-diversity analysis. Note: a: Alpha-diversity indexes; b: Rarefaction curve. A: Black; B: Quercetin; C: Isoquercitrin; D: Orientin; E: LFF; F: LPF O-Gly; G: LPF C-Gly.
Figure 8.
Alpha-diversity analysis. Note: a: Alpha-diversity indexes; b: Rarefaction curve. A: Black; B: Quercetin; C: Isoquercitrin; D: Orientin; E: LFF; F: LPF O-Gly; G: LPF C-Gly.
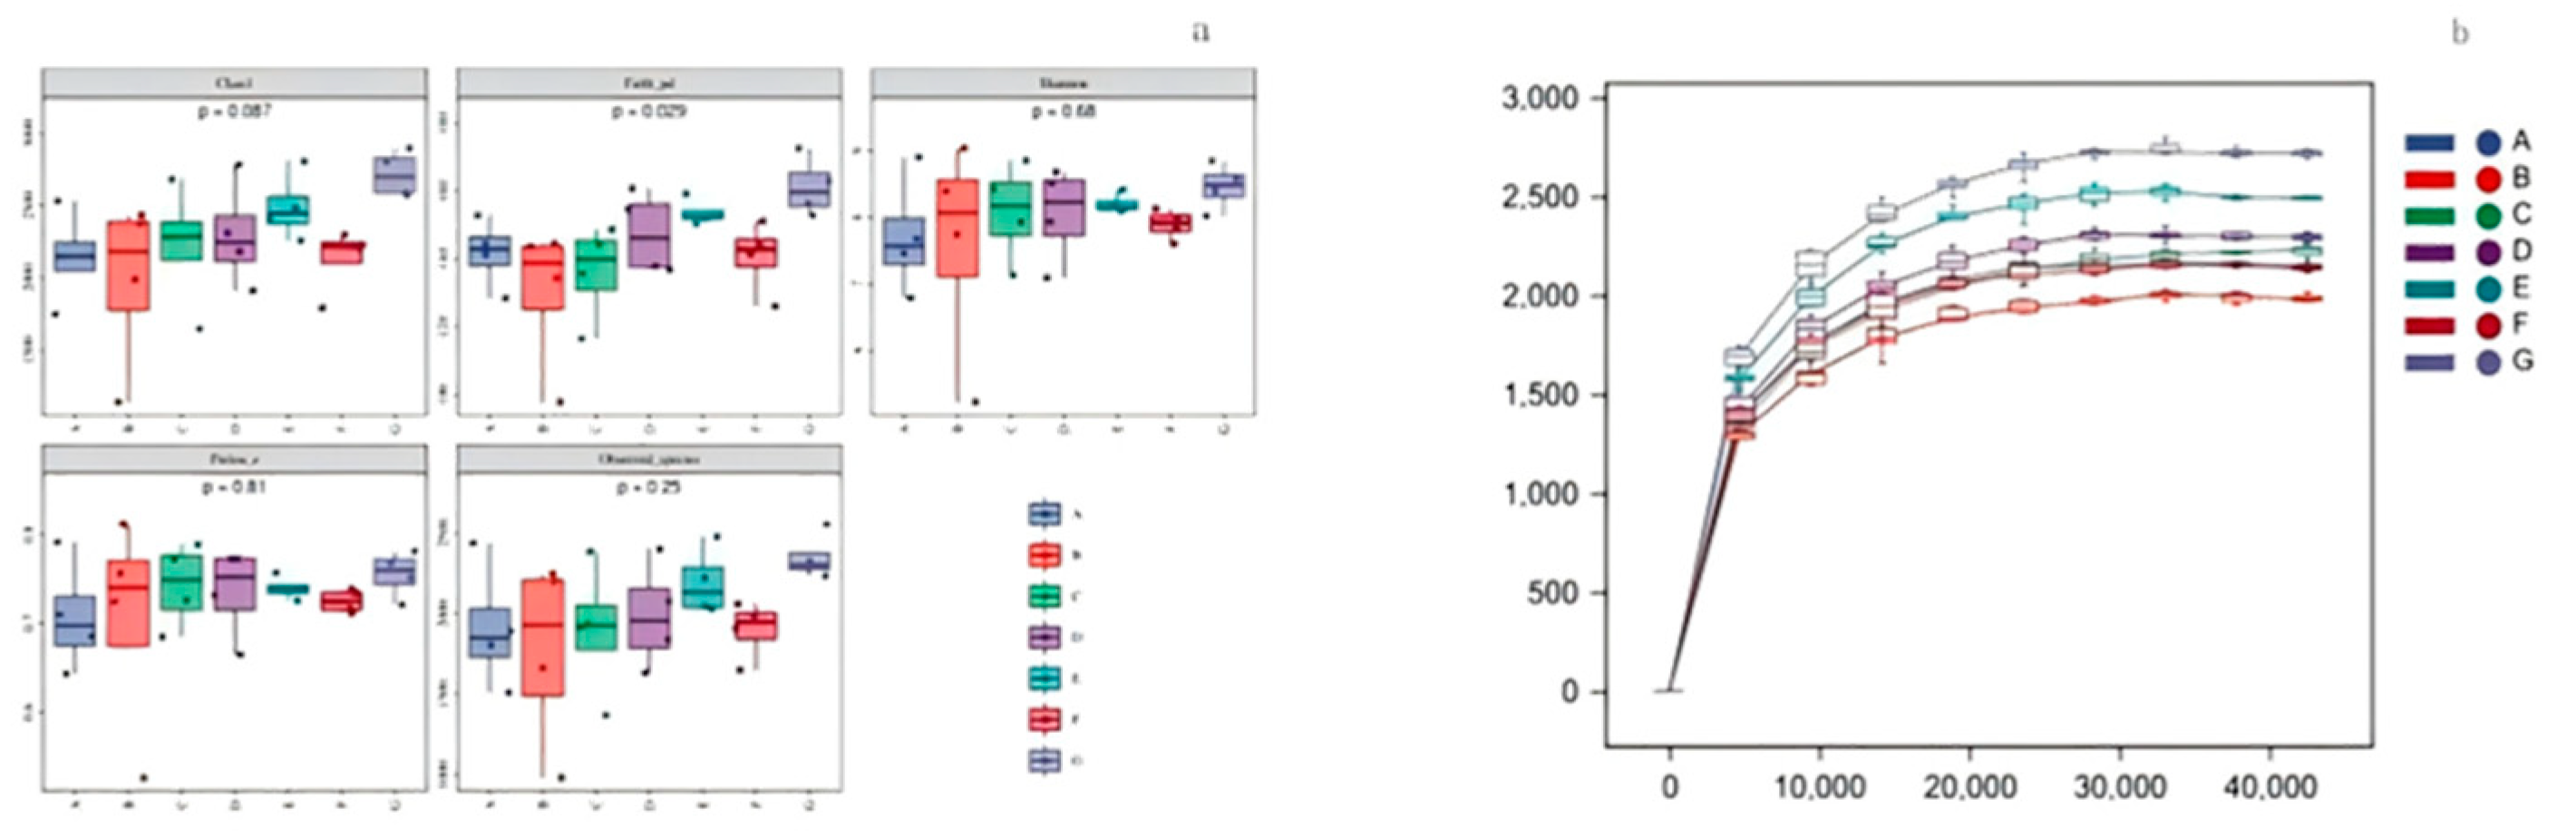
Figure 9.
Species composition analysis.
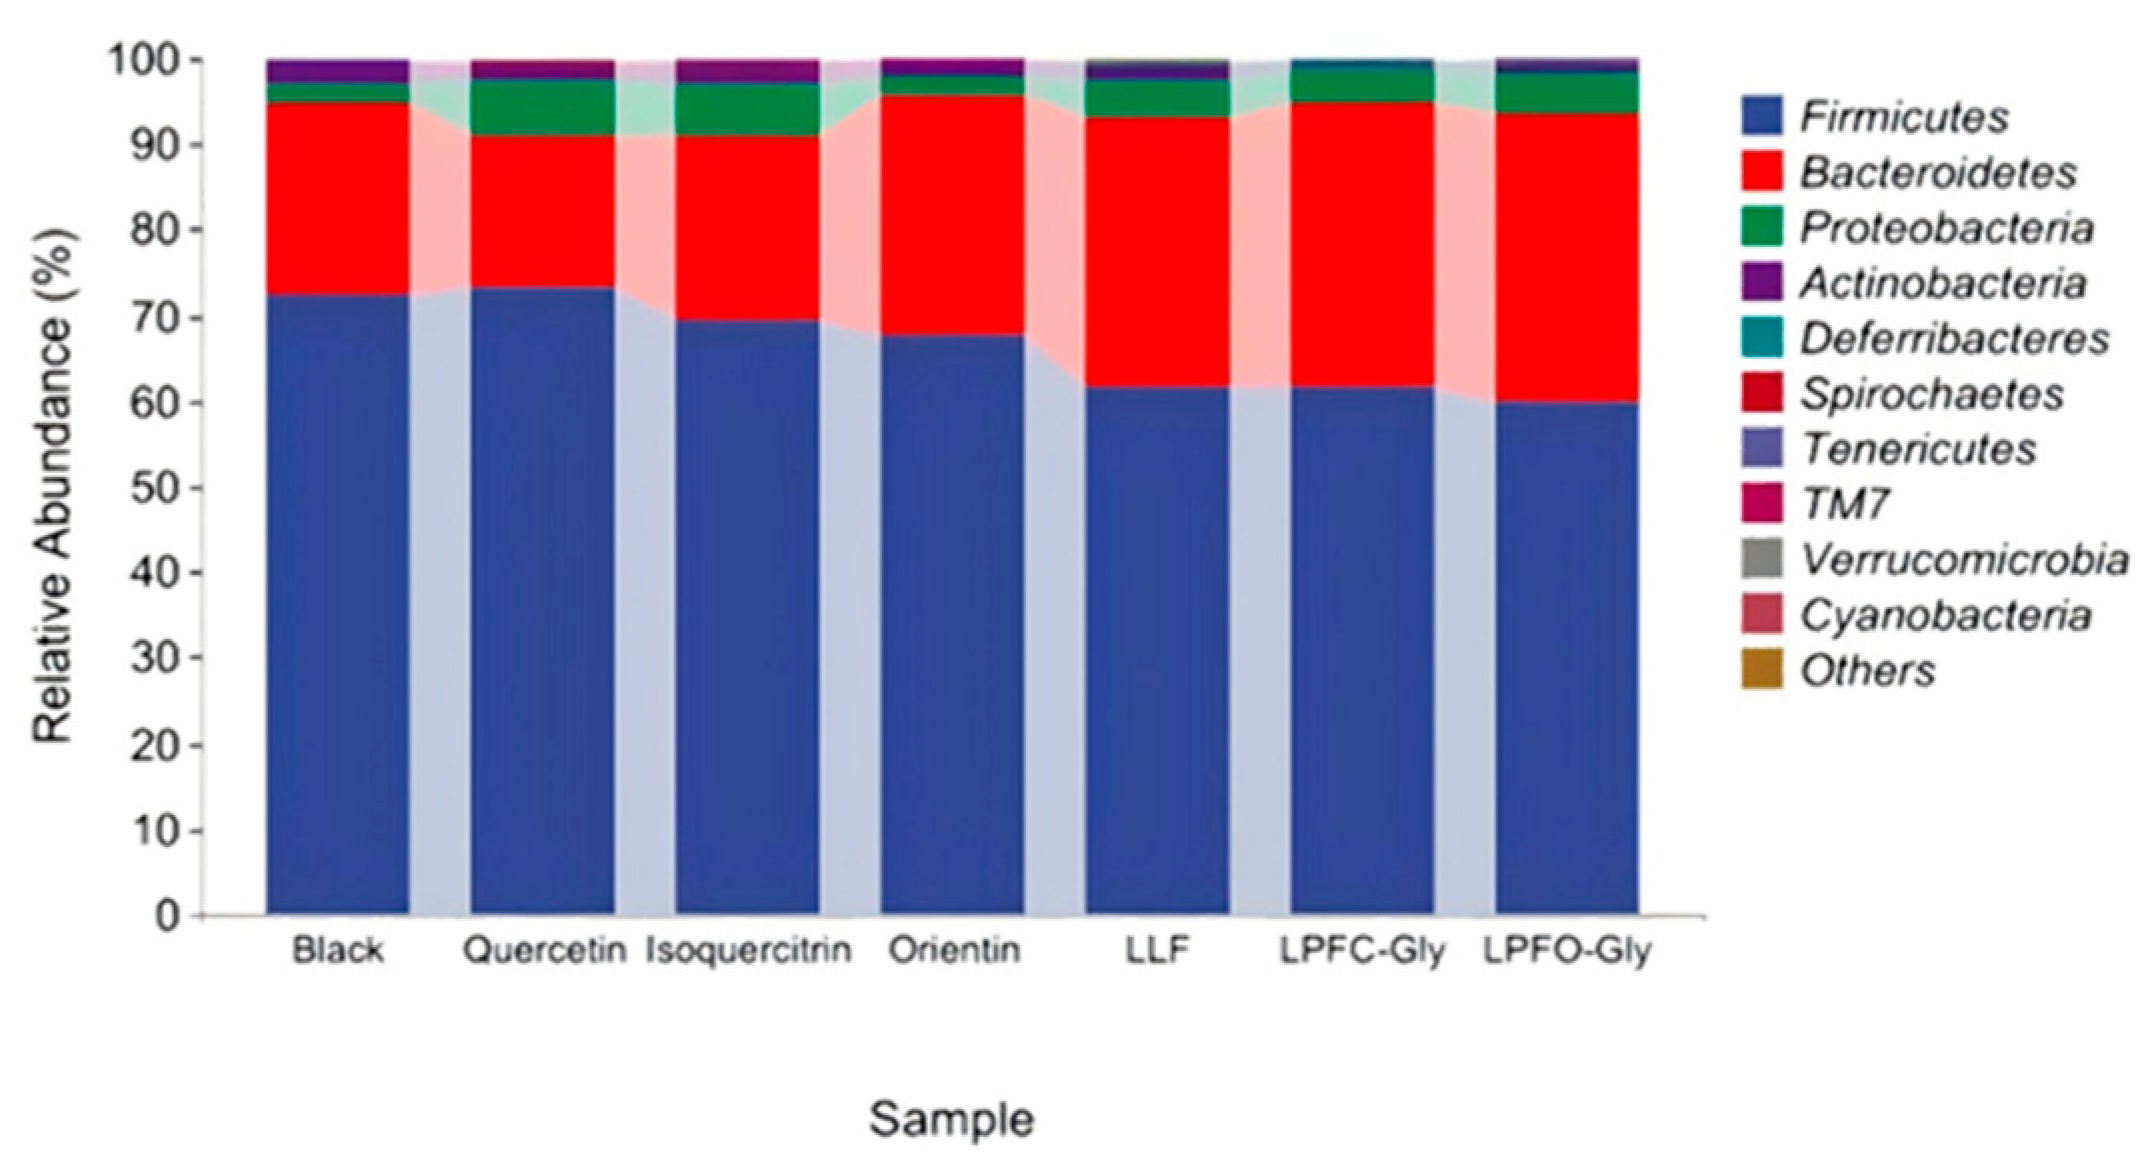

Table 1.
The composition of simulated digestion fluid.
| Main Constituent | Concentration | SSF pH 7 |
SGF pH 3 |
SIF pH 7 |
||||
| Volume | Concentration | Volume | Concentration | Volume | Concentration | |||
| g L-1 | Mol L-1 | mL | mmolL-1 | mL | mmolL-1 | mL | mmolL-1 | |
| NaCl | 117 | 2 | — | — | 11.8 | 47.2 | 9.6 | 38.4 |
| NaHCO3 | 84 | 1 | 6.8 | 13.6 | 12.5 | 25 | 42.5 | 85 |
| KCl | 37.3 | 0.5 | 15.1 | 15.1 | 6.9 | 6.9 | 6.8 | 6.8 |
| KH2PO4 | 68 | 0.5 | 3.7 | 3.7 | 0.9 | 0.9 | 0.8 | 0.8 |
| (NH4)2CO3 | 48 | 0.5 | 0.06 | 0.06 | 0.5 | 0.5 | — | — |
| MgCl2(H2O)6 | 30.5 | 0.15 | 0.5 | 0.15 | 0.4 | 0.1 | 1.1 | 0.33 |
| pH regulating solution | ||||||||
| molL-1 | mL | mmolL-1 | mL | mmolL-1 | mL | mmolL-1 | ||
| HCl | 6 | 0.09 | 1.1 | 1.3 | 15.6 | 0.7 | 8.4 | |
| NaOH | 1 | — | — | — | — | — | — | |
| Add CaCl2(H2O)2again in the digestion stage | ||||||||
| gL-1 | molL-1 | mmolL-1 | mmolL-1 | mmolL-1 | ||||
| CaCl2(H2O)2 | 44.1 | 0.3 | 1.5 | 0.15 | 0.6 | |||
Table 2.
Identification of flavonoids of lotus leaves by LC-MS/MS.
| NO | RT(min) | NI-MS | MS/MS | Identification | Ref |
| 1 | 17.991 | 595 | 300 | Quercetin 3-O-arabinopyranosyl-(1→2)-galactopyranoside | zhu et al., 2015 |
| 2 | 19.733 | 609 | 300 | Quercetin 3-O-rhamnopyranosyl-(1→2)-glucopyranoside | zhu et al., 2015 |
| 3 | 20.980 | 463 | 300 | Hyperoside | Standard |
| 4 | 21.580 | 463 | 300 | Isoquercitrin | Standard |
| 5 | 22.388 | 477 | 301 | Quercetin 3-O-glucuronide | Standard |
| 6 | 26.787 | 447 | 284 | Kaempferol 3-O-galactoside | zhu et al., 2015 |
| 7 | 27.239 | 447 | 284 | Kaempferol 3-O-glucoside (astragalin) | zhu et al., 2015 |
| 8 | 27.988 | 461 | 285 | Kaempferol 3-O-glucuronide | zhu et al., 2015 |
| 9 | 28.112 | 461 | 298 | Diosmetin 7-O-hexose | zhu et al., 2015 |
| 10 | 29.999 | 609 | 314, 299 | Isorhamnetin3-O-arabinopyranosyl-(1→2)-glucopyranoside | zhu et al., 2015 |
| 11 | 30.909 | 477 | 314 | Isorhamnetin 3-O-hexose | zhu et al., 2015 |
| 12 | 32.436 | 491 | 315 | Isorhamnetin 3-O-glucuronide | zhu et al., 2015 |
RT: retention time on HPLC analysis; NI-MS: Negative ion mode primary mass spectrometry.
Table 3.
Identification of flavonoids of lotus plumules by LC-MS/MS.
| NO | RT (min) | NI-MS | MS/MS | Identification | Ref |
| 1 | 18.457 | 579 | 519, 489, 459, 399, 369 | Luteolin6-C-pentoside-8-C-glucoside | Li et al. (2014) |
| 2 | 19.648 | 593 | 575, 533, 503, 473, 383, 353 | Chrysoeriol (Diosmetin)6-C-pentoside (hexoside)-8-C-hexoside | Ferreres et al. (2003) |
| 3 | 20.276 | 579 | 519, 489 | Luteolin6-C- glucoside -8-C- pentoside | Li et al. (2014) |
| 4 | 20.815 | 563 | 503, 473, 443, 425, 383, 353 | Apigenin 6-C-glucoside-8-C-xylosidase | Liu et al. (2017) |
| 5 | 22.968 | 563 | 503, 473 | Apigenin-6-C-xylosidase-8-C-glucoside | Liu et al. (2017) |
| 6 | 24.795 | 563 | 473, 443, 383, 353 | Apigenin 6-C-glucosyl-8-C-arabinoside(Schaftoside) | Standard |
| 7 | 25.317 | 447 | 327, 297 | Luteolin-6-C-glucoside (isoorientin) | Standard |
| 8 | 26.983 | 447 | 357, 327, 297 | Luteolin-8-C-glucoside (orientin) | Standard |
| 9 | 27.436 | 563 | 503, 473, 443, 383, 353 | Apigenin-6-C-arabinosyl-8-C-glucoside (isoschaftoside) | zheng et al. (2019) |
| 10 | 29.263 | 577 | 503, 487, 457, 383, 353 | Apigenin-6-C-glucosyl-8-C-rhamnoside | Li et al. (2014) |
| 11 | 29.689 | 609 | 300, 271 | Rutin | zhu et al. (2017) |
| 12 | 30.540 | 577 | 457, 383, 353 | Apigenin-6-C-rhamnoside-8-C-glucosyl | Li et al. (2014) |
| 13 | 30.731 | 593 | 447, 285 | Luteolin-7-O-neohesperidoside | Liu et al. (2017) |
| 14 | 31.077 | 463 | 300 | Quercetin3-O-glucoside(Isoquercitrin) | zhu et al. (2017) |
| 15 | 32.013 | 593 | 285 | Luteolin-7-O-rutinoside | Liu et al. (2017) |
| 16 | 32.290 | 623 | 315 | Isorhamnetin-3-O-rutinoside | Liu et al. (2017) |
| 17 | 33.199 | 607 | 299, 284 | Diosmetin 7-O-rutinoside (Diosmin) | zhu et al. (2017) |
RT: retention time on HPLC analysis; NI-MS: Negative ion mode primary mass spectrometry.
Table 4.
Determination of flavonoids in lotus leaves and lotus plumules by HPLC.
| LFF | Content(mg/g) | LPF O-Gly | Content(mg/g) | LPF C-Gly | Content(mg/g) |
| Qu 3-ara (1→2) gal | 59.17±16.01 | Ru | 158.12±19.11 | Lu 6-pen-8-glu | 13.31±0.92 |
| Qu 3-rha (1→2) glu | 19.88±3.3 | Lu 7-neo | 71.46±15.99 | Chr 6-pen-8-hex | 29.55±2.63 |
| IQ | 29.39±9.61 | IQ | 62.57±13.67 | Lu 6-glu-8-pen | 21.42±2.41 |
| Qu 3-glu | 611.98±138.92 | Lu 7-rut | 28.24±2.64 | Ap 6-glu-8-xyl | 13.12±1.86 |
| Ka 3-gal | 22.25±2.96 | Iso 3-rut | 41.37±3.77 | Ap 6-xyl-8-glu | 45.56±3.79 |
| Ka 3-glu | 21.49±0.72 | Dio 7-rut | 21.40±2.89 | Sc | 92.65±0.45 |
| Ka 3-gln | 15.76±1.51 | Ior | 144.23±5.27 | ||
| Iso 3-gln | 18.88±4.96 | Or | 23.85±5.73 | ||
| Isc | 45.12±0.86 | ||||
| Ap 6-glu-8-rha | 45.48±6.16 | ||||
| Total | 798.81±86.53 | 383.17±31.65 | 474.29±74.57 |
1 Note: Results are expressed as mean ± standard deviation of three replicates. 2 Note: LFF: Lotus leaves flavonoids; LPF O-Gly: Lotus plumules flavonoid -O Gly; LPF C-Gly: Lotus plumules flavonoid -C Gly. Qu: quercetin; Ara: arabinopyranosyl; Gal: galactoside; Rha: rhamnopyranosyl; Glu: glucuronide; IQ: isoquercitrin; Ka: Kaempferol; Iso: isorhamnetin; Ru: rutin; Lu: luteolin; Neo: neohesperidoside; Dio: diosmetin Rut: rutinoside; Pen: pentoside; Chr: chrysoeriol; Hex: hexoside; Xyl: xylosidase; Ap: Apigenin Sc: schaftoside; Ior: isoorientin Or: orientin; Isc: isoschaftoside.
Table 5.
Evolution of lotus leaves flavonoids content during in vitro digestion.
| Compound | Phase (Content mg/g) | |||
| Firsthand | Oral cavity | Stomach | Intestinum | |
| Qu 3-ara (1→2) gal | 59.17±16.01a | 40.75±3.04a | 11.50±0.33b | 15.19±5.04b |
| Qu 3-rha (1→2) glu | 19.88±3.3a | 14.62±0.65b | 14.98±2.31b | 13.27±0.90b |
| IQ | 29.39±9.61a | 25.52±1.46ab | 21.55±2.04bc | 13.62±1.29c |
| Qu 3-glu | 611.98±138.92a | 360.75±32.87b | 327.86±29.66b | 221.87±4.55b |
| Ka 3-gal | 22.25±2.96a | 14.96±1.23b | 12.36±0.90b | 12.56±0.32b |
| Ka 3-glu | 21.49±0.72a | 17.59±0.44b | 13.93±1.08c | 11.57±0.30d |
| Ka 3-gln | 15.76±1.51a | 11.50±0.21b | 12.33±0.30b | 11.45±0.51b |
| Iso 3-gln | 18.88±4.96a | 15.36±0.31ab | 13.72±0.05ab | 12.20±0.30b |
| Qu | 0.00 | ND | 4.27±1.37 | 9.48±2.16 |
| Total | 798.81±86.53a | 500.85±2.89b | 427.22±33.76c | 311.73±2.45d |
Note: Different letters in the same line indicate a significant difference (p < 0.05); ND: No detection.
Table 6.
Evolution of LPF O-Gly content during in vitro digestion.
| Compound | Phase (Content mg/g) | |||
| Firsthand | Oral cavity | Stomach | Intestinum | |
| Rut | 158.12±19.11a | 72.62±0.58b | 57.42±0.28b | 52.99±4.39b |
| Lu 7-neo | 71.46±15.99a | 67.93±0.32ab | 50.43±2.44bc | 42.37±2.39c |
| IQ | 62.57±13.67a | 36.74±0.27b | 31.02±0.085b | 23.70±2.41b |
| Lu 7-rut | 28.24±2.64a | 20.21±4.29b | 19.30±0.85b | 18.22±1.16b |
| Iso 3-rut | 41.37±3.77a | 29.72±0.26b | 26.44±1.12bc | 23.31±2.07c |
| Dio 7-rut | 21.40±2.89a | 16.14±2.06ab | 18.21±0.59bc | 13.02±0.74c |
| Qu | 0.00 | ND | 1.41±0.22 | ND |
| Total | 383.17±31.65 | 243.36±1.60b | 202.82±3.44c | 173.61±9.30d |
Note: Different letters in the same line indicate significant difference (p < 0.05); ND: No detection.
Table 7.
Evolution of LPF C-Gly content during in vitro digestion.
| Compound | Phase (Content mg/g) | |||
| Firsthand | Oral cavity | Stomach | Intestinum | |
| Lu 6-pen-8-glu | 13.31±0.92a | 11.58±1.05a | 11.60±0.01a | 11.16±0.24a |
| Chr 6-pen-8-hex | 29.55±2.63a | 22.98±5.43b | 23.47±1.10b | 23.50±2.12b |
| Lu 6-glu-8-pen | 21.42±2.41a | 15.56±4.95b | 13.83±1.54b | 15.18±3.2b |
| Ap 6-glu-8-xyl | 13.12±1.86a | 11.41±1.28b | 11.12±0.4b | 11.93±0.32b |
| Ap 6-xyl-8-glu | 45.56±3.79a | 34.92±9.00b | 34.05±2.58b | 33.64±5.64b |
| Sc | 92.65±0.45a | 77.53±27.78b | 75.31±7.24b | 75.40±13.45b |
| Ior | 144.23±5.27a | 101.54±30.27b | 90.72±7.50b | 93.16±13.37b |
| Or | 23.85±5.73a | 17.90±1.41b | 18.04±0.78b | 17.87±1.92b |
| Isc | 45.12±0.86a | 31.24±10.92b | 33.38±1.59b | 33.02±6.26b |
| Ap 6-glu-8-rha | 45.48±6.16a | 33.89±8.23b | 30.85±0.87b | 31.54±5.91b |
| Total | 474.29±74.57a | 358.56±26.44b | 344.53±18.70c | 346.40±40.54c |
Note: Different letters in the same line indicate significant difference (p < 0.05).
Table 8.
Evolution of LFF content during in vitro fermentation.
| Compound | Phase (Content mg/g) | ||||
| 0h | 6h | 12h | 24h | 48h | |
| Qu 3- ara (1→2) gal | 32.76±6.32a | 28.27±4.65ab | 17.55±3.36b | 17.27±6.32b | 10.60±3.03c |
| Qu 3- rha (1→2) glu | 9.84±2.01 | ND | ND | ND | ND |
| IQ | 16.77±3.02a | 12.12±1.20ab | 4.54±0.63c | 6.83±2.31c | 3.67±1.21cd |
| Qu 3-glu | 282.23±32.36a | 139.56±14.56b | 72.97±6.99c | 94.77±5.21c | 9.88±2.51d |
| Ka 3-gal | 10.68±2.14a | 9.82±1.58a | 2.28±0.45b | 2.40±1.01b | 2.68±0.59b |
| Ka 3-glu | 12.38±1.59a | 9.80±3.26ab | 2.11±0.65c | 2.98±0.84c | 4.30±1.24c |
| Ka 3-gln | 11.20±1.58a | 10.09±2.12a | 3.56±1.11b | 2.21±0.54b | 3.63±0.87b |
| Iso 3-gln | 14.17±2.55a | 10.15±1.24ab | 2.57±0.57c | 2.62±0.08c | 1.99±0.04c |
| Qu | 3.26±0.24c | 3.91±0.84c | 29.53±2.45b | 41.87±5.98ab | 30.73±5.21ab |
| Total | 390.03±26.34a | 219.81±15.94b | 105.58±8.98c | 128.98±15.45c | 36.75±5.65d |
Note: Different letters in the same line indicate significant difference (p < 0.05); ND: No detection.
Table 9.
Evolution of LPF O-Gly content during in vitro fermentation.
| Compound | Phase (Content mg/g) | ||||
| 0h | 6h | 12h | 24h | 48h | |
| Rut | 106.23±14.84a | 73.00±4.57b | 62.013±5.24b | 68.68±6.87b | 22.62±2.48c |
| Lu 7-neo | 56.67±6.54a | 49.64±6.87ab | 34.54±4.77c | 32.12±4.54c | 14.57±3.21d |
| IQ | 59.46±6.57a | 41.44±3.54b | 29.89±3.65bc | 27.59±4.14bc | 11.62±2.51d |
| Lu 7-rut | 20.09±3.21a | 13.87±2.21b | 10.46±1.39b | 11.21±2.24b | 2.68±0.59c |
| Iso 3-rut | 31.71±3.54a | 22.92±2.24ab | 17.49±4.55bc | 18.97±3.66bc | 4.54±1.21d |
| Dio 7-rut | 14.84±2.34a | 6.64±2.21b | 1.84±0.54c | 1.48±0.05c | ND |
| Qu | 1.73±0.14c | 3.70±1.14c | 11.86±2.21bc | 11.64±1.14bc | 14.41±2.57a |
| Total | 289.00±14.51a | 207.51±9.87ab | 156.233±6.54bc | 160.05±8.84bc | 56.03±4.89d |
Note: Different letters in the same line indicate significant difference (p < 0.05); ND: No detection.
Table 10.
Evolution of LPF C-Gly content during in vitro fermentation.
| Compound | Phase (Content mg/g) | ||||
| 0h | 6h | 12h | 24h | 48h | |
| Lu 6-pen-8-glu | 5.51±2.14a | 5.15±1.24a | 3.38±1.47ab | 3.08±1.54ab | 2.39±0.47bc |
| Chr 6-pen-8-hex | 18.94±5.47a | 19.59±5.47a | 20.029±4.14a | 14.88±3.44b | 16.74±4.47ab |
| Lu 6-glu-8-pen | 9.12±2.47a | 10.41±3.24a | 8.94±2.14ab | 9.03±2.44a | 6.37±2.54bc |
| Ap 6-glu-8-xyl | 8.88±2.45a | 10.55±2.55a | 9.48±2.41a | 7.26±1.47ab | 7.24±.31ab |
| Ap 6-xyl-8-glu | 29.70±6.87a | 29.44±6.54a | 26.80±4.87a | 23.64±4.58ab | 20.41±6.57bc |
| Sc | 59.50±10.54a | 59.80±11.23a | 64.46±12.14a | 56.21±10.24ab | 57.91±9.87ab |
| Ior | 92.37±15.15a | 82.97±11.21ab | 86.60±9.23ab | 98.11±14.55a | 92.55±11.25a |
| Or | 12.029±2.34a | 11.20±3.21a | 10.28±3.54a | 8.78±2.69a | 10.70±3.51a |
| Isc | 28.79±6.55ab | 32.71±3.65a | 32.27±5.47a | 28.97±6.88ab | 26.54±7.21ab |
| Ap 6-glu-8-rha | 23.42±7.27a | 20.50±5.66a | 20.33±6.36a | 20.58±4.14a | 16.25±4.57b |
| Total | 288.26±21.54a | 282.32±24.31a | 262.27±21.9c | 270.54±17.4b | 257.10±15.48c |
Note: Different letters in the same line indicate significant difference (p < 0.05).
Table 11.
Identification of metabolites of LLF in plasma and urine.
| NO | tR/min | [M-H]- /[M+H]+ |
PPM | Fragment ions (m/z) |
Mode | Formula | Transformations | Location | |
| P | U | ||||||||
| 1 | 1.195 | 477.066 | 1.41 | 301.034 151.002 |
Neg | C21H18O13 | Glucuronide Conjugation | - | + |
| 2 | 1.236 | 318.073 | -0.12 | Neg | C16H14O7 | Reduction, Methylation |
+ | - | |
| 3 | 1.336 | 491.082 | -1.63 | 315.050 151.002 |
Neg | C21H16O14 | Methylation | - | + |
| 4 | 6.286 | 653.098 | -1.87 | 477.0666 301.034 |
Neg | C27H26O19 | Glucuronide Conjugation | - | + |
| 5 | 6.299 | 653.098 | -0.85 | 477.066 301.034 |
Neg | C21H18O13 | Glucuronide Conjugation | - | + |
| 6 | 7.092 | 301.030 | -0.97 | 153.017 | Pos | C15H8O7 | Dehydration, Reduction, Methylation | - | + |
| 7 | 7.220 | 301.070 | -1.29 | 153.017 | Pos | C15H8O7 | Dehydration, Reduction, Methylation | - | + |
| 8 | 8.298 | 315.051 | -2.60 | 300.027 151.002 |
Neg | C16H12O7 | Methylation | - | + |
| 9 | 11.007 | 315.050 | -1.05 | 300.027 151.002 |
Neg | C16H12O7 | Methylation | + | |
| 10 | 11.762 | 315.050 | -4.18 | 300.026 151.002 |
Neg | C16H12O7 | Methylation | - | + |
| 11 | 14.374 | 313.237 | -0.12 | Neg | C15H6O8 | Desatyration, Methylation | - | + | |
| 12 | 14.417 | 315.253 | -0.34 | 300.027 | Neg | C16H12O7 | Methylation | - | + |
| 13 | 16.088 | 315.253 | -1.07 | 300.026 | Neg | C16H8O7 | Methylation | + | + |
| 14 | 18.198 | 315.050 | -1.37 | 300.027, 151.002 |
Neg | C16H8O7 | Methylation | + | + |
| 15 | 19.139 | 315.253 | -1.16 | 300.027 | Neg | C16H10O8 | Methylation | + | + |
| 16 | 32.294 | 315.050 | -1.98 | 300.027 151.002 |
Neg | C21H20O12 | Methylation | - | + |
Note: P: plasma, U: urine. “+”, detected; “-”, undetected. LFF: Lotus leaves flavonoids.
Table 12.
Identification of metabolites of LPF O-Gly in plasma and urine.
| NO | tR/min | [M-H]- /[M+H]+ |
PPM | Fragment ions (m/z) |
Mode | Formula | Transformations | Location | |
| P | U | ||||||||
| 1 | 1.325 | 145.049 | -0.88 | Neg | C6H8O4 | Hydration, Desaturation |
- | + | |
| 2 | 1.432 | 195.050 | -3.99 | Neg | C17H14O10 | Dioxidation, | - | + | |
| 3 | 4.197 | 187.006 | -4.94 | Neg | C8H12O7 | Dehydration, Acetylation |
- | + | |
| 4 | 4.797 | 129.054 | -0.40 | Neg | C6H8O3 | Didehydration | - | + | |
| 5 | 5.935 | 461.072 | -1.07 | 151.002 | Neg | C21H18O12 | Desaturation, Glucuronide Conjugation |
+ | - |
| 6 | 8.619 | 301.069 | -1.09 | 153.017 | Pos | C16H12O8 | Dehydration, Reduction, Methylation | - | + |
| 7 | 8.717 | 285.039 | -1.16 | 151.110 | Neg | C21H18O11 | Dehydration, Reduction, |
- | + |
| 8 | 8.989 | 307.118 | -2.78 | Neg | C12H20O9 | Dehydration, Glucoside Conjugation | - | + | |
| 9 | 14.797 | 315.253 | -1.16 | 300.027 | Neg | C16H12O6 | Methylation | + | |
| 10 | 15.238 | 477.277 | -0.77 | 151.075 | Neg | C21H18O13 | Glucuronide Conjugation | - | + |
| 11 | 16.747 | 315.253 | -0.78 | 300.026 | Neg | C16H12O6 | Methylation, | - | - |
| 12 | 29.685 | 311.108 | -0.19 | Neg | C16H8O7 | Didesaturation, Methylation |
- | + | |
| 13 | 30.535 | 286.047 | -1.80 | Neg | C15H10O6 | Dehydration, Reduction |
- | + | |
Note: P: plasma, U: urine. “+”, detected; “-”, undetected. LPF O-Gly: Lotus plumules flavonoid O- glycosides.
Table 13.
Identification of metabolites of LPF C-Gly in plasma and urine.
| NO | tR/min | [M-H]- /[M+H]+ |
PPM | Fragment ions (m/z) |
Mode | Formula | Transformations | Location | |
| P | U | ||||||||
| 1 | 1.144 | 563.147 | -0.59 | 503.309 | Neg | C26H8O14 | - | + | |
| 2 | 1.801 | 563.147 | -1.63 | 503.309 | Neg | C26H8O14 | - | + | |
| 3 | 1.823 | 447.092 | -2.30 | 357.736 | Neg | C21H20O11 | + | ||
| 4 | 1.981 | 563.147 | 4.02 | 503.309 | Neg | C26H8O14 | - | + | |
| 5 | 1.994 | 447.106 | -4.19 | 357.736 | Neg | C22H22O10 | + | - | |
| 6 | 2.329 | 445.253 | -1.49 | 357.736 | Neg | C22H22O10 | Dehydration, Reduction, Methylation |
+ | - |
| 7 | 29.947 | 491.119 | -0.61 | Neg | C23H24O12 | Reduction, Acetylation |
+ | - | |
| 8 | 30.281 | 491.119 | -0.42 | Neg | C23H24O12 | Reduction, Acetylation |
+ | - | |
Note: P: plasma, U: urine. “+”, detected; “-”, undetected. LPF O-Gly: Lotus plumules flavonoid C-glycosid.
Disclaimer/Publisher’s Note: The statements, opinions and data contained in all publications are solely those of the individual author(s) and contributor(s) and not of MDPI and/or the editor(s). MDPI and/or the editor(s) disclaim responsibility for any injury to people or property resulting from any ideas, methods, instructions or products referred to in the content. |
© 2025 by the authors. Licensee MDPI, Basel, Switzerland. This article is an open access article distributed under the terms and conditions of the Creative Commons Attribution (CC BY) license (http://creativecommons.org/licenses/by/4.0/).
Copyright: This open access article is published under a Creative Commons CC BY 4.0 license, which permit the free download, distribution, and reuse, provided that the author and preprint are cited in any reuse.


