Submitted:
22 April 2025
Posted:
23 April 2025
You are already at the latest version
Abstract
This paper introduces the total Stock Internal Rate of Return Including Price Appreciation (SIRRIPA), a new, comprehensive metric for equity valuation derived from the Potential Payback Period (PPP) methodology. SIRRIPA consolidates the present value of future earnings and capital appreciation into a single, annualized return figure. Conceptually and mathematically, SIRRIPA plays for equities the same role that Yield to Maturity (YTM) plays for bonds. While YTM discounts future coupon payments and face value to equate them with the bond's current price, SIRRIPA applies the same principle to earnings per share (EPS) and an expected exit price. This unified return metric represents a groundbreaking cross-asset tool, enabling direct and consistent comparisons between stocks and bonds, and supporting more coherent portfolio strategies and efficient capital allocation.
Keywords:
SIRRIPA
; Potential Payback Period (PPP)
; Stock Internal Rate of Return
; Equity Valuation
; Cross-Asset Valuation
; Yield to Maturity (YTM)
; Intrinsic Value
1. Introduction
Traditional valuation metrics such as the Price/Earnings (P/E) ratio or the PEG ratio have long served as heuristics for assessing the attractiveness of equities. However, these metrics lack the depth needed for a forward-looking and time-sensitive analysis. They fail to capture the time value of money, ignore differences in earnings growth and risk, and offer no direct comparability with fixed-income metrics such as the Yield to Maturity (YTM).
The Potential Payback Period (PPP) methodology was developed to address these gaps by measuring how many years of future, discounted earnings it would take to recover the current price of a stock. Building on the PPP framework, this paper proposes a unified annualized return metric — the total Stock Internal Rate of Return Including Price Appreciation (SIRRIPA) — which includes both the recovery of investment through earnings and price appreciation realized at exit. It serves as a true counterpart to the YTM used in bond markets.
What makes SIRRIPA groundbreaking is not only its conceptual clarity but also its operational simplicity. It is computed using just three basic and widely available financial inputs:
- The Price-to-Earnings (P/E) ratio
- The expected earnings growth rate g
- The discount rate r, typically derived from the Capital Asset Pricing Model (CAPM).
These inputs are readily available from most financial data platforms. Once combined through the PPP framework, they yield a powerful, forward-looking metric directly comparable to a bond’s YTM — enabling consistent valuation logic across asset classes.
2. Theoretical Foundation
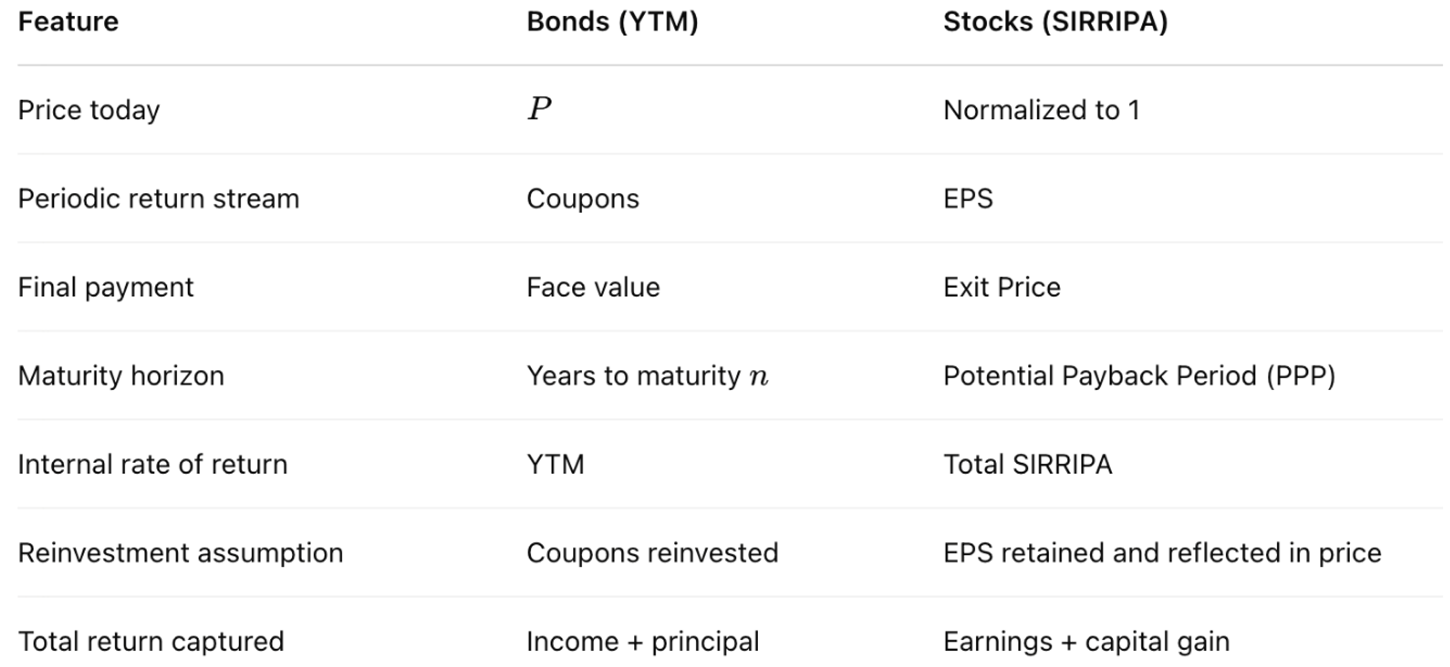
2.1. Yield to Maturity (YTM) for Bonds
The Yield to Maturity (YTM) is the internal rate of return that equates a bond’s current market price to the present value of its future coupon payments and face value:
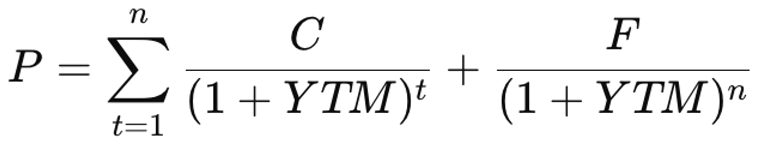 where:
- PPP: Bond price
- CCC: Coupon payment
- FFF: Face value at maturity
- n: Years to maturity
YTM reflects both income and capital gain/loss, assuming reinvestment of coupons at the same rate.
2.2. Potential Payback Period (PPP) for Stocks
For stocks, the PPP answers the question: How many years of discounted future earnings are needed to recover the price paid today?
Assuming a normalized stock price P = 1, the PPP satisfies:
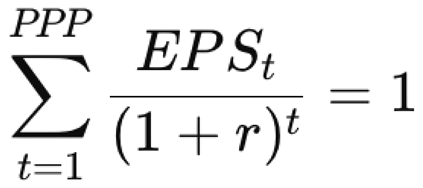
This calculation treats EPS as a proxy for recoverable value and assumes future earnings are discounted at a rate r that reflects risk, typically based on CAPM.
3. Derivation of the Total SIRRIPA
To obtain an annualized return equivalent to YTM, we extend the PPP structure to include capital appreciation, yielding the total SIRRIPA.
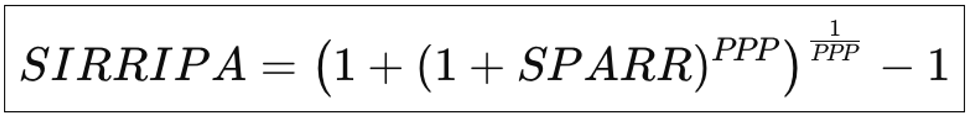
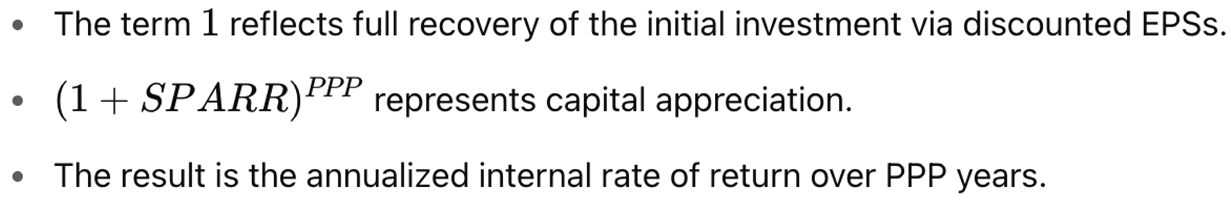
3.1. SIRRIPA Using SPARR
Let SPARR represent the Stock Price Appreciation Rate of Return, i.e., the annualized rate at which the stock price grows from today’s price to its Exit Price at the end of PPP. Then:
3.2. SIRRIPA Using Discounted Exit Price
Alternatively, using the present value of the Exit Price:
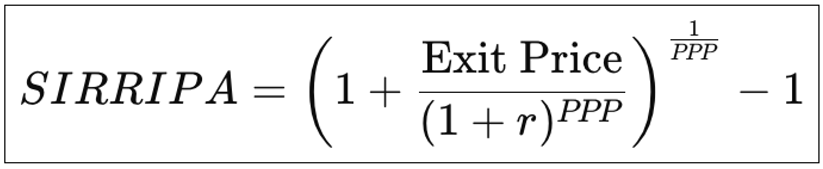
This version avoids estimating SPARR and uses a known or assumed Exit Price discounted at rate r.
4. Robustness and Realism of the Exit Price in SIRRIPA
Traditional valuation models struggle to justify or estimate a realistic exit price. The SIRRIPA framework overcomes this challenge by making two market-based and internally consistent assumptions:
4.1. Growth Decline from g to r
It assumes a linear decline in earnings growth from the initial rate g to the discount rate r over the PPP period. This reflects the inevitable corporate maturation process:
- No company sustains high growth indefinitely.
- Market saturation, competition, and scalability limits eventually slow growth.
- A linear trajectory is both realistic and mathematically consistent with the PPP model.
4.2. Exit P/E Equals PPP
The Exit P/E ratio is assumed to equal the PPP itself:

This is justified because, as the earnings growth rate g declines and ultimately converges with the discount rate r, the Potential Payback Period (PPP) approaches a stable equilibrium value. In this limiting case, the PPP formula becomes mathematically equivalent to the traditional Price-to-Earnings (P/E) ratio. This convergence — demonstrated through L’Hôpital’s Rule — shows that PPP reflects a mature valuation state consistent with fundamental principles of present value. Therefore, using PPP as the Exit P/E ratio ensures the model remains self-contained, analytically consistent, and grounded in long-term economic behavior.
5. Earnings Per Share vs. Coupons: A Theoretical Reconciliation
Though EPS is often not distributed, it is economically equivalent to a bond’s coupon for valuation purposes. Shareholders own the earnings, and even if retained, they increase firm value through reinvestment — just as reinvested coupons enhance bond value in YTM calculations.
SIRRIPA treats the stream of earnings as recovering the initial price, while capital appreciation through the Exit Price delivers excess return — again, analogous to the coupon-plus-principal structure of a bond.
Empirically, high-growth firms like Amazon, Alphabet, and Tesla often retain all earnings yet trade at high valuations. The market clearly recognizes and prices retained earnings as value, justifying their inclusion in a total return calculation like SIRRIPA.
6. Structural Comparison: SIRRIPA vs. YTM
7. Case Study: Applying SIRRIPA to NVIDIA Stock
To demonstrate the practical application of the SIRRIPA methodology, we analyze NVIDIA stock using real-world inputs and the Potential Payback Period (PPP) framework.
7.1. Data as of April 17, 2025
- -
- Stock Price: $101.49
- -
- P/E Ratio: 34.52
- -
- Expected Earnings Growth Rate (g): 40%
- -
- Risk-Free Rate (rf): 4.33% (10-year U.S. Treasury yield)
- -
- Expected Market Risk Premium (rm): 3.00%
- -
- Beta (β): 1.96
7.2. CAPM-Based Discount Rate
Using the Capital Asset Pricing Model (CAPM), the appropriate discount rate for NVIDIA is:
r = rf + (β x rm) = 4.33% + (1.96 x 3.00%) = 10.21%
This rate reflects the return required by investors given NVIDIA’s systematic risk profile.
7.3. PPP-Derived Metrics
Using the above inputs and the SIRRIPA methodology:
- -
- PPP (calculated from the P/E ratio, growth rate, and discount rate) = 13.68 years
- -
- SIRR (representing the compound return from earnings alone, based on the Doubling Formula) = 5.20%
- -
- SPARR (derived from the projected exit price at the end of the PPP period, discounted back to present) = 6.09%
- -
- SIRRIPA (total return metric, incorporating both discounted future earnings and capital appreciation) = 8.99%
- -
- SRP (Stock Risk Premium) = SIRRIPA – Risk-Free Rate = 8.99% – 4.33% = 4.66%.
7.4. Interpretation
An SRP of 4.66% is significant under current market conditions. It suggests that NVIDIA, despite a P/E of 34.52 and a relatively high discount rate, offers a robust risk-adjusted return above the Treasury benchmark. This implies:
- -
- The market may be undervaluing NVIDIA’s future earning power.
- -
- The stock still offers attractive long-term value when measured against its risk profile.
Moreover, the ability to derive all these metrics from only three input variables (P/E, g, and r) highlights the elegance and practicality of the SIRRIPA framework. It delivers a clear, unified view of equity return potential that mirrors the precision of bond YTM models.
8. Cross-Asset Applications
SIRRIPA has far-reaching implications for investors, analysts, and portfolio managers:
- It enables direct comparisons between stock and bond returns on a unified, annualized basis.
- It supports efficient capital allocation by revealing risk-adjusted returns across asset classes.
- It enriches portfolio construction strategies by placing equities and fixed income on the same valuation scale.
Its minimal input requirement — just P/E, g, and r — and the transparency of its logic make SIRRIPA highly adaptable and scalable.
9. Conclusion
The total SIRRIPA completes the conceptual bridge between stock and bond valuation. It transforms the PPP methodology into a comprehensive, annualized return metric that mirrors Yield to Maturity in fixed income. By combining discounted earnings and capital appreciation in a unified framework, SIRRIPA provides a forward-looking, time-sensitive measure of a stock’s intrinsic return potential.
With its minimal data inputs and theoretical coherence, SIRRIPA offers a universal solution to the valuation asymmetry between stocks and bonds. Just as YTM revolutionized bond analysis, SIRRIPA has the potential to become the new standard in equity valuation — especially in multi-asset environments where cross-asset comparison is essential for capital efficiency and optimal risk-adjusted returns.
References
- Bodie, Z., Kane, A., & Marcus, A. J. (2013). Investments (10th ed.). McGraw-Hill. The book is a comprehensive coverage of investment theory, useful for readers to contrast traditional valuation methods with the PPP-derived SIRR.
- Damodaran, A. (2002). Investment Valuation: Tools and Techniques for Determining the Value of Any Asset. Wiley Finance. The book provides insights on valuation techniques for various asset classes, offering context for why traditional methods fall short in capturing long-term earning power.
- Fama, E. F., & French, K. R. (1993). Common Risk Factors in the Returns on Stocks and Bonds. Journal of Financial Economics, 33 (1), 3-56. The article examines the risk factors influencing returns in stocks and bonds, relevant for understanding the importance of risk-adjusted metrics in investment evaluation. [CrossRef]
- Graham, B., & Dodd, D. (1934). Security Analysis. McGraw-Hill. The book represents the classic text on value investing that underscores the importance of intrinsic value, a concept integral to the PPP-derived SIRR’s focus on earning power.
- Kobiyh, M., El Amri, A., Oulfarsi, S., & Hilmi, Y. (2023). Behavioral finance and the imperative to rethink market efficiency. Financial Markets, Institutions and Risks, Volume 7, Issue 4. [CrossRef]
- Modigliani, F., & Miller, M. H. (1958). The Cost of Capital, Corporation Finance, and the Theory of Investment. The American Economic Review, 48(3), 261-297. The article represents a foundational work in financial theory, highlighting the impactof capital costs on corporate finance decisions, relevant to the discussion of discount rates in PPP and SIRR.
- Sam, R. (1984). "Le PER, un instrument mal adapté à la gestion mondiale des portefeuilles. Comment remédier à ses lacunes". Revue Analyse Financière publiée par la Société Française des Analystes Financiers (SFAF), 2ème trimestre 1984. The article critiques the P/E ratio’s effectiveness in global portfolio management and advocates for the adoption of the "Délai de Recouvrement (DR)" or "Payback.
- Period (PP)" as a more robust and adaptable evaluation tool. This article is part of a set of three articles written by Rainsy Sam in the 1980s that laid the foundation for the Potential Payback Period (PPP).
- Sam, R. (1985). Le Délai de Recouvrement (DR). Revue Analyse Financière, 3ème trimestre 1985. The article, which refines the concept of the DR (or PP), is part of a set of three articles written by Rainsy Sam in the 1980s that laid the foundation for the Potential Payback Period (PPP).
- Sam, R. (1988). Le DR confronté à la réalité des marchés financiers. Revue Analyse Financière, 4ème trimestre 1988. The article, which demonstrates the first applications of the DR (or PP) to portfolio management, is part of a set of three articles written by Rainsy Sam in the 1980s that laid the foundation for the Potential Payback Period(PPP).
- Sam, R. (2024). Stock Evaluation: Discovering the Potential Payback Period (PPP) as a Dynamic P/E Ratio. The website is a specialized platform dedicated to financial analysis, focusing on the Potential Payback Period (PPP) and its innovative application in deriving the Stock Internal Rate of Return (SIRR). It serves as both an educational and practical resource for investors, academics, and finance professionals interested in modern stock and bond valuation methodologies.
- Sam, R. (2025). "Le Potential Payback Period (PPP) : Une Généralisation Utile du Price Earnings Ratio (PER) Pour l’Evaluation des Actions". Revue Française d’Economie et de Gestion, "Volume 1 : Numéro 2" pp 621-632. Février 2025.
- Sam, R. (2025). "Le Potential Payback Period (PPP) : La Septième Révolution Financière". Revue Française d’Économie et de Gestion, "Volume 6 : Numéro 2" pp : 594- 620. Mars 2025.
- Sam, R. (2025). "Anatomy of a Looming Bear Market: How to Assess the Impact of Donald Trump’s Chaotic Measures on Wall Street". Revue Française d’Économie et de Gestion, "Volume 6 : Numéro 3" pp : 550- 560. Mars 2025.Sam, R. (2025). "Comparing Global Stock Markets Using Risk-Premiums Derived from the Potential Payback Period (PPP)". Revue Française d’Économie et de Gestion, "Volume 6 : Numéro 3" pp : 541- 549. Mars 2025.
- Sam, R. (2025). "Analyse Financière: Le Potential Payback Period (PPP), une alternative au Price Earnings Ratio pour évaluer les entreprises temporairement déficitaires – Etude de cas : Intel Corp.". Revue Française d’Économie et de Gestion, "Volume 6 : Numéro 3" pp : 561- 576. Mars 2025.
- Sharpe, W. F. (1964). Capital Asset Prices: A Theory of Market Equilibrium under Conditions of Risk. The Journal of Finance, 19(3), 425-442. The article introduces the Capital Asset Pricing Model (CAPM), which informs the risk adjustments in the PPP-derived SIRR. [CrossRef]
Disclaimer/Publisher’s Note: The statements, opinions and data contained in all publications are solely those of the individual author(s) and contributor(s) and not of MDPI and/or the editor(s). MDPI and/or the editor(s) disclaim responsibility for any injury to people or property resulting from any ideas, methods, instructions or products referred to in the content. |
© 2025 by the authors. Licensee MDPI, Basel, Switzerland. This article is an open access article distributed under the terms and conditions of the Creative Commons Attribution (CC BY) license (http://creativecommons.org/licenses/by/4.0/).
Copyright: This open access article is published under a Creative Commons CC BY 4.0 license, which permit the free download, distribution, and reuse, provided that the author and preprint are cited in any reuse.


