Submitted:
14 April 2025
Posted:
15 April 2025
You are already at the latest version
Abstract
The Price-to-Earnings (P/E) ratio, though widely used in stock valuation, suffers from significant limitations: it is static, backward-looking, and fails to account for critical variables such as earnings growth, risk, and the time value of money. This paper introduces a new and robust alternative — the Stock Internal Rate of Return Including Price Appreciation (SIRRIPA). Derived from a refined version of the P/E ratio called the Potential Payback Period (PPP), SIRRIPA integrates both earnings accumulation and capital appreciation over time, expressed as a forward-looking, risk-adjusted, compound annual return. It is directly comparable to a bond’s Yield to Maturity (YTM), enabling a unified and rational framework for cross-asset valuation. Grounded in financial theory and supported by intuitive formulas, SIRRIPA offers investors and analysts a superior metric for assessing the intrinsic value and total return potential of equity investments.
Keywords:
Stock valuation
; Potential Payback Period
; SIRRIPA
; P/E ratio
; Yield to Maturity
; Earnings growth
; Discount rate
; Intrinsic value
; Cross-asset comparison
1. Introduction
The Stock Internal Rate of Return Including Price Appreciation (SIRRIPA) is a powerful indicator that offers a multidimensional and dynamic assessment of a stock’s value by integrating earnings growth, cost of capital, and risk — placing it far beyond the traditional P/E ratio in terms of data coverage and accuracy. Expressed as an annualized total return rate — combining earnings accumulation and price appreciation — and directly comparable to bond yields, it is set to revolutionize portfolio management.
This innovative tool allows investors, analysts, and portfolio managers to rigorously compute the total annualized return of any stock using just three basic financial inputs:
- The Price-to-Earnings (P/E) ratio
- The expected earnings growth rate (g)
- The discount rate (r) — derived from the Capital Asset Pricing Model (CAPM), based on the risk-free rate, the market risk premium, and the stock’s beta.
These inputs are readily available from most financial data platforms. Combined through the SIRRIPA methodology, they yield a unified, forward-looking return metric — directly comparable to a bond’s Yield to Maturity (YTM). This universality supports coherent portfolio construction, efficient capital allocation, and stronger risk-adjusted returns across asset classes.
2. The Four Core Formulas Behind SIRRIPA
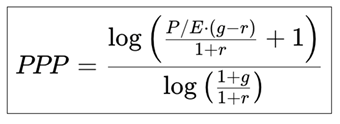
2.1. PPP – Potential Payback Period
The Potential Payback Period (PPP) expresses the number of years needed for the sum of discounted future earnings per share (EPS) to recover the current price per share (P), assuming 100% payout. It refines the traditional Price-to-Earnings (P/E) ratio by introducing growth, time discounting, and risk, making it more suitable for dynamic and real-world valuation.
2.1.a. Derivation of the PPP Formula from a Geometric EPS Sequence
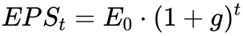
Let us assume the current stock price is normalized to 1 (i.e., P = 1), and the current EPS is E0. Under full payout and compound growth, the EPS in year t becomes:
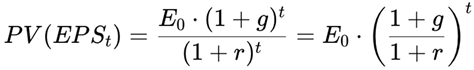
The present value (PV) of each year's EPS (discounted at rate r) is:
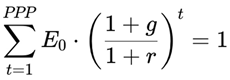
The sum of discounted EPSs over the PPP period (from t = 1 to t = PPP) must equal the stock price P = 1. Therefore:

2.1.b. Final PPP Formula
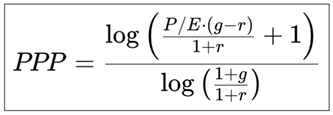
Where:
- P/E = Price-to-Earnings ratio
- g = Expected earnings growth rate (average if declining)
- r = Discount rate (typically CAPM-based).
This formula provides a forward-looking, realistic measure of the time needed to recover a stock’s price through discounted future earnings.
2.1.1. PPP as a Generalization of the P/E Ratio
This formula reveals a key breakthrough: the PPP is not just an alternative to the P/E ratio — it is its generalization.
In a hypothetical, static world where:
- Earnings do not grow (g = 0)
- Time has no cost (r = 0)
- Risk is ignored (as r carries no premium).
… the PPP formula simplifies to: PPP = P/E
This limiting case proves that the Price-to-Earnings ratio is merely a special case of the PPP — one that ignores the essential real-world dynamics of growth, discounting, and risk.
By contrast, the PPP explicitly incorporates:
- Earnings growth (g)
- Discount rate and time value of money (r)
- Risk via the CAPM-derived rate.
Conclusion: The PPP is a more complete, more realistic, and more relevant tool than the P/E ratio — especially in a modern, forward-looking investment framework. It retains the intuitive simplicity of “years to recover the investment,” but upgrades the concept by rooting it in sound financial principles. This makes the PPP indisputably better suited for real-world valuation.
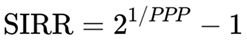
2.2. SIRR – Stock Internal Rate of Return (Earnings Component Alone)
The Stock Internal Rate of Return (SIRR) measures the internal rate of return generated solely by the reinvested earnings over the PPP horizon. It captures the earnings power of a stock and is calculated using the Doubling Formula, which assumes that the present value of earnings exactly recovers the investment (P = 1) over the PPP.
Formula:
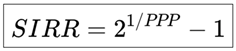
The SIRR represents the annualized return that doubles the investment value over the PPP horizon, using only the earnings stream. It provides a fast and practical estimate of the internal return from earnings alone.
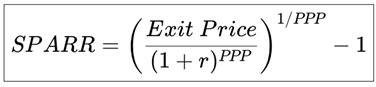
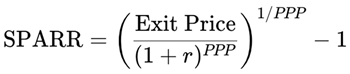
2.3. SPARR – Stock Price Appreciation Rate of Return (Capital Gain Component)
The Stock Price Appreciation Rate of Return (SPARR) captures the second component of total return: the expected capital gain over the PPP horizon.
To estimate SPARR, we first calculate the expected stock price at the end of the PPP period — the Exit Price.
2.3.a. Exit Price Calculation:
- Estimate the future EPS using a growth rate that linearly declines from g to r.
- Use a terminal P/E ratio equal to PPP (see next sub-section for justification).

Then discount this future Exit Price to the present to calculate the implied capital gain.
2.3.b. SPARR Formula:
2.3.1. Why the Terminal P/E Ratio Equals the PPP
This assumption ensures full internal consistency between the earnings recovery horizon and the terminal valuation.
From the PPP formula:
As g → r, both numerator and denominator tend toward zero. Applying L’Hôpital’s Rule:
Differentiate numerator and denominator with respect to g, and evaluate the limit:
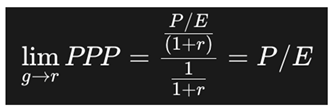
This confirms mathematically that PPP equals the P/E ratio when the earnings growth rate equals the discount rate.
This proves that, at maturity, when the company’s growth rate stabilizes at the discount rate, the terminal P/E ratio equals the PPP. This anchors the exit valuation to the same conceptual base as the time horizon of recovery, completing a coherent valuation loop.
2.4. SIRRIPA – Stock Internal Rate of Return Including Price Appreciation
The SIRRIPA combines both return components — SIRR (from earnings) and SPARR (from capital gain) — into a single, comprehensive total return metric. It is directly comparable to a bond’s Yield to Maturity (YTM).
2.4.1. General Formula
SIRRIPA represents the total internal rate of return from holding a stock, capturing both:
- The accumulated earnings over the holding period
- The capital gain from price appreciation at the end of the PPP horizon.
It unifies the two key components derived earlier:
- SIRR (Stock Internal Rate of Return): The internal rate of return generated from earnings alone over the PPP period
- SPARR (Stock Price Appreciation Rate of Return): The internal rate of return associated with the expected capital gain, assuming the stock is sold at the end of the PPP period.
Since these two components compound over time, they are not simply additive. To integrate them in a financially sound way, we apply a compounding framework, leading to the foundational formula:

Substitution Using SPARR
From the earlier definition:
Then:
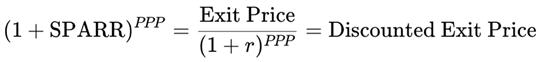
Substituting this into the general SIRRIPA equation:

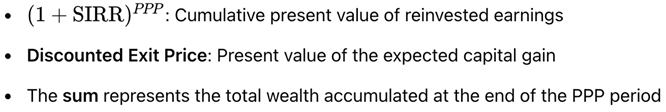
Interpretation of the Components
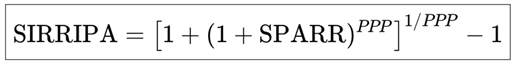
Final Rearranged Formula
We isolate SIRRIPA to obtain:

This equation shows that SIRRIPA is the compound annual growth rate that equates the present price of a stock investment (normalized to P = 1) with its total expected cash flows over the PPP period, consisting of both earnings and capital gain.
With its dual structure — earnings and price appreciation — SIRRIPA becomes a comprehensive, risk-adjusted, annualized return metric, fully comparable to a bond’s Yield to Maturity (YTM), which similarly captures periodic income (coupons) plus final redemption value.
2.4.2. Specific Formula When SIRR Is Computed Using the Doubling Formula
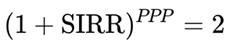
In calculating SIRRIPA, the Doubling Formula offers a powerful and intuitive shortcut to estimate the total return from earnings accumulation. It is based on the principle that over the Potential Payback Period (PPP), the present value of reinvested earnings doubles the initial investment value:
This means the accumulated earnings alone grow the value from 1 to 2 over the PPP.
Since:
We can substitute this directly into the general SIRRIPA formula:
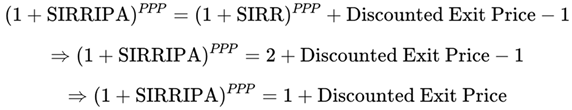
Taking the PPP-th root of both sides and solving for SIRRIPA:
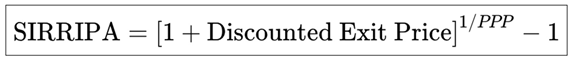
Now recall the definition of SPARR, which expresses the price appreciation return:
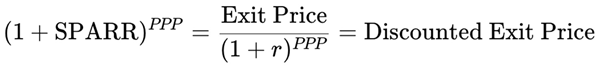
So we can rewrite the SIRRIPA formula in its fully compact form:
Key Insight
This elegant formulation shows how SIRRIPA builds on the Doubling Formula by combining:
- The doubling of value through reinvested earnings
- The discounted capital gain from the Exit Price
This simplified version highlights how SIRRIPA builds directly on the Doubling Formula — by adding the discounted capital gain to the doubling of value through earnings. The result is a comprehensive, forward-looking return measure, fully comparable to the Yield to Maturity (YTM) of a bond.
2.4.3. Caution and Realism in Assumptions
The SIRRIPA framework stands out not only for its analytical depth but also for its prudently grounded assumptions. The projected earnings growth rate g used in the PPP and SIRRIPA calculation is not constant, but rather assumed to decline linearly over time, eventually converging to the discount rate r. This reflects the real-world lifecycle of companies, where high early-stage growth inevitably moderates as the business matures.
Similarly, the exit P/E ratio is set equal to the PPP — which, by design, decreases when growth slows or risk increases. This avoids optimistic valuation multiples and ensures that future price expectations are consistent with a company’s long-term earning power.
Such conservatism is justified, as overreliance on persistently high growth or inflated multiples leads to valuation errors and poor investment outcomes. By contrast, SIRRIPA offers a sober and internally consistent projection, grounded in a realistic appreciation of market dynamics, mean reversion, and maturity curves.
3. Anchoring Valuation to a Universal Benchmark: The Risk-Free Rate
With SIRRIPA, the valuation of both stocks and bonds revolves around a shared, objective benchmark: the risk-free rate, typically represented by the 10-year U.S. Treasury yield.
What’s groundbreaking is not just the return metric, but the valuation framework:
SIRRIPA applies the same discounting principle to stocks that is used in bond pricing — thus creating a unified model of asset valuation.
This framework is validated by how capital flows naturally between stocks and bonds in response to shifting return expectations.
It enables:
- Rational comparisons across asset classes
- Consistent benchmarking of expected returns
- More integrated and objective portfolio allocation.
4. Why SIRRIPA Can Be Directly Compared to the Yield to Maturity (YTM) of a Bond
Both SIRRIPA and YTM are:
- Forward-looking,
- Risk-adjusted,
- Compound annualized measures of return
- Based on current price and the present value of future cash flows
- YTM expresses the total return from a bond’s coupons and final redemption value
- SIRRIPA expresses the total return from a stock’s earnings stream and capital appreciation.
As such, SIRRIPA functions as the equity-market equivalent of YTM, offering a powerful and rational basis for cross-asset comparison and allocation.
5. Sensitivity Analysis: Test Every Scenario
Any calculator can include sensitivity analysis features, allowing users to test variations in:
- strong>∙ Earnings growth rate g
- strong>∙ Discount rate r
- strong>∙ P/E valuation assumptions
This makes SIRRIPA not just a valuation metric, but a dynamic investment decision-support tool, especially under uncertain conditions.
6. Instant Calculation Example Using the SIRRIPA Framework
From just three basic parameters :
- Price-to-Earnings ratio (P/E)
- Expected earnings growth rate (g)
- Discount rate (r)
You can instantly calculate PPP, SIRR, SPARR, and SIRRIPA:
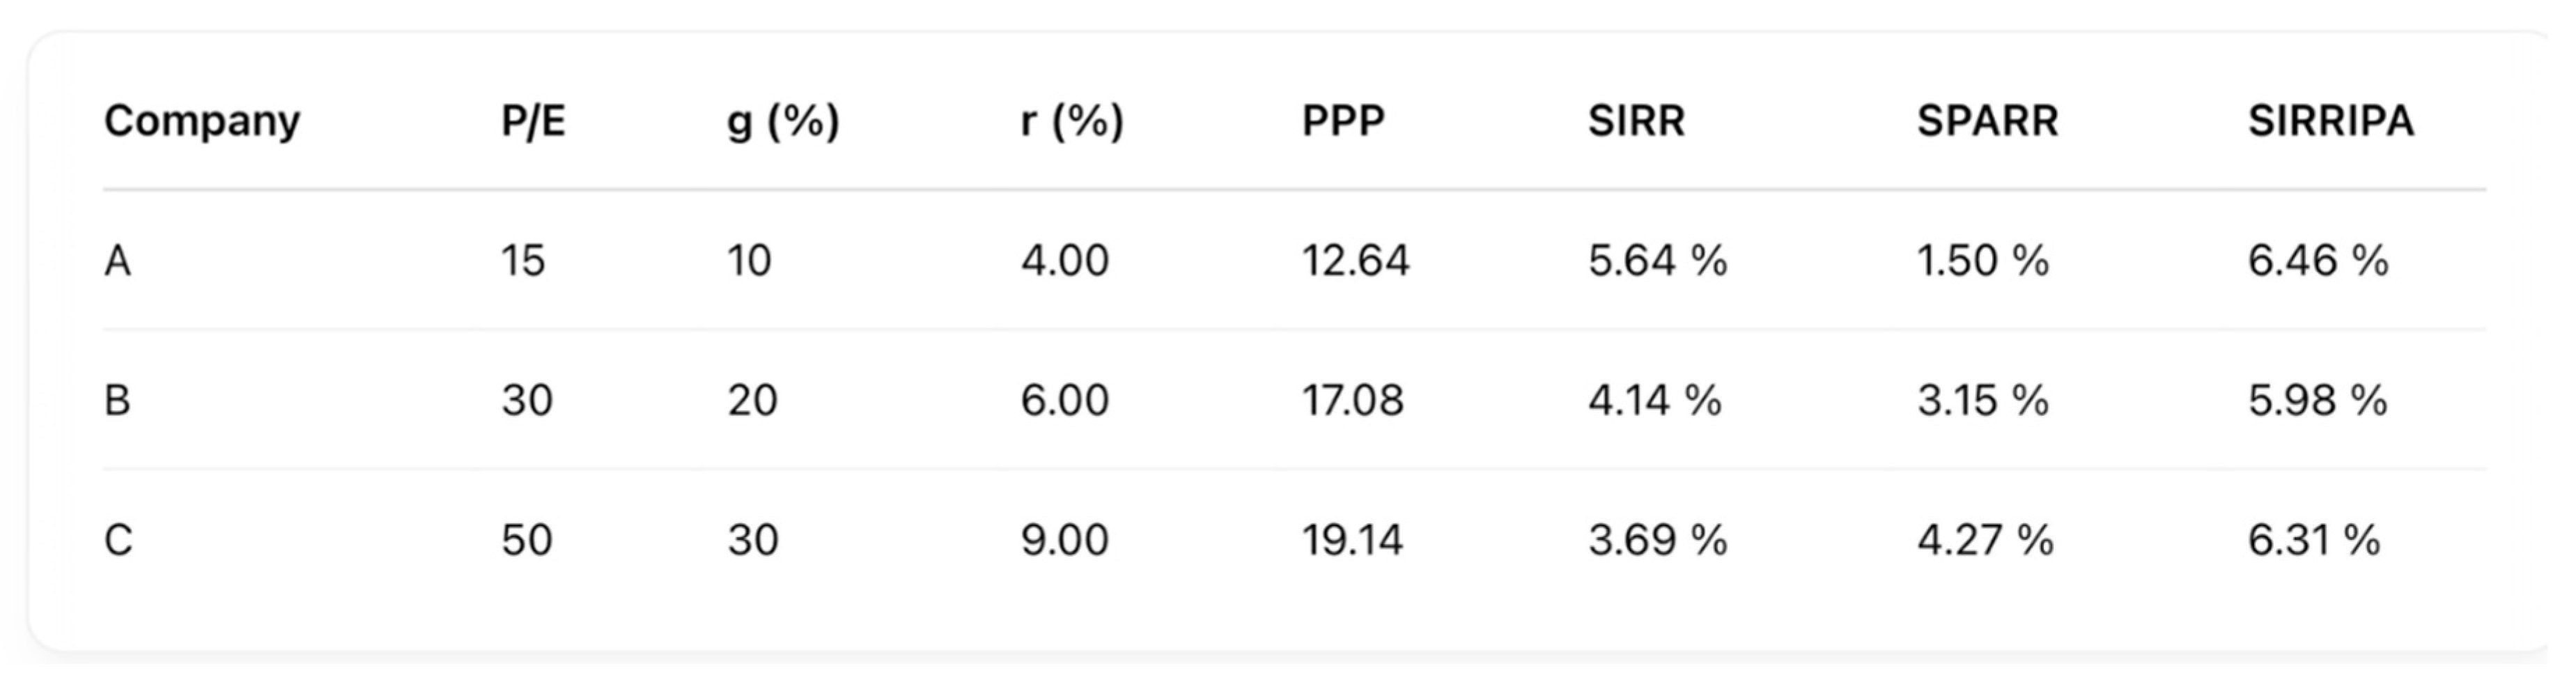
Key Insight
Even though the three A, B, C stocks show very different P/E ratios — from 15 to 50 — their SIRRIPAs all converge around 6%. This suggests that, when adjusted for growth and risk, these stocks offer similar intrinsic value.
Compared to a 4% risk-free rate, each one offers a risk-adjusted premium of about 2%. This demonstrates that the market, despite appearances, may be far more rational and efficient than simplistic metrics like the raw P/E ratio suggest.
7. Must-Have Tool for Portfolio Management
SIRRIPA equips investors to:
- Evaluate intrinsic value with theoretical and financial rigor
- Compare stock returns with bond yields on a consistent basis
- Build more rational, yield-based, cross-asset portfolios
- Anchor expectations to reality in a volatile world.
8. SIRRIPA’s Power Unlocked by Instant Calculation
SIRRIPA offers a groundbreaking alternative to the outdated P/E ratio — offering a dynamic, growth- and risk-adjusted measure of total stock return, directly comparable to bond yields.
The Price-to-Earnings ratio (P/E) has long been one of the most commonly used metrics for valuing stocks. Yet, it suffers from serious limitations: it is static, backward-looking, and ignores critical dimensions like growth, risk, and the time value of money. Despite these obvious flaws—and its potential to mislead investors—the P/E ratio has survived for so long largely because of its simplicity. It is easy to calculate and quick to interpret.
However, simplicity has come at the cost of accuracy and relevance. Today, thanks to automated, instant calculation tools, a far more precise and operational metric like the Stock Internal Rate of Return Including Price Appreciation (SIRRIPA) can finally be adopted without concern for computational complexity. With instant calculators now publicly available, investors no longer need to rely on the misleading shortcut of the P/E ratio.
You can try this free, easy-to-use, instant calculator for the SIRRIPA now:
9. Conclusion
The Stock Internal Rate of Return Including Price Appreciation (SIRRIPA) represents a significant advancement in equity valuation methodology. By integrating earnings growth, discounting, and price appreciation into a single annualized return metric, SIRRIPA extends and refines the traditional Price-to-Earnings ratio. Its comparability with the Yield to Maturity (YTM) of bonds establishes a unified framework for cross-asset valuation, enabling a consistent and rigorous approach to portfolio construction and asset allocation.
The universality of SIRRIPA lies in its ability to bridge the conceptual and analytical gap between equities and fixed-income instruments. Anchored to the risk-free rate and grounded in sound financial theory, it captures both the income-generating and capital appreciation components of stock returns in a manner analogous to bond valuation.
With the availability of automated calculation tools, the adoption of this framework becomes not only feasible but also essential. As markets evolve and demand more precise and forward-looking decision tools, SIRRIPA provides investors, analysts, and scholars with a robust, practical, and theoretically grounded metric for evaluating intrinsic value and return potential across asset classes.
References
- Bodie, Z., Kane, A., & Marcus, A. J. (2013). Investments (10th ed.). McGraw-Hill. The book is a comprehensive coverage of investment theory, useful for readers to contrast traditional valuation methods with the PPP-derived SIRR . [Google Scholar]
- Damodaran, A. (2002). Investment Valuation: Tools and Techniques for Determining the Value of Any Asset.Wiley Finance. The book provides insights on valuation techniques for various asset classes, offering context for why traditional methods fall short in capturing long-term earning power . [Google Scholar]
- Fama, E. F., & French, K. R. (1993). Common Risk Factors in the Returns on Stocks and Bonds The article examines the risk factors influencing returns in stocks and bonds, relevant for understanding the importance of risk-adjusted metrics in investment evaluation. Journal of Financial Economics, 33(1), 3–56. [Google Scholar] [CrossRef]
- Graham, B., & Dodd, D. (1934). Security Analysis The book represents the classic text on value investing that underscores the importance of intrinsic value, a concept integral to the PPP-derived SIRR’s focus on earning power. In McGraw-Hill. [Google Scholar]
- Kobiyh, M., El Amri, A., Oulfarsi, S., & Hilmi, Y. (2023). Behavioral finance and the imperative to rethink market efficiency. Financial Markets, Institutions and Risks, 7(Issue 4). [Google Scholar] [CrossRef]
- Modigliani, F., & Miller, M. H. (1958). The Cost of Capital, Corporation Finance, and the Theory of Investment The article represents a foundational work in financial theory, highlighting the impact of capital costs on corporate finance decisions, relevant to the discussion of discount rates in PPP and SIRR. The American Economic Review, 48(3), 261–297. [Google Scholar]
- Sam, R. (1984). Le P.E.R., un instrument mal adapté à la gestion mondiale des portefeuilles. Comment remédier à ses lacunes. Analyse Financière, 2 ème trimestre 1984. The article critiques the P/E ratio’s effectiveness in global portfolio management and advocates for the adoption of the "Délai de Recouvrement (DR)" or "Payback Period (PP)" as a more robust and adaptable evaluation tool. This article is part of a set of three articles written by Rainsy Sam in the 1980s that laid the foundation for the Potential Payback Period (PPP) . [Google Scholar]
- Sam, R. (1985). Le Délai de Recouvrement (DR).Analyse Financière, 3 ème trimestre 1985. The article, which refines the concept of the DR (or PP), is part of a set of three articles written by Rainsy Sam in the 1980s that laid the foundation for the Potential Payback Period (PPP) . [Google Scholar]
- Sam, R. (1988). Le DR confronté à la réalité des marchés financiers. Analyse Financière, 4 ème trimestre 1988. The article, which demonstrates the first applications of the DR (or PP) to portfolio management, is part of a set of three articles written by Rainsy Sam in the 1980s that laid the foundation for the Potential Payback Period(PPP) . [Google Scholar]
- Sam, R. (2024). Stock Evaluation: Discovering the Potential Payback Period (PPP) as a Dynamic P/E Ratio. The website is a specialized platform dedicated to financial analysis, focusing on the Potential Payback Period (PPP) and its innovative application in deriving the Stock Internal Rate of Return (SIRR). It serves as both an educational and practical resource for investors, academics, and finance professionals interested in modern stock and bond valuation methodologies . [Google Scholar]
- Sam, R. "Le Potential Payback Period (PPP) : Une Généralisation Utile du Price Earnings Ratio (PER) Pour l’Evaluation des Actions". Revue Française d’Economie et de Gestion, "Volume 1 : Numéro 2". pp 621-632 .
- Sam, R. (2025). "Le Potential Payback Period (PPP) : La Septième Révolution Financière". Revue Française d’Économie et de Gestion, "Volume 6 : Numéro 2". pp : 594- 620 . [Google Scholar]
- Sam, R. "Anatomy of a Looming Bear Market: How to Assess the Impact of Donald Trump’s Chaotic Measures on Wall Street". Revue Française d’Économie et de Gestion, "Volume 6 : Numéro 3". pp : 550- 560 .
- Sam, R. (2025). "Comparing Global Stock Markets Using Risk-Premiums Derived from the Potential Payback Period (PPP)". Revue Française d’Économie et de Gestion, "Volume 6 : Numéro 3". pp : 541- 549 . [Google Scholar]
- Sam, R. (2025). "Analyse Financière: Le Potential Payback Period (PPP), une alternative au Price Earnings Ratio pour évaluer les entreprises temporairement déficitaires – Etude de cas : Intel Corp.". Revue Française d’Économie et de Gestion, "Volume 6 : Numéro 3". pp : 561- 576 . [Google Scholar]
- Sharpe, W. F. (1964). Capital Asset Prices: A Theory of Market Equilibrium under Conditions of Risk The article introduces the Capital Asset Pricing Model (CAPM), which informs the risk adjustments in the PPP-derived SIRR. The Journal of Finance, 19(3), 425–442. [Google Scholar]
Disclaimer/Publisher’s Note: The statements, opinions and data contained in all publications are solely those of the individual author(s) and contributor(s) and not of MDPI and/or the editor(s). MDPI and/or the editor(s) disclaim responsibility for any injury to people or property resulting from any ideas, methods, instructions or products referred to in the content. |
© 2025 by the authors. Licensee MDPI, Basel, Switzerland. This article is an open access article distributed under the terms and conditions of the Creative Commons Attribution (CC BY) license (http://creativecommons.org/licenses/by/4.0/).
Copyright: This open access article is published under a Creative Commons CC BY 4.0 license, which permit the free download, distribution, and reuse, provided that the author and preprint are cited in any reuse.


