Submitted:
03 May 2025
Posted:
06 May 2025
You are already at the latest version
Abstract
Traditional valuation metrics like the Price-to-Earnings (P/E) ratio and the PEG ratio have long served as tools for assessing equity value. However, these widely used measures often overlook key financial variables such as earnings growth, discount rates, and risk. This article introduces the Potential Payback Period (PPP) as an evolution in valuation methodology — one that enhances, refines, and extends the utility of P/E and PEG ratios. By offering a time-based measure of how long it takes for a company's earnings to recover the investment, and deriving a Stock Internal Rate of Return (SIRR) from it, the PPP integrates growth and risk into a unified framework. A visual and conceptual breakthrough — the Hidden Value Zone (HVZ) — is introduced, revealing how PPP identifies undervalued high-growth stocks that traditional PEG ratios misclassify. The analysis shows how PPP provides a more dynamic, forward-looking, and theoretically grounded approach to equity valuation, making traditional ratios more relevant when used in conjunction with this enhanced model.
Keywords:
stock valuation
; price‐to‐earnings ratio (P/E)
; PEG ratio
; potential payback period (PPP)
; stock internal rate of return (SIRR)
; growth and risk adjustment
; discounted earnings
1. Introduction: Revisiting Traditional Valuation Metrics
In financial analysis, the Price-to-Earnings (P/E) ratio and the Price-to-Earnings to Growth (PEG) ratio have been longstanding reference points. The P/E ratio provides a snapshot of how much investors are willing to pay for one unit of current earnings, while the PEG attempts to adjust this by accounting for future earnings growth. These metrics are widely appreciated for their simplicity and accessibility.
Yet in today’s fast-changing economic landscape — marked by fluctuating interest rates, technological disruptions, and shifting investor expectations — the static nature of these tools can lead to oversimplification. They often fail to incorporate critical elements such as the time value of money, earnings volatility, and risk-adjusted discounting.
This article explores how the Potential Payback Period (PPP) offers a more dynamic valuation approach by extending and refining these traditional tools. Rather than dismissing the P/E and PEG ratios, the PPP builds upon them to reflect a fuller picture of corporate value creation over time.
Crucially, it introduces the concept of a Hidden Value Zone (HVZ) — a region in the P/E–growth space where high-growth companies with high P/E ratios are shown to offer compelling value when analyzed through the lens of PPP. This zone exposes the limitations of PEG’s simplistic structure and highlights the greater analytical depth provided by the PPP.
2. Understanding the Limitations of P/E and PEG
2.1. The P/E Ratio
The P/E ratio is calculated as:
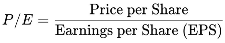
It is interpreted as the number of years it would take to recover the price paid for a stock if earnings remain constant. However, it inherently assumes:
- Zero earnings growth
- No discounting of future earnings
- Static and risk-free operating conditions.
Thus, two companies with identical P/E ratios may have vastly different investment potentials if one is growing rapidly and the other is not. The ratio gives no sense of the time frame for value recovery under realistic conditions.
2.2. The PEG Ratio
The PEG ratio is defined as:

Where g is the expected earnings growth rate.
While the PEG ratio attempts to correct the P/E by factoring in growth, it suffers from key limitations:
- Linear treatment of growth, ignoring compounding and the time value of money. This linear structure is an oversimplification of financial reality, where growth is exponential in nature and must be discounted over time.
- No consideration of interest rates or risk.
- Arbitrary “PEG = 1” threshold, with no theoretical foundation.
- Over-reliance on analyst projections for growth estimates.
In contrast, the PPP uses a logarithmic structure, which captures the compounding effects of earnings growth and the discounting of future returns. This makes it mathematically more aligned with real-world investment dynamics.
3. The Potential Payback Period (PPP): A Dynamic Adjustment
The PPP offers a time-based valuation framework that integrates earnings growth (g), interest rates (r), and risk — captured through an appropriate discount rate. It answers a more comprehensive question: How many years of discounted future earnings are needed to recover the current stock price?
3.1. PPP Formula
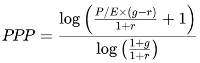
Where:
- P/E is the price-to-earnings ratio
- g is the average earnings growth rate
- r is the discount rate, calculated as the risk-free rate plus a market risk premium adjusted for the stock’s specific risk, in accordance with the CAPM framework.
This formula shows that the P/E ratio is a special case of the PPP when both g and r equal zero. In other words, the PPP extends the P/E ratio to reflect real-world financial conditions.
4. From PPP to SIRR: A New Return-Based Metric
From the PPP, one can derive a Stock Internal Rate of Return (SIRR) using the Doubling Formula:
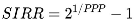
The SIRR provides a return-based interpretation of stock attractiveness, comparable to yield on bonds but adjusted for growth and risk. A stock with a SIRR exceeding the risk-free rate offers a positive expected excess return.
5. Case Study: Applied Materials vs. Broadcom
Data as of January 24, 2025, with discount rate r = 4.62%
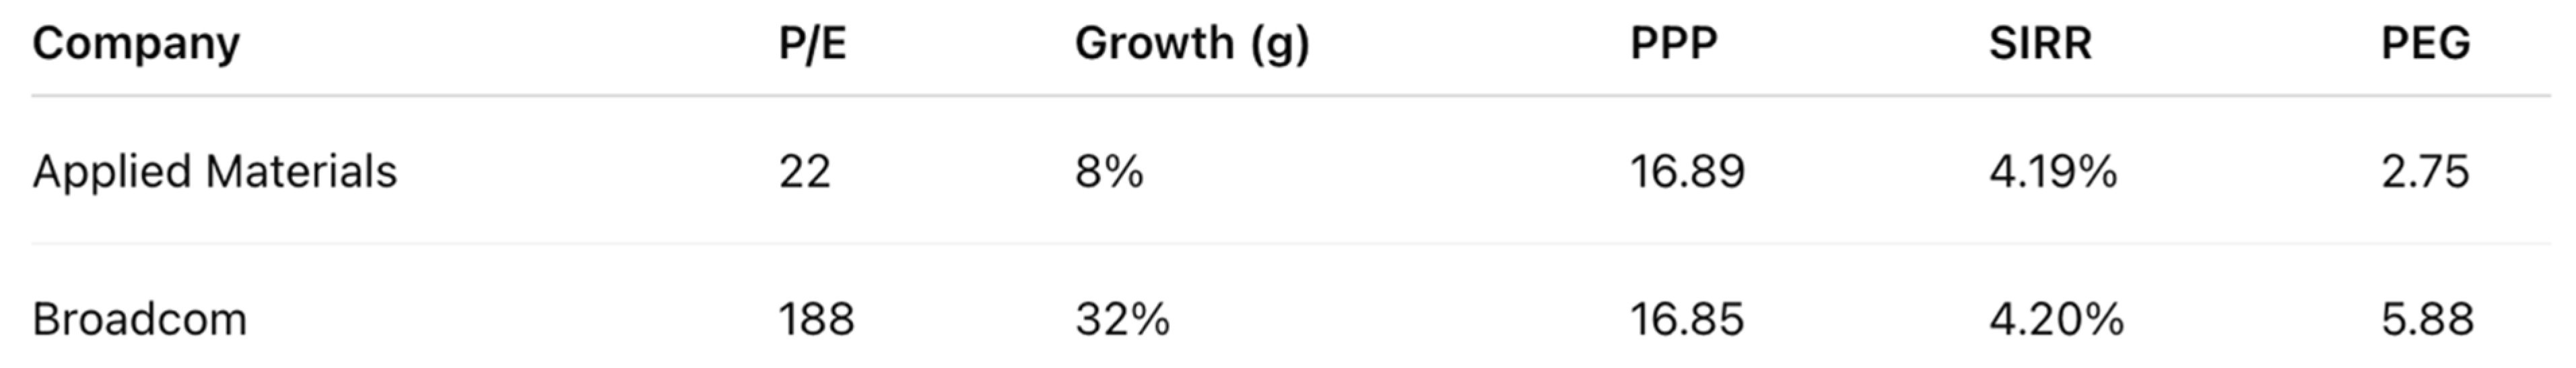
Traditional metrics might imply Broadcom is overvalued due to its high P/E and PEG. However, PPP and SIRR reveal that both stocks offer similar return potential once growth and discounting are integrated.
This shows how the PPP adds dimensionality and provides context to traditional metrics, offering a more complete and actionable assessment.
6. The Hidden Value Zone (HVZ): Where the PPP Reveals What PEG Misses
A striking difference between the PPP and PEG approaches emerges when plotting P/E ratios against earnings growth rates (g). The Hidden Value Zone (HVZ), shown in the figure below, highlights an area where traditional PEG-based analysis fails to recognize undervalued stocks—particularly high-growth ones with high P/E ratios.
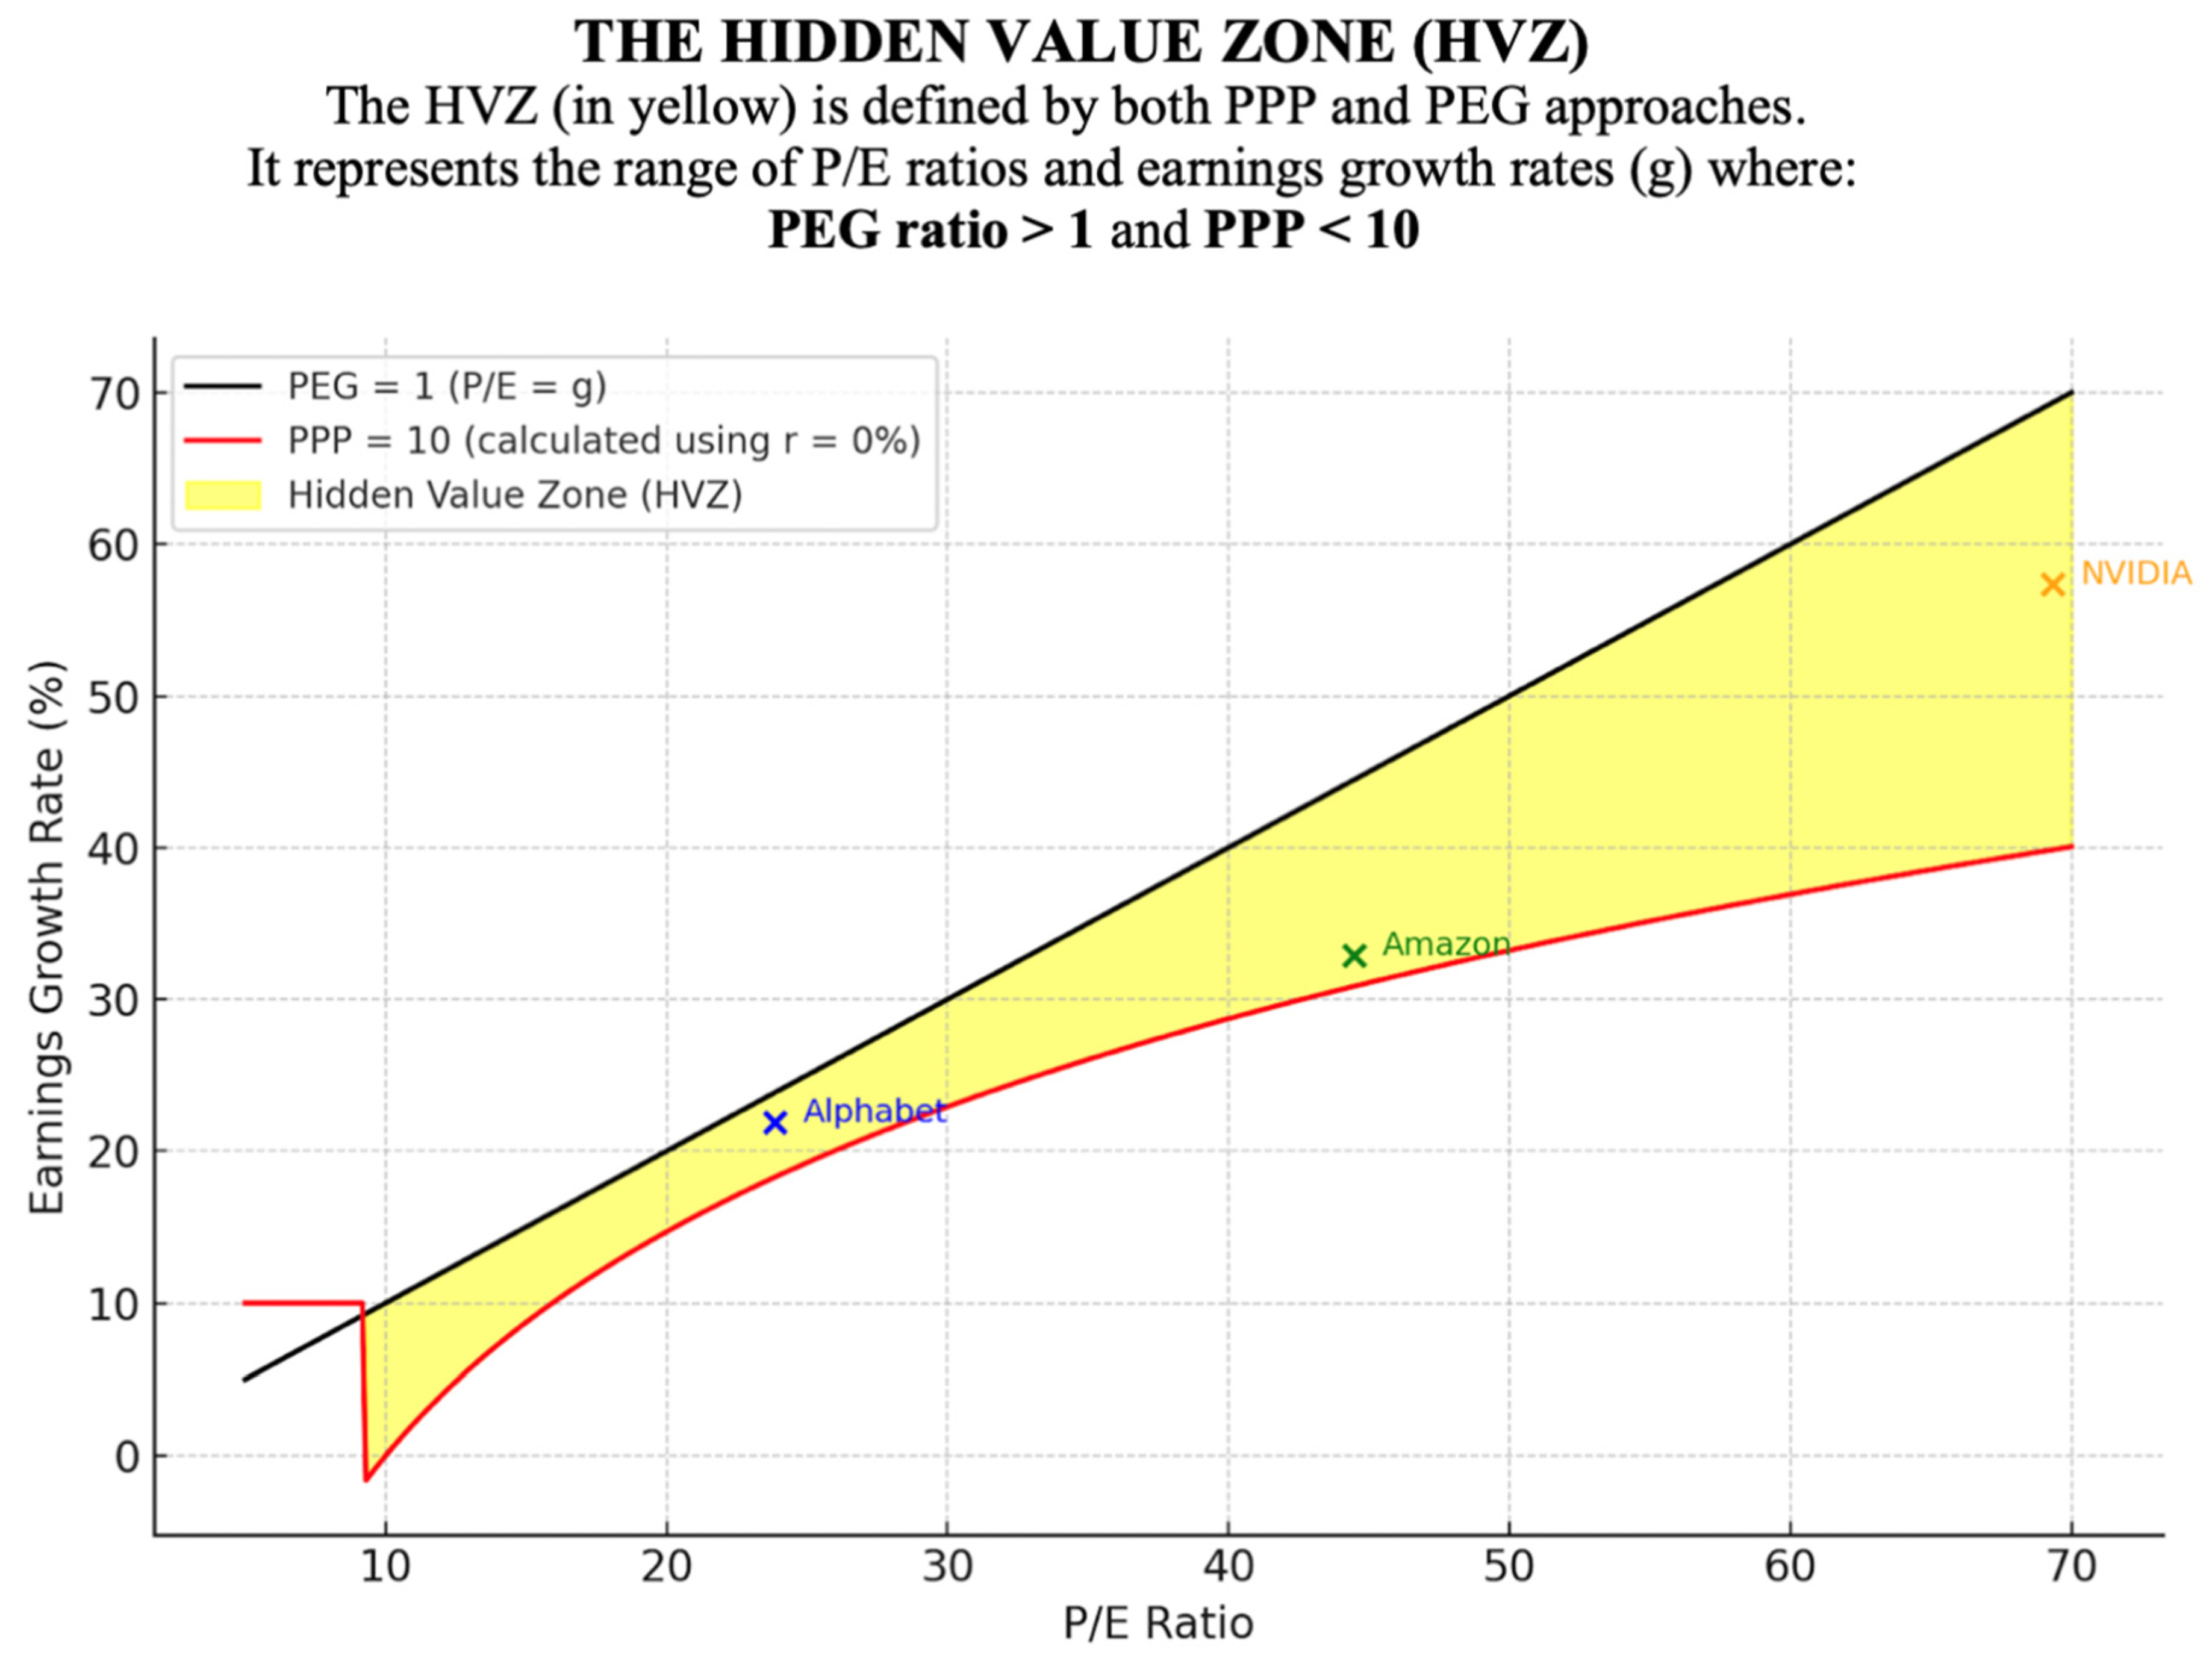
In this graph:
- The black line represents the traditional PEG = 1 boundary (i.e., P/E = g), often used as an arbitrary threshold to judge overvaluation. It is also the bisector of the graph, representing points where the P/E ratio is numerically equal to the earnings growth rate (g). Stocks below this line have a PEG ratio above 1 and are therefore considered overvalued according to the PEG approach.
- The red curve represents PPP = 10 years, assuming a 0% discount rate (r = 0), focusing purely on the relationship between price and compounded growth. As earnings growth accelerates, the PPP decreases, reducing the time needed to recover the investment through future discounted earnings.Stocks positioned above this curve have a PPP below 10 years and are therefore considered to offer attractive intrinsic value according to the PPP approach.
- The yellow shaded area between the two curves is the Hidden Value Zone (HVZ) — a region where high-growth stocks appear overvalued by PEG standards but are revealed as undervalued under the PPP framework. The HVZ essentially results from a clash between the linear logic of the PEG ratio and the logarithmic structure of the PPP formula, with the latter offering a more realistic representation of earnings growth and value recovery over time.
Key Interpretation:
Stocks above the red PPP = 10 line have PPP values below 10 years, suggesting high intrinsic earning power and quicker payback, even if their P/E ratios appear high. This is because the PPP decreases as earnings growth accelerates, reducing the time needed for future profits — once discounted — to recoup the stock price.
A PPP of 10 years can serve as an intuitive yet justified lower threshold for identifying stock undervaluation, grounded in both financial logic and investor expectations.
Specifically, a PPP of 10 years corresponds to a Stock Internal Rate of Return (SIRR) of approximately 7.18%, based on the Doubling Formula:
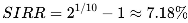
This is well above the current risk-free rate of 4.62%, indicating a meaningful intrinsic return premium. Such a spread signals that the stock is likely undervalued, offering strong earning power relative to its price. While the PEG ratio might misclassify these high-growth, high-P/E stocks as overvalued, the PPP approach correctly reclassifies them as attractive opportunities, thanks to its incorporation of compounding growth and time-based valuation.
Recent Examples from the Hidden Value Zone (HVZ)
As of November 8, 2024, using data from Yahoo Finance, several prominent U.S. technology companies — part of the so-called “Magnificent Seven” — were positioned in the Hidden Value Zone. Despite having high P/E ratios and PEG ratios above 1, their strong earnings growth rates and relatively low PPP values reveal intrinsic value overlooked by the PEG model. For example:
- NVIDIA: P/E = 69.31; growth rate = 57.38%; PPP = 8.18; PEG = 1.21.
- Alphabet: P/E = 23.85; growth rate = 21.91%; PPP = 9.23; PEG = 1.09.
- Amazon: P/E = 44.48; growth rate = 32.90%; PPP = 9.67; PEG = 1.35.
All three companies fall above the red PPP = 10 line yet below the black PEG = 1 line, placing them firmly in the HVZ. This positioning confirms that high-growth stocks can still be fundamentally undervalued, even when dismissed by simplistic PEG thresholds.
7. Application to Market Indices: The S&P 500
As of January 2025:
- P/E = 30
- g = 18%
- r = 4.62% (risk-free rate represented by the 10-year U.S. Treasury yield).
Applying the PPP and SIRR:
- PPP = 13.10 years
- SIRR = 5.43%
Although the S&P 500 exhibits a historically elevated P/E ratio, the PPP model suggests that it remains fairly valued, as the SIRR clearly exceeds the risk-free rate. By integrating growth and discounting, the PPP offers a more nuanced assessment than traditional metrics, which might otherwise label the market as prematurely overvalued.
8. Comparing PPP to Traditional Metrics
Another fundamental distinction lies in their mathematical architecture: the PEG ratio’s linear structure provides only a heuristic shortcut, whereas the PPP’s logarithmic formula is rooted in the mathematics of compound growth and present value discounting. This structural difference makes PPP a more rigorous and reliable valuation model.
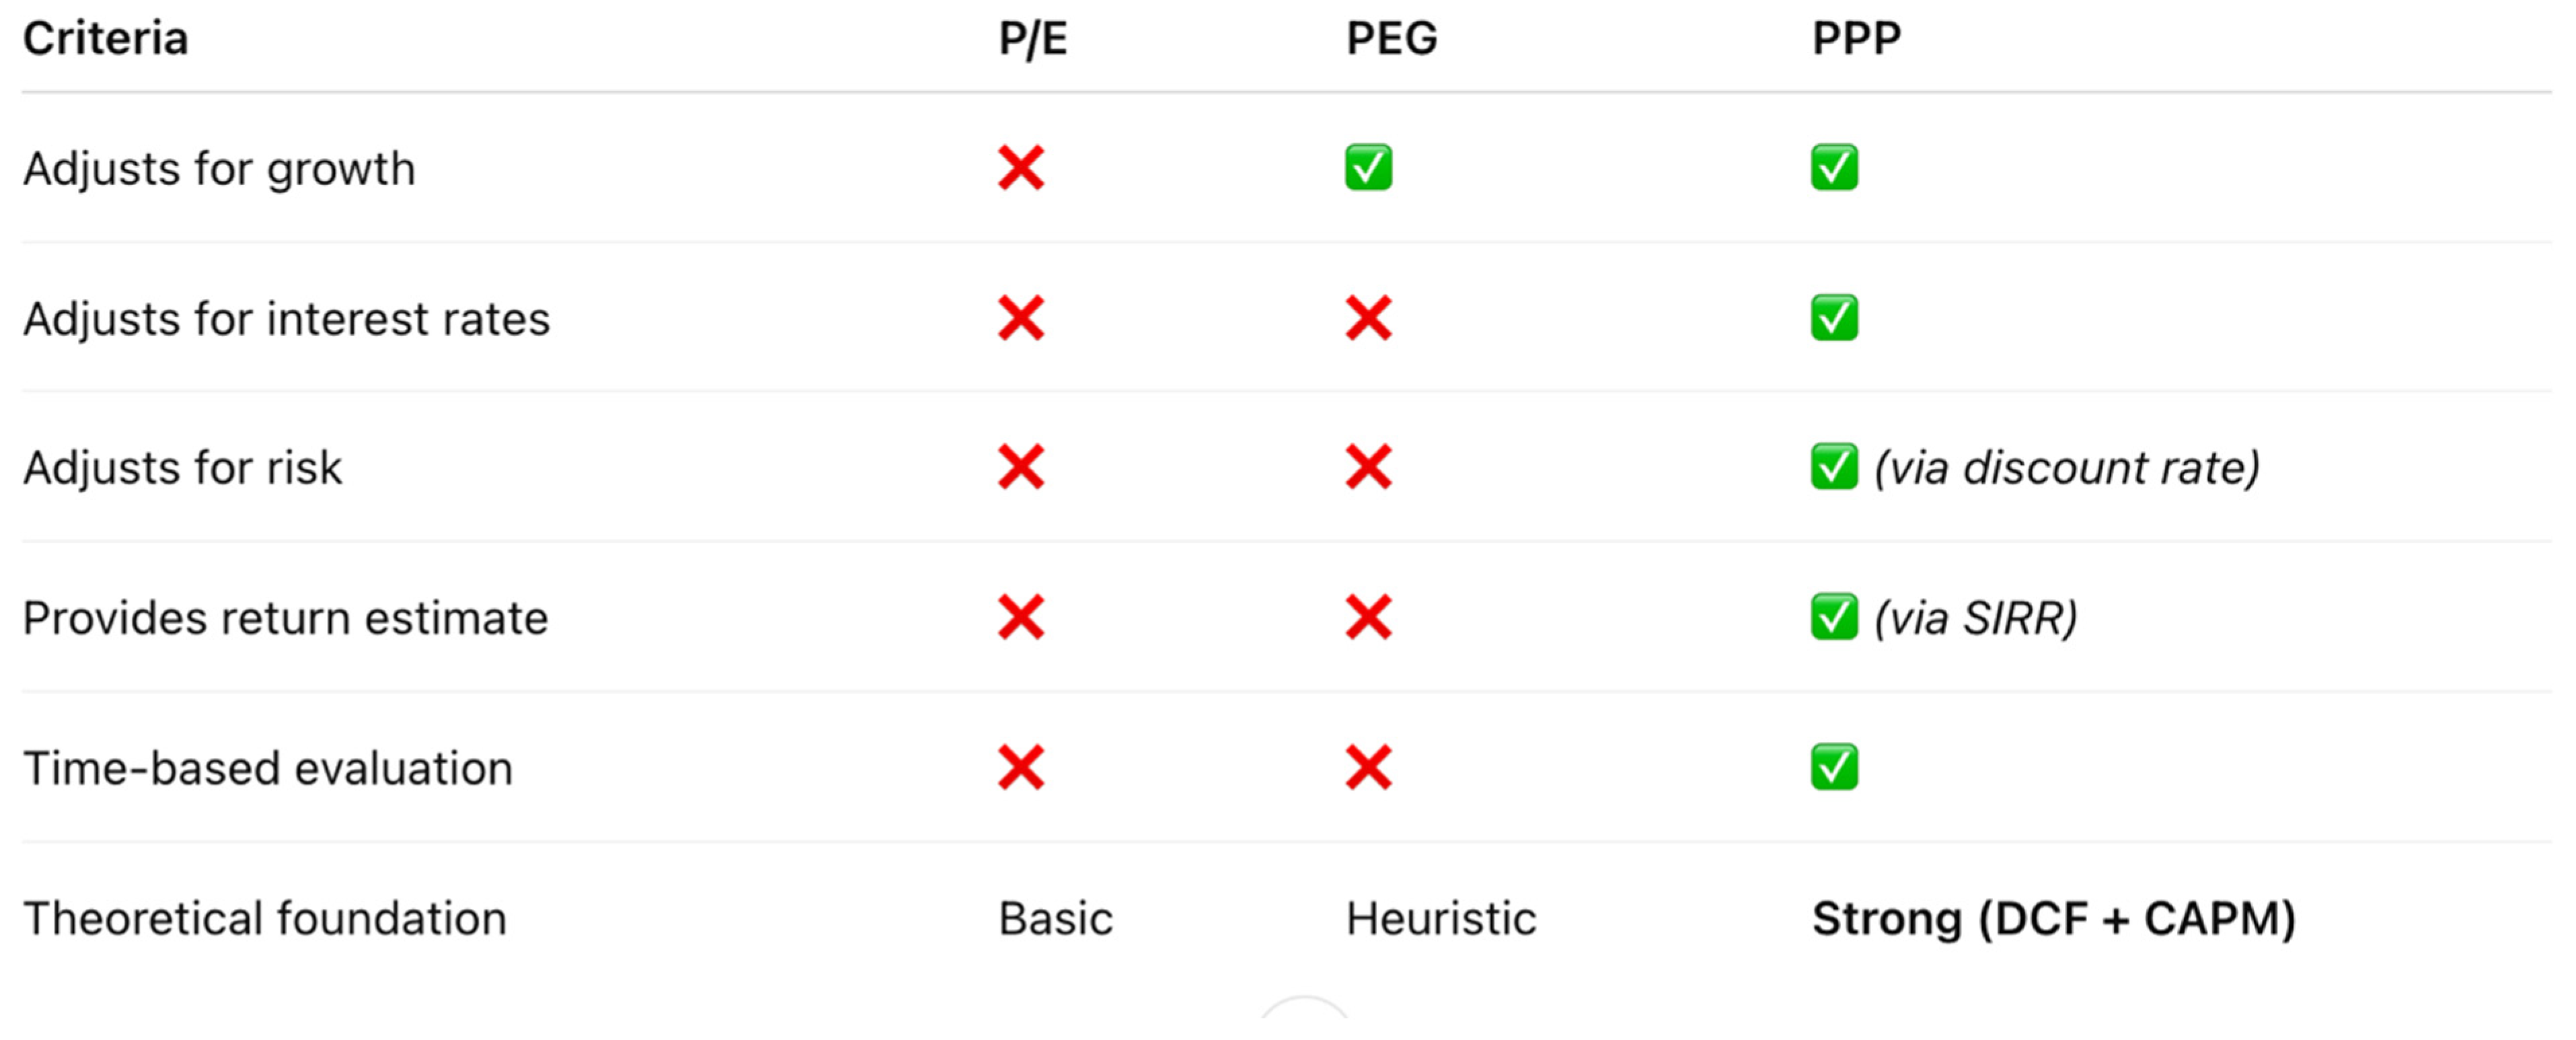
Rather than rendering older tools useless, the PPP extends and refines them, offering a richer analytical framework.
9. Conclusion
The Potential Payback Period (PPP) and its derivative, the Stock Internal Rate of Return (SIRR), provide a meaningful evolution in stock valuation. These tools:
- Incorporate growth, risk, and the time value of money
- Extend the traditional P/E and PEG ratios into dynamic metrics
- Offer investors a time-based and return-based framework
- Reveal valuation clarity for both individual stocks and broad indices.
One of the most compelling contributions of this model is the identification of the Hidden Value Zone (HVZ) — a conceptual and visual breakthrough where PPP reveals investment opportunities missed by linear PEG analysis. The HVZ illustrates how high-growth stocks with high P/E ratios, often dismissed by PEG thresholds, may in fact offer superior value based on their rapid payback potential.
By adopting PPP, investors and analysts gain access to more forward-looking, risk-aware, and mathematically grounded metrics that better reflect modern market realities. The PPP doesn’t discard the P/E or PEG ratios — it subsumes and enhances them, making them more useful and relevant in today’s complex financial landscape.
References
- Bodie, Z. , Kane, A., & Marcus, A. J. (2013). Investments (10th ed.). McGraw-Hill. Comprehensive coverage of investment theory, useful for contrasting traditional valuation methods with the PPP-derived SIRR and SIRRIPA.
- Damodaran, A. (2002). Investment valuation: Tools and techniques for determining the value of any asset. Wiley Finance. Provides insights into valuation techniques for various asset classes, highlighting why traditional methods can fall short in capturing long-term earning power as reflected by PPP-derived SIRR and SIRRIPA.
- Fama, E. F. , & French, K. R. (1993). Common risk factors in the returns on stocks and bonds. Journal of Financial Economics, 33(1), 3–56. Examines risk factors influencing stock and bond returns, underscoring the importance of risk-adjusted metrics in investment evaluation such as PPP-derived SIRR and SIRRIPA.
- Graham, B. , & Dodd, D. (1934). Security analysis. McGraw-Hill. Classic work on value investing emphasizing intrinsic value, a concept central to the PPP-derived SIRR and SIRRIPA’s focus on earning power.
- Modigliani, F. , & Miller, M. H. (1958). The cost of capital, corporation finance, and the theory of investment. The American Economic Review, 48(3), 261–297. Foundational paper in financial theory, highlighting the role of capital costs in investment decisions, relevant to discount rate discussions in PPP, SIRR, and SIRRIPA.
- Sam, R. (1984). Le PER, un instrument mal adapté à la gestion mondiale des portefeuilles. Comment remédier à ses lacunes. Revue Analyse Financière, 2e trimestre 1984. Critiques the limitations of the P/E ratio for global portfolio management and proposes the DR (Payback Period) as a more robust evaluation tool, paving the way for PPP-derived metrics such as SIRR and SIRRIPA.
- Sam, R. (1985). Le Délai de Recouvrement (DR). Revue Analyse Financière, 3e trimestre 1985. Refines the DR concept (early form of the PPP), setting theoretical groundwork for dynamic valuation metrics like SIRR and SIRRIPA.
- Sam, R. (1988). Le DR confronté à la réalité des marchés financiers. Revue Analyse Financière, 4e trimestre 1988. Applies the DR concept in real-world financial markets, validating its relevance and laying further foundations for the PPP and its derivatives such as SIRR and SIRRIPA.
- Sam, R. (2024). Stock evaluation: Discovering the Potential Payback Period (PPP) as a dynamic P/E ratio. Dedicated platform focusing on the Potential Payback Period (PPP) and its innovative use in deriving both the Stock Internal Rate of Return (SIRR) and the Stock Internal Rate of Return Including Price Appreciation (SIRRIPA).
- Sam, R. (2025). Le Potential Payback Period (PPP): Une généralisation utile du Price Earnings Ratio (PER) pour l’évaluation des actions. Revue Française d’Économie et de Gestion, 1(2), 621–632. Explores how the PPP generalizes and extends the traditional P/E ratio by integrating earnings growth, interest rates, and risk, leading to evaluation metrics such as SIRR and SIRRIPA.
- Sam, R. (2025). Le Potential Payback Period (PPP): La septième révolution financière. Revue Française d’Économie et de Gestion, 6(2), 594–620. Positions the PPP as a major evolution in financial analysis, comparable to earlier pivotal innovations, and highlights the significance of metrics such as SIRR and SIRRIPA.
- Sam, R. (2025). Anatomy of a looming bear market: How to assess the impact of Donald Trump’s chaotic measures on Wall Street. Revue Française d’Économie et de Gestion, 6(3), 550–560. Analyzes potential bear market scenarios linked to political instability, applying PPP-derived methods, including SIRR and SIRRIPA, to assess market risks.
- Sam, R. (2025). Comparing global stock markets using risk-premiums derived from the Potential Payback Period (PPP). Revue Française d’Économie et de Gestion, 6(3), 541–549. Applies PPP-derived risk premiums and related return metrics such as SIRR and SIRRIPA to compare and rank different global stock markets.
- Sam, R. (2025). Analyse financière: Le Potential Payback Period (PPP), une alternative au Price Earnings Ratio pour évaluer les entreprises temporairement déficitaires – Étude de cas: Intel Corp. Revue Française d’Économie et de Gestion, 6(3), 561–576. Demonstrates how the PPP, through metrics such as SIRR and SIRRIPA, can be effectively applied to companies with temporary losses, where the traditional P/E ratio fails, using Intel Corp. as a case study.
- Sharpe, W. F. (1964). Capital asset prices: A theory of market equilibrium under conditions of risk. The Journal of Finance, 19(3), 425–442. Introduces the Capital Asset Pricing Model (CAPM), forming the basis for adjusting returns for risk, crucial for calculating PPP-derived SIRR and SIRRIPA.
Disclaimer/Publisher’s Note: The statements, opinions and data contained in all publications are solely those of the individual author(s) and contributor(s) and not of MDPI and/or the editor(s). MDPI and/or the editor(s) disclaim responsibility for any injury to people or property resulting from any ideas, methods, instructions or products referred to in the content. |
© 2025 by the authors. Licensee MDPI, Basel, Switzerland. This article is an open access article distributed under the terms and conditions of the Creative Commons Attribution (CC BY) license (http://creativecommons.org/licenses/by/4.0/).
Copyright: This open access article is published under a Creative Commons CC BY 4.0 license, which permit the free download, distribution, and reuse, provided that the author and preprint are cited in any reuse.


