
Submitted:
05 May 2025
Posted:
06 May 2025
You are already at the latest version
Abstract
The Price-to-Earnings (P/E) ratio remains a cornerstone of equity valuation, yet it overlooks essential dimensions such as earnings growth and risk. The Price-to-Earnings to Growth (PEG) ratio was developed to address this gap but provides only a linear and often oversimplified adjustment. This paper presents the Potential Payback Period (PPP) as a more robust and comprehensive alternative. By incorporating compound earnings growth and risk-adjusted discounting within a time-based valuation framework, PPP extends the traditional P/E ratio while addressing key limitations of the PEG approach. A visual framework — the Hidden Value Zone (HVZ) — highlights how PEG may misclassify certain high-growth stocks that PPP more accurately identifies as undervalued. Theoretical insights and empirical illustrations together support the PPP as a more relevant and effective valuation methodology in today’s dynamic market environment.
Keywords:
P/E ratio
; PEG ratio
; potential payback period (PPP)
; stock valuation
; discounted earnings
; stock internal rate of return (SIRR)
; growth adjustment
1. Introduction
For decades, the Price-to-Earnings (P/E) ratio has been a foundational metric in stock valuation. Its appeal lies in its simplicity: it expresses how many years of current earnings an investor is paying for at the prevailing stock price. However, the P/E ratio is fundamentally backward-looking and static, assuming constant earnings and no growth. To address this limitation, the PEG ratio — P/E divided by the projected earnings growth rate — was popularized as a means of adjusting the P/E for growth.
Yet the PEG ratio’s simplicity is both its strength and its greatest weakness. It applies a linear correction to a non-linear reality. As capital markets grow more complex and forward-looking, new models are required to assess valuation in a way that captures both earnings potential and the risk-adjusted time value of money.
This article introduces and analyzes the Potential Payback Period (PPP) — a valuation methodology developed by the author beginning in the mid-1980s — as a more comprehensive and dynamic framework. The PPP builds upon and extends the P/E ratio by integrating compound growth and discounting to assess how quickly a stock’s earnings can recover its price. By doing so, it not only addresses the shortcomings of the PEG ratio but also repositions valuation analysis within a more rigorous, time-sensitive, and risk-adjusted structure.
The following sections present the theoretical foundations of PPP, contrast it with PEG, and demonstrate its practical relevance using both individual stock comparisons and broader market-level applications.
2. The PEG Ratio: Strengths and Shortcomings
2.1. Definition and Interpretation
The PEG ratio is defined as:
Where:
- P/E is the Price-to-Earnings ratio
- g is the projected annual earnings growth rate.
A PEG ratio of 1 is traditionally considered “fair value,” with values below 1 indicating undervaluation and above 1 suggesting overvaluation. This rule of thumb is intuitive and accessible, especially for retail investors.
2.2. Critical Weaknesses
Despite its popularity, the PEG ratio suffers from several fundamental flaws:
- Linearity: It assumes a linear relationship between P/E and growth, whereas the relationship is exponential in reality due to compounding.
- No Discounting: It fails to account for the time value of money. Future earnings are treated as if they occur immediately.
- No Risk Adjustment: It does not incorporate interest rates or firm-specific risk factors, making it incompatible with models like CAPM or DCF.
- Misleading for High-Growth Stocks: PEG systematically misclassifies high-growth companies with high P/E ratios as overvalued, even when they offer strong long-term returns.
The PEG ratio is a heuristic at best — useful for quick screens but theoretically inadequate for precise valuation.
3. The Potential Payback Period (PPP): A Modern Generalization
3.1. Concept and Formula
The Potential Payback Period (PPP) seeks to determine the number of years required for the discounted cumulative earnings of a company to recover its current price. It reflects both the growth in earnings and the investor’s opportunity cost via a discount rate.
Where:
- P/E is the Price-to-Earnings ratio
- g is the expected annual earnings growth rate
- r is the discount rate (e.g., CAPM-derived).
This formula encapsulates the exponential nature of growth and the decelerating effect of discounting. It allows for a time-based assessment of valuation, unlike both P/E and PEG which express value as static ratios.
3.2. Theoretical Foundations
- Dynamic Valuation: The logarithmic structure of the PPP formula captures the compounding nature of earnings growth and aligns closely with the logic of discounted cash flow (DCF) valuation.
- Risk Sensitivity: The model incorporates risk through the discount rate, making it consistent with CAPM and modern portfolio theory.
- Generalization of P/E: When g = r = 0, PPP collapses into P/E, showing that P/E is a special case of PPP under static conditions.
- Improvement over PEG: Unlike the PEG, PPP uses logarithmic relationships to reflect diminishing marginal returns and capital recovery time.
4. From PPP to SIRR: Deriving the Stock Internal Rate of Return
Once the PPP is calculated, it can be used to derive a Stock Internal Rate of Return (SIRR) using the “doubling formula”:
This converts the time-based PPP into a return-based metric, allowing direct comparison with yields on bonds, hurdle rates, and cost of capital benchmarks.
A high SIRR relative to the risk-free rate signals that the stock is undervalued even if its P/E or PEG ratios are high.
5. Real-World Comparison of Valuation Methods
5.1. Case Example – Applied Materials vs. Broadcom
As of January 24, 2025:
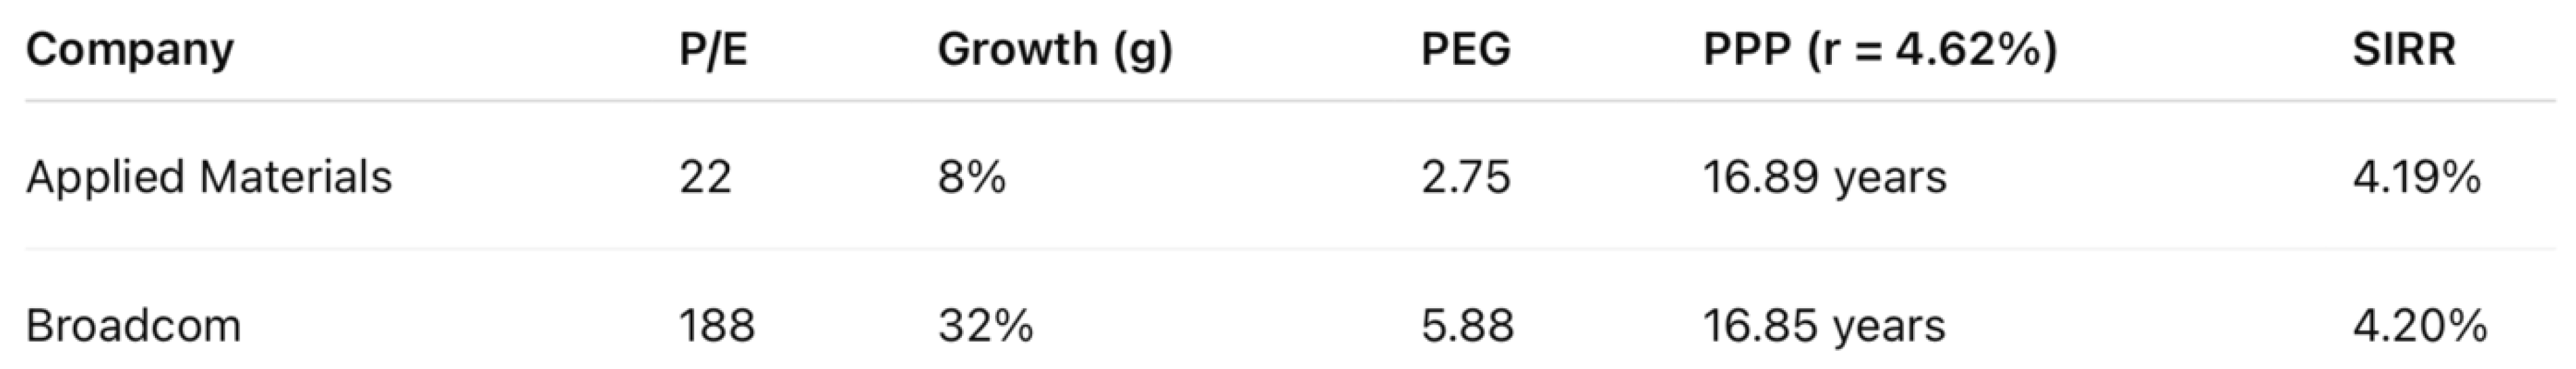
Despite Broadcom’s apparently excessive P/E and PEG ratios, its rapid earnings growth justifies its valuation. PPP and SIRR show nearly identical values for both companies — something PEG would never reveal.
Notably, over the six months preceding the analysis, Broadcom’s share price increased by 50%, while that of Applied Materials declined by 15%. This performance divergence, in hindsight, offers empirical support for the PPP and SIRR framework — suggesting their potential utility as forward-looking investment management tools.
5.2. Market Index – The S&P 500
As of January 24, 2025:
- P/E = 30
- g = 18%
- r = 4.62% (risk-free rate represented by the 10-year U.S. Treasury yield).
Traditional metrics suggest overvaluation (PEG = 1.67), yet PPP and SIRR reveal a fairly valued market offering positive excess return over the risk-free rate.
6. Revealing Mispriced Growth: The Hidden Value Zone (HVZ)
A major advantage of the PPP framework lies in its ability to uncover undervalued opportunities in places where traditional PEG analysis fails. This is especially relevant for high-growth stocks with high P/E ratios, which PEG often misclassifies as overvalued.
6.1. Graphical Representation
The figure below illustrates the Hidden Value Zone (HVZ):
Figure 1.
The Hidden Value Zone (HVZ). A chart plotting P/E ratios on the x-axis and earnings growth rates (g) on the y-axis.
Figure 1.
The Hidden Value Zone (HVZ). A chart plotting P/E ratios on the x-axis and earnings growth rates (g) on the y-axis.
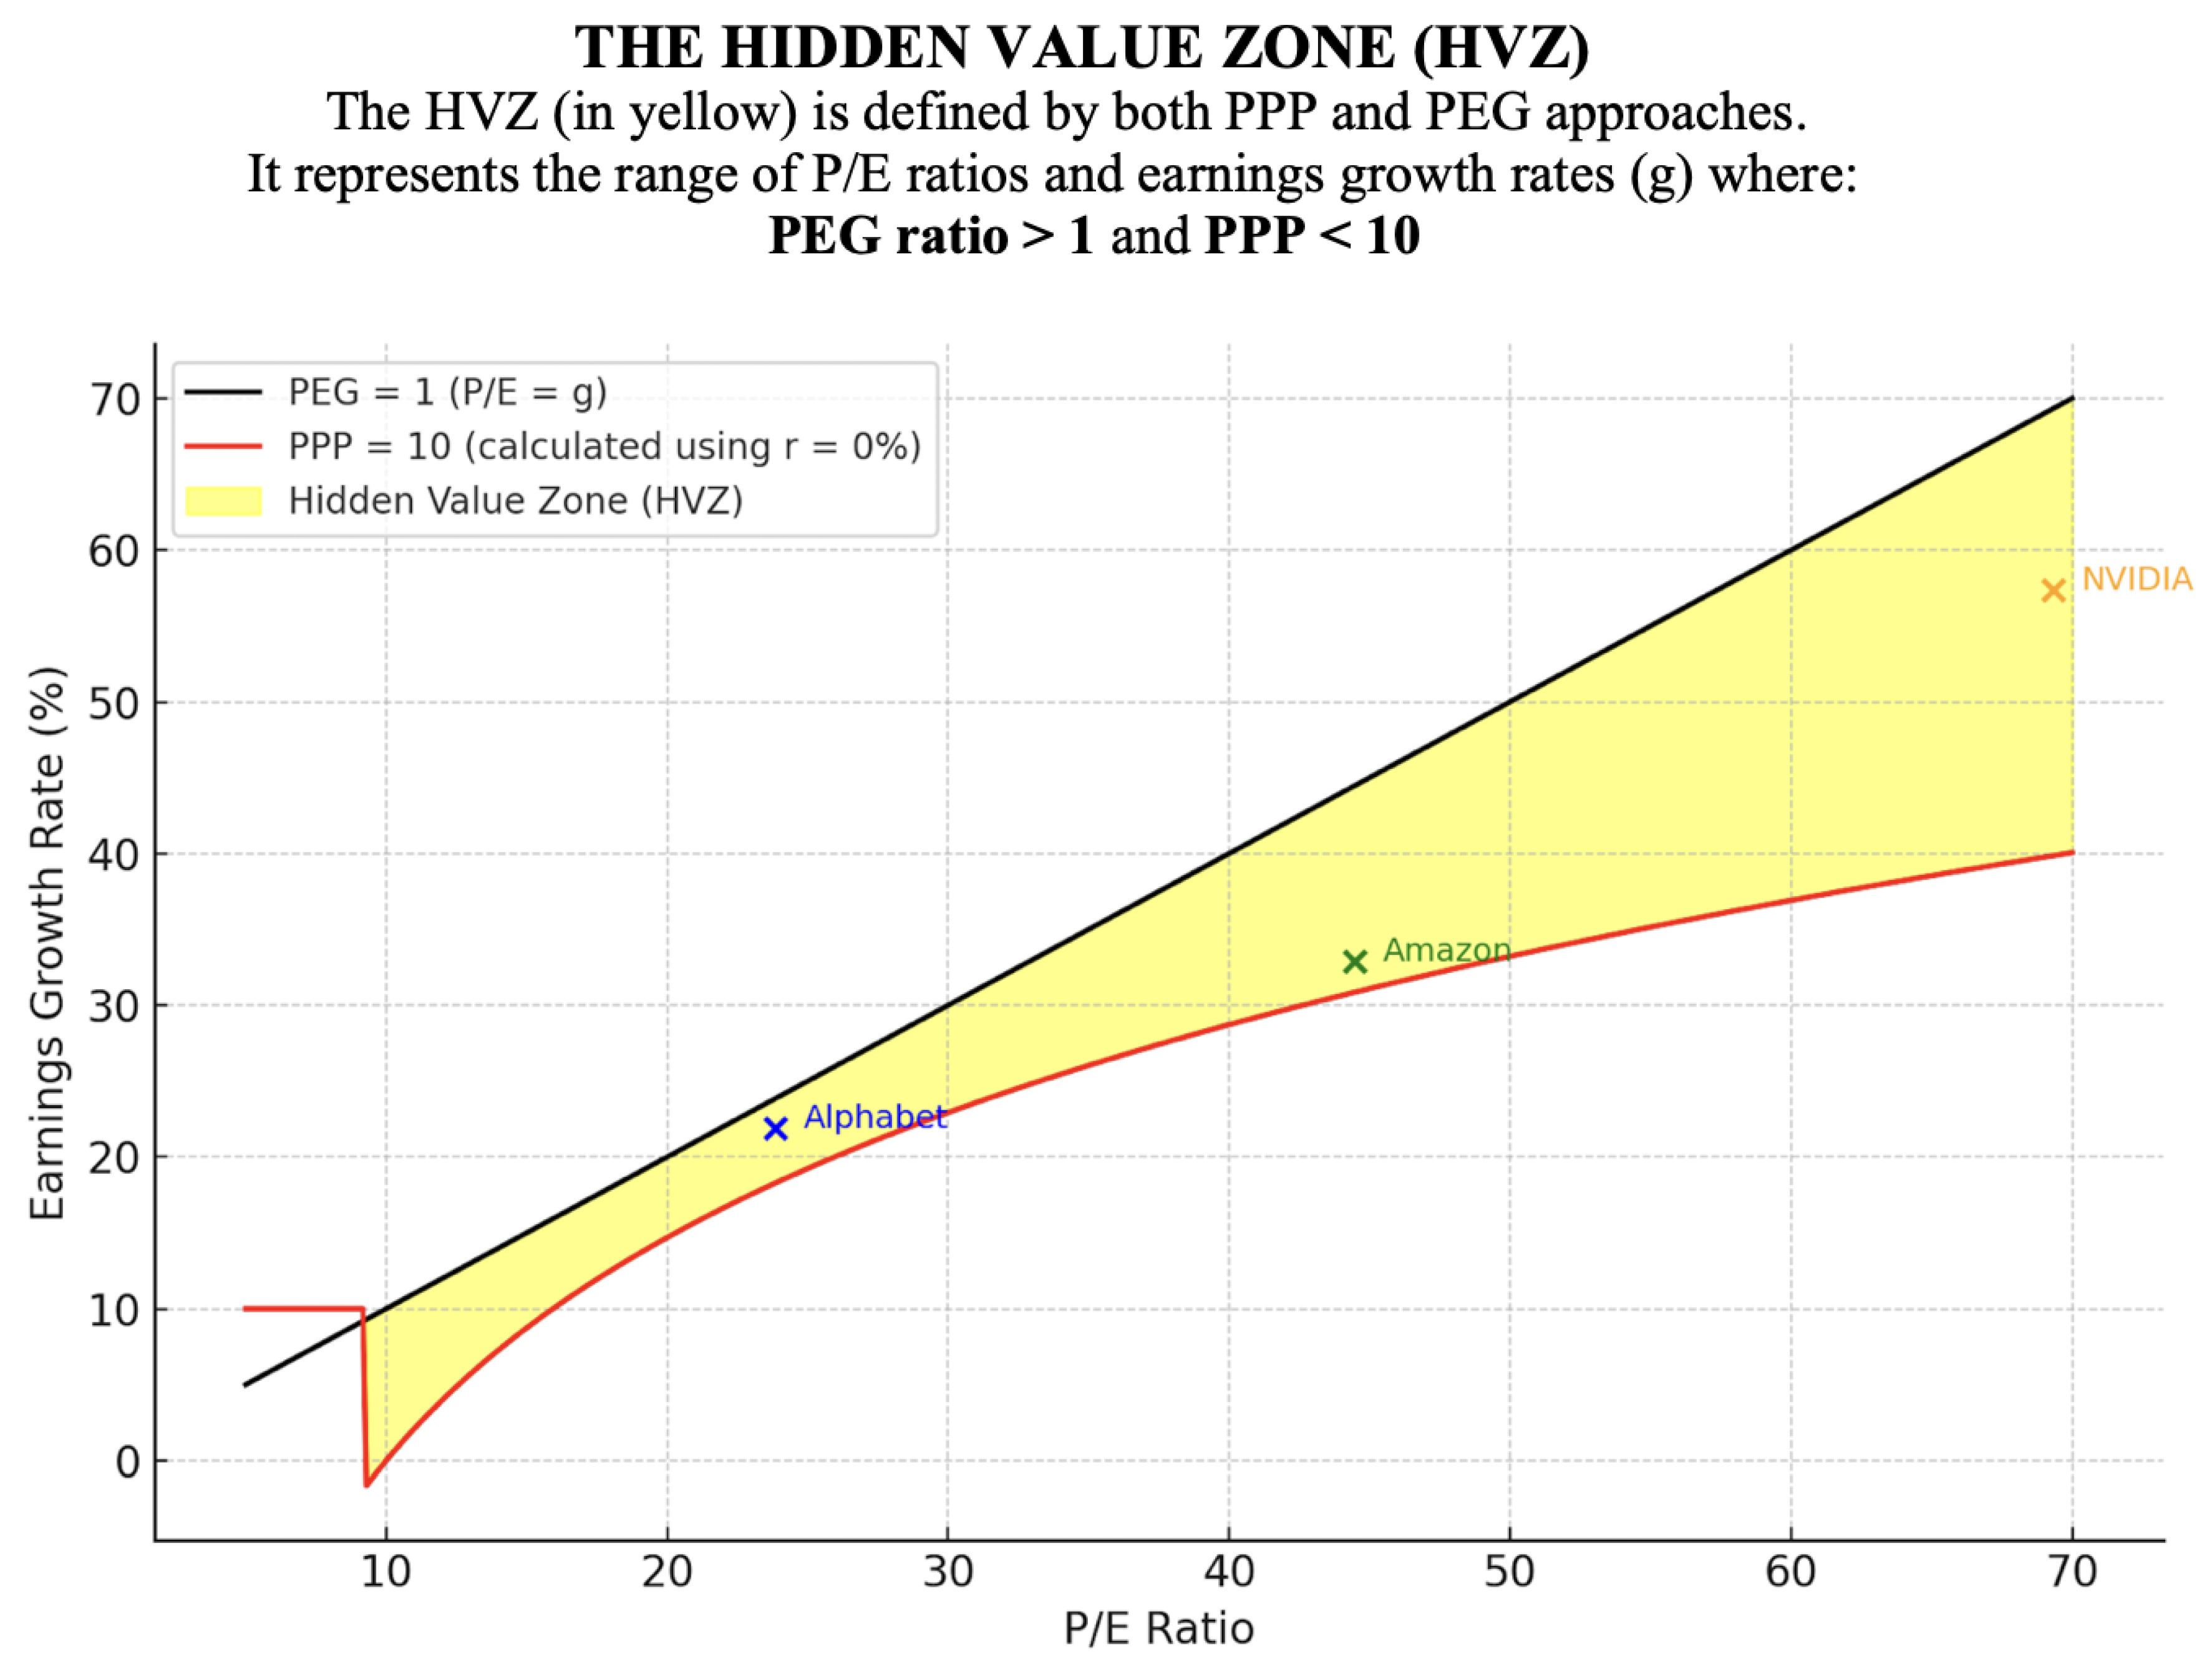
Two key lines are shown:.
- The Black Line: The linear PEG = 1 threshold (i.e., P/E = g), widely used as a benchmark to judge stock valuation. Stocks below this line (P/E > g) are labeled overvalued under PEG logic.
- The Red Curve: The PPP = 10 years isocline assuming a discount rate r = 0%. This curve reflects the compounding nature of growth. Stocks plotted above this curve (where g is higher and PPP is lower) have PPP < 10 years, making them attractive under the PPP framework.
- The Yellow-Shaded Zone: The HVZ, which lies between the two curves. It includes stocks that PEG misclassifies as overvalued, but that PPP identifies as offering rapid payback and strong intrinsic value.
6.2. Interpretation
- PEG vs. PPP Discrepancy: The HVZ visually reveals the inadequacy of PEG’s linear logic in the face of exponential earnings growth. The PEG ratio incorrectly penalizes fast-growing companies with high P/E ratios, ignoring the effect of compounding on time-to-value recovery.
- Time-Based Reclassification: PPP recalibrates valuation using logarithmic growth and discounting. A PPP of 10 years (highlighted by the red curve) corresponds to a Stock Internal Rate of Return (SIRR) of approximately 7.18%, well above typical risk-free rates. This makes the 10-year PPP threshold both intuitive and economically justified.
- Example Stocks Positioned in the HVZ (as of November 8, 2024, using a discount rate of r = 0% to focus the PPP calculation solely on earnings power, consistent with the PEG approach):

Despite PEGs above 1, all three companies have PPPs below 10, placing them within the HVZ and validating their attractiveness under dynamic, growth-aware valuation.
The HVZ reconciles investor intuition with financial logic — demonstrating that high growth justifies high multiples when evaluated through a time-and-risk-adjusted lens.
6.3. Strategic Implications
The HVZ graph reveals the critical limitation of the PEG ratio, which uses a flat threshold and fails to account for how growth and compounding reduce the time needed to recoup an investment. The PPP model, by contrast, uncovers these undervalued high-growth firms and provides a more reliable path for stock selection and portfolio optimization.
7. Growth Sensitivity: A Core Argument for PPP
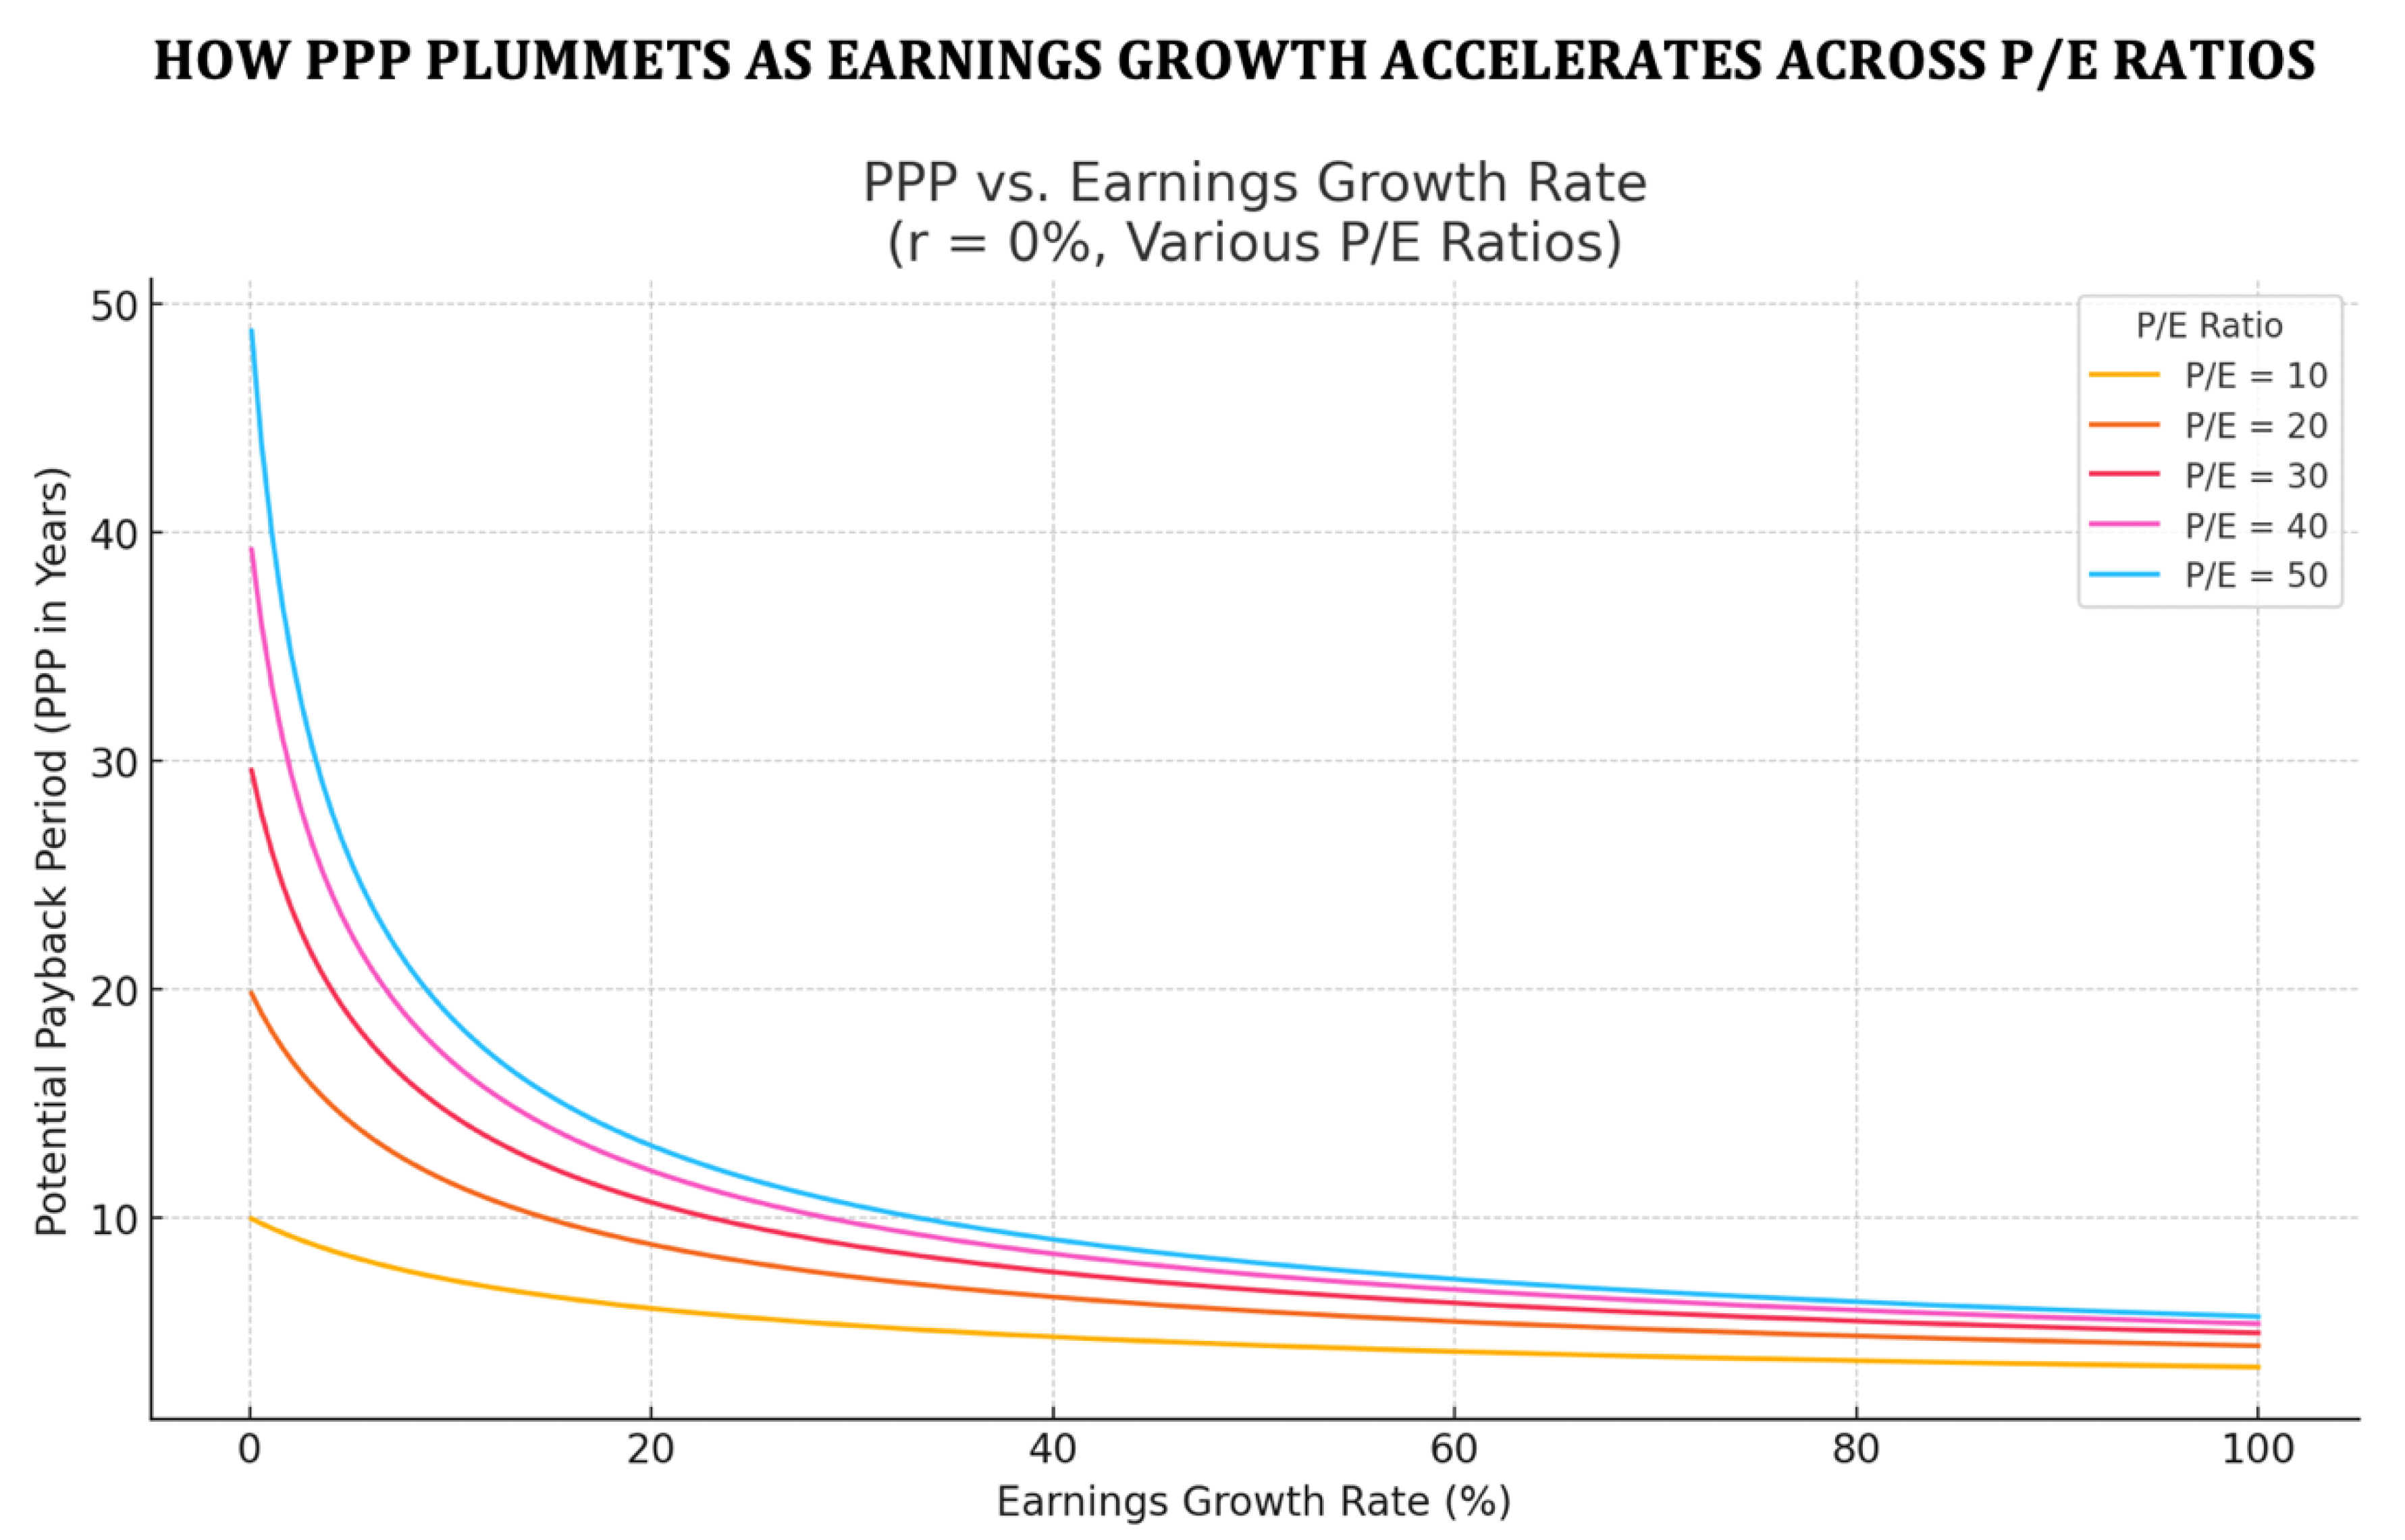
The following graph provides compelling visual proof of why adjusting the P/E ratio for earnings growth using a non-linear model like PPP is essential. While PEG applies a simple linear division of P/E by growth, the PPP reflects the accelerating effects of compounding earnings — especially at higher P/E levels.
The chart below (Figure 2) shows how PPP decreases as earnings growth increases, but the rate of decline is far more dramatic at higher P/E ratios. This demonstrates a critical valuation insight: while all investments benefit from higher growth, those with elevated P/E ratios rely more heavily on growth to justify their valuations. PPP captures this relationship mathematically and graphically, while PEG oversimplifies it.
At higher growth rates, PPP converges regardless of initial P/E, but the decline in PPP is steeper for higher P/E values — a behavior PEG fails to reflect. As earnings growth (g) becomes very high, the P/E ratio tends to lose its relevance as a valuation anchor, since even relatively high multiples can be justified by rapid compounding.
8. From SIRR to SIRRIPA: Incorporating Exit Price with Realism and Caution
While this article focuses primarily on the internal return generated from a stock’s earnings — measured by the Stock Internal Rate of Return (SIRR) — many real-world investment decisions also consider the exit price or terminal value of the stock. To reflect this, the SIRR framework can be extended to include price appreciation through the calculation of the Stock Internal Rate of Return Including Price Appreciation (SIRRIPA).
SIRRIPA accounts not only for the discounted cumulative earnings over the PPP horizon, but also for the terminal value of the stock, discounted back to the present. This terminal value is typically based on a conservative exit multiple (e.g., a P/E ratio) applied to projected earnings at the end of the PPP period. As a comprehensive, risk-adjusted return metric, SIRRIPA is to stocks what the yield to maturity (YTM) is to bonds — both represent the internalized return over a finite holding period, incorporating all expected cash flows and terminal value.
Importantly, in line with the logic and philosophy of the PPP methodology, SIRRIPA is computed using cautious and realistic assumptions:
- Earnings growth is assumed to decline linearly over time, reflecting natural business cycle dynamics and competitive pressures.
- The exit P/E ratio is assumed to contract, converging toward the PPP level by the end of the holding period, reinforcing valuation discipline.
These assumptions ensure that the model does not inflate the valuation through overly optimistic growth or terminal value projections. In fact, the exclusive use of SIRR in the present article — without yet factoring in price appreciation — demonstrates analytical prudence and emphasizes a solid foundation based solely on intrinsic earnings power.
Although the article does not explore SIRRIPA in detail due to length constraints and a deliberate focus on earnings-based valuation, its relevance is substantial. Future extensions of this framework may incorporate SIRRIPA to offer a fuller picture of stock performance, especially in cases where exit planning plays a central role in the investment project.
9. Acknowledging Limitations and the Role of Sensitivity Analysis
While the Potential Payback Period (PPP) provides a more dynamic and rigorous framework for equity valuation, it is not without limitations. Like all valuation models, PPP is only as reliable as the assumptions and inputs it is based on. In particular, the model in its initial formulation assumes — for the sake of analytical tractability — that earnings growth (g) and the discount rate (r) remain stable over the projection horizon, even though such stability may not hold in volatile or transitional market environments.
However, the subsequent development of SIRRIPA is explicitly grounded in more cautious and realistic expectations — including linearly declining earnings growth and a contracting exit multiple — to better reflect the dynamic and uncertain conditions encountered in practice.
Furthermore, estimating future earnings growth accurately can be challenging, especially for early-stage or cyclical companies. The choice of discount rate also requires careful justification, as it must reflect both macroeconomic conditions and firm-specific risk factors. If these inputs are biased or poorly estimated, the resulting PPP — and derived metrics such as SIRR and SIRRIPA — may offer a distorted view of a stock’s intrinsic value.
To address this, sensitivity analysis is essential. By varying key inputs such as the growth rate, discount rate, or P/E ratio, analysts can explore a range of possible outcomes and assess the robustness of the PPP under different scenarios. This not only enhances the credibility of the analysis but also helps investors better understand the risk-return profile of a given investment.
In sum, while PPP marks a meaningful advancement in valuation methodology, it should be applied with appropriate analytical care and supplemented by scenario testing to account for real-world uncertainties.
10. Conclusion: From PEG to PPP—A Shift Toward Precision in Growth-Adjusted Valuation
This article has examined the limitations of the PEG ratio and introduced the Potential Payback Period (PPP) as a more complete and adaptable framework for equity valuation. While the PEG ratio represented a useful early attempt to incorporate growth into valuation, it ultimately oversimplifies the complex relationship between price, earnings, and growth over time.
By contrast, the PPP model integrates compound earnings growth and risk-adjusted discounting within a time-based structure, offering a more nuanced and realistic measure of value. It generalizes the traditional P/E ratio under dynamic assumptions and yields insights that static valuation metrics often overlook. PPP also provides a foundation for calculating implied rates of return, beginning with SIRR and extending to SIRRIPA when exit price considerations are incorporated.
Rather than replacing traditional tools outright, PPP refines and extends them — making these metrics more relevant in an environment increasingly defined by volatility, innovation, and growth. As financial decision-making continues to evolve, the PPP framework offers a forward-looking, analytically rigorous approach that better aligns valuation with the realities of modern markets.
References
- Bodie, Z., Kane, A., & Marcus, A. J. (2013). Investments (10th ed.). McGraw-Hill. Comprehensive coverage of investment theory, useful for contrasting traditional valuation methods with the PPP-derived SIRR and SIRRIPA.
- Damodaran, A. (2002). Investment valuation: Tools and techniques for determining the value of any asset. Wiley Finance. Provides insights into valuation techniques for various asset classes, highlighting why traditional methods can fall short in capturing long-term earning power as reflected by PPP-derived SIRR and SIRRIPA.
- Fama, E. F., & French, K. R. (1993). Common risk factors in the returns on stocks and bonds. Journal of Financial Economics, 33(1), 3–56. Examines risk factors influencing stock and bond returns, underscoring the importance of risk-adjusted metrics in investment evaluation such as PPP-derived SIRR and SIRRIPA.
- Graham, B., & Dodd, D. (1934). Security analysis. McGraw-Hill. Classic work on value investing emphasizing intrinsic value, a concept central to the PPP-derived SIRR and SIRRIPA’s focus on earning power.
- Modigliani, F., & Miller, M. H. (1958). The cost of capital, corporation finance, and the theory of investment. The American Economic Review, 48(3), 261–297. Foundational paper in financial theory, highlighting the role of capital costs in investment decisions, relevant to discount rate discussions in PPP, SIRR, and SIRRIPA.
- Sam, R. (1984). Le PER, un instrument mal adapté à la gestion mondiale des portefeuilles. Comment remédier à ses lacunes. Revue Analyse Financière, 2e trimestre 1984. Critiques the limitations of the P/E ratio for global portfolio management and proposes the DR (Payback Period) as a more robust evaluation tool, paving the way for PPP-derived metrics such as SIRR and SIRRIPA.
- Sam, R. (1985). Le Délai de Recouvrement (DR). Revue Analyse Financière, 3e trimestre 1985. Refines the DR concept (early form of the PPP), setting theoretical groundwork for dynamic valuation metrics like SIRR and SIRRIPA.
- Sam, R. (1988). Le DR confronté à la réalité des marchés financiers. Revue Analyse Financière, 4e trimestre 1988. Applies the DR concept in real-world financial markets, validating its relevance and laying further foundations for the PPP and its derivatives such as SIRR and SIRRIPA.
- Sam, R. (2024). Stock evaluation: Discovering the Potential Payback Period (PPP) as a dynamic P/E ratio. Dedicated platform focusing on the Potential Payback Period (PPP) and its innovative use in deriving both the Stock Internal Rate of Return (SIRR) and the Stock Internal Rate of Return Including Price Appreciation (SIRRIPA).
- Sam, R. (2025). Le Potential Payback Period (PPP) : Une généralisation utile du Price Earnings Ratio (PER) pour l’évaluation des actions. Revue Française d’Économie et de Gestion, 1(2), 621–632. Explores how the PPP generalizes and extends the traditional P/E ratio by integrating earnings growth, interest rates, and risk, leading to evaluation metrics such as SIRR and SIRRIPA.
- Sam, R. (2025). Le Potential Payback Period (PPP) : La septième révolution financière. Revue Française d’Économie et de Gestion, 6(2), 594–620. Positions the PPP as a major evolution in financial analysis, comparable to earlier pivotal innovations, and highlights the significance of metrics such as SIRR and SIRRIPA.
- Sam, R. (2025). Anatomy of a looming bear market: How to assess the impact of Donald Trump’s chaotic measures on Wall Street. Revue Française d’Économie et de Gestion, 6(3), 550–560. Analyzes potential bear market scenarios linked to political instability, applying PPP-derived methods, including SIRR and SIRRIPA, to assess market risks.
- Sam, R. (2025). Comparing global stock markets using risk-premiums derived from the Potential Payback Period (PPP). Revue Française d’Économie et de Gestion, 6(3), 541–549. Applies PPP-derived risk premiums and related return metrics such as SIRR and SIRRIPA to compare and rank different global stock markets.
- Sam, R. (2025). Analyse financière: Le Potential Payback Period (PPP), une alternative au Price Earnings Ratio pour évaluer les entreprises temporairement déficitaires – Étude de cas : Intel Corp. Revue Française d’Économie et de Gestion, 6(3), 561–576. Demonstrates how the PPP, through metrics such as SIRR and SIRRIPA, can be effectively applied to companies with temporary losses, where the traditional P/E ratio fails, using Intel Corp. as a case study.
- Sharpe, W. F. (1964). Capital asset prices: A theory of market equilibrium under conditions of risk. The Journal of Finance, 19(3), 425–442. Introduces the Capital Asset Pricing Model (CAPM), forming the basis for adjusting returns for risk, crucial for calculating PPP-derived SIRR and SIRRIPA. [CrossRef]
Figure 2.
PPP vs. Earnings Growth Rate for various P/E Ratios (r = 0%).
Disclaimer/Publisher’s Note: The statements, opinions and data contained in all publications are solely those of the individual author(s) and contributor(s) and not of MDPI and/or the editor(s). MDPI and/or the editor(s) disclaim responsibility for any injury to people or property resulting from any ideas, methods, instructions or products referred to in the content. |
© 2025 by the authors. Licensee MDPI, Basel, Switzerland. This article is an open access article distributed under the terms and conditions of the Creative Commons Attribution (CC BY) license (http://creativecommons.org/licenses/by/4.0/).
Copyright: This open access article is published under a Creative Commons CC BY 4.0 license, which permit the free download, distribution, and reuse, provided that the author and preprint are cited in any reuse.


