
Submitted:
21 April 2025
Posted:
22 April 2025
You are already at the latest version
Abstract
Electric ducted fans are increasingly being applied in the aviation sector due to their advantages in compact size, low noise, and zero emissions when compared to conventional gas turbine engines. This paper presents a test system for an electric Ducted Propulsion Fan (eDPF) developed by the Aerospace Propulsion Systems group at the School of Mechanical Engineering, Hanoi University of Science and Technology, Vietnam. The core component of the experimental system is a 390 mm diameter eDPF, made of carbon fiber composite and driven by a BLDC electric motor located within the fan core. The eDPF is mounted on a test stand equipped with force sensors and an optical RPM sensor, which are connected to digital display gauges. The power supply consists of LiFePO₄ battery packs, with voltage and current monitored by multimeters and controlled via a potentiometer connected to an ESC module. This electric thruster was experimentally operated at rotational speeds ranging from 2000 rpm to 7000 rpm in order to establish the relationship between its electrical and aero-propulsion characteristics. Initially, the testing aimed to determine the operational thrust range of the eDPF. Subsequently, comparisons were made between the electrical and aero-propulsion performance, as well as dimensionless parameters—including power coefficient (CP), thrust coefficient (CT), and figure of merit (FM)—under two configurations: 8-pack and 9-pack battery setups. In addition, an acoustic test was performed to measure the sound pressure level (SPL) at a distance of 1.0 m. The experimental results provide insights and recommendations for operating the eDPF at different power levels to achieve optimal thrust efficiency.
Keywords:
electric Ducted Propulsion Fan
; electrical characteristic
; static aero-propulsion characteristic
; figure of merit
; sound pressure level
1. Introduction
Ducted fan applications in UAVs and S/VTOL aircraft are no longer novel. Competitive advantages such as a higher static thrust-to-power ratio and lower noise levels compared to open rotors of the same diameter have brought ducted fans to the forefront. Furthermore, the use of electric power to replace the thermal cycle in conventional engines further aligns electric propulsion fans with a green future. Numerous empirical studies have been published over the past 20 years.
Kondor et al. [1,2,3] employed circulation control via pneumatic jets at the inlet and nozzle of a shrouded fan model, aiming to improve propulsive efficiency and mitigate off-design performance degradation during VTOL operations. Utilizing the Coandă surface principle, these studies explored morphing nacelle configurations through investigations into static thrust performance, fan exhaust flow visualization, fan pressure ratios across different altitudes, and rotational speeds ranging from 10,000 to over 30,000 rpm.
Around the same period, Martin’s group [4,5] examined a 10-inch ducted rotor VTOL UAV under various flight conditions, including hover, forward flight, and high angles of attack, to analyze the effects of duct shape and propeller tip gap on aerodynamic performance. Experimental data—gathered through wind tunnel tests, flow visualization, and acoustic measurements—combined with CFD analyses, demonstrated good agreement between simulations and experiments, offering valuable insights for optimizing novel rotor and duct designs as well as tip gap configurations.
Graf et al. [6] conducted experimental aerodynamic studies on an electric ducted fan (EDF) under static thrust conditions, using a test stand and a rotating support system in a wind tunnel. By modifying the duct lip shape of the electric propulsor in forward flight, they aimed to enhance aerodynamic performance, including lift-to-drag ratio, pitching moment reduction, and control authority via duct-mounted control strategies. Meanwhile, Ohanian et al. [7] introduced a compact non-dimensional modeling method using only twelve coefficients to efficiently predict forces, moments, and required rotor power of ducted fan vehicles across a range of wind tunnel flight conditions.
Akturk et al. [8,9,10] conducted extensive simulation and experimental studies on ducted fan rotors, focusing on tip clearance effects, force, torque, and PIV measurements across various rotational speeds. Dimensionless parameters such as thrust coefficient, power coefficient, and figure of merit were employed to evaluate the aerodynamic characteristics of these electric thrusters.
Combining simulations with experiments, Cho et al. [11] proposed design procedures to optimize duct shapes for small UAV ducted fans, aiming to improve thrust efficiency and reduce noise. Concurrently, Brezina and Thomas [12] evaluated multiple small-scale propeller systems by measuring force, torque, and total pressure under both static and dynamic conditions, with the goal of refining prediction methods and better understanding open rotor design and electric motor characteristics.
Yilmaz et al. [13] assessed a 16-inch ducted propeller at zero angle of attack under various flight conditions to highlight the significant impact of duct shape and advance ratio on thrust and performance. McCrink and Gregory [14], using blade element momentum theory and several non-dimensional factors—including advance ratio, thrust, torque, and power coefficients—performed low Reynolds number wind tunnel experiments on open propellers to emphasize the importance of scale effects and model fidelity. In contrast, Deng [15] examined ground effect during takeoff and landing for an EDF model, demonstrating that proximity to the ground reduces thrust and increases power demand.
Research by Xiang and Xu’s groups [16,17] also investigated ground effect in aerial systems, underlining its substantial impact on control and aerodynamic behavior. The former focused on modeling and control of a novel coaxial EDF aerial robot using a nonlinear disturbance observer, while the latter compared open and shrouded rotors, showing that EDFs are more sensitive to ground proximity due to flow phenomena such as tip leakage and back pressure. Ebus et al. [18] conducted an experimental study of a small contra-rotating EDF with a thrust range of 100 N, analyzing parameters such as mass flow rate, thrust, static pressure, rotation speed, and electrical power consumption, and comparing the results with ANSYS CFX simulations.
Jiahao and Zhou [19,20] carried out thrust experiments based on rotational speed for a 150 mm diameter EDF and applied CFD to refine blade designs for a larger 400 mm model. The first study focused on improving rotor and stator configurations to increase thrust and efficiency, while the second proposed a multi-objective design strategy for distributed VTOL ducted fans aimed at optimizing thrust, efficiency, and power usage. Meanwhile, Urban et al. [21] investigated the structural configuration effects of two small EDFs (50 mm and 64 mm diameter) by measuring thrust, torque, voltage, current, and angular velocity to identify suitable UAV configurations.
Luo et al. [22] simulated the influence of wind—considering both static wind speed and wind angle—on EDF aerodynamic characteristics using a model validated through thrust (or torque) diagrams at specified rotation speeds. Grava et al. [23], on the other hand, examined crossflow effects on aerodynamic properties such as thrust, drag, and power coefficients of a small drone propeller in forward flight by varying angle of attack and Reynolds number. In parallel, Hirono et al. [24] performed aerodynamic and aeroacoustic studies on three EDF models with different design flow coefficients in both a wind tunnel and anechoic chamber to determine metrics such as thrust and power coefficients, jet velocity ratio, sound pressure level (SPL) spectra, acoustic directivity, and psychoacoustic attributes.
Many works contributed to the advancement of UAV design and control, focusing on different functional aspects such as propulsion, stability, control precision, and environmental adaptability. A common theme is the use of ducted fans and hovering flight, with several studies applying advanced techniques like CFD, reinforcement learning, or physics-informed modeling. Miyazaki et al. [25] introduced a multirotor UAV equipped with an add-on translational driving system (ATD) to perform high-pressure washing tasks at high altitudes. The system uses three ducted fans to counteract nozzle reaction forces, enabling accurate water injection and stable flight near walls using sensor feedback. Manzoor et al. [26] proposed a model predictive control (MPC) approach for ducted fan UAVs based on physics-informed machine learning. The method enhances control precision by updating system dynamics using hybrid models and demonstrates closed-loop stability through simulations. Ahmed Snikdha and Chen [27] investigated a disc-shaped VTOL UAV with a centrally mounted ducted fan and curved upper surface to improve fuel efficiency. Using CFD analysis, the design is shown to generate 95% of its lift aerodynamically during hover, reducing energy consumption. Fu et al. [28] presented a safe reinforcement learning algorithm for controlling back-transitions between flight and hover in ducted-fan UAVs. The constrained policy optimization (CPO) method ensures smooth transitions while adhering to velocity constraints and performs well under dynamic conditions.
It is evident that most of the above studies focus on EDFs with diameters under 300 mm or on open propeller models [12,14,23]. Many of these works employ dimensionless parameters—such as thrust coefficient, power coefficient, figure of merit, and advance ratio—to assess the experimental performance of ducted fans [1,2,3,4,6,7,10,12,14,15,17,22,23,24,25,27,28].
Building upon this foundation, the present paper proposes an experimental study on the static thrust characteristics of an electric Ducted Propulsion Fan, referred to as the eDPF system, developed by the Aerospace Propulsion Systems (APSs) research team at Hanoi University of Science and Technology, Vietnam. Static propulsion tests were conducted to measure thrust values over a range of rotational speeds from 2000 rpm to 7000 rpm, while varying input voltage and current. The study also includes an analysis of the correlation between electrical and aero-propulsive characteristics, as well as acoustic experiments to measure sound pressure levels.
2. Experimental Method
2.1. Facility Description
2.1.1. Electric Ducted Propulsion Fan Model
The eDPF model, partially described in previous publications by APSs [25,26], consists of 10 rotating blades and 6 stationary blades, with a duct shroud diameter of 390 mm and an average blade tip clearance of 2 mm (Table 1). This electric propulsor is primarily constructed from carbon fiber composite materials, with overall dimensions of 554 mm in length and 498 mm in nacelle diameter. The fan blades rotate counterclockwise, driven by a 32 kW Brushless Direct Current (BLDC) electric motor located at the core, allowing the eDPF to operate at rotational speeds of up to 10,000 rpm, depending on the battery, electrical, and control system configurations.
Figure 1 illustrates the main components of the eDPF, including the fan blades, strut blades, duct (shroud, lip, nacelle), tailcone, and mounting bars for attachment to the thrust test stand.
2.1.2. Thrust Testing Stand System
The thrust test stand system was developed by members and partners of the APSs research group. Figure 2 shows the key elements of the test stand setup, excluding the acoustic measurement equipment and control system. It includes the eDPF sample, support frame, working table, thrust load cell, cylindrical photoelectric sensor, and battery packs.
2.1.3. Measuring Equipments
All measurement equipment used in the static thrust testing of the eDPF was calibrated by the Vietnam Metrology Institute, as listed in Table 2. The compression-type thrust load cell is secured to the workbench using a fixed holder. The cylindrical photoelectric sensor is firmly mounted to the support frame at a distance suitable for directing the red LED beam onto the surface of a fan blade coated with a reflective layer. The microphone is mounted on a tripod at a suitable height and distance from the eDPF. Voltage and current from the battery system are measured independently and simultaneously using two digital clamp meters.
2.1.4. Battery System
The battery system powering the eDPF test setup is modular, consisting of nine rechargeable battery packs that can be connected either in series or in parallel. Each pack uses LiFePO₄ battery cells, with voltage and current ratings specified in Table 3, and efficiency guaranteed by the supplier. Configurations with 8 or 9 battery packs connected in series were tested to determine the voltage and current values for the subsequent test steps.
2.2. Experimental Setup
Figure 3 presents the schematic diagram and layout of the testing system. First, the circuit is closed using a circuit breaker located in the electrical cabinet. Then, DC power from the battery system—positioned beneath the working table—is supplied to the BLDC motor via an Electronic Speed Controller (ESC).
A 1/2” microphone is mounted on a tripod at a height of 1.5 m and a distance of 1.0 m from the fan nose. This microphone is aligned with the rotational axis of the eDPF to capture acoustic pressure fluctuations. The analog sound pressure signal is amplified and filtered using an amplifier before being digitized by the CompactDAQ system at a 20 kHz sampling rate. The digitized data is then processed to calculate Sound Pressure Level (SPL).
During operation, the support frame moves forward along the working table, transferring the thrust force to the load cell. A servo tester provides the PWM control signal to the ESC, which in turn regulates the rotational speed of the BLDC motor.
Two digital clamp meters are connected along the power line before the ESC to measure DC voltage and current. Signals from the thrust load cell, rotational speed sensor (photoelectric sensor), and microphone are transmitted to the CompactDAQ system for data acquisition and analysis.
3. Data Processing
3.1. Testing Procedure
All components involved in the eDPF static thrust testing are shown in Figure 3. A smoothing filter is applied in real time to eliminate most of the noise during data acquisition. The microphone operates at a sampling rate of 20 kHz and uses a low-pass filter amplifier for capturing audio signals.
In the next phase, data on thrust, rotational speed, and sound pressure are collected in real time on a computer using LabVIEW software. Voltage and current values are manually recorded from the digital clamp meter displays.
All measurements were carried out under identical operating conditions. Each test was repeated five times, and the average values were used as reference data. Only results with relative errors within acceptable limits were considered valid.
The testing campaign was divided into three groups:
+ Group 1: Full-range thrust tests using the 9-pack battery configuration. From these tests, the recommended voltage and current thresholds corresponding to different rotation speeds were determined.
+ Group 2: Comparative testing with 8-pack and 9-pack battery configurations. The electrical and thrust performance of the eDPF was evaluated based on both rotation speed and the number of battery packs.
+ Group 3: Acoustic measurements using the 9-pack battery configuration, assessed as a function of rotation speed.
3.2. Uncertainty Analysis
The measurement uncertainties for all equipment were verified by the Vietnam Metrology Institute and are detailed in Table 2.
To evaluate measurement accuracy, the relative error for each measurement was required to be less than 5%. The relative error is defined as the ratio of the average difference between the measured and reference values to the applied value for each test. All data presented in the experimental results section exhibit relative errors below 5%, confirming that the uncertainties of both the instruments and measurements remain within acceptable bounds.
4. Experimental Results and Discussion
4.1. Experimental by Thrust Range
Initially, the battery system is fully utilized with 9 packs. The eDPF rotational speed is then gradually increased to explore the relationships that vary across the thrust range.
Figure 4 shows that with 9 battery packs, the voltage decreases from 117.9 V to 106.8 V, while the thrust increases from 100 N to 650 N in increments of 50 N. To increase thrust, the potentiometer is adjusted to raise the current through the ESC’s PWM pulse chopper wire. In practice, the current rises from 20.4 A to 330.9 A, indicating that current increases proportionally with thrust and inversely with voltage. Furthermore, the graph in Figure 4 shows that as both current and thrust increase, the input power also rises—from 2.40 kW to 35.34 kW.
Figure 5 presents additional relationships between current, thrust, and rotational speed. As thrust increases from 100 N to 650 N, the rotational speed increases from approximately 2828 rpm to 7469 rpm.
Although the ESC can handle high current and power levels, the manufacturer recommends not exceeding voltage and current thresholds of 120 V and 300 A, respectively. At a thrust value of 600 N, the voltage is 107.7 V, the current is 288.8 A, the power is 31.10 kW, and the rotational speed is approximately 7208 rpm.
This means that to operate within the safe working limits of the ESC and BLDC, the eDPF should not be adjusted to achieve 600 N of thrust. For subsequent tests, the current should be kept below 280 A and the rotational speed below 7200 rpm, which remain within the ESC and BLDC's recommended operational range.
4.2. Experimental by Battery Pack Number
In this test step, the number of battery packs is varied with the aim of adjusting the input voltage. During this phase, eDPF operation is monitored across a rotational speed range from 2000 rpm to 7000 rpm, with increments or decrements of 500 rpm.
Figure 6 shows that when using 8 battery packs, the voltage decreases from 105.2 V at 2000 rpm to 95.5 V at 6500 rpm. Meanwhile, with 9 battery packs, the voltage decreases from 117.9 V at 2000 rpm to 106.2 V at 7000 rpm. Notably, the maximum voltage in the 8-pack configuration is still lower than the minimum voltage in the 9-pack configuration. This allows for seamless and continuous monitoring of voltage variations.
Figure 6, Figure 7 and Figure 8 reveal a recurring pattern in the 8 battery pack case: as rotational speed increases, voltage and power demand also increase, resulting in increased thrust, while voltage tends to drop.
Figure 6 also shows that the maximum rotational speed achievable with 8 battery packs is 6500 rpm, whereas with 9 battery packs, it can reach 7000 rpm—both within the system's safe operating threshold. Additionally, at the same rotational speed, since the voltage supplied by the 8-pack configuration is lower than that of the 9-pack, a higher current is required when using 8 packs. As speed increases, the difference in current between the two configurations becomes more pronounced due to higher energy demand. Specifically, at 6500 rpm, 8 battery packs must supply approximately 254.4 A, while 9 battery packs supply only about 229.3 A—a difference of around 25.1 A.
Since electrical power is proportional to the square of the current and inversely proportional to voltage, a faster rise in current intensity results in more heat generation in the wires and electrical equipment, leading to increased thermal losses over time. Therefore, based on Figure 6, prolonged use of the 8-pack battery configuration will result in higher heat losses compared to the 9-pack configuration, especially at medium to high rotational speeds (from 4500 rpm and above).
Figure 7 shows a slight difference in input power at each rotational speed, particularly from 4500 rpm and higher. Meanwhile, Figure 8 indicates a small variation in thrust between the two configurations in the 4500–6500 rpm range. Specifically, the thrust produced by 8 battery packs is slightly higher than that produced by 9 packs. At 6000 rpm, the 8-pack setup enables the eDPF to generate about 444 N of thrust, while the 9-pack setup delivers around 421 N—a difference of about 23 N.
4.3. Aeroacoustic Testing
To reduce the impact of vibration when placed too close to the eDPF operating at high speeds, a distance of 1.0 m is selected along the axis of rotation and from the fan tip to the location where the tripod is placed to mount the microphone.
Figure 9 and Figure 10 show that as the rotational speed increases from 2000 rpm to 7500 rpm, the SPL also rises from 84.8 dB to 117.9 dB. This indicates that even at low rotational speeds, the noise generated near the eDPF reaches uncomfortable levels. At high rotational speeds, the noise approaches 120 dB—comparable to the sound level at a concert—which can be harmful to human hearing with prolonged exposure. Therefore, hearing protection headphones are required for participants during this eDPF test.
4.4. Relationship Between Electrical and Aero-Propulsion Characteristics
To clarify the relationship between independent quantities related to electrical and aerodynamic properties, the ratios between them are examined.
Figure 11 shows that as thrust increases from 100 N to 650 N, the ratio of rotational speed to voltage increases slightly from 24.0 rpm/V to 69.9 rpm/V, while the ratio of rotational speed to current decreases sharply from 129.0 rpm/A to 22.6 rpm/A. Accordingly, the ratio of rotational speed to electric power also drops significantly from 1178.7 rpm/kW to 211.4 rpm/kW. This confirms that the increase in thrust or rotational speed depends more on current and electric power than on input voltage.
Figure 12 and Figure 13 show the ratios of thrust to current, voltage, and power for both 8- and 9-battery pack configurations. As the rotational speed increases, these ratios follow the same patterns as analyzed in Figure 11. However, the thrust-to-current ratio in the case of 9 battery packs is higher than that of 8 battery packs, while the thrust-to-voltage ratio is lower. For the thrust-to-power ratio, there is almost no difference between the two battery configurations at rotational speeds from 2500 rpm to 6500 rpm. Remarkably, at 2000 rpm, the 9-battery pack configuration yields a much higher thrust-to-current and thrust-to-power ratio than the 8-battery pack configuration. This may suggest that the 9-battery pack setup provides better initial power.
4.5. Non-Dimensional eDPF Data
For further evaluation, a proposal for dimensionless analysis of the investigated quantities—similar to many previous studies—was adopted [1,2,3,4,6,7,10,12,14,15,17,22,23,24]. Accordingly, in this study, three dimensionless quantities are proposed: the power coefficient (CP), thrust coefficient (CT), and figure of merit (FM).
These quantities are calculated as follows:
where ρ is the air density under the test conditions (approximately 25°C), i.e., ρ = 1.225 kg/m³; Ω is the fan rotation speed (rpm); and D is the fan blade diameter (m), i.e., D = 0.386 m (excluding the blade tip clearance).
Thus, non-dimensional quantities essentially help eliminate the effects of scale and environmental conditions, allowing the studied propeller configuration to be assessed in a more generalized manner.
Figure 14, Figure 15 and Figure 16 show that as the rotational speed increases from 2000 rpm to 7000 rpm, CP, CT, and FM generally decrease. At moderate rotational speeds, between 3000 rpm and 6000 rpm, the 8-pack configuration appears slightly more efficient due to higher CP and CT values. However, at low rotational speeds of 2000 rpm and 2500 rpm, the 9-pack configuration performs more efficiently.
FM represents the efficiency of thrust generation relative to the supplied energy. A value of FM closer to 1 implies lower energy loss and higher overall efficiency of the eDPF. Figure 16 indicates that FM ranges from about 0.66 (8-pack battery case at 2000 rpm) to about 0.83 (9-pack battery case at 2000 rpm). At medium rotational speeds, the FM value fluctuates around 0.7–0.75. These results suggest that the 8-pack battery configuration operates inefficiently at low rotational speeds, while the eDPF exhibits good energy conversion efficiency at medium speeds, with approximately 70%–75% of the supplied energy being converted into thrust.
5. Conclusions
In summary, this experimental study has initially carried out several tasks, including a survey based on thrust range and the number of battery packs. In addition, the study evaluated the relationship between the electrical and aerodynamic characteristics of the eDPF system and provided a preliminary assessment of aeroacoustic measurements. The main conclusions drawn from the study are as follows:
- The study investigated static thrust—without considering wind effects—under various settings of thrust range, rotational speed, number of battery packs, and aerodynamic noise.
- In all cases, as thrust or rotational speed increases—regardless of whether 8 or 9 battery packs are used—input power, input current, and SPL all increase significantly, while input voltage decreases slightly.
- The increase in current must be controlled within the safe operating thresholds of the ESC and BLDC.
- Depending on the battery configuration, the maximum rotational speed of the eDPF system can reach 6500 rpm or up to 7000 rpm.
- Noise from the eDPF system may become hazardous to hearing when nearing the 120 dB threshold at high speeds of 6000 rpm and above.
- Starting from the average rotational speed of 4500 rpm, to maintain the same speed, the 8-pack battery configuration requires a higher current, resulting in greater heat loss over time and negatively impacting system performance.
- The 8-pack battery configuration provides better thrust per volt supplied, whereas the 9-pack configuration delivers better thrust per ampere and improved starting power.
- As rotational speed increases, the CP, CT, and FM indices all tend to decrease, indicating that the eDPF system operates more efficiently at lower speeds.
- The FM index at medium rotational speeds fluctuates between 0.7 and 0.75, indicating that the eDPF system has a relatively high capability to convert input energy into thrust.
Based on the above experimental results and analysis, this study identifies several areas for improvement and further exploration in future research, including:
- Considering the influence of inlet wind on the thrust of the test system;
- Adding more aerodynamic experiments such as pressure probes, PIV, and flow visualization (colored smoke);
- Expanding the acoustic experiments by establishing sound directivity and using sound cameras;
- Investigating structural properties such as vibration;
- Adding verification between experimental and numerical simulation results.
Author Contributions
Hoang-Quan Chu conceived the research idea, conducted the experiments, and drafted the manuscript. Quang-Ngoc Dinh and Thai-Son Vu assisted with the experimental work and analyzed the experimental data. Van-Yen Pham and Van-Trung Bui were responsible for constructing the mechanical components of the thrust testing stand. Nhat-Minh Hoang processed the acoustic data. Trung-Kien Nguyen reviewed and edited the manuscript. Gia-Diem Pham provided consultation and oversaw the control and battery systems. Cong-Truong Dinh secured financial support and assumed overall responsibility for the project.
Funding
This work supported by the Ministry of Education and Training, Vietnam under Project No. B2023-BKA-11.
Acknowledgments
The authors would like to express their sincere thanks to the Ministry of Education and Training, Vietnam for providing the budget of this project.
Conflicts of Interest
The authors declare no conflict of interest.
Nomenclature
| D | fan blade diameter (m) |
| Greek | |
| ρ | density of air (kg/m3) |
| Ω | fan rotation speed (rpm) |
| Subcripts | |
| P | Power |
| T | Thrust |
| Acronyms | |
| APSs | Aerospace Propulsion Systems |
| BLDC | Brushless Direct Current |
| CP | Power Coefficient |
| CT | Thrust Coefficient |
| DAQ | Data Acquisition |
| EDF | Electric Ducted Fan |
| eDPF | electric Ducted Propulsion Fan |
| ESC | Electronic Speed Controller |
| EXP | Experimental |
| FM | Figure of Merit |
| PIV | Particle Image Velocimetry |
| PWM | Pulse Width Modulation |
| RPM | Revolutions Per Minute |
| S/VTOL | Short / Vertical Takeoff and Landing |
| SPL | Sound Pressure Level |
| UAV | Unmanned Aerial Vehicle |
References
- Kondor, S.A.; Lee, W.; Englar, R.J.; Moore, M.D. Experimental investigation of circulation control on a shrouded fan, 21st AIAA Applied Aerodynamics Conference, 2003. [CrossRef]
- Kondor, S.A.; Moore, M. Experimental investigation of a morphing nacelle ducted fan, NASA / ONR Circulation Control Workshop, 2004, 435–468. https://ntrs.nasa.gov/citations/20050192632.
- Kondor, S.A. Further experimental investigation of circulation control morphing shrouded fan, 43rd AIAA Aerospace Sciences Meeting and Exhibit - Meeting Papers, 2005, 7765–7772. [CrossRef]
- Martin, P.; Tung, C. Performance and flow field measurements on a 10-inch ducted rotor VTOL UAV, Proceedings of the 60th Annual Forum of the American Helicopter Society, 2004. https://ntrs.nasa.gov/citations/20050009943.
- Martin, P.B.; Boxwell, D.A. Design, analysis, and experiments on a 10-inch ducted rotor VTOL UAV, AHS International Specialists’ Meeting - Unmanned Rotorcraft, 2005, 399–420. https://www.researchgate.net/publication/259039691.
- Graf, W.; Fleming, J.; Ng, W. Improving ducted fan UAV aerodynamics in forward flight, 46th AIAA Aerospace Sciences Meeting and Exhibit, 2008. [CrossRef]
- Ohanian, O.J.; Gelhausen, P.A.; Inman, D.J. A compact method for modeling the aerodynamics of ducted fan vehicles, 48th AIAA Aerospace Sciences Meeting, 2010. [CrossRef]
- Akturk, A.; Shavalikul, A.; Camci, C. PIV measurements and computational study of a 5-inch ducted fan for V/STOL UAV applications, 47th AIAA Aerospace Sciences Meeting, 2009. [CrossRef]
- Akturk, A.; Camci, C. Experimental and computational assessment of a ducted-fan rotor flow model, Journal of Aircraft, 2012, 49, 885–897. [CrossRef]
- Akturk, A.; Camci, C. Tip clearance investigation of a ducted fan used in VTOL unmanned aerial vehicles—Part I: Baseline experiments and computational validation, Journal of Turbomachinery, 2013, 136(2), 021004. [CrossRef]
- Cho, B.L.; Lee, S.; Cho, J. Numerical and experimental analyses of the ducted fan for the small VTOL UAV propulsion, Transactions of the Japan Society for Aeronautical and Space Sciences, 2013, 56(6), 328–336. [CrossRef]
- Brezina, A.J.; Thomas, S.K. Measurement of static and dynamic performance characteristics of electric propulsion systems, 51st AIAA Aerospace Sciences Meeting, 2013. [CrossRef]
- Yilmaz, S.; Erdem, D.; Kavsaoglu, M.S. Performance of a ducted propeller designed for UAV applications at zero angle of attack flight: An experimental study, Aerospace Science and Technology, 2015, 45, 376–386. [CrossRef]
- McCrink, M.H.; Gregory, J.W. Blade element momentum modeling of low-Reynolds electric propulsion systems, Journal of Aircraft, 2017, 54, 163–176. [CrossRef]
- Deng, Y. Experimental investigation on ground effect of ducted fan system for VTOL UAV, Lecture Notes in Electrical Engineering, 2019, 459, 1602–1609. [CrossRef]
- Ai, T.; Xu, B.; Xiang, C.; Fan, W.; Zhang, Y. Aerodynamic analysis and control for a novel coaxial ducted fan aerial robot in ground effect, International Journal of Advanced Robotic Systems, 2020, 17(4). [CrossRef]
- Han, H.; Xiang, C.; Xu, B.; Yu, Y. Experimental and computational investigation on comparison of micro-scale open rotor and shrouded rotor hovering in ground effect, Proceedings of the Institution of Mechanical Engineers, Part G: Journal of Aerospace Engineering, 2021, 235(5), 553–565. [CrossRef]
- Ebus, T.; Dietz, M.; Hupfer, A. Experimental and numerical studies on small contra-rotating electrical ducted fan engines, CEAS Aeronautical Journal, 2021, 12(3), 559–571. [CrossRef]
- Guo, J.; Zhou, Z. An efficient blade design method of a ducted fan coupled with the CFD modification, Aerospace, 2022, 9(5). [CrossRef]
- Guo, J.; Zhou, Z. Multi-objective design of a distributed ducted fan system, Aerospace, 2022, 9(3). [CrossRef]
- Urban, D.; Kusmirek, S.; Socha, V.; Hanakova, L.; Hylmar, K.; Kraus, J. Effect of electric ducted fans structural arrangement on their performance characteristics, Applied Sciences, 2023, 13(5). [CrossRef]
- Luo, Y.; Ai, T.; He, Y.; Xu, B.; Qian, Y.; Zhang, Y. Numerical analysis of wind effects on aerodynamic characteristics of a ducted fan, Chinese Journal of Aeronautics, 2024, 37(5), 263–280. [CrossRef]
- Grava, A.; Jacopo, S.; Gaetano, I.; Luis, B.; Gioacchino, C. Experimental investigation of a small drone propeller aerodynamics in forward flight, Journal of Aircraft, 2024, Article in Advance, 1–12. [CrossRef]
- Hirono, F.C.; Torija, A.J.; Grimshaw, S.D.; Cousins, D.; Farman, J.; Taylor, J.V. Aerodynamic and aeroacoustic design of electric ducted fans, Aerospace Science and Technology, 2024, 153, 109411. [CrossRef]
- Miyazaki, R.; Paul, H.; Kominami, T.; Martinez, R.R.; Shimonomura, K. Flying Washer: Development of High-Pressure Washing Aerial Robot Employing Multirotor Platform with Add-On Thrusters. Drones 2022, 6, 286. [Google Scholar] [CrossRef]
- Manzoor, T.; Pei, H.; Sun, Z.; Cheng, Z. Model Predictive Control Technique for Ducted Fan Aerial Vehicles Using Physics-Informed Machine Learning. Drones 2023, 7, 4. [Google Scholar] [CrossRef]
- Ahmed Snikdha, S.S.; Chen, S.-H. A Computational Investigation of the Hover Mechanism of an Innovated Disc-Shaped VTOL UAV. Drones 2023, 7, 105. [Google Scholar] [CrossRef]
- Fu, Y. ; Zhao,W. ; Liu, L. Safe Reinforcement Learning for Transition Control of Ducted-Fan UAVs. Drones 2023, 7, 332 https:// doiorg/103390/drones7050332. [Google Scholar]
Figure 1.
Photograph of the electric Ducted Propulsion Fan.
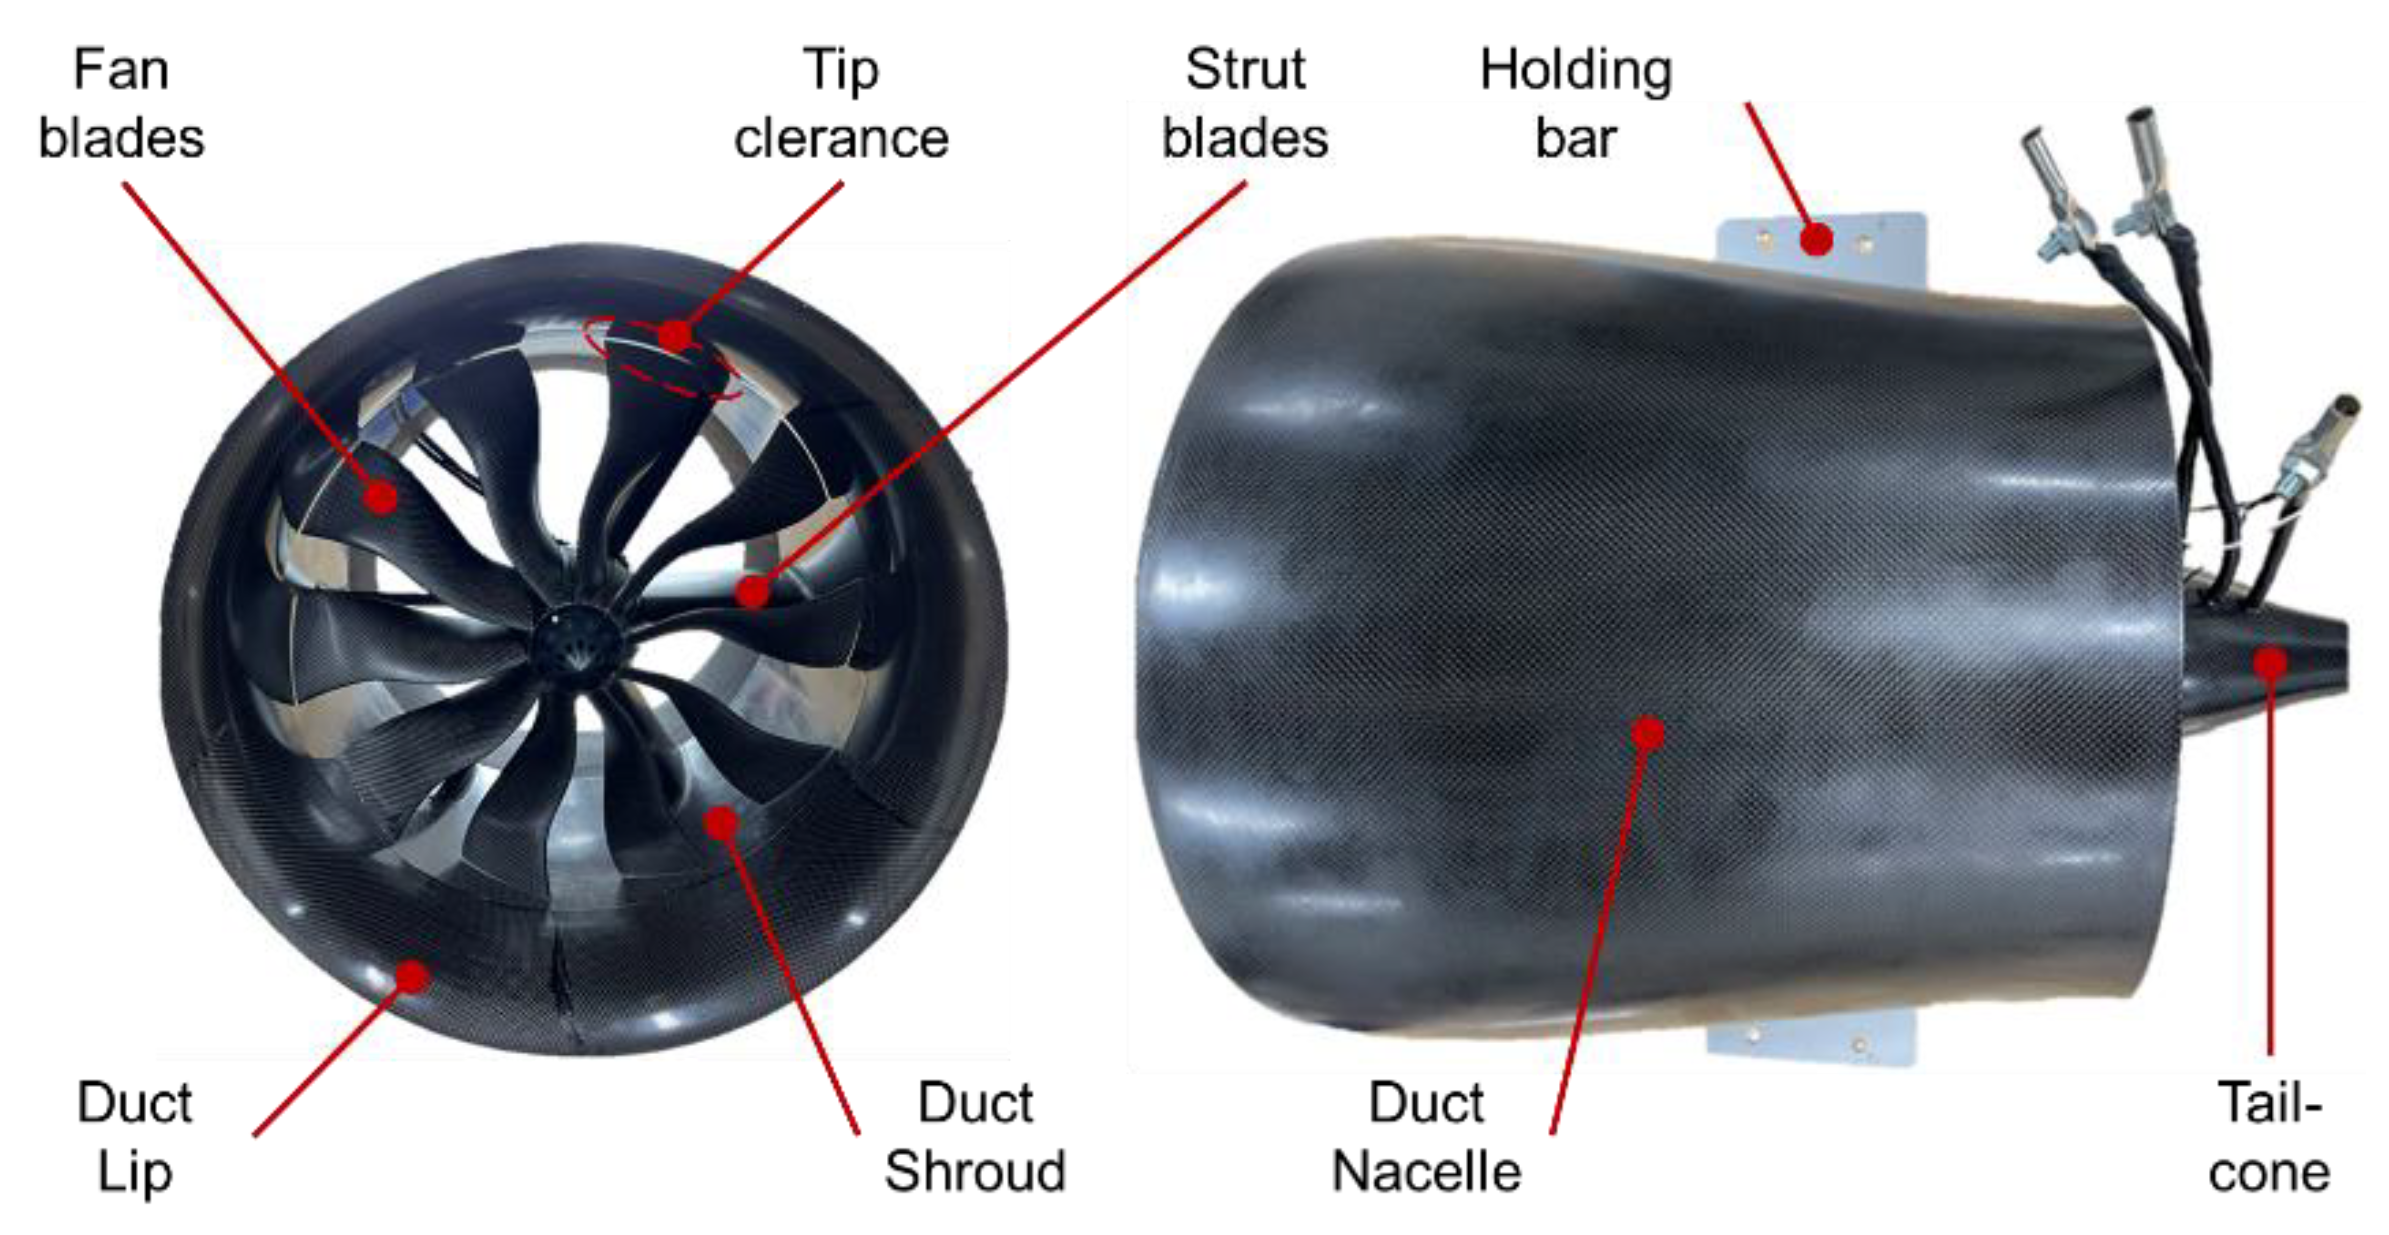
Figure 2.
Photograph of the thrust testing stand system.
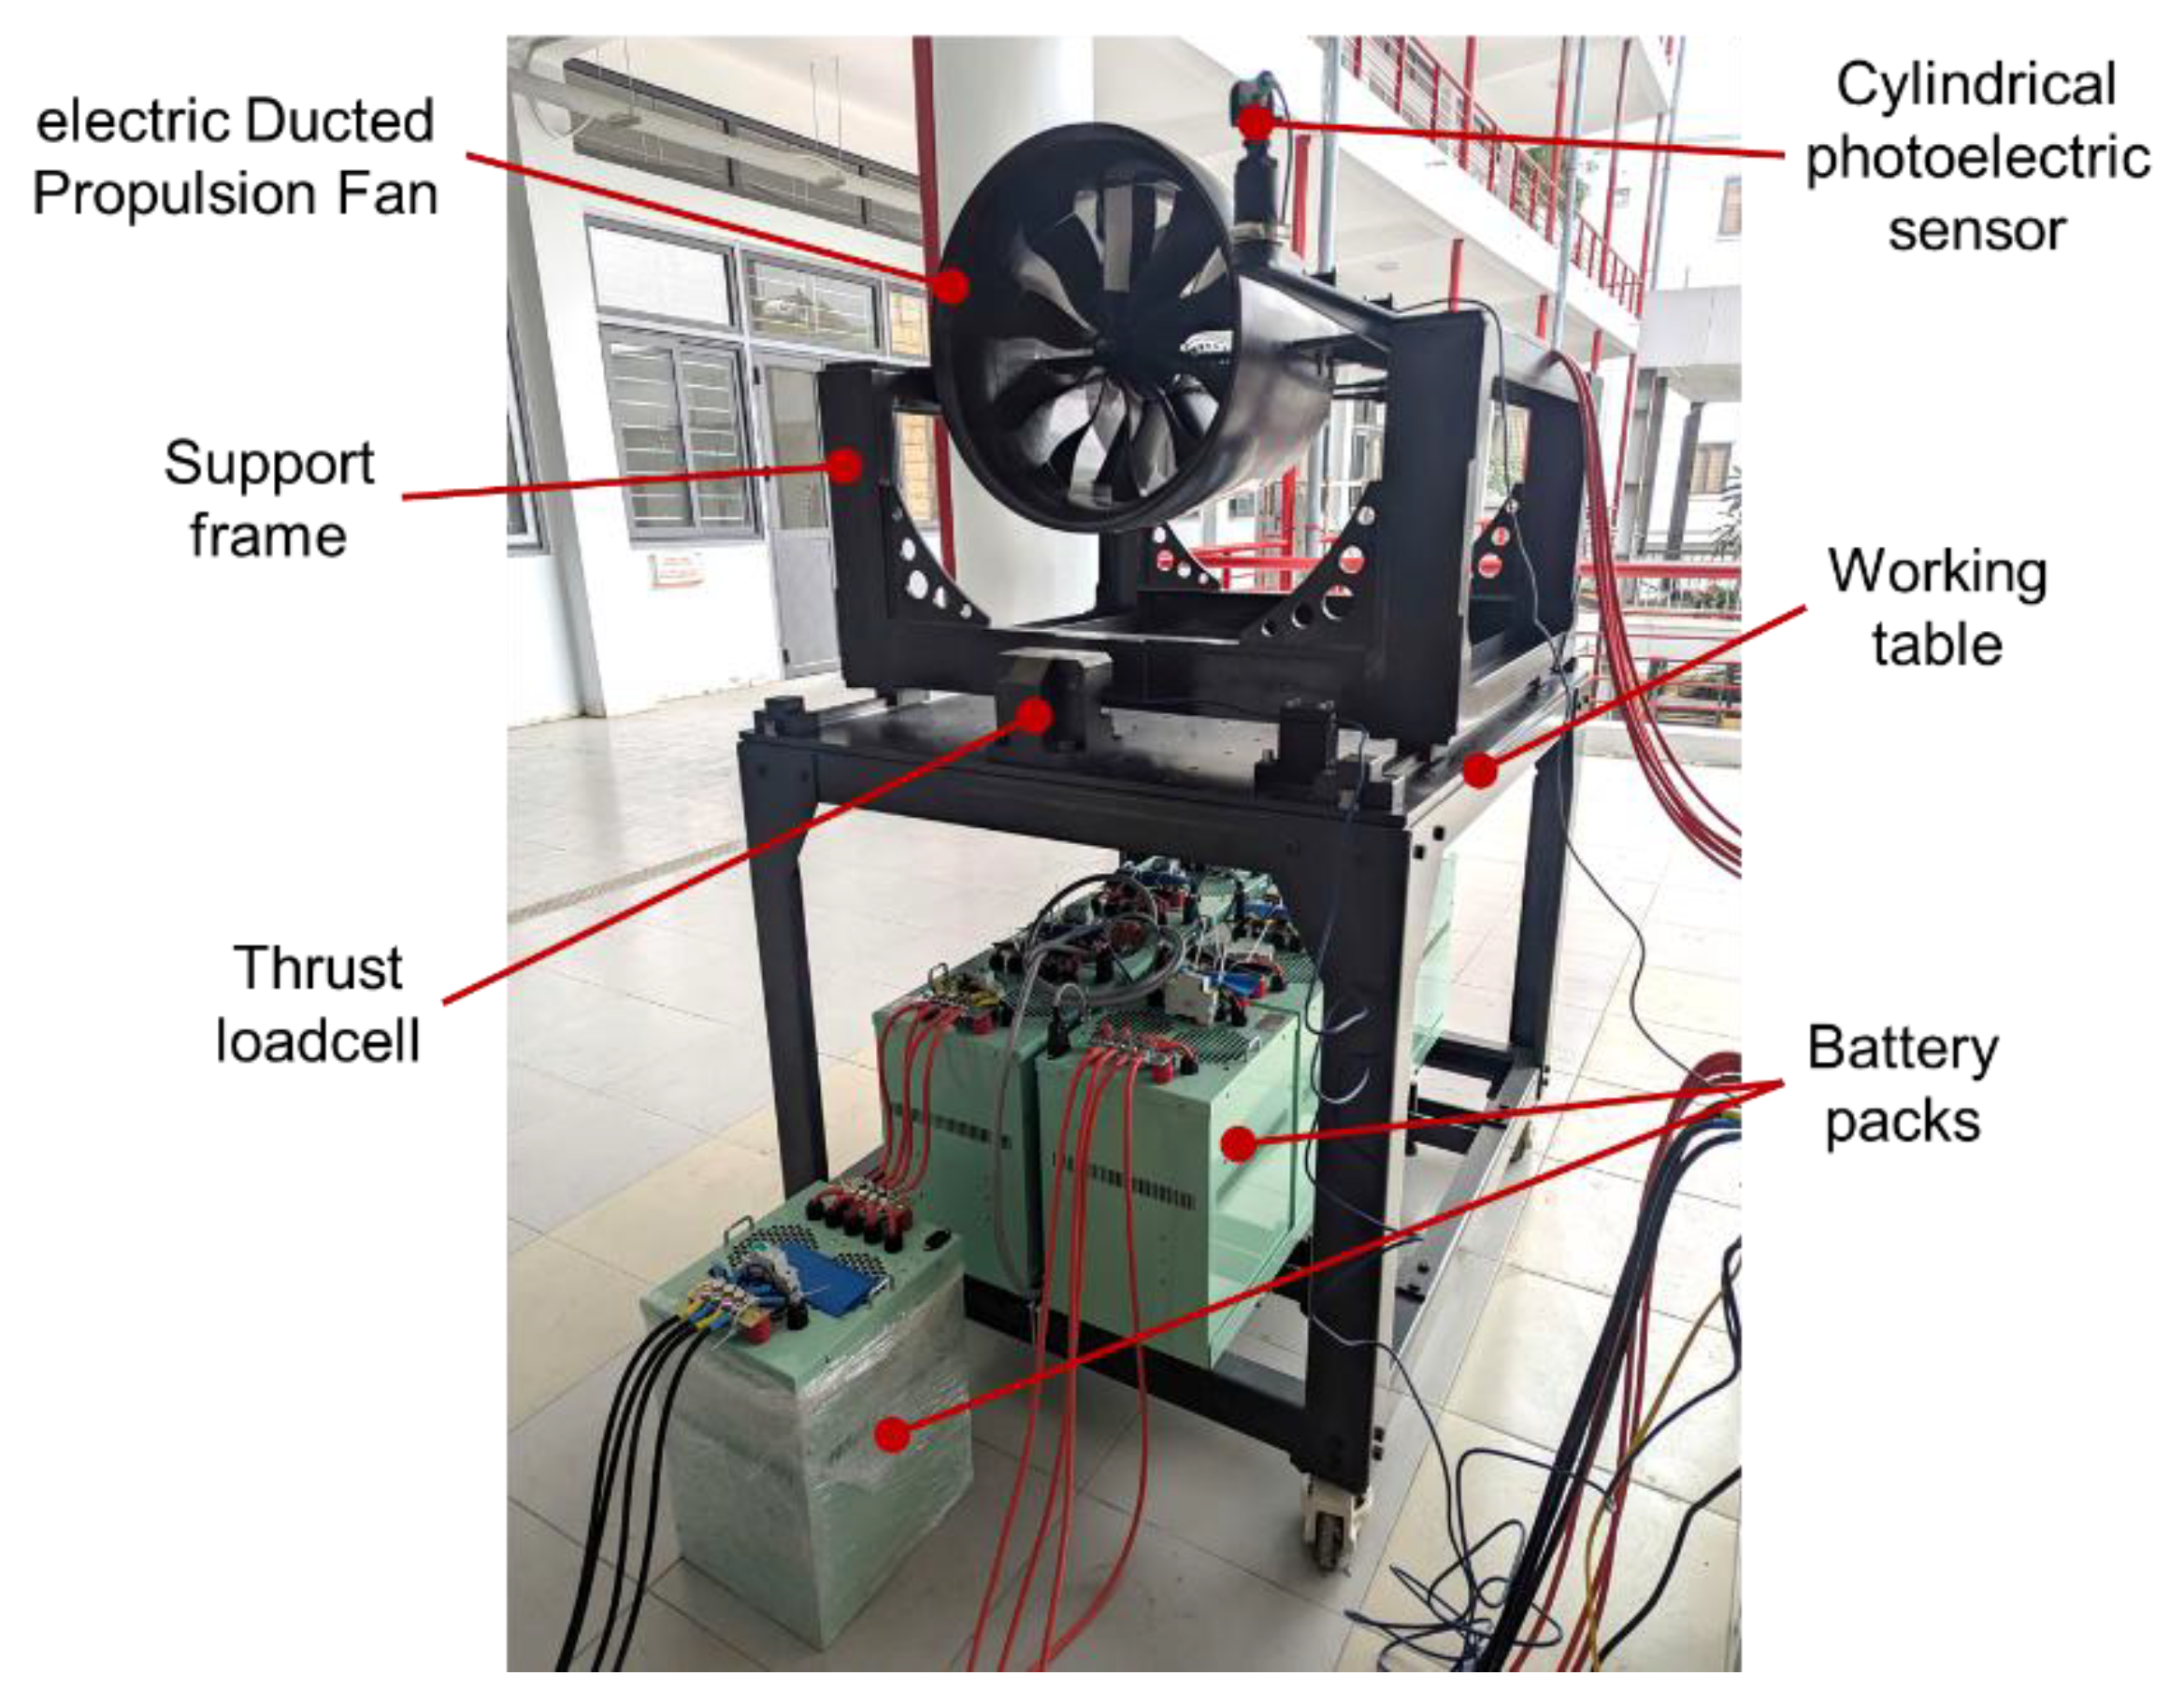
Figure 3.
Schematic diagram for static aero-propulsion testing.
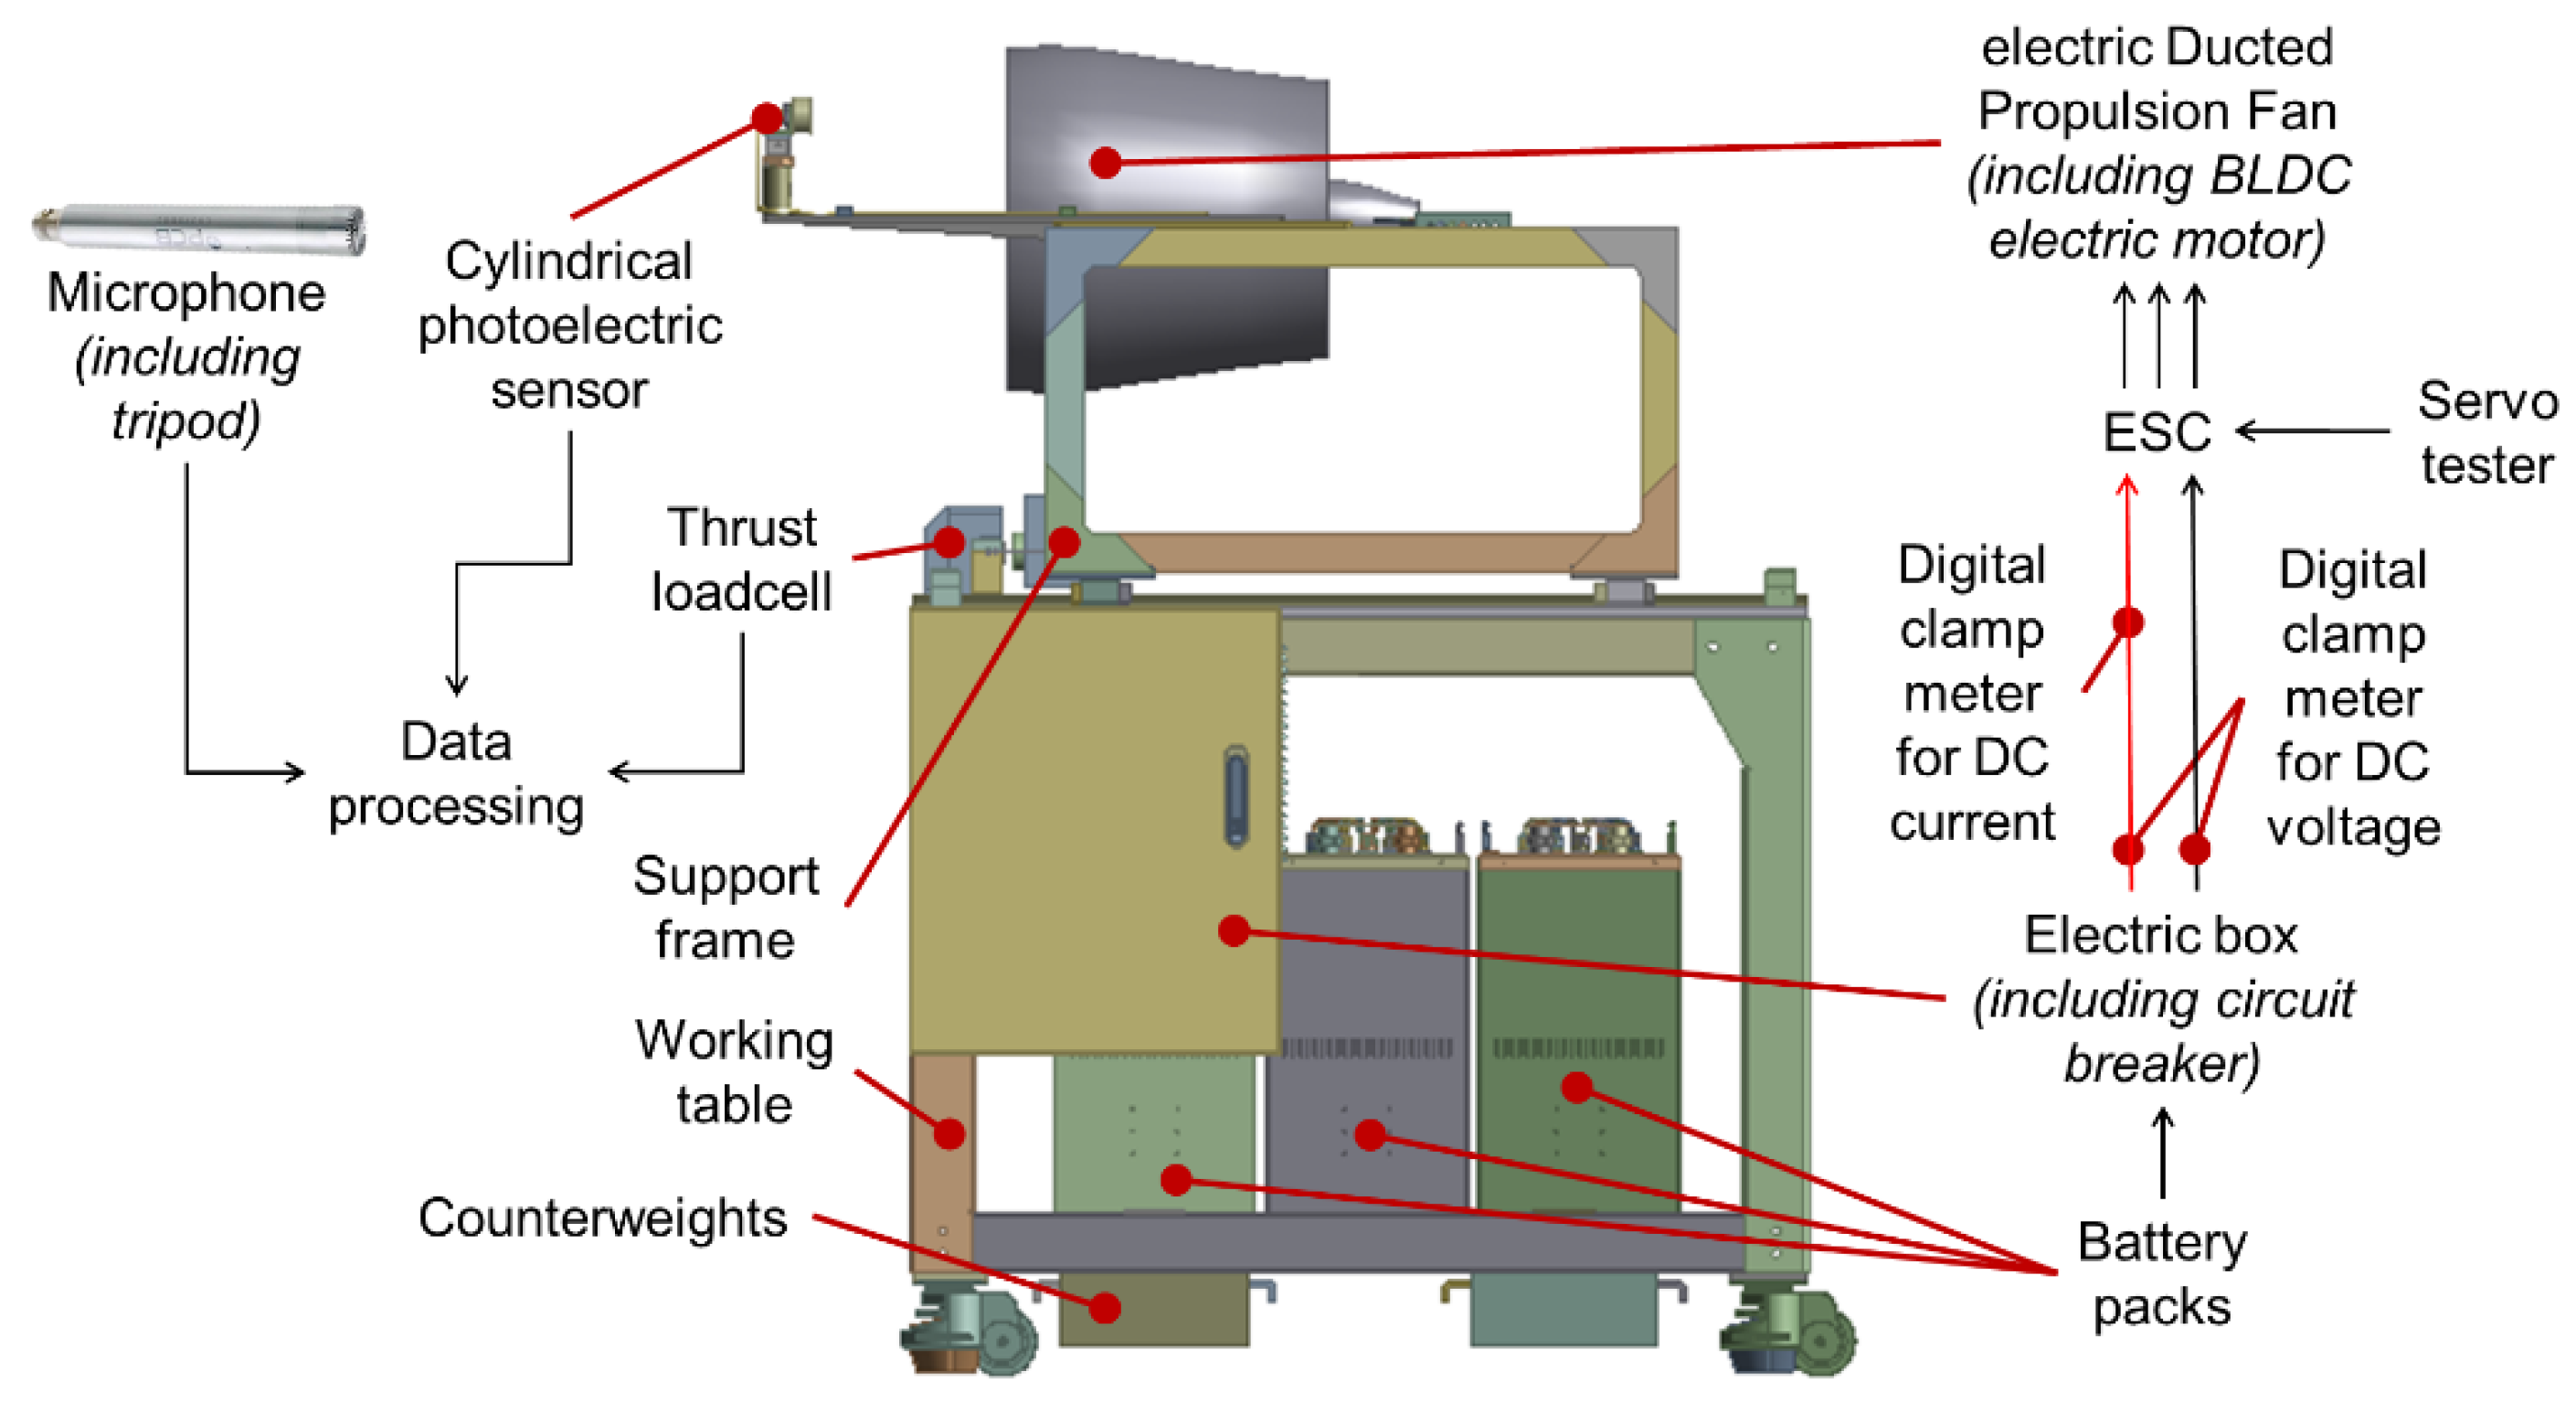
Figure 4.
Electric testing according to thrust range.
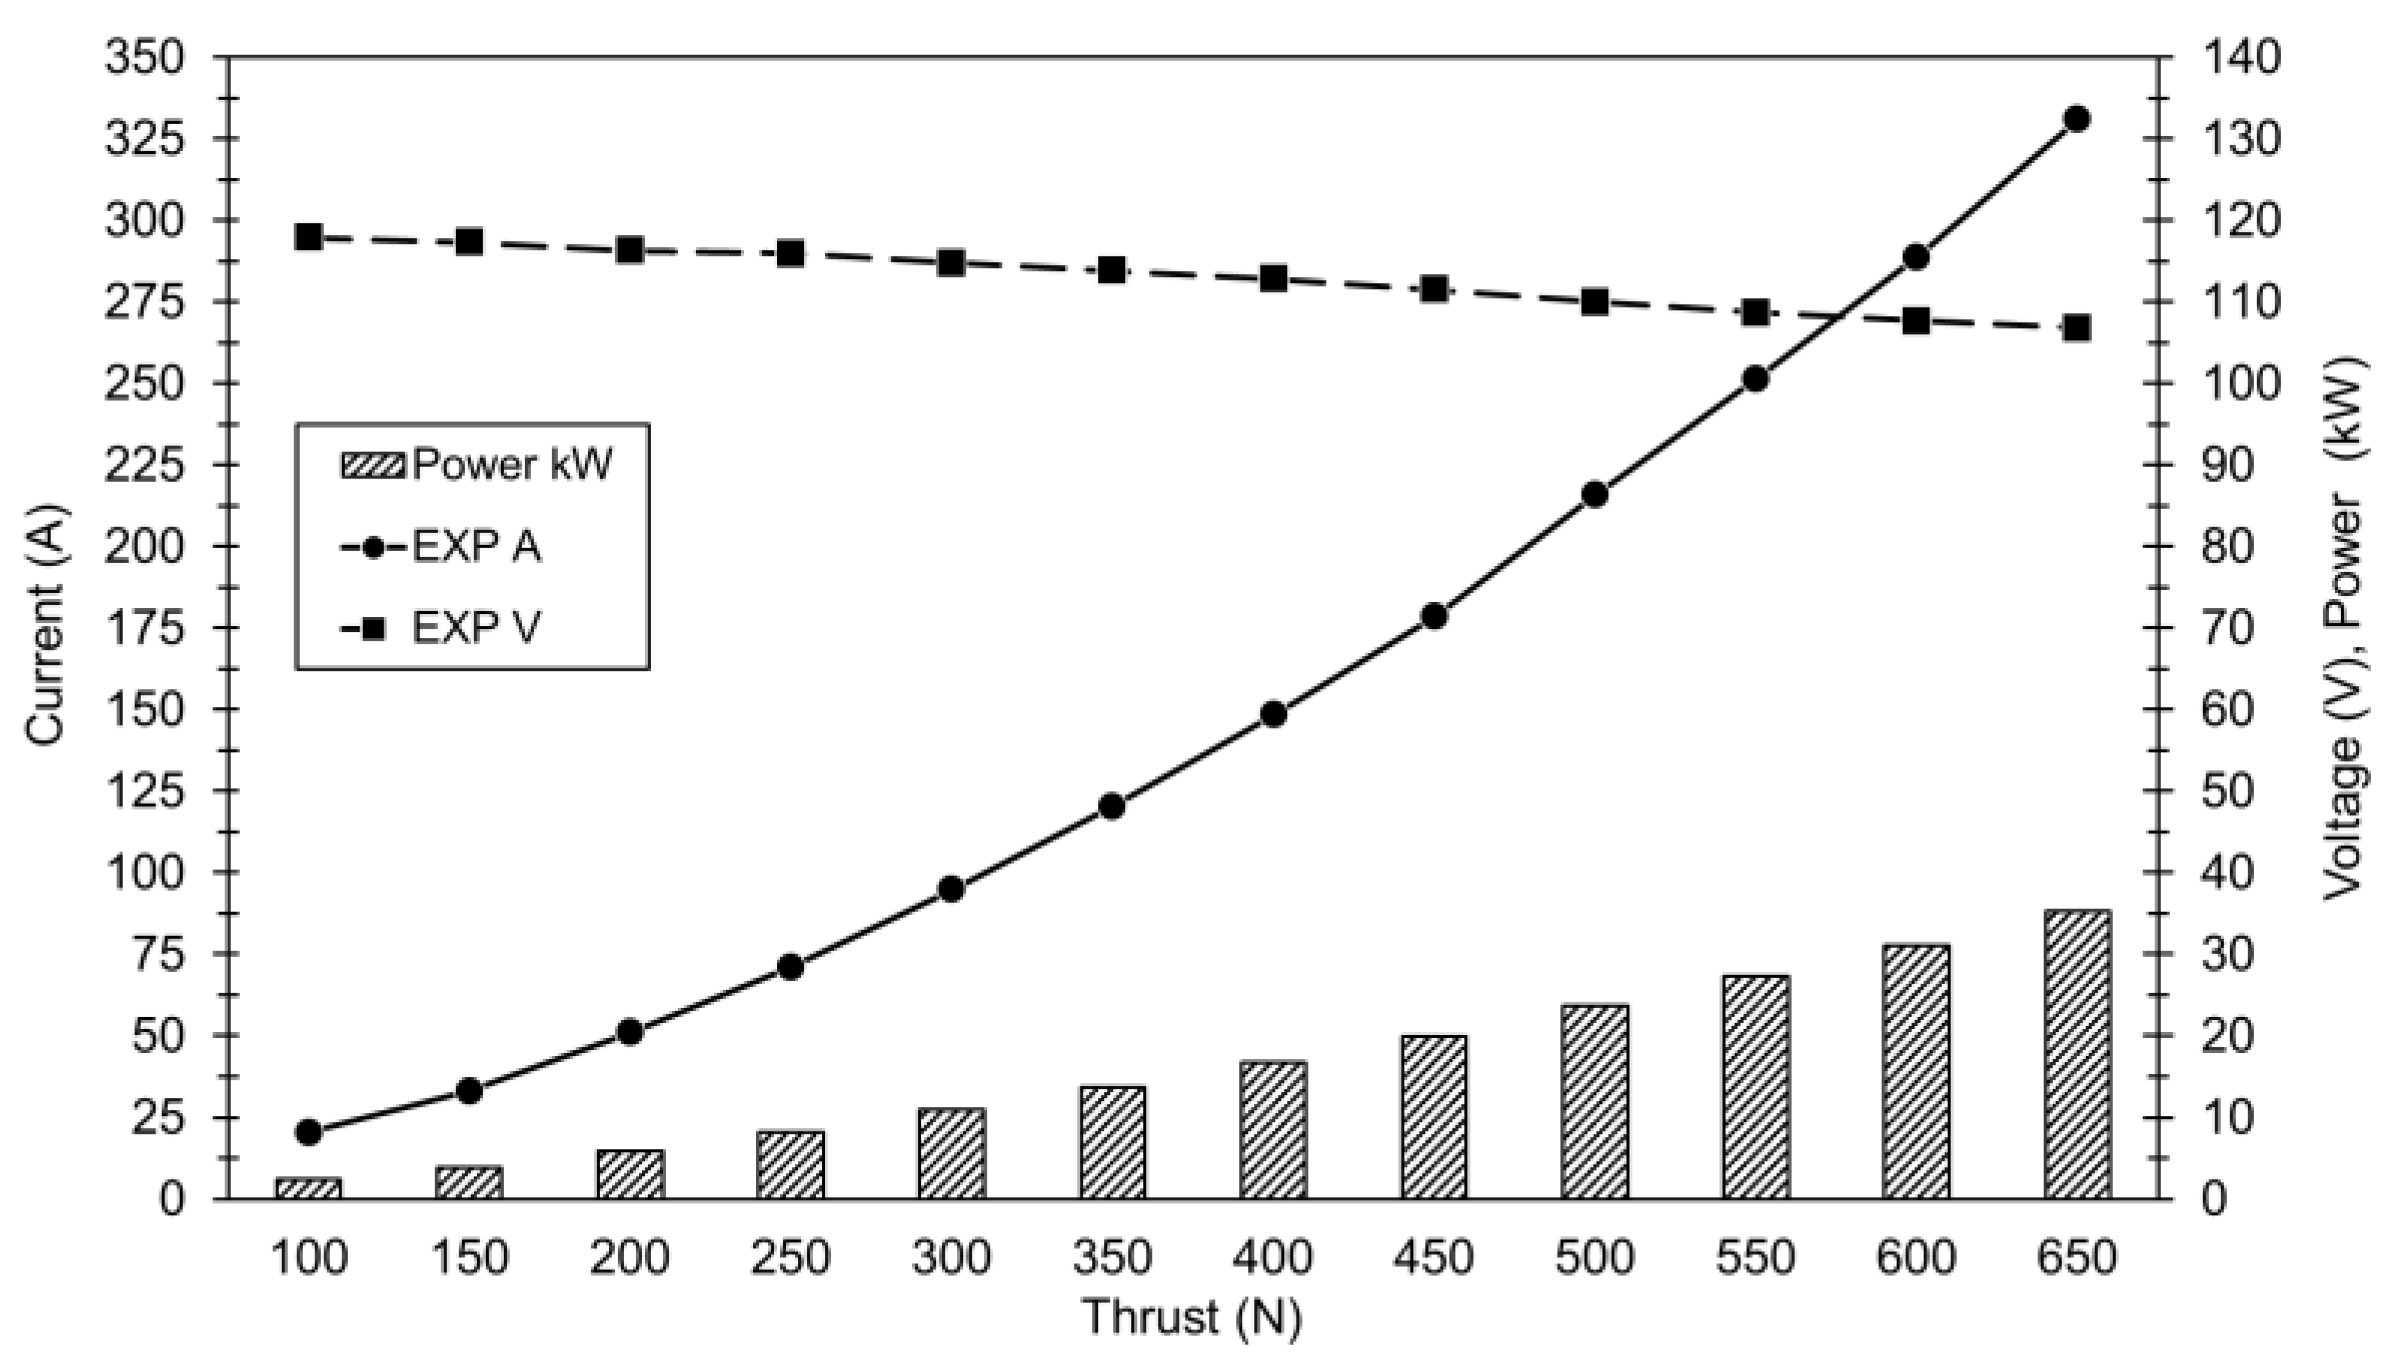
Figure 5.
Aero-propulsion testing according to thrust range.
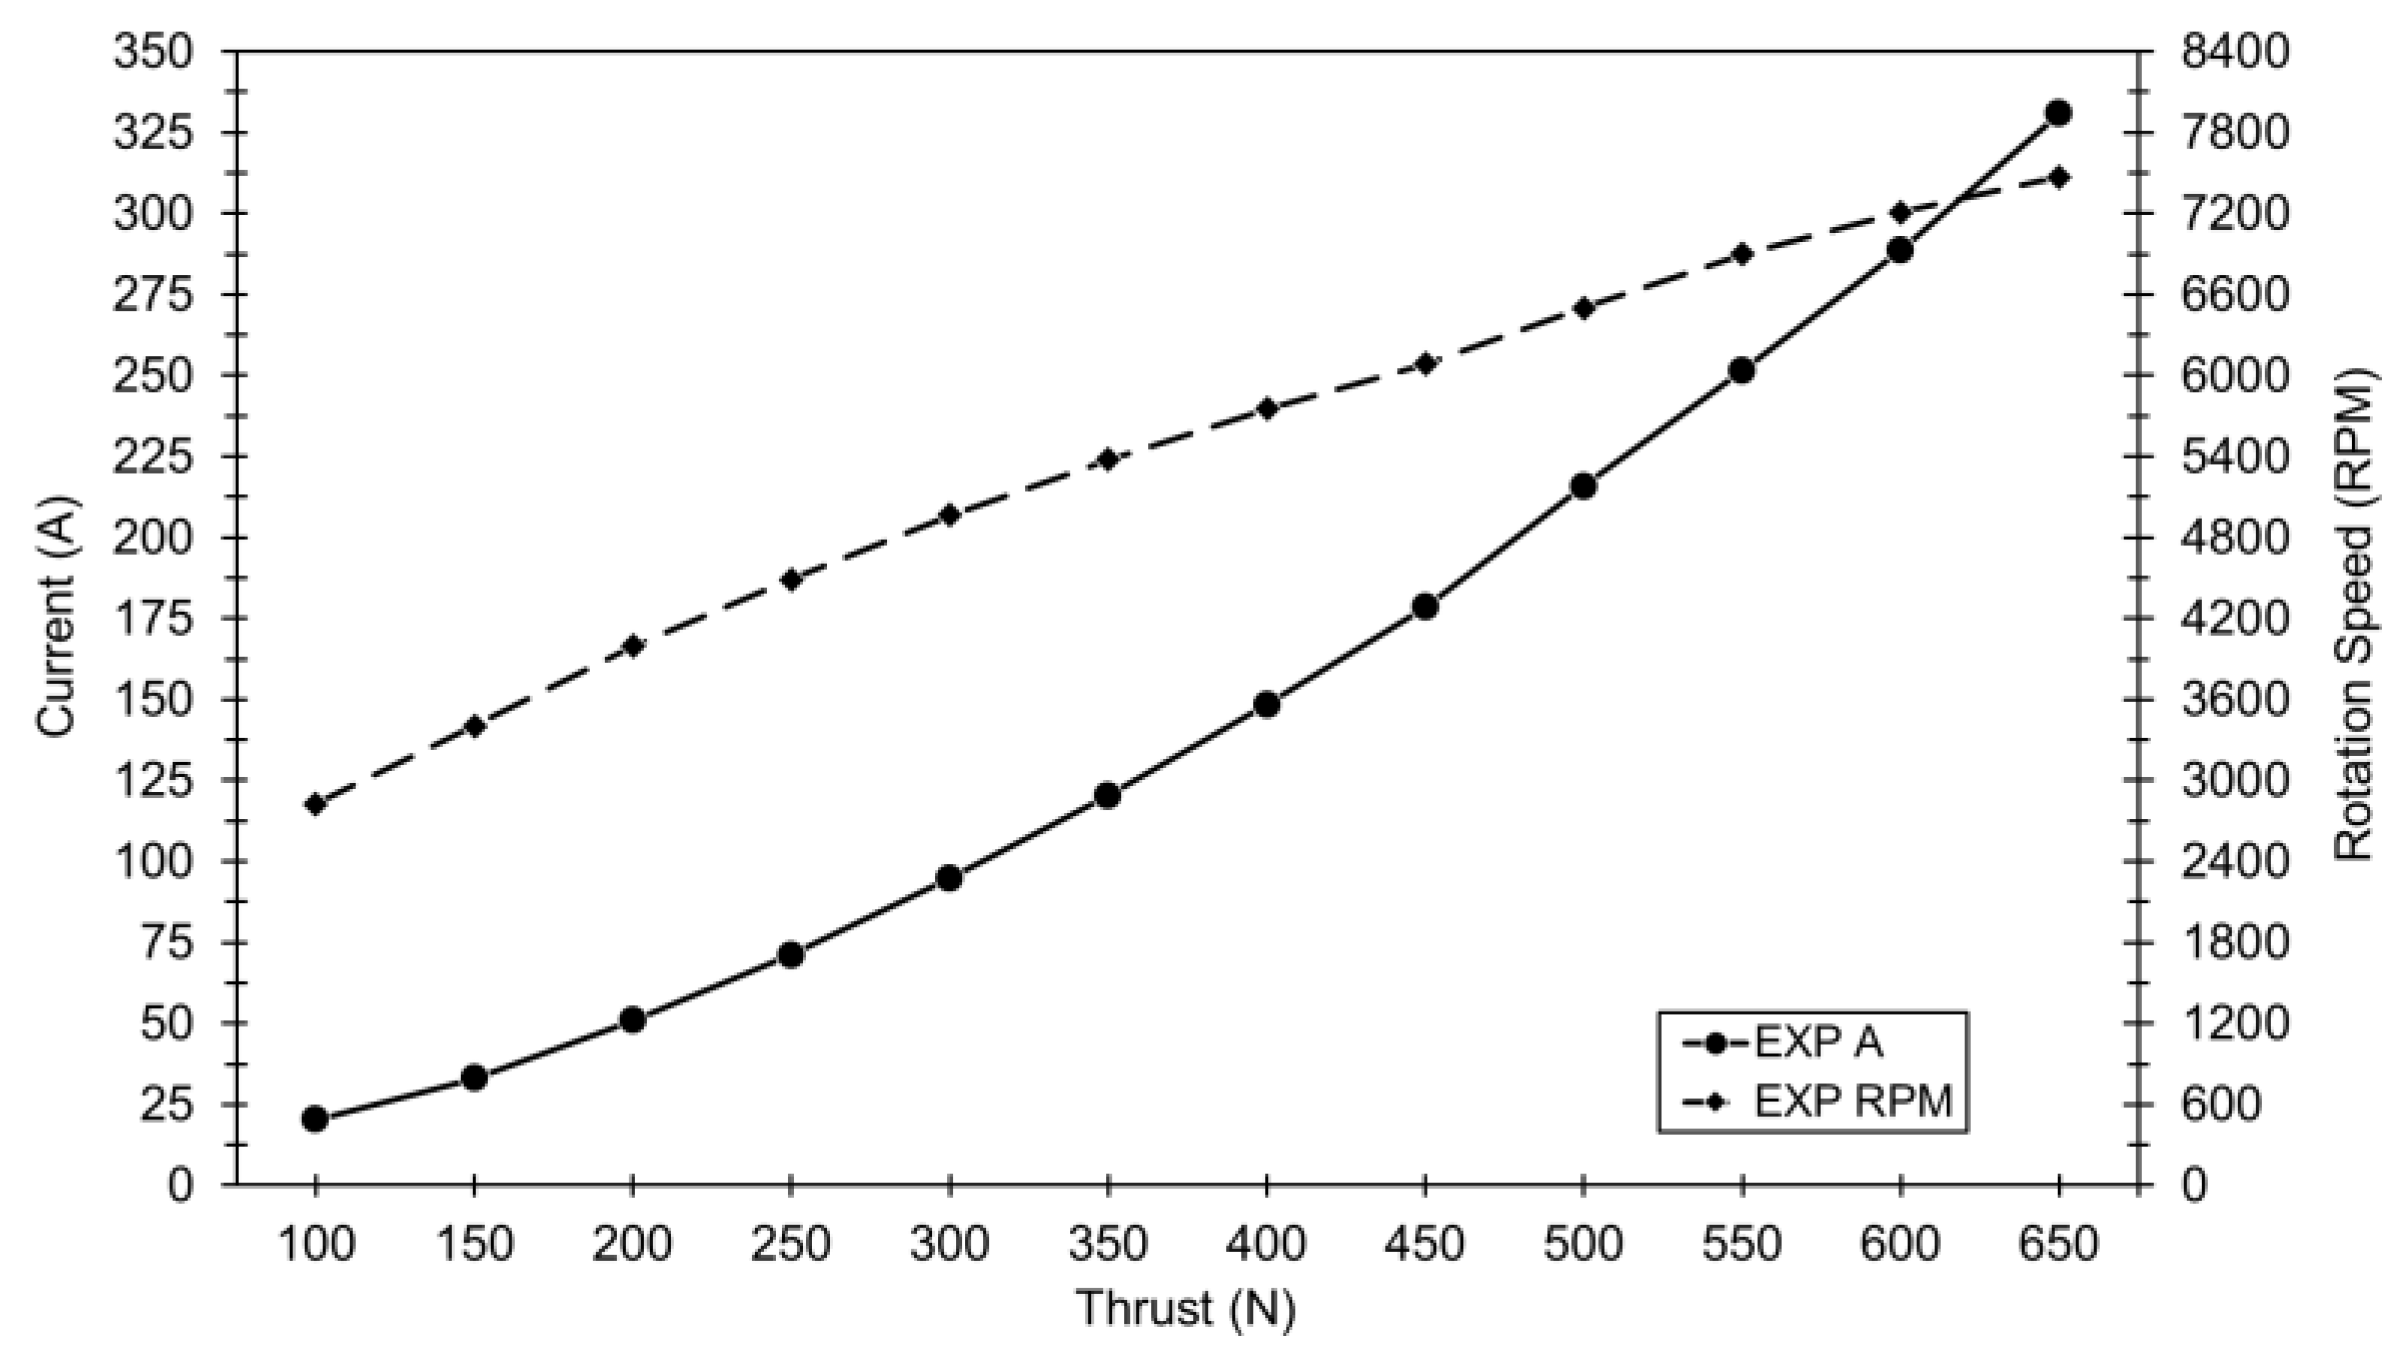
Figure 6.
Electric testing according to the number of battery packs.
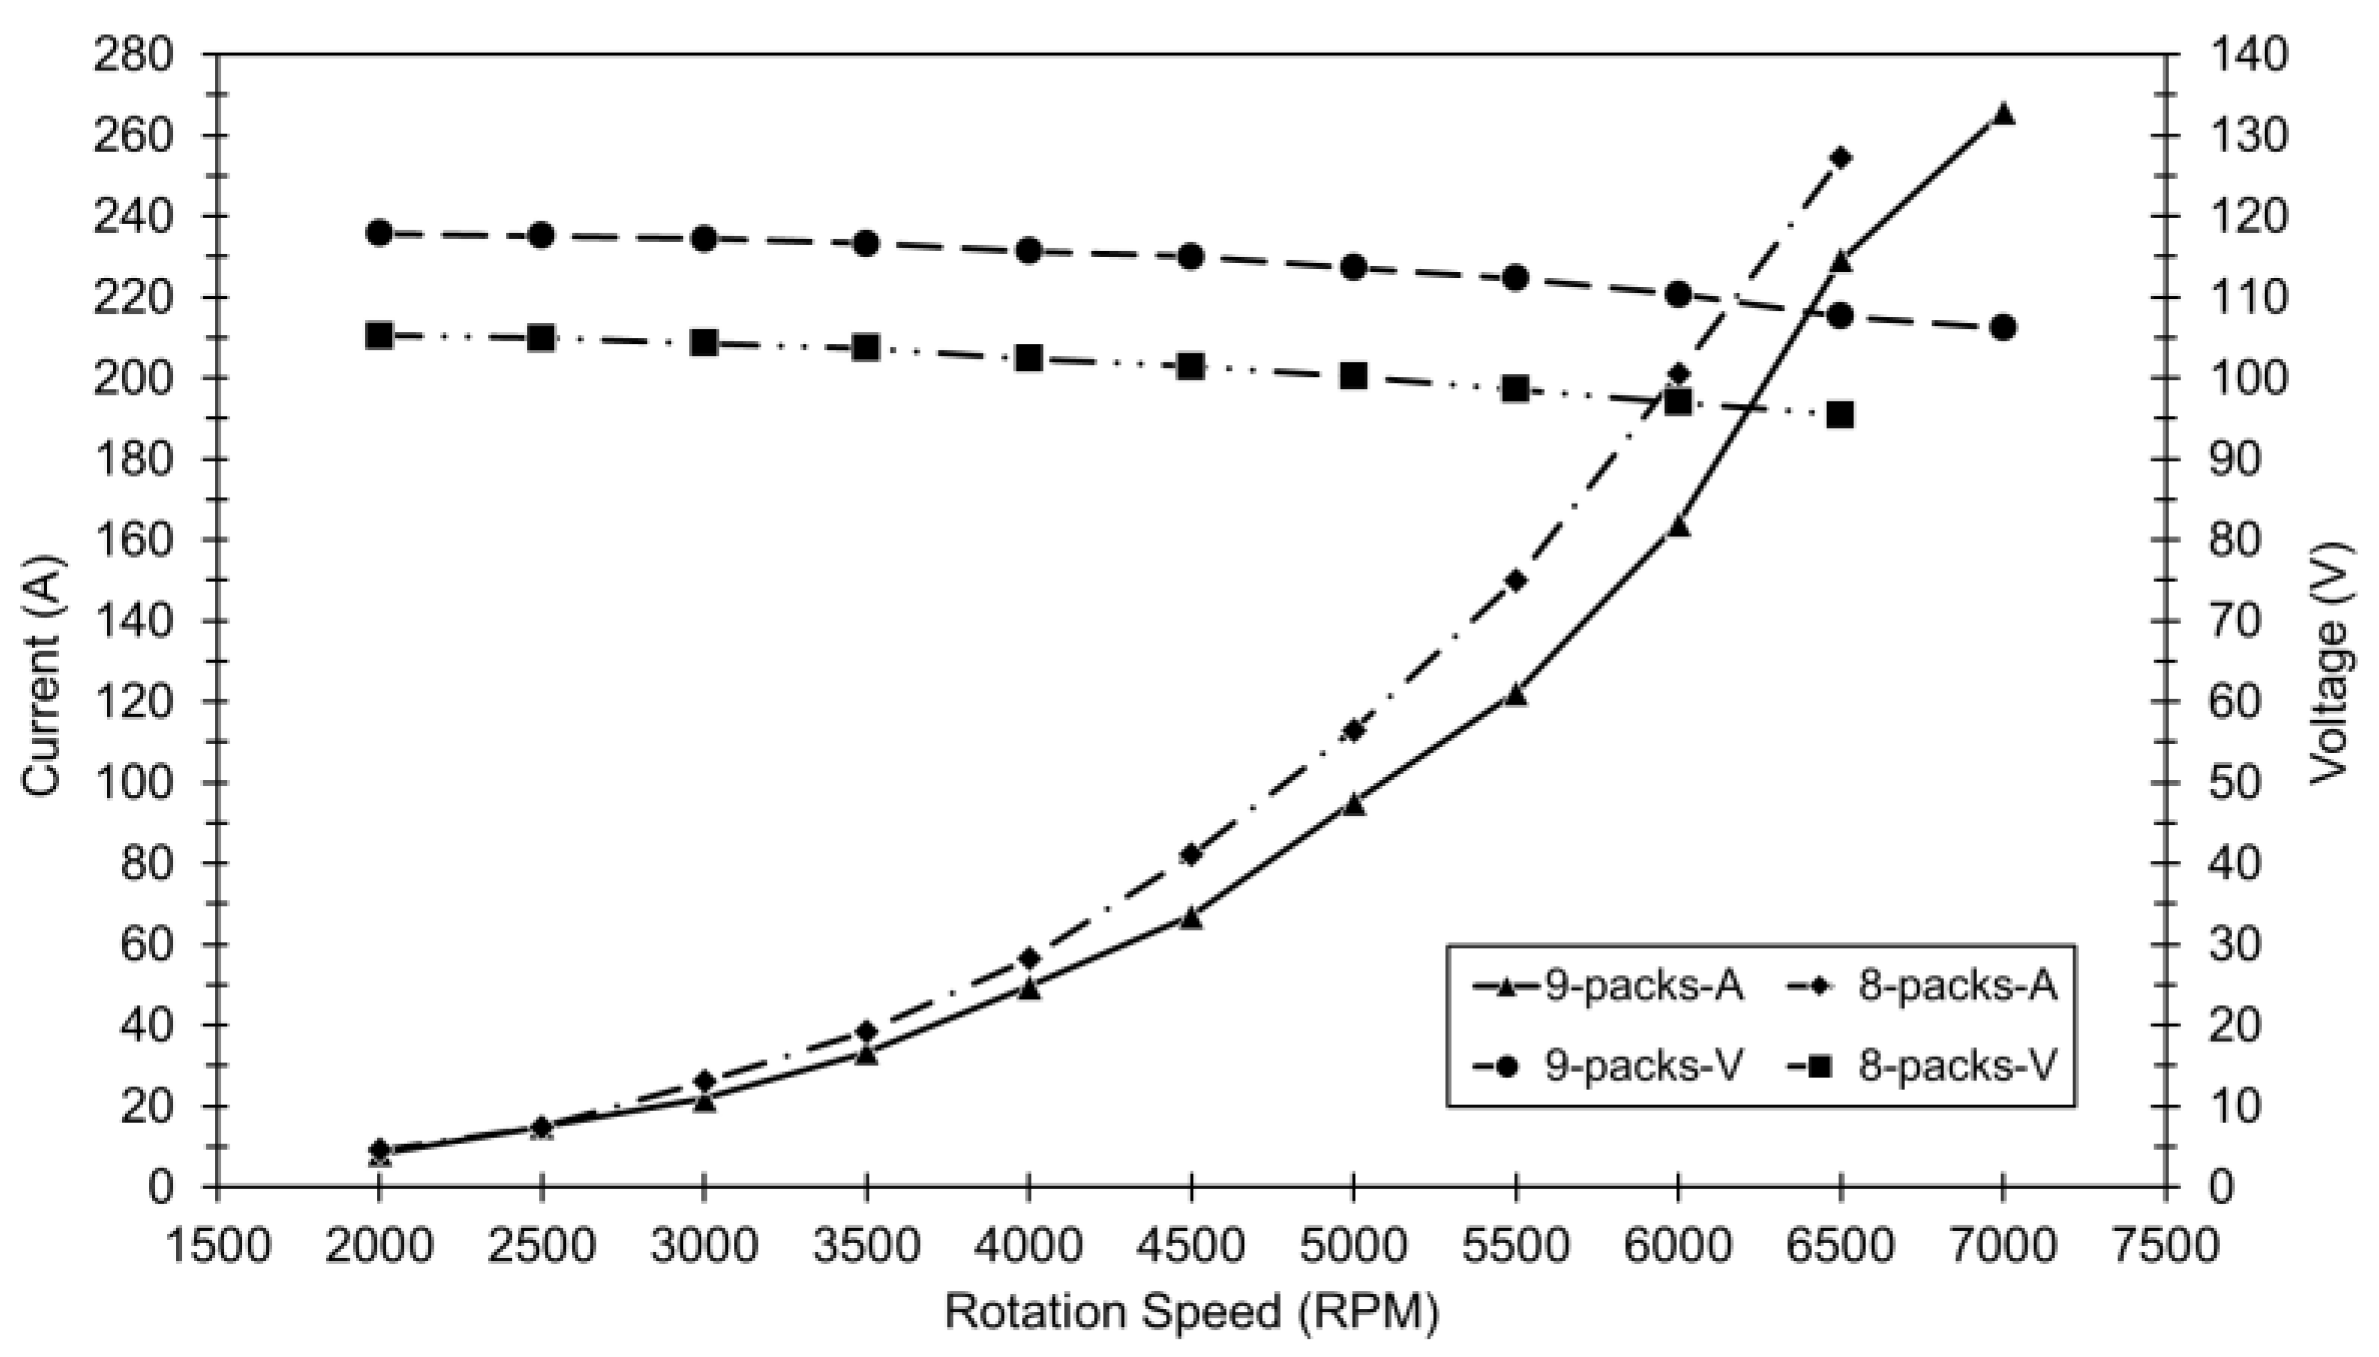
Figure 7.
Electric power according to the number of battery packs.
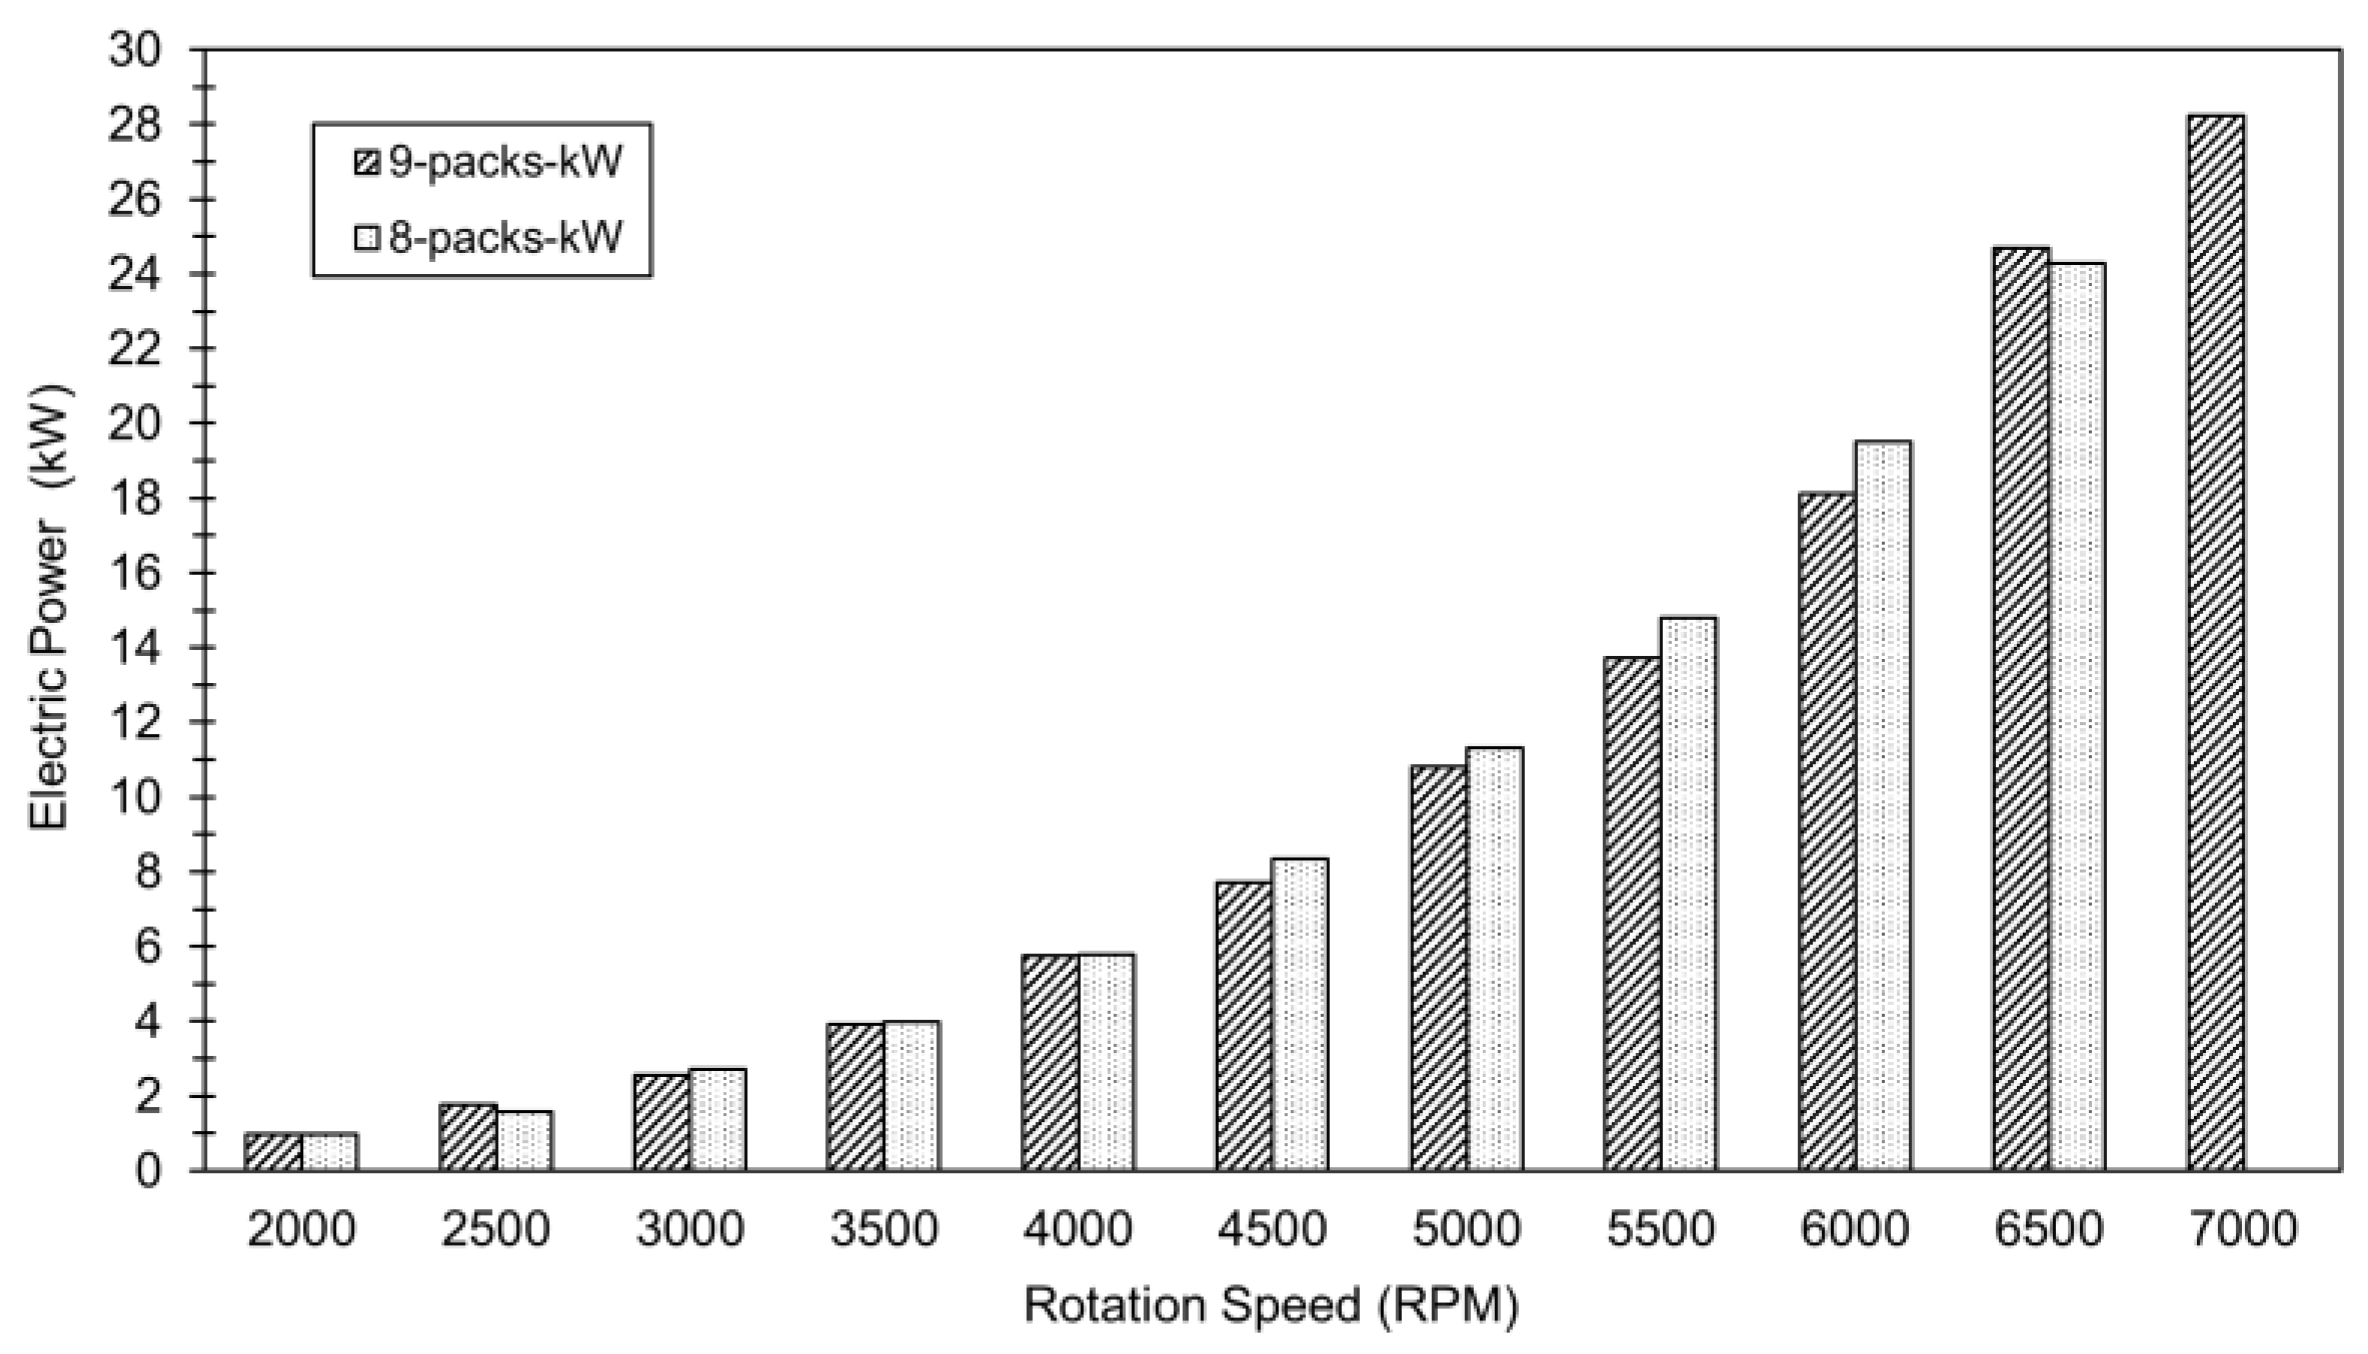
Figure 8.
Aero-propulsion according to the number of battery packs.
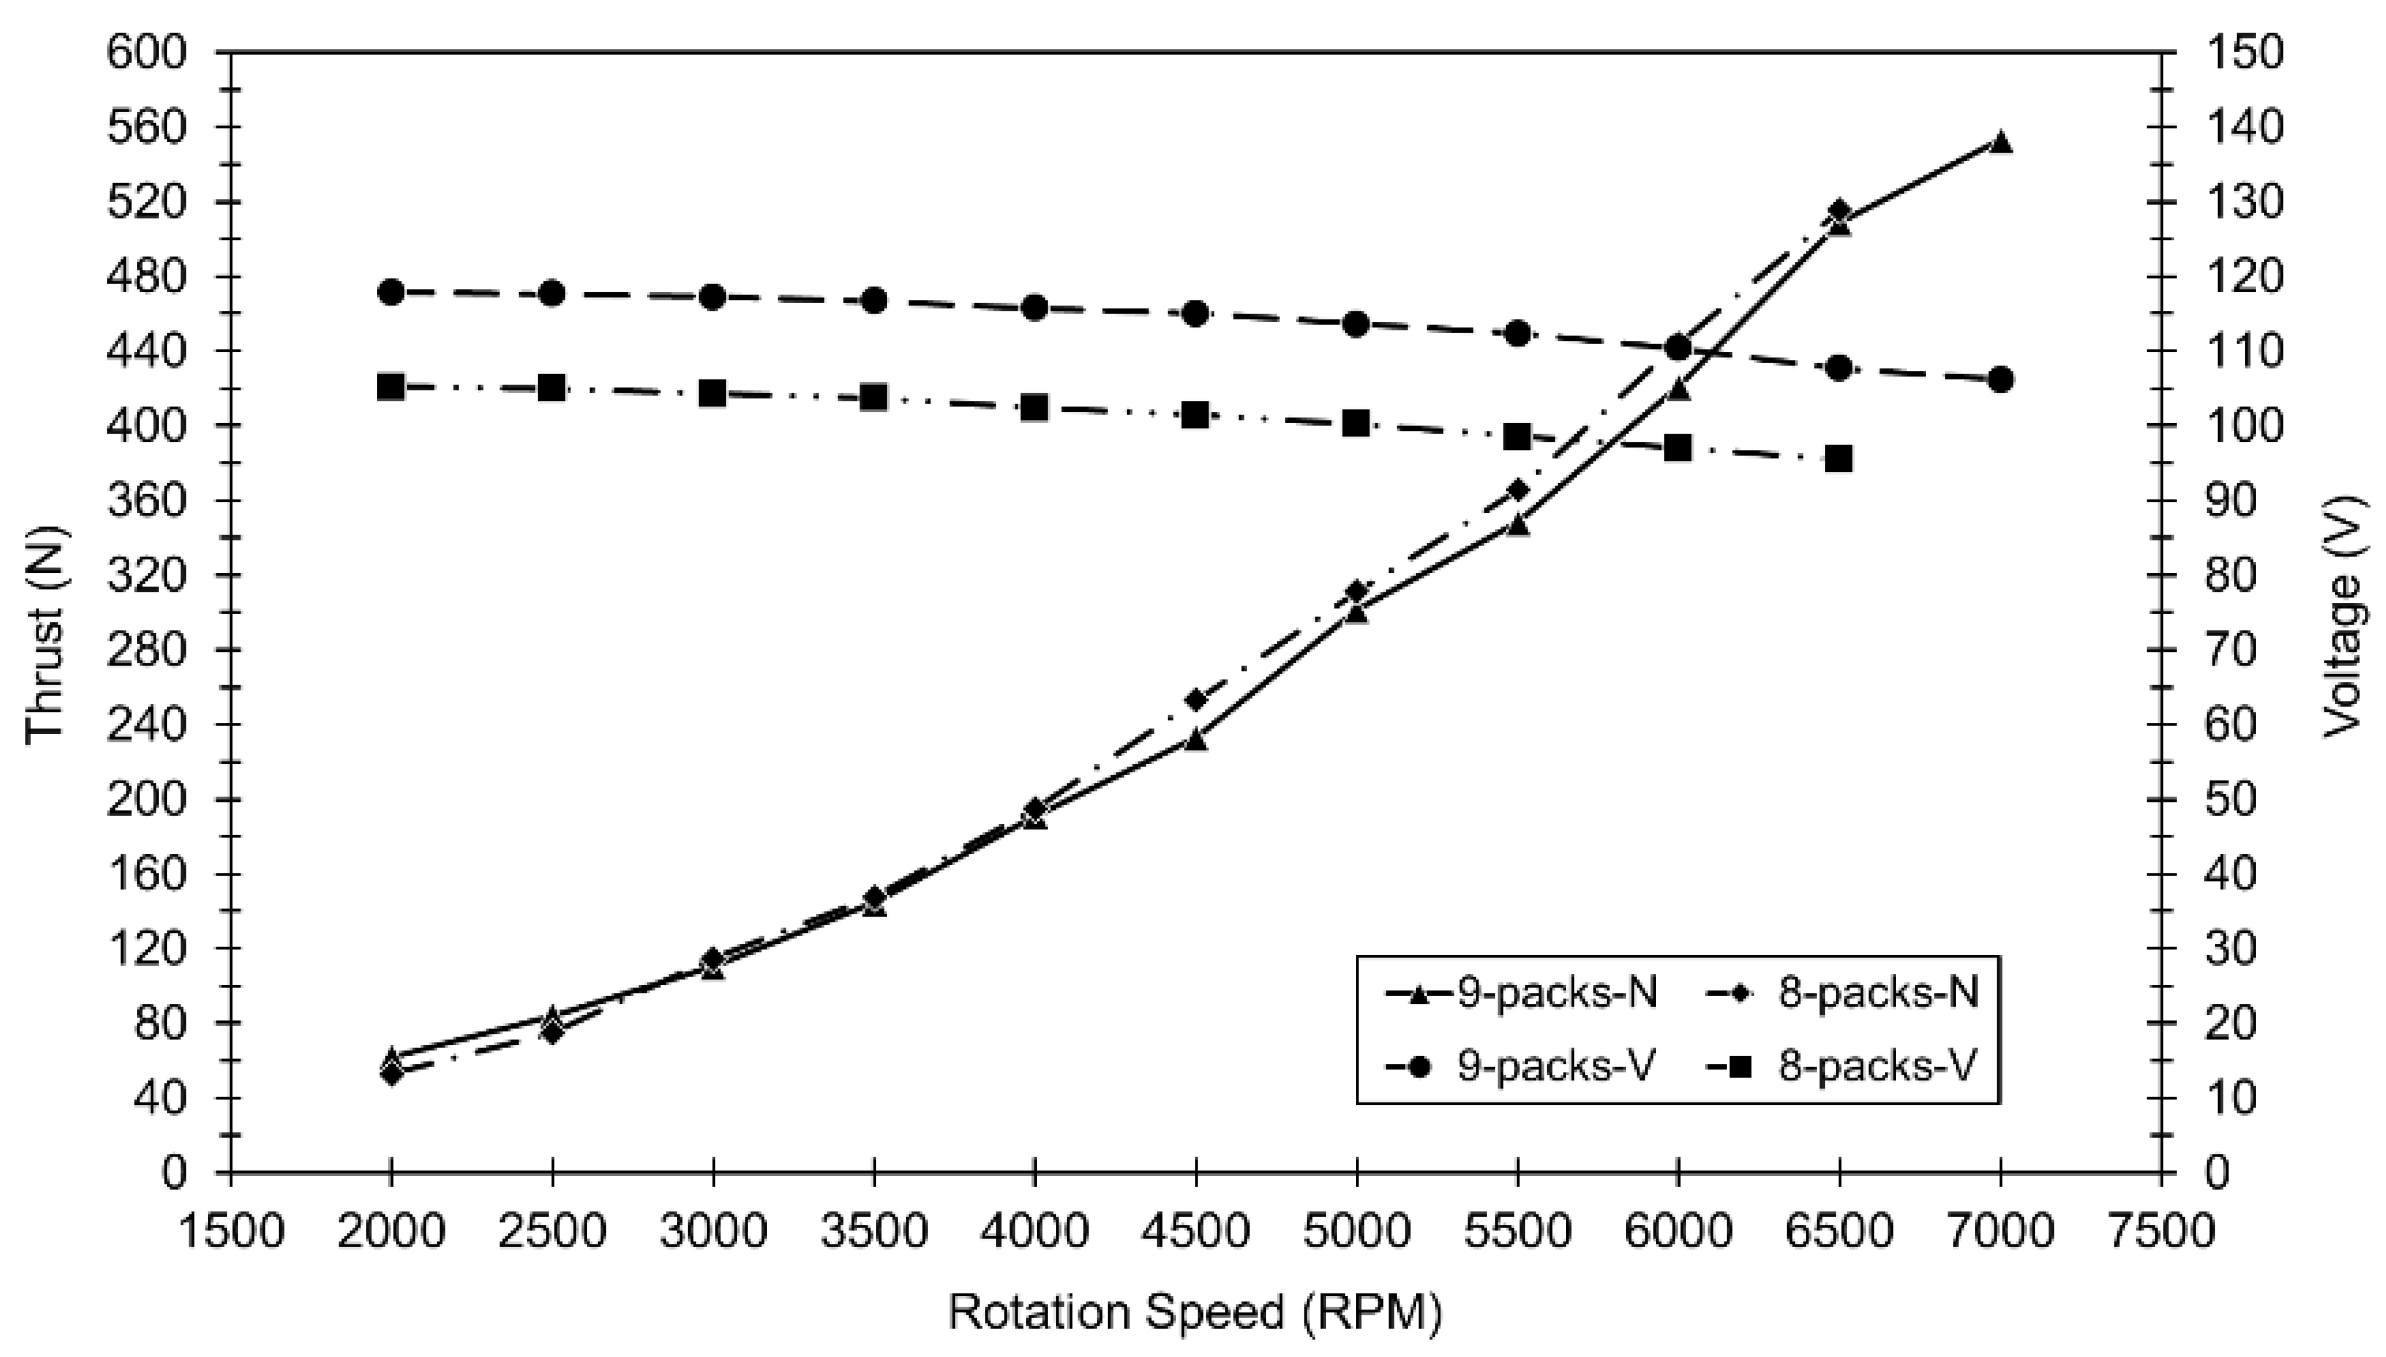
Figure 9.
Electric-acoustic testing according to rotation speed.
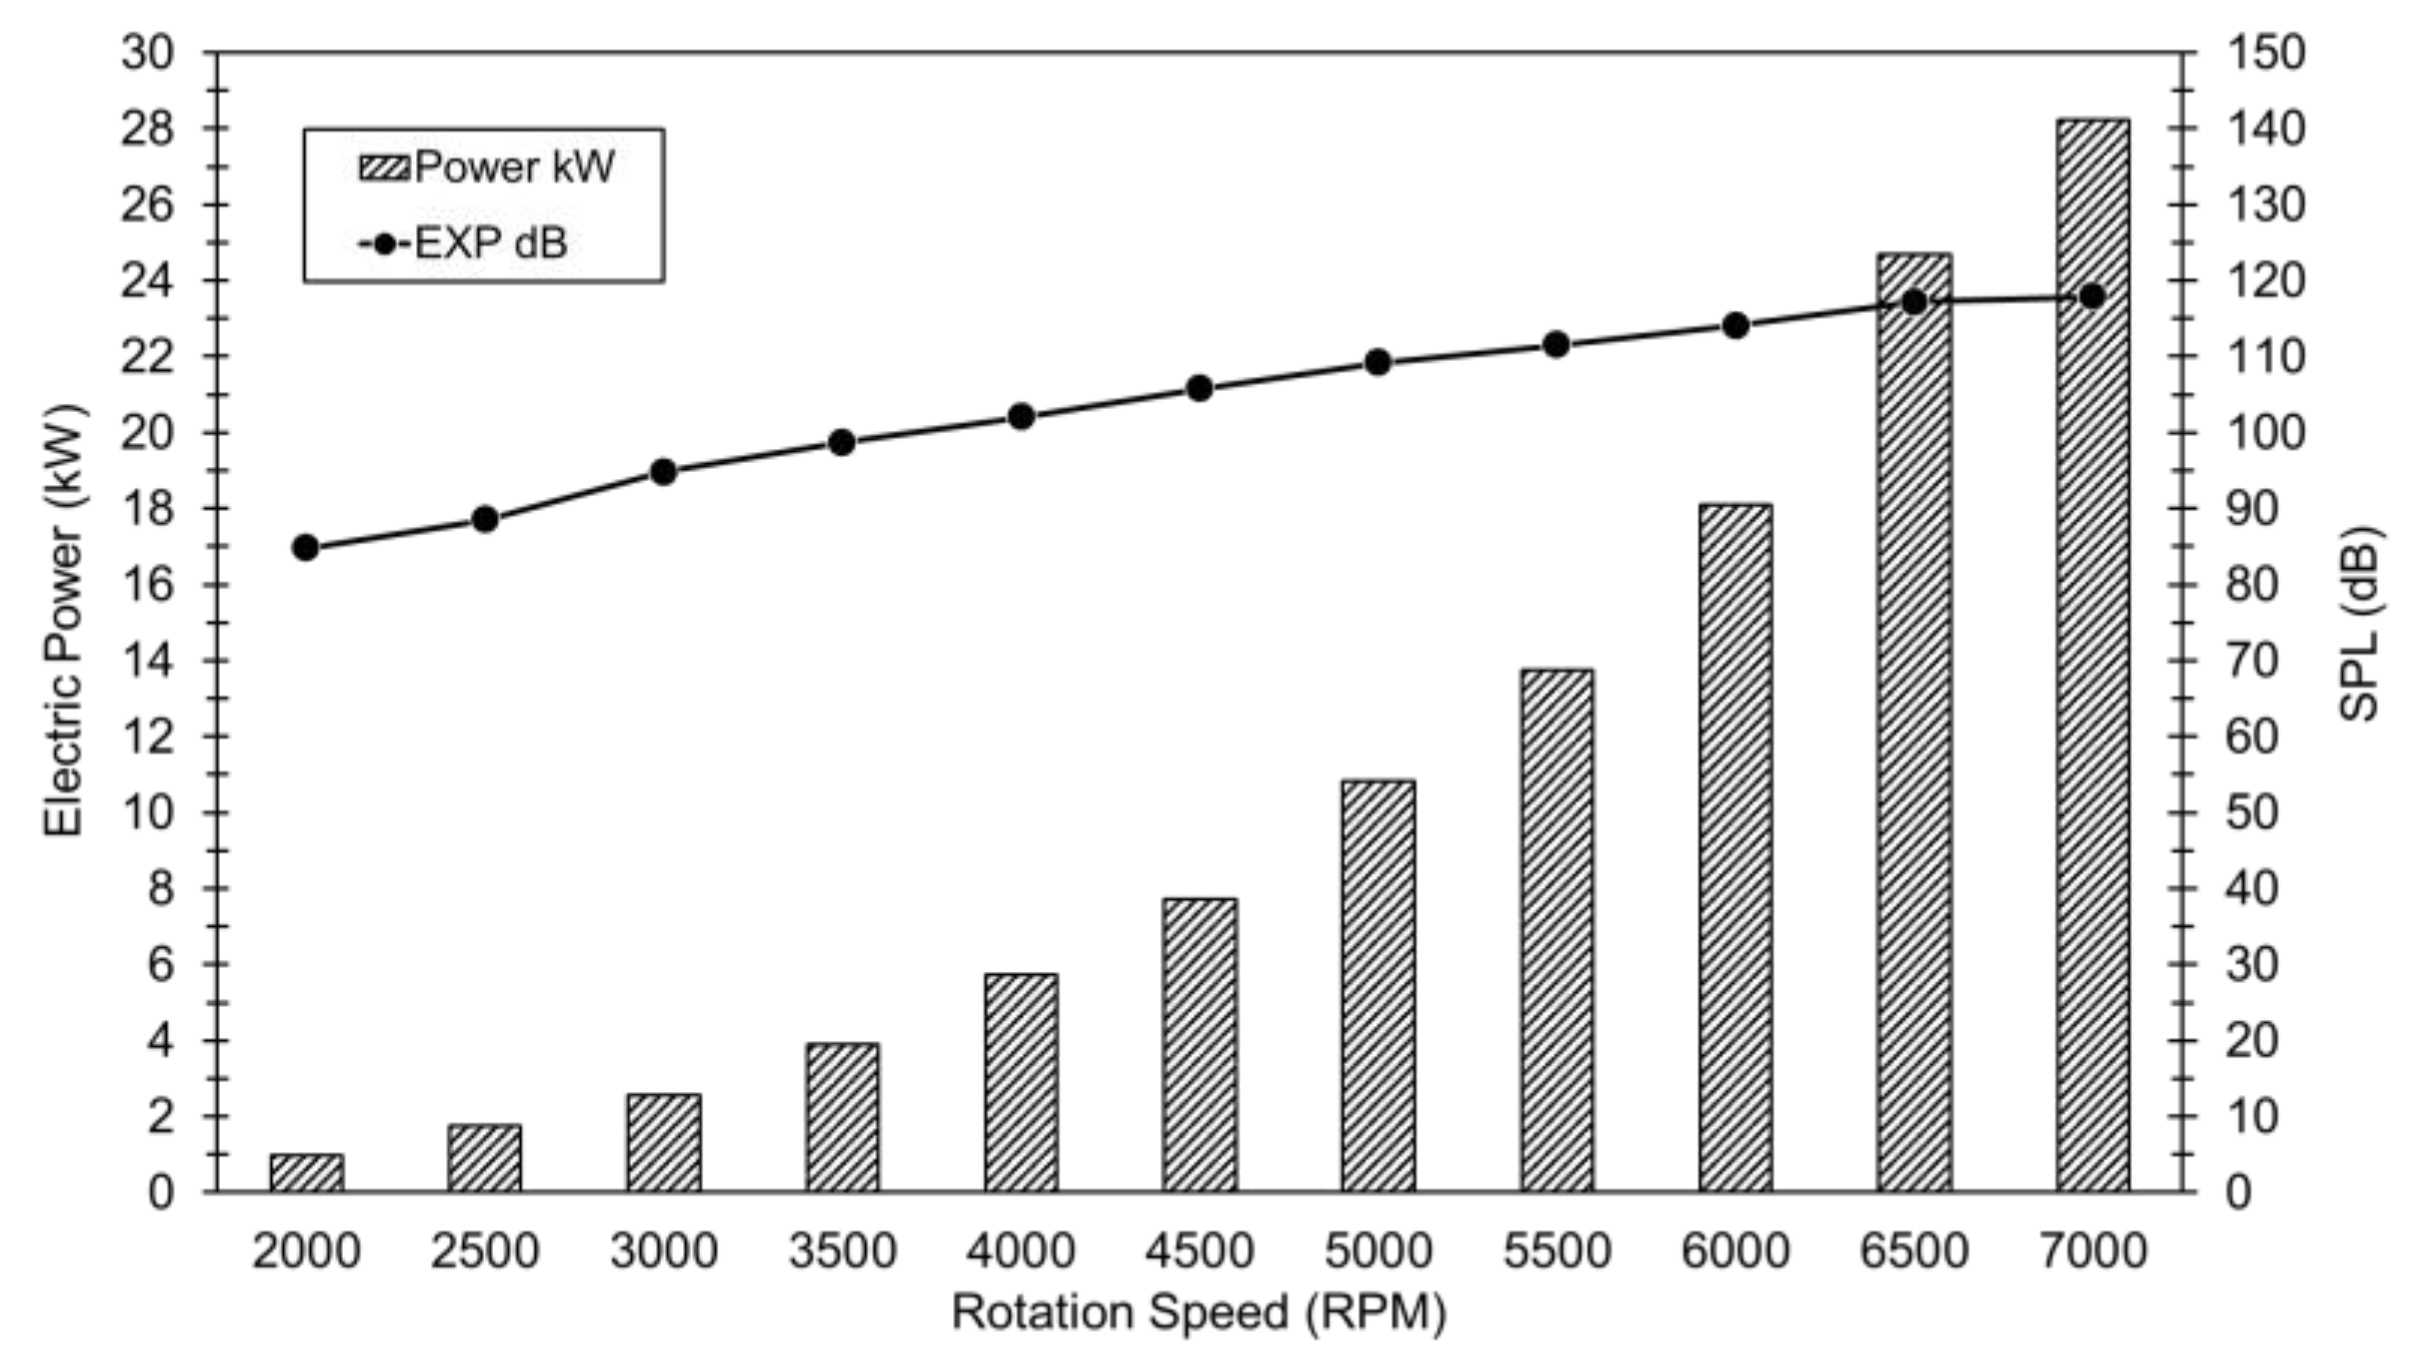
Figure 10.
Aeroacoustic testing according to rotation speed.
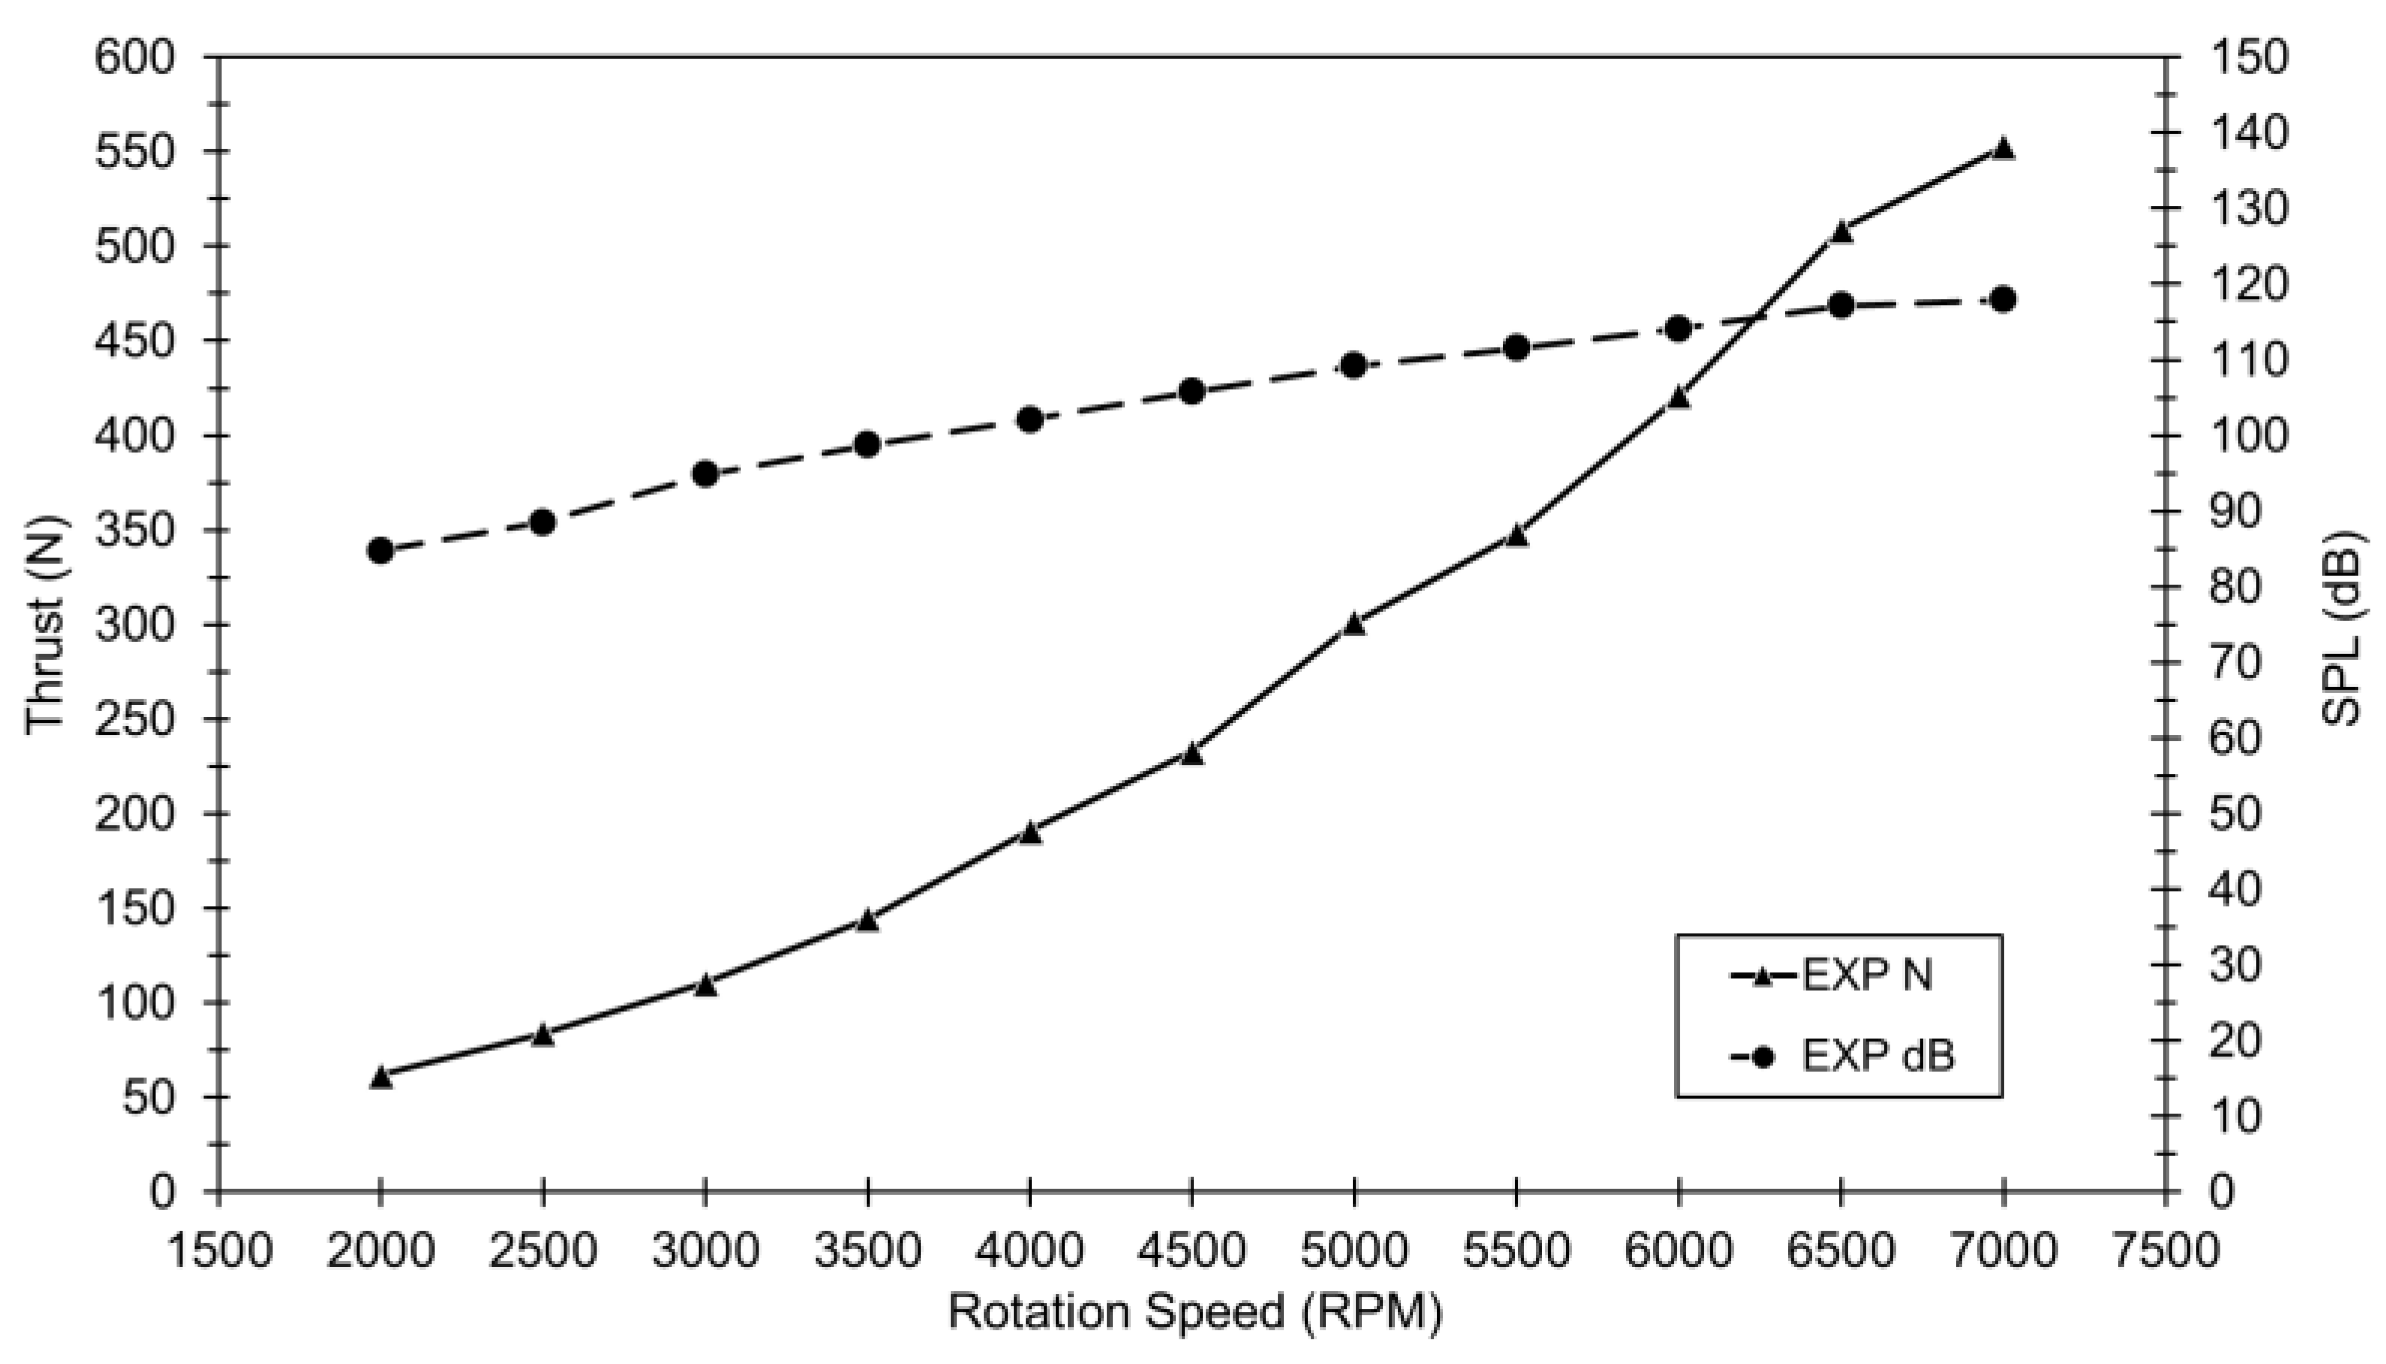
Figure 11.
Electric-propulsion ratio according to thrust range.
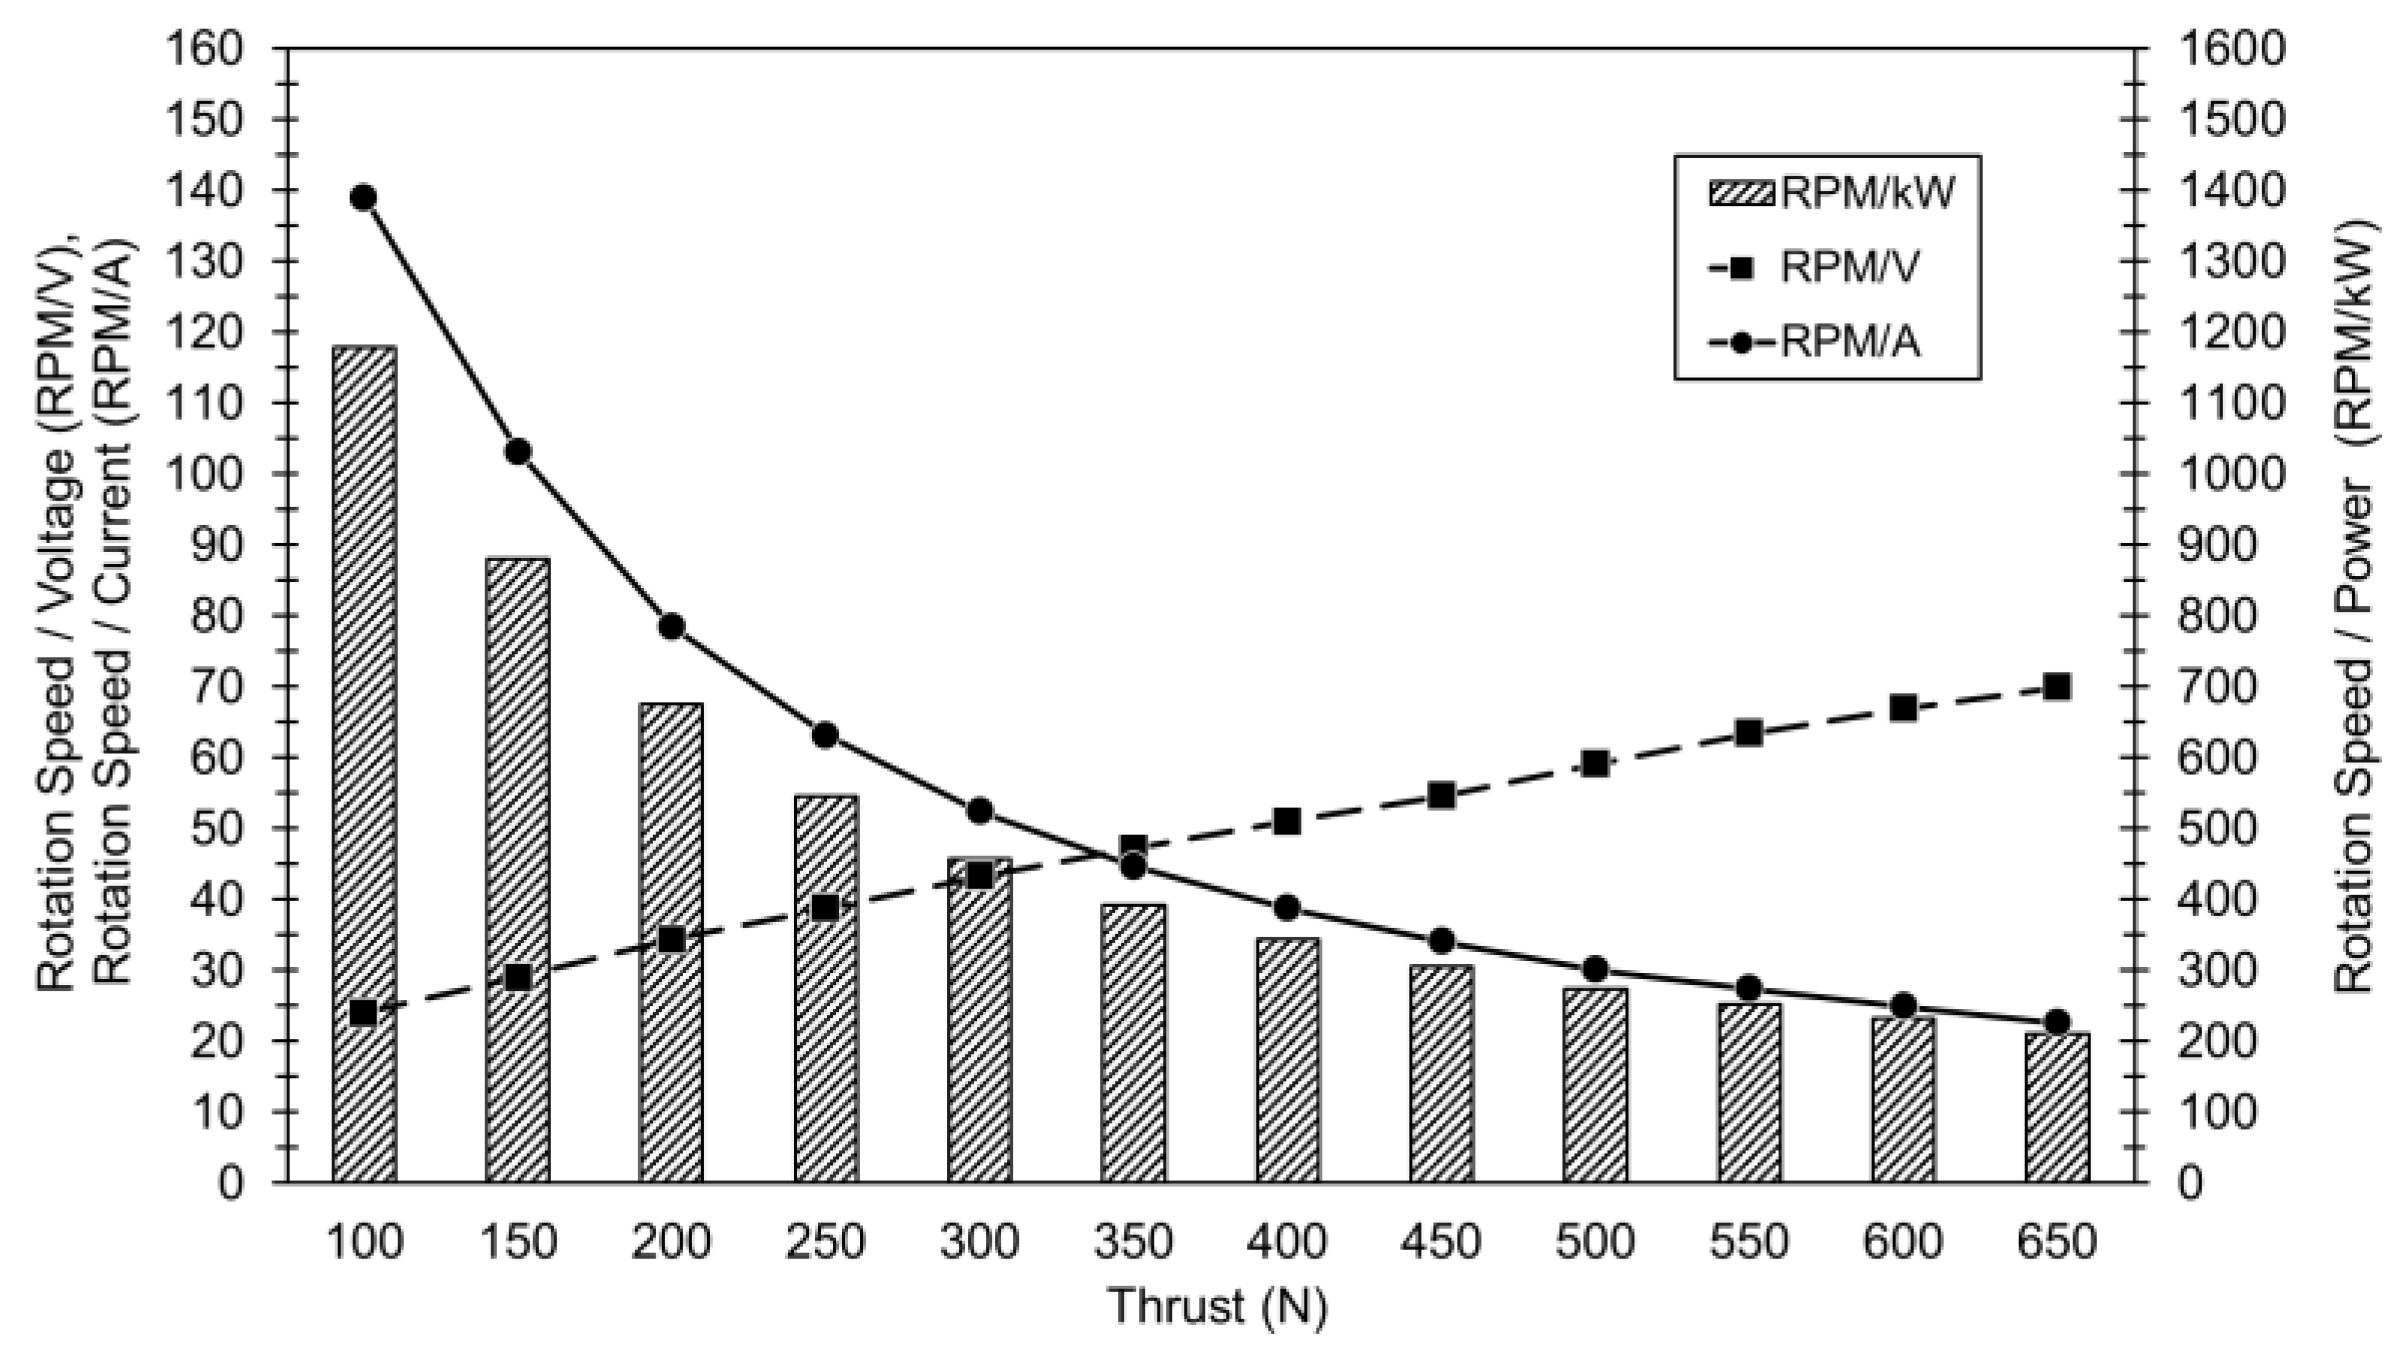
Figure 12.
Electric-propulsion ratios according to the battery packs.
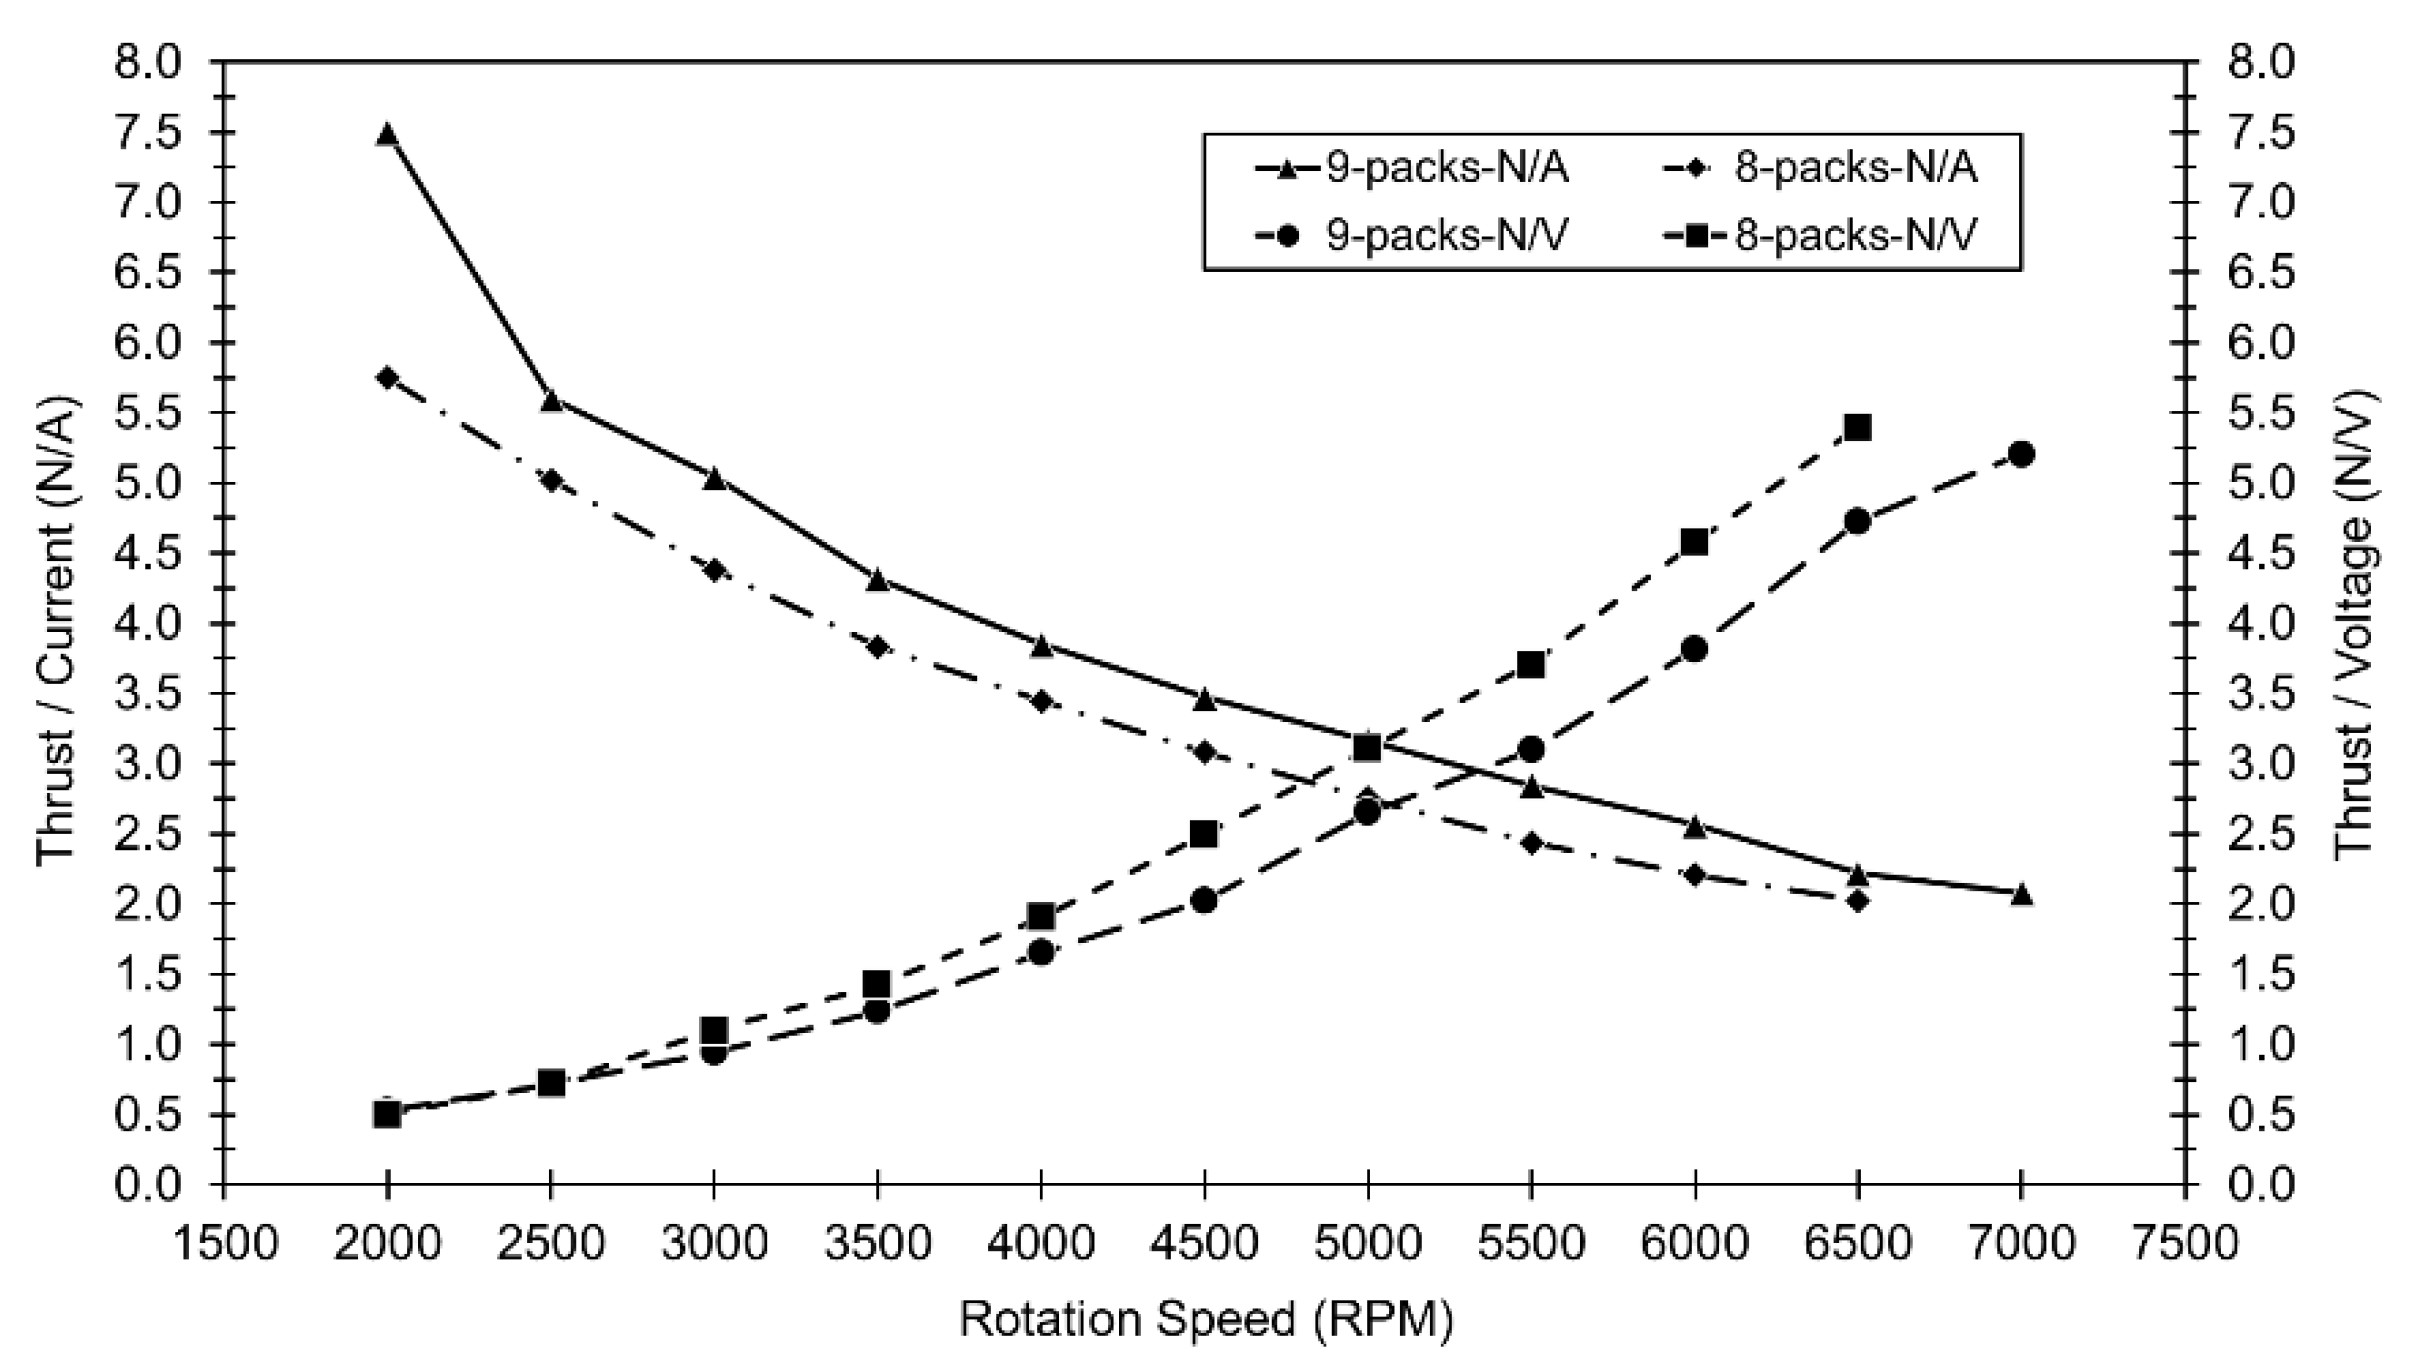
Figure 13.
Electric power vs propulsion according to the battery packs.
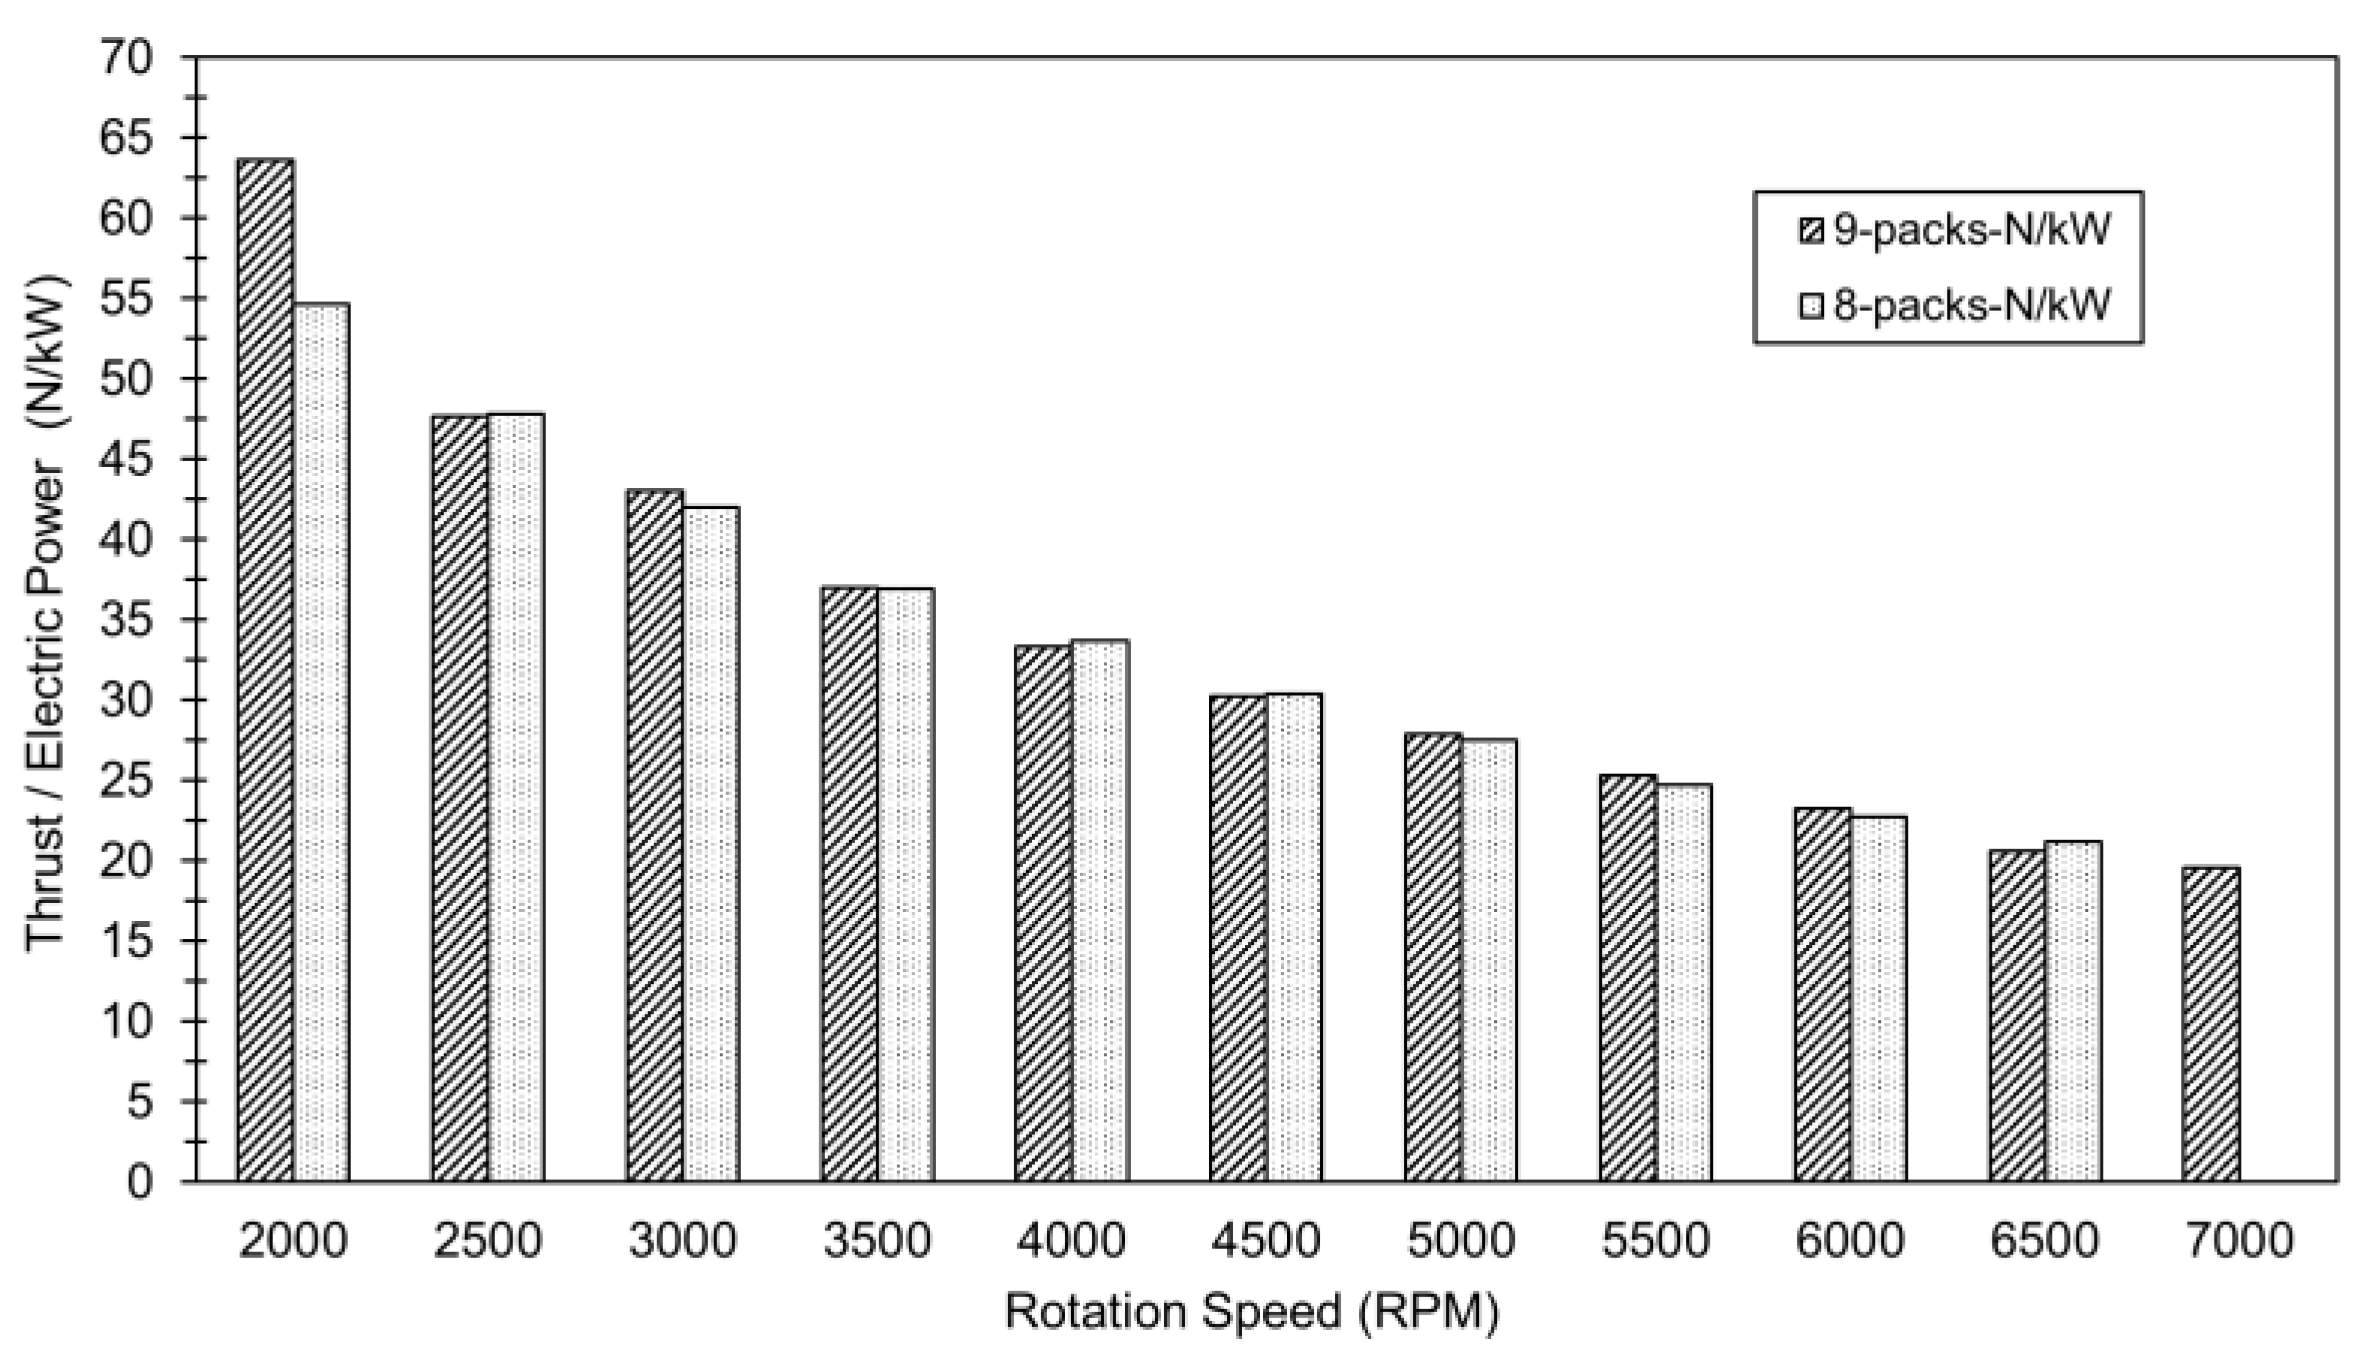
Figure 14.
Power coefficient according to the battery packs.
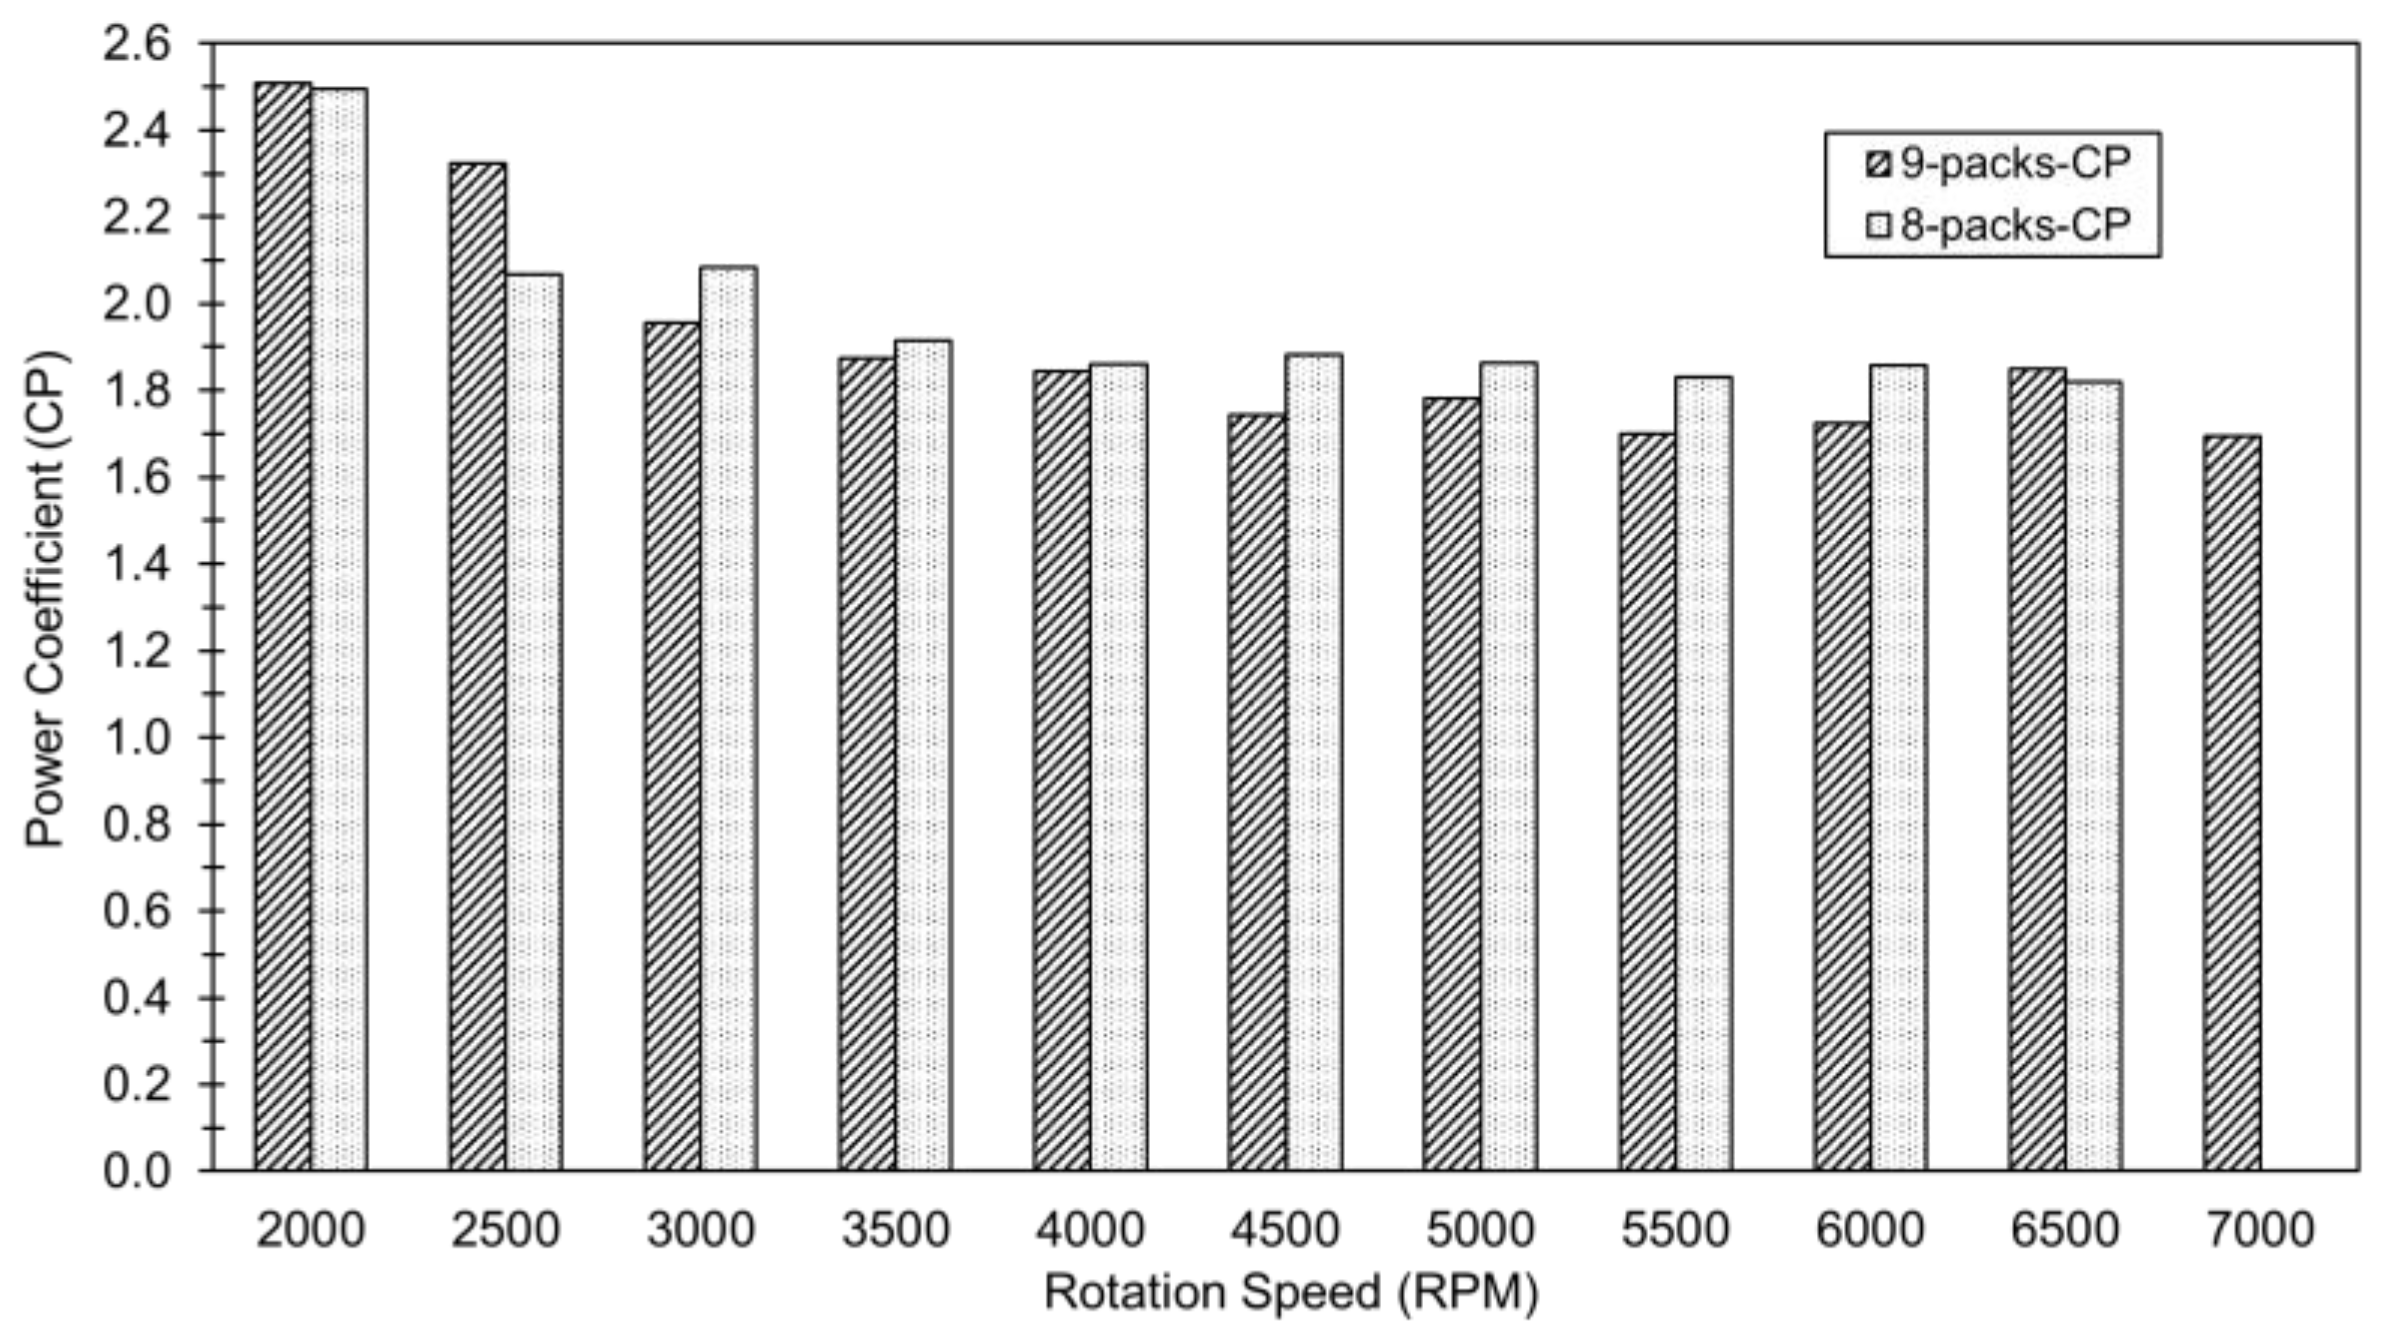
Figure 15.
Thrust coefficient according to the battery packs.
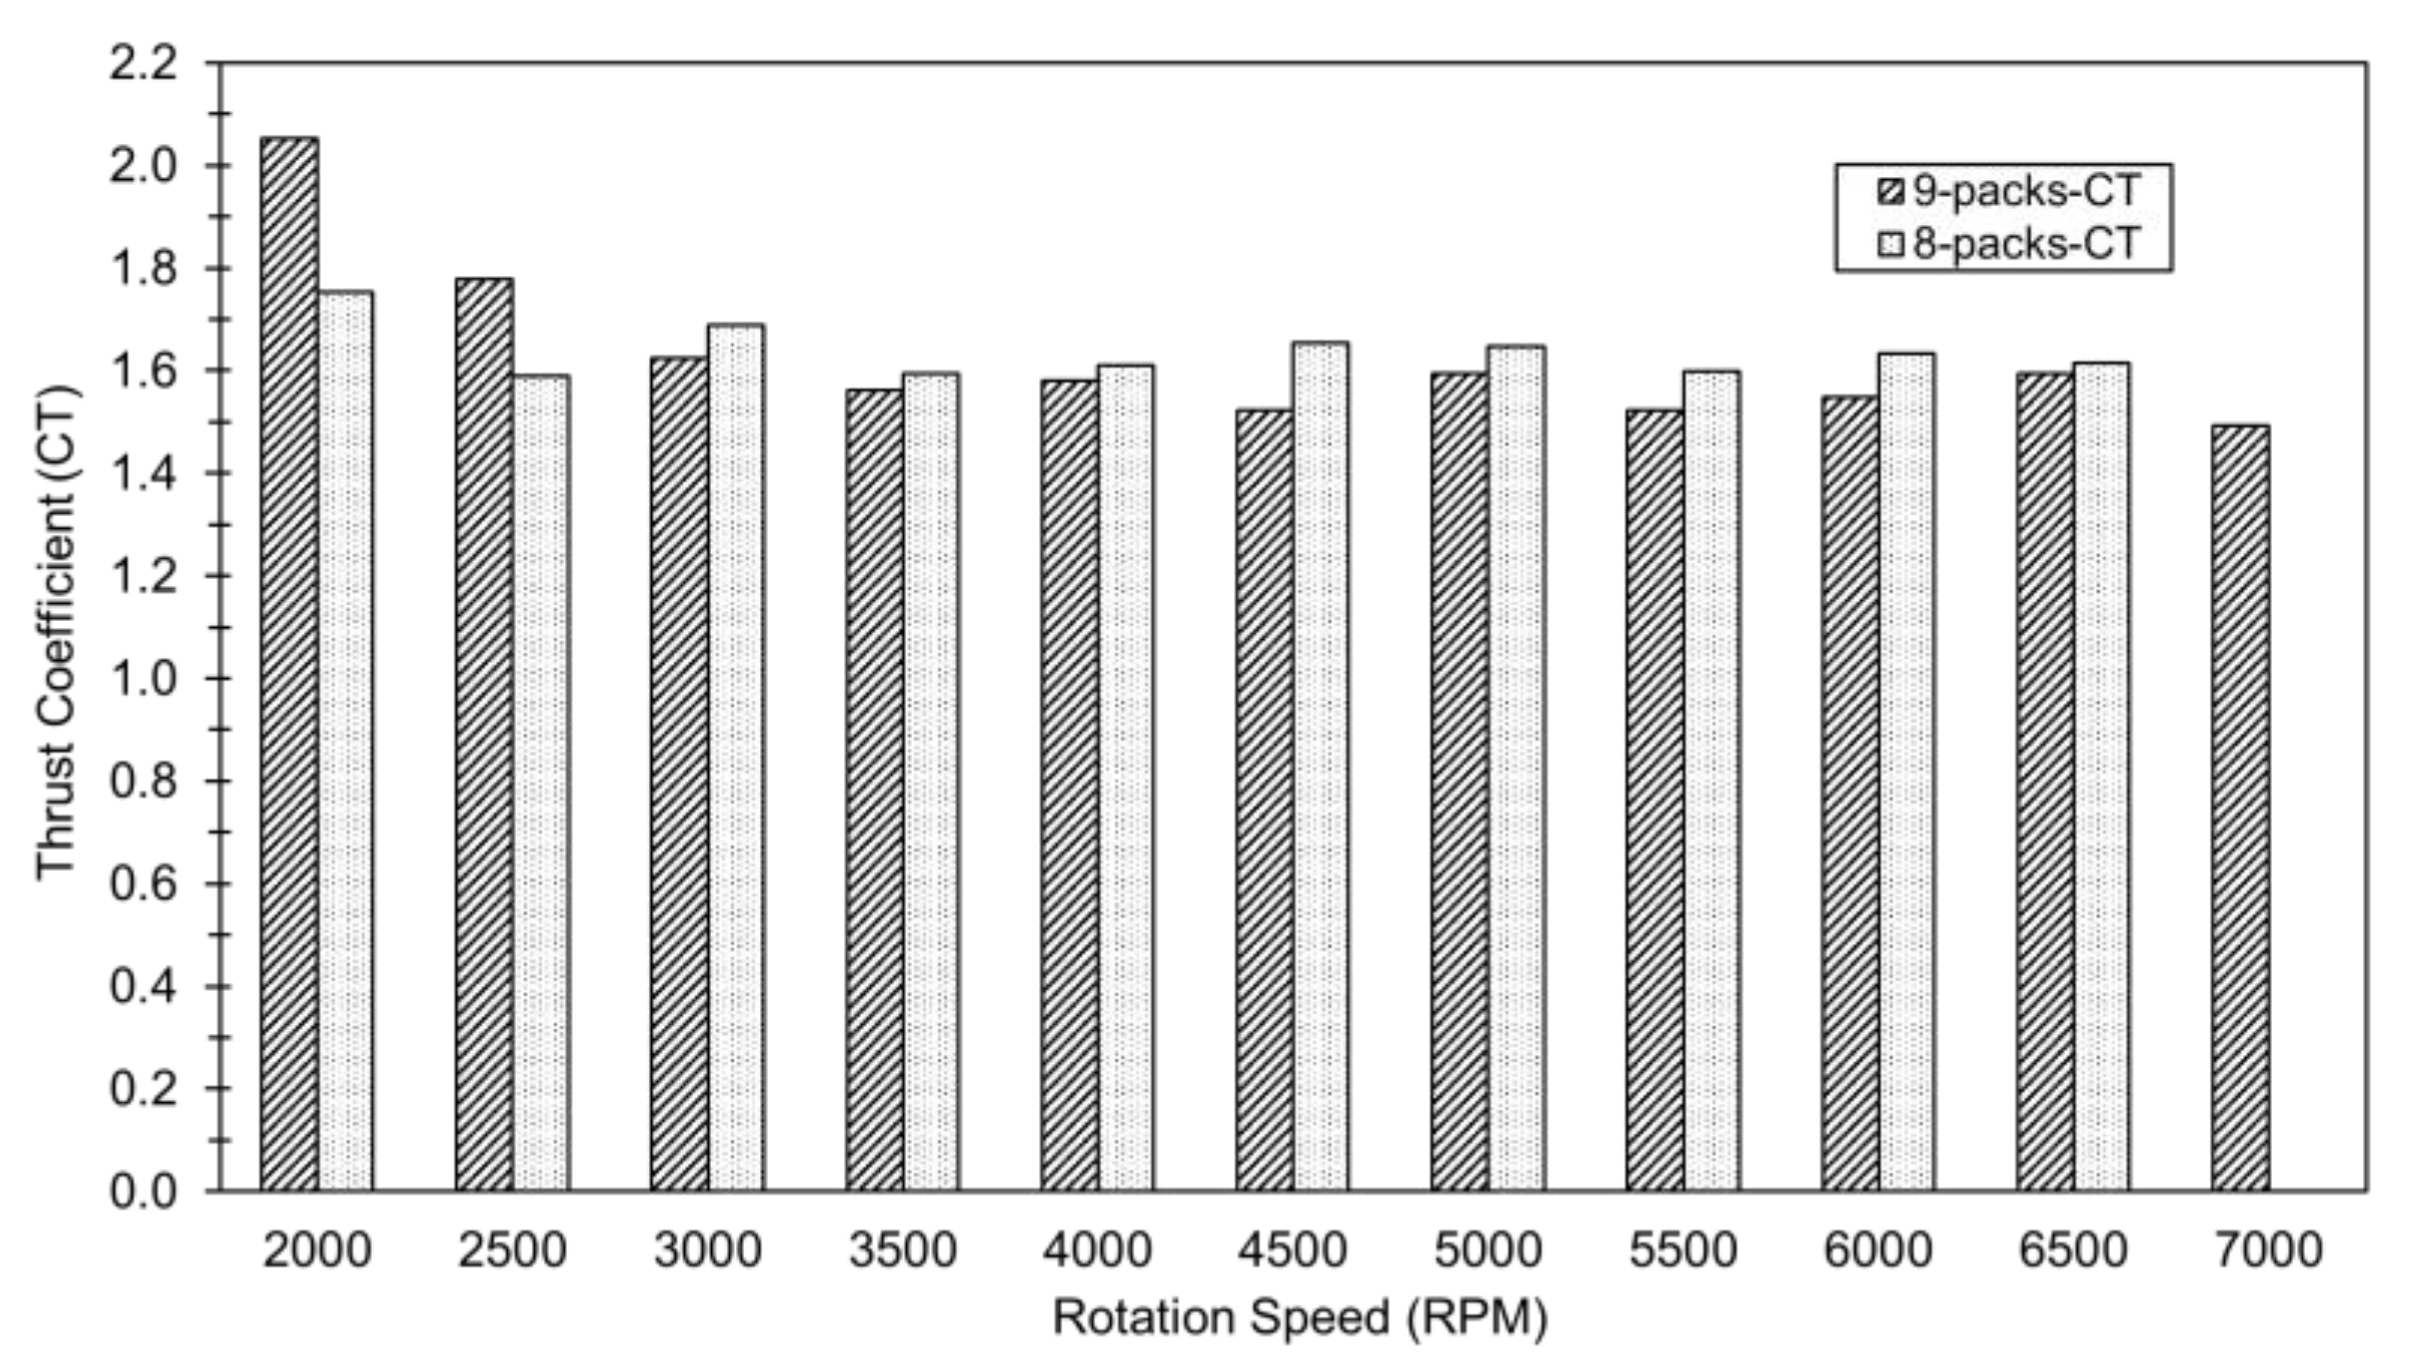
Figure 16.
Figure of merit according to the battery packs.
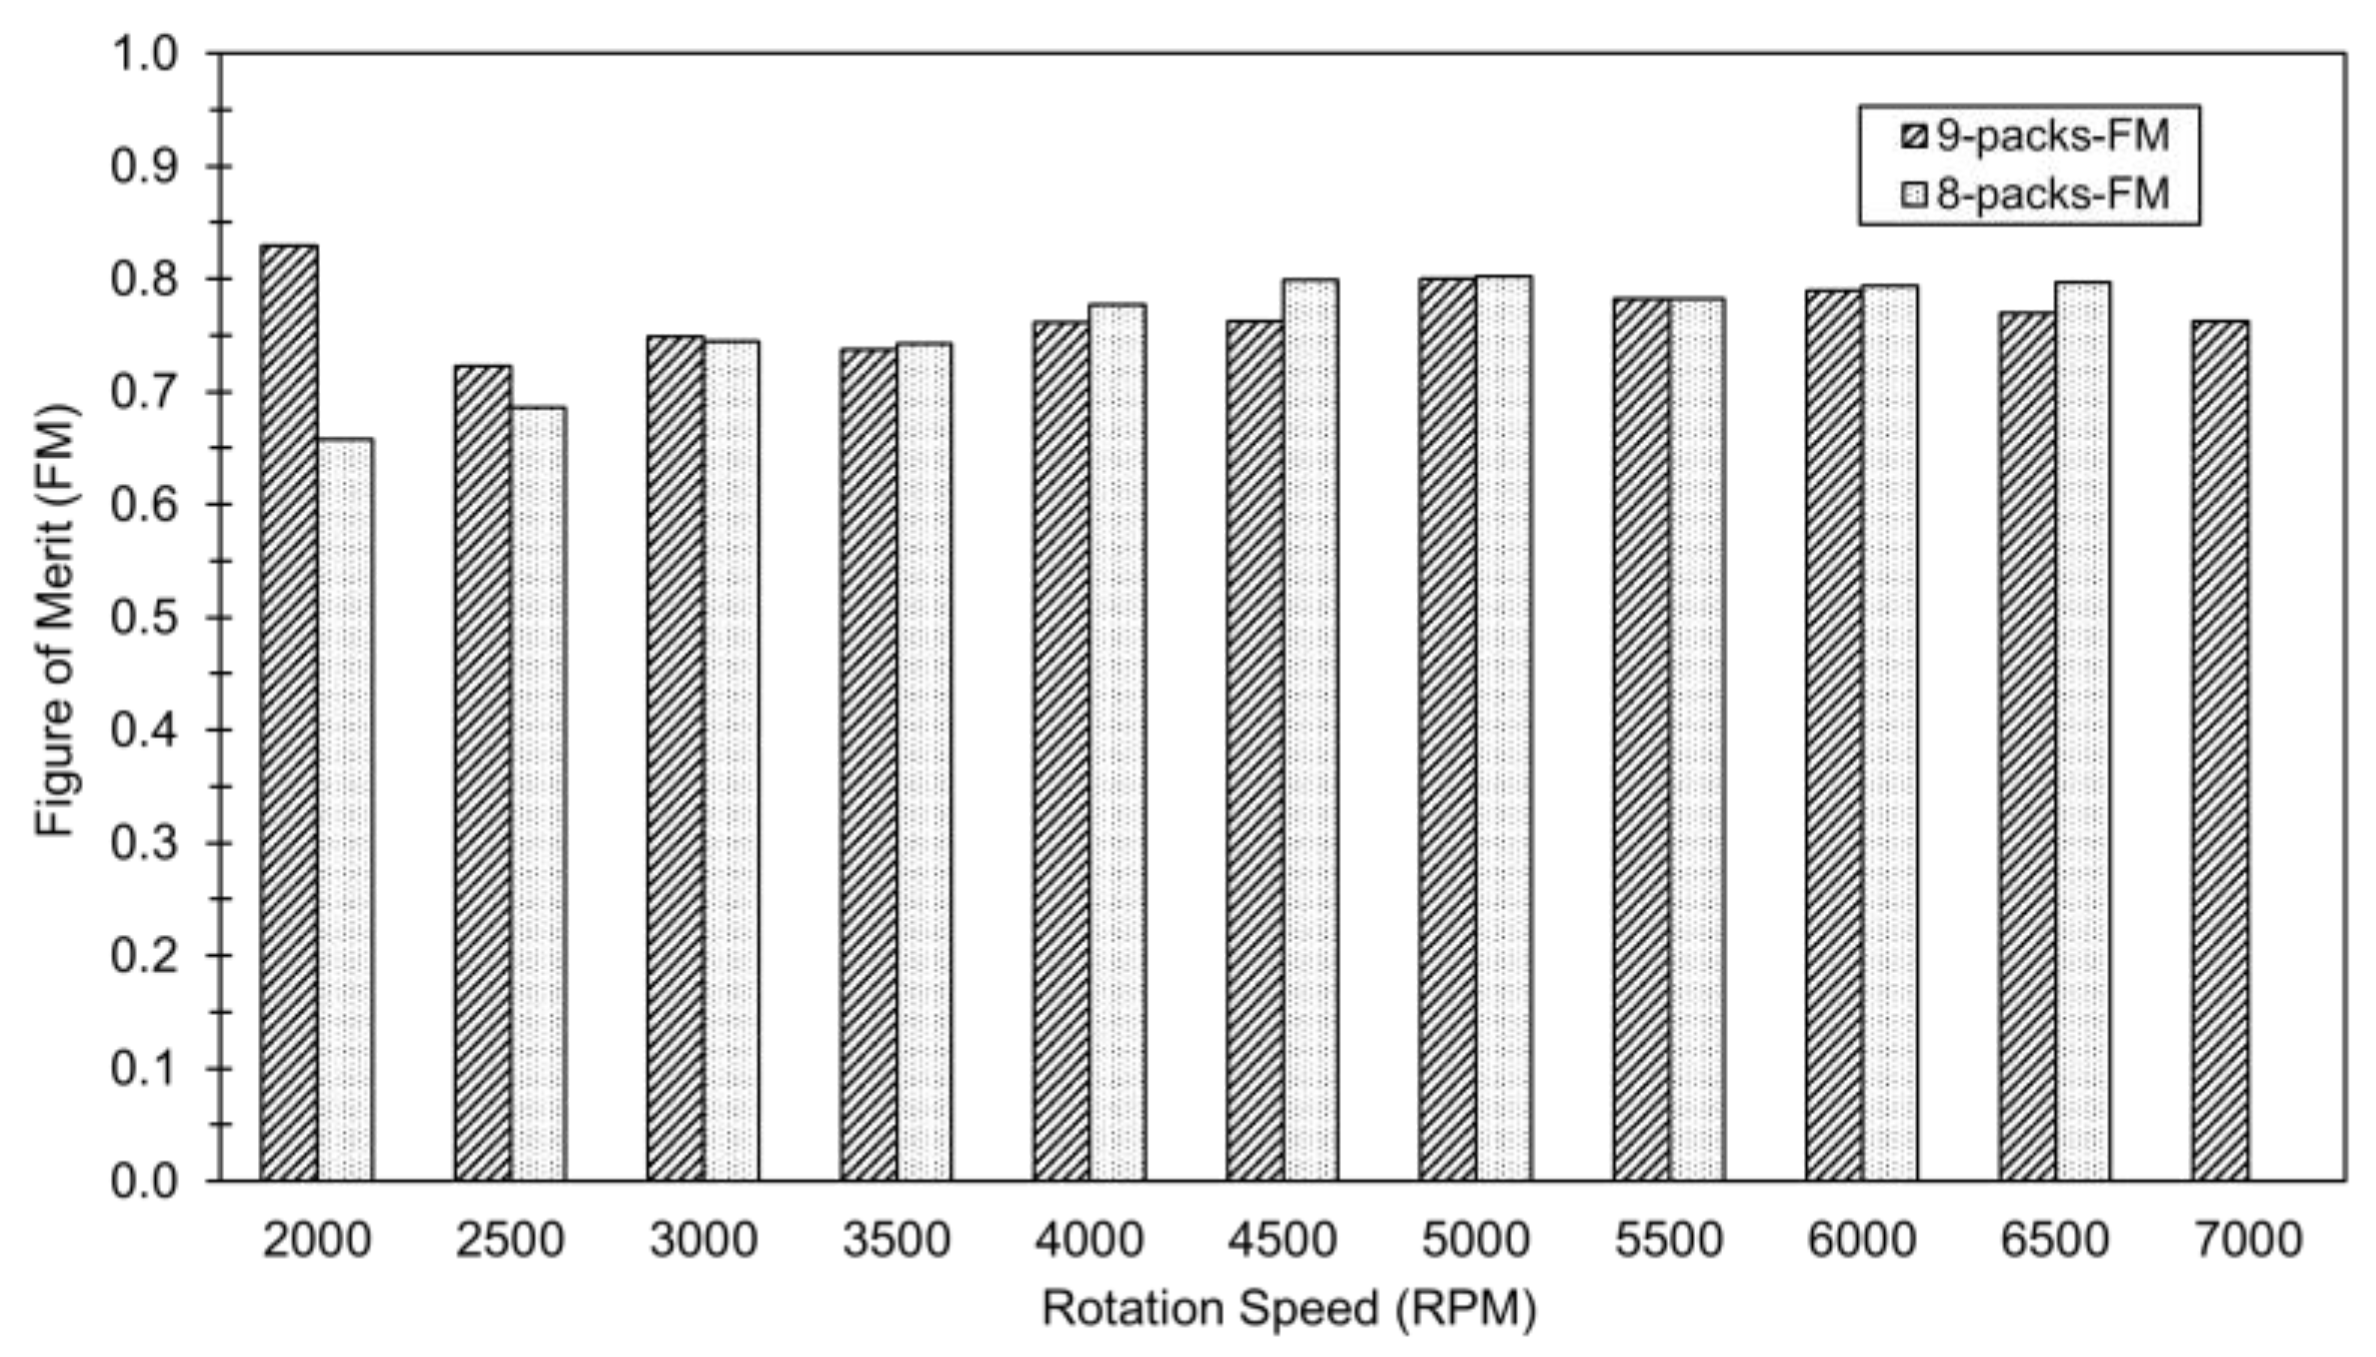
Figure 17.
Radar diagram of CT-CP-FM in the case of 8 battery packs.
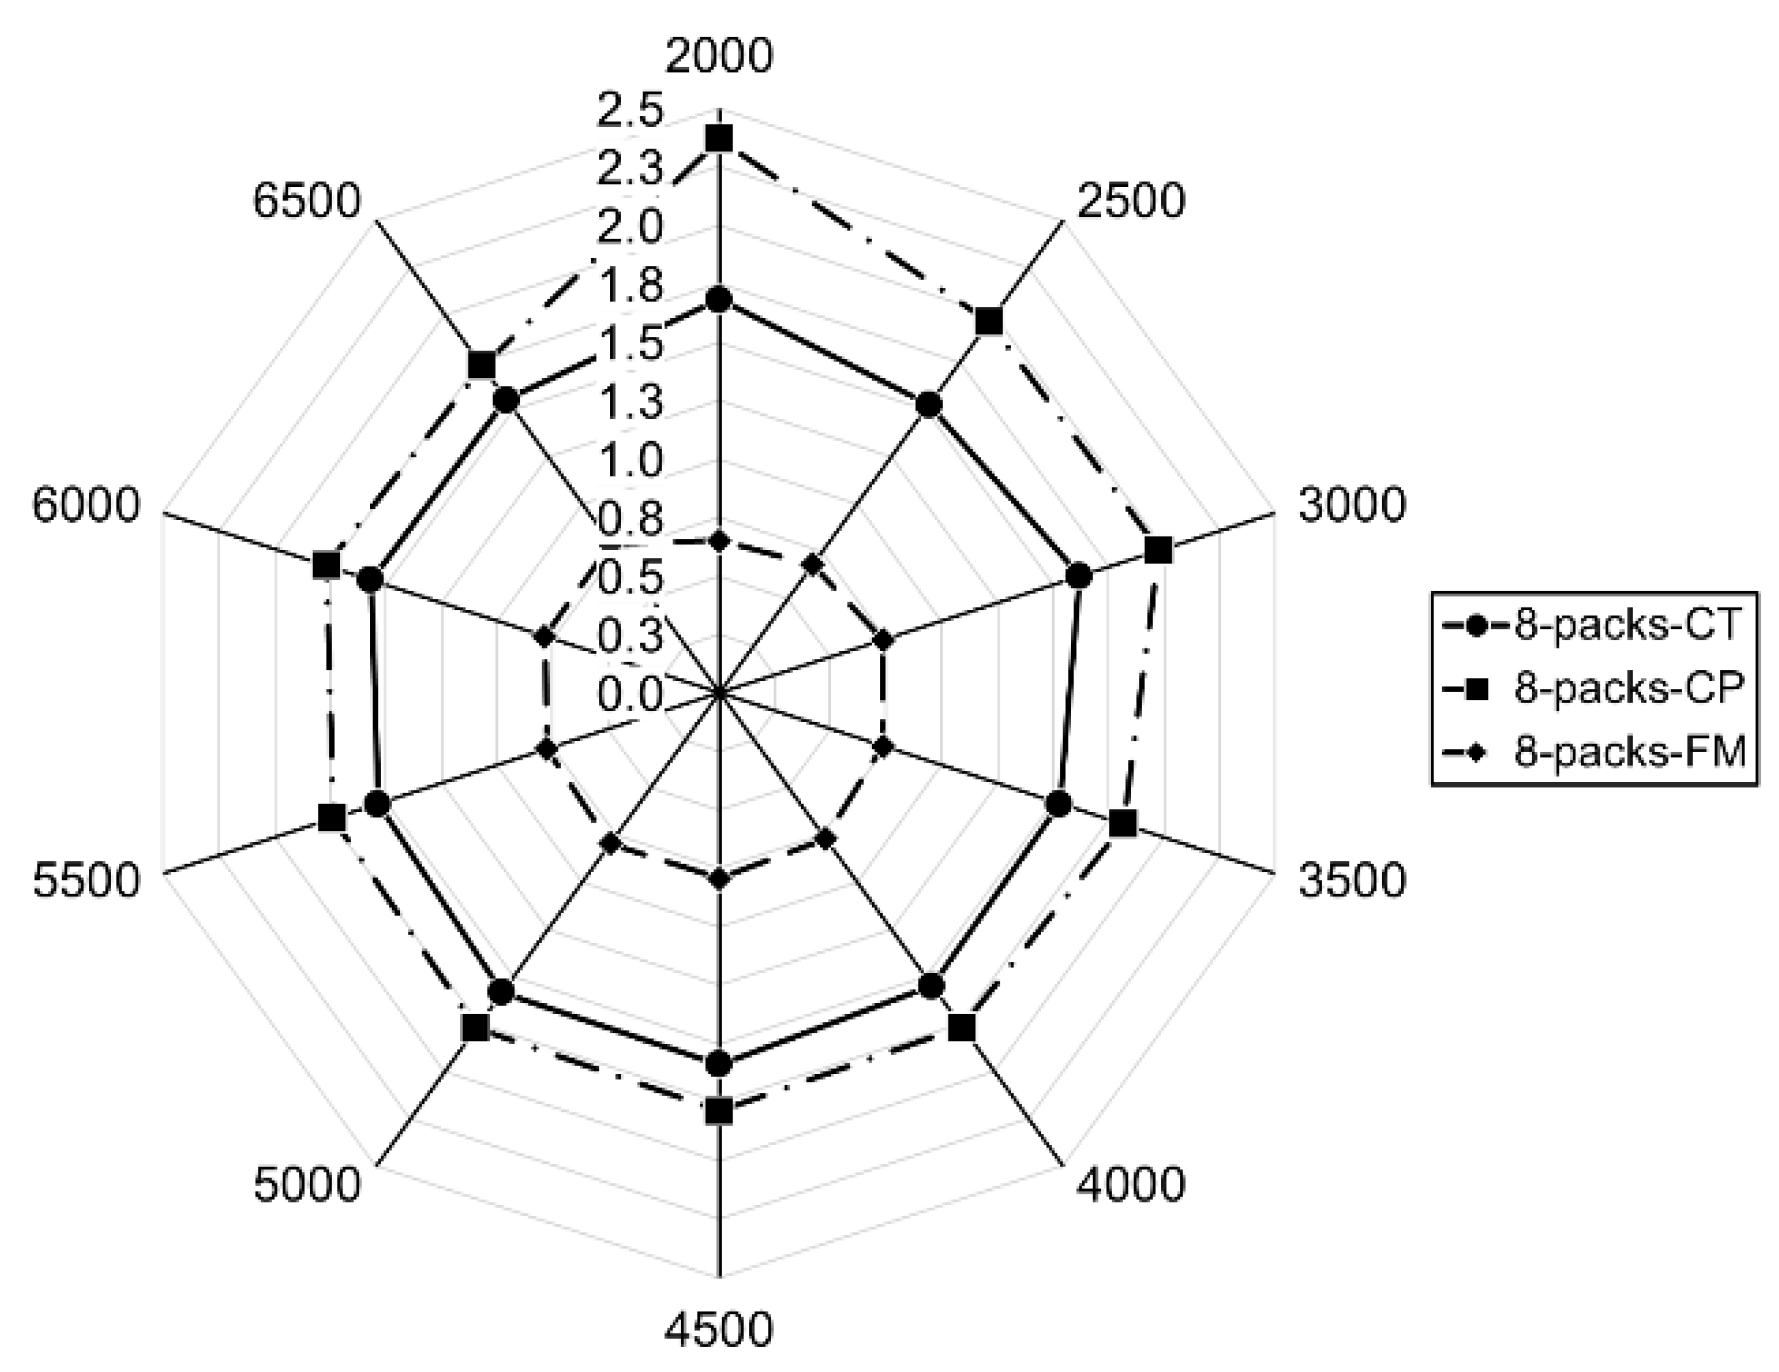
Figure 18.
Radar diagram of CT-CP-FM in the case of 9 battery packs.
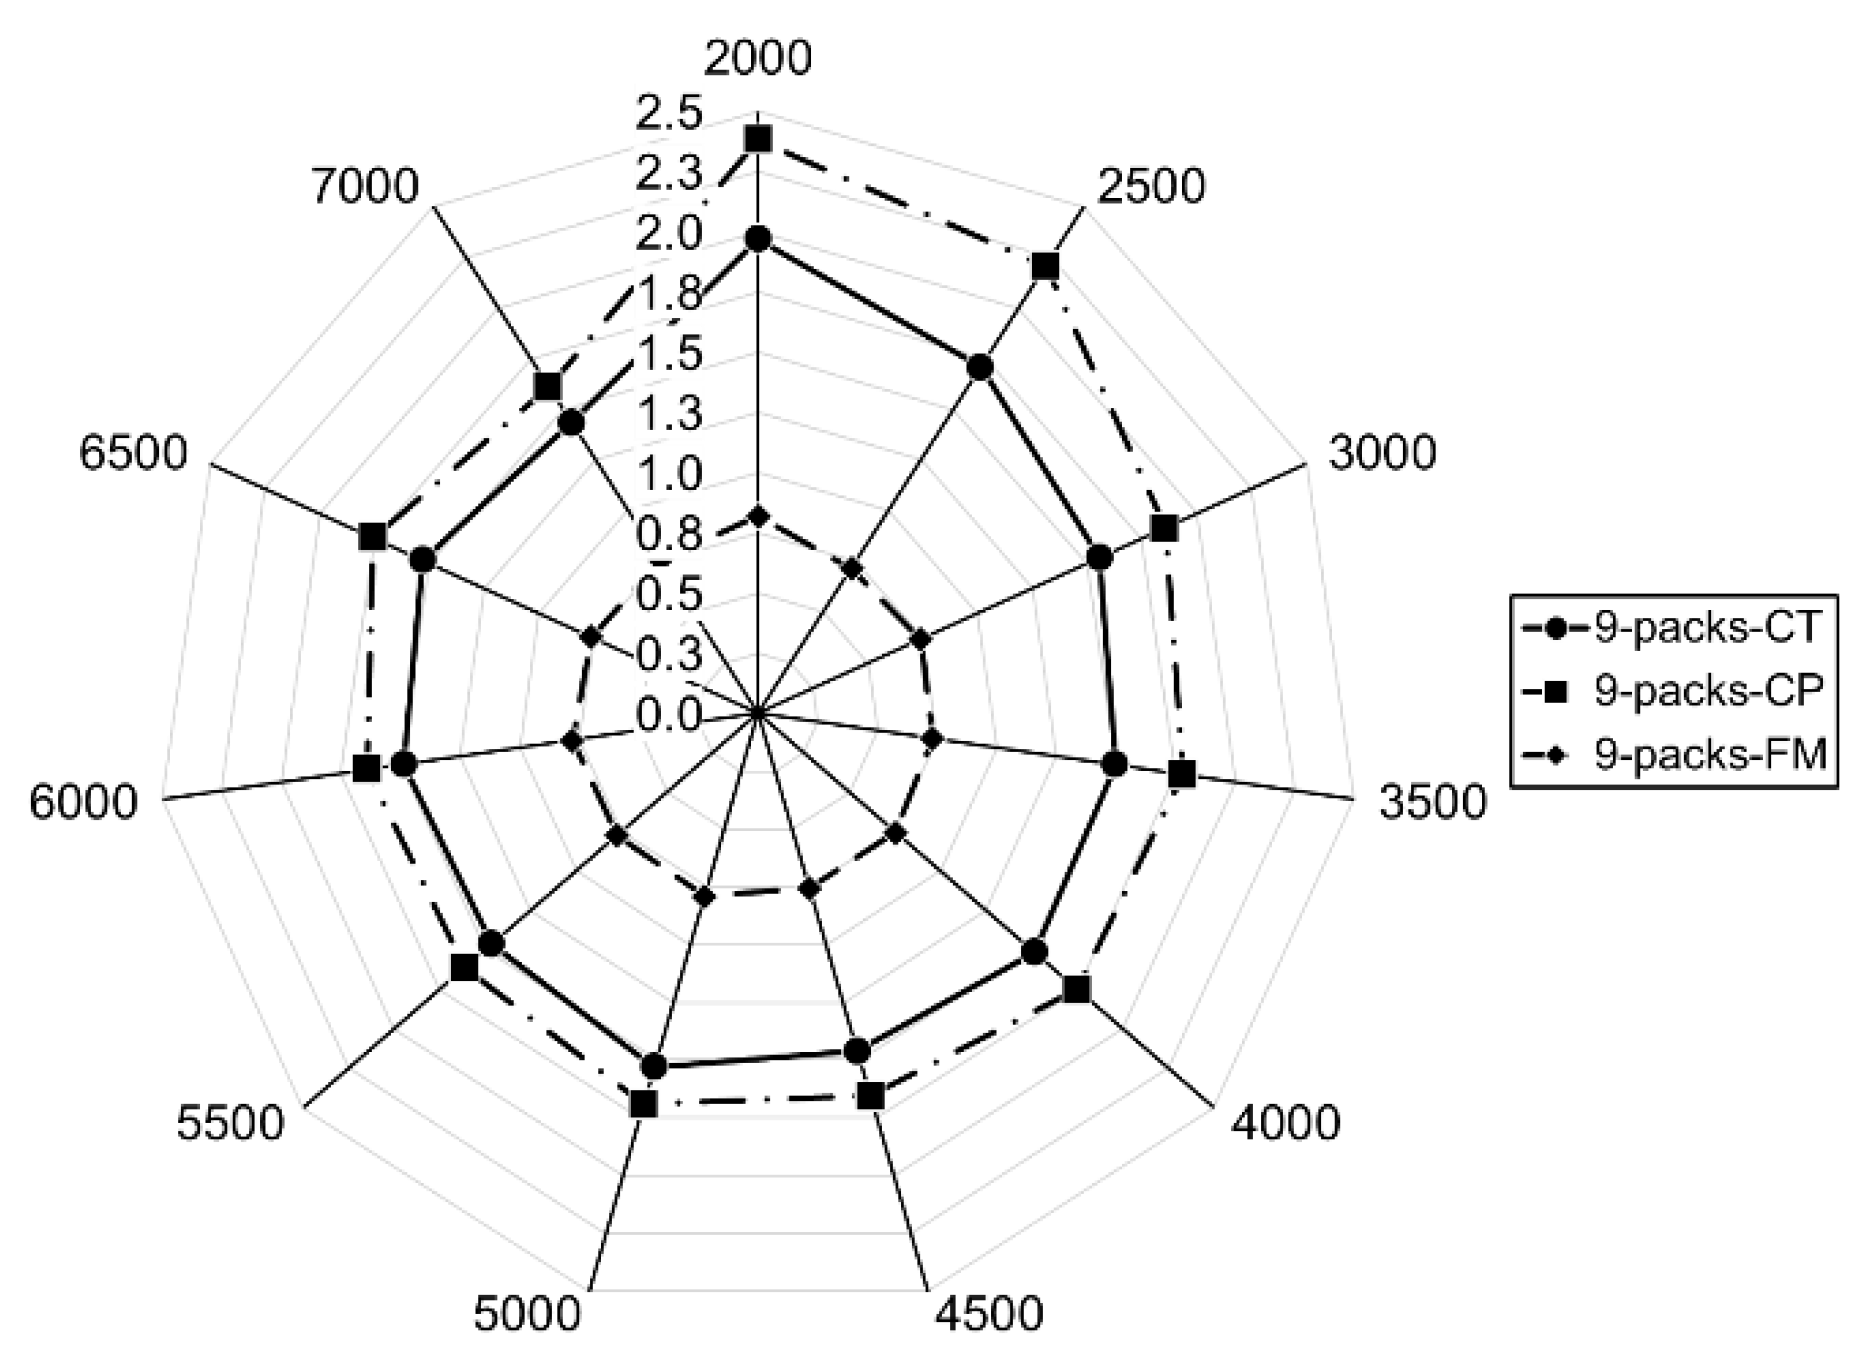

Table 1.
Geometric specification of the eDPF model.
| Fan shroud diameter | Fan tip clerance | Number of fan blades | Number of strut blades | eDPF axial length | eDPF nacelle diameter | Center body diameter |
|---|---|---|---|---|---|---|
| 390 mm | 2 mm | 10 | 6 | 554 mm | 498 mm | 110 mm |
Table 2.
Measuring equipment uncertainties.
| Measuring Equipment | Specification | Min | Max | Uncertainty | Unit |
|---|---|---|---|---|---|
| Thrust Load Cell (Compression type) | Thrust | 0 | 2700 | 0.88% | N |
| Cylindrical photoelectric sensor (Red LED light) | Angular velocity | 0 | 7200 | 0.1% | rpm |
| Microphone (PCB 377C01 + 426E01 + DAQ 20 kHz) | Sound Pressure | 0 | 200 | 0.25% | dB |
| Digital clamp meter (DC Voltage) | Voltage | 0 | 600 | 0.01% | V |
| Digital clamp meter (DC Current) | Current | 0 | 600 | 0.27% | A |
Table 3.
Basic technical characteristics of battery system.
| Option (serial connection) |
Max DC Voltage |
Operating DC Voltage |
Max DC Current |
Operating DC Current |
Efficiency |
|---|---|---|---|---|---|
| One battery pack | 14.4 V | 12.8 V | 400 A | 100 A | 98% |
| 8 battery packs | 115±3 V | 105±3 V | 400±40 A | 100±10 A | 98% |
| 9 battery packs | 130±3 V | 115±3 V | 400±40 A | 100±10 A | 98% |
Disclaimer/Publisher’s Note: The statements, opinions and data contained in all publications are solely those of the individual author(s) and contributor(s) and not of MDPI and/or the editor(s). MDPI and/or the editor(s) disclaim responsibility for any injury to people or property resulting from any ideas, methods, instructions or products referred to in the content. |
© 2025 by the authors. Licensee MDPI, Basel, Switzerland. This article is an open access article distributed under the terms and conditions of the Creative Commons Attribution (CC BY) license (http://creativecommons.org/licenses/by/4.0/).
Copyright: This open access article is published under a Creative Commons CC BY 4.0 license, which permit the free download, distribution, and reuse, provided that the author and preprint are cited in any reuse.


