
Submitted:
22 April 2025
Posted:
22 April 2025
You are already at the latest version
Abstract
The effect of replacing wheat with corn on the color distribution across various locations in the carcass of broilers was assessed. ROSS 308 1-day old male chicks were reared in 10 pens per treatment, depending on the main cereal ingredient during both the starter (1-14d) and grower (15-41d) phases: Corn and Wheat. At 41 days old, slaughtering was performed. At 24 h post slaughter, color measurements were taken using a MINOLTA CM600d reflectance spectrocolorimeter in the CIEL*a*b* space. Twelve locations were measured. The results indicate that the color distribution in the broiler carcass is not homogeneous. Very small color differences can be found between the surface and the interior of the breast, but they differ greatly from areas where there is skin. Corn produces darker color than wheat, though the intact skin homogenizes lightness* across the entire carcass reducing differences between regions. Corn increased mainly yellowness influencing color saturation. The pronounce color differences between the shank and other locations almost disappear when corn is excluded from the feed. Hue could serve as a potential indicator of color variations in the breast resulting from differences in dietary ingredients.
Keywords:
broiler
; color
; carcass
; corn
; wheat
1. Introduction
Appearance is one of the most important quality attributes that drives consumer behavior at purchase and, in most cases, is the only characteristic that can be assessed when meat is displayed in sealed packaging at the supermarket. Appearance encompasses both physical aspects and color, and both are crucial for the consumer when judging freshness [1]. This judgment is mainly associated with the characteristic pink color of the chicken meat [1], but this color only applies to what is referred to as white chicken. Some consumers have traditionally look for white-skinned chicken, while others are used to consuming yellow-skinned chicken, even within the same country [2,3]. In Spain, in the early 1980s, most of the chicken in the market was yellow. Nevertheless, from 2000 onwards only some areas in the north of the country maintained this product at retail as a remembrance of traditional husbandry practices whereas in the rest of the country, most consumers could only find white-skinned chicken at retail. Currently, the trend is slowly shifting toward a higher presence of yellow skinned chicken in supermarkets, with increased added value associated with a natural product. This shift in production is growing due to a different type of consumer, more focused on animal welfare [4] even if they have limited knowledge of how these animals are produced [5]. Additionally, some consumers associate yellow color with a healthier animal [6], as only healthy animals absorb pigments that can be transported in the blood to skin and fat tissues [7]. These skin colors depend on the animal’s diet, linked to the presence of carotenoids that cannot be synthesized by the animal [8], as well as the animal’s capacity to absorb and deposit them [9]. These compounds form the largest group of naturally occurring pigments, responsible from yellow to red colors in fruits, vegetables, algae or animals. Some of them also exhibit antioxidant activity or vitamin A activity once metabolized through conversion from mono-hydroxy- or monoketocarotenoids [10].
Corn is a common ingredient in poultry diets. Carotenoids present in corn include lutein, zeaxanthin, β-cryptoxanthin, β- carotene and α-carotene [11], which are responsible for its hue. In chicken, β- carotene is metabolized into vitamin A; therefore, it contributes little to meat pigmentation [10]. For yellow-skinned chicken, consumers have become accustomed to a very intense yellow skin that may even turn orange at times [12]. To achieve this high-intensity color in chicken, the industry combines natural and/or synthetic yellow and red carotenoids [2,7] in a diet that also includes corn as an ingredient. This ensures that the color does not appear artificial and helps to reduce the price of the ration if the inclusion rate is not too high. This approach is particularly relevant within the European Union where the feed is based on wheat, in contrast to the USA where the feed is based on corn due to higher availability. Research has been conducted on the effect of varying levels of natural or synthetic carotenoids in the diet on the performance or quality of the meat [7,13,14,15]. Nevertheless, the effect that corn has on the color of the final product is faded out, or even forgotten, due to the supplemented carotenoids in the feed [16]. Consumers are not aware of the mechanisms that lead to the desired color in the belief that it is solely due to the intake of corn. However, a movement among consumers toward natural food production, reducing unnecessary additives in the feed, could eliminate the inclusion of extra carotenoids in the formulation. This would also reduce costs as additives, particularly synthesized ones, can be expensive. Therefore, this study was conducted with the aim of assessing the effect of the substitution of wheat by corn in the diet of broilers on the color of different locations in the carcass, without supplementing additional carotenoids, with the hypothesis of a heterogeneous distribution of color across the carcass, using the CIEL*a*b* system as a non-invasive methodology.
2. Materials and Methods
Animals
The Ethics Committee for Animal Experiments at the University of Zaragoza approved this project (PD19/20NE). Animals were reared in the Experimental Unit of UVESA in Tudela (Navarra) divided into 20 pens (2 x 2.5m), with 60 ROSS 308 1-day old male chicks per pen. Animals were randomly distributed in the pens on the day of arrival. Pens were alternatively assigned to one of two diets characterized by their main cereal ingredient in both phases: Corn and Wheat, for a total of ten pens per treatment. Breeding conditions were those commonly used in the industry. From the first to the fourth day, animals were fed on papers on the floor that were simultaneously set up with the feeders. Throughout the trial, broilers had access to feed and water ad libitum. Animals received two different standard broiler diets per treatment: starter from 1 to 14 days old, and grower from then onwards until reaching 41 days old. Diets were formulated to be isoenergetic and isonitrogenous based on digestible lysine. The ingredient and nutrient composition of the diets can be found in Table 1.
When animals reached 41 days old, they were transported for less than 30 min to the abattoir after fasting on the farm for 6 hours, with total feed withdrawal for less than 10 hours, including lairage. Stunning was performed with CO2. Carcasses were defeathered, eviscerated, and had their heads, shanks and vents removed prior to chilling. Shanks were randomly collected and chilled at this point.
Color
At 24 h after slaughter, 15 carcasses per treatment, randomly chosen from the pens, were transported under commercial refrigerated conditions at 4o C from the processing plant of the abattoir to the facilities of the meat quality laboratory at the Veterinary Faculty of the University of Zaragoza. Color was measured at 12 points: 9 different points on each carcass: drumette, apterial latero-pectoral area, neck, the back at the 7th thoracic vertebra, saddle, thigh, ham, hock and around the vent, as well as on the shanks that were automatically separated from the carcass at the abattoir, and on the surface and interior of the breast after dissection from the carcass (Figure 1). A reflectance spectrocolorimeter MINOLTA CM600d [Konika Minolta, Inc, Japan] in the CIEL*a*b* color space [17] with an illuminant D65 and a 10o standard observer was used, obtaining the average of three measurements in each location per carcass. Lightness (L*), redness (a*) and yellowness (b*) were recorded and Chroma [C*, √(a2 + b2)] and Hue angle (Ho, tan-1(b*/a*) in degrees) were calculated.
Statistical Analyses
Using SPSS 26.0, a General Linear Model [GLM] was applied to assess the effect of diet, region and their interactions on color parameters. Due to the highly significant interactions between the effects found in all parameters, individual differences between diets at each location, and between locations within diets were assessed in a second step analysis also with a GLM procedure. Differences within mean values were analyzed with a Tukey’s multiple range test.
3. Results and Discussion
Lightness was affected by the diet in five out of the 12 locations analyzed (Table 2). In all of the significantly different regions in color, wheat produced a lighter color than corn-based diet, especially in the neck, the back, and the shank (P<0.001), but also in the drumette and the apterial latero-pectoral area (P<0.05). In all these areas, differences between diets exceeded 2 points., Consumers will differentiate between diets due to darker and lighter carcasses in these locations because the human eye is able to distinguish lightness differences greater than one point when colors are compared next to each other, but might not be able to differentiate the breast, which is the most expensive piece, either whole or sliced. Neither Rajput et al. [15] nor Peng et al. [18] found differences in lightness in the meat of the breast or the thigh with increasing levels of marigold supplementation or with different grain sources, respectively. On the contrary, Lyon et al. [19] also obtained significantly lighter breast in animals fed wheat than corn or sorghum, but in this case in thawed meat, with darker color than in our study, which could reflect the influence of freezing and thawing on color development.
The darkest location was the breast, either inside or on the surface (L* below 52 or around 54.5, respectively), irrespective of the diet, followed by the ham (L* around 66). All the other locations showed lightness* higher than 71 in Corn or 72 in Wheat diets, being the lightest locations the shank (79.0) in Wheat and the hock (76.2) in Corn diets. These shank L* values are in the same range as those found by Peng et al. [18] in corn- and sorghum+barley-based diets. But these authors found values above 71 in the breast skin, whereas we found L* values below 56 in the breast muscle, coincidentally with Ciurescu et al. [20]. In our study, we did not measure the skin when measuring the breast (Figure 1), considering that most consumers at retail purchase skinless breasts. In fact, except for the ham that has very thin skin, all the other locations showed high lightness values that are comparable to those found by Peng et al. [18]. Therefore, with the exception of the leg, whole carcasses can be considered fairly homogenous in Lightness*, irrespective of the diet when considering the color over the intact skin.
Significant differences appeared in the a*index between diets in all regions (Table 3), except in the saddle (P=0.137) and the thigh (P=0.062). As expected, corn provoked higher redness than wheat, whose lower a* values could even be negative. This relates to the carotenoid content of the grains, with extremely low content in wheat and very high content in corn (12 mg/kg in the corn of our study), especially when fortified with carotenoids [21]. In fact, provitamin A carotenoids (α- and β-carotene and β-cryptoxantin) or zeaxanthin are not detected in traditional wheat varieties [22]. Nevertheless, the carcass is not homogenous in redness, ranging between -0.94 and 5.30 in Wheat diet and 0.15 to 6.78 in Corn diet. Values in the breast were almost 3-fold lower than those found by Córdova-Novoa et al. [23], perhaps because their animals were 10 days older, and pigmentation increases with age or is reduced when restricted in the feed [13].
The breast and the posterior part of the body (ham, shank, thigh and hock) showed lower redness than the saddle and around the vent, due to the higher fatness in those latter areas. The dynamics of adipose tissue in different areas of the body have been found to be age-related [24] with differences in growth rate after hatching, both by hyperplasia and hypertrophy of adipocytes. Abdominal fat is a late-development adipose tissue in comparison with clavicular and subcutaneous fat [24]. Therefore, pigments in the diet will accumulate to a greater extent in late-developing tissues when administered in the grower feed, as was the case with the incorporation of corn as the main ingredient in this phase, which coincided with the latest feed administered to the animal.
The largest differences between diets appeared in yellowness (Table 4) in all locations except the thigh (P=0.237) and the ham (P=0.320), with the latter location showing the lowest yellowness intensity in both diets (4.62 vs 5.47 in Wheat and Corn diets, respectively). Lutein and zeaxanthin (yellow pigments with absorbance at 445-450 nm) are the major carotenoids in corn [25], contributing to a larger extent to the development of yellow hue than of red hue. The shank in the Corn group showed a 60% higher b* value than in the Wheat group, being the region with the highest b* value [31.6 vs 18.7, respectively]. Some authors have not found differences in any chromatic values in the breast [23] or in the breast and the thigh [20] when substituting corn with other cereals, such as sorghum. Although the total carotenoid content in sorghum is significantly lower than in yellow corn, their bioavailability is higher [26]. The fact that lutein and zeaxanthin are the major carotenoids in sorghum [26], as in corn, might contribute to similar L*a*b* values when comparing both cereals in the diet.
A higher amount of yellow pigments in the diet increased the differences between the shank and the subsequent locations, such as the vent, which were very large (8.56 points) in the Corn group but very small (0.05 points) and not significant in animals from the Wheat group. This might be due to the fact that zeaxanthin and canthaxanthin are mainly deposited in the shanks [27]. When zeaxanthin is supplemented in the diet, yellowness in the shank can rise by over 35 units, reaching even 65 when administered together with canthaxanthin [7]. Yellowness can reach 44 units in the hock [28] or in the breast [12] when marigold is supplemented in the feed, far higher than the values just over 10 found in our study in Corn diet without further carotenoid supplementation. The scales in the shank are structures that are able to incorporate carotenoids very early in animal development. However, in the abattoir during the defeathering process at the shackle line, they can be removed due to physical contact with the rotating rubber fingers used for plucking the feathers, resulting in an irregular, whiter appearance of the shank (Figure 2), thus dismissing visual differences between the treatments. Nevertheless, this can be considered an undesirable carcass quality defect and has been avoided in our measurements.
Chroma* reflects the saturation or concentration of a specific color. As a result of the differences in redness and yellowness, large differences appeared in Chroma* between diets (Table 5), except in the thigh and the ham, which showed small differences (1.37 and 0.74 units, respectively in each location between Wheat and Corn groups). Again, the shank is the location with the largest differences between diets (13.1 units), followed by the hock (5.27 units) and the neck (5.06 units). The intensity of the saturation will be linked to the deposition rate of those carotenoids with pigmentation properties in the tissues. Some competition among carotenoids has been described for uptake, absorption and incorporation into micelles [29], favored by dietary fat. However, Hencken [10] found that most carotenoids are excreted without absorption, and only 1.7% of zeaxanthin is deposited in the skin. This may happen, among other factors, due to the saturation of the uptake with high carotenoid doses or the physiological turnover of mucosal cells, the maturity of the enterocytes, or the morphology of the mucosa [29]. If there is a microbial disorder, feed utilization will be reduced [30]. Some organs, such as retina or liver, will contain more carotenoids than adipose tissue, either at high or lose intake doses [31,32]. Therefore, it seems logical the small differences found between diets in those locations with thin skin or low subcutaneous fat would occur, since the difference in deposition of certain carotenoids will be minimal between the diet with high and low content, after tissues competition for the deposition of the pigments.
Besides the shank, higher Chroma* was found around the vent, the hock, the saddle and the neck, with low values in the ham and the breast. Few authors calculate this saturation value in their work, which is highly dependent on b* intensity due to its predominance over a* value in pigmented chicken. In a sorghum diet, Ponsano et al. [14] found comparable saturation in the thigh and the breast to those found in the Corn group. Calculated data reflect similar values in corn or sorghum diets in the breast and the thigh [20], but much lower color saturation in the thawed breast [19] between corn- (4.16), sorghum- (2.95) and wheat- (2.57) based diets than those found in our work, indicating color losses after the freezing process.
Hueo reflects the color perception by which an object is red, blue, and so on [14]. As with Choma*, few authors calculate this chromatic attribute, but it is an important discriminator of the color of the meat with abnormal pH, as an example [33]. Although differences were obvious between diets in L*a*b* and Chroma* values, Hueº did not differ in the drumette, apterial latero-pectoral area, around the vent, the saddle, or the thigh (Table 6) between Corn and Wheat groups. The largest differences appeared in the breast and, especially, the ham (102.7 vs 88.9), with higher values in the wheat group in every location. The ham had the highest Hueº in the Wheat group (102.7), whereas the thigh had the highest in the Corn group (90.7). After calculating this attribute from published data, these differences in Hueº have also been found in the breast between diets when comparing corn with sorghum and wheat [19,20,23], which could be an indicator of different feed sources while assessing color differences in the carcass.
4. Conclusions
As a conclusion, color distribution in the carcass in the broiler is not homogeneous. Very small color differences can be found between the surface and the interior of the breast, but they differ greatly from locations where the skin is valued. Corn produces a darker color than wheat, although the intact skin homogenizes lightness* across the entire carcass. Pigments from the corn present in the feed without further carotenoid supplementation mainly increase yellowness, influencing color saturation. The large differences between the shank and the rest of the locations due to carotenoids almost disappear when corn is not included in the feed and, therefore, low pigments are consumed. Hueo could be an interesting indicator of differences in the color of the breast due to variations in the ingredients of the feed. Further research can optimize the type of ingredients in the feed by assessing the influence of various raw materials with different carotenoid content across different broiler strains to achieve consumer acceptability, thereby reducing the need for the inclusion of pigments as additives in the diet.
Author Contributions
Conceptualization, MMC and LM; methodology, MMC and LM.; formal analysis, MMC and LM.; investigation, MMC and LM; resources, MMC and LM; data curation, MMC; writing—original draft preparation, MMC; writing—review and editing, MMC and LM.; project administration, MMC; funding acquisition, MMC. All authors have read and agreed to the published version of the manuscript.
Funding
This research received no external funding.
Data Availability Statement
The raw data supporting the conclusions of the article will be made available by the authors on request.
Acknowledgments
Authors would like to thank UVESA for providing the facilities and the carcasses used in the study.
Conflicts of Interest
The authors declare no conflicts of interest.
References
- Kennedy, O.B.; Stewart-Knox, B.J.; Mitchell, P.C.; Thurnham, D.I. Consumer perceptions of poultry meat: a qualitative analysis. Nutr. Food Sci. 2004, 34, 122–129. [Google Scholar] [CrossRef]
- Castañeda, M.P.; Hirschler, E.M.; Sams, A.M. Skin pigmentation evaluation in broilers fed natural and synthetic pigments. Poult. Sci. 2005, 84, 143–147. [Google Scholar] [CrossRef] [PubMed]
- Sirri, F.; Petracci, M.; Bianchi, M.; Meluzzi, A. Survey of skin pigmentation of yellow-skinned broiler chickens. Poult. Sci. 2010, 89, 1556–1561. [Google Scholar] [CrossRef]
- Torrey, S.; Mohammadigheisar, M.; Nascimento dos Santos, M.; Rothschild, D.; Dawson, L.C.; Liu, Z.; Kiarie, E.G.; Edwards, A.M.; Mandell, I.; Karrow, N.; Tulpan, D.; Widowski, T.M. In pursuit of a better broiler: growth, efficiency, and mortality of 16 strains of broiler chickens. Poult. Sci. 2021, 100, 100955. [Google Scholar] [CrossRef]
- Lusk, J.L. Consumer preferences for and beliefs about slow growth chicken. Poult. Sci. 2018, 97, 4159–4166. [Google Scholar] [CrossRef]
- Sunde, M.L. The scientific way to pigment poultry products. Poult. Sci. 1992, 71, 709–710. [Google Scholar] [CrossRef]
- Pérez-Vendrell, A.M.; Hernández, J.M.; Llauradó, L.; Schierle, J.; Brufau, J. Influence of source and ratio of xanthophyll pigments on broiler chicken pigmentation and performance. Poult. Sci. 2001, 80, 320–326. [Google Scholar] [CrossRef] [PubMed]
- Blanch, A. Getting the color of yolk and skin right. World Poult Sci. J. 1999, 15, 32–33. [Google Scholar]
- Alonso-Alvarez, C.; García-de-Blas, E.; Mateo, R. Dietary canthaxanthin reduces xanthophyll uptake and red coloration in adult red-legged partridges. J Exp. Biol. 2018, 221, jeb185074. [Google Scholar] [CrossRef]
- Hencken, H. Chemical and physiological behavior of feed carotenoids and their effects on pigmentation. Poult. Sci. 1992, 71, 711–717. [Google Scholar] [CrossRef]
- Odunitan-Wayas, F.A.; Kolanisi, U.; Chimonyo, M.; Siwela, M. Effect of provitamin A biofortified maize inclusion on quality of meat from indigenous chickens. J. Appl. Poult. Res. 2016, 25, 581–590. [Google Scholar] [CrossRef]
- Martínez Peña, M.; Cortés Cuevas, A.; Avila González, E. Evaluation of three pigment levels of marigold petals (Tagetes erecta) on skin pigmentation of broiler chicken. Tec. Pecu. Mex. 2004, 42, 105–111. [Google Scholar]
- Muñoz-Díaz, J.I.; Fuente-Martínez, B.; Hernández-Velasco, X.; Ávila-González, E. Skin pigmentation in broiler chickens fed various levels of metabolizable energy and xanthophylls from Tagetes erecta. J. Appl. Poult. Res. 2012, 21, 788–796. [Google Scholar] [CrossRef]
- Ponsano, E.H.G.; Pinto, M.F.; Garcia-Neto, M.; Lacava, P.M. Performance and color of broilers fed diets containing Rhodocyclus gelatinosus biomass. Braz. J. Poult. Sci. 2004, 6, 237–242. [Google Scholar] [CrossRef]
- Rajput, N.; Naeem, M.; Ali, S.; Rui, Y.; Tian, W. Effect of dietary supplementation of marigold pigment on immunity, skin and meat color, and growth performance of broiler chickens. Braz. J. Poult. Sci. 2012, 14, 233–304. [Google Scholar] [CrossRef]
- Abraham, M.E.; Weimer, S.L.; Scoles, K.; Vargas, J.I.; Johnson, T.A.; Robison, C.; Hoverman, L.; Rocheford, E.; Rocheford, T.; Ortiz, D.; Karcher, D.M. Orange corn diets associated with lower severity of footpad dermatitis in broilers. Poult. Sci. 2021, 100, 101054. [Google Scholar] [CrossRef]
- C.I.E. (Commission Internationale de L’Eclairage). Colorimetry; C.I.E.: Vienna, Austria. 1986.
- Peng, Y.; Tan, H.; Liu, S.; Li, H.; Chen, Y.; Lin, J. Effects of different grain sources in both maternal and offspring diets on pigmentation and growth performance in yellow-skinned chickens. J. Poult. Sci. 2017, 54, 228–235. [Google Scholar] [CrossRef]
- Lyon, B.G.; Smith, D.P.; Lyon, C.E.; Savage, E.M. Effects of diet and feed withdrawal on the sensory descriptive and instrumental profiles of broiler breast fillets. Poult. Sci. 2004, 83, 275–281. [Google Scholar] [CrossRef]
- Ciurescu, G.; Vasilachi, A.; Idriceanu, L.; Dumitru, M. Effects of corn replacement by sorghum in broiler chickens diets on performance, blood chemistry, and meat quality. Ital. J. Anim. Sci. 2023, 22, 537–547. [Google Scholar] [CrossRef]
- Moreno, J.A.; Diaz-Gomez, J.; Fuentes-Font, L.; Angulo, E.; Gosalvez, L.F.; Sandmann, G.; Portero-Otin, M.; Capell, T.; Zhu, C.; Christou, P.; Nogareda, C. Poultry diets containing (keto)carotenoid-enriched maize improve egg yolk color and maintain quality. Anim. Feed Sci. Technol. 2020, 260, 114334. [Google Scholar] [CrossRef]
- Trono, D. Carotenoids in cereal food crops: composition and retention throughout grain storage and food processing. Plants 2019, 8, 551. [Google Scholar] [CrossRef] [PubMed]
- Córdova-Noboa, H.A.; Oviedo-Rondón, E.O.; Sarsour, A.H.; Barnes, J.; Ferzola, P.; Rademacher-Heilshorn, M.; Braun, U. Performance, meat quality, and pectoral myopathies of broilers fed either corn or sorghum based diets supplemented with guanidinoacetic. Poultr. Sci. 2018, 97, 2479–2493. [Google Scholar] [CrossRef]
- Bai, S.; Wang, G.; Zhang, W.; Zhang, S.; Rice, B.B.; Cline, M.A.; Gilbert, E.R. Broiler chicken adipose tissue dynamics during the first two weeks post-hatch. Comp Biochem Physiol A. 2015, 189, 115–123. [Google Scholar] [CrossRef]
- Muzhingi, T.; Yeum, K.J.; Russell, R.M.; Johnson, E.L.; Qin, J.; Tang, G. Determination of carotenoids in yellow maize, the effects of saponification and food preparations. Int. J. Vitam. Nutr. Res. 2008, 78, 112–120. [Google Scholar] [CrossRef]
- Kean, E.G.; Bordenave, N.; Ejeta, G.; Hamaker, B.R.; Ferruzzi, M.G. Carotenoid bioaccessibility from whole grain and decorticated yellow endosperm sorghum porridge. J. Cereal Sci. 2011, 54, 450–459. [Google Scholar] [CrossRef]
- Branellec, J.C. La pigmentation du poulet de chair. Aliscope 1985, 85, 1–13. [Google Scholar]
- Riveros Lizana, R.; Zea Mendoza, O.; Vilchez Perales, C. Evaluation of tarsus pigmentation in chickens fed with different levels of xanthophyll pigment: A practical application of the CIELab system. Int. J. Poult. Sci. 2020, 19, 265–269. [Google Scholar] [CrossRef]
- Deming, D.M.; Erdman Jr, J.W. Mammalian carotenoid absorption and metabolism. Pure Appl. Chem. 1999, 71, 2213–2223. [Google Scholar] [CrossRef]
- Gao, Y.Y.; Lin, Z.X.; Zhang, M.; Yang, R.; Guo, P.T.; Zhang, J.; Wang, C.K.; Jin, L. Health effects of astaxanthin in the intestinal tract of yellow-feathered broilers. Poult. Sci. 2025, 104, 104768. [Google Scholar] [CrossRef]
- Phelan, D.; Prado-Cabrero, A.; Nolan, J.M. Analysis of lutein, zeaxanthin, and meso-zeaxanthin in the organs of carotenoid-supplemented chickens. Foods 2018, 7, 20. [Google Scholar] [CrossRef]
- Wang, Y.; Illingworth, D.R.; Connor, S.L.; Duell, P.B.; Connor, W.E. Competitive inhibition of carotenoid transport and tissue concentrations by high dose supplements of lutein, zeaxanthin and beta-carotene. Eur. J. Nutr. 2010, 49, 327–336. [Google Scholar] [CrossRef] [PubMed]
- Abril, M.; Campo, M.M.; Önenç, A.; Sañudo, C.; Albertí, P.; Negueruela, A.I. Beef color evolution as a function of ultimate pH. Meat Sci. 2001, 58, 69–78. [Google Scholar] [CrossRef] [PubMed]
Figure 1.
Regional location of measurements: A, Drumette; B, Apterial latero-pectoral area; C, Neck; D, Back; E, Saddle; F, Thigh; G, Ham; H, Hock; I, Vent; J, Shank; K, Breast surface; L, Breast interior.
Figure 1.
Regional location of measurements: A, Drumette; B, Apterial latero-pectoral area; C, Neck; D, Back; E, Saddle; F, Thigh; G, Ham; H, Hock; I, Vent; J, Shank; K, Breast surface; L, Breast interior.
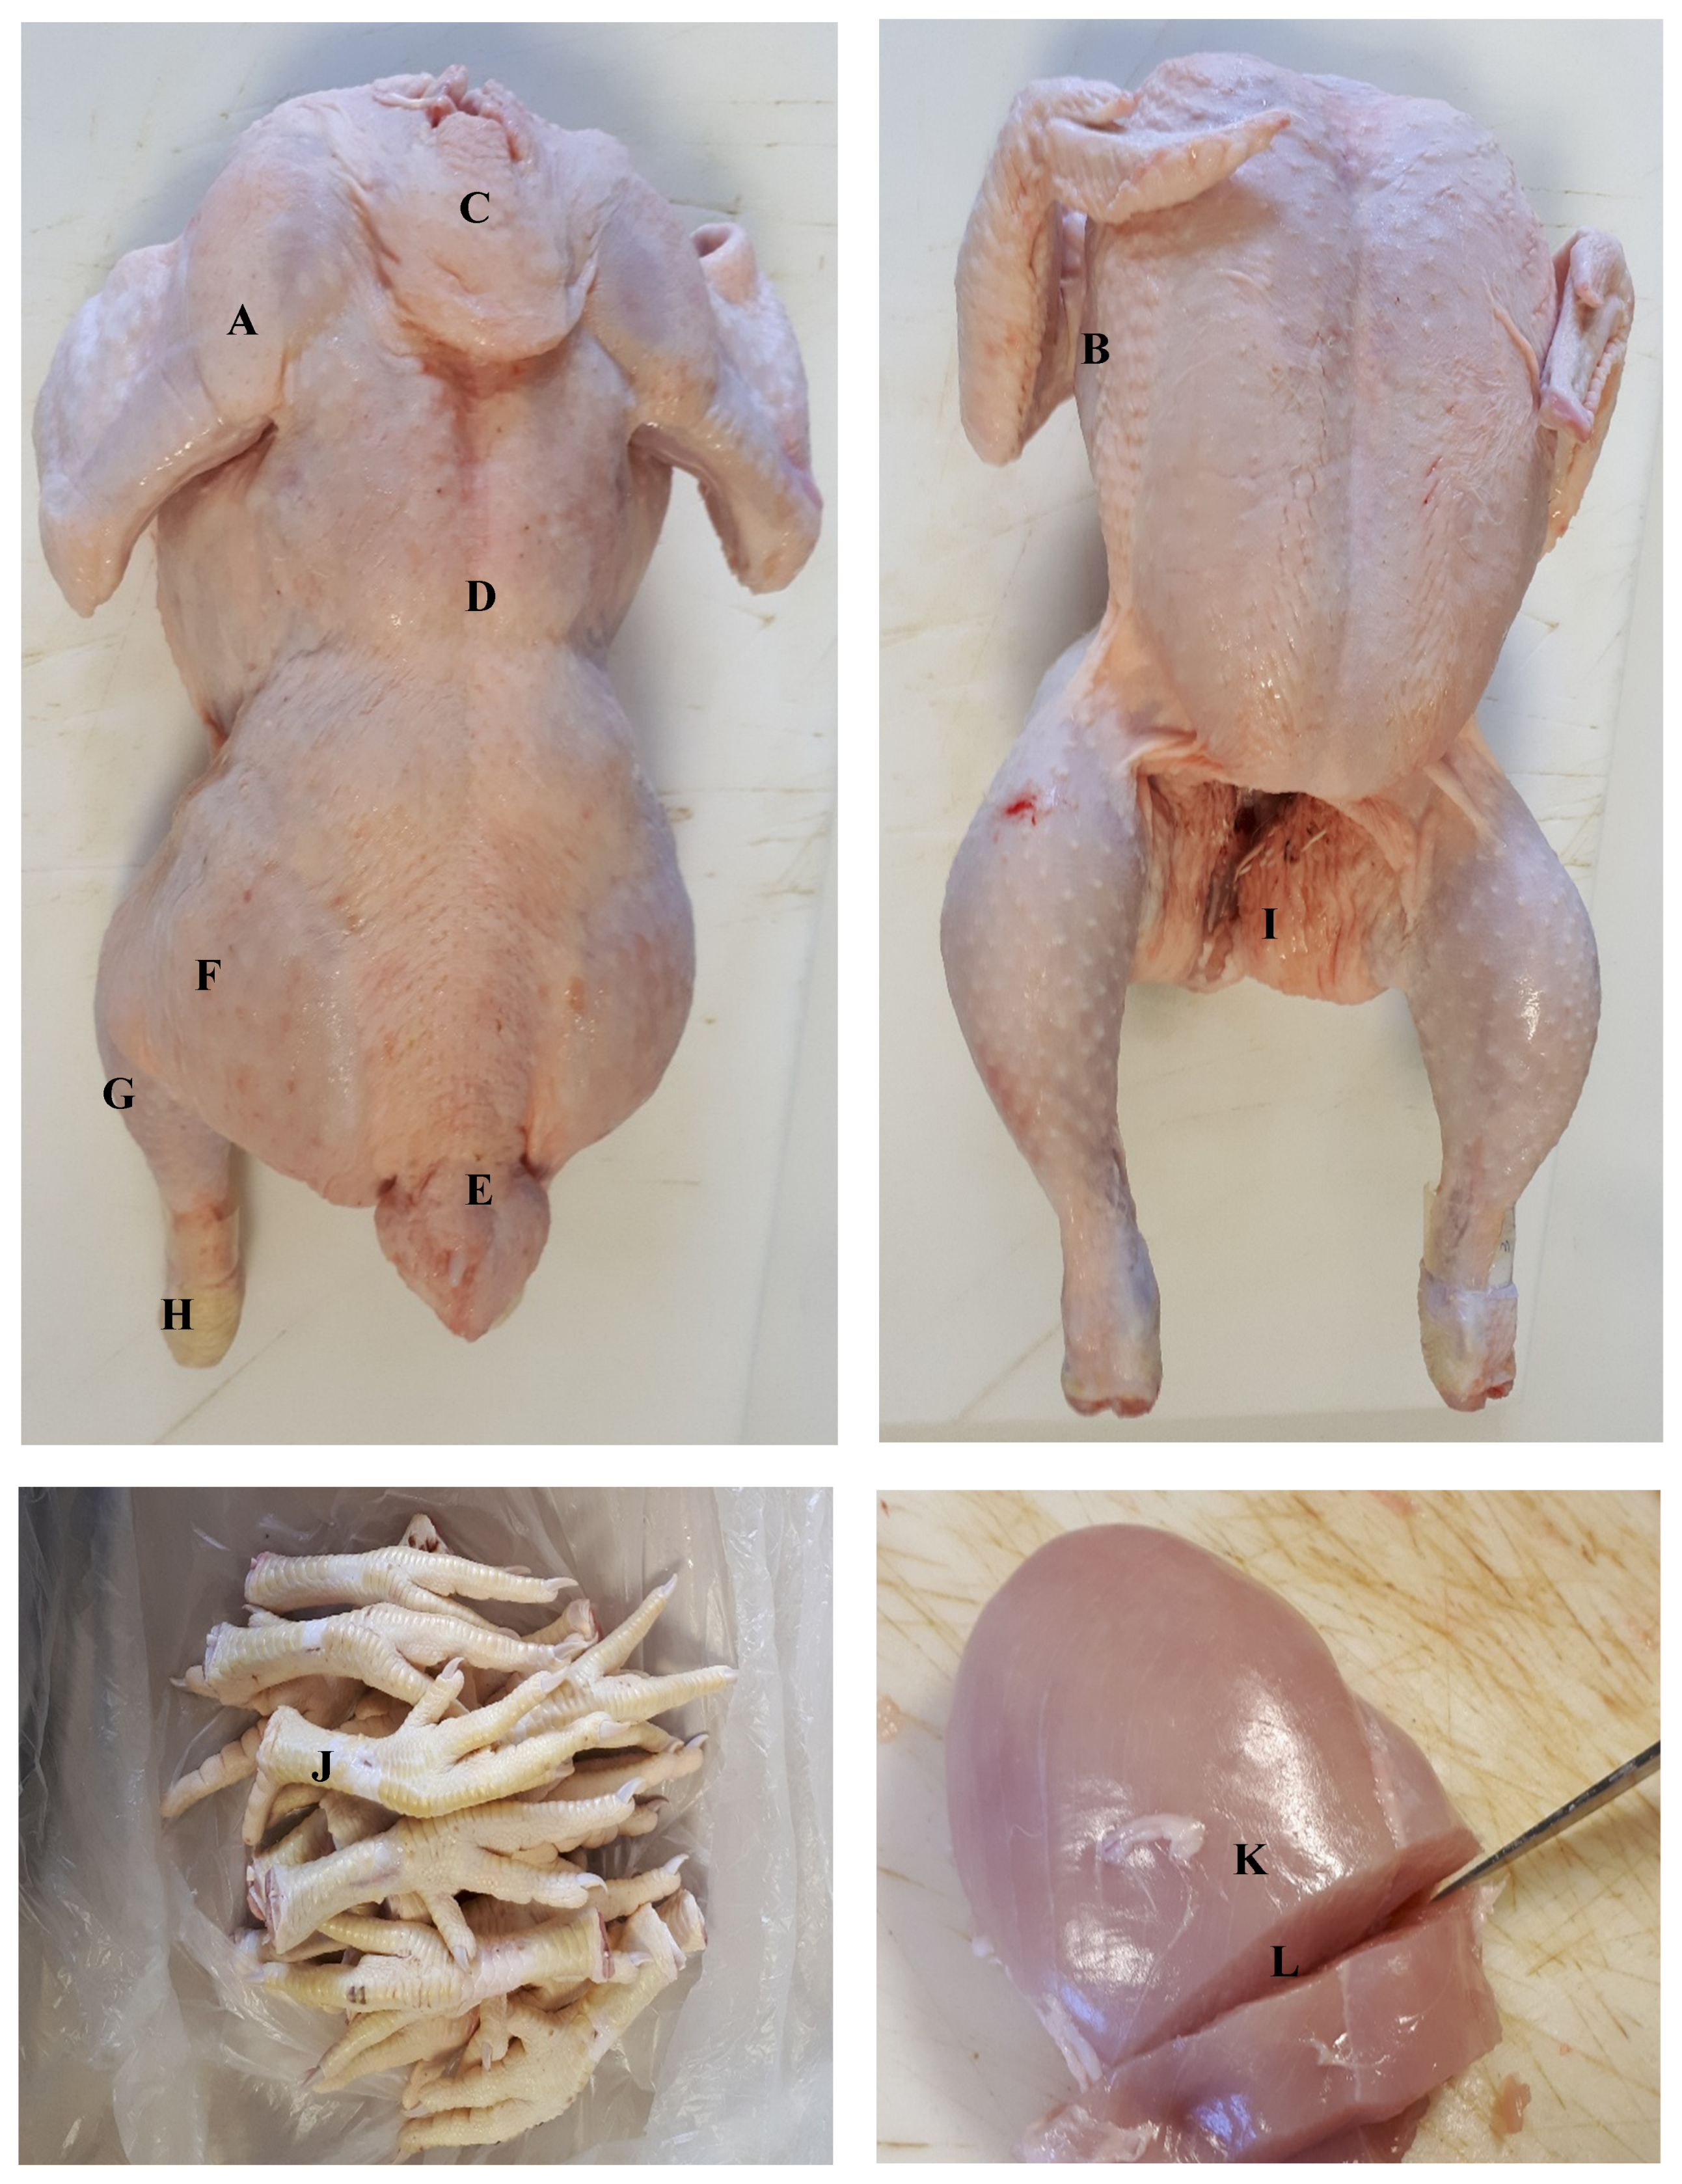
Figure 2.
Shanks from the Corn (A) and Wheat (B) groups, with remarks on areas that have lost scales during processing and have been avoided in the measurements.
Figure 2.
Shanks from the Corn (A) and Wheat (B) groups, with remarks on areas that have lost scales during processing and have been avoided in the measurements.
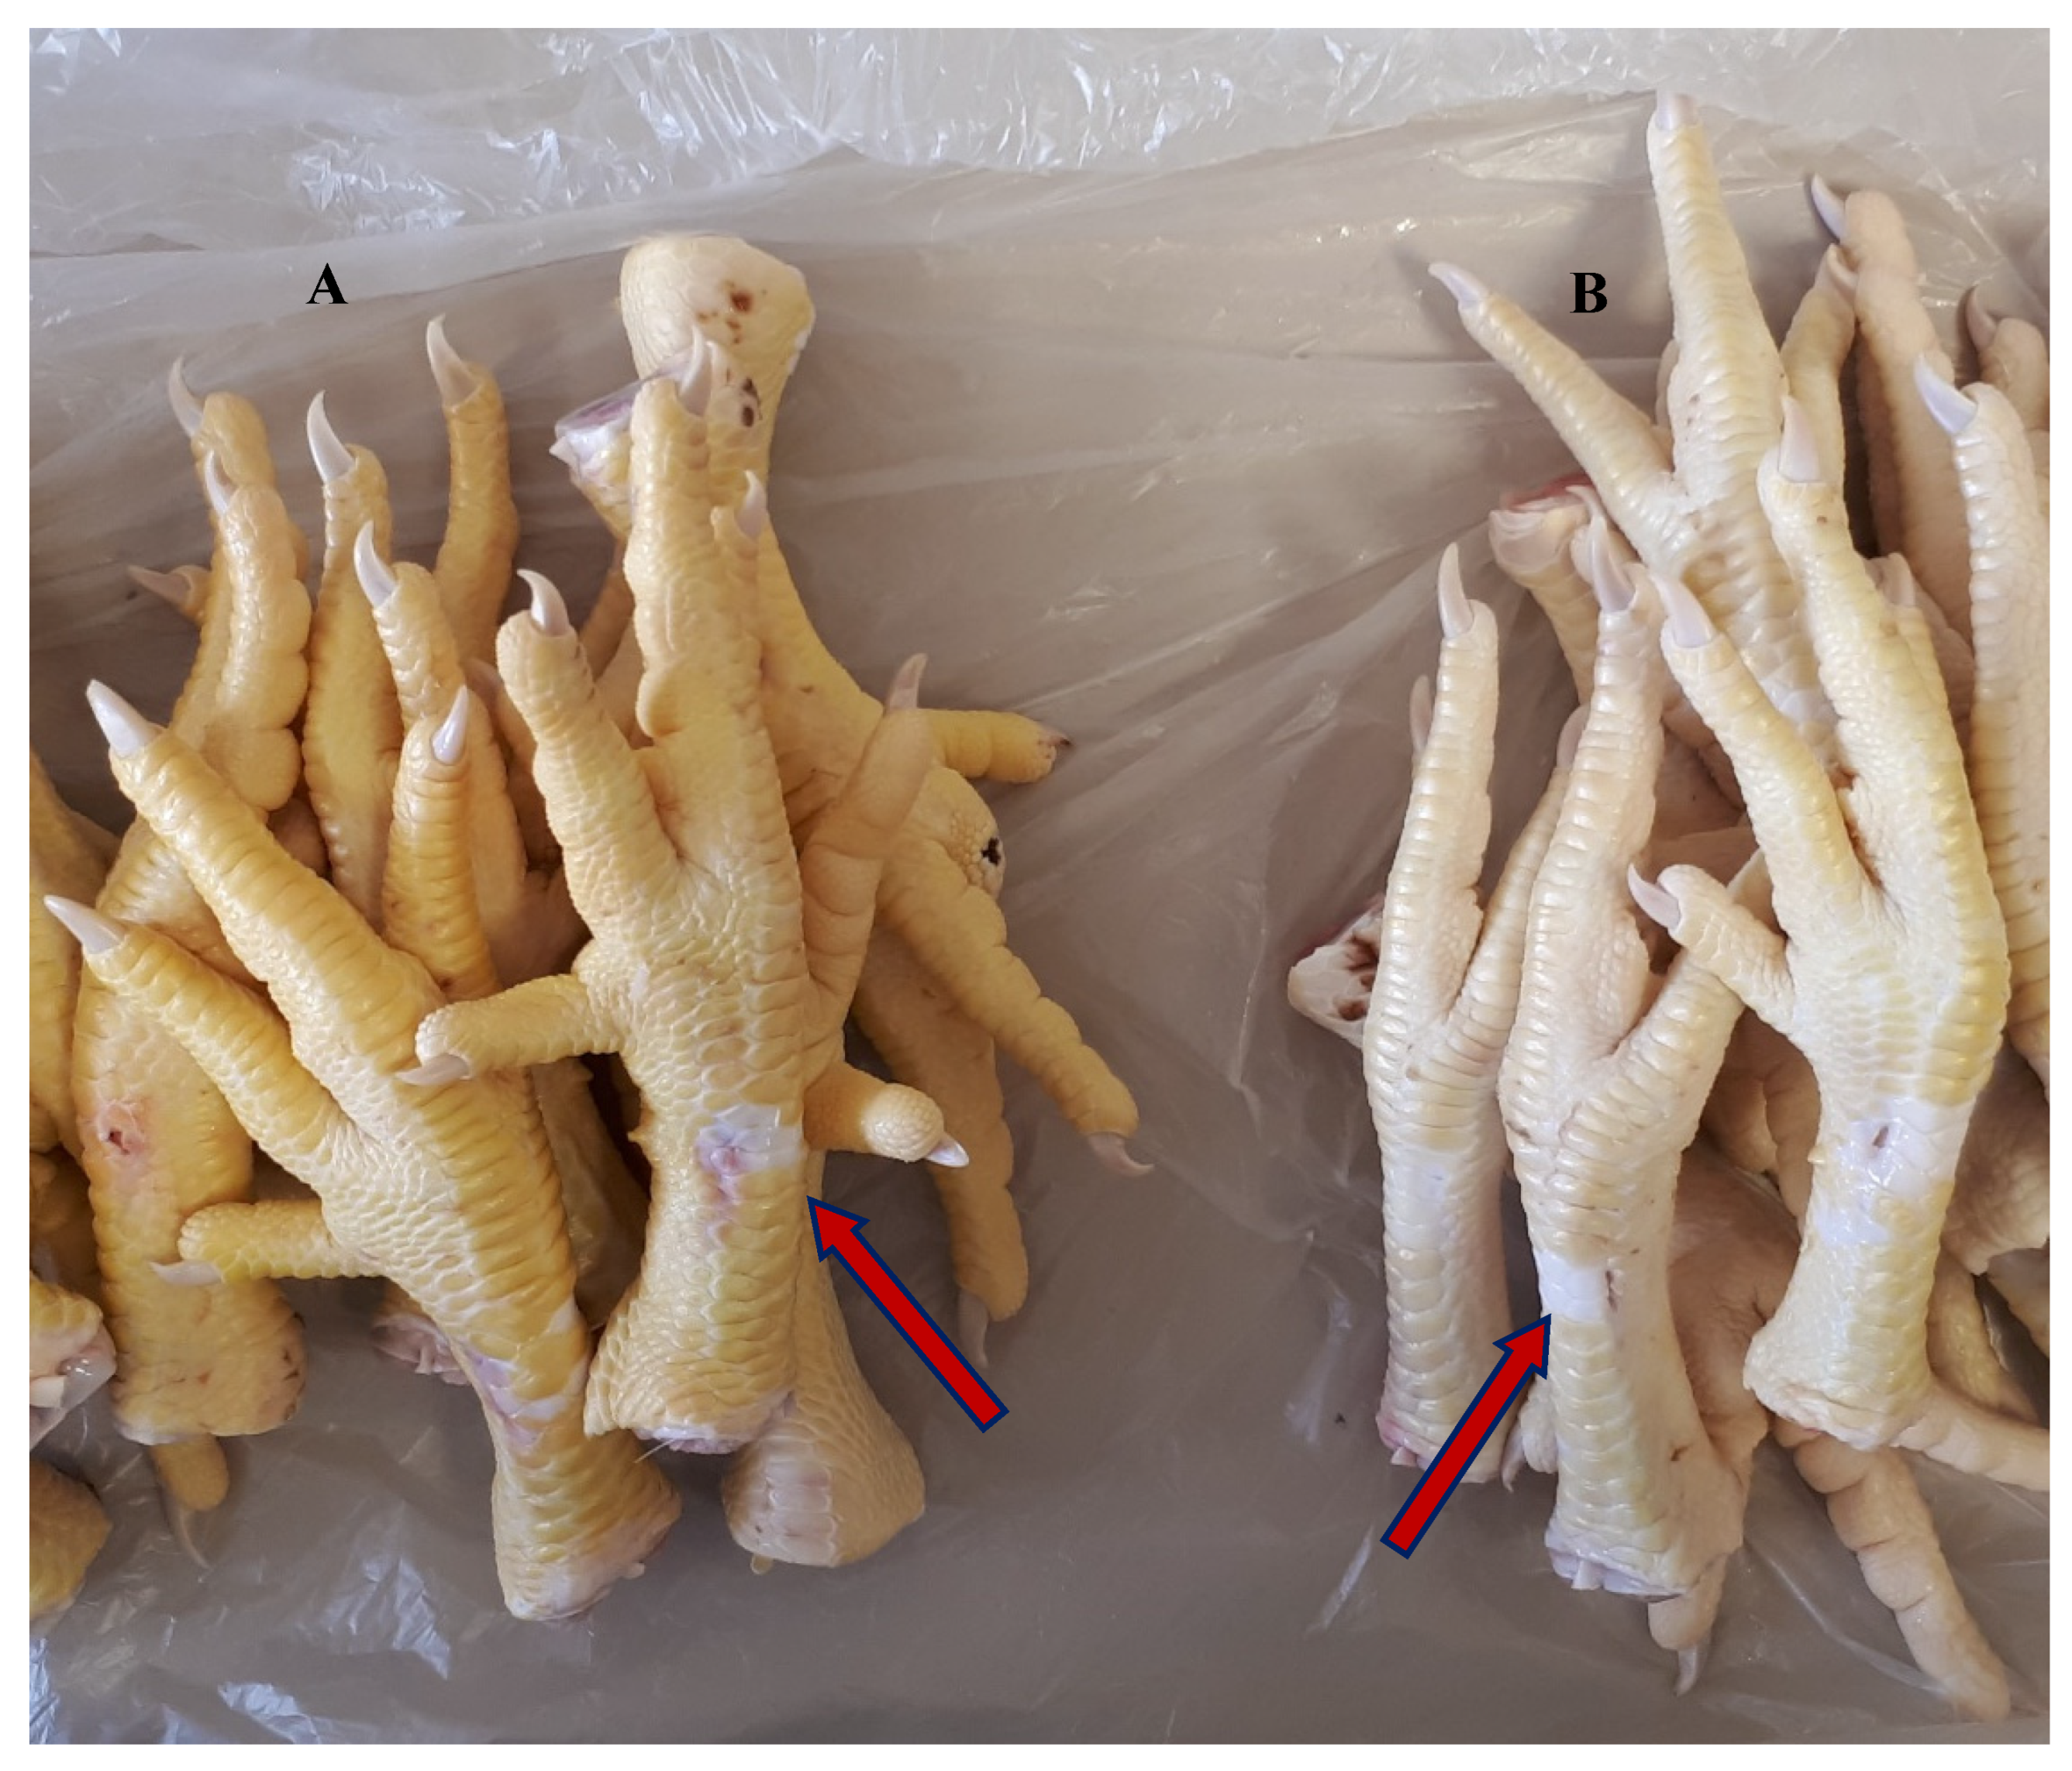

Table 1.
Ingredients and nutrient composition of experimental diets (g/kg as fed basis).
|
Starter (0-14d) Crumble |
Grower (15-41d) Pellet |
|||
| WHEAT | CORN | WHEAT | CORN | |
| Ingredients % | ||||
| Corn | 5.00 | 30.0 | 0 | 45.0 |
| Wheat | 30.0 | 15.0 | 45.1 | 0 |
| Barley | 20.0 | 6.70 | 25.0 | 22.9 |
| Soybean meal, 47% | 30.0 | 30.0 | 20.8 | 25.4 |
| Full fat soybean meal | 5.00 | 6.00 | 0 | 0 |
| Soybean oil | 0 | 0 | 2.51 | 2.25 |
| Sunflower meal, 34% | 3.00 | 4.00 | 3.00 | 1.00 |
| Tallow | 1.60 | 1.60 | 0 | 0 |
| Mucose, hydrolised | 2.00 | 2.65 | 0 | 0 |
| Dicalcium phosphate | 0.920 | 0.968 | 0.965 | 1.10 |
| Limestone | 0.786 | 0.712 | 0.981 | 0.871 |
| Vitamin-mineral premix1 | 0.500 | 0.500 | 0.500 | 0.500 |
| MHA-Ca2 | 0.447 | 0.447 | 0.327 | 0.346 |
| L-Lysine HCl | 0.278 | 0.260 | 0.293 | 0.233 |
| Salt (NaCl) | 0.168 | 0.153 | 0.167 | 0.217 |
| Sodium bicarbonate | 0.119 | 0.100 | 0.189 | 0.137 |
| L-Threonine | 0.130 | 0.115 | 0.106 | 0.071 |
| Calculated nutrients % | ||||
| Dry matter | 89.5 | 88.4 | 90.0 | 87.9 |
| ME poultry, kcal/kg | 2980 | 2980 | 3064 | 3050 |
| Crude protein | 29.0 | 23.8 | 18.7 | 18.3 |
| Lysine, total | 1.47 | 1.47 | 1.09 | 1.10 |
| Lysine, digestible | 1.31 | 1.31 | 0.970 | 0.970 |
| Crude fibre | 3.91 | 3.81 | 3.72 | 3.15 |
| Crude fat | 4.09 | 4.82 | 4.00 | 4.77 |
| Ash | 5.54 | 5.51 | 5.10 | 5.00 |
| Calcium | 0.965 | 0.950 | 1.00 | 0.995 |
| Phosphorus, total | 0.597 | 0.609 | 0.551 | 0.553 |
| Phosphorus, digestible | 0.440 | 0.440 | 0.420 | 0.420 |
1Contains per kg premix: vitamin A, 2000000 IU; vitamin D3, 700000 IU; vitamin E, 10000 IU; Vitamin K3, 0.6g; thiamine, 0.5g; vitamin B2, 1.4g; vitamin B6, 0.8g; vitamin B12, 4mg; biotin, 0.1g; folic acid, 0.3g; niacin, 16g; d-pantothenic acid, 2.8g; choline chloride, 50g; betaine anhydrous, 24g; Fe (iron sulfate monohydrate), 8g; Cu (copper sulfate pentahydrate), 3g; Zn (zinc sulfate monohydratate), 12g; Zn (zinc quelate), 8g; Mn (manganese sulfate monohydrate), 20g; Se (sodium selenite) 0.06g; I, 0.2g. endo-1,4-beta xylanase 390000 EPU; 6-phytase 300000 FTY; narasin, 10g; nicarbazin, 10g. 2Methionine hydroxy analogue - calcium salts.
Table 2.
Lightness (L*) of different carcass areas in broilers fed wheat- or corn-based diets.
| FEED | SEM | P | ||
|---|---|---|---|---|
| WHEAT | CORN | |||
| Apterial latero-pectoral area | 74.43 cdeX | 72.28 cY | 0.47 | 0.020 |
| Back | 74.89 bcdX | 72.58 cY | 0.33 | <0.001 |
| Breast interior | 51.95 g | 51.59 f | 0.67 | 0.791 |
| Breast surface | 54.55 g | 54.50 e | 0.46 | 0.959 |
| Drumette | 72.71 deX | 71.31 cY | 0.31 | 0.021 |
| Ham | 66.05 f | 65.81 d | 0.48 | 0.805 |
| Hock | 77.49 ab | 76.19 a | 0.35 | 0.057 |
| Neck | 75.97 bcX | 73.49 bcY | 0.37 | <0.001 |
| Saddle | 73.02 de | 73.00 c | 0.34 | 0.975 |
| Shank | 78.99 aX | 75.84 abY | 0.32 | <0.001 |
| Thigh | 72.93 de | 71.57 c | 0.37 | 0.064 |
| Vent | 72.09 e | 71.93 c | 0.37 | 0.830 |
| SEM | 0.63 | 0.59 | ||
| P | <0.001 | <0.001 | ||
a, b, c, d, e, f, g: mean values within feed with different letters differ significantly between carcass areas (P≤0.05); X,Y: mean values within location with different letters differ significantly between diets (P≤0.05). SEM: standard error of the mean.
Table 3.
Redness (a*) of different carcass areas in broilers fed wheat- or corn-based diets.
| FEED | SEM | P | ||
|---|---|---|---|---|
| WHEAT | CORN | |||
| Apterial latero-pectoral area | 0.78 dY | 2.05 deX | 0.30 | 0.030 |
| Back | 2.84 cY | 4.76 bcX | 0.32 | 0.001 |
| Breast interior | -0.94 eY | 0.80 efX | 0.20 | <0.001 |
| Breast surface | -0.32 deY | 1.02 efX | 0.17 | <0.001 |
| Drumette | 3.46 bcY | 5.12 bX | 0.31 | 0.005 |
| Ham | -0.43 eY | 0.25 fX | 0.12 | 0.002 |
| Hock | -0.36 deY | 2.14 deX | 0.30 | <0.001 |
| Neck | 3.19 bcY | 5.17 bX | 0.28 | <0.001 |
| Saddle | 4.31 ab | 5.08 b | 0.26 | 0.137 |
| Shank | -0.27 deY | 3.32 cdX | 0.33 | <0.001 |
| Thigh | -0.39 de | 0.15 f | 0.14 | 0.062 |
| Vent | 5.30 aY | 6.78 aX | 0.31 | 0.015 |
| SEM | 0.17 | 0.19 | ||
| P | <0.001 | <0.001 | ||
a, b, c, d, e, f: mean values within feed with different letters differ significantly between carcass areas (P≤0.05). X,Y: mean values within location with different letters differ significantly between diets (P≤0.05). SEM: standard error of the mean.
Table 4.
Yellowness (b*) of different carcass areas in broilers fed wheat- or corn-based diets.
| FEED | SEM | P | ||
|---|---|---|---|---|
| WHEAT | CORN | |||
| Apterial latero-pectoral area | 7.78 deY | 11.64 efX | 0.58 | <0.001 |
| Back | 13.17 cY | 15.21 deX | 0.40 | 0.009 |
| Breast interior | 6.53 efY | 10.93 fX | 0.46 | <0.001 |
| Breast surface | 7.39 deY | 10.58 fX | 0.45 | <0.001 |
| Drumette | 14.35 bcY | 17.75 cdX | 0.45 | <0.001 |
| Ham | 4.62 f | 5.47 g | 0.42 | 0.320 |
| Hock | 16.39 abY | 21.52 bcX | 1.23 | 0.035 |
| Neck | 14.98 bcY | 19.70 bcX | 0.52 | <0.001 |
| Saddle | 16.58 abY | 18.57 cdX | 0.44 | 0.020 |
| Shank | 18.70 aY | 31.59 aX | 1.23 | <0.001 |
| Thigh | 9.50 d | 10.86 f | 0.57 | 0.237 |
| Vent | 18.65 aY | 23.03 bX | 0.58 | <0.001 |
| SEM | 0.39 | 0.56 | ||
| P | <0.001 | <0.001 | ||
a, b, c, d, e, f, g: mean values within feed with different letters differ significantly between carcass areas (P≤0.05). X,Y: mean values within location with different letters differ significantly between diets (P≤0.05). SEM: standard error of the mean.
Table 5.
Chroma* of different carcass areas in broilers fed wheat- or corn-based diets.
| FEED | SEM | P | ||
|---|---|---|---|---|
| WHEAT | CORN | |||
| Apterial latero-pectoral area | 7.89 efY | 11.90 eX | 0.60 | <0.001 |
| Back | 13.50 dY | 16.04 dX | 0.43 | 0.002 |
| Breast interior | 6.62 fgY | 10.98 eX | 0.46 | <0.001 |
| Breast surface | 7.41 efY | 10.65 eX | 0.46 | <0.001 |
| Drumette | 14.80 cdY | 18.53 cdX | 0.49 | <0.001 |
| Ham | 4.76 g | 5.50 f | 0.40 | 0.365 |
| Hock | 16.40 bcY | 21.67 bcX | 1.24 | 0.030 |
| Neck | 15.34 cdY | 20.40 bcX | 0.55 | <0.001 |
| Saddle | 17.16 abcY | 19.29 cdX | 0.46 | 0.018 |
| Shank | 18.71 abY | 31.77 aX | 1.24 | <0.001 |
| Thigh | 9.53 e | 10.90 e | 0.57 | 0.232 |
| Vent | 19.45 aY | 24.02 bX | 0.61 | <0.001 |
| SEM | 0.40 | 0.58 | ||
| P | <0.001 | <0.001 | ||
a, b, c, d, e, f, g: mean values within feed with different letters differ significantly between carcass areas (P≤0.05). X,Y: mean values within location with different letters differ significantly between diets (P≤0.05). SEM: standard error of the mean.
Table 6.
Hueo of different carcass areas in broilers fed wheat- or corn-based diets.
| FEED | SEM | P | ||
|---|---|---|---|---|
| WHEAT | CORN | |||
| Apterial latero-pectoral area | 84.91 cd | 80.81 cd | 1.48 | 0.169 |
| Back | 77.93 deX | 72.55 eY | 1.12 | 0.014 |
| Breast interior | 97.58 abX | 85.91 abcY | 1.33 | <0.001 |
| Breast surface | 93.05 bcX | 84.56 bcY | 1.06 | <0.001 |
| Drumette | 76.70 de | 73.92 e | 0.86 | 0.106 |
| Ham | 102.70 aX | 88.90 abY | 3.36 | 0.037 |
| Hock | 91.29 bcX | 84.14 bcY | 0.94 | <0.001 |
| Neck | 78.06 deX | 75.25 deY | 0.71 | 0.047 |
| Saddle | 75.64 de | 74.60 e | 0.65 | 0.429 |
| Shank | 90.98 bcX | 84.06 bcY | 0.64 | <0.001 |
| Thigh | 93.04 bc | 90.74 a | 0.89 | 0.200 |
| Vent | 74.35 e | 73.64 e | 0.62 | 0.573 |
| SEM | 0.89 | 0.58 | ||
| P | <0.001 | <0.001 | ||
a, b, c, d, e: mean values within feed with different letters differ significantly between carcass areas (P≤0.05). X,Y: mean values within location with different letters differ significantly between diets (P≤0.05). SEM: standard error of the mean.
Disclaimer/Publisher’s Note: The statements, opinions and data contained in all publications are solely those of the individual author(s) and contributor(s) and not of MDPI and/or the editor(s). MDPI and/or the editor(s) disclaim responsibility for any injury to people or property resulting from any ideas, methods, instructions or products referred to in the content. |
© 2025 by the authors. Licensee MDPI, Basel, Switzerland. This article is an open access article distributed under the terms and conditions of the Creative Commons Attribution (CC BY) license (http://creativecommons.org/licenses/by/4.0/).
Copyright: This open access article is published under a Creative Commons CC BY 4.0 license, which permit the free download, distribution, and reuse, provided that the author and preprint are cited in any reuse.


