
Submitted:
21 April 2025
Posted:
22 April 2025
You are already at the latest version
Abstract
Integrated soil fertility management is essential to improve soil productivity, rice yield, and nitrogen use efficiency (NUE). This study evaluated the integration of chemical fertilizer rate, humic acid (HA), and flue gas desulfurization gypsum (FG) on soil chemical properties, rice yield, NUE, and nitrogen agronomic efficiency (NAE) in acidic paddy soil. This study included three factors: (1) fertilization based on farmer practices and rice requirements, (2) HA at 0 and 975 kg ha-1, and (3) FG at 0, 636, and 23 kg ha-1. Fertilization based on rice requirements reduced nitrogen (N) input by 14.5% compared to farmer practices while maintaining similar yields. Under farmer practice, HA enhanced total N, CEC, rice yield, NUE, and NAE. HA with FG at 636 kg ha-1 increased TOC, total N, and exchangeable NH4-N but decreased yield. In contrast, HA combined with FG at 23 kg ha-1 enhanced soil exchangeable Ca and S, rice yield, NUE, and NAE. This study suggests that to maintain farmer fertilization practices while improving soil properties and rice yield, HA should be applied with FG (23 kg ha-1). HA combined with FG (636 kg ha-1) should be applied with fertilization tailored to rice nutrient requirements to optimize NUE and NAE.
Keywords:
integrated soil fertility management
; humic acid
; flue gas desulfurization gypsum
; nitrogen use efficiency
; agronomic efficiency
; acidic paddy soil
1. Introduction
Rice is a staple food and a major contributor to food security, particularly in Asia, where it is not only widely cultivated and consumed but also supports millions of livelihoods [1]. Various nutrient and soil fertility management strategies have been employed to maximize rice yield and enhance fertilizer use efficiency. Generally, farmers in developed countries, such as those in Thailand, commonly rely on conventional nutrient management based on their personal experience, knowledge or perception rather than scientifically informed approaches [2,3]. Consequently, these practices often fail to align with actual crop nutrient requirements, resulting in low nitrogen use efficiency (NUE) and agronomic efficiency (NAE). To exemplify, over-fertilization of N under farmer practices in China (205 N kg ha-1) in late-season rice led to reduce rice yield and lower NUE (22%) and NAE (6 kg kg-1) compared to a nutrient expert system that achieved higher (NUE 33%) and NAE (20 kg kg-1) [4]. This highlights the inefficiency of excessive fertilizer inputs, which contributed to both economic loss and environmental degradation [5]. Low yield and use efficiency of applied fertilizer under farmer practices had presented significant opportunities for improvement in farmer practices to enhance their NUE and NAE. The improvement strategies of NUE and NAE are vital for sustainable rice production as they increase yield and decrease nutrient inputs which help increase the beneficial returns to farmers.
Aligning fertilizer application to crop nutrients requirements is the key to success in obtaining optimum nutrient application rates and achieving the targeted yield [6]. Previous studies revealed that the fertilizer input in line with crop nutrient requirements achieve targeted yields and optimize NUE in numerous crops, including rice and maize [7,8]. The amounts of nutrients required to attain targeted yield vary among plant species and varieties [9,10]. For instance, producing 1 ton of grain requires approximately 14 kg N ha-1 for Indica hybrid rice and 18 kg N ha-1 for Japonica rice [9]. The study by Sukitprapanon et al. [11] reported that rice in Thailand absorbs about 21 kg N ha-1 per 1 ton of grain produced.
Integrated soil fertility management (ISFM) practice is the integration of inorganic, organic, natural nutrient resources, and agronomic practices to enhance soil fertility and promote crop productivity and sustainability [12]. ISFM has been widely adopted to improve long-term soil health while minimizing environmental impact by reducing chemical fertilizer input [13,14]. Its key components include inorganic fertilizers, organic amendments (e.g., compost, manure, green manure, and cover crops), and locally accessible soil amendments (e.g., biochar, humic acid (HA), gypsum, and lime). In principle, the ISFM incorporates at least two of these components [15]. However, the use of organic amendments as one of the ISFM components possesses a slow onset effect since they initially undergo a decomposition process to produce humic substances [16]. This slow onset effect can be accelerated by adding a pre-made HA into the soil as a soil amendment.
HA is a major component of humic substances formed after the complete decomposition of organic matter. The extraction of HA can be enhanced by sourcing it from various organic materials, which contain the following percentages of HA: sugarcane waste compost (49%), vermicompost (6-8%), farmyard manure (4%), chicken dung compost (5%), sewage sludge (31%), and leonardite (30-56%) [17,18]. Leonardite is mainly used for global HA production because of its natural abundance, cost-effectiveness, high HA contents, and high amounts of plant nutrients, such as N [19]. The HA also supplies additional carbon to promote total organic carbon (TOC) accumulation in soils [20]. In addition, the HA improves soil structure as it plays a role as a binding agent that binds soil particles to form microaggregate that accelerates soil aggregate formation [21]. The HA functional groups, such as carboxylic (R-COOH) and phenolic (R-OH), form complex and chelate more exchangeable cations resulting in enhancing cation exchange capacity (CEC), which is linked to high nutrient retention in soils [22]. The HA has a positive effect on N cycling by enhancing N availability and reducing its loss as HA delays the hydrolysis of ammonium (NH4+) to nitrate (NO3-) [23]. Thereby, HA application has been shown to boost soil nutrient turnover, nutrient uptake, yield, and NUE of crops, such as maize, wheat, and rice [24,25,26].
Flue gas desulfurization gypsum (FG), a by-product of coal combustion in power plants, is locally accessible, abundant, and cost-effective as a soil amendment. The application of FG can improve extractable calcium (Ca) and sulfur (S) in soils, particularly acidic soils deficient in Ca [27,28]. The Ca released from FG displaces exchangeable bases (e.g., Mg, K and Na) in topsoil, allowing the bases to move downward in the soil profile [29]. The Ca, derived from FG, promotes soil aggregate formation and clay flocculation [30]. In addition, the Ca plays a role in N translocation and enhances NUE in plants [31].
Previous studies showed that coapplication of HA and FG to salt-affected soils positively affected not only soil properties (e.g., electrical conductivity (EC), TOC, water-stable macroaggregate, and available water content), but also the crops yield (e.g., rapeseed and rice) [32,33,34,35]. The coapplication HA and FG can achieve better N retention [36]. The incorporation of HA with FG in coastal saline soil improved rice yield by 10%, mitigated greenhouse gas emissions by 32%, and enhanced NUE by 27% [35]. However, the previous studies had not explored the mechanism under the coapplication effect of HA and FG on the N dynamics in acidic paddy soils. In addition, the previous studies have been performed in salt-affected soils, which sodium toxicity is the main problem. No studies have been conducted on the combined applications of fertilizer, HA, and FG on soil properties, yield, NUE, and NAE in an acidic paddy soil with Ca deficiency as a key problem.
Therefore, this study hypothesized that the interaction effect of soil fertilized based on crop nutrient requirement with HA and an optimal FG rate can effectively increase TOC, CEC, exchangeable forms of NH4-N (NH4-N), Ca and S, NUE, and NAE for rice production in an acidic paddy soil. This study aims at (1) determining the application effects of fertilizer, HA, and FG on soil properties, yield, NUE, and NAE, and (2) determining the relationship between rice yield and NUE and rice yield and NAE for rice cultivation in an acidic paddy soil. This study contributes to effective nutrient management practices that enhance rice production while decreasing the use of chemical fertilizers, thus promoting sustainable agriculture and a healthier environment.
2. Materials and Methods
2.1. Site Characteristics
A pot experiment was conducted from August 2022 to January 2023 in a greenhouse at the Soil and Fertilizer Research Station, Khon Kaen University, Khon Kaen, Thailand. The initial soil used in this study was collected from a paddy field in Khon Kaen, Thailand (UTM: 48Q 256751E, 1827796N), topographically 187 m above sea level. The study area was under a tropical savanna climate, with an average maximum temperature of 32°C and a minimum of 21°C. Cumulative precipitation during experiment was 412 mm [37]. The paddy soil used in this study was classified as Aeric Kandiaquult according to Soil Taxonomy [38]. The topsoil (0-15 cm) is sandy loam with sand, silt, and clay contents of 583, 359, and 58 g kg-1, respectively. The initial soil was acidic (pH 4.7) and had low levels of EC (0.08 mS cm-1), TOC (1.6 g kg-1), CEC (2.6 cmol kg-1), exchangeable ammonium nitrogen (NH4-N) (23 mg kg-1), exchangeable nitrate nitrogen (NO3-N) (12 mg kg-1), exchangeable Ca (95 mg kg-1), and exchangeable S (37 mg kg-1). Additionally, the soil had total N, Ca, and S concentrations of 0.56, 0.28 and 0.14 g kg-1, respectively (Table 1).
2.2. Greenhouse Experiment
The experimental design was arranged in 2 × 2 × 3 factorial in a randomized complete block design with three replications. Three factors for the ISFM were employed. The first factor was chemical fertilizer at two application rates, including rates pertaining to farmer practices (F1) and those pertaining to rice nutrient requirements (F2). According to the study by Sukitprapanon et al. [11], the N, P2O5, and K2O nutrient inputs pertaining to F1 were 75, 38, and 38 kg ha-1 and those to F2 were 61, 25, and 12 kg ha-1, respectively. The applied chemical fertilizer was prepared from urea (46-0-0), diammonium phosphate (DAP) (18-46-0), and muriate of potash (MOP) (0-0-60) at the rate of 131, 81, and 63 kg ha-1 for F1 and at the rate of 112, 53, and 19 kg ha-1 for F2, respectively. Compared to the nutrient input based on farmer practices, the chemical fertilizer applied based on rice requirement declined by 14.5, 34.6, and 69.8% for urea, DAP, and MOP, respectively.
The second factor was HA incorporation. The HA used in this study was produced from leonardite, which was obtained from Concurchem Co., LTD, Bang Yai District, Nonthaburi, Thailand. HA was strongly alkaline (pH 9.8) and contained elevated level of EC (8.3 mS cm-1), and elevated contents of TOC (291 g kg-1), CEC (57 cmol kg-1), total N (11 g kg-1), total Ca (9.4 g kg-1), and total S (6.7 g kg-1) (Table 1). The HA applied, including no HA (H0) and with HA applied at the rate of 975 kg ha-1 (H1), which provided the input of 10.68 kg ha-1 of N. This HA application rate was acquired from the optimum rate for rice production in paddy soils in Northeast Thailand found in the previous study by Sukitprapanon et al. [11].
The last factor was FG application rates. The FG used in this study was obtained from Mae Moh Power Plant, Electricity Generating Authority of Thailand, Mae Moh District, Lampang Province, Thailand. The FG used in the study was neutral (pH H2O 7.7) and rich in total concentrations of Ca (388 g kg-1) and S (199 g kg-1) (Table 1). There were three rates of FG applied: no FG (G0), an application rate based on gypsum requirements (GR) for acidic soil (636 kg ha-1) (G1), and based on the amount of Ca required by rice (23 kg FG ha-1) (G2), which supplied total N to the soil of 0, 0.08, and 0.003 kg ha-1, respectively. The GR was calculated by multiplying the clay content (g kg-1) by 6 and dividing the result by 1000 as suggested by several studies such as [28,39,40], whereas Ca required by rice was suggested by Sukitprapanon et al. [11]. The Ca rice required is 7.9 kg ha-1 for a 1-ton grain ha-1 production Sukitprapanon et al. [11].
The summary of total inputs of N from chemical fertilizer, HA, and FG is shown in Table 2. In this study, three pots without additions of fertilizer, HA, and FG were set aside for the analyses of NUE and NAE. Soil amendments were incorporated and incubated for 14 days before rice transplantation. Half of N and full dose of P2O5 and K2O were applied at 7 days after transplanting, while the remaining half of N was applied at the panicle stage, which was approximately 65 days after planting (DAP).
The rice (Oryza sativa L.) (Sakon Nakhon variety) was sown in a plastic tray filled with soil. After 14 days, the seedlings that had similar growth were selected and transplanted to a pot with the dimensions of 30 cm length × 30 cm width × 39 cm height at 20-cm spacing. The soil was kept under a waterlogged condition at 5 cm water height above the soil surface from transplanting to 7 days before harvest. Crop management practice, including seed selection, seedling, transplanting, weeding, pest and disease control, and harvesting, followed the Thai Department of Agriculture recommendation [41]. The grain yield, straw, and root biomass from each pot were recorded at harvest (128 DAP). The rice grain, straw, and root were cleaned with deionized water (DI water) and stored in sample paper bags, which were transported to the laboratory. All parts of the rice were oven-dried at 65°C until constant weight. The oven-dried samples were then finely ground using a plant grinder for total N concentration analysis.
2.3. Soil Sampling
Soil samples were collected from the pot after rice was harvested (128 DAP) and divided into two subsamples, including air-dried and field-moist soil samples. The air-dried soil samples were ground and sieved through a 2 mm sieve, while the field-moist soil samples were packed in plastic containers and immediately refrigerated at 4°C to minimize microbial activity.
2.4. Laboratory Analyses
2.4.1. Humic Acid and Flue Gas Desulfurization Gypsum Analyses
The pH and EC of both HA and FG were determined using a 1:5 soil amendment to DI water ratio [42]. Total N and TOC were performed using dry combustion with a CN analyzer (Multi N/C 2100s, Analytik Jena Germany). The CEC of HA was determined using 1 M ammonium acetate (NH4OAc), pH 7 [43]. Total Ca and S concentrations in HA were analyzed using hot acid digestion (7 mL of HClO4 at 190°C until the color of suspension was clear) [42] and those for FG was determined by aqua regia (3:1 HCl: HNO3 at 130°C for 1 hour) [44]. The concentrations of Ca and S were measured by inductively coupled plasma optical emission spectroscopy (ICP-OES) (Analytic Jena PQ 9000).
2.4.2. Soil Analyses
Soil pH and redox potential (Eh) under field conditions were measured using a portable pH meter (Hanna Instruments, HI 98103) and an oxidation-reduction potential (ORP) meter (Hanna Instruments, HI 8424), respectively. Air-dried soil samples were determined for particle size distribution, total N, TOC, exchangeable Ca, and CEC. Particle size distribution of the initial soil was determined by the pipette method [45]. Total N and TOC were determined using dry combustion with a CN analyzer (Multi N/C 2100s, Analytik Jena Germany). Exchangeable Ca and CEC were analyzed using 1 M NH4OAc at pH 7 [43]. The total concentrations of Ca and S were determined using aqua regia digestion (1:3 HNO3: HCl at 130°C for 1 h) [44] and their concentrations were determined using ICP-OES (Analytic Jena PQ 9000).
Field-moist soil samples were prepared for exchangeable S, NH4-N (NH4-N), and NO3-N (NO3-N) analysis. The exchangeable S concentration was extracted with Mehlich-3 solution and quantified by ICP-OES (Analytic Jena PQ 9000) [43]. NH4-N and NO3-N were extracted by 2 M KCl and 0.5 M K2SO4, respectively. NH4-N concentration was determined using the salicylate-sodium hypochlorite, while NO3-N was determined using the salicylic acid-sodium hydroxide [46]. The concentration of NH4-N and NO3-N were determined by colorimetric method using a spectrophotometer (SP-UV 300) at 650 and 410 nm, respectively [46].
2.4.3. Plant Analyses
The plant samples, including grain, straw, and root biomass, were digested using hot acid digestion with 7 ml of HClO4 at 190°C until the color of suspension became clear [42]. The N concentration in the solution was determined using the Kjeldahl distillation method [46]. The total N uptake in rice was computed by multiplying the N concentration in grain, straw, and root by the oven-dried biomass.
NUE was determined by the difference in total N uptake, derived from grain, straw, and root biomass, between pots that received fertilizer and soil amendments and those that did not receive any fertilizers and soil amendments, as explained in equation (1) [28].
where Nf is the amount (kg ha-1) of total N uptake of rice in the pot with fertilizer and soil amendments. Nu is the amount (kg ha-1) of total N uptake of rice in the pot without fertilizer and soil amendments.
NAE, the grain production per unit of fertilizer applied, was calculated by the ratio of the difference of grain yield of the fertilized pot and unfertilized pot to the total amount of N applied as shown in equation (2) [28].
where Gf is the amount (kg ha-1) of grain yield of the pot with fertilizer and soil amendments. Gu is the amount (kg ha-1) of grain yield of the pot without fertilizer and soil amendments.
2.5. Statistical Analyses
All data were analyzed using a three-way analysis of variance (ANOVA) along with mean comparisons using least significant difference (LSD) (P < 0.05) to determine the effect of fertilizer, HA, FG, and their interactions on soil properties and rice yields. The data describing the relationship between yield components and agronomic attributes were analyzed using principal component analysis (PCA) and regression analysis at (P < 0.05). Data analyses were conducted using Statistica software version 8.0 while graphical visualizations were created using SigmaPlot version 11 and OriginPro 2018.
3. Results and Discussion
3.1. Effects of Fertilizer, Humic Acid, and Gypsum Applications on Soil Properties
The effects of fertilizer, HA, and FG applications on paddy soil properties are shown in Table 3 and Figure 1 and Figure 2.
After harvest, the soil pH ranged from 6.6 to 7.2 and were not influenced by the applications of chemical fertilizer, HA, and FG (Table 3) (Figure 1a). However, the soil pH values increased by approximately 40% to 53%, compared to the initial soil pH (4.7) (Table 1). The soil pH alteration is due to the reduction of ferric iron (Fe3+) into ferrous iron (Fe2+) under waterlogged conditions, which consume protons and raise pH levels [47,48].
Soil Eh was also unaffected by chemical fertilizer, HA, and FG. The soil Eh ranged from ̶ 141 to ̶ 85 mV (Figure 1b). These values indicate that the studied soils are under reducing conditions, commonly observed under anaerobic conditions where soil microbes utilize alternative electron acceptors to compensate for the lack of oxygen [49].
TOC was neither affected by fertilizer nor FG. However, the TOC was affected by HA addition (Table 3). The TOC in soil treated with HA (2.3 g kg-1) was higher compared to those without HA (2.2 g kg-1). The integrated use of F1H1G1 achieved the highest TOC (2.4 g kg-1) (Figure 1c), likely due to HA being rich in stable organic carbon which enhanced TOC in the soil (Table 1). Additionally, FG released Ca that plays an important role in TOC stabilization and accumulation as Ca being a polyvalent cation acts as a bridge between negative charge of clay particle and organic colloids during deprotonation of the carboxylic (COOH) and phenolic OH functional groups [50].
CEC was significantly improved by chemical fertilizer, HA, and FG applications. Soil treated with H1 and G1 had higher CEC values (3.0 and 2.8 cmol kg-1, respectively) (Table 3). The interaction effect of F1H1 and H1G1 significantly elevated CEC to 3.3 and 3.4 cmol kg-1, respectively (Figure 2a and 2b). The highest CEC was recorded under F2H1G1 (3.5 cmol kg-1) (Figure 1d). CEC was positively related with TOC (R2 = 0.13) (P < 0.05) (Figure 3a), indicating that the addition of HA can increase CEC in the soils by providing the negative charges, derived from its functional groups such as carboxylic and phenolic groups [11,22,51]. FG application helps increase CEC in soils because released Ca2+ displaces proton (H+) and Al3+ that are adsorbed onto soil surfaces, increasing the negative charges in soils [52]. In addition, Ca released from FG favors soil aggregate formation, which increase surface area for cation exchange, thereby indirectly benefiting CEC [28,30].
Total N ranged from 1.1 to 2.0 g kg-1 (Figure 1e), with significant increases observed under F1 (1.5 g kg-1) and H1 (1.6 g kg-1) (Table 3). The interaction effect of F1H1 and H1G1 significantly increased total N to 1.7 g kg-1 and 1.8 g kg-1, respectively (Figures 2c and 2d). The highest total N was achieved by integrated F1H1G1 practice (2.0 g kg-1) (Figure 1e). The increase of total N in F1 and H1 was due to F1 supplying higher total N to the soil (Table 2) and HA containing high N content (Table 1), respectively. The highest total N in F1H1G1 was attributed to the fact that N was supplied by fertilizer, HA, and FG, with a total N input of 85.76 kg N ha-1 to the soil (Table 2).
NH4-N was significantly increased by the application of fertilizer, FG, and the combination of HA and FG (Table 3 and Figure 2e). F2 and H1 showed similar NH4-N concentrations (19 mg kg-1 for both), while the G1 increased NH4-N to 20 mg kg-1 (Table 3). The H1G1 significantly elevated NH4-N to 23 mg kg-1 (Figure 2e). Moreover, NH4-N was higher under F2H1G1 (26 mg kg-1) than other treatments (Figure 1f).
NO3-N was significantly affected by fertilizer, HA, FG, fertilizer × FG, and HA × FG (Table 3). The NO3-N concentrations were notably increased either by F1 (5.2 mg kg-1) or G2 (5.7 mg kg-1) (Table 3). The F1G2 slightly increases NO3-N to 6.0 mg kg-1 (Figure 2f). Both sole H1 (4.4 mg kg-1) and G1 (4.6 mg kg-1) treatments and their interactions of H1G1 significantly reduced NO3-N to 3.8 mg kg-1 (Table 3) (Figure 2g), which were lower than in the initial soil (12 mg kg-1) (Table 1). The highest NO3-N was in F1H0G2 (7.2 mg kg-1) (Figure 1g). The bivariate relationship revealed that NH4-N had a negative relationship with NO3-N (R2 = 0.11) (P < 0.05) (Figure 3b). This study was consistent with the study by Chen et al. [36] who reported that when HA was applied together with FG, NH4-N retention on soil colloidal surfaces is not nitrified and improved. The S derived from FG hindered NH4-N transformation to NO3-N by forming complexes with NH4+ to form ammonium sulfate ((NH4)2SO4) [53]. Additionally, the HA can adsorb NH4-N due to its negative charge, which slows the transformation of NH4-N to NO3-N through nitrification, leading to a decrease in nitrogen losses through leaching, volatilization, and denitrification [23].
The application of G2 increased the concentrations of exchangeable Ca to 329 mg kg-1, which was 1.3-fold higher than that in G1 (250 mg kg-1) (Table 3). The H1G2 significantly enhanced exchangeable Ca to 350 mg kg-1 (Figure 2h). Exchangeable Ca concentrations after applying FG, especially G2, increased by 1.6 to 2.5 times (Table 3) higher than initial soil (95 mg kg-1) (Table 1). The higher amount of exchangeable Ca was achieved by F1H1G2 (355 mg kg-1), which is not significantly different from F2H1G2 (345 mg kg-1) (Figure 1h). The low concentration of exchangeable Ca in G1 treatment is attributed to excessive Ca supply triggered a chemical reaction in the soil, i.e., exchangeable Ca reacts with P to form calcium phosphate minerals such as brushite (Ca(PO3OH).2H2O), which is not available to plant [54,55]. Thus, this study suggested that a suitable FG application rate in paddy field conditions should be considered based on Ca required by rice.
Exchangeable S ranged from 47 to 84 mg kg-1 (Figure 1i). Exchangeable S was recorded higher under G2-treated soil (77 mg kg-1) compared to G1-treated soil (50 mg kg-1) (Table 3). The soil treated with FG elevated exchangeable S due to FG supplying S to the soil as FG contained high amounts of S (Table 1). The lower concentration of exchangeable S in G1 compared to that of G2 is due to the lower Eh value in G1 (-111 mV) (Table 3). A higher FG application rate supplied more sulfate ions (SO42-) to the soil and served as electron acceptor, producing hydrogen sulfide (H2S) that led to lower Eh. A higher reduction state transforms SO42- to H2S which is prone to volatilization. Eventually, the exchangeable S depleted [56].
3.2. Yield, Nitrogen Uptake, Nitrogen Use Efficiency, and Nitrogen Agronomic Efficiency of Rice
Straw biomass was neither affected by fertilizer, HA, FG, nor their interactions (Table 4). Straw biomass ranged between 14 and 16 t ha-1 (Figure 4a). The highest straw biomass (16 t ha-1) was under F1H0G0, F1H1G0, and F1H1G2. Whereas the lowest straw biomass was under F1H0G1 and F2H0G1 (14 t ha-1) (Figure 4a).
Root biomass was higher in F1 (9.5 t ha-1) and H0 (9.3 t ha-1) than their corresponding counterparts of different rates (Table 4). Meanwhile, G2 had the highest root biomass of 10 t ha-1, compared to those treated with G1 (8.3 t ha-1) and G0 (8.5 t ha-1) (Table 4). The interaction of fertilizer × HA and HA × FG significantly affected root biomass (Table 4). The F1H0 and H0G2 significantly increased root biomass to 11 t ha-1 (Figure 5a and 5b), while F1H0G2 showed the highest root biomass (13 t ha-1) (Figure 4b).
For grain yield, although fertilizer application showed a nonsignificant effect on grain yield, F2 can reduce the amounts of N input by 14.5% without a significant decline in grain yield, compared to F1. Grain yield significantly increased by H1 addition (7.4 t ha-1) (Table 4). Although rice grain yield was not responsive to the interaction of fertilizer, HA, and FG, this study found that both F1H1G0 and F1H1G2 achieved the maximum grain yield (7.7 t ha-1), whereas both F1H0G1 (6.8 t ha-1) and F2H0G1 (6.6 t ha-1) gained the minimum grain yield (Figure 4c). Therefore, this study highlighted the fact that the application of FG at a high rate based on gypsum requirement at 636 kg ha-1 (G1) restricts straw biomass and grain yield in the studied soil acidic paddy soil.
Total N uptake ranged from 57 to 74 kg ha-1 (Figure 4d) and was significantly increased by H1 (70 kg ha-1) (Table 4). NUE was significantly influenced by both fertilizer application rates and HA. F2 and H1 increased NUE to 36% (Table 4), while the F1H1G2 resulted in the highest NUE (39%) under farmer practices (Figure 4e). Under rice nutrient requirement-based fertilization, F2H1G1 maximizes the NUE to 46 % (Figure 4e). NAE was significantly improved by H1 and further enhanced by multiple interactions (fertilizer × HA, fertilizer × HA × FG, and HA × FG) (Table 4). Applying F2 (30 kg kg-1) tended to give higher NAE values than F1 (28 kg kg-1) and were significantly increased by H1 addition (33 kg kg-1) (Table 4). Both the F1H1G0 and F1H1G2 produced an optimal NAE (32 kg ha-1) under farmer practices, whereas the F2H1G1 practice maximized the NAE to 41 kg ha-1 for rice grown under rice nutrient requirement-based fertilization (Figure 4f).
The application of fertilizer according to rice nutrient requirements reduces the use of chemical fertilizers without adversely affecting rice yield. F2 provided appropriate nutrients supply to achieve optimum rice yield. This study, therefore, advocates nutrient applications based on crop nutrient requirement, such as rice, for its crucial role in achieving precision nutrient management and sustainability. HA application contributed to higher grain yield, NUE, and NAE, primarily by stimulating the nutrient uptake (Table 4) as the HA incorporation increases the accumulation of soil nutrient availability like NH4-N (Table 3). The F2H1G1 practice did not achieve the higher rice yield like F1H1G0 and F1H1G2 did, but this practice achieves maximum NUE and NAE. This finding indicates that higher NUE and NAE under F2H1G1 practice is mainly attributed to lower total nutrient input (71.76 kg ha-1) to the soil. i.e., 19% lower than F1H1G0 (85.68 kg ha-1) and F1H1G2 practice (85.683 kg ha-1) (Table 2). Conversely, the F1H1G1, F1H0G1, and F 2H0G1 practices where the FG was applied at a higher rate (636 kg ha-1) tended to reduce rice yield. Previous studies reported the crop response to FG application at different rates to slightly acidic soil (pH 6.3-6.5) and revealed that FG applied at a higher rate led to yield reduction because Ca, released from FG, induced nutrient imbalance and lower nutrients P, K and Mg uptake [28,57]. According to this current study, the decline in rice yield is owing to G1 releasing a large amount of Ca to the soil, which potentially inhibited N uptake as found by previous work that Ca released from FG plays a crucial role in regulating N absorption [31,58]. Therefore, this finding suggests that careful consideration should be made when considering an FG application. Additionally, the FG should be applied based on Ca needed by rice (23 kg ha-1) as it increased soil exchangeable Ca and S. This finding can be applied to other types of gypsum to be applied a paddy soils.
3.3. Relationship Between Rice Yield, Nitrogen Uptake, Nitrogen Use Efficiency, and Nitrogen Agronomic Efficiency
Principal component analysis (PCA), performed using the basis of the standardized average values of soil properties (including soil pH, Eh, TOC, CEC, total N, NH4-N, NO3-N, exchangeable Ca, and exchangeable S), rice grain, straw biomass, root biomass, total N uptake, NUE, and NAE, is presented in Figure 6.
PCA showed that Eh, exchangeable Ca, exchangeable S, NO3-N, and root biomass were mainly associated with F1H0G2, F2H0G2, and F2H1G2 (Figure 6). This is attributed to FG-enhanced root development due to supplying exchangeable S (Table 3) [59]. Higher concentrations of exchangeable S in the soil treated by G2 were discussed in section 3.1.
Furthermore, total N, CEC, straw biomass, grain yield, total N uptake, NUE, and NAE were associated with F1H1G0 and F1H1G2 (Figure 6). The bivariate relationship was positive between rice grain yield and straw biomass (R2 = 0.48) (P < 0.05) (Figure 7a). In addition, grain yield was positively associated with total N uptake (R2 = 0.38) (P < 0.05) (Figures 7b), indicating that increased straw biomass contributes to increase grain production because higher straw biomass supports higher photosynthesis rate and nutrients reserves which are essential for grain development [60]. Furthermore, this study suggested that total N uptake is critical for rice grain yield since N is a fundamental component of chlorophyll, which facilitates photosynthesis and carbohydrate synthesis for grain filling [61].
Straw biomass was positively associated with both total N uptake (R2 = 0.21) (P < 0.05) and root biomass (R2 = 0.13) (P < 0.05) (Figure 7c and 7d), indicating that total N uptake contributes more to increasing straw biomass as N is required for cell division and growth [62,63]. Improving underground biomass contributes to higher straw biomass as an extensive root system absorbs more nutrients and water that can be transported to the aboveground biomass [64].
NUE was positively correlated with total N uptake and grain yield (R2 = 0.38 and 0.13, respectively) (P < 0.05) (Figures 7e and 7f). These findings underscore the importance of enhancing total N uptake in improving NUE as total N uptake is a key component for NUE computation [65]. Moreover, grain yield, total N uptake, and straw biomass were associated with NAE (R2 = 0.48, 0.20 and 0.18, respectively) (P < 0.05) (Figures 7g-7i). The NAE is defined as the grain yield produced per unit of N applied [65]. Therefore, this study indicates that improving grain yield leads to achieving higher NAE, which is a crucial component of the ISFM [66]. The study by Vanlauwe et al. [66] revealed that higher NAE can enhance economic returns for farmers. This current study, therefore, proposes that the ISFM of fertilizer application based on farmer practices combined with HA (F1H1G0) or with HA and FG based on rice requirement (F1H1G2) are optimal soil management practice for adopting in an acidic paddy soil because these practices potentially sustain rice production and NAE.
The increase in rice yield in soil treated with HA is due to HA increasing the CEC, TOC, and NH4-N, all of which in turn promote nutrient uptake and rice productivity. This is consistent with previous studies showing that HA applications (e.g.,1500 kg ha-1 and 20 mg CL-1) promoted crops growth and yield (e.g., rice and maize) in black soil in a typical cold region and hydroponic system, respectively [67,68]. Furthermore, the positive interactive effect of HA and FG in the F1H1G2 results in higher grain yield, straw biomass, and NAE, compared to the other treatments. Therefore, this study proposes that the integration of fertilizer application based on farmer practice, either with HA alone or combined with FG based on rice need at 23 kg ha-1 is proposed as an effective strategy for improving grain yield and NAE in acidic paddy soil.
Other ISFM strategies, such as F1H1G1, F2H0G0, F2H1G0, and F2H1G1, were associated with soil pH, TOC, and NH4-N. Additionally, the F2H1G1 was associated with NUE, total N uptake, and NAE, which was situated along the factor 1 axis (Figure 6). Higher TOC in the combined application of HA and FG (636 kg ha-1) was attributed to TOC supplied by HA (Table 1) and Ca derived from FG, forming complexes with OC to stabilize and accumulate TOC in the soil because their complexation can protect OC from microbial decomposition [28,50,69]. This showed that coapplication of HA and FG applied following gypsum requirement (636 kg ha-1) under both fertilizer regimes of soils fertilized pertaining to farmer practice and rice requirements can improve properties of the studied acidic paddy soil but they did not bring about additional benefits to crop performance, i.e., NUE, and NAE. However, this study highlights that farmers should apply FG according to gypsum requirements, along with fertilizer application rates based on rice’s needs, to enhance total N uptake, NUE, and NAE.
4. Conclusions
This study determines the effects of integrated soil fertility management (ISFM) involving the coapplication of chemical fertilizer, humic acid (HA), and flue gas desulfurization gypsum (FG) on soil properties, rice yield, nitrogen (N) use efficiency (NUE), and N agronomic efficiency (NAE) in a tropical acidic paddy soil. Fertilizer primarily enhances total N and exchangeable NO3-N (NO3-N). HA incorporation improves soil TOC, CEC, total N, and exchangeable NH4-N (NH4-N). FG incorporation improves exchangeable Ca, but requires careful management when it is applied alone. Coapplication of HA and FG based on gypsum requirement (636 kg ha-1) in the acidic paddy soils improves total N, TOC, and NH4-N. However, integrating FG at this rate with application of chemical fertilizer based on farmer practices adversely affect rice yield and total N uptake. On the other hand, applying FG at 23 kg ha-1, whether alone or with HA improves exchangeable Ca and S under farmer practices. The optimal ISFM strategy combining the application of HA (975 kg ha-1) and FG (23 kg ha-1) significantly enhances soil properties and rice agronomic performance. The findings of this study highlight the optimum application rate of FG, which should be at 23 kg ha-1, particularly in combination with HA, to maximize NUE, NAE, and rice yield. The higher FG application rates based on gypsum requirements should be avoided when paddy soils are fertilized using farmer practice, owing to the negative impacts on yield, total N uptake, and NUE. However, to improve total N uptake, NUE, and NAE, FG addition based on gypsum requirement should be applied with a fertilizer rate based on rice requirement.
Author Contributions
H.; Conceptualization, Methodology, Investigation, Data Curation, Validation, Writing-Original Draft Preparation. T.M.; Resources, Data Curation, Writing-Review and Editing, P.V.; Data Curation, Validation, Writing-Review and Editing. T.-S.S.; Conceptualization, Methodology, Software, Validation, Formal Analysis, Investigation, Resources, Data Curation, Writing-Review and Editing, Supervision, Project Administration, Funding Acquisition. All authors have read and agreed to the published version of the manuscript.
Funding
This research was funded by the Fundamental Fund of Khon Kaen University (Research grant number: 203181).
Data Availability Statement
The data presented in this study are available on request from the corresponding author.
Acknowledgments
The authors would like to acknowledge Khon Kaen University for financial support and staffs from Faculty of Agriculture, Khon Kaen University for advice on the chemical analyses.
Conflicts of Interest
The authors declare no conflict of interest.
References
- Yuan, S.; Stuart, A.M.; Laborte, A.G.; Rattalino Edreira, J.I.; Dobermann, A.; Kien, L.V.N.; Thúy, L.T.; Paothong, K.; Traesang, P.; Tint, K.M.; et al. Southeast Asia must narrow down the yield gap to continue to be a major rice bowl. Nat Food 2022, 3, 217–226. [Google Scholar] [CrossRef] [PubMed]
- Assessment of farmers’ water and fertilizer practices and perceptions in the North China Plain - Sun - 2022 - Irrigation and Drainage - Wiley Online Library. Available online: https://onlinelibrary.wiley.com/doi/full/10.1002/ird.2719 (accessed on Mar 19, 2025).
- C. Virochsaengaroon, C. C. Virochsaengaroon, C. Piratanatsakul, P. Lawongsa, T.-S. Sukitprapanon Rice farmers’ perceptions and behaviors on nitrogen fertilizer applications for RD6 glutinous rice cultivation in Northeast Thailand.; Chiangmai, Thailand, 2022; pp. 340–351.
- Xu, Z.; He, P.; Yin, X.; Struik, P.C.; Ding, W.; Liu, K.; Huang, Q. Simultaneously improving yield and nitrogen use efficiency in a double rice cropping system in China. European Journal of Agronomy 2022, 137, 126513. [Google Scholar] [CrossRef]
- Timsina, J.; Dutta, S.; Devkota, K.P.; Chakraborty, S.; Neupane, R.K.; Bishta, S.; Amgain, L.P.; Singh, V.K.; Islam, S.; Majumdar, K. Improved nutrient management in cereals using Nutrient Expert and machine learning tools: Productivity, profitability and nutrient use efficiency. Agricultural Systems 2021, 192, 103181. [Google Scholar] [CrossRef]
- Xu, Y.; He, P.; Xu, X.; Qiu, S.; Ullah, S.; Gao, Q.; Zhou, W. Estimating Nutrient Uptake Requirements for Potatoes Based on QUEFTS Analysis in China. Agronomy Journal 2019, 111, 2387–2394. [Google Scholar] [CrossRef]
- Shehu, B.M.; Lawan, B.A.; Jibrin, J.M.; Kamara, A.Y.; Mohammed, I.B.; Rurinda, J.; Zingore, S.; Craufurd, P.; Vanlauwe, B.; Adam, A.M.; et al. Balanced nutrient requirements for maize in the Northern Nigerian Savanna: Parameterization and validation of QUEFTS model. Field Crops Research 2019, 241, 107585. [Google Scholar] [CrossRef] [PubMed]
- Wang, Y.; Li, C.; Li, Y.; Zhu, L.; Liu, S.; Yan, L.; Feng, G.; Gao, Q. Agronomic and environmental benefits of nutrient expert on maize and rice in Northeast China. Environ Sci Pollut Res Int 2020, 27, 28053–28065. [Google Scholar] [CrossRef]
- Sun, T.; Yang, X.; Tang, S.; Han, K.; He, P.; Wu, L. Genotypic Variation in Nutrient Uptake Requirements of Rice Using the QUEFTS Model. Agronomy 2021, 11, 26. [Google Scholar] [CrossRef]
- Wen, M.; Yang, S.; Huo, L.; He, P.; Xu, X.; Wang, C.; Zhang, Y.; Zhou, W. Estimating Nutrient Uptake Requirements for Melon Based on the QUEFTS Model. Agronomy 2022, 12, 207. [Google Scholar] [CrossRef]
- Tanabhat-sakorn Sukitprapanon; Patcharee Suriya; Tidarat Monkham; Patimakorn Pasuwan; Patma vityakon Effect of humic acid application on residual phosphorus availability and phosphorus use efficiency of glutinous rice cultivated in paddy soils in Northeast Thailand; Research report, 2020.
- Urmi, T.A.; Rahman, M.M.; Islam, M.M.; Islam, M.A.; Jahan, N.A.; Mia, M.A.B.; Akhter, S.; Siddiqui, M.H.; Kalaji, H.M. Integrated Nutrient Management for Rice Yield, Soil Fertility, and Carbon Sequestration. Plants 2022, 11, 138. [Google Scholar] [CrossRef]
- Mutuku, E.A.; Roobroeck, D.; Vanlauwe, B.; Boeckx, P.; Cornelis, W.M. Maize production under combined Conservation Agriculture and Integrated Soil Fertility Management in the sub-humid and semi-arid regions of Kenya. Field Crops Research 2020, 254, 107833. [Google Scholar] [CrossRef]
- Oechaiyaphum, K.; Ullah, H.; Shrestha, R.P.; Datta, A. Impact of long-term agricultural management practices on soil organic carbon and soil fertility of paddy fields in Northeastern Thailand. Geoderma Regional 2020, 22, e00307. [Google Scholar] [CrossRef]
- Adem, M.; Azadi, H.; Spalevic, V.; Pietrzykowski, M.; Scheffran, J. Impact of integrated soil fertility management practices on maize yield in Ethiopia. Soil and Tillage Research 2023, 227, 105595. [Google Scholar] [CrossRef]
- Liu, M.; Linna, C.; Ma, S.; Ma, Q.; Song, W.; Shen, M.; Song, L.; Cui, K.; Zhou, Y.; Wang, L. Biochar combined with organic and inorganic fertilizers promoted the rapeseed nutrient uptake and improved the purple soil quality. Front Nutr 2022, 9, 997151. [Google Scholar] [CrossRef]
- Han, X.; Liu, S.; Xie, Z.; Ma, X.; Wang, Y.; Peng, C. Dynamic Changes of Humic Acids in Chicken Manure Composting. Pol. J. Environ. Stud. 2022, 31, 1637–1644. [Google Scholar] [CrossRef]
- Lanno, M.; Klavins, M.; Purmalis, O.; Shanskiy, M.; Kisand, A.; Kriipsalu, M. Properties of Humic Substances in Composts Comprised of Different Organic Source Material. Agriculture 2022, 12, 1797. [Google Scholar] [CrossRef]
- Arrobas, M.; de Almeida, S.F.; Raimundo, S.; da Silva Domingues, L.; Rodrigues, M.Â. Leonardites Rich in Humic and Fulvic Acids Had Little Effect on Tissue Elemental Composition and Dry Matter Yield in Pot-Grown Olive Cuttings. Soil Systems 2022, 6, 7. [Google Scholar] [CrossRef]
- Zhou, L.; Xu, S.; Monreal, C.M.; Mclaughlin, N.B.; Zhao, B.; Liu, J.; Hao, G. Bentonite-humic acid improves soil organic carbon, microbial biomass, enzyme activities and grain quality in a sandy soil cropped to maize (Zea mays L.) in a semi-arid region. Journal of Integrative Agriculture 2022, 21, 208–221. [Google Scholar] [CrossRef]
- Tahoun, A.M.M.A.; El-Enin, M.M.A.; Mancy, A.G.; Sheta, M.H.; Shaaban, A. Integrative Soil Application of Humic Acid and Foliar Plant Growth Stimulants Improves Soil Properties and Wheat Yield and Quality in Nutrient-Poor Sandy Soil of a Semiarid Region. J Soil Sci Plant Nutr 2022, 22, 2857–2871. [Google Scholar] [CrossRef]
- Xu, J.; Li, Q.; Yu, H.; Jiang, W. Effect of Humic Acid Addition on Buffering Capacity and Nutrient Storage Capacity of Soilless Substrates. Front. Plant Sci. 2021, 12. [Google Scholar] [CrossRef]
- Kong, B.; Wu, Q.; Li, Y.; Zhu, T.; Ming, Y.; Li, C.; Li, C.; Wang, F.; Jiao, S.; Shi, L.; et al. The Application of Humic Acid Urea Improves Nitrogen Use Efficiency and Crop Yield by Reducing the Nitrogen Loss Compared with Urea. Agriculture 2022, 12, 1996. [Google Scholar] [CrossRef]
- Izhar Shafi, M.; Adnan, M.; Fahad, S.; Wahid, F.; Khan, A.; Yue, Z.; Danish, S.; Zafar-ul-Hye, M.; Brtnicky, M.; Datta, R. Application of Single Superphosphate with Humic Acid Improves the Growth, Yield and Phosphorus Uptake of Wheat (Triticum aestivum L.) in Calcareous Soil. Agronomy 2020, 10, 1224. [Google Scholar] [CrossRef]
- Yao, H.; Chen, X.; Yang, J.; Li, J.; Hong, J.; Hu, Y.; Mao, X. Effects and Mechanisms of Phosphate Activation in Paddy Soil by Phosphorus Activators. Sustainability 2020, 12, 3917. [Google Scholar] [CrossRef]
- Yuan, Y.; Gai, S.; Tang, C.; Jin, Y.; Cheng, K.; Antonietti, M.; Yang, F. Artificial humic acid improves maize growth and soil phosphorus utilization efficiency. Applied Soil Ecology 2022, 179, 104587. [Google Scholar] [CrossRef]
- Gonzalez, J.M.; Dick, W.A.; Islam, K.R.; Watts, D.B.; Fausey, N.R.; Flanagan, D.C.; Batte, M.T.; VanToai, T.T.; Reeder, R.C.; Shedekar, V.S. Cover crops, crop rotation, and gypsum, as conservation practices, impact Mehlich-3 extractable plant nutrients and trace metals. International Soil and Water Conservation Research 2024, 12, 650–662. [Google Scholar] [CrossRef]
- Hartina; Monkham, T.; Vityakon, P.; Sukitprapanon, T.-S. Coapplication of humic acid and gypsum affects soil chemical properties, rice yield, and phosphorus use efficiency in acidic paddy soils. Sci Rep 2025, 15, 4350. [CrossRef]
- Minato, E.A.; Brignoli, F.M.; Neto, M.E.; Besen, M.R.; Cassim, B.M.A.R.; Lima, R.S.; Tormena, C.A.; Inoue, T.T.; Batista, M.A. Lime and gypsum application to low-acidity soils: Changes in soil chemical properties, residual lime content and crop agronomic performance. Soil and Tillage Research 2023, 234, 105860. [Google Scholar] [CrossRef]
- Tirado-Corbalá, R.; Slater, B.K.; Dick, W.A.; Bigham, J.; Muñoz-Muñoz, M. Gypsum amendment effects on micromorphology and aggregation in no-till Mollisols and Alfisols from western Ohio, USA. Geoderma Regional 2019, 16, e00217. [Google Scholar] [CrossRef]
- Xing, Y.; Zhu, Z.-L.; Wang, F.; Zhang, X.; Li, B.-Y.; Liu, Z.-X.; Wu, X.-X.; Ge, S.-F.; Jiang, Y.-M. Role of calcium as a possible regulator of growth and nitrate nitrogen metabolism in apple dwarf rootstock seedlings. Scientia Horticulturae 2021, 276, 109740. [Google Scholar] [CrossRef]
- Jiangkuan, N.; Chen, X.; Lashari, M.; Jianqiang, D.; Du, Z. Impact of flue gas desulfurization gypsum and lignite humic acid application on soil organic matter and physical properties of a saline-sodic farmland soil in Eastern China. Journal of Soils and Sediments 2016, 16. [Google Scholar] [CrossRef]
- Nan, J.; Chen, X.; Wang, X.; Lashari, M.S.; Wang, Y.; Guo, Z.; Du, Z. Effects of applying flue gas desulfurization gypsum and humic acid on soil physicochemical properties and rapeseed yield of a saline-sodic cropland in the eastern coastal area of China. J Soils Sediments 2016, 16, 38–50. [Google Scholar] [CrossRef]
- Saqib, A.I.; Ahmed, K.; Naseem, A.R.; Qadir, G.; Nawaz, M.Q.; Khalid, M.; Warraich, I.A.; Arif, M. Integrated Use of Humic Acid and Gypsum under Saline-Sodic Conditions. PJAR 2020, 33. [Google Scholar] [CrossRef]
- Sun, L.; Ma, Y.; Liu, Y.; Li, J.; Deng, J.; Rao, X.; Zhang, Y. The combined effects of nitrogen fertilizer, humic acid, and gypsum on yield-scaled greenhouse gas emissions from a coastal saline rice field. Environ Sci Pollut Res 2019, 26, 19502–19511. [Google Scholar] [CrossRef] [PubMed]
- Chen, J.; Hu, G.; Wang, H.; Fu, W. Leaching and migration characteristics of nitrogen during coastal saline soil remediation by combining humic acid with gypsum and bentonite. Annals of Agricultural Sciences 2023, 68, 1–11. [Google Scholar] [CrossRef]
- Meteorological Department Climate of Thailand; Thai Meteorological Department. Ministry of Information and Communication Technology: Bangkok, Thailand, 2022.
- Soil Survey Staffs Keys to Soil Taxonomy; 13th ed.; USDA Natural Resources Conservation Service, 2022.
- Fagundes Costa, R.; Firmano, R.; Bossolani, J.; Alleoni, L. Soil Chemical Properties, Enzyme Activity and Soybean and Corn Yields in a Tropical Soil Under No-till Amended with Lime and Phosphogypsum. International Journal of Plant Production 2023, 17. [Google Scholar] [CrossRef]
- Barcelos, J.P. de Q.; Souza, M. de; Nascimento, C.A.C. do; Rosolem, C.A. Soil acidity amelioration improves N and C cycles in the short term in a system with soybean followed by maize-guinea grass intercropping. Geoderma 2022, 421, 1–12. [Google Scholar] [CrossRef]
- Puparn Royal Development Study Center Handbook for Cultivating Sakhon Nakon Rice Variety; Royal Irrigation Department, Ministry of Agriculture and Cooperatives: Bangkok, Thailand, 2012.
- Sukitprapanon, T.-S.; Jantamenchai, M.; Tulaphitak, D.; Vityakon, P. Nutrient composition of diverse organic residues and their long-term effects on available nutrients in a tropical sandy soil. Heliyon 2020, 6. [Google Scholar] [CrossRef]
- Rayment, G.E., Lyons, D.J. Soil Chemical Methods - Australasia; Csrio publishing, 2011.
- APHA Standard methods for the examination of water and wastewater; American Public Health Association-American Water Works Association, Baltimore, 1998.
- Gee, G.W; Bauder, J.W Particle-size analysis. In: Klute, A. (Ed.), Methods of Soil 759 Analysis: Part 1. Physical and Mineralogical Methods; Second ed.; Agronomy, pp., 1986.
- Tropical soil biology and fertility: a handbook of methods; Anderson, J.M., Ed.; 2. ed., repr.; C.A.B. International: Wallingford, 1996; ISBN 978-0-85198-821-4.
- Ding, C.; Du, S.; Ma, Y.; Li, X.; Zhang, T.; Wang, X. Changes in the pH of paddy soils after flooding and drainage: Modeling and validation. Geoderma 2019, 337, 511–513. [Google Scholar] [CrossRef]
- Sahrawat, K.L. Fertility and organic matter in submerged rice soils. CURRENT SCIENCE 2005, 88. [Google Scholar]
- Sukitprapanon, T.; Suddhiprakarn, A.; Kheoruenromne, I.; Anusontpornperm, S.; Gilkes, R.J. Forms of Acidity in Potential, Active and Post-Active Acid Sulfate Soils in Thailand. 2015, 48.
- Varadachari, C.; MONDAL, A.; Ghosh, K. Some Aspects of Clay-Humus Complexation: Effect of Exchangeable Cations and Lattice Charge. Soil Science 1991, 151. [Google Scholar] [CrossRef]
- Stevenson, F.J.; Butler, J.H.A. Chemistry of Humic Acids and Related Pigments. In Organic Geochemistry: Methods and Results; Eglinton, G., Murphy, M.T.J., Eds.; Springer: Berlin, Heidelberg, 1969; pp. 534–557. ISBN 978-3-642-87734-6. [Google Scholar]
- Rampim, L.; Lana, M.C. Ion mobility and base saturation after gypsum application in continuous soybean-wheat cropping system under no-till. Australian Journal of Crop Science 2015. [Google Scholar]
- Febrisiantosa, A.; Ravindran, B.; Choi, H.L. The Effect of Co-Additives (Biochar and FGD Gypsum) on Ammonia Volatilization during the Composting of Livestock Waste. Sustainability 2018, 10, 795. [Google Scholar] [CrossRef]
- Hartina, H.; Monkham, T.; Wisawapipat, W.; Vityakon, P.; Sukitprapanon, T.-S. Influence of Humic Acid and Gypsum on Phosphorus Dynamics and Rice Yield in Acidic Paddy Soil: Insights from Sequential Extraction and Xanes Spectroscopy 2025. [CrossRef]
- Attanayake, C.P.; Dharmakeerthi, R.S.; Kumaragamage, D.; Indraratne, S.P.; Goltz, D. Flooding-induced inorganic phosphorus transformations in two soils, with and without gypsum amendment. Journal of Environmental Quality 2022, 51, 90–100. [Google Scholar] [CrossRef] [PubMed]
- Fageria, N.K.; Carvalho, G.D.; Santos, A.B.; Ferreira, E.P.B.; Knupp, A.M. Chemistry of Lowland Rice Soils and Nutrient Availability. Communications in Soil Science and Plant Analysis 2011, 42, 1913–1933. [Google Scholar] [CrossRef]
- Chaganti, V.N.; Culman, S.W.; Dick, W.A.; Kost, D. Effects of Gypsum Application Rate and Frequency on Corn Response to Nitrogen. Agronomy Journal 2019, 111, 1109–1117. [Google Scholar] [CrossRef]
- Weng, X.; Li, H.; Ren, C.; Zhou, Y.; Zhu, W.; Zhang, S.; Liu, L. Calcium Regulates Growth and Nutrient Absorption in Poplar Seedlings. Front. Plant Sci. 2022, 13. [Google Scholar] [CrossRef] [PubMed]
- Bossolani, J.W.; Crusciol, C.A.C.; Garcia, A.; Moretti, L.G.; Portugal, J.R.; Rodrigues, V.A.; da Fonseca, M. de C.; Calonego, J.C.; Caires, E.F.; Amado, T.J.C.; et al. Long-Term Lime and Phosphogypsum Amended-Soils Alleviates the Field Drought Effects on Carbon and Antioxidative Metabolism of Maize by Improving Soil Fertility and Root Growth. Front Plant Sci 2021, 12, 650296. [Google Scholar] [CrossRef]
- Cheng, F.; Bin, S.; Iqbal, A.; He, L.; Wei, S.; Zheng, H.; Yuan, P.; Liang, H.; Ali, I.; Xie, D.; et al. High Sink Capacity Improves Rice Grain Yield by Promoting Nitrogen and Dry Matter Accumulation. Agronomy 2022, 12, 1688. [Google Scholar] [CrossRef]
- Gu, J.; Chen, Y.; Zhang, H.; Li, Z.; Zhou, Q.; Yu, C.; Kong, X.; Liu, L.; Wang, Z.; Yang, J. Canopy light and nitrogen distributions are related to grain yield and nitrogen use efficiency in rice. Field Crops Research 2017, 206, 74–85. [Google Scholar] [CrossRef]
- Leghari, S.J.; Wahocho, N.; Laghari, G.; Laghari, A.; Banbhan, G.M.; Talpur, K.; Ahmed, T.; Wahocho, S.; Lashari, A. Role of Nitrogen for Plant Growth and Development: A review. Advances in Environmental Biology 2016, 10, 209–218. [Google Scholar]
- Chen, Z.; Wang, Q.; Ma, J.; Zou, P.; Jiang, L. Impact of controlled-release urea on rice yield, nitrogen use efficiency and soil fertility in a single rice cropping system. Sci Rep 2020, 10, 10432. [Google Scholar] [CrossRef]
- Du, M.; Zhang, W.; Gao, J.; Liu, M.; Zhou, Y.; He, D.; Zhao, Y.; Liu, S. Improvement of Root Characteristics Due to Nitrogen, Phosphorus, and Potassium Interactions Increases Rice (Oryza sativa L.) Yield and Nitrogen Use Efficiency. Agronomy 2022, 12, 23. [Google Scholar] [CrossRef]
- Agegnehu, G.; Nelson, P.N.; Bird, M.I. The effects of biochar, compost and their mixture and nitrogen fertilizer on yield and nitrogen use efficiency of barley grown on a Nitisol in the highlands of Ethiopia. Science of The Total Environment 2016, 569–570, 869–879. [Google Scholar] [CrossRef] [PubMed]
- Vanlauwe, B.; Bationo, A.; Chianu, J.; Giller, K.E.; Merckx, R.; Mokwunye, U.; Ohiokpehai, O.; Pypers, P.; Tabo, R.; Shepherd, K.D.; et al. Integrated soil fertility management: Operational definition and consequences for implementation and dissemination. Outlook on Agriculture 2010, 39, 17–24. [Google Scholar] [CrossRef]
- Zheng, E.; Qin, M.; Zhang, Z.; Xu, T. Humic Acid Fertilizer Incorporation Increases Rice Radiation Use, Growth, and Yield: A Case Study on the Songnen Plain, China. Agriculture 2022, 12, 653. [Google Scholar] [CrossRef]
- Jing, J.; Zhang, S.; Yuan, L.; Li, Y.; Lin, Z.; Xiong, Q.; Zhao, B. Combining humic acid with phosphate fertilizer affects humic acid structure and its stimulating efficacy on the growth and nutrient uptake of maize seedlings. Sci Rep 2020, 10, 17502. [Google Scholar] [CrossRef]
- Rowley, M.C.; Nico, P.S.; Bone, S.E.; Marcus, M.A.; Pegoraro, E.F.; Castanha, C.; Kang, K.; Bhattacharyya, A.; Torn, M.S.; Peña, J. Association between soil organic carbon and calcium in acidic grassland soils from Point Reyes National Seashore, CA. Biogeochemistry 2023, 165, 91–111. [Google Scholar] [CrossRef]
Figure 1.
The interaction effect of fertilizer, humic acid (HA), and flue-gas desulfurization gypsum (FG) on soil properties after soil amendments incorporation. Soil pH (a); Eh (b); total organic carbon (TOC) (c); cation exchange capacity (CEC) (d); total nitrogen (Total N) (e); exchangeable ammonium nitrogen (NH4-N) (f); exchangeable nitrate nitrogen (NO3-N) (g); exchangeable calcium (Exc. Ca) (h); exchangeable sulfur (Exc. S) (i). F1 = Fertilizer application rate based on farmer practices; F2 = Fertilizer application rate based on rice nutrient requirements; H0 = No HA; H1 = HA application at 975 kg ha-1; G0 = No FG; G1 = FG application rate followed gypsum requirement at 636 kg ha-1; G2 = FG application rate based on Ca required by rice at 23 kg ha-1. Mean value followed by different letters showed significant differences at P < 0.05.
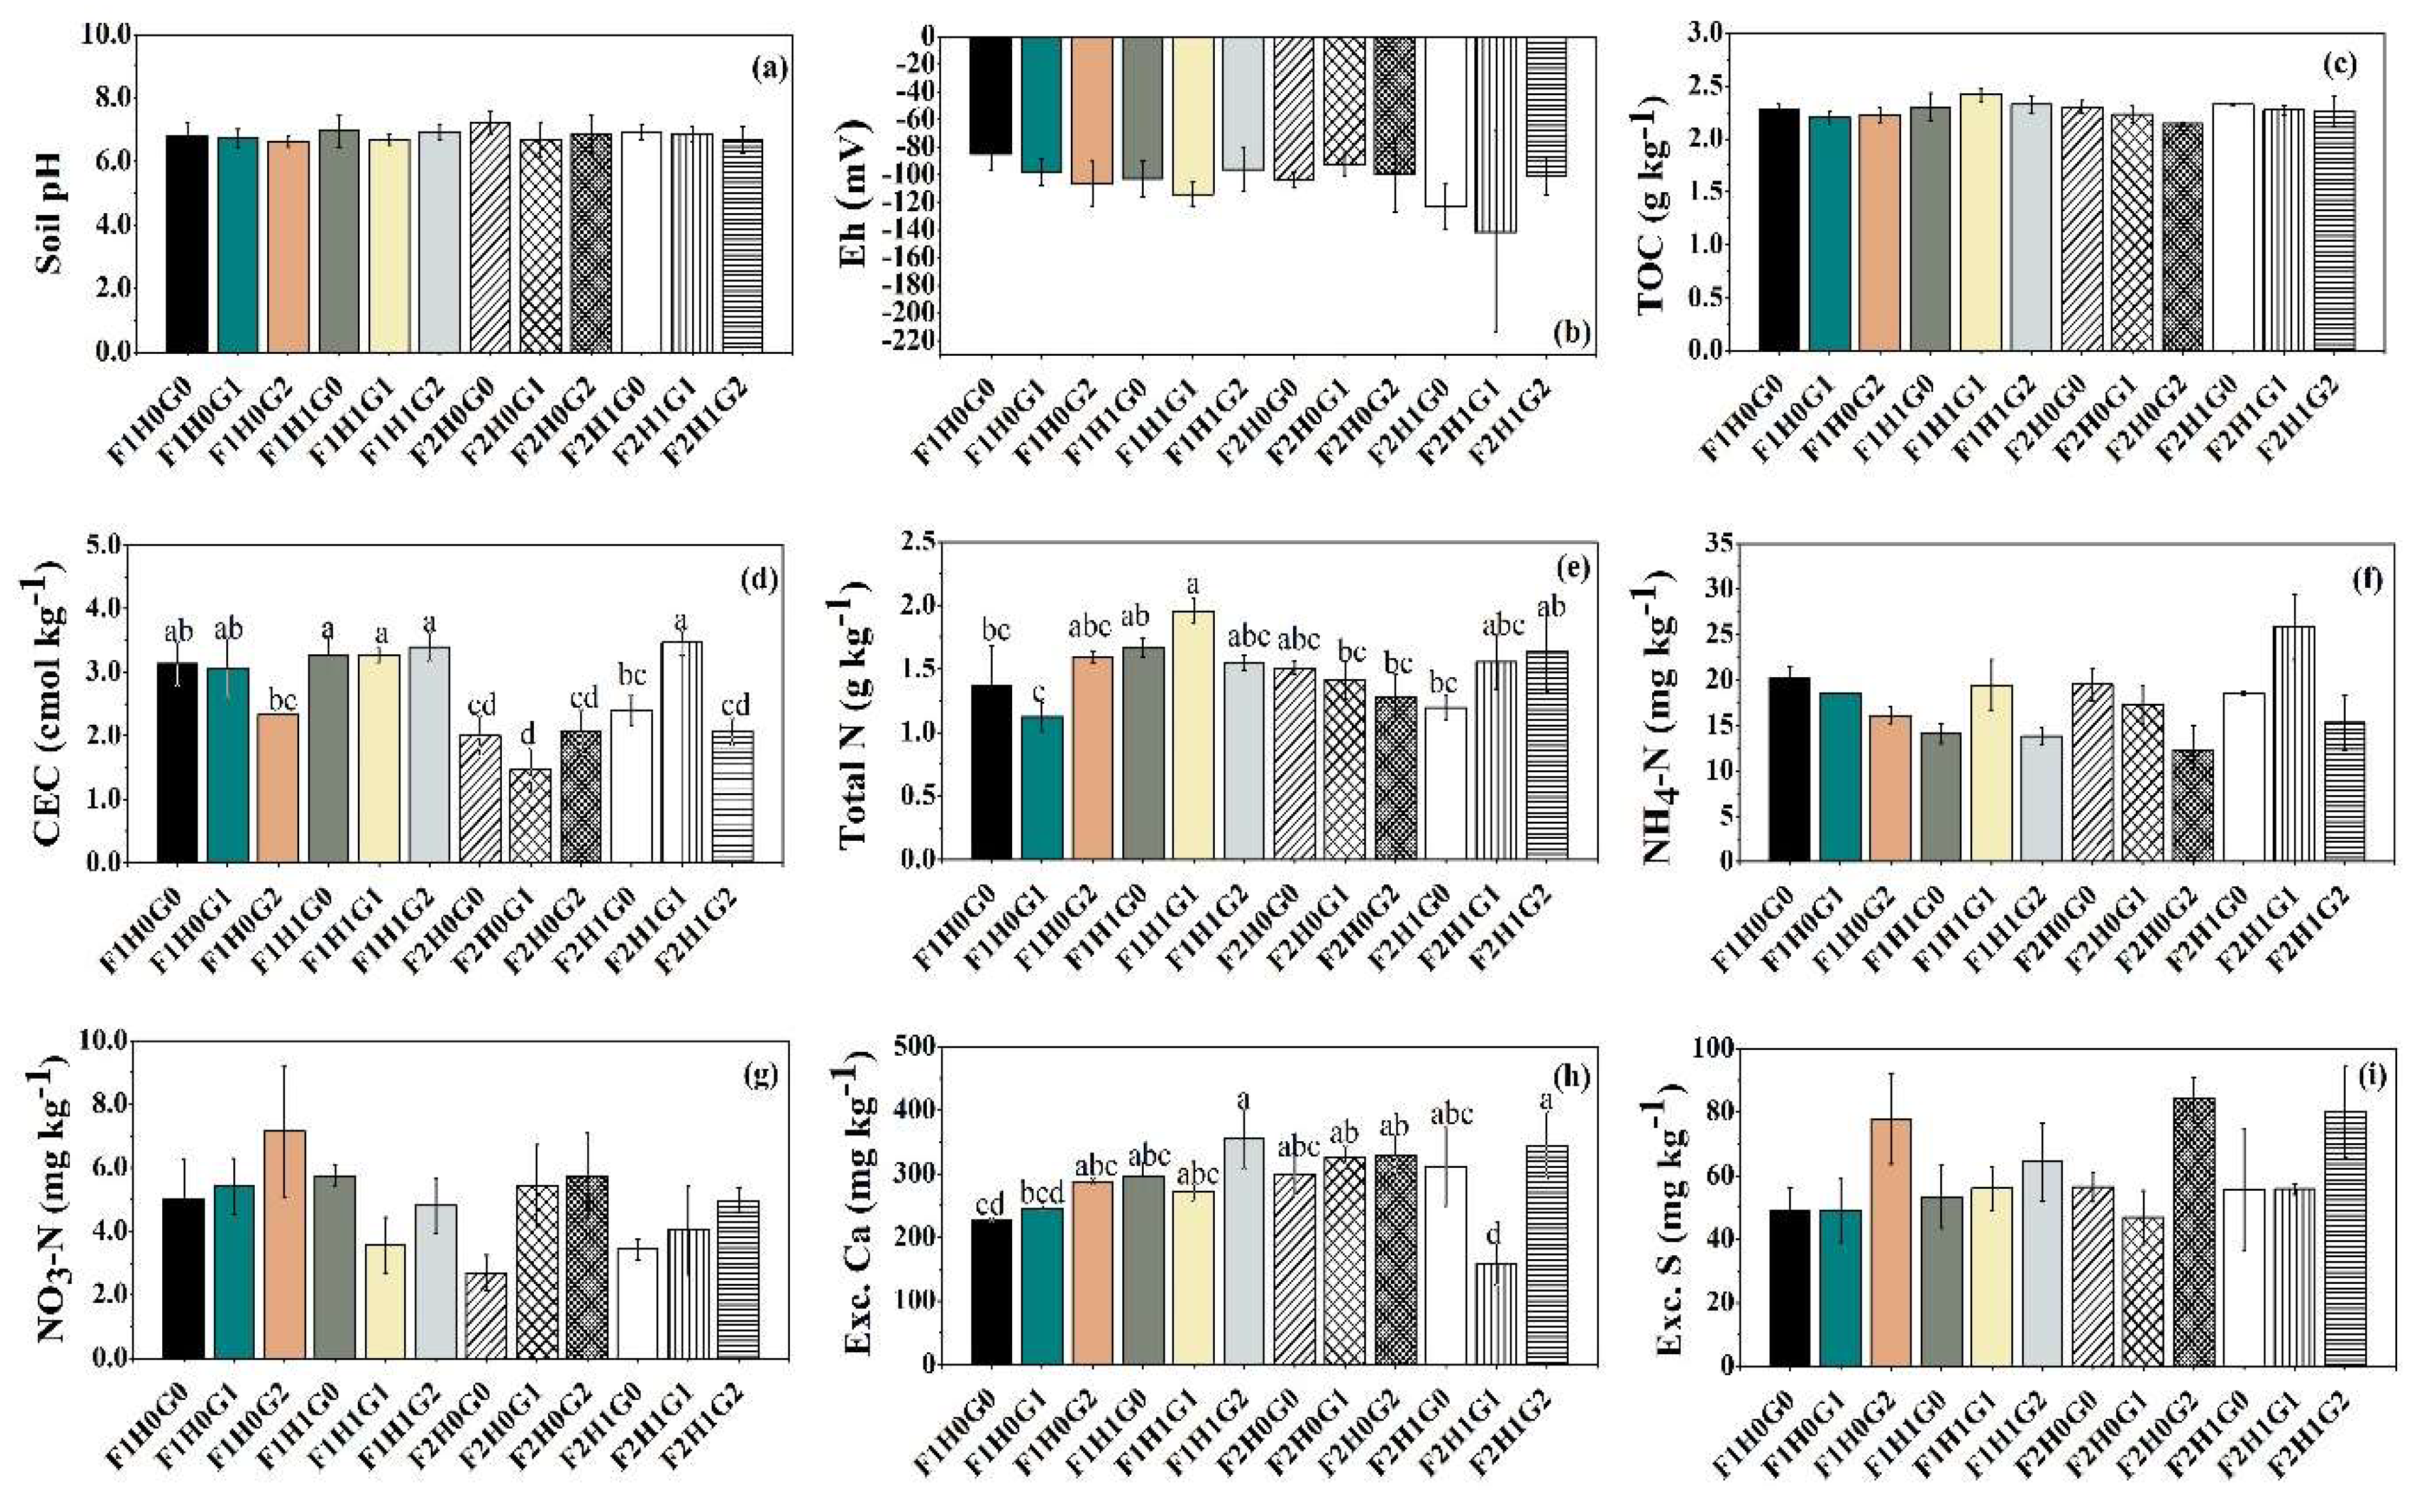
Figure 2.
Two factor interaction effects of fertilizer, humic acid (HA), and flue-gas desulfurization gypsum (FG) on soil properties after soil amendments incorporation. Cation exchange capacity (CEC) (a and b); total nitrogen (N) (c and d); exchangeable ammonium nitrogen (NH4-N) (e); exchangeable nitrate nitrogen (NO3-N) (f and g); and exchangeable calcium (Exc. Ca) (h). F1 = Fertilizer application rate based on farmer practices; F2 = Fertilizer application rate based on rice nutrient requirements; H0 = No HA; H1 = HA application at 975 kg ha-1; G0 = No FG; G1 = FG application rate followed gypsum requirement at 636 kg ha-1; G2 = FG application rate based on Ca required by rice at 23 kg ha-1. Mean value followed by different letters showed significant differences at P < 0.05.
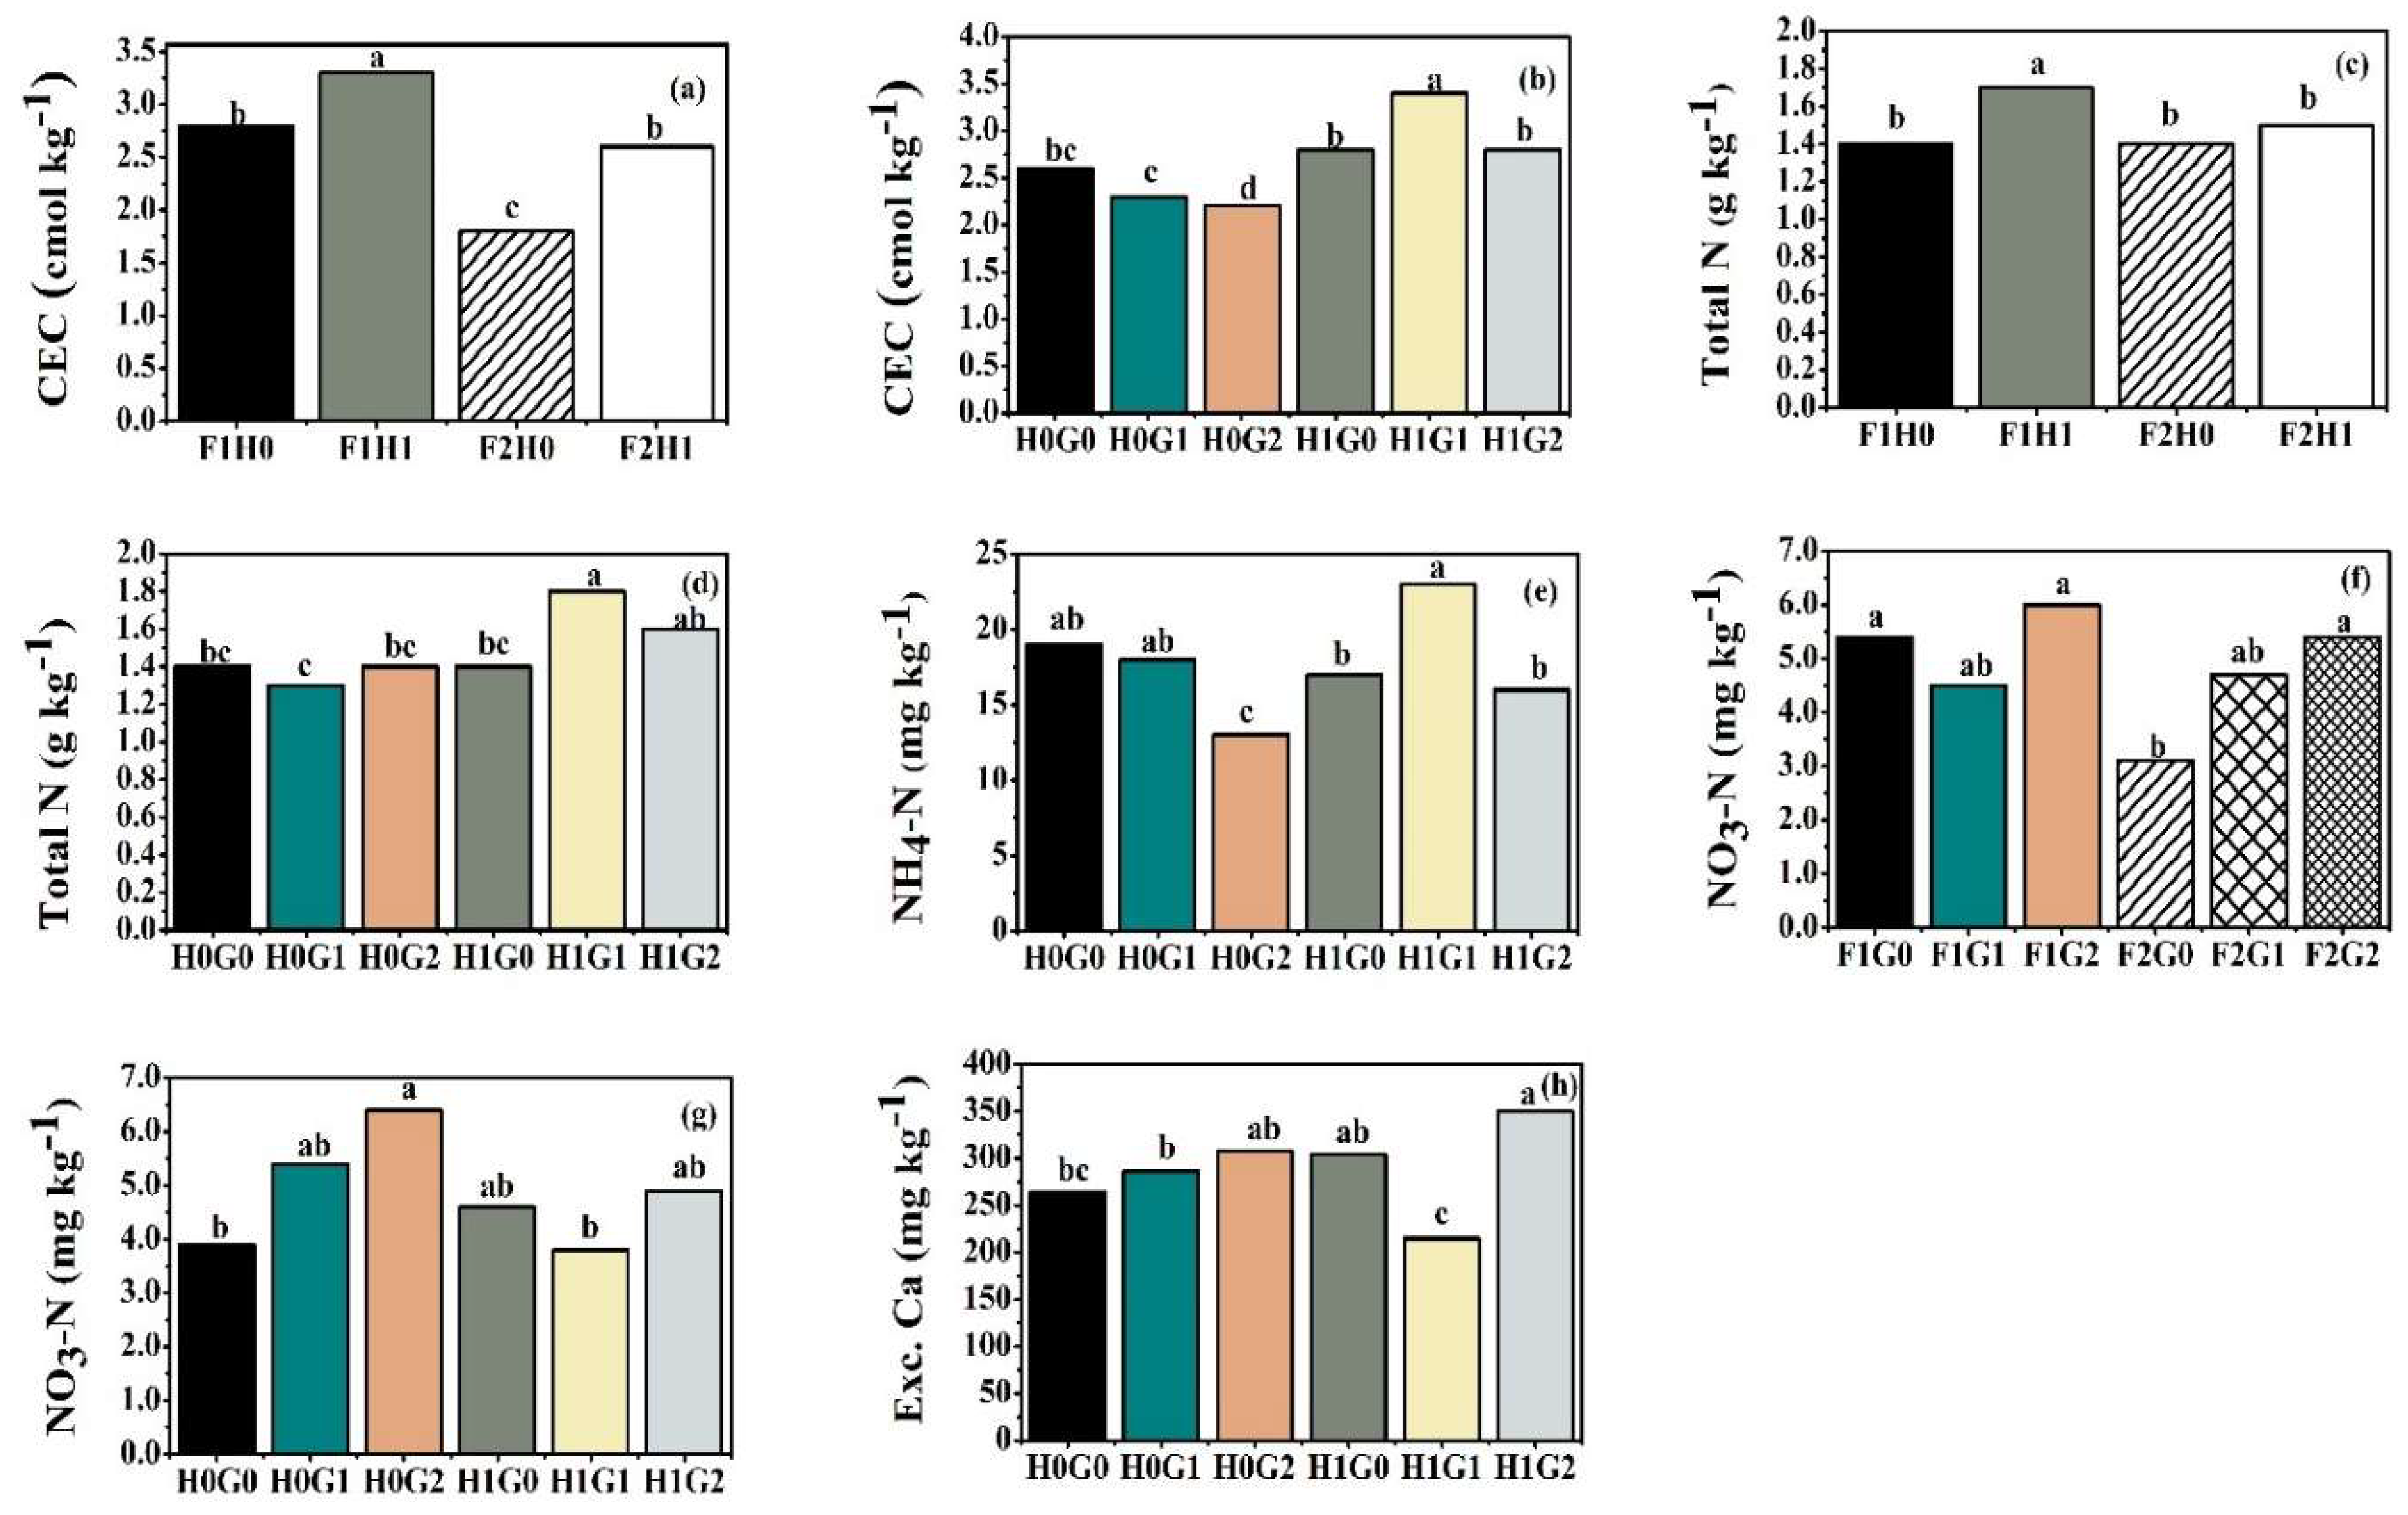
Figure 3.
Bivariate relationship (n = 36) between total organic carbon (TOC) and cation exchange capacity (CEC) (a) and exchangeable ammonium nitrogen (NH4-N) and exchangeable nitrate nitrogen (NO3-N) (b). Significant differences at P < 0.05.
Figure 3.
Bivariate relationship (n = 36) between total organic carbon (TOC) and cation exchange capacity (CEC) (a) and exchangeable ammonium nitrogen (NH4-N) and exchangeable nitrate nitrogen (NO3-N) (b). Significant differences at P < 0.05.
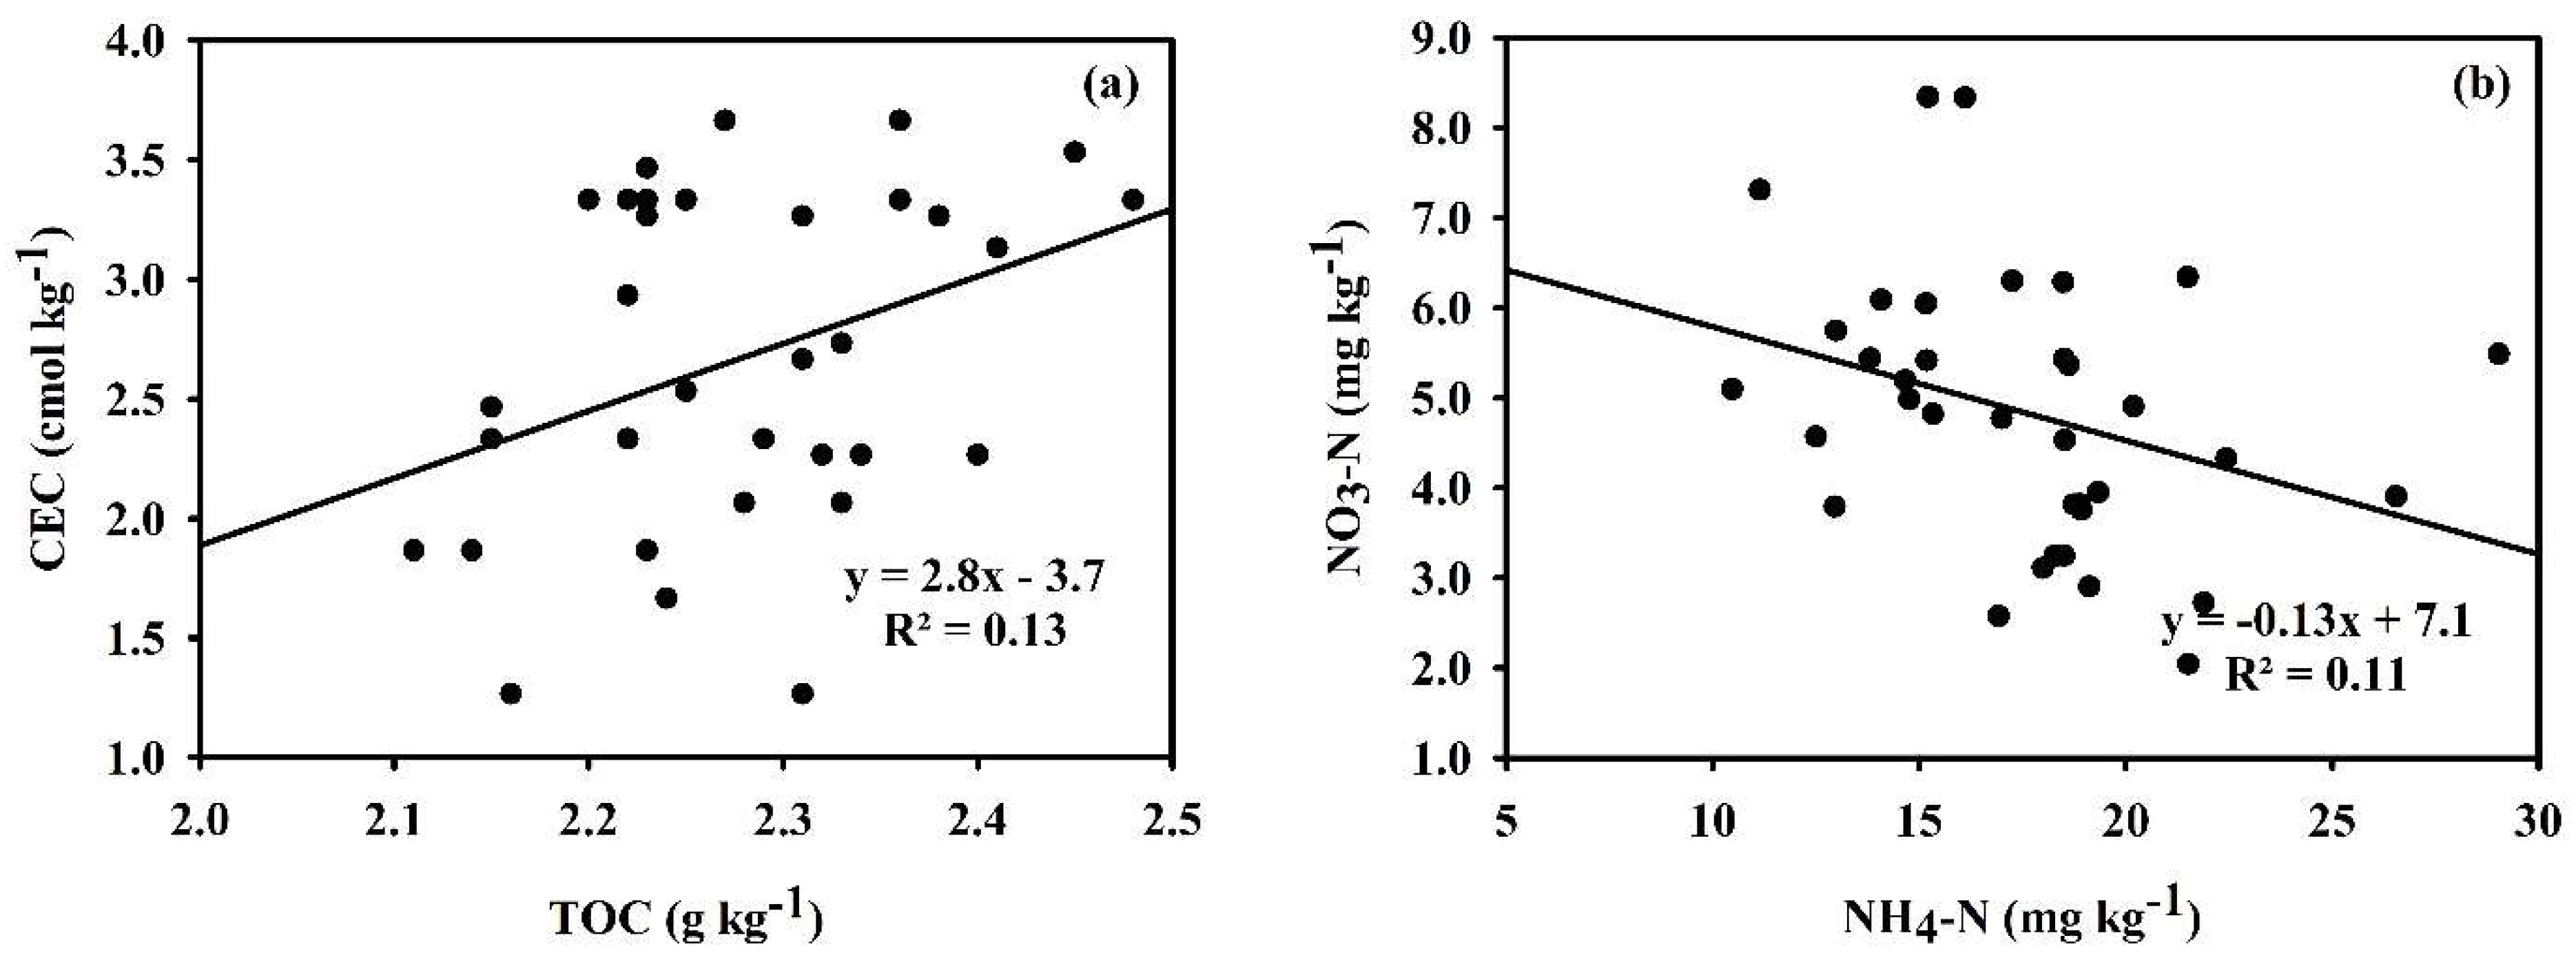
Figure 4.
The interaction effect of fertilizer, humic acid (HA), and flue-gas desulfurization gypsum (FG) on straw biomass (a); root biomass (b); grain yield (c); total nitrogen (N) uptake (d); nitrogen use efficiency (NUE) (e); nitrogen agronomic efficiency (NAE) (f). F1 = Fertilizer application rate based on farmer practices; F2 = Fertilizer application rate based on rice nutrient requirements; H0 = No HA; H1 = HA application at 975 kg ha-1; G0 = No FG; G1 = FG application rate followed gypsum requirement at 636 kg ha-1; G2 = FG application rate based on Ca required by rice at 23 kg ha-1. Mean value followed by different letters showed significant differences at P < 0.05.
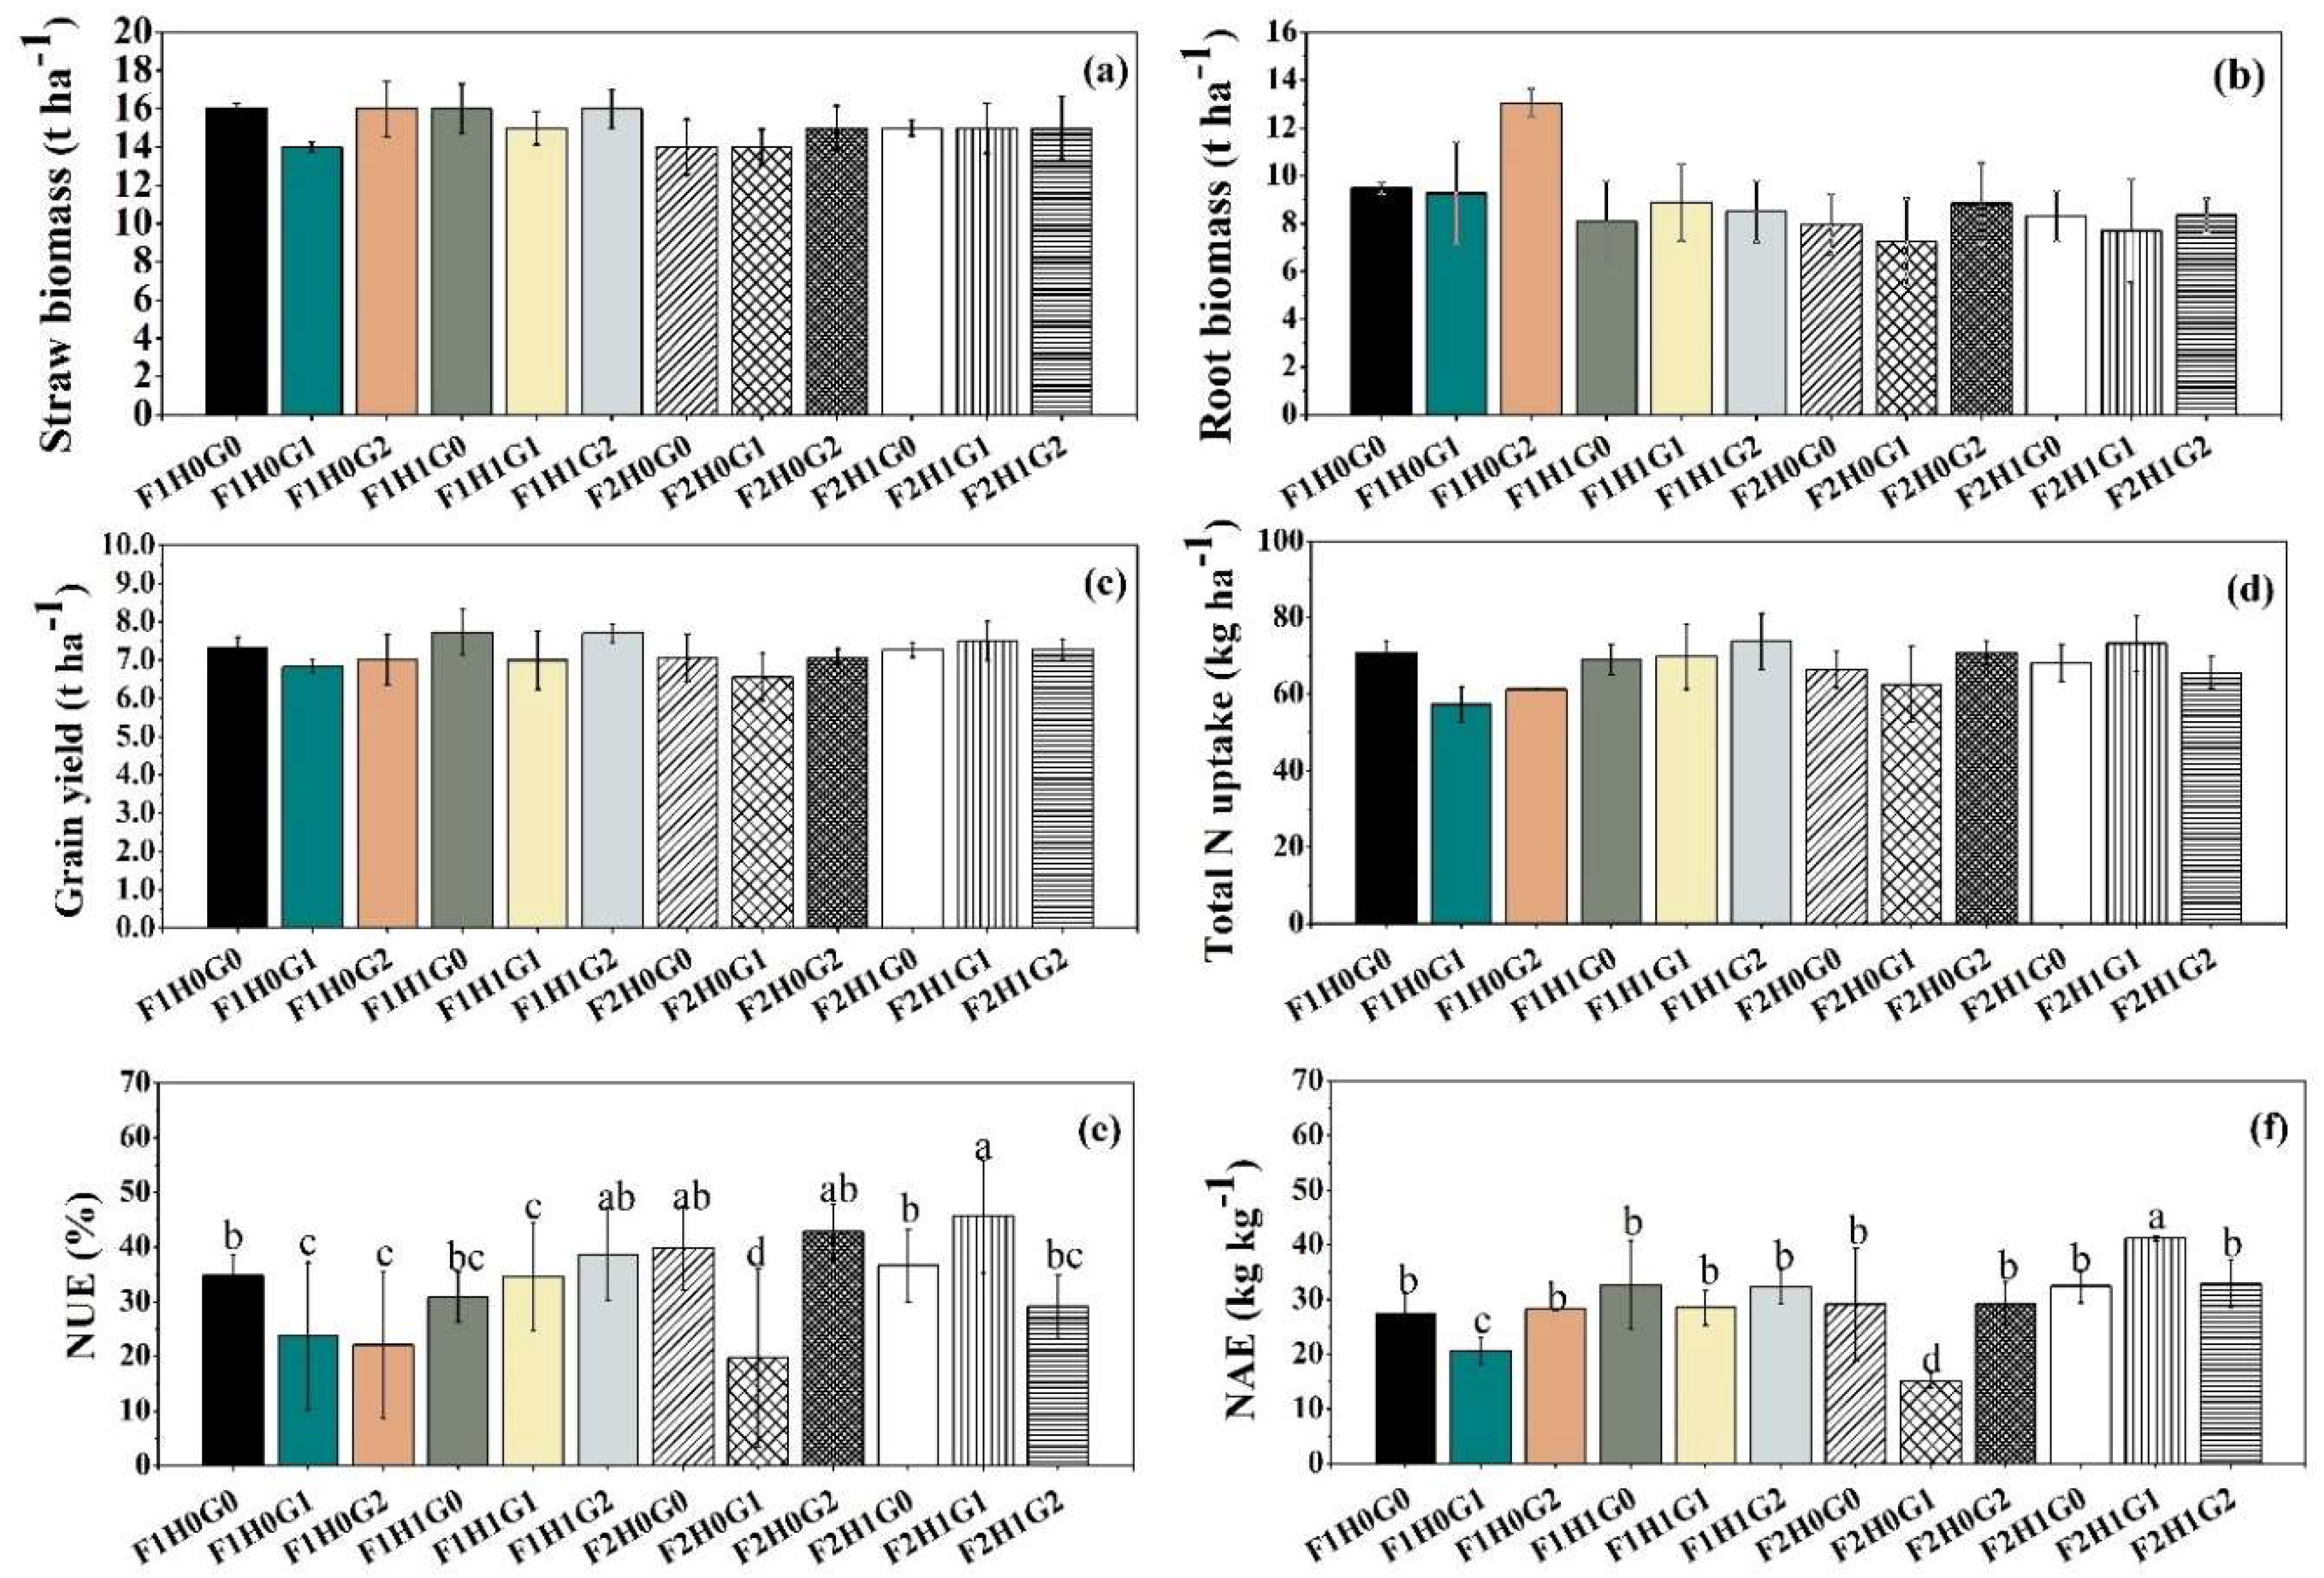
Figure 5.
Two factor interaction effect of fertilizer, humic acid (HA), and flue-gas desulfurization gypsum (FG) on root biomass (a and b). H0 = No HA; H1 = HA application at 975 kg ha-1; G0 = No FG; G1= FG application rate followed gypsum requirement (636 kg ha-1); G2= FG application rate based on Ca required by rice (23 kg ha-1). Mean value followed by different letters showed significant differences at P < 0.05.
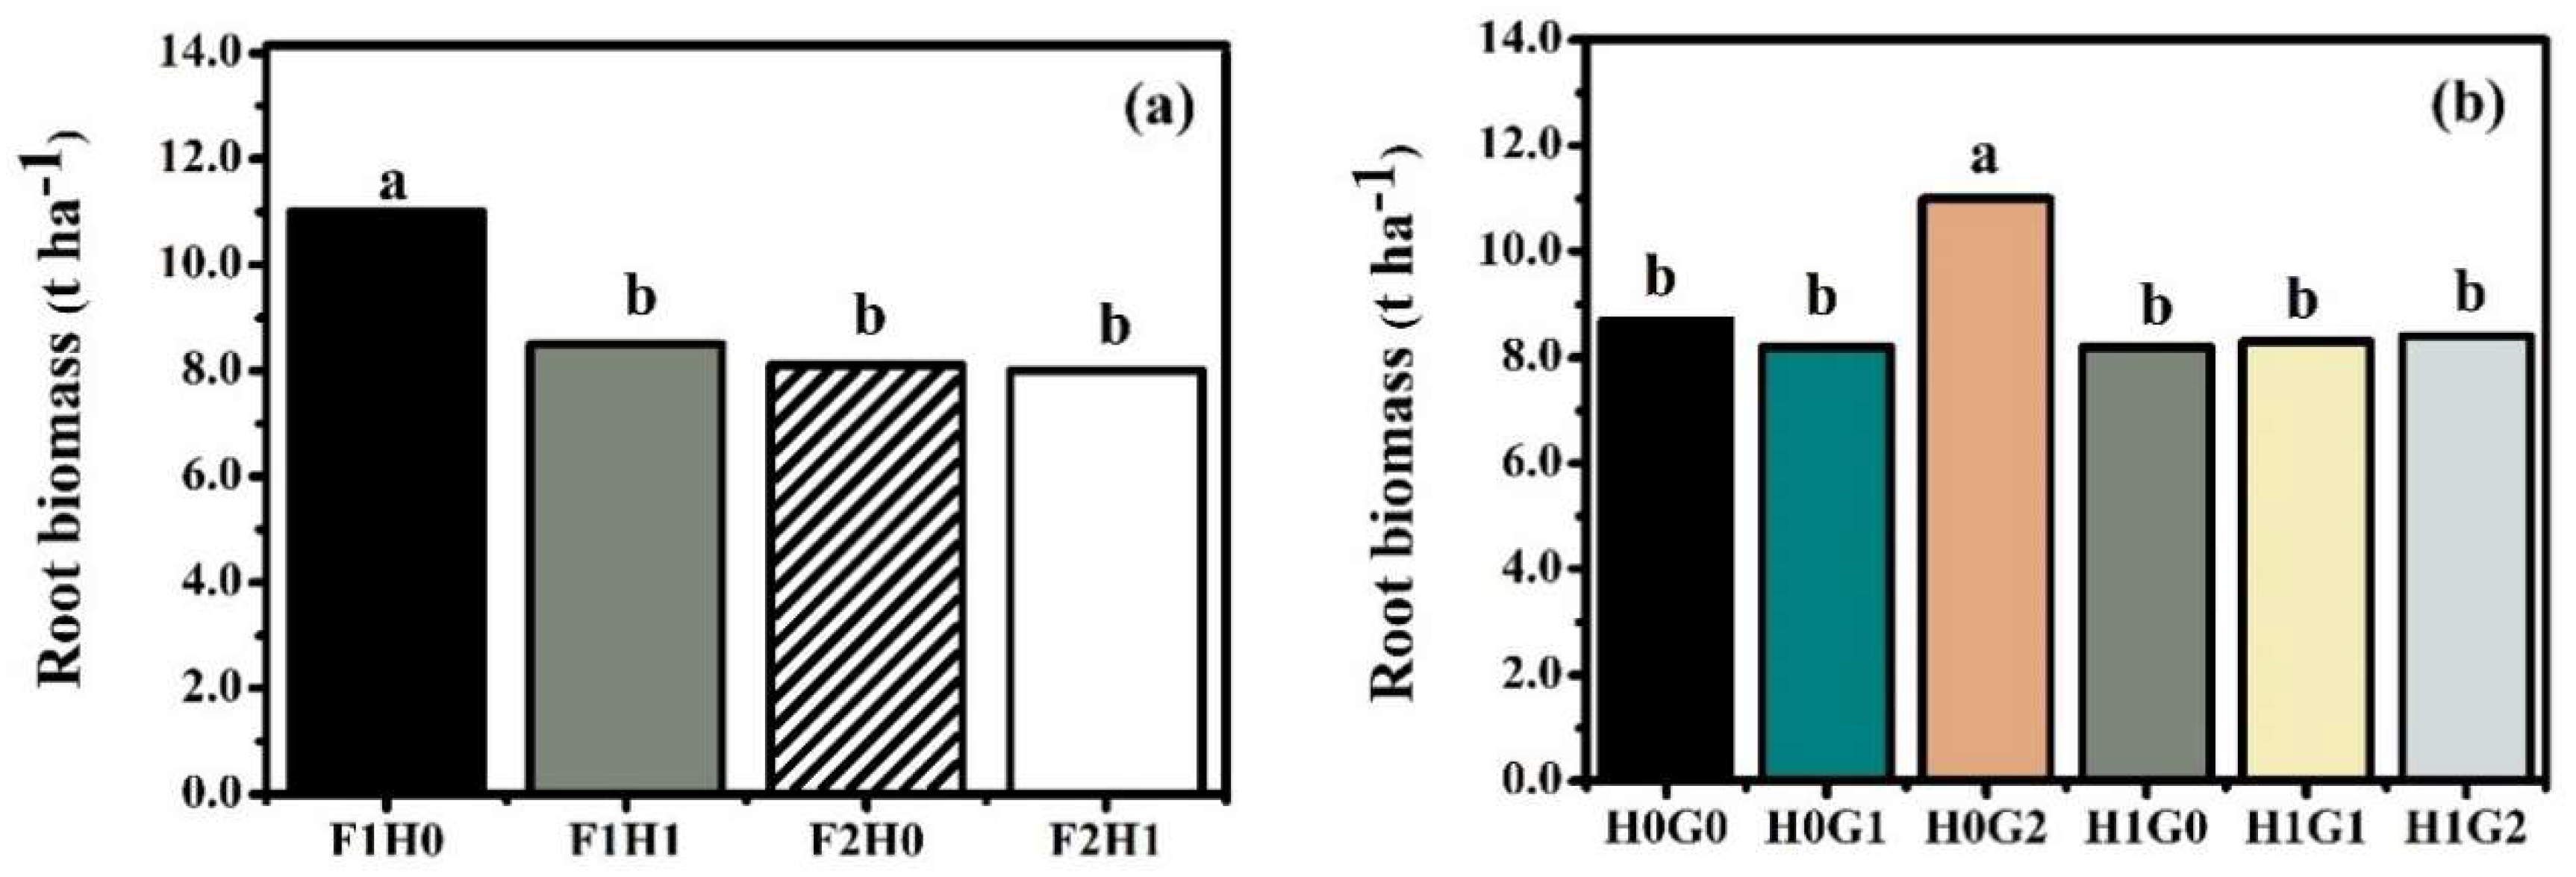
Figure 6.
Principal component analysis based on standardized average data for rice grain, straw biomass, root biomass, total nitrogen (N) uptake, N use efficiency (NUE), and N agronomic efficiency (NAE), and soil properties of an acidic paddy soil. (a) distribution of properties (variables) and (b) distribution of soils treated by different application rate of fertilizer, humic acid (HA), flue gas desulfurization gypsum (FG) (cases) for all treatments. F1 = Fertilizer application rate based on farmer practices; F2 = Fertilizer application rate based on rice nutrient requirements; H0 = No HA; H1 = HA application at 975 kg ha-1; G0 = No FG; G1 = FG application rate followed gypsum requirement at 636 kg ha-1; G2 = FG application rate based on Ca required by rice at 23 kg ha-1.
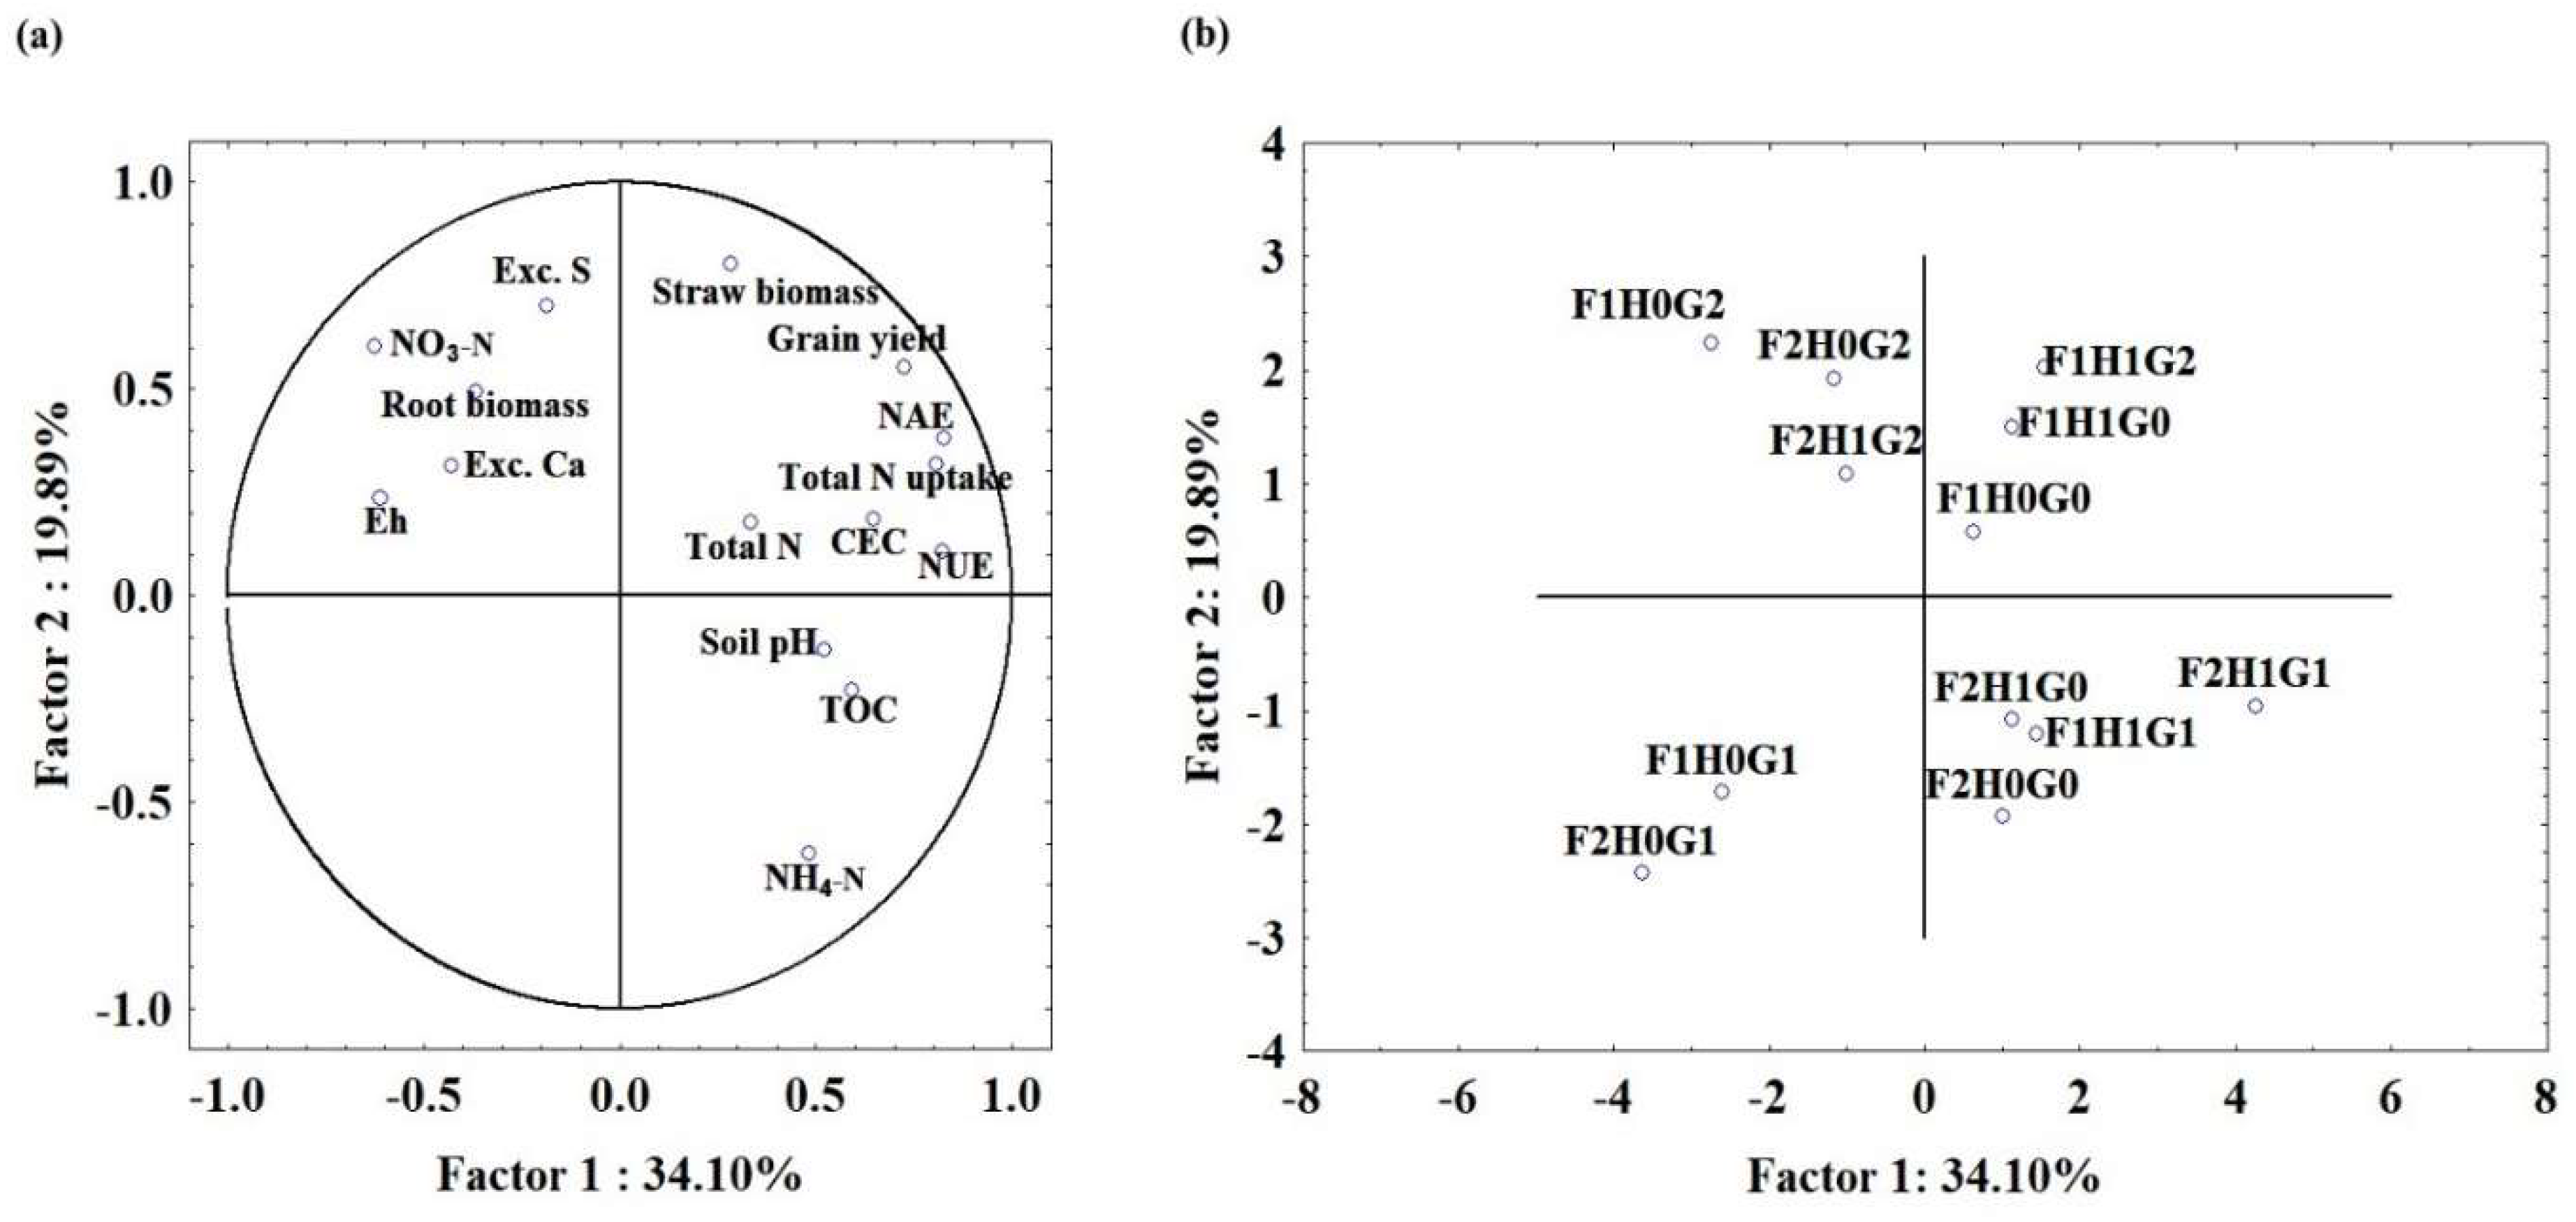
Figure 7.
Bivariate relationship (n = 36) between grain yield and straw biomass (a) and total N uptake (b); straw biomass and total nitrogen (N) uptake (c) and root biomass (d); nitrogen use efficiency (NUE) and total N uptake (e) and grain yield (f); nitrogen agronomic efficiency (NAE) and grain yield (g), total N uptake (h) and straw biomass (i). Significant differences at P < 0.05.
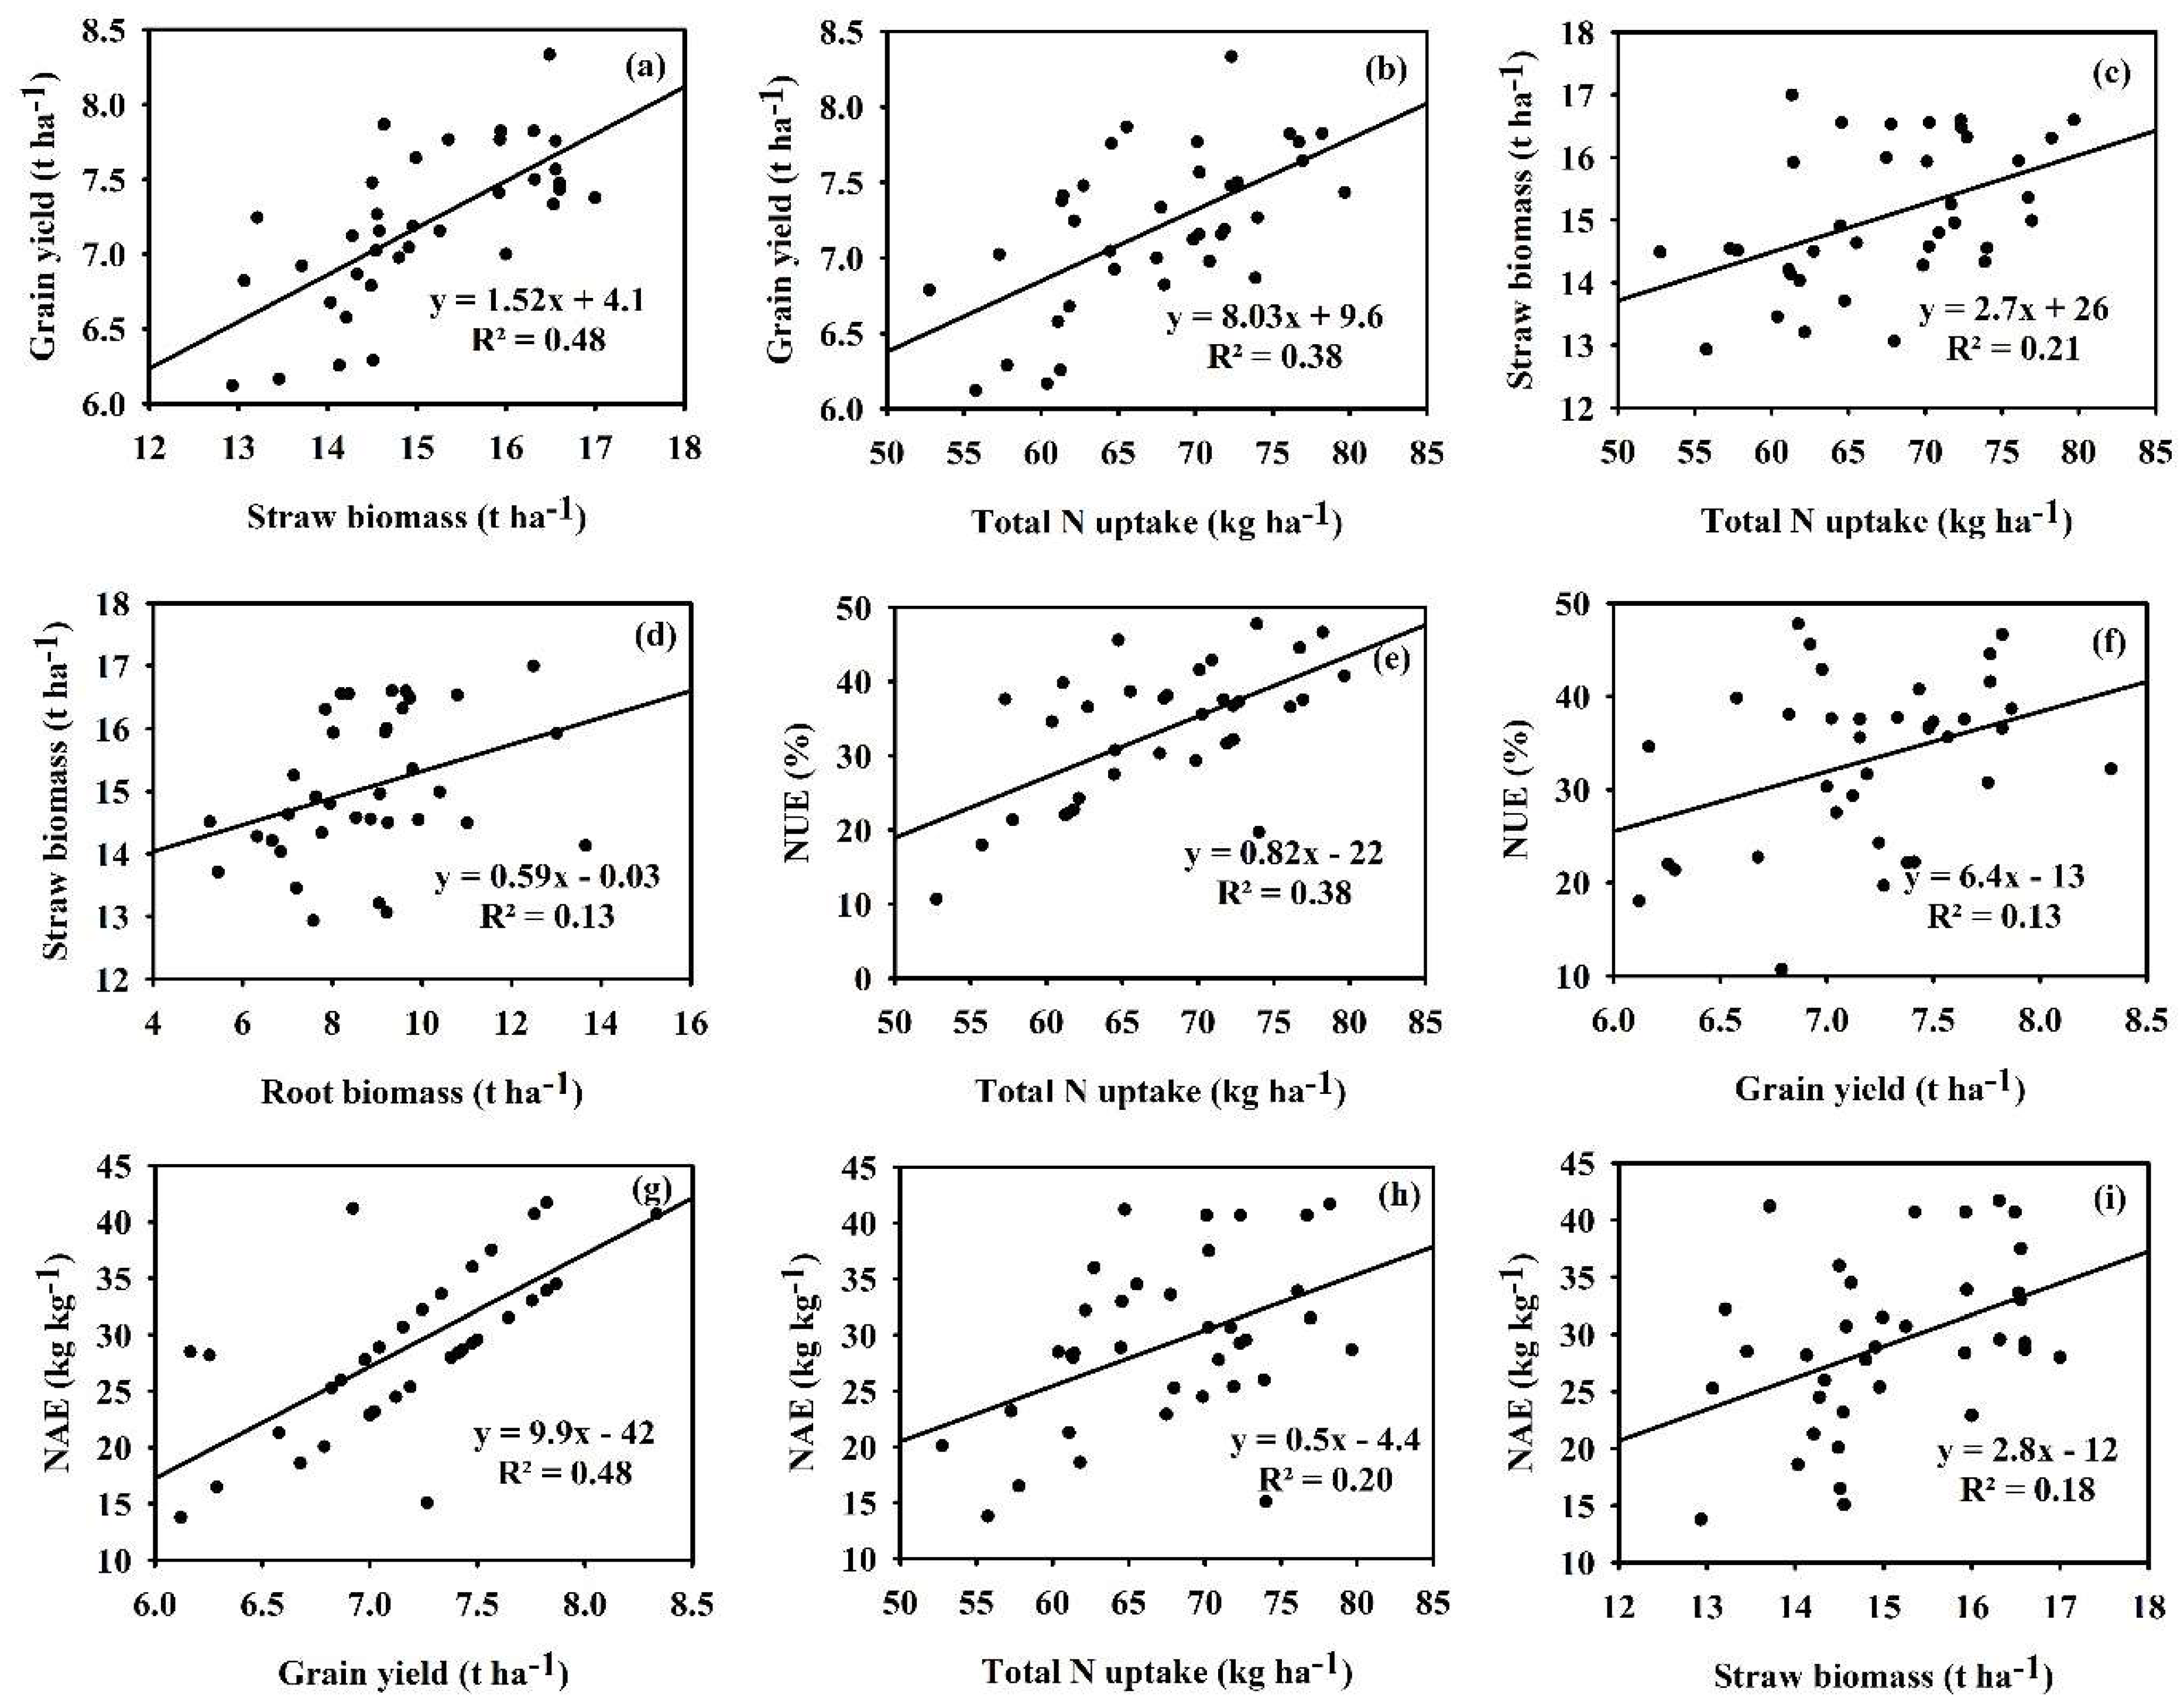

Table 1.
Characteristics of soil, humic acid, and flue gas desulfurization gypsum used in this study.
Table 1.
Characteristics of soil, humic acid, and flue gas desulfurization gypsum used in this study.
| Property | Initial soil | Humic acid | FG |
| Soil classification | Aeric Kandiaquult | - | - |
| Soil texture | Sandy loam | - | - |
| Sand (g kg-1) | 583 | - | - |
| Silt (g kg-1) | 359 | - | - |
| Clay (g kg-1) | 58 | - | - |
| pH | 4.7 | 9.8 | 7.7 |
| EC (mS cm-1) | 0.08 | 8.3 | 3.3 |
| TOC (g kg-1) | 1.6 | 291 | - |
| CEC (cmol kg-1) | 2.6 | 57 | - |
| NH4-N (mg kg-1) | 23 | - | - |
| NO3-N (mg kg-1) | 12 | - | - |
| Exchangeable Ca (mg kg-1) | 95 | - | - |
| Exchangeable S (mg kg-1) | 37 | - | - |
| Total N (g kg-1) | 0.56 | 11 | 0.12 |
| Total Ca (g kg-1) | 0.28 | 9.4 | 388 |
| Total S (g kg-1) | 0.14 | 6.7 | 199 |
HA = Humic acid; FG = Flue gas desulfurization gypsum; EC = Electrical conductivity; TOC = Total organic carbon; CEC = Cation exchange capacity; NH4-N = Exchangeable ammonium nitrogen; NO3-N = Exchangeable nitrate nitrogen; Total N = Total nitrogen; Total Ca = Total calcium; Total S = Total sulfur.
Table 2.
The amounts of nutrient nitrogen input (kg ha-1) from chemical fertilizer, humic acid, and flue gas desulfurization gypsum used in this study.
Table 2.
The amounts of nutrient nitrogen input (kg ha-1) from chemical fertilizer, humic acid, and flue gas desulfurization gypsum used in this study.
| Treatment | Nitrogen input (kg ha-1) | |||
| Fertilizer | HA | FG | Total | |
| F1H0G0 | 75 | 0 | 0 | 75 |
| F1H0G1 | 75 | 0 | 0.08 | 75.08 |
| F1H0G2 | 75 | 0 | 0.003 | 75.003 |
| F1H1G0 | 75 | 10.68 | 0 | 85.68 |
| F1H1G1 | 75 | 10.68 | 0.08 | 85.76 |
| F1H1G2 | 75 | 10.68 | 0.003 | 85.683 |
| F2H0G0 | 61 | 0 | 0 | 61 |
| F2H0G1 | 61 | 0 | 0.08 | 61.08 |
| F2H0G2 | 61 | 0 | 0.003 | 61.003 |
| F2H1G0 | 61 | 10.68 | 0 | 71.68 |
| F2H1G1 | 61 | 10.68 | 0.08 | 71.76 |
| F2H1G2 | 61 | 10.68 | 0.003 | 71.683 |
HA = Humic acid; FG = Flue gas desulfurization gypsum; F1 = Fertilizer application rate based on farmer practices; F2 = Fertilizer application rate based on rice nutrient requirements; H0 = No HA; H1 = HA application at 975 kg ha-1; G0 = No FG; G1 = FG application rate followed gypsum requirement at 636 kg ha-1; G2 = FG application rate based on Ca required by rice at 23 kg ha-1.
Table 3.
Soil properties influenced by applications of fertilizer, humic acid, and flue gas desulfurization gypsum under rice cultivation in an acidic paddy soil.
Table 3.
Soil properties influenced by applications of fertilizer, humic acid, and flue gas desulfurization gypsum under rice cultivation in an acidic paddy soil.
| Soil Properties | Soil pH | Eh | TOC | CEC | Total N | NH4-N | NO3-N | Exc. Ca | Exc. S |
| (mV) | (g kg-1) | (cmol kg-1) | (g kg-1) | (------------------------mg kg-1--------------------) | |||||
| Fertilizer (F) | |||||||||
| F1 | 6.8 | -100 | 2.3 | 3.1a | 1.5a | 16b | 5.2a | 280 | 57 |
| F2 | 6.9 | -110 | 2.3 | 2.2b | 1.4b | 19a | 4.4b | 295 | 63 |
| P value | 0.448 | 0.217 | 0.168 | <0.001 | 0.052 | 0.013 | 0.023 | 0.173 | 0.167 |
| Humic acid (HA) | |||||||||
| H0 | 6.8 | -97 | 2.2b | 2.3b | 1.4b | 17 | 5.2a | 286 | 60 |
| H1 | 6.8 | -113 | 2.3a | 3.0a | 1.6a | 19 | 4.4b | 290 | 60 |
| P value | 0.913 | 0.064 | 0.003 | <0.001 | <0.001 | 0.109 | 0.038 | 0.741 | 0.928 |
| Gypsum (FG) | |||||||||
| G0 | 7.0 | -104 | 2.3 | 2.7ab | 1.4 | 18a | 4.2b | 284b | 54b |
| G1 | 6.8 | -111 | 2.3 | 2.8a | 1.5 | 20a | 4.6ab | 250b | 50b |
| G2 | 6.8 | -101 | 2.2 | 2.4b | 1.5 | 15b | 5.7a | 329a | 77a |
| P value | 0.122 | 0.514 | 0.136 | 0.023 | 0.404 | 0.001 | 0.012 | <0.001 | <0.001 |
| Interactions (P value) | |||||||||
| F × HA | 0.238 | 0.343 | 0.320 | 0.099 | 0.01 | 0.089 | 0.362 | <0.001 | 0.751 |
| F × FG | 0.721 | 0.577 | 0.143 | 0.450 | 0.696 | 0.116 | 0.028 | 0.085 | 0.352 |
| HA × FG | 0.802 | 0.174 | 0.319 | 0.006 | 0.003 | 0.004 | 0.024 | <0.001 | 0.158 |
| F × HA × FG | 0.313 | 0.697 | 0.379 | <0.001 | <0.001 | 0.267 | 0.681 | 0.018 | 0.682 |
HA = Humic acid; FG = Flue gas desulfurization gypsum; F1 = Fertilizer application rate based on farmer practices; F2 = Fertilizer application rate based on rice nutrient requirements; H0 = No HA; H1 = HA application at 975 kg ha-1; G0 = No FG; G1 = FG application rate based on gypsum requirement at 636 kg ha-1; G2 = FG application rate based on Ca required by rice at 23 kg ha-1. Eh = Field redox potential; TOC = Total organic carbon; CEC = Cation exchange capacity; N = Total nitrogen; NH4-N = Exchangeable ammonium nitrogen; NO3-N = Exchangeable nitrate nitrogen; Exc. Ca = Exchangeable calcium; Exc. S = Exchangeable sulfur. Mean value followed by different letters showed significant differences at P < 0.05.
Table 4.
Yield, total N uptake, and nitrogen use efficiency as influenced by applications of fertilizer, humic acid, and flue gas desulfurization gypsum under rice cultivation in the acidic paddy soil.
Table 4.
Yield, total N uptake, and nitrogen use efficiency as influenced by applications of fertilizer, humic acid, and flue gas desulfurization gypsum under rice cultivation in the acidic paddy soil.
| Treatment | Straw biomass | Root biomass | Grain yield | Total N uptake | NUE | NAE |
| (----------------t ha-1----------------) | (kg ha-1) | (%) | (kg kg-1) | |||
| Fertilizer (F) | ||||||
| F1 | 15 | 9.5a | 7.3 | 68 | 31b | 28 |
| F2 | 15 | 8.1b | 7.1 | 67 | 36a | 30 |
| P value | 0.099 | <0.001 | 0.230 | 0.657 | 0.008 | 0.234 |
| Humic acid (HA) | ||||||
| H0 | 15 | 9.3a | 7.0b | 65b | 30b | 25b |
| H1 | 15 | 8.3b | 7.4a | 70a | 36a | 33a |
| P value | 0.730 | 0.014 | 0.004 | 0.013 | 0.004 | <0.001 |
| Gypsum (FG) | ||||||
| G0 | 15 | 8.5b | 7.3 | 69 | 36 | 31a |
| G1 | 14 | 8.3b | 6.9 | 66 | 31 | 26b |
| G2 | 15 | 10a | 7.3 | 68 | 33 | 30a |
| P value | 0.120 | 0.011 | 0.094 | 0.429 | 0.101 | 0.034 |
| Interactions (P value) | ||||||
| F x HA | 0.499 | 0.008 | 0.903 | 0.177 | 0.161 | 0.073 |
| F x FG | 0.243 | 0.257 | 0.368 | 0.334 | 0.853 | 0.631 |
| HA × FG | 0.662 | 0.027 | 0.768 | 0.053 | <0.001 | 0.001 |
| F × HA × FG | 0.709 | 0.218 | 0.184 | 0.073 | <0.001 | 0.012 |
HA = Humic acid; FG = Flue gas desulfurization gypsum; F1 = Fertilizer application rate based on farmer practices; F2 = Fertilizer application rate based on rice nutrient requirements; H0 = No HA; H1 = HA application at 975 kg ha-1; G0 = No FG; G1 = FG application rate based on gypsum requirement at 636 kg ha-1; G2 = FG application rate based on Ca required by rice at 23 kg ha-1. Total N uptake = Total nitrogen uptake; NUE = Nitrogen use efficiency; NAE = Nitrogen agronomic efficiency. Mean value followed by different letters showed significant differences at P < 0.05.
Disclaimer/Publisher’s Note: The statements, opinions and data contained in all publications are solely those of the individual author(s) and contributor(s) and not of MDPI and/or the editor(s). MDPI and/or the editor(s) disclaim responsibility for any injury to people or property resulting from any ideas, methods, instructions or products referred to in the content. |
© 2025 by the authors. Licensee MDPI, Basel, Switzerland. This article is an open access article distributed under the terms and conditions of the Creative Commons Attribution (CC BY) license (http://creativecommons.org/licenses/by/4.0/).
Copyright: This open access article is published under a Creative Commons CC BY 4.0 license, which permit the free download, distribution, and reuse, provided that the author and preprint are cited in any reuse.


