Submitted:
21 April 2025
Posted:
22 April 2025
You are already at the latest version
Abstract
Understanding the variations in the potential suitable habitats of different populations of the same species is crucial for targeted biodiversity conservation and ecosystem management in specific regions. For widely distributed species, the impact of climate change on the suitable habitats of different populations may vary. However, research in this area is currently insufficient. Hippuris vulgaris is an aquatic species widely distributed across the Northern Hemisphere, with an altitudinal range from 0 to 5000 meters, known for its high ecological and medicinal significance. In this study, we employed a MaxEnt model to simulate the current and future suitable habitats of Hippuris vulgaris through constructing high-altitude, low-altitude, and integrated distribution models. The results indicated that bio3 (isothermality), bio1 (annual mean temperature) and bio19 (precipitation of coldest quarter) significantly influenced the distribution of high-altitude populations of Hippuris vulgaris, whereas in low-altitude areas, bio3 (isothermality), bio9 (mean temperature of driest quarter), and bio13 (precipitation of wettest month) were the main influencing factors. The suitable habitat area for high-altitude populations of Hippuris vulgaris increased by 19.66% in the 2050s but decreased by 47.75% in the 2070s. The suitable habitat area for low-altitude populations increased by 99.71% in the 2050s and by 13.29% in the 2070s.Our findings showed that the key bioclimatic variables and suitable values influencing the distribution of Hippuris vulgaris populations in high- and low-altitude regions differed, and the changes in suitable habitats of the two populations showed completely opposite trends under climate change, with migration directions extending towards higher altitudes and higher latitudes, respectively.
Keywords:
Hippuris vulgaris
; climate change
; maximum entropy model
; different population
; suitable habitat
1. Introduction
Climate is a primary determinant of species distribution, with changes in species distribution patterns directly reflecting climate change [1,2]. Currently, numerous studies have employed the MaxEnt model to predict future species distributions and niche dynamics across diverse taxa and ecosystems[3,4], but research on differences in distribution patterns of the same species across different regions remains limited. Under the climate change scenario, populations of species with a wide ecological niche range at different altitudes may show similar differences among different species, and it is necessary to evaluate them separately in each region[5].Species distributed at high altitudes are more sensitive to climate change than those at lower altitudes[6,7], and their distribution range may shrink in the future, while migrating to higher altitudes faster [8]. Under climate change, the suitable habitat area of Carex moorcroftii and Pegaeophyton scapiflorum in the Tibetan Plateau has significantly decreased, with an increase in altitude [9,10]. In contrast, species in low-altitude regions may experience an expansion in their distribution ranges, albeit at a relatively slower migration rate [11,12]. Research on three congeneric species of Bergenia distributed at different altitudes has found that the upslope migration rate of the high-altitude species Bergenia purpurascens is much higher than that of the low-altitude species Bergenia ciliata [13]. This indicates that high-altitude plants are more susceptible to climate change than their low-altitude counterparts. For species with broad distributions across altitudes, whether the distribution pattern differences between high-altitude and low-altitude populations are similar to those between high-altitude and low-altitude species remains unclear. The use of delineated ecoregions as training units within the model allows for the division of a species’ range into different populations, which in turn facilitates the subsequent tracking of individual populations under climate change projections [14]. Investigating the potential habitat changes of populations of the same species in different regions is extremely important for the development of biodiversity conservation and ecosystem management strategies.
Hippuris vulgaris is a perennial herbaceous plant that belongs to the genus Hippuris under the Plantaginaceae family [15], widely distributed along the margins of ponds, lakes, streams, and ditches in the Northern Hemisphere from 0 to 5,000 meters altitude [16]. Meanwhile, as one of the most cold-tolerant emergent aquatic plants globally, it forms monodominant communities in plateau wetlands above 3,000 meters altitude [17,18], playing an extremely important role in maintaining the structural stability and functional integrity of these ecosystems [19]. Additionally, it is a key component of Tibetan and Mongolian traditional medicines, used as an endemic Chinese medicine to cure tuberculosis and cough [20]. As a species with broad altitudinal distribution, Hippuris vulgaris exhibits strong adaptability to environmental changes [21], which also implies the existence of intraspecific trait variation across different altitudinal habitats [22]. This variation may lead to differences in the distribution patterns of Hippuris vulgaris populations at different altitudes under climate change. Therefore, understanding these differences is crucial for targeted species conservation and ecosystem restoration in specific regions.
Species distribution modeling (SDM) is employed as the primary method to simulate suitable habitat areas and predict distribution changes based on environmental variables [4]. The maximum entropy model (MaxEnt), one of the most frequently used niche models, uses maximum entropy to calculate the potential geographical distribution of species, with the advantages of small distortion, good stability and simple operation. In addition, because the MaxEnt model can accurately predict the future potential geographical distribution areas of species and visualize the spatial pattern changes in the suitable areas of species, it has been widely used to explore the potential distribution areas of species [23]. In this study, we utilized the MaxEnt (maximum entropy) model to construct three population distribution models for Hippuris vulgaris: a high-altitude distribution model, a low-altitude distribution model, and an integrated distribution model, thereby simulating the suitable habitat for Hippuris vulgaris under current conditions and future periods based on occurrence records and climatic variables. Specifically, we aimed to: (1) identify the most important bioclimatic variables affecting the distribution of Hippuris vulgaris; (2) characterize the current suitable habitat of Hippuris vulgaris in Asia; and (3) determine variations in the distribution and change trends of potential suitable habitats for Hippuris vulgaris in different altitudinal models.
2. Materials and Methods
2.1. Collection and Processing of Distribution Records
The distribution data for Hippuris vulgaris were primarily obtained from the Global Biodiversity Information Facility (GBIF, http://www.gbif.org/), the Chinese Virtual Herbarium (CVH, http://www.cvh.ac.cn/), the iPlant Species Information System (iPlant, http://www. iplant.cn/), and supplemented with relevant domestic and international literature and field investigations. We verified occurrence records of Hippuris vulgaris, records not located in Asia were excluded. To eliminate sampling bias, the obtained distribution points were organized into a CSV file format by species name, longitude, and latitude, and then imported into ArcMap 10.6 to overlay with the environmental variables used. Distribution data outside the range of environmental variables were removed. To minimize the interference of spatial autocorrelation in model construction, the distribution data were filtered using the Wallace platform in R 4.2.2 [24], ensuring that only one occurrence point was retained within each 2.5 min × 2.5 min grid cell [25,26]. Ultimately, 800 valid distribution records of Hippuris vulgaris across the Asian continent were obtained. Based on elevation, distribution points above 1,000 meters were defined as high-altitude occurrences, resulting in 396 valid points, while those below 1,000 meters were defined as low-altitude occurrences, yielding 404 valid points (Figure 1).
2.2. Environmental Variable Selection
In this study, 19 bioclimatic variables from the WorldClim database (https://www.worldclim.org/) were used for model analysis (Table 1) at a resolution of 2.5 arc minutes. The bioclimatic variables for the future periods were available for 2041–2060 (the 2050s) and 2061–2080 (the 2070s). The Global Change model (BCC-CSM 2-MR) climate system model in the Sixth International Coupled Model Comparison Plan (CMIP 6) was selected, including shared socioeconomic pathways (SSPs) and representative concentration pathways (RCP), and the general development pathway SSP2-RCP4.5 (SSP245), namely the combined scenario of moderate radiative forcing and moderate social vulnerability. This scenario assumes that global CO2 emissions remain at current levels until mid-century, then begin to decline but do not reach zero by the end of the century. Concurrently, global economic development follows historical trends without significant changes, resulting in a temperature increase of 2.7°C by the end of the century [27].
The environmental data were first transformed into the ASC format required for the MaxEnt model. To avoid multicollinearity caused by 19 bioclimatic variables and overfitting the model, multiple linear correlation analysis was conducted on the environmental variables used by the model, and the correlation coefficient between environmental variables combined with the contribution rate of environmental variables was used as the basis for screening[28,29]. The “Band Collection Statistics” tool in ArcMap 10.6 was used to analyz the correlation of 19 environmental variables, and an absolute value of correlation coefficient | r |> 0.8 was selected as the standard for strong correlation between environmental variables. Then, the 19 environmental variables were imported into the MaxEnt model for the trial run, and environmental variables with higher contribution rates were retained when the absolute value of correlation coefficient | r |> 0.8. By these methods, eight bioclimatic variables—bio1, bio2, bio3, bio7, bio8, bio13, bio15, and bio19— were selected for use in the integrated distribution model and the high-altitude distribution model, bio2, bio3, bio7, bio8, bio9, bio13, bio15, and bio17 were selected for use in the low-altitude distribution model.
2.3. Model Optimization and Accuracy Evaluation
To enhance the accuracy of the MaxEnt model predictions, the distribution model of Hippuris vulgaris was optimized using the Wallace Species Distribution Platform in R 4.2.2. The optimal Regularization Multiplier (RM) and Feature Combination (FC) were selected. In Wallace, the range of RM was set from 0.5 to 4.0 with an interval of 0.5. The FC options included: H (hinge, fragmented), L (linear), LQ (linear and quadratic), LQH (linear, quadratic, and hinge), and LQHP (linear, quadratic, hinge, and product). Delta.AICc is a model evaluation metric, and the model with the lowest delta.AICc value among the candidate models is determined as the optimal model[30,31]. Based on the lowest delta.AICc values from the Wallace calculations, the optimal RM and FC were chosen for the three models: for the high-altitude distribution model, RM = 3 and FC = LQHP; for the low-altitude distribution model, RM = 0.5 and FC = LQ; for the integrated distribution model, RM = 3.5 and FC = LQHP.
Other Parameters Settings were as follows: Model training was performed using 75% of the distribution data, and the remaining 25% of the data were used for model testing. The maximum number of background points was set to 10,000. The running process was repeated 10 times using bootstrap as the replicated run type, and the average result was taken as the final output.The replication mode was set to choose Cross-validation. The maximum number of iterations was set to 1000.The 10th percentile training presence threshold rule was selected to delineate suitable and unsuitable habitats. Other settings were left at their default values.
The accuracy of the model was evaluated using the area under the receiver operating characteristic (ROC) curve (AUC), which ranges from 0 to 1. We evaluated the model’s accuracy using the average test AUC value from 10 repeated runs. In general, an AUC > 0.90 is considered excellent, between 0.80 and 0.90 good, between 0.70 and 0.80 fair, and < 0.70 poor [32,33].
2.4. Classification of Suitable Habitat and Centroid Distribution
The threshold for delineating unsuitable and suitable habitats was set at the 10th percentile training presence logistic mean value (0.3) after 10 runs. To facilitate display, we categorized the distribution maps for different periods into different levels, following the classification system for assessing likelihood in the Sixth IPCC Report. We designated regions with a species occurrence probability of 0.7–1 as high-suitability areas, 0.5–0.7 as medium-suitability areas, 0.3–0.5 as low-suitability areas, and below 0.3 as unsuitable areas. [34,35]. For each distribution model, the suitable habitat distribution areas were calculated for different periods. Reclassification was then performed to generate change distribution maps and centroid migration maps for these periods.
3. Results
3.1. Model Validation, Dominant bioclimatic variables and Response Curves
The AUC values for the high-altitude distribution model, low-altitude distribution model, and integrated distribution model were 0.919, 0.797, and 0.799, respectively, indicating excellent or good levels and suggesting that the models were effective in simulating the suitable habitat for Hippuris vulgaris.
For the high-altitude distributed population, the bioclimatic variables with significant impacts on distribution are bio3 (isothermality), bio1 (annual mean temperature), and bio19 (precipitation of coldest quarter) (Figure 2). The high-altitude distributed population shows a relatively suitable range of isothermality from 31.25 to 41.8, a suitable range of annual mean temperature from -0.02 to 8.84°C, and a suitable range of precipitation of coldest quarter from 2.32 to 16.24 mm. The response curves of the high-altitude distributed population to these three bioclimatic variables all exhibit a “unimodal” pattern, initially increasing and then decreasing (Figure 3).
For the low altitude-distributed population, the bioclimatic variables with significant impacts on distribution are bio3 (isothermality), bio9 (mean temperature of driest quarter), and bio13 (precipitation of wettest month) (Figure 2). The low-altitude distributed population shows a relatively suitable range of isothermality from 19.25 to 27.47, a suitable range of mean temperature of driest quarter from -20.03 to -1.95°C, and a suitable range of precipitation of wettest month from 83.32 to 256.67 mm. The response curves of the low-altitude distributed population to these three bioclimatic variables also exhibit a “unimodal” pattern, initially increasing and then decreasing (Figure 4).
For the integrated distribution population, the bioclimatic variables with significant impacts on distribution are bio1 (annual mean temperature), bio13 (precipitation of wettest month), and bio19 (precipitation of coldest quarter) (Figure 2). The integrated distribution population shows a relatively suitable range of annual mean temperature from -2.12 to 9.72°C, a suitable range of precipitation of wettest month from 87.92 to 207.23 mm, and a suitable range of precipitation of coldest quarter from 2.78 to 20.224 mm and from 389.56 to 695.2 mm.
3.2. Distribution and Trends of Potential Suitable habitats
The simulated results showed that the main suitable habitat for the high-altitude distributed Hippuris vulgaris is primarily located in the Tibetan Plateau, Mongolian Plateau, Inner Mongolia Plateau, Pamir Plateau, and the Tianshan and Altai Mountains under current conditions. Comparing the suitable habitat areas and distributions between the current and future periods reveals that the suitable habitat area for plateau-distributed Hippuris vulgaris increases by 19.66% in the 2050s but decreases by 47.75% in the 2070s (Figure 6). The increased regions are primarily located in the southwestern and northwestern parts of the Tibetan Plateau, Pamir Plateau and northwestern Mongolian Plateau. In the 2070s, the suitable habitat area decreases significantly, with a sharp contraction in the Mongolian Plateau, Inner Mongolia Plateau and the southern edge of the Hengduan Mountains.The highly suitable habitat area increases to some extent in both future periods, primarily concentrated along the southern edge of the Tibetan Plateau and the Hengduan Mountains. The centroid migration results show an overall shift of the suitable habitat of high-altitude distributed Hippuris vulgaris towards higher latitudes and altitudes. Compared to the current period, the centroid in the 2050s shifts 343.87 km northwestward from Delingha City in Haixi, Qinghai, to a higher latitude. In the 2070s, the centroid shifts to Golmud City in Haixi, moving 431.44 km southwestward (Figure 7, Figure 8).
The low-altitude-distributed Hippuris vulgaris is currently mainly concentrated in the Northeast China Plain, the northern part of the North China Plain, low-altitude areas of Daxing Anling, Mongolian Plateau and Inner Mongolia Plateau, as well as the West Siberian Plain and the North Siberian Plain in Russia. Comparing the suitable habitat areas and distributions between the current and future periods reveals that the suitable habitat area for low-altitude-distributed Hippuris vulgaris will increase significantly with climate change. The suitable habitat area increases by 99.71% in the 2050s and by 13.29% in the 2070s (Figure 6). The increased areas mainly expand sharply around the current distribution areas, with substantial growth in high, medium, and low suitability zones, especially the high suitability zone, which expands by about 4.37 times. This expansion mainly extends eastward from the Northeast low-altitude areas to the Changbai Mountains, the northern part of the Korean Peninsula, and the western part of the Japanese archipelago; westward to the Greater Khingan Range and the Inner Mongolia Plateau; and southward to the northern part of the North China low-altitude area and the Taihang Mountains. The low suitability zone mainly expands westward and eastward from the West Siberian low-altitude areas, connecting with the medium and high suitability zones in Central Asia, forming a continuous area. The expansion trend indicates that by the 2070s, low-altitude-distributed Hippuris vulgaris will gradually migrate to higher altitude areas. The centroid migration results also show an overall shift of the suitable habitat of low-altitude-distributed Hippuris vulgaris towards higher latitudes and altitudes. Compared to the current period, the distribution center of Hippuris vulgaris will continuously move northwestward from the southwest of Hulunbuir in Inner Mongolia. In the 2050s, it will move 550.32 km northwestward, and in the 2070s, it will move 206.22 km northward (Figure 9, Figure 10).
The integrated distribution model indicates that the current potential distribution of Hippuris vulgaris is primarily concentrated in the central part of the Asian continent, within the range of 75°–142°E and 27°–56°N. Comparing the suitable habitat areas and distributions between the current and future periods reveals that the trend in the change of suitable habitat area and suitability value for the integrated distribution of Hippuris vulgaris is consistent with that of the high-altitude distribution, with an increase in the 2050s and a decrease in the 2070s (Figure 6). In the 2050s, the high, medium, and low suitability zones all increase, characterized by expansion towards higher latitudes. In the 2070s, the low suitability zone significantly decreases. The high suitability zones for Hippuris vulgaris are concentrated in the southwestern part of the Tibetan Plateau and the southeastern Hengduan Mountains. The increased areas shift towards higher latitudes and altitudes. The centroid migration results show an overall shift of the suitable habitat for Hippuris vulgaris towards higher northern latitudes. Compared to the current period, the distribution center of Hippuris vulgaris moves 443.60 km northwestward in the 2050s from Ordos in Inner Mongolia, and 337.20 km southeastward in the 2070s (Figure 11, Figure 12).
4. Discussion
4.1. Differences in Crucial bioclimatic Variables Across Various Models
In freshwater habitats, climatic variables are fundamental controlling factors for physiological metabolism and the rates of biological processes, determining the distribution and abundance of aquatic plants [36]. Among the three models, temperature factors were the most important environmental factors determining the distribution pattern of Hippuris vulgaris, followed by precipitation factors. This is similar to the findings in studies of terrestrial and wetland herbaceous plants such as Solanum Nigrum [37], Corydalis species [38] and Alternanthera Philoxeroides [39]. In the integrated distribution model, the environmental variable with the highest contribution rate was the annual mean temperature, with suitable values ranging from -2.12°C to 9.72°C, reflecting its adaptation to cold environments. The precipitation in wettest month and the precipitation in coldest quarter are climatic factors reflecting water requirements under humid-hot and dry-cold conditions. The suitable values indicate that the water requirement of Hippuris vulgaris, in wet and hot conditions, rainfall should not be too high, while in dry and cold conditions, it depends on a certain amount of rainfall to replenish water. This is consistent with the ecological characteristics of Hippuris vulgaris, which is relatively small in stature and is only suitable for growth in shallow water areas such as marshes, wetlands, lakes, streams, and the banks of rivers [21], and is extremely vulnerable to fluctuations in water levels [40,41]. In the integrated distribution model, the presence of two suitable ranges of rainfall in the coldest season suggests that Hippuris vulgaris has undergone niche differentiation across different regions.
Plants can adjust their ecological strategies to adapt to different climatic conditions, which is reflected in the significant altitudinal dependence of ecological traits in species with broad altitudinal distributions [42]. The threshold values of crucial bioclimatic variables influencing the distribution of Hippuris vulgaris show significant differences between the two altitudinal populations. In both the high-altitude and low-altitude distribution models, the highest contributing biocliamtic variable is isothermality. Higher isothermality indicates larger diurnal temperature ranges and smaller annual temperature ranges [43]. The suitable value range of Hippuris vulgaris in the high-altitude distribution area is significantly higher than that of the low-altitude population, and is close to that of the Tibetan Plateau endemic species Swertia przewalskii [44]. This suggests that high-altitude and low-altitude populations of Hippuris vulgaris have undergone intraspecific differentiation to adapt to different climatic conditions, with the low-altitude population adapting to regions with larger annual temperature ranges and smaller diurnal temperature differences.
In addition to isothermality, the other two dominant bioclimatic variables differ between the two models. For the high-altitude distribution model, they are annual mean temperature and precipitation in coldest quarter, while for the low-altitude distribution model, they are mean temperature in driest quarter and precipitation in wettest quarter. The suitable range of annual mean temperature for high-altitude-distributed Hippuris vulgaris is slightly lower than that in the integrated distribution model, indicating a stronger adaptation to cold climates [17]. The distribution area of high-altitude-distributed Hippuris vulgaris is mainly characterized by alpine plateau climates, with arid and low-rainfall conditions. During the dry and cold season, Hippuris vulgaris relies on a certain amount of rainfall for water supply, making precipitation in coldest quarter a limiting factor for high-altitude-distributed Hippuris vulgaris. The distribution area of low- altitude-distributed Hippuris vulgaris mostly ranges within the temperate continental climate and temperate monsoon zones, characterized by extreme annual temperature range, cold and dry winters and scarce precipitation. Although Hippuris vulgaris overwinters in the form of underground rhizomes, the long and extremely cold winters mean that the mean temperature of driest quarter remains a key factor influencing its distribution. In contrast, during the wettest summer months, when precipitation is concentrated, the small stature of Hippuris vulgaris leads to its gradual death in deep water areas [40,41]. Therefore, precipitation in wettest month is an important factor affecting its distribution.
4.2. Distribution Pattern and Trends of the Suitable Habitat
The results from the integrated altitude distribution model and high altitude distribution model indicated that potential suitable habitats of Hippuris vulgaris initially expand and then contract under the climate change scenarios, with populations primarily migrating towards high altitude regions. The high-suitability areas are all located to the west and north of the Hu Huanyong Line (Heihe-Tengchong Line). Many studies have shown that under global climate change, alpine species are shrinking their habitat and migrating to higher altitudes [11,45,46]. Potential suitable areas of Carex moorcroftii, Stipa purpurea, Meconopsis punicea and most endimice wetland plants on the Qinghai-Tibet Plateau have decreased [10,47,48]. Distribution changes of 171 forest species in Western Europe over the past century indicated that climate warming has led to an average increase of 29 meters per decade in the optimal altitude of species [49]. Hippuris vulgaris responds to climate change in a manner consistent with these plants, expanding their ecological niches upwards to track their climatic niches [50,51]. In the 2050s, the expansion of the distribution range of Hippuris vulgaris in high-altitude areas is likely to be closely associated with the enlargement of lake surfaces in these regions [52] and the upward shift of the ecological niche suitable for the growth of aquatic plants. As climate warming persists and progresses over time, the distribution of Hippuris vulgaris in high-altitude regions is expected to gradually contract due to the uneven spatiotemporal distribution of increased precipitation trends at high altitudes [53] and limitations in colonization space [8].
In contrast, Hippuris vulgaris in the low-altitude distribution areas showed a significant expansion trend, with populations continuously migrating towards higher latitudes. Current studies show that in the mid- and high-latitude regions of the Northern Hemisphere, the area of aquatic vegetation in lakes has shown a significant expansion trend over the past 40 years[54]. Under future climate scenarios, the distribution area of aquatic plants may also increase significantly, the suitable habitat area of Hydrocharis dubia and Hydrocharis morsus-ranae is projected to significantly increase and shift towards higher latitudes [55], Elodea densa, Myriophyllum aquaticum, and Ludwigia spp. are anticipated to expand their invasive ranges as their distribution moves toward higher latitudes in Europe and North America [56]. The expansion trend may driven by climate warming, permafrost thawing, shortened ice-cover periods of lakes [57].
Conclusions
In this study, populations of Hippuris vulgaris on the Asian continent were distinguished into high-altitude and low-altitude distribution groups, and independent test datasets were used to model each population separately, with the aim of more accurately predicting the species’ distribution across different geographical regions. The results indicate that there are differences in the key bioclimatic variables and suitable values affecting the distribution of sea buckthorn populations in high and low-altitude regions.Furthermore, the shifts in suitable habitats for these two populations are anticipated to take entirely opposite directions under future climate change scenarios.Specifically, the migration trends indicate a propensity for these populations to move towards areas of higher altitude and increased latitude.
In response to the formidable challenges posed by climate change, as well as the intense competition resulting from the altitudinal migration of lowland species to higher elevations, the ecological niche of Hippuris vulgaris in high-altitude regions may be further compressed, potentially leading to a further contraction in its distribution range. In these areas, it is highly necessary to closely monitor the dynamics of wetland vegetation and to enhance the conservation and restoration efforts for Hippuris vulgaris.In the low-altitude regions, the distribution of Hippuris vulgaris may undergo significant expansion. It is crucial to focus on monitoring the dynamics of wetland vegetation in low-altitude areas with high latitudes and to enhance the surveillance and management of Hippuris vulgaris.
Author Contributions
Conceptualization: J.X., H.G.and Q.L.; Methodology: Q.L., J.X. and W.Y; Software: J.M. and W.Y.; Formal Analysis: J.X. and Q.L.; Data Curation: J.X., J.M. and K.T.; Visualization: J.X. and J.M.; Writing—Original Draft: J.X.; Writing—Review and Editing: J.X., Q.L.and K.T.; Supervision: H.G.; Project Administration: H.G.. All authors have read and approved the final manuscript.
Funding
This study was supported by the Foundation of the Key Laboratory of Plateau Wetland Conservation, Restoration and Ecological Services of Yunnan Province (202105AG070002).
Data Availability Statement
Data are contained within the article.
Conflicts of Interest
The authors declare no conflict of interest.
References
- Woodward, F.I.; Lomas, M.R.; Kelly, C.K. Global climate and the distribution of plant biomes. Philosophical transactions of the Royal Society of London. Series B, Biological sciences 2004, 359, 1465–1476. [Google Scholar] [CrossRef] [PubMed]
- Pearson, R.G.; Dawson, T.P. Predicting the impacts of climate change on the distribution of species: are bioclimate envelope models useful? Global Ecology and Biogeography 2003, 12, 361–371. [Google Scholar] [CrossRef]
- Zhu, G.; Liu, Q.; Bu, W.; Gao, Y. Ecological niche modeling and its applications in biodiversity conservation. Biodiversity Science 2013, 21, 90–98. [Google Scholar]
- Sandhya Kiran, G.; Prajapati, P.C.; Mohanta, A. A systematic appraisal of ecological niche modelling in the context of phytodiversity conservation. Environment, Development and Sustainability 2024. [Google Scholar] [CrossRef]
- Roberts, D.R.; Hamann, A.J.E. Method selection for species distribution modelling: are temporally or spatially independent evaluations necessary? Ecography 2012, 35, 792–802. [Google Scholar] [CrossRef]
- Piao S L; Zhang X Z; Wang T; et al. Responses and feedback of the Tibetan Plateau’s alpine ecosystem to climate change. Chinese Science Bulletin 2019, 64, 2842–2855. [Google Scholar] [CrossRef]
- Chen, J.; Yang, Y.; Sun, H. Advances in the Studies of Responses of Alpine Plants to Global Warming*. Chinese Journal of Appplied Environmental Biology 2012, 17, 435–446. [Google Scholar] [CrossRef]
- Parmesan, C. Ecological and Evolutionary Responses to Recent Climate Change. Annu. Rev. Ecol. Evol. Syst. 2006, 37, 637–669. [Google Scholar] [CrossRef]
- Li, R.; Fan, J.; Zhao, Q.; Li, T.; Wang, C.; Ding, R.; Gu, R.; Zhong, S. Estimation of habitat suitability and climatic distribution change of Pegaeophyton scapiflorum based on the MaxEnt model. Journal of Nanjing Forestry University (Natural Science Edition) 2024, 48, 173–180. [Google Scholar]
- Liu, W.; Zeng, J.Y.W.; Qi, D. Prediction of the eographical distribution of Carex moorcroftii under global climate change based on MaxEnt model. Chinese Journal of Grassland 2018, 40, 43–49. [Google Scholar]
- Chen, I.-C.; Hill, J.K.; Ohlemüller, R.; Roy, D.B.; Thomas, C.D.J.S. Rapid Range Shifts of Species Associated with High Levels of Climate Warming. Science 2011, 333, 1024–1026. [Google Scholar] [CrossRef] [PubMed]
- Walther, G.-R.; Post, E.; Convey, P.; Menzel, A.; Parmesan, C.; Beebee, T.J.C.; Fromentin, J.-M.; Hoegh-Guldberg, O.; Bairlein, F. Ecological responses to recent climate change. Nature 2002, 416, 389–395. [Google Scholar] [CrossRef]
- Qiu, L.; Fu, Q.-L.; Jacquemyn, H.; Burgess, K.S.; Cheng, J.-J.; Mo, Z.-Q.; Tang, X.-D.; Yang, B.-Y.; Tan, S.-L. Contrasting range changes of Bergenia (Saxifragaceae) species under future climate change in the Himalaya and Hengduan Mountains Region. Theoretical and Applied Climatology 2023, 155, 1927–1939. [Google Scholar] [CrossRef]
- Gray, L.K.; Hamann, A. Strategies for Reforestation under Uncertain Future Climates: Guidelines for Alberta, Canada. PLOS ONE 2011, 6, e22977. [Google Scholar] [CrossRef] [PubMed]
- Albach, D.C.; Meudt, H.M.; Oxelman, B. Piecing Together the “New” Plantaginaceae. American Journal of Botany 2005, 92, 297–315. [Google Scholar] [CrossRef]
- Wu, Z. Flora of China; Science Press: Beijing, 1993. [Google Scholar]
- Wang, D. The Geography of aquatic vascular plants of Qinghai-Xizang(Tibet) Plateau. Doctor, Wuhan University, 2003.
- Chen, J.; Du, Z.-Y.; Sun, S.-S.; Gituru, R.; Wang, Q.-F. Chloroplast DNA Phylogeography Reveals Repeated Range Expansion in a Widespread Aquatic Herb Hippuris vulgaris in the Qinghai-Tibetan Plateau and Adjacent Areas. PloS one 2013, 8, e60948. [Google Scholar] [CrossRef]
- Pan, Y.; García-Girón, J.; Iversen, L.L. Global change and plant-ecosystem functioning in freshwaters. Trends in Plant Science 2023, 28, 646–660. [Google Scholar] [CrossRef]
- Shang, X.; Tao, C.; Miao, X.; Wang, D.; Tang, m.; Da, w.; Wang, Y.; Yang, Y.; Pan, H. Ethno-veterinary survey of medicinal plants in Ruoergai region, Sichuan province, China. Ethnopharmacol 2012, 142. [Google Scholar] [CrossRef] [PubMed]
- Lu, Q.X.; Zhu, J.; Yu, D.; Xu, X. Genetic and geographical structure of boreal plants in their southern range: phylogeography of Hippuris vulgaris in China. BMC Evol Biol 2016, 16, 34–40. [Google Scholar] [CrossRef]
- Rixen, C.; Wipf, S.; Rumpf, S.B.; Giejsztowt, J.; Millen, J.; Morgan, J.W.; Nicotra, A.B.; Venn, S.; Zong, S.; Dickinson, K.J.M.; et al. Intraspecific trait variation in alpine plants relates to their elevational distribution. Journal of Ecology 2022, 110, 860–875. [Google Scholar] [CrossRef]
- LI, S.; MO, S.; HU, X.; DENG, T. Prediction of potential suitable areas of endangered plant Abies ziyuanensis based on MaxEnt and ArcGIS. Chinese journal of Ecology 2024, 43, 533–541. [Google Scholar]
- Kass, J.M.; Vilela, B.; Aiello-Lammens, M.E.; Muscarella, R.; Merow, C.; Anderson, R.P. Wallace: A flexible platform for reproducible modeling of species niches and distributions built for community expansion. Methods in Ecology and Evolution 2018, 9, 1151–1156. [Google Scholar] [CrossRef]
- Betts, M.G.; Ganio, L.M.; Huso, M.M.P.; Som, N.A.; Huettmann, F.; Bowman, J.; Wintle, B.A. Comment on “Methods to account for spatial autocorrelation in the analysis of species distributional data: a review”. Ecography 2009, 32, 374–378. [Google Scholar] [CrossRef]
- Zhu, g.; Liu, q.; Gao, Y. Improving ecological niche model transferability to predict the potential distribution of invasive exotic species. Biodiversity Science 2014, 22, 223–230. [Google Scholar]
- Méndez, C.; Simpson, N.; Johnson, F.; Birt, A. Climate Change 2023: Synthesis Report (Full Volume) Contribution of Working Groups I, II and III to the Sixth Assessment Report of the Intergovernmental Panel on Climate Change; 2023.
- Zhang, H.; Zhao, H.X.; Wang, H. Potential geographical distribution of populus euphratica in China under future climate change scenarios based on Maxent model. Acta Ecologica Sinica 2020, 40, 6552–6563. [Google Scholar]
- K, Y.W.; Y, L.; L, W.; Y, Z.X.; Q, L. Effects of artificial introduction and climate change on the future distribution of Cyanopica cyanus. Acta Ecologica Sinica 2023, 43, 10387–10398. [Google Scholar]
- Kong, W.L., Xinhai; Zou, H. Optimizing MaxEnt model in the prediction of species distribution. Chinese Journal of Applied Ecology 2019, 30, 2116–2128. [Google Scholar]
- Li, M.; Zhang, Y.; Yang, Y.; Wang, T.; Wu, C.; Zhang, X. Prediction of Historical, Current, and Future Configuration of Tibetan Medicinal Herb Gymnadenia orchidis Based on the Optimized MaxEnt in the Qinghai–Tibet Plateau. Plants 2024, 13, 645. [Google Scholar] [CrossRef]
- Swets, J.A. Measuring the accuracy of diagnostic systems. Science 1988, 240 4857, 1285–1293. [Google Scholar] [CrossRef]
- Zhang, Z.; Yan, X.; Guo, C.; Dong, W.; Zhao, L.; Liu, D. Changes in the Suitable Habitat of the Smoke Tree (Cotinus coggygria Scop.), a Species with an East Asian–Tethyan Disjunction. Plants 2025, 14. [Google Scholar] [CrossRef]
- Chen, Y.-g.; Le, X.-g.; Chen, Y.-h.; Cheng, W.-x.; Du, J.-g.; Zhong, Q.-l.; Cheng, D.-l. Identification of the potential distribution area of Cunninghamia lanceolata in China under climate change based on the MaxEnt model. Chinese Journal of Applied Ecology 2022, 33, 1207–1214. [Google Scholar]
- Fan, Y.; Yao, W.; Wang, Z.; Fan, X.; Hu, S.; Wang, H.; Ou, J. Predicting Potential Suitable Habitats of Three Rare Wild Magnoliaceae Species (Michelia crassipes, Lirianthe coco, Manglietia insignis) Under Current and Future Climatic Scenarios Based on the Maxent Model. Plants 2025, 14. [Google Scholar] [CrossRef] [PubMed]
- Fu, H.; Yuan, G.; Li, W.; Ge, D.; Zou, D.; Huang, Z. Environmental effects on community productivity of aquatic macrophytes are mediated by species and functional composition. Ecohydrology 2019, 12, e2147. [Google Scholar] [CrossRef]
- Qi, K.Y.; Wang, X.L.; Su, Y.L.; Luo, Y.Y.; Sun, Z.L.; Xiong, M.; Zhou, L.Y. Prediction of suitable Solanum rostratum growth areas in Horqin Sandy Land based on the Maximum Entropy Model. Pratacultural Science 2024, 41, 1279–1287. [Google Scholar]
- Chen, C.H.; Longzhu, D.J.; Lu, X.W.; Songzha, C.; Miao, Q.; Sun, F.H.; Suonan, J. Habitat suitability of Corydalis based on the optimized MaxEnt model in China. Acta Ecologica Sinica 2023, 43, 10345–10362. [Google Scholar]
- Wei, Y.K.M., Y L; Zhu, G.P. Impact of global climate change on potential distributions of Alternanthera philoxeroides and Agasicles hygrophila. Journal of Tianjin Normal University(Natural Science Edition) 2023, 43, 28–33. [Google Scholar]
- Yu, D. Study on the dynamics and succession of aquatic macrophyte communities in the Zhushun Lake, Harbin. Acta Phytoecologica Sinica 1994, 18, 372–378. [Google Scholar]
- Sakurai, Y.; Yabe, K.; Katagiri, K. Factors controlling changes in the aquatic macrophyte communities from 1984 to 2009 in a pond in the cool-temperate zone of Japan. Limnology 2016. [Google Scholar] [CrossRef]
- Sigdel, S.R.; Zheng, X.; Babst, F.; Camarero, J.J.; Gao, S.; Li, X.; Lu, X.; Pandey, J.; Dawadi, B.; Sun, J.; et al. Accelerated succession in Himalayan alpine treelines under climatic warming. Nature Plants 2024, 10, 1909–1918. [Google Scholar] [CrossRef]
- Chen, P.; Shen, C.; Tao, Z.; Qin, W.; Huang, W.; Siemann, E. Deterministic responses of biodiversity to climate change through exotic species invasions. Nature Plants 2024, 10, 1464–1472. [Google Scholar] [CrossRef]
- Cao, Q.; Gao, Q.-B.; Guo, W.-J.; Zhang, Y.; Wang, Z.-H.; Ma, X.-L.; Zhang, F.-Q.; Chen, S.-L. Impacts of human activities and environmental factors on potential distribution of Swertia przewalskii Pissjauk., an endemic plant in Qing-Tibetan Plateau, using MaxEnt. Plant Science Journal 2021, 39, 22–31. [Google Scholar]
- VanDerWal, J.; Murphy, H.T.; Kutt, A.S.; Perkins, G.C.; Bateman, B.L.; Perry, J.J.; Reside, A.E. Focus on poleward shifts in species’ distribution underestimates the fingerprint of climate change. Nature Climate Change 2013, 3, 239–243. [Google Scholar] [CrossRef]
- Zu, K.; Wang, Z.; Zhu, X.; Lenoir, J.; Shrestha, N.; Lyu, T.; Luo, A.; Li, Y.; Ji, C.; Peng, S.; et al. Upward shift and elevational range contractions of subtropical mountain plants in response to climate change. The Science of the total environment 2021, 783, 146896. [Google Scholar] [CrossRef]
- HU, Z.-j.; ZHANG, Y.-l.; Yu, H.-b. Simulation of Stipa purpurea distribution pattern on Tibetan Plateau based on MaxEnt model and GIS. Chinese Journal of Applied Ecology 2015, 26, 505–511. [Google Scholar] [PubMed]
- Shi, N.; Naudiyal, N.; Wang, J.N.; Gaire, N.P.; Wu, Y.; Wei, Y.Q.; He, J.L.; Wang, C.Y. Assessing the Impact of Climate Change on Potential Distribution of Meconopsis punicea and Its Influence on Ecosystem Services Supply in the Southeastern Margin of Qinghai-Tibet Plateau. FRONTIERS IN PLANT SCIENCE 2022, 12. [Google Scholar] [CrossRef] [PubMed]
- Lenoir, J.; Gegout, J.C.; Marquet, P.A.; Ruffray, P.D.; Brisse, H.J.S. A significant upward shift in plant species optimum elevation during the 20th century. Science 2008, 320, 1768–1771. [Google Scholar] [CrossRef]
- Antão, L.H.; Weigel, B.; Strona, G.; Hällfors, M.; Kaarlejärvi, E.; Dallas, T.; Opedal, Ø.H.; Heliölä, J.; Henttonen, H.; Huitu, O.; et al. Climate change reshuffles northern species within their niches. Nature Climate Change 2022, 12, 587–592. [Google Scholar] [CrossRef]
- Wang, Y.; Pineda-Munoz, S.; McGuire, J.L. Plants maintain climate fidelity in the face of dynamic climate change. Proceedings of the National Academy of Sciences 2023, 120, e2201946119. [Google Scholar] [CrossRef]
- Cao, Z.; Zhang, Y.; Liu, Z.; Guan, B.; Lai, L.; Yang, Q.; Chen, X. Recent decade expansion of aquatic vegetation covering in china’s lakes. Ecological Indicators 2024, 159, 111603. [Google Scholar] [CrossRef]
- Wang, J.; Yao, Y.; Wang, Y.; Wang, S.; Liu, X.; Zhou, Y.; Du, H.; Zhang, Y.; Ren, Y. Meteorological Droughts in the Qinghai-Tibet Plateau:Research Progress and Prospects. Advances in Earth Science 2022, 37, 21. [Google Scholar]
- Liu, J.; Huang, H.; Hou, X.; Feng, L.; Pi, X.; Kyzivat, E.D.; Zhang, Y.; Woodman, S.G.; Tang, L.; Cheng, X.; et al. Expansion of aquatic vegetation in northern lakes amplified methane emissions. Nature Geoscience 2025. [Google Scholar] [CrossRef]
- Yang, J.; Fu, Z.; Xiao, K.; Dong, H.; Zhou, Y.; Zhan, Q. Climate Change Potentially Leads to Habitat Expansion and Increases the Invasion Risk of Hydrocharis (Hydrocharitaceae). Plants 2023, 12, 4124. [Google Scholar] [CrossRef] [PubMed]
- Gillard, M.; Thiebaut, G.; Deleu, C.; Leroy, B. Present and future distribution of three aquatic plants taxa across the world: decrease in native and increase in invasive ranges. Biological Invasions 2017, 19, 2159–2170. [Google Scholar] [CrossRef]
- Zhu, Z.; Piao, S.; Myneni, R.B.; Huang, M.; Zeng, Z.; Canadell, J.G.; Ciais, P.; Sitch, S.; Friedlingstein, P.; Arneth, A.; et al. Greening of the Earth and its drivers. Nature Climate Change 2016, 6, 791–795. [Google Scholar] [CrossRef]
Figure 1.
Occurrences of Hippuris vulgaris in Asia.
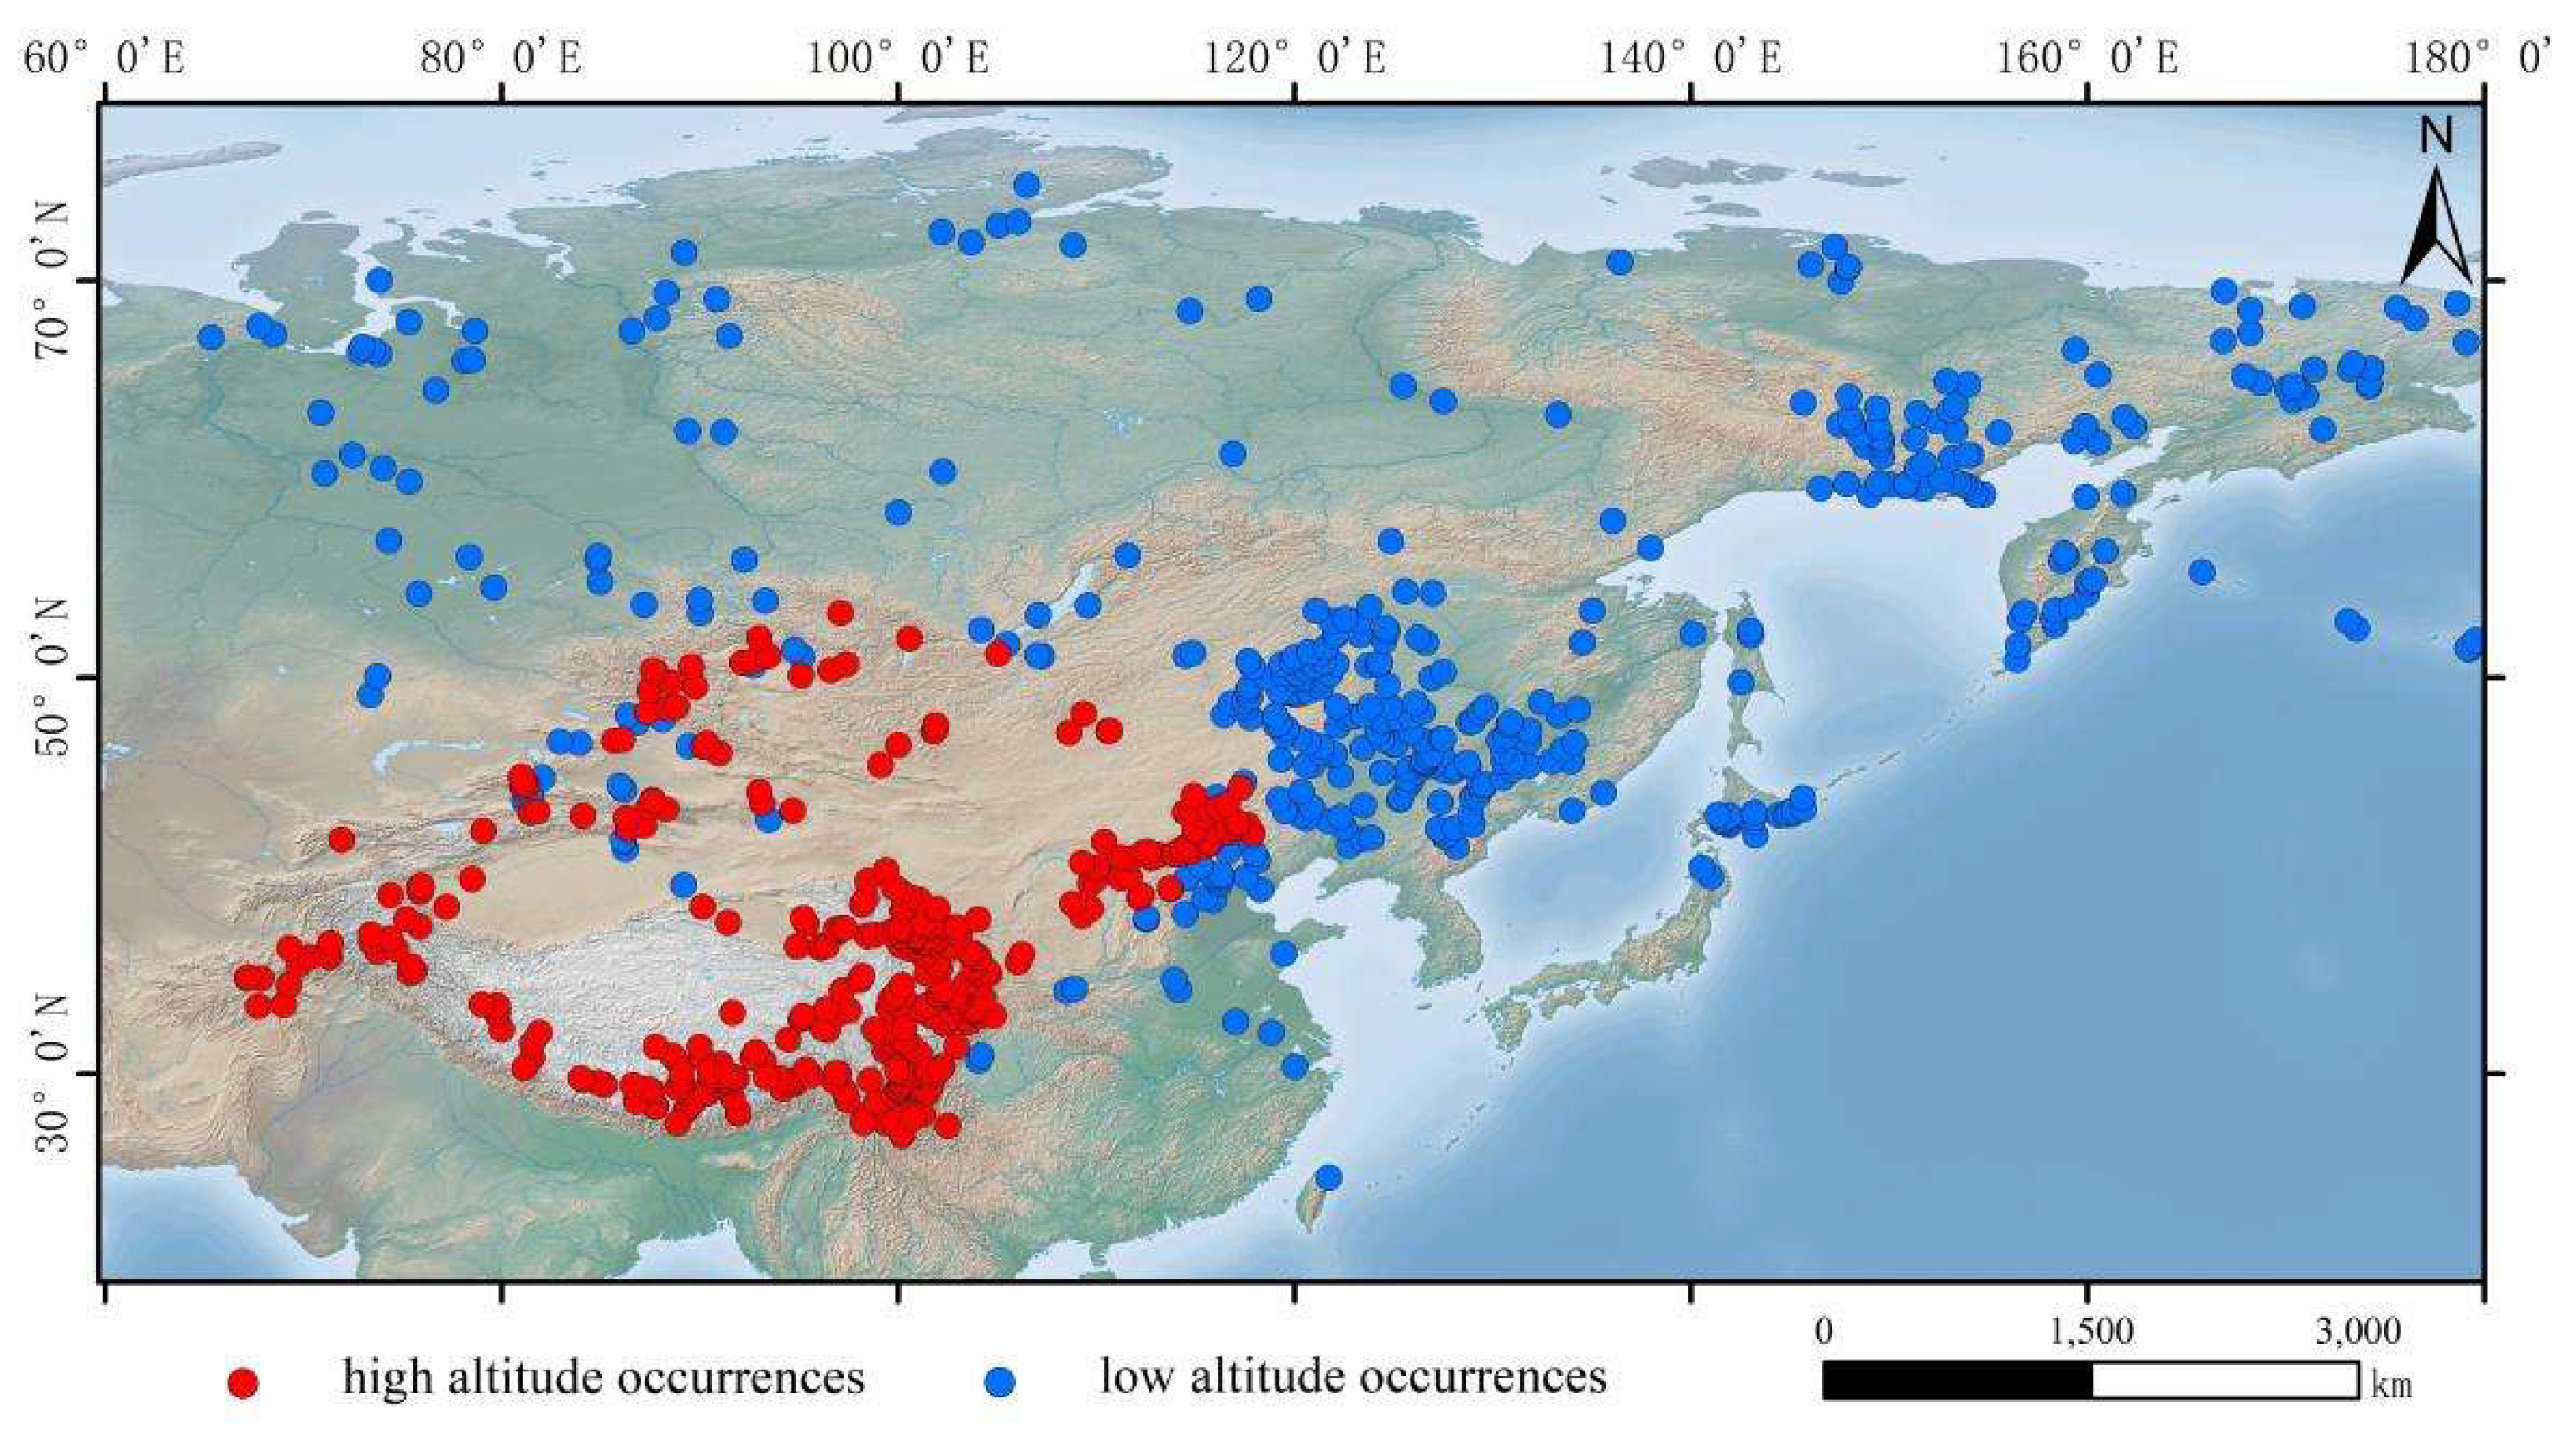
Figure 2.
Contribution rate of bioclimatic variables.
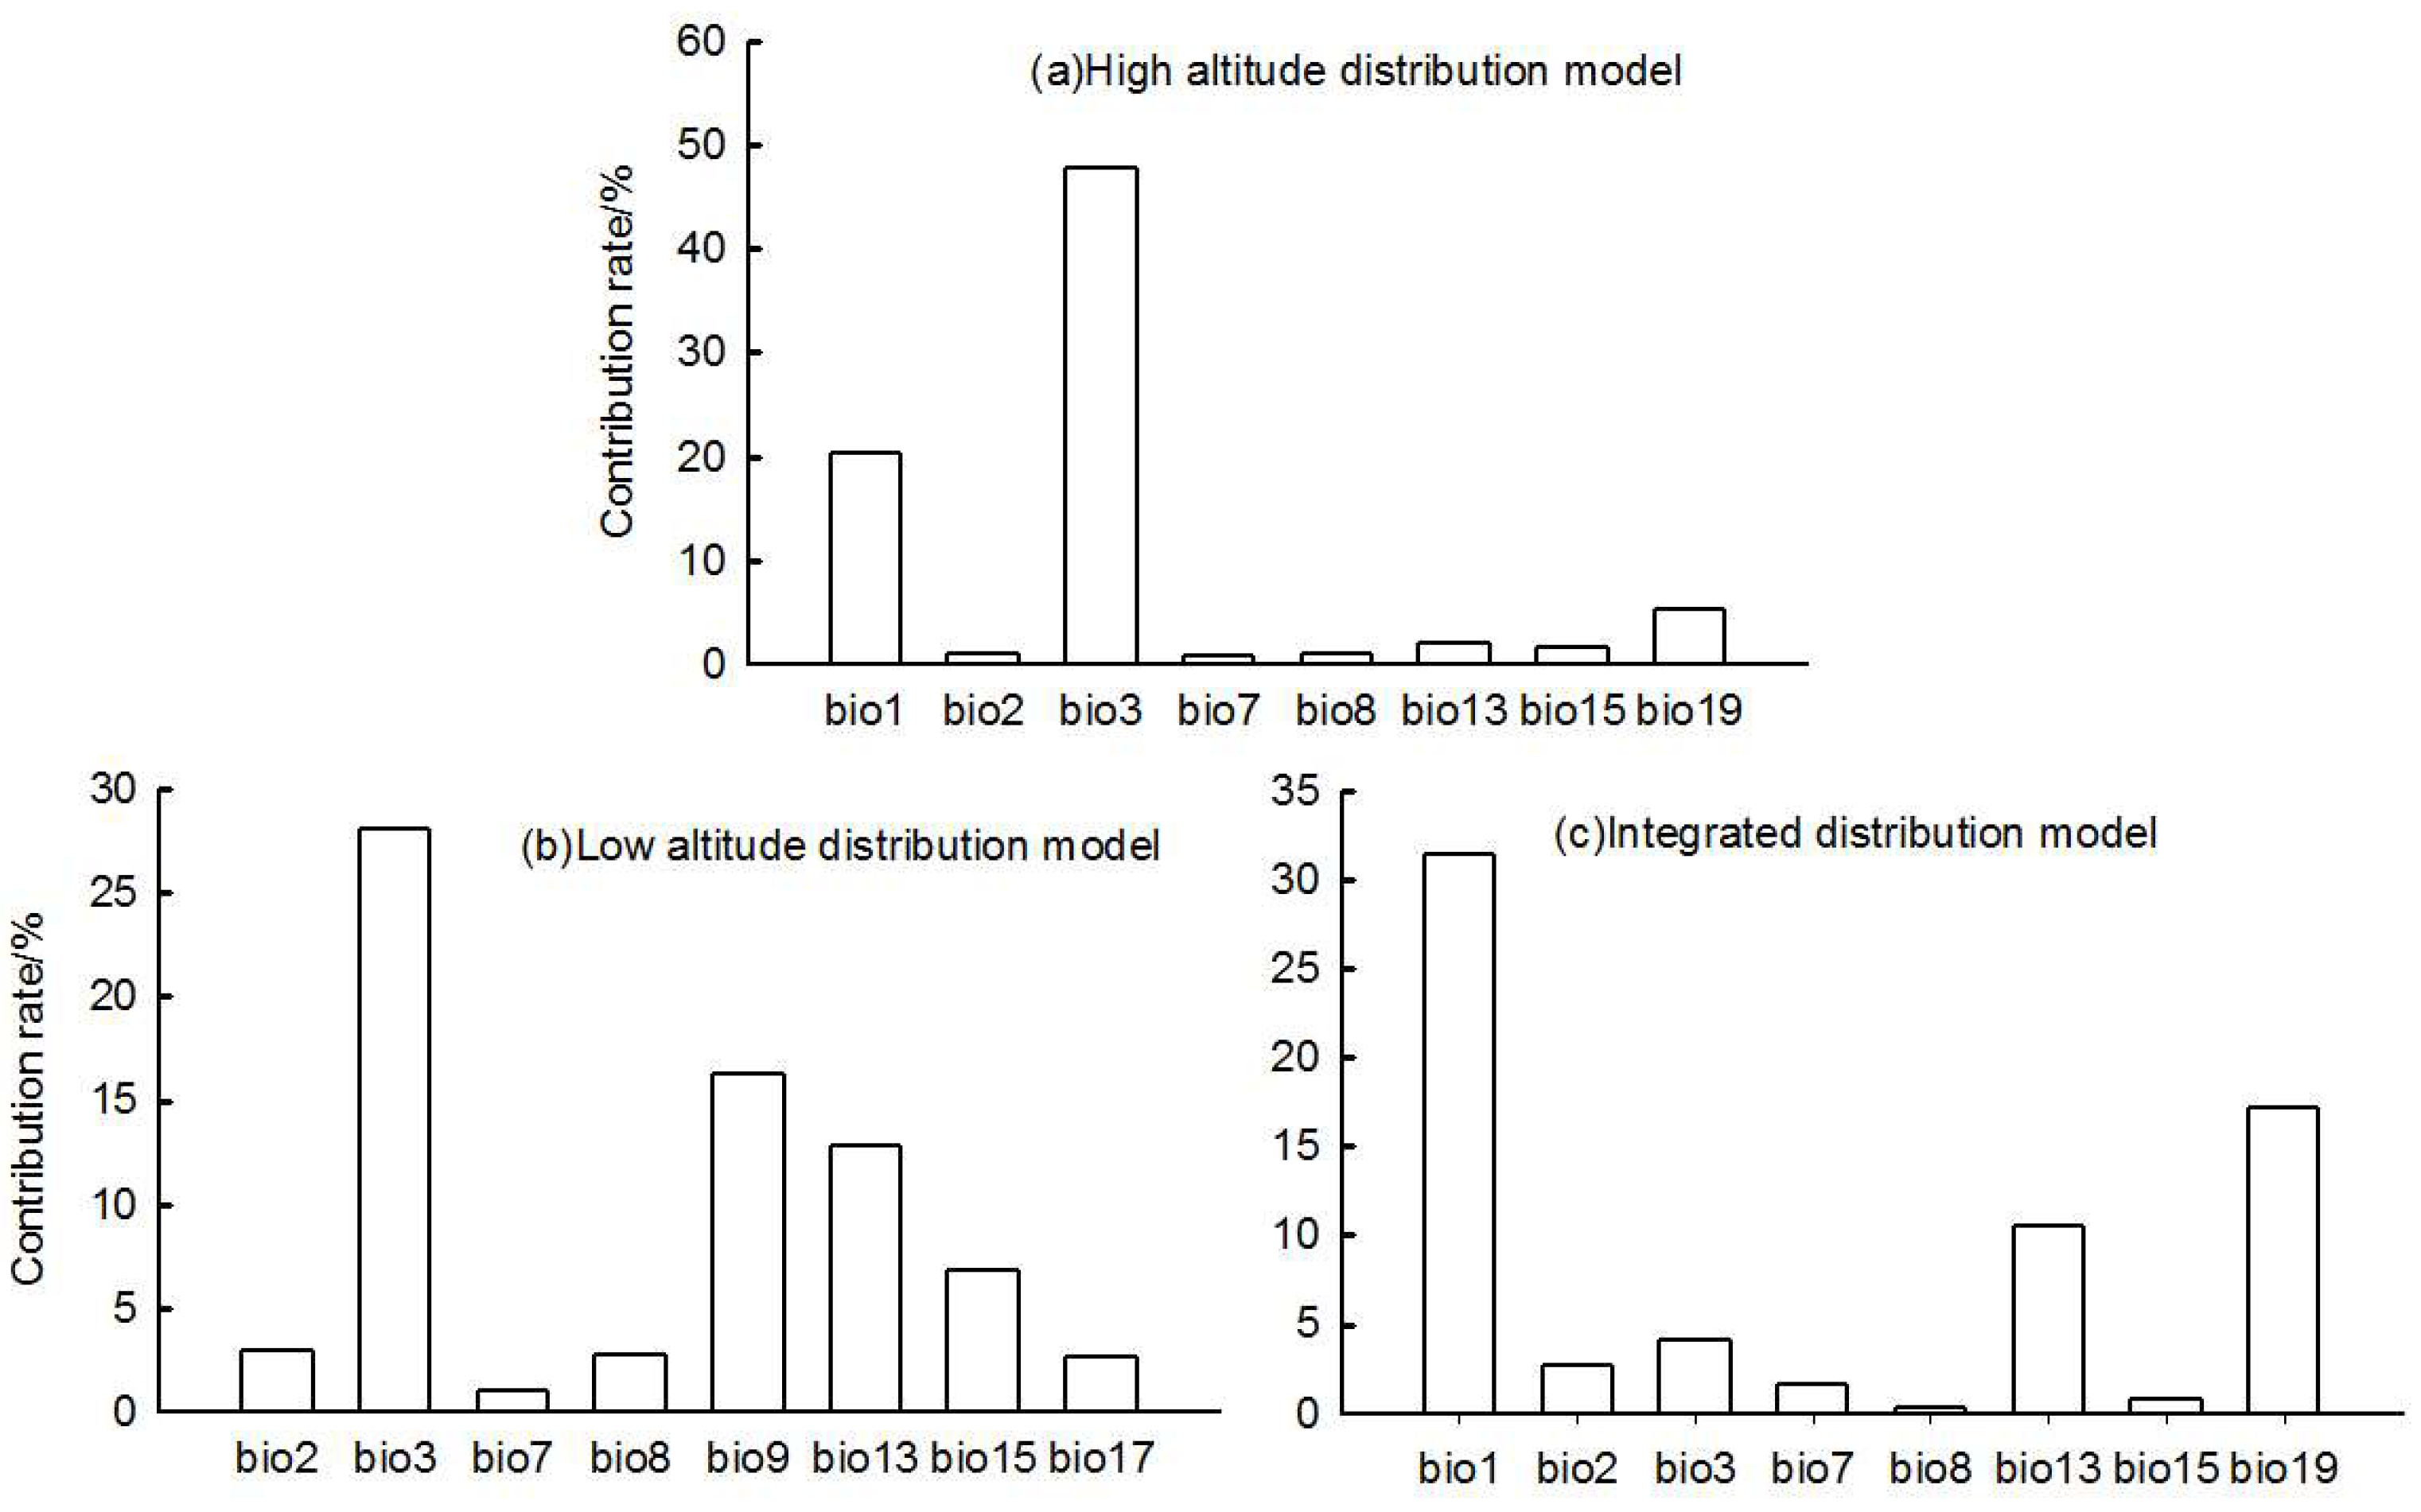
Figure 3.
Response curves of important bioclimatic variables in high-altitude distribution modell.
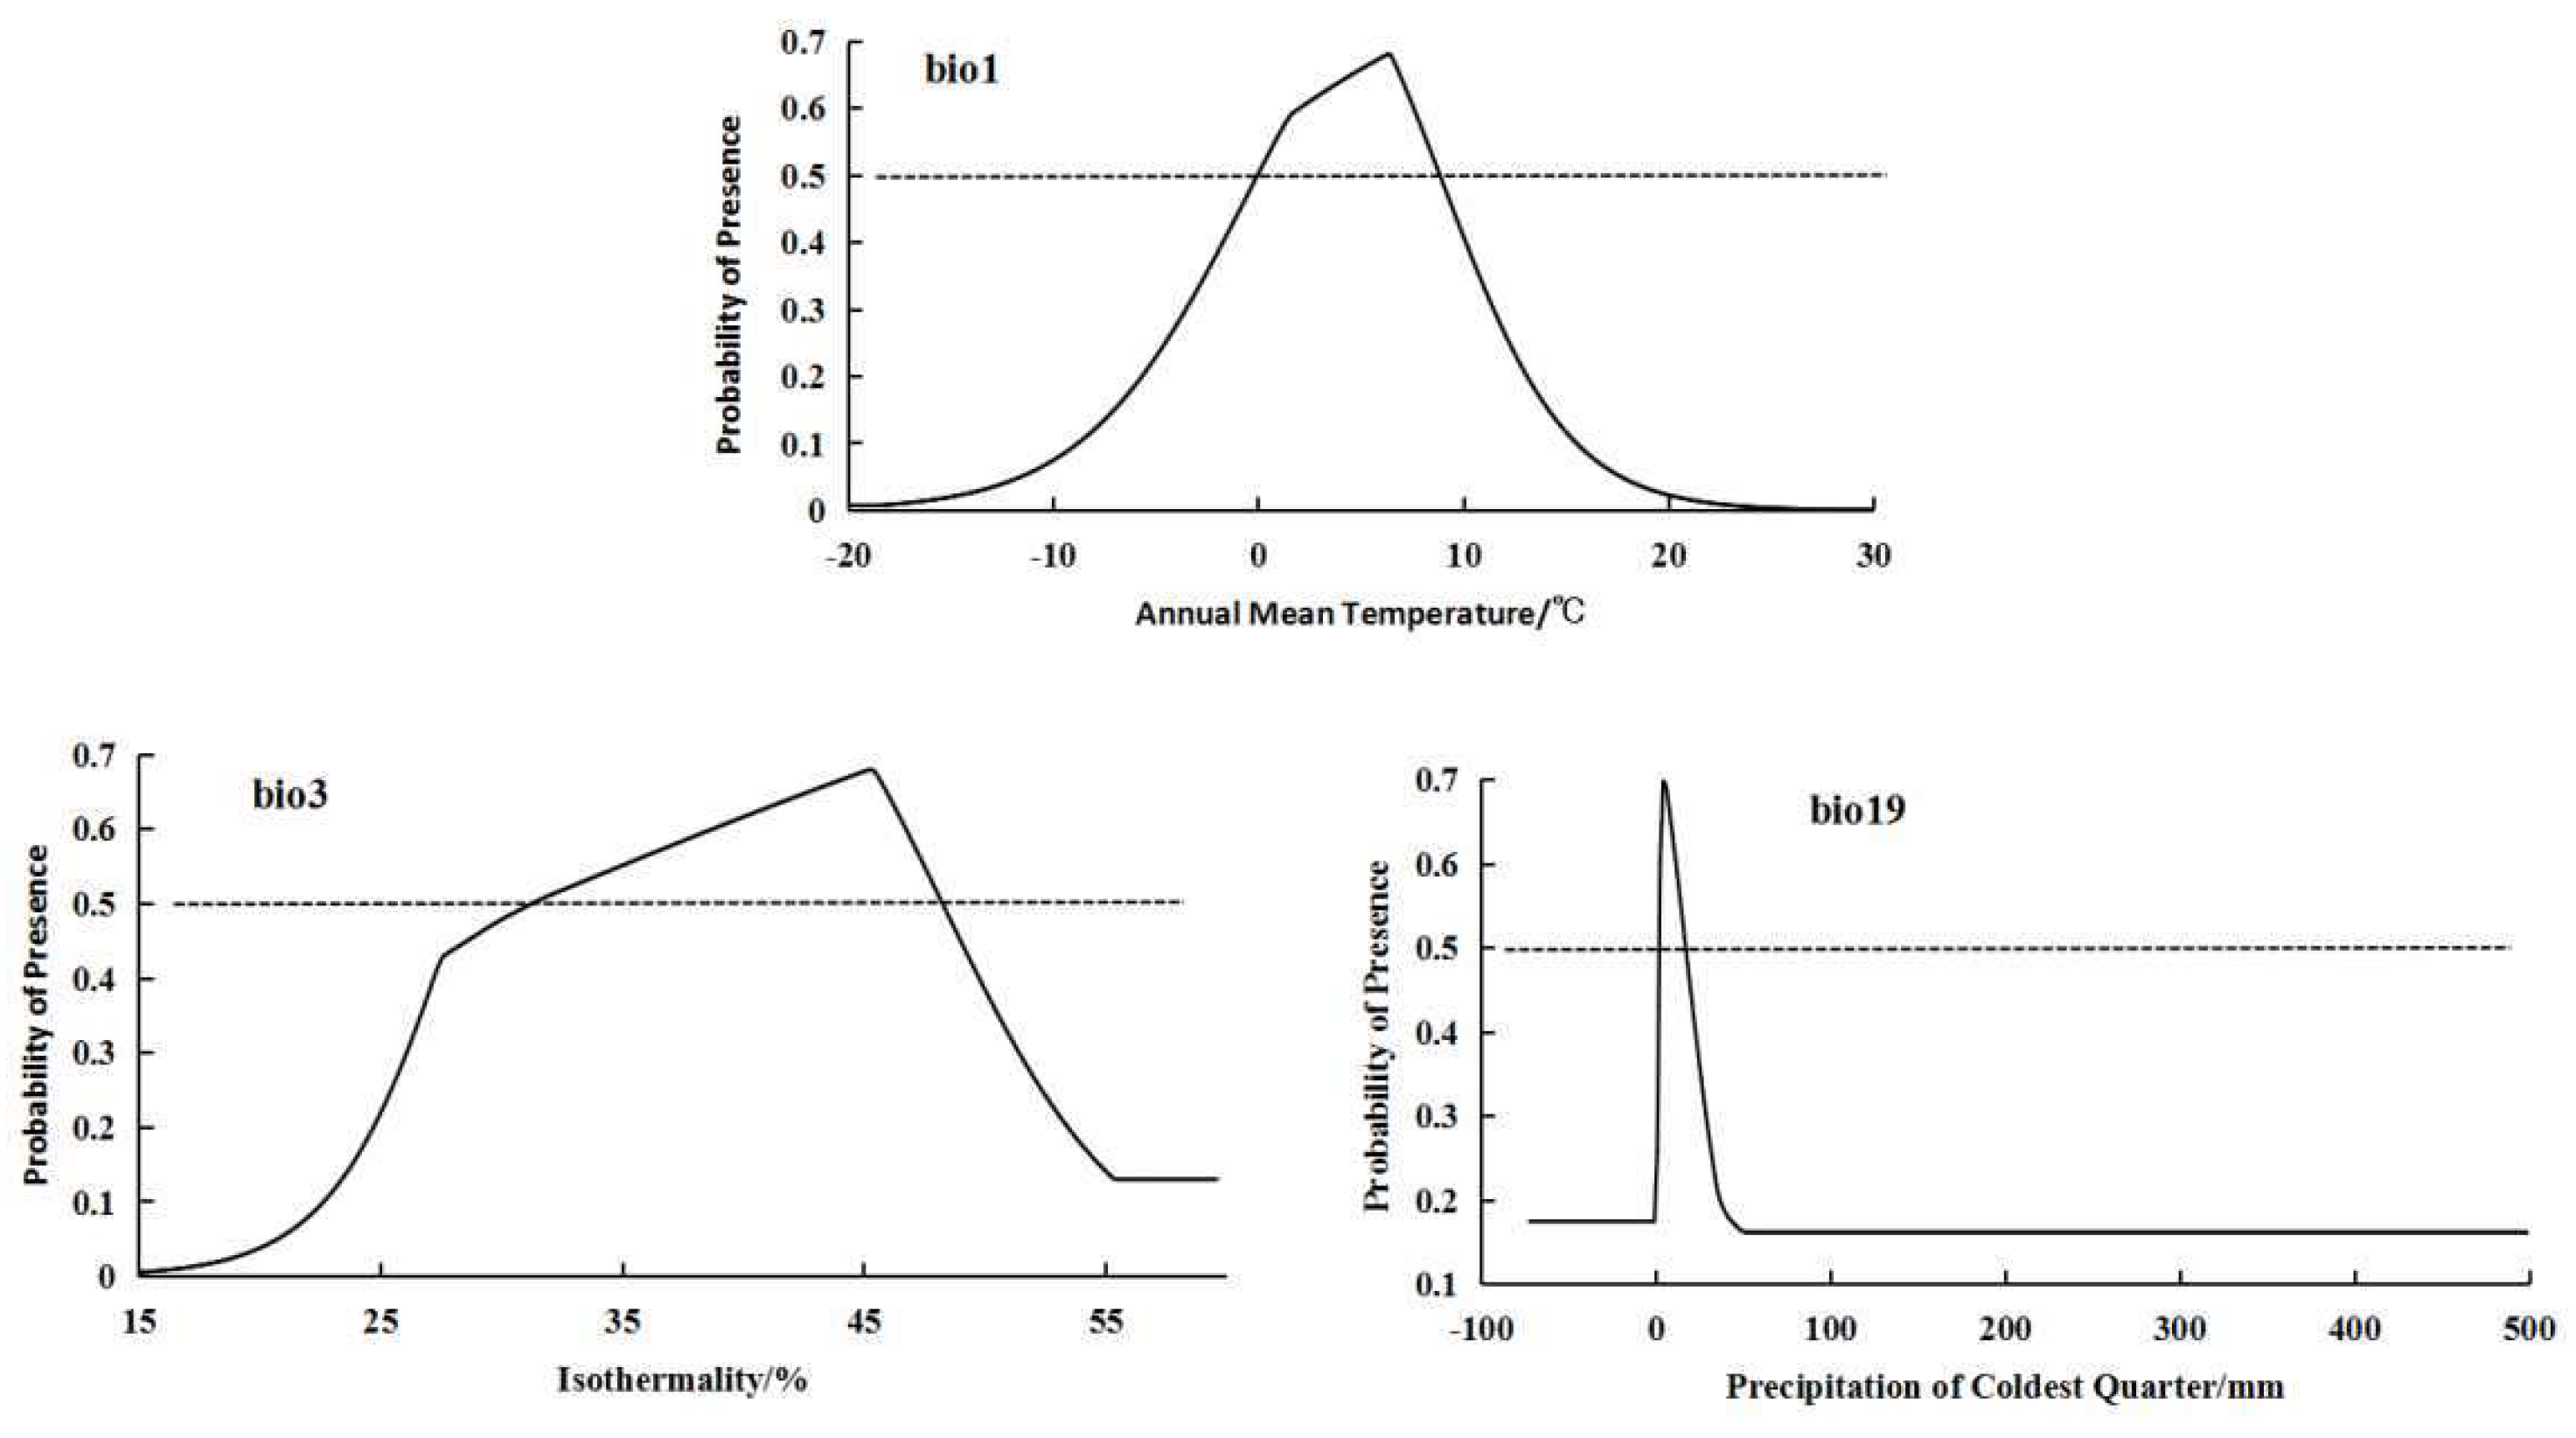
Figure 4.
Response curves of important bioclimatic variables in low-altitude distribution model.
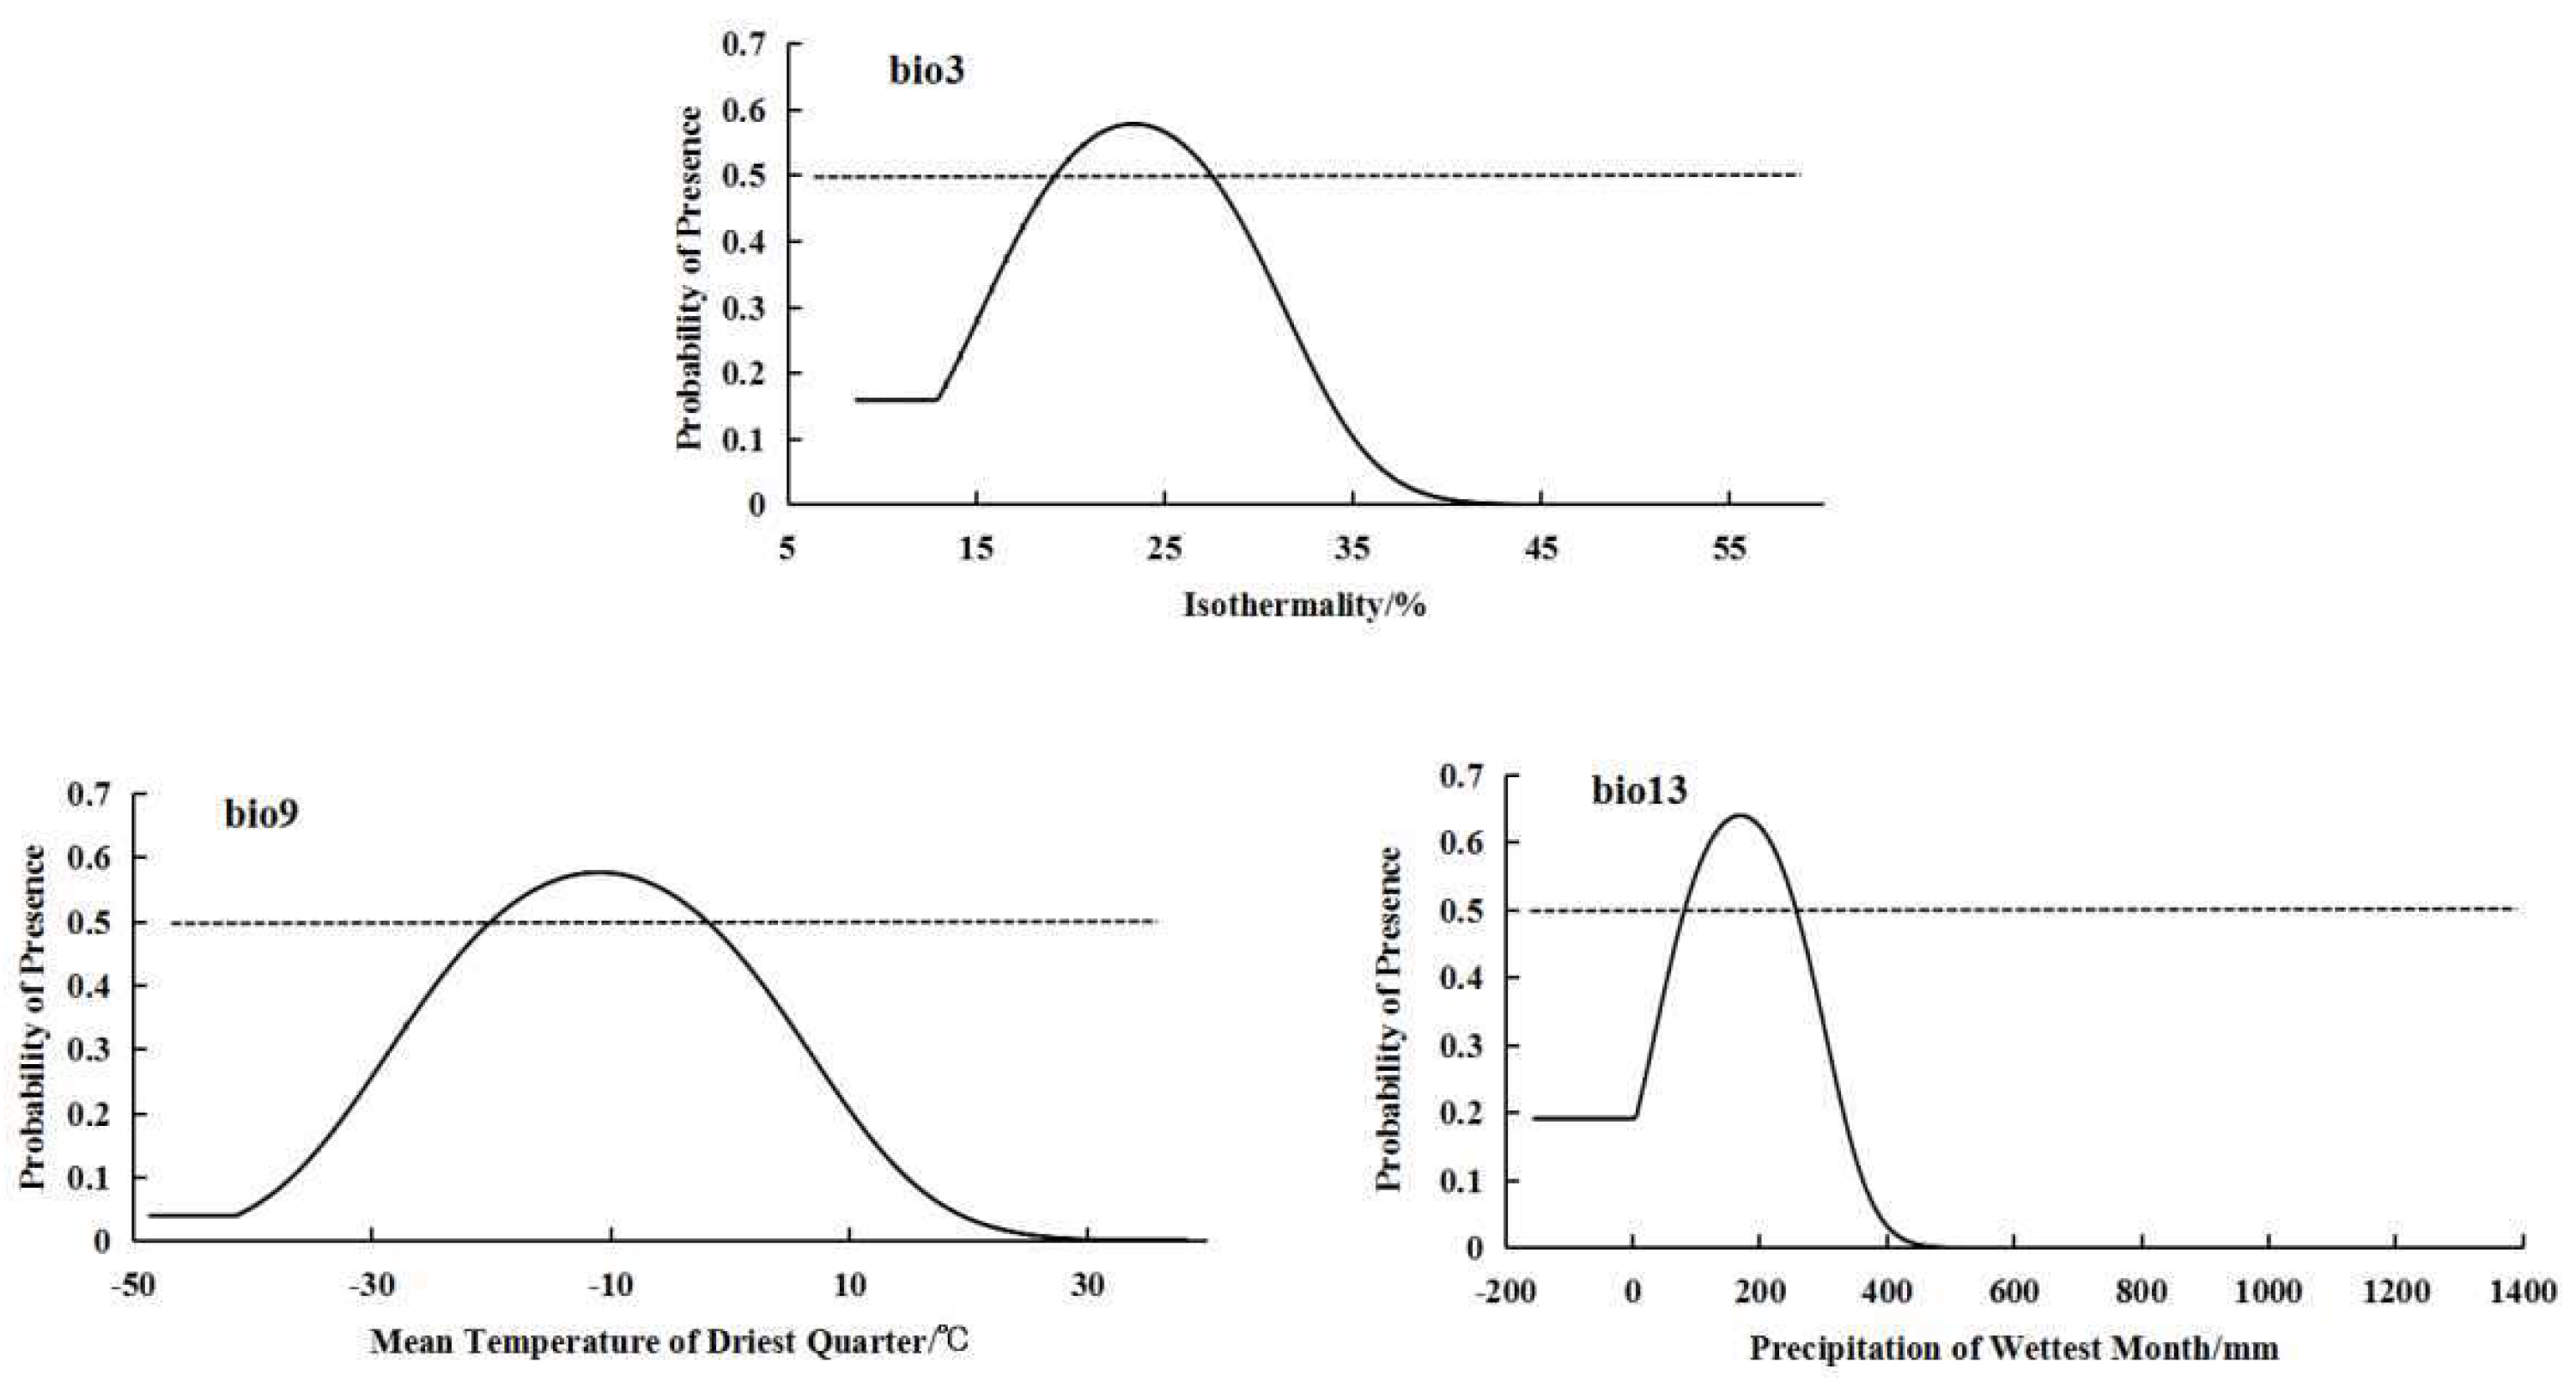
Figure 5.
Response curves of important bioclimatic variables in integrated distribution model.
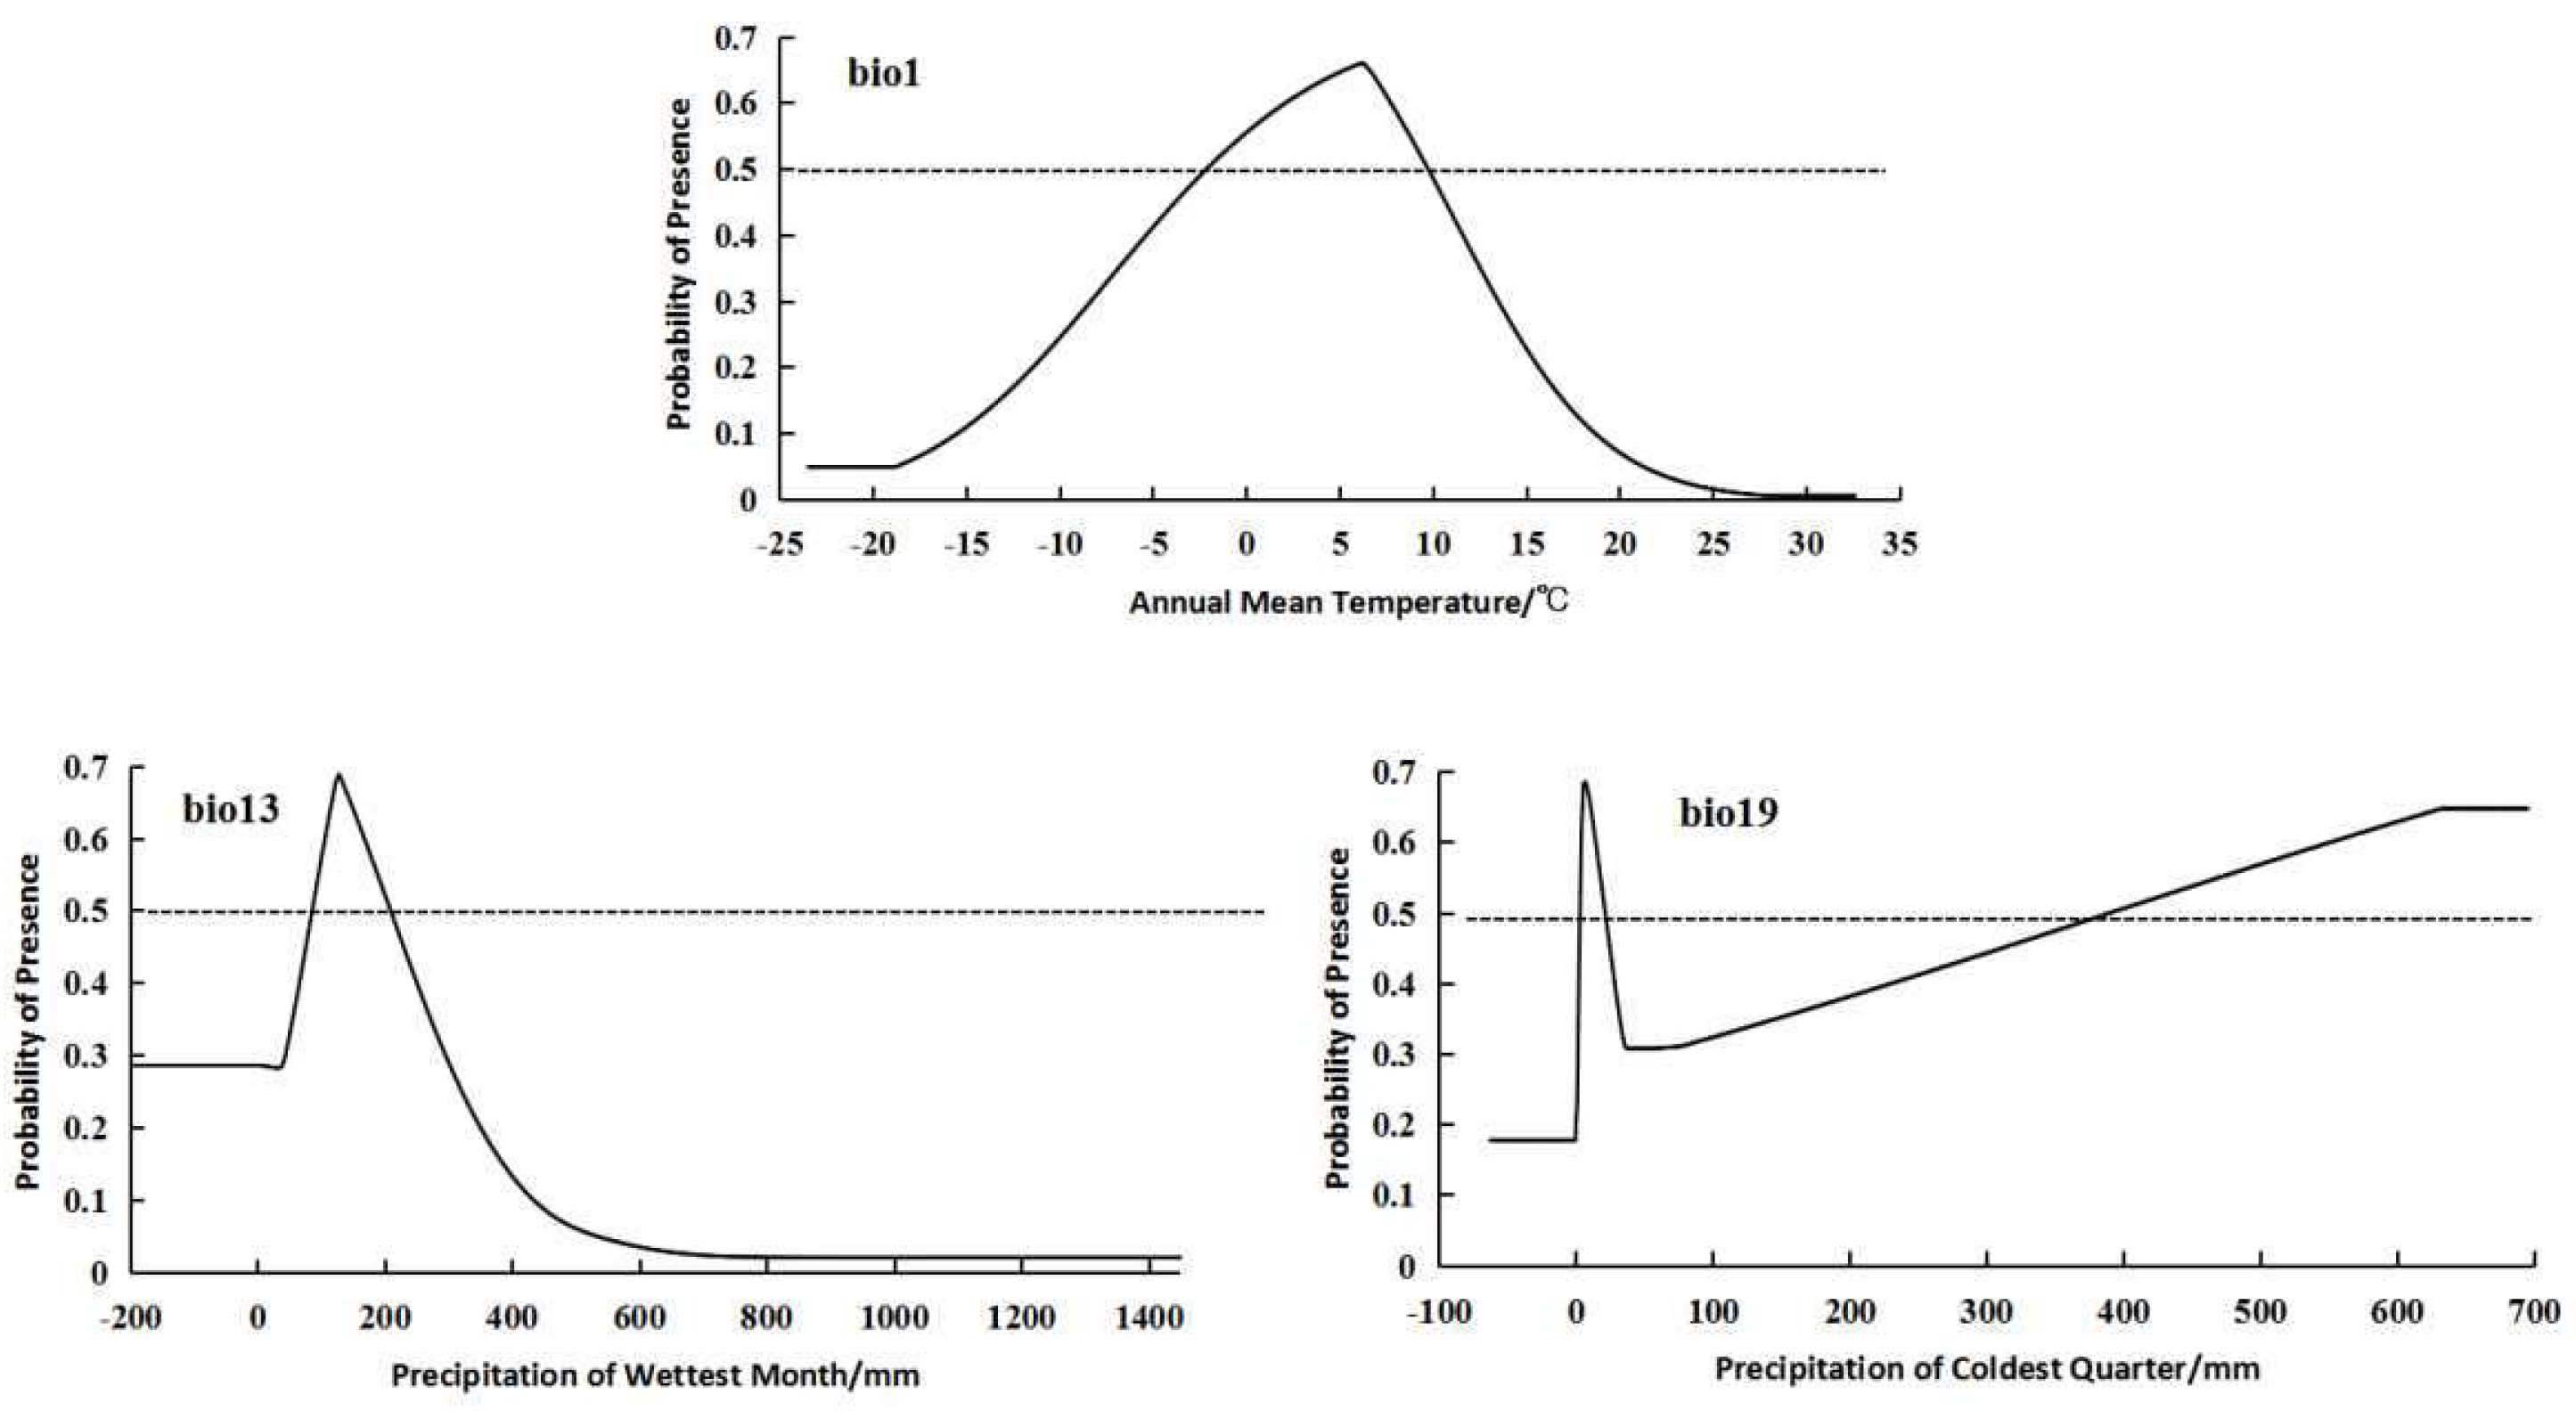
Figure 6.
Suitable areas of Hippuris vulgaris in different periods.
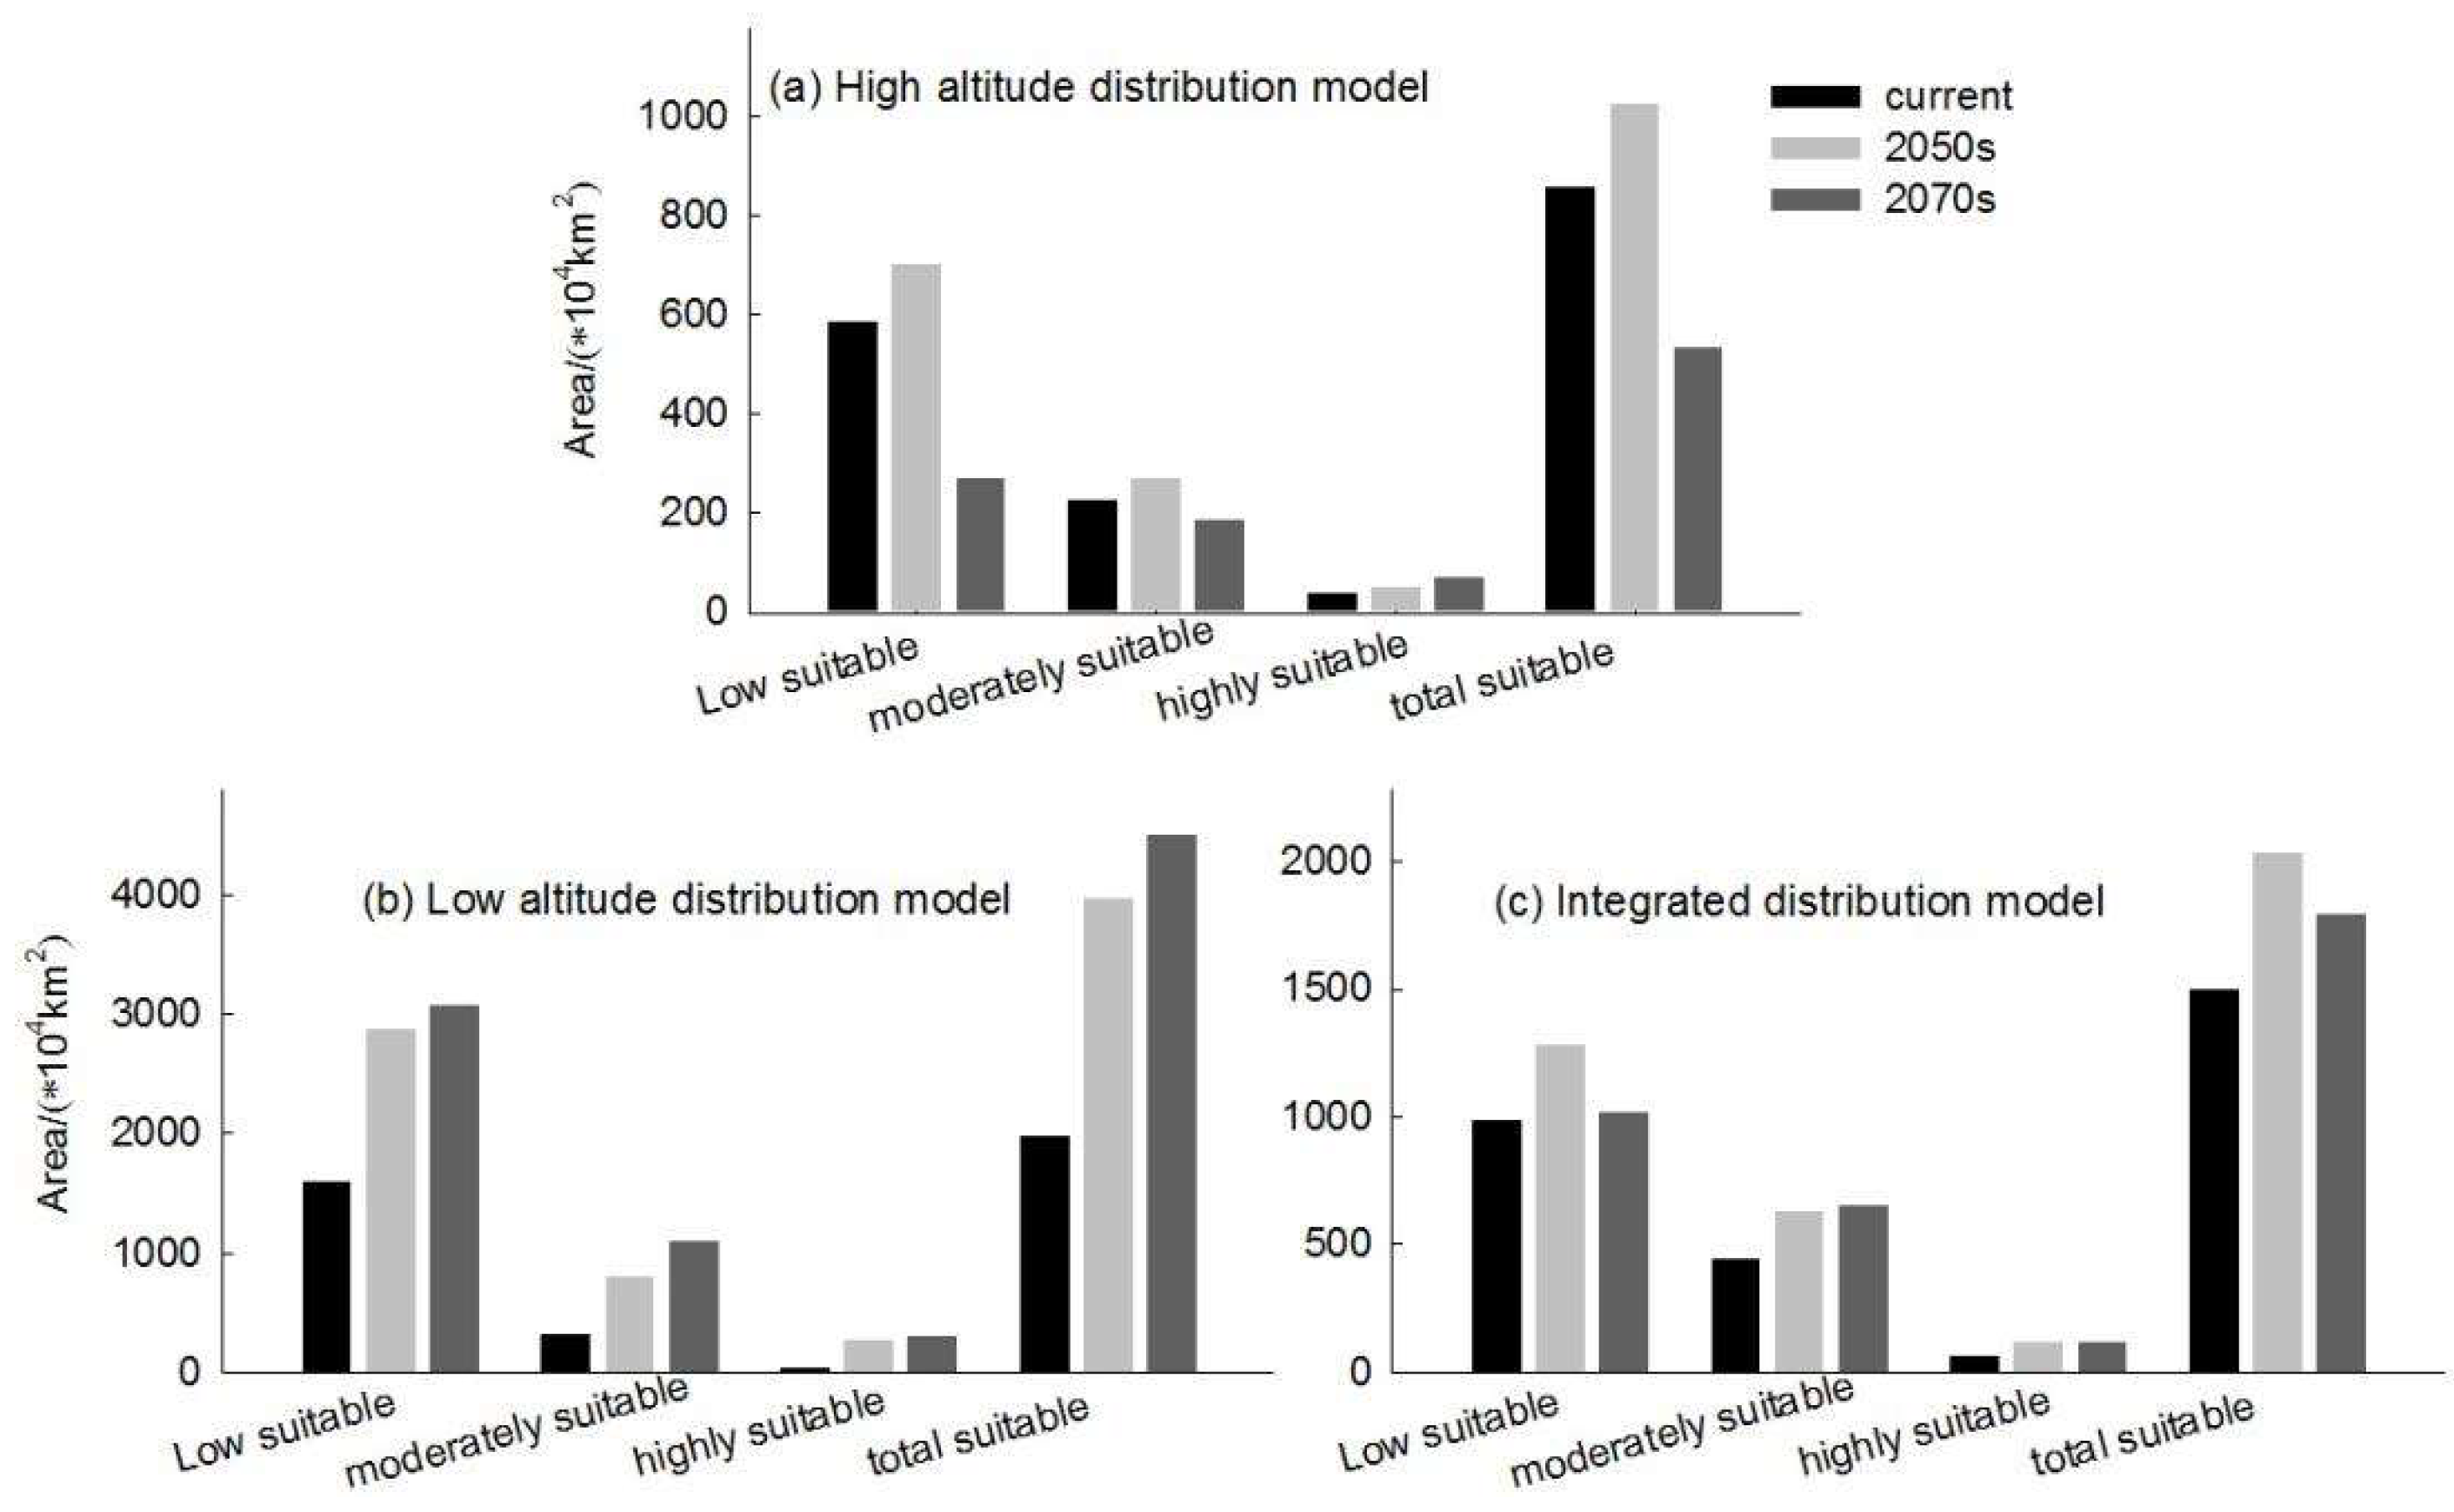
Figure 7.
Distribution of suitable areas and centroid transfer of Hippuris vulgaris in different periods in high-altitude distribution model.
Figure 7.
Distribution of suitable areas and centroid transfer of Hippuris vulgaris in different periods in high-altitude distribution model.
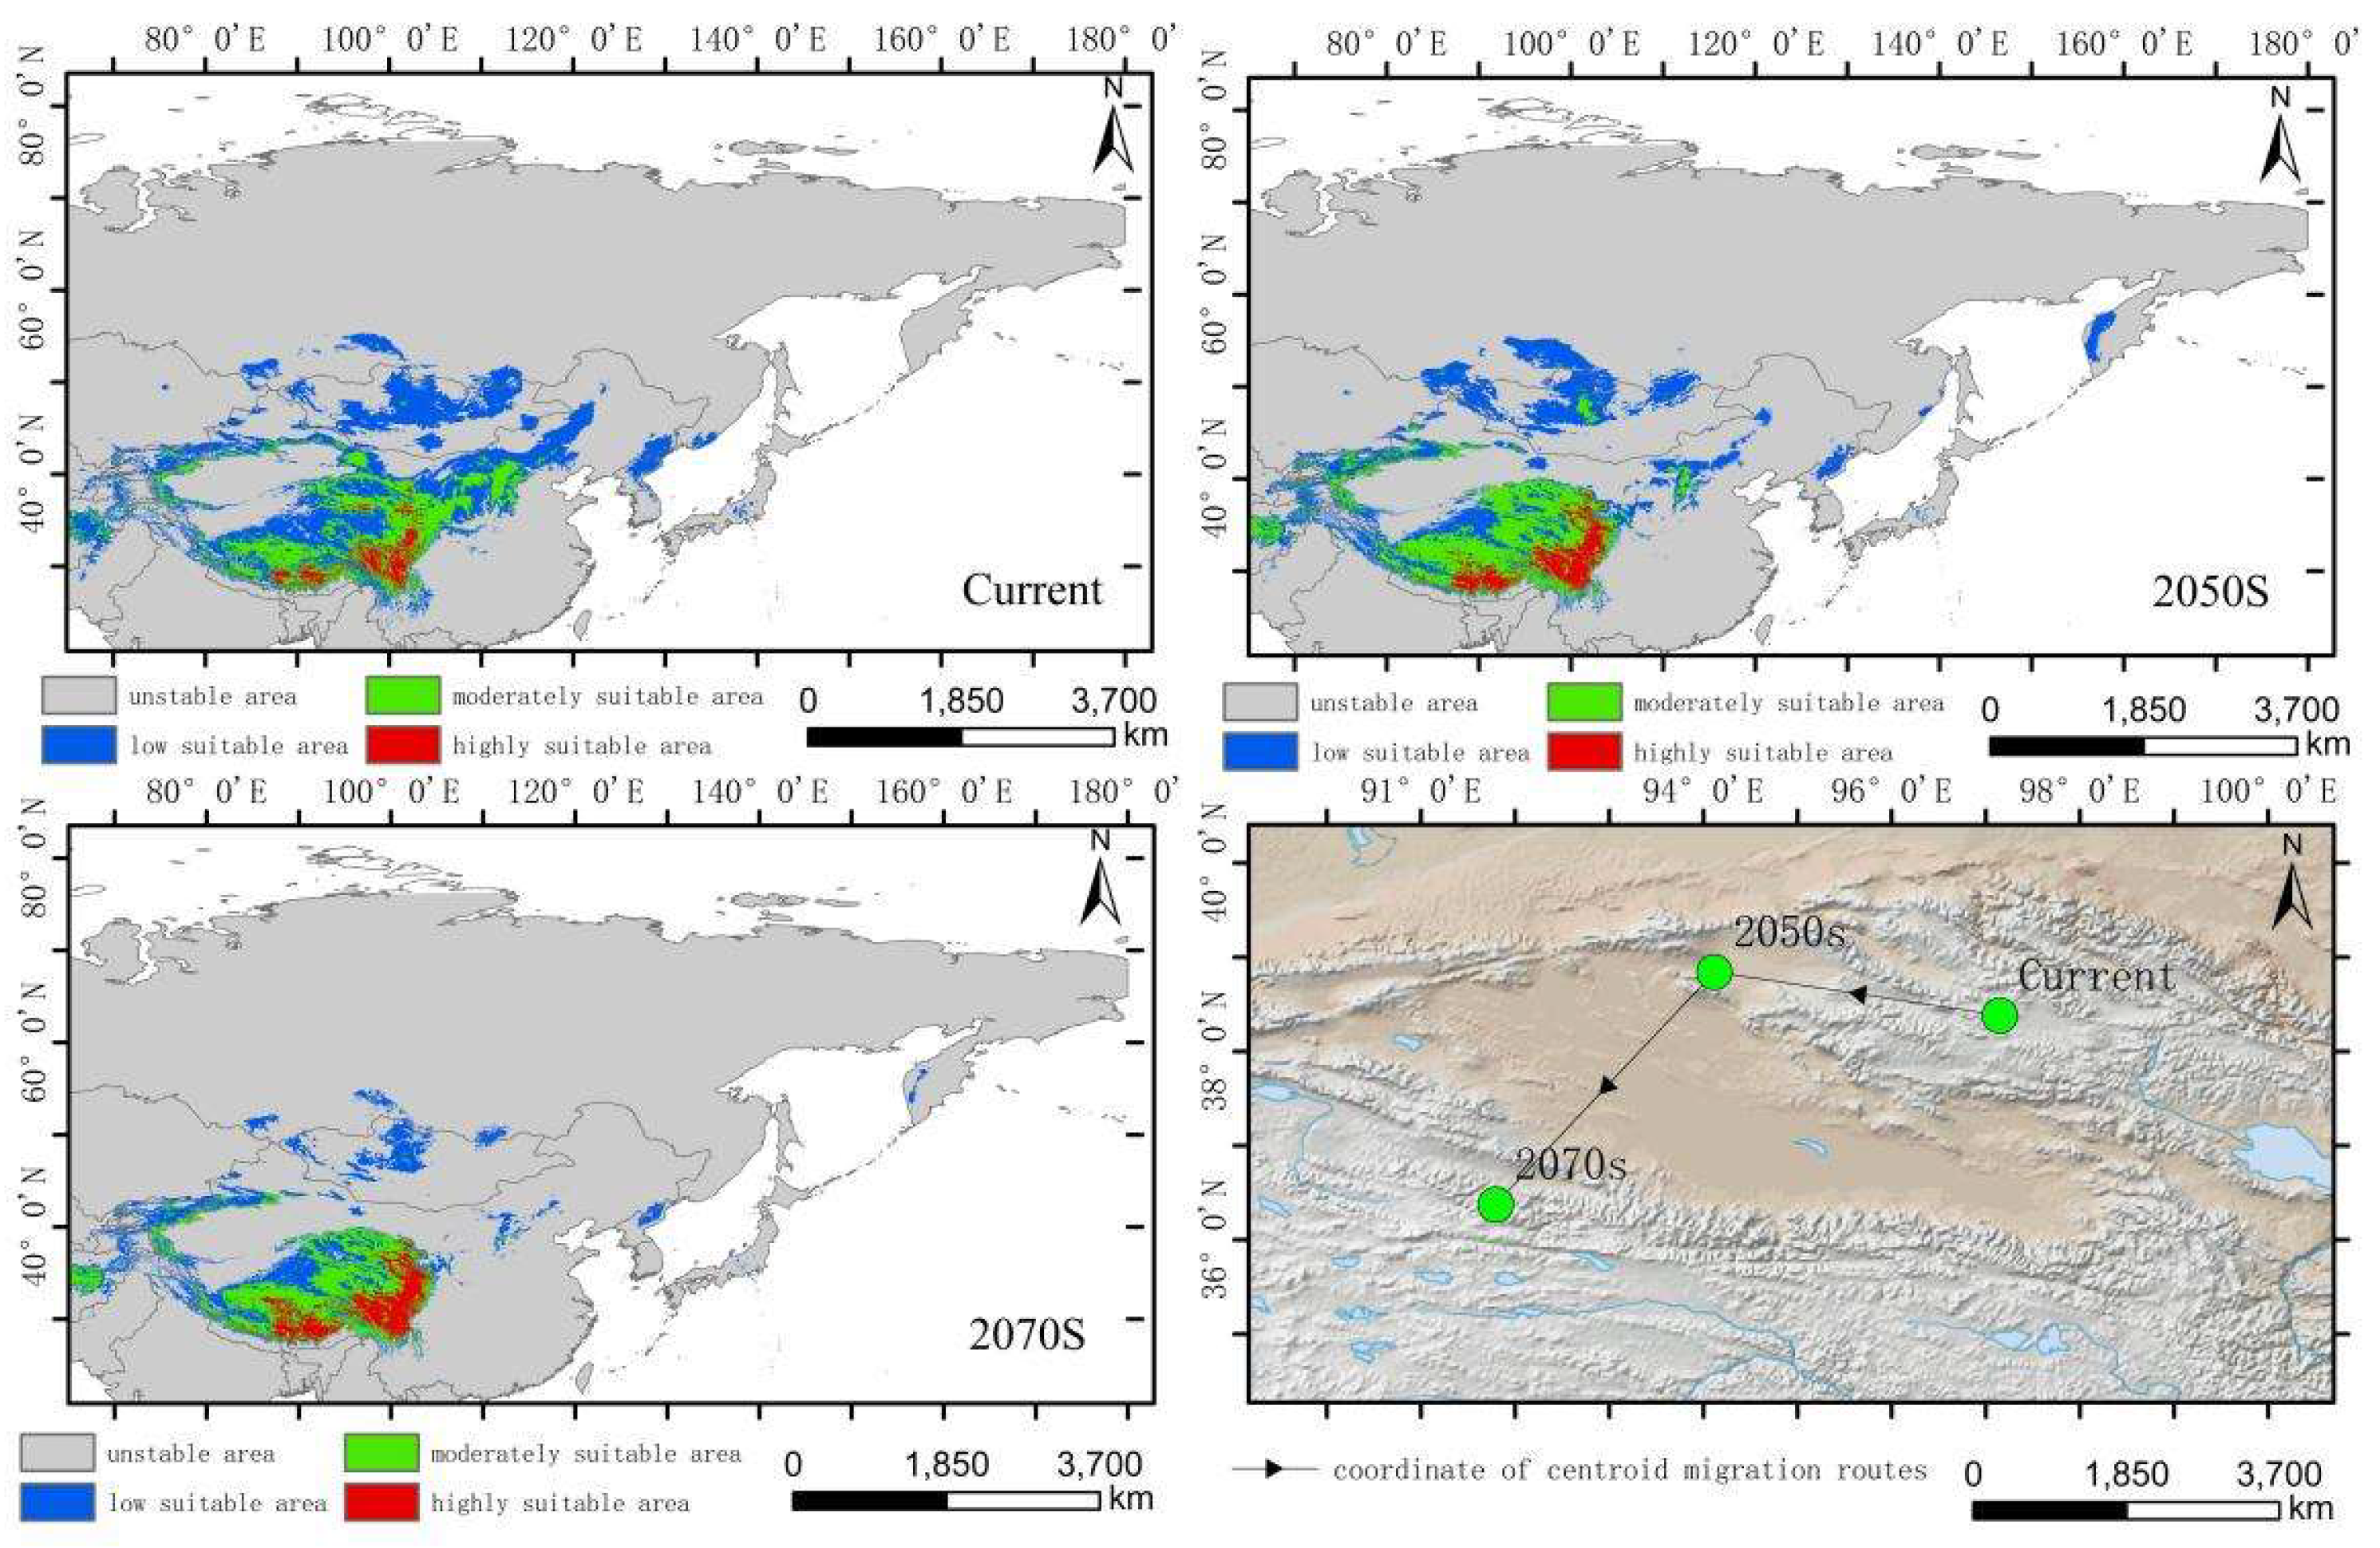
Figure 8.
Dynamic changes in suitable area of Hippuris vulgaris in different periods in high-altitude distribution model.
Figure 8.
Dynamic changes in suitable area of Hippuris vulgaris in different periods in high-altitude distribution model.
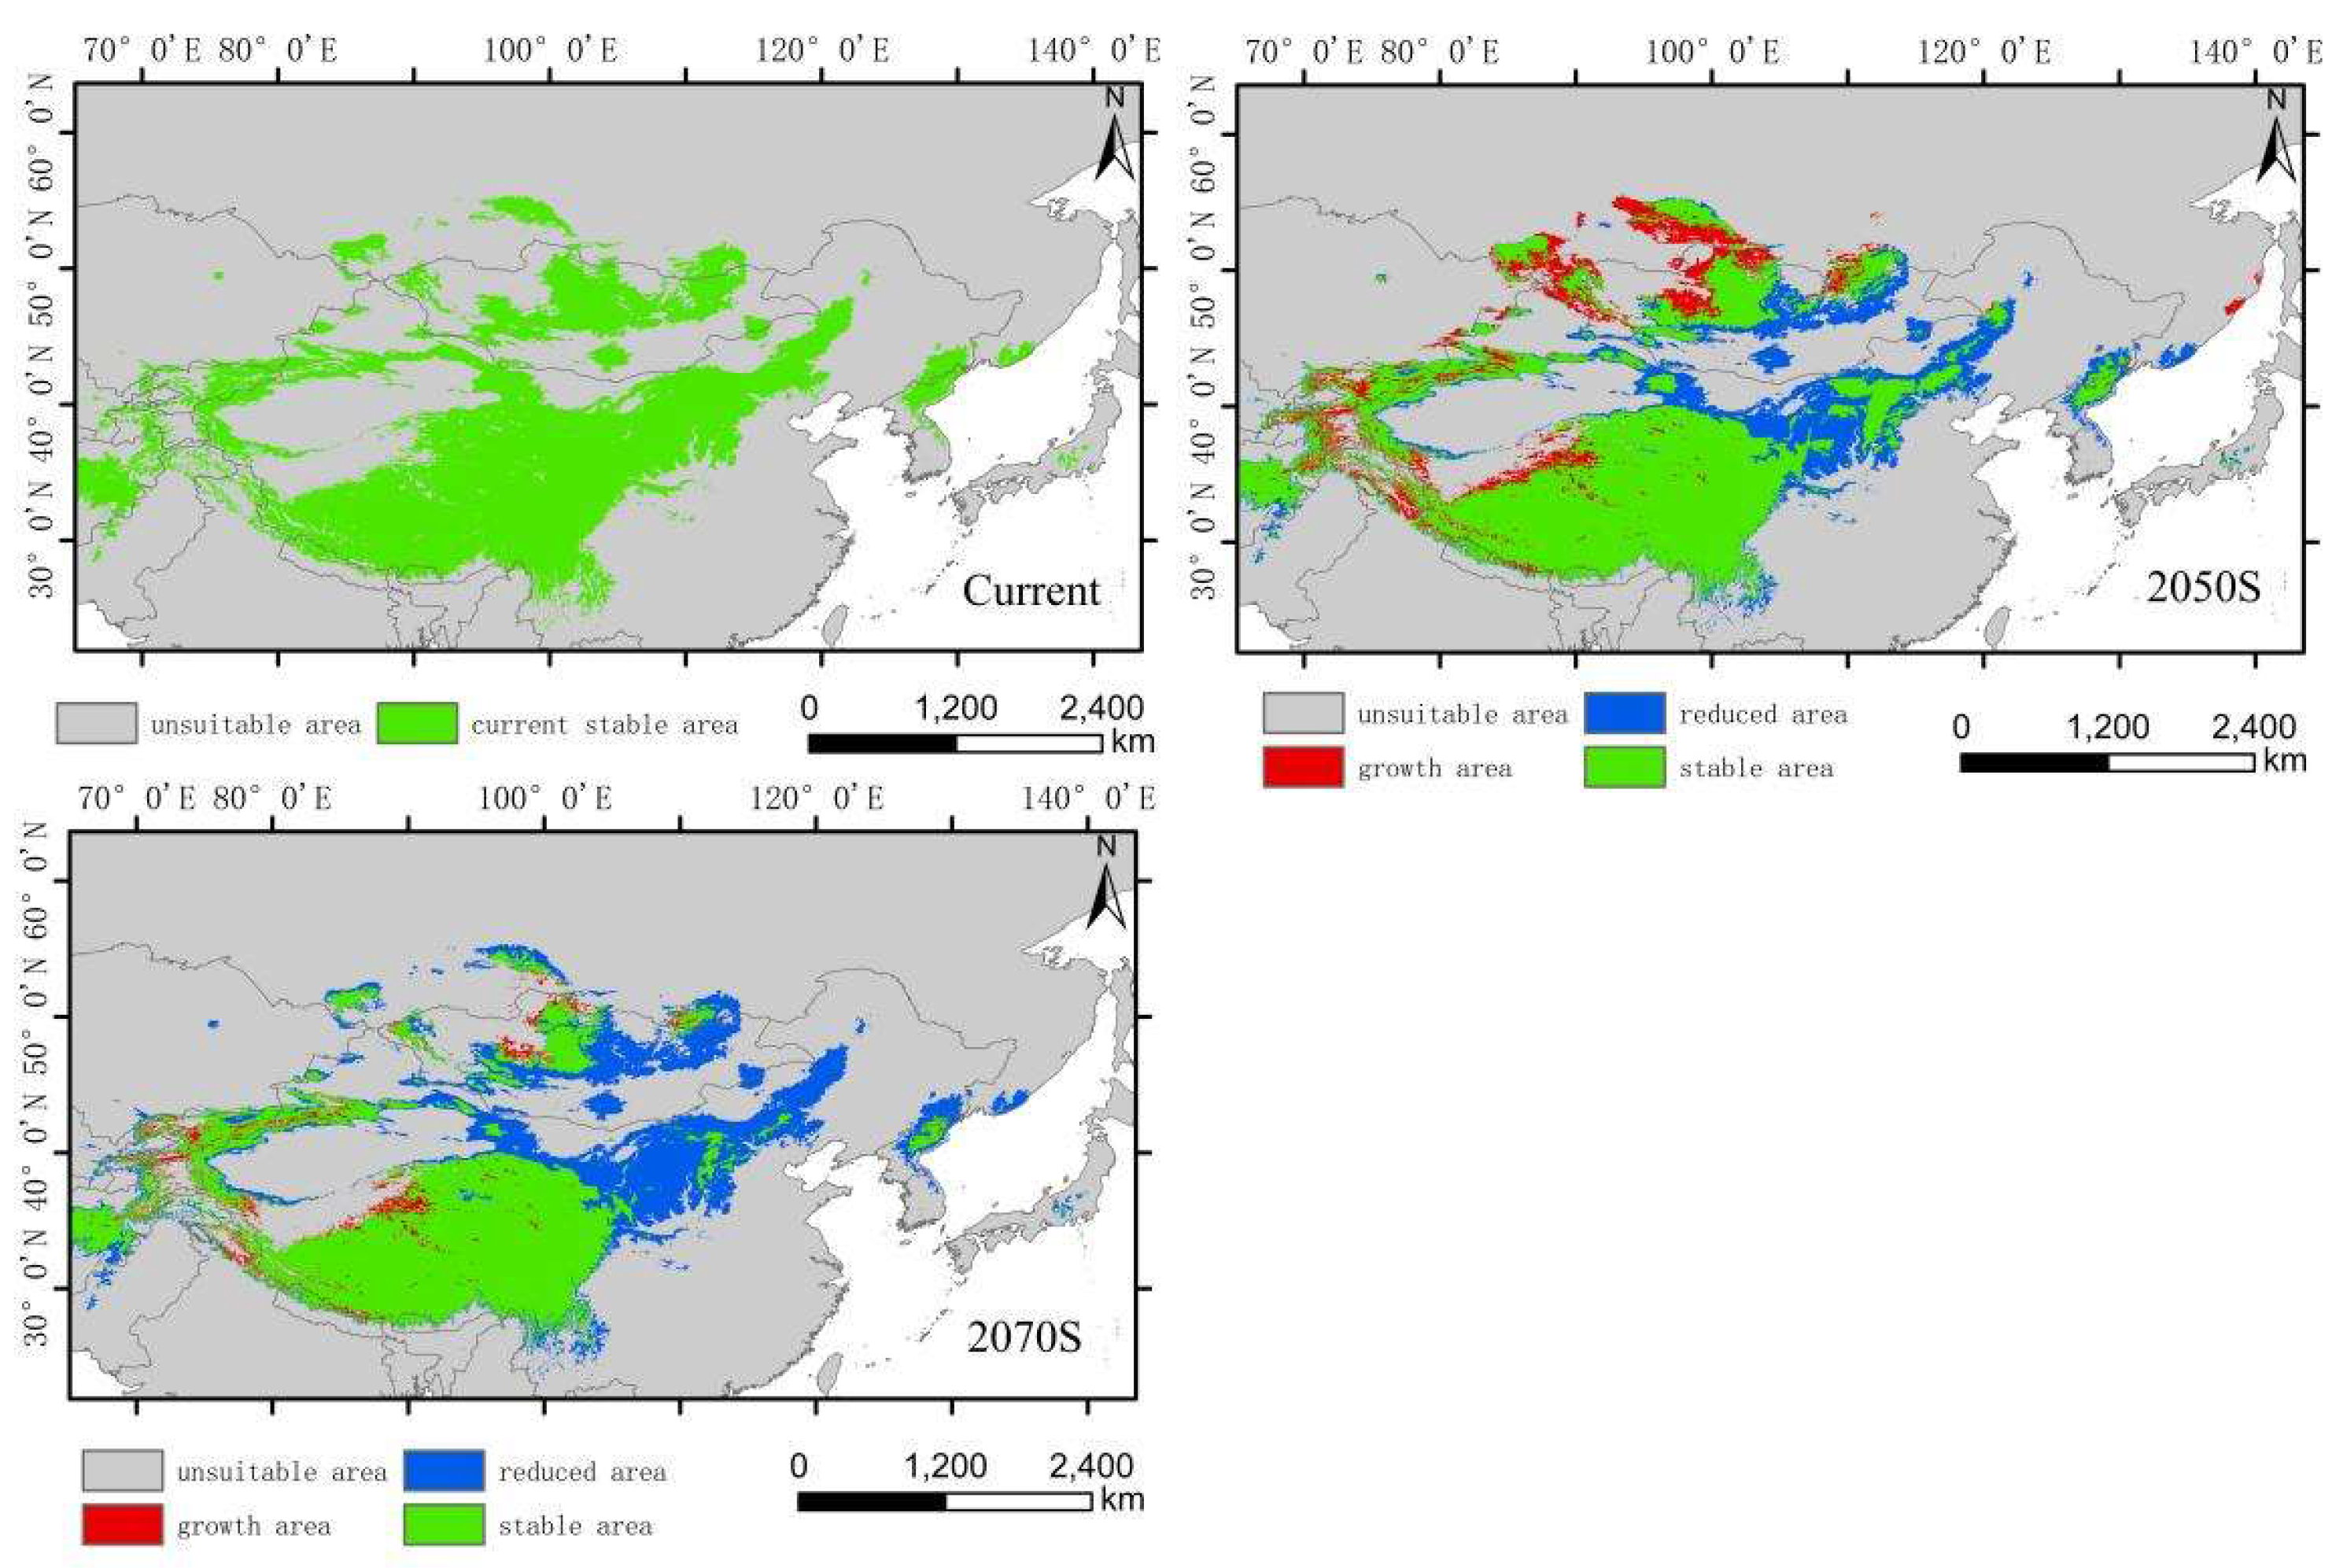
Figure 9.
Distribution of suitable areas and centroid transfer of Hippuris vulgaris in different periods in low-altitude distribution model.
Figure 9.
Distribution of suitable areas and centroid transfer of Hippuris vulgaris in different periods in low-altitude distribution model.
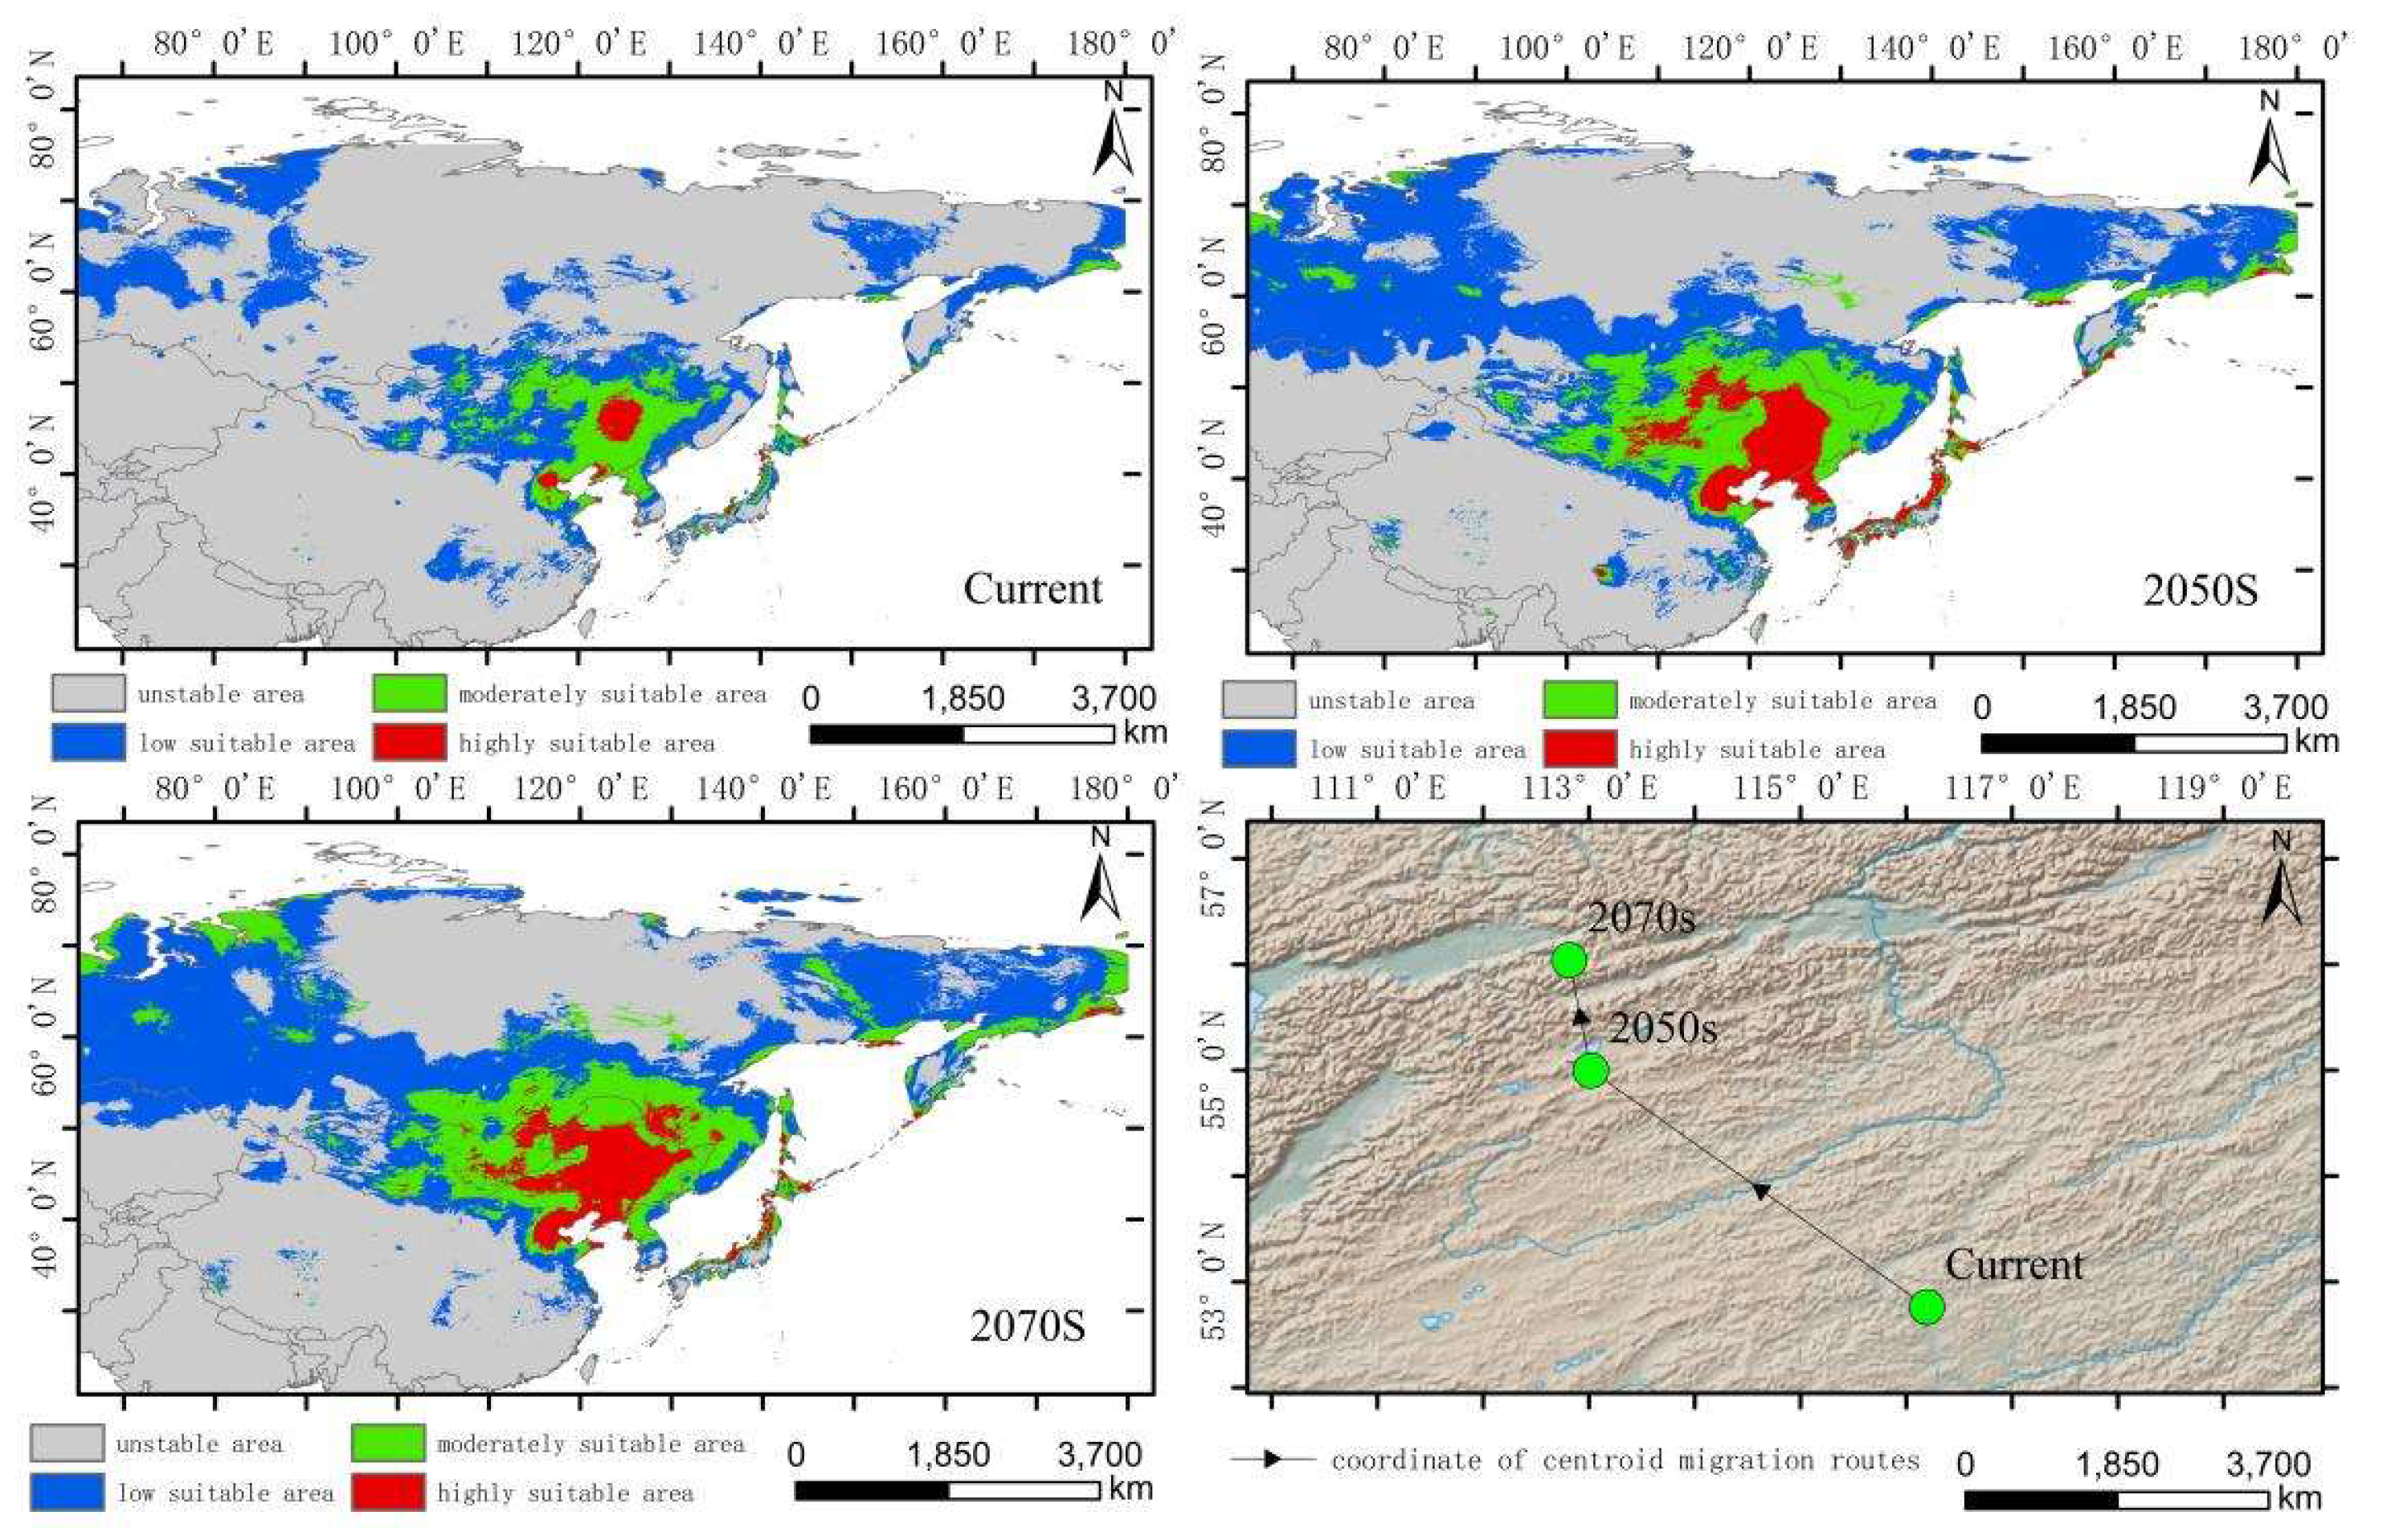
Figure 10.
Dynamic changes in suitable area of Hippuris vulgaris in different periods in low-altitude distribution model.
Figure 10.
Dynamic changes in suitable area of Hippuris vulgaris in different periods in low-altitude distribution model.
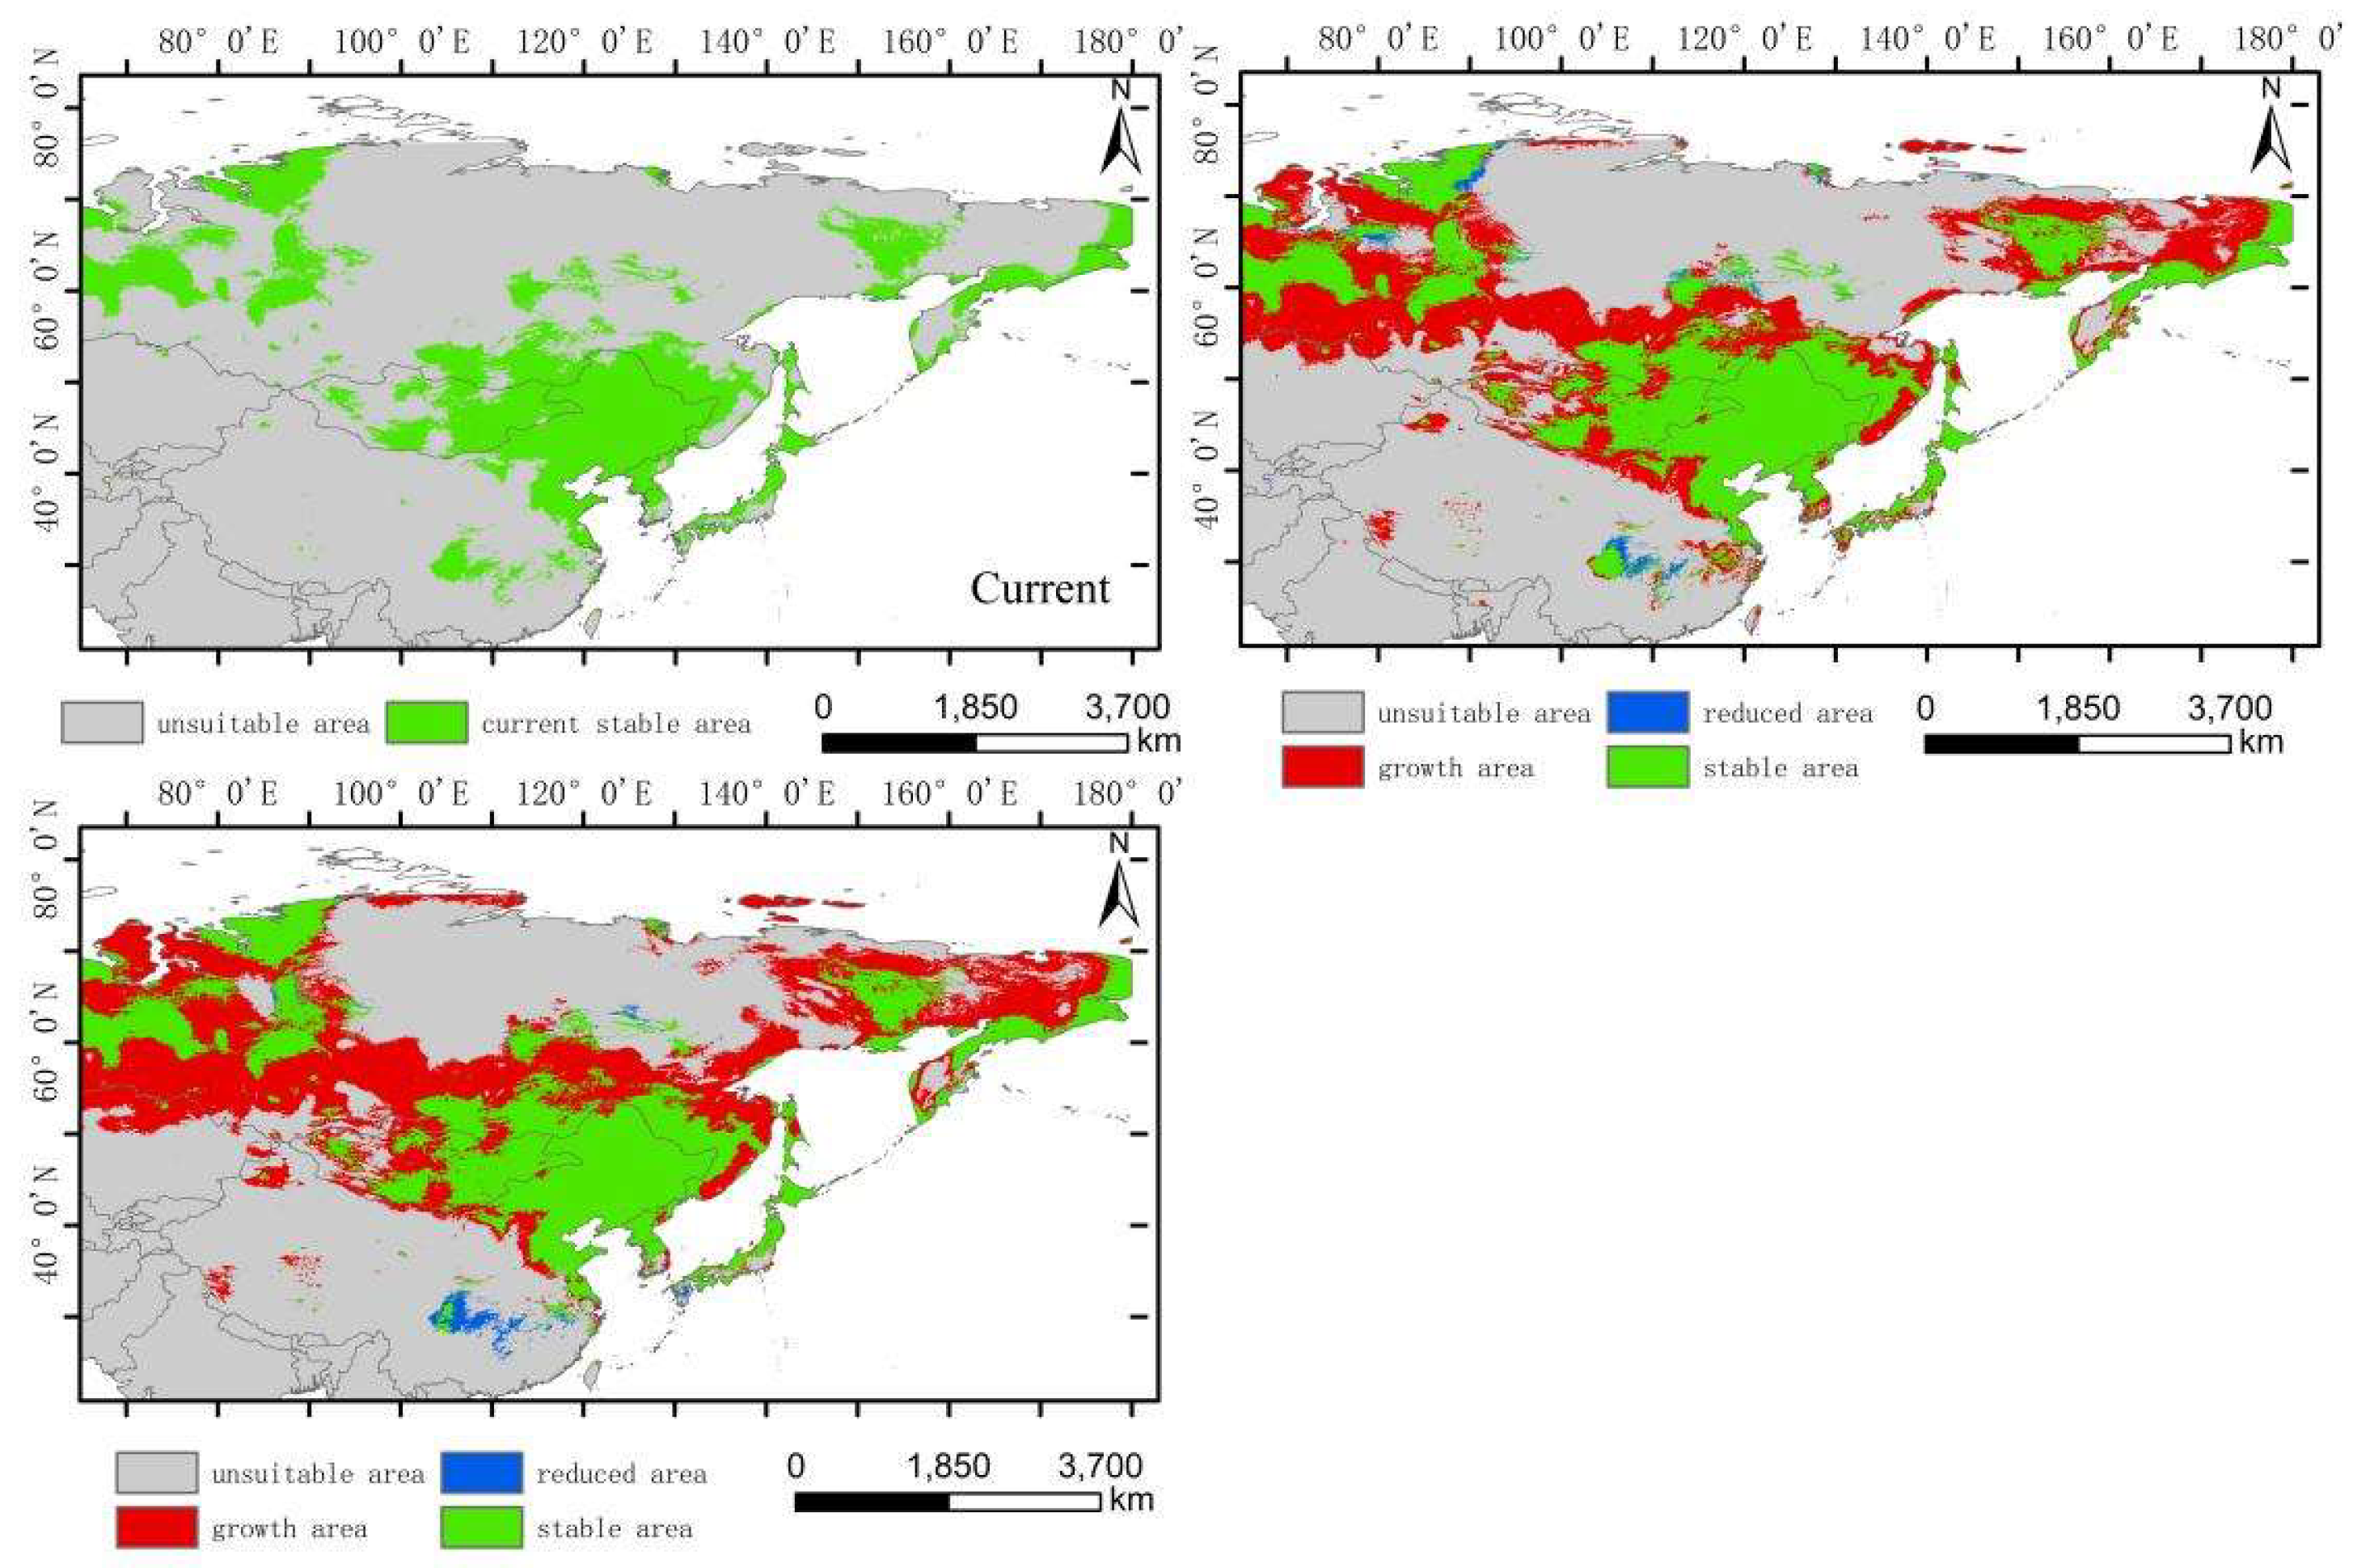
Figure 11.
Distribution of suitable areas and centroid transfer of Hippuris vulgaris in different periods in integrated distribution model.
Figure 11.
Distribution of suitable areas and centroid transfer of Hippuris vulgaris in different periods in integrated distribution model.
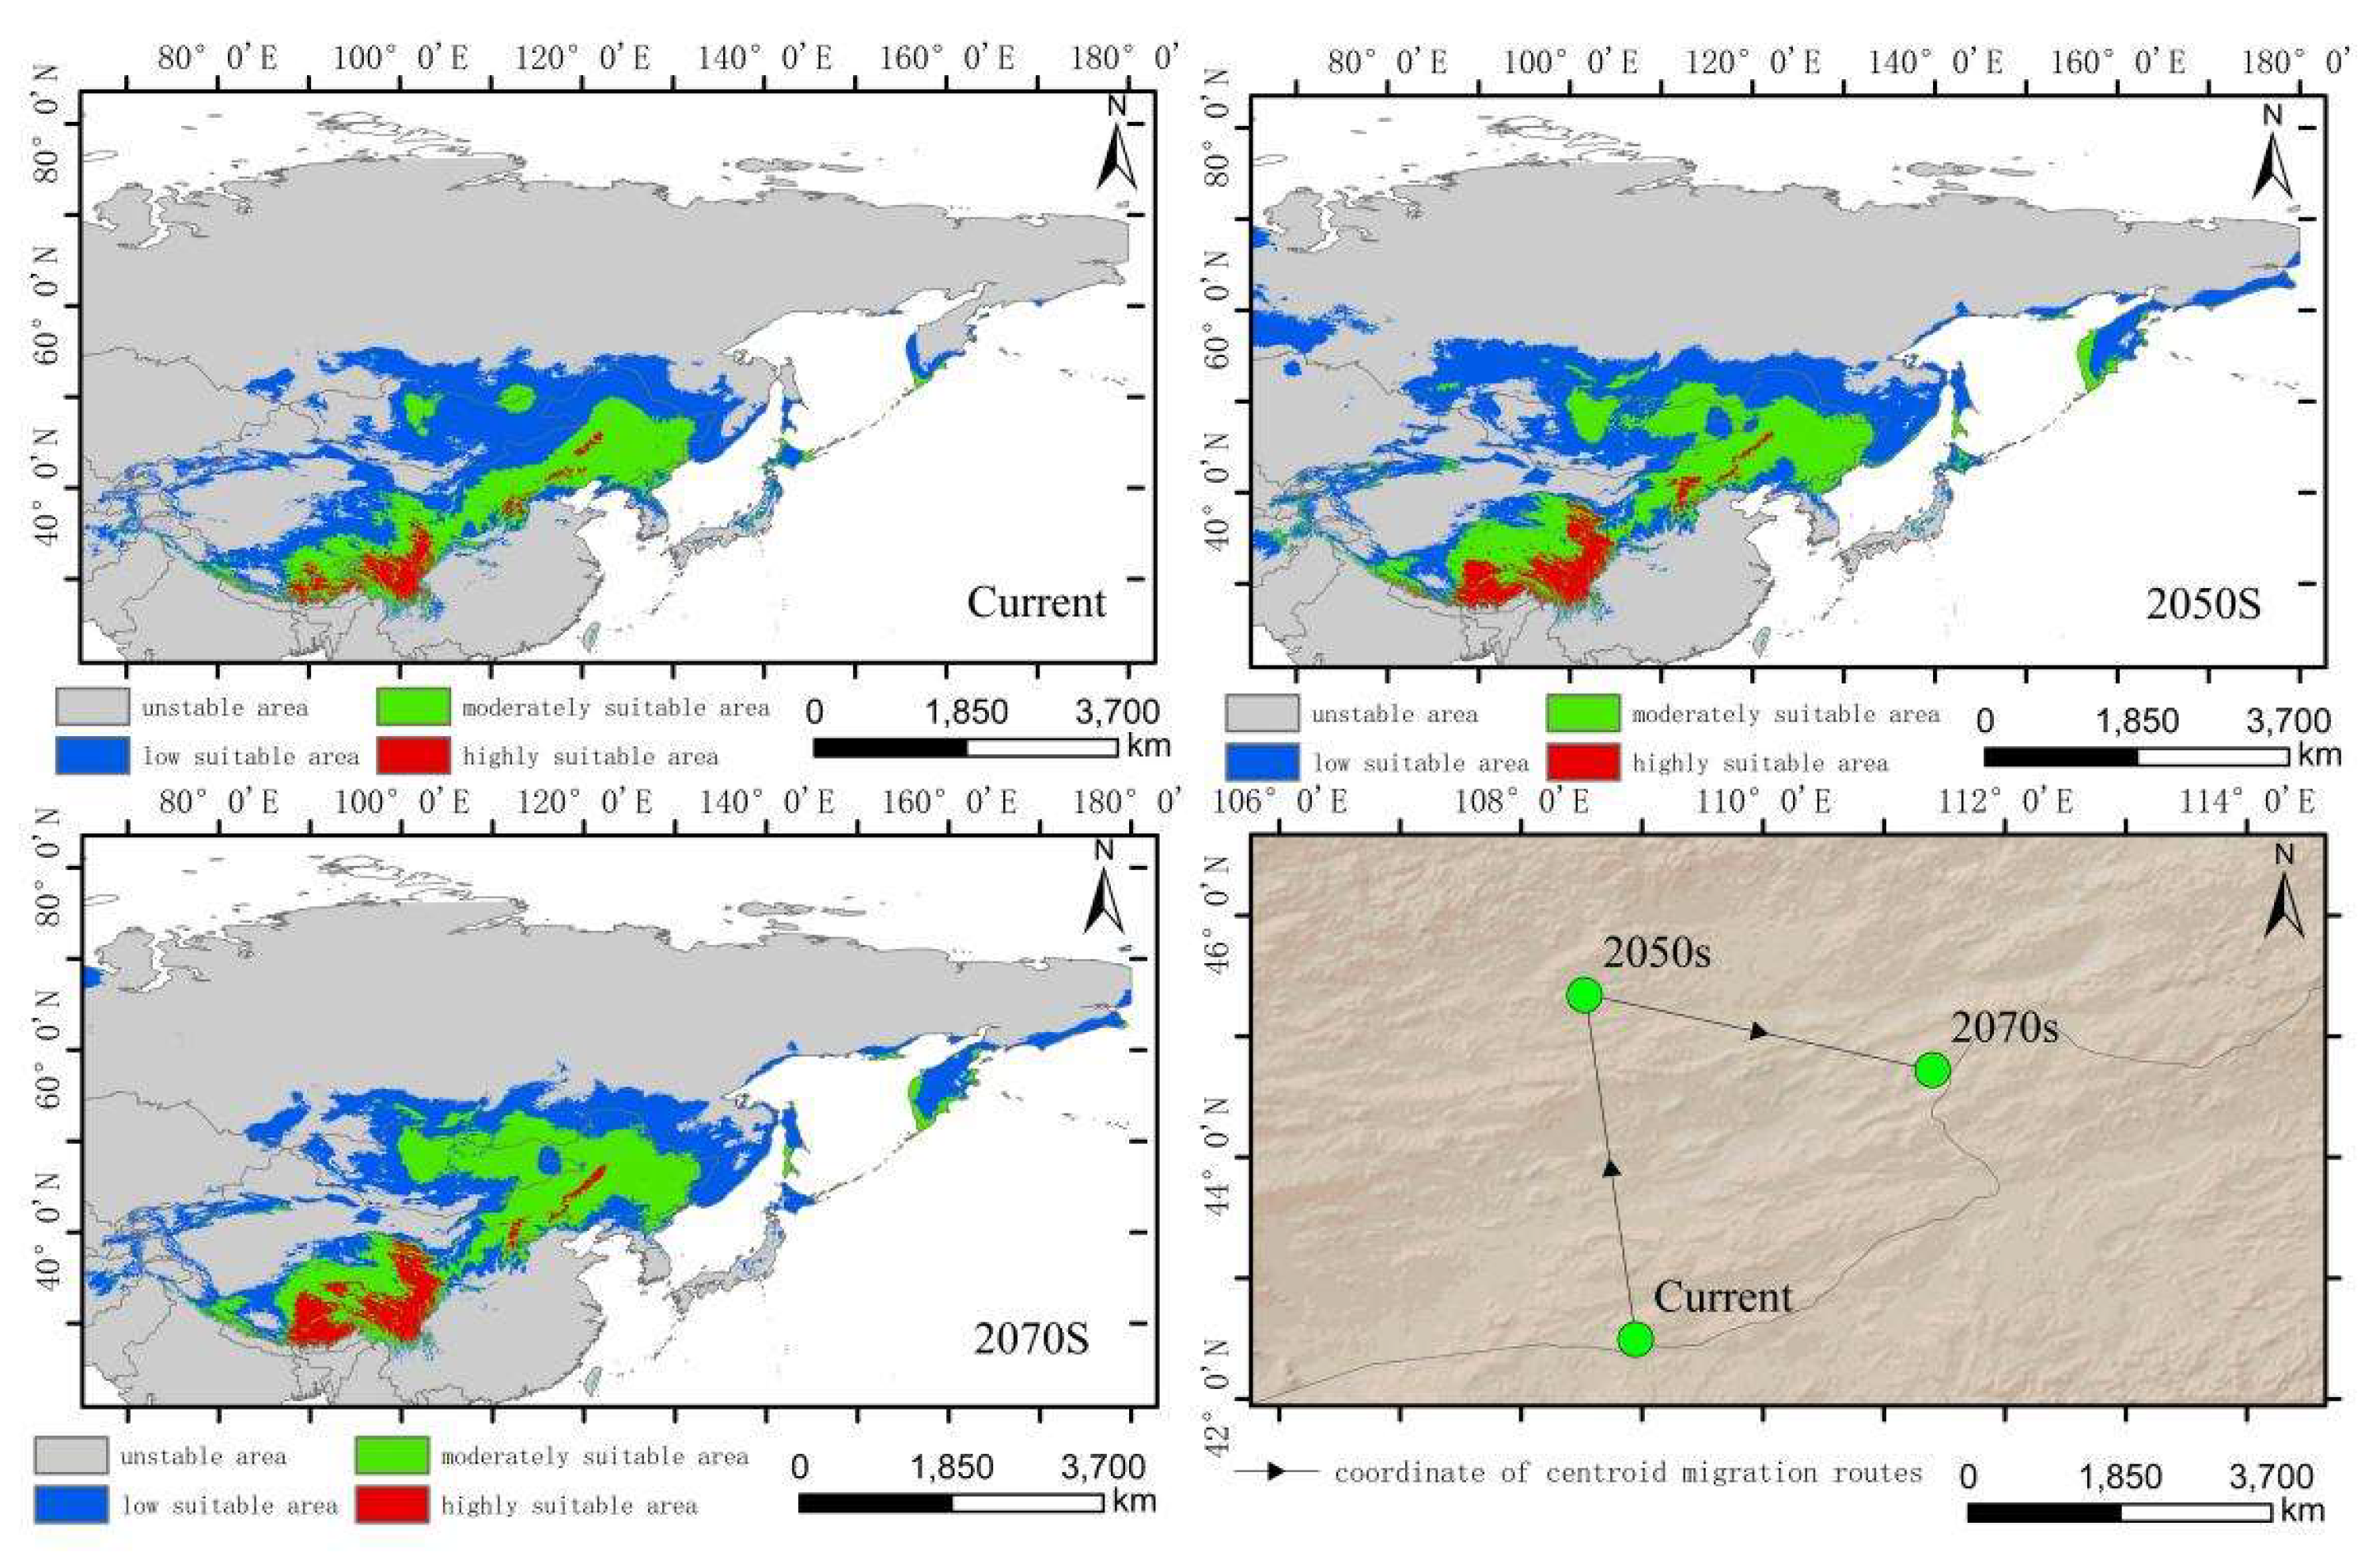
Figure 12.
Dynamic changes in suitable area of Hippuris vulgaris in different periods in integrated distribution model.
Figure 12.
Dynamic changes in suitable area of Hippuris vulgaris in different periods in integrated distribution model.
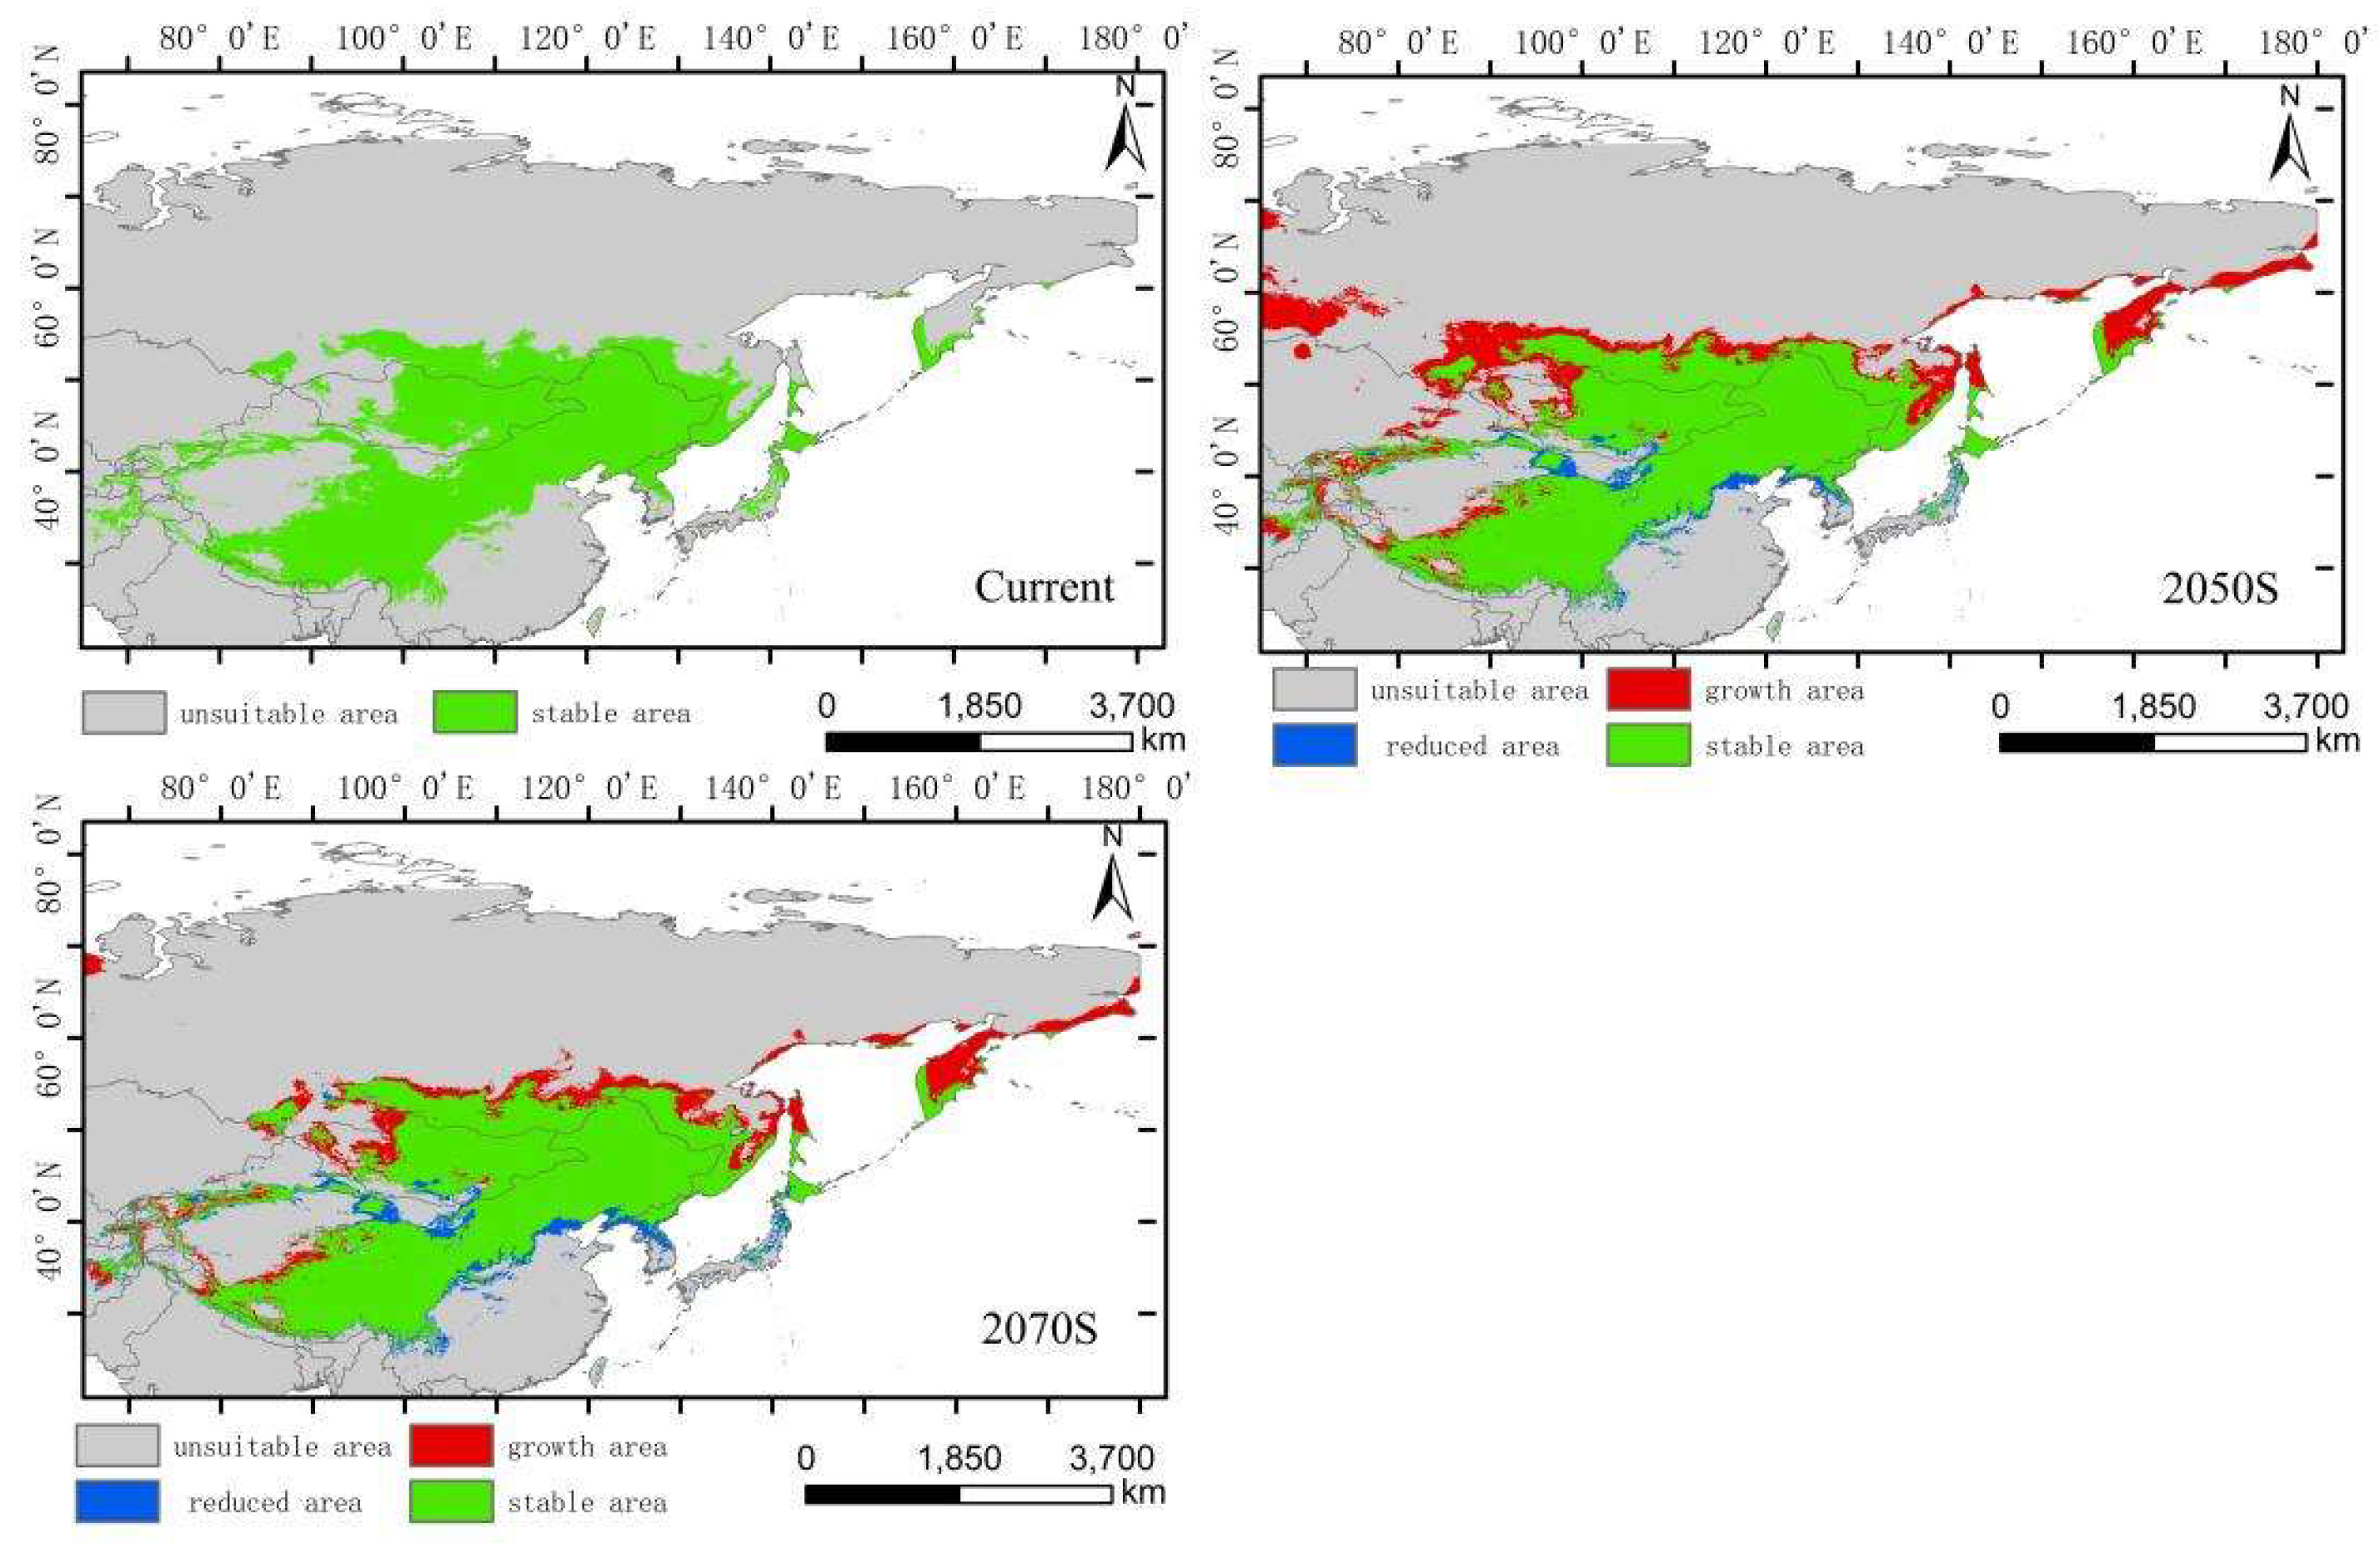

Table 1.
19 bioclimatic variables.
| Environment variables | Description | Unit |
|---|---|---|
| bio1 | Annual Mean Temperature | ℃ |
| bio2 | Mean Diurnal Range(Mean of monthly(max temp - min temp)) | ℃ |
| bio3 | Isothermality | % |
| bio4 | Temperature Seasonality | - |
| bio5 | Max Temperature of Warmest Month | ℃ |
| bio6 | Min Temperature of Coldest Month | ℃ |
| bio7 | Temperature Annual Range | ℃ |
| bio8 | Mean Temperature of Wettest Quarter | ℃ |
| bio9 | Mean Temperature of Driest Quarter | ℃ |
| bio10 | Mean Temperature of Warmest Quarter | ℃ |
| bio11 | Mean Temperature of Coldest Quarter | ℃ |
| bio12 | Annual Precipitation | mm |
| bio13 | Precipitation of Wettest Month | mm |
| bio14 | Precipitation of Driest Month | mm |
| bio15 | Precipitation Seasonality(Coefficient of Variation) | - |
| bio16 | Precipitation of Wettest Quarter | mm |
| bio17 | Precipitation of Driest Quarter | mm |
| bio18 | Precipitation of Warmest Quarter | mm |
| bio19 | Precipitation of Coldest Quarter | mm |
Disclaimer/Publisher’s Note: The statements, opinions and data contained in all publications are solely those of the individual author(s) and contributor(s) and not of MDPI and/or the editor(s). MDPI and/or the editor(s) disclaim responsibility for any injury to people or property resulting from any ideas, methods, instructions or products referred to in the content. |
© 2025 by the authors. Licensee MDPI, Basel, Switzerland. This article is an open access article distributed under the terms and conditions of the Creative Commons Attribution (CC BY) license (http://creativecommons.org/licenses/by/4.0/).
Copyright: This open access article is published under a Creative Commons CC BY 4.0 license, which permit the free download, distribution, and reuse, provided that the author and preprint are cited in any reuse.


