
Submitted:
18 April 2025
Posted:
23 April 2025
You are already at the latest version
Abstract
Methylammonium chloride (MACl) in perovskite solar cells (PSCs) is a key additive known to enhance film quality in dimethyl sulfoxide (DMSO)-based systems, where an optimal concentration of 50 mol% is typically required. However, alternative solvent systems, such as N-methyl-2-pyrrolidone (NMP), have shown potential to reduce additive concentrations while maintaining high performance. This study explores the NMP/DMF (1:9) solvent system and its impact on MACl optimization. The optimal concentration of MACl in NMP-based systems was reduced to 20~30 mol%, representing a substantial decrease from the 50 mol% typically required in DMSO-based formulations. Films produced under these conditions exhibited superior crystallinity, as evidenced by narrower full-width at half maximum (FWHM) values in X-ray diffraction (XRD), and reduced defect densities. These structural improvements translated into enhanced optoelectronic properties, with devices achieving efficiency exceeding 23%, compared to ~20% for DMSO-based counterparts. Furthermore, the NMP-based system demonstrated improved long-term stability under continuous illumination.
Keywords:
perovskite solar cells
; NMP-based solvent
; methylammonium chloride (MACl)
; additive reduction
; precursor engineering
; crystallinity control<
; span style="mso-bidi-font-size: 9.0pt
; mso-fareast-font-family: DengXian
; mso-fareast-th
1. Introduction
Perovskite solar cells (PSCs) have revolutionized the field of photovoltaics, achieving unprecedented power conversion efficiencies (PCEs) that rival or even surpass those of traditional silicon-based solar cells [1,2]. This exceptional performance stems from the unique optoelectronic properties of perovskite materials, including their high absorption coefficients, long carrier diffusion lengths, and tunable bandgaps [3-5]. Additionally, the low-temperature, solution-processable fabrication methods associated with PSCs make them particularly attractive for scalable and cost-effective renewable energy applications. As PSCs approach commercialization, challenges related to device stability, reproducibility, and large-scale manufacturing must be addressed [6-8]. A critical aspect of overcoming these challenges lies in the optimization of perovskite precursor formulations, where solvents and additives play pivotal roles in determining the quality of perovskite films and the overall efficiency of devices [9].
Historically, dimethyl sulfoxide (DMSO) and N,N-dimethylformamide (DMF) have been the most widely used solvents for perovskite precursor solutions [10]. These solvents are highly effective in dissolving essential components, such as lead halides and organic cations, while facilitating controlled crystallization during film formation [11]. The 1:4 volume ratio of DMSO to DMF has been widely recognized as the standard for achieving high-quality perovskite films with uniform morphology and desirable optoelectronic properties [12]. Despite their widespread use, DMSO-based systems are not without limitations. The high volatility of DMSO can disrupt the evaporation dynamics during deposition, leading to non-uniform crystallization and suboptimal film quality [13-17]. Furthermore, the rapid crystallization kinetics associated with DMSO often result in smaller grain sizes and higher defect densities, which negatively impact both efficiency and stability [18,19]. These limitations have prompted researchers to explore alternative solvent systems capable of addressing these challenges while maintaining or enhancing device performance.
Among alternative solvents, N-methyl-2-pyrrolidone (NMP) and N,N′-dimethylpropyleneurea (DMPU) have emerged as promising candidates for perovskite precursor formulations [20,21]. These solvents exhibit distinct physicochemical properties, including lower volatility, higher boiling points, and stronger coordination capabilities with precursor components, which allow for more controlled film formation [22]. This enhanced control over the evaporation and crystallization processes supports the formation of perovskite films with greater uniformity, larger grain sizes, and reduced defect densities. Additionally, the compatibility of these solvents with scalable deposition techniques, such as blade coating and slot-die coating, makes them particularly attractive for industrial-scale manufacturing [23]. Among these, NMP, when combined with DMF at a 1:9 volume ratio, has shown particular promise, producing films with enhanced crystallinity and optoelectronic properties [24,25]. These advancements suggest that NMP could address many of the challenges posed by DMSO while providing a pathway to scalable production. However, while extensive efforts have been made to optimize solvent volume ratios, comparatively little attention has been given to the role of additives in alternative solvent systems.
Additives, such as Methylammonium chloride (MACl), play a crucial role in improving the quality and performance of perovskite films [26-28]. MACl is widely recognized for its ability to enhance crystallinity, promote larger grain sizes, and reduce defect densities, which collectively contribute to higher PCEs and improved device stability. In DMSO-based systems, an optimal MACl concentration of approximately 50 mol% has been established across numerous studies [29,30]. This concentration facilitates uniform crystallization and provides sufficient chloride ions to passivate defects at grain boundaries and charge trap sites [31]. These effects result in films with superior optoelectronic properties and greater stability under operational conditions. However, the transferability of this optimal concentration to alternative solvent systems, such as NMP/DMF, remains largely unexplored. Given the distinct physicochemical properties of NMP, including its lower volatility and unique coordination interactions, it is reasonable to hypothesize that the optimal concentration of MACl in NMP-based systems would differ significantly from that in DMSO-based systems.
The interplay between solvents and additives is a critical but often overlooked factor in perovskite precursor engineering. Solvents influence the solubility, distribution, and reactivity of additives, as well as the kinetics of crystallization and defect passivation [32,33]. For example, NMP’s lower evaporation rate and stronger coordination with precursor components may alter the behavior of MACl during film formation, potentially reducing the required MACl concentration while maintaining or even enhancing film quality. Additionally, the unique chemical interactions between NMP and precursor components may lead to differences in the crystallization dynamics, resulting in improved grain growth and defect reduction. Despite these possibilities, few studies have systematically investigated the combined effects of solvents and additives in NMP-based systems. This gap in understanding limits the ability to fully exploit the advantages offered by alternative solvent systems, particularly in reducing material consumption while achieving high efficiency.
To address this gap, our study investigates the relationship between solvent systems and additive concentrations, with a specific focus on the NMP/DMF (1:9) solvent system. We systematically evaluate how the optimal concentration of MACl in NMP-based systems compares to that in traditional DMSO-based systems. Our findings reveal that the optimal MACl concentration in NMP-based systems can be substantially reduced to 20~30 mol%, representing a notable decrease from the 50 mol% commonly used in DMSO-based systems. Remarkably, this reduction is achieved without compromising film quality or device performance. Films prepared with NMP and 20~30 mol% MACl exhibit superior crystallinity, as evidenced by narrower full-width at half maximum (FWHM) values in X-ray diffraction (XRD) measurements, along with reduced defect densities. These improvements translate into enhanced optoelectronic properties, with devices achieving PCEs exceeding 23%, compared to ~20% for DMSO-based systems [34]. Furthermore, devices fabricated under these conditions demonstrate improved long-term stability under continuous illumination, highlighting the potential of NMP-based systems for scalable PSC manufacturing.
2. Materials and Methods
2.1. Materials
The chemicals were stored in a nitrogen-filled (N2) glove box and used without further purification. The following materials were used in the experiments: formamidine hydroiodide (FAI;99.99%, TCI), lithium bis(trifluoromethanesulfonyl)imide (Li-TFSI;98%, TCI), lead(II) iodide (PbI2;99.99%, TCI), anhydrous N,N-dimethylformamide (DMF;99.8%, Sigma-Aldrich), anhydrous N-methyl-2-pyrrolidone (NMP;99.5%, Sigma-Aldrich), 4-tert-butylpyridine (tBP;98%, Sigma-Aldrich), isopropanol (IPA;99.5%, Sigma-Aldrich), lead(II) bromide (PbBr2;99.999%, Sigma-Aldrich), anhydrous acetonitrile (ACN;99.8%, Sigma-Aldrich), methylammonium chloride (MACl;99.5%, Lumtec), 2,2′,7,7′-tetrakis(N,N-di-p-methoxyphenyl-amine)9,9′-spirobifluorene (Spiro-OMeTAD;99.5%, Lumtec), deionized water (H2O;100%, DAEJUNG), propanone (Acetone;99.7%, SAMCHUN), cyclohexylmethylammonium iodide (CHMAI;GreatCellSolar), tin(IV) oxide (SnO2;15% H2O colloidal dispersion, Alfa Aesar), chlorobenzene (CB;99.5%, Alfa Aesar).
The perovskite precursor solution was prepared to a total molar concentration of 1.35 M by dissolving FAI (1.35 M), PbI2 (1.32975 M), and PbBr2 (0.02025 M) in a mixed solvent of DMF and NMP with a 9:1 volume ratio. MACl was added as an additive at various molar concentrations (0%, 10%, 20%, 30%, 40%, and 50%) relative to the total precursor concentration, corresponding to 0 M, 0.135 M, 0.27 M, 0.405 M, 0.54 M, and 0.675 M, respectively. The solution was stirred at room temperature until fully dissolved and used without filtration.
2.2. Device Fabrication
The indium tin oxide (ITO) substrates were sequentially ultrasonically cleaned in DI water, acetone, and IPA solutions, each for 15 minutes. The cleaned substrates were further treated with UV-ozone for 15 minutes to enhance surface wettability.
The electron transport layer (ETL) was deposited using a spin coating method. A SnO2 solution was prepared by mixing commercial SnO2 dispersion with DI water, maintaining a 1:3 volume ratio. After UV-ozone treatment (15 minutes), 100 µL of the diluted SnO2 solution was statically dropped onto each substrate and spin-coated at 5000 rpm for 30 seconds. The resulting films were then annealed on a hot plate at 155°C for at least 15 minutes to complete the ETL formation.
After ETL deposition, an additional UV-ozone treatment (10 minutes) was applied before depositing the perovskite layer. All processes up to this step were performed under ambient conditions, while the perovskite, inter layer and hole transport layer (HTL) deposition steps were conducted in a dry air environment. For perovskite layer deposition, 50 μL of precursor solution was statically dropped onto the ETL-coated substrate, followed by spin-coating at 3000 rpm for 30 seconds. CB (30 μL) was dripped at 15 seconds into the spin-coating process as an anti-solvent. The perovskite films were then annealed at 155°C for exactly 15 minutes. An inter layer was applied between the perovskite and HTL by spin-coating a CHMAI solution (0.025 M in IPA). A volume of 40 μL was dynamically deposited onto each substrate and spin-coated at 5000 rpm for 30 seconds without additional annealing.
For the HTL deposition, a Spiro-OMeTAD solution was prepared by dissolving Spiro-OMeTAD in CB at a concentration of 0.059 M, followed by doping with t-BP and Li-TFSI (1.18 M). The prepared solution was dynamically spin-coated onto the HTL at 2500 rpm for 30 seconds, with 50 μL of solution dispensed per substrate to ensure uniform coating. No additional annealing step was performed after the coating. Before depositing the metal electrode, the ITO surface at both edges of the substrate was carefully scraped with a blade to ensure direct electrical contact between the electrode and the underlying layers. Finally, gold (Au) electrodes (54.9 nm) were thermally evaporated using a metal mask to complete the device fabrication.
2.3. Measurement Condition
The J-V characteristics were measured under 1 sun equivalent illumination using an Ossila Solar Cell I-V Test System equipped with a LumiSun-50TM LED Solar Simulator (Innovations in Optics, Woburn, MA, USA). The LumiSun-50 TM provides a Class A+A+A+ illumination, closely replicating the AM1.5G solar spectrum with exceptional spectral match and uniformity, ensuring highly accurate photovoltaic performance measurements under standard testing conditions. Incident photon-to-current efficiency (IPCE) measurements were performed using a quantX-300 system (Newport, USA).
AFM data were obtained using an MFP-3D Origin+ system (Oxford Instruments, Oxfordshire, UK). SEM images were captured in planar view using a Hitachi SU8600. XRD analysis was conducted with a Rigaku SmartLab instrument (Rigaku, Tokyo, Japan), employing Cu Kα radiation and recording data at 0.02° intervals.
AFM, SEM, and XRD analyses were conducted at the Central Laboratory of Hankyong National University using samples prepared with a structure consisting of ITO substrates coated with SnO2 and perovskite layers only. In contrast, J–V measurements were performed on fully fabricated devices, including the HTL and metal electrode.
3. Results and Discussion
To investigate the effect of MACl molar concentration on the crystal structure of perovskite films, XRD analysis was performed. As illustrated in Figure 1a, the perovskite precursor solution was prepared using an NMP-based solvent system and deposited via the anti-solvent method [35]. Measurements were conducted under two different conditions: one in the wet state, referring to the moment immediately after spin-coating the precursor solution, before any thermal treatment; and the other in the annealed state, following thermal annealing. The perovskite composition was fixed as FAPb(I0.99Br0.01)3, and MACl was added at six different molar concentrations: 0%, 10%, 20%, 30%, 40%, and 50%. All samples were analyzed in the 2θ range of 5° to 30°.
Since the wet state reflects the initial stage of crystallization before thermal annealing, it plays a critical role in determining the final quality of perovskite films. As such, analyzing the phase composition in this early stage can provide key insights into film formation mechanisms [36]. In the XRD results obtained from the wet state (Figure 1b), three major peaks were identified: the intermediate phase around 9°, the δ-phase (yellow phase) around 12°, and the α-phase (black phase) around 14°. The α-phase peak was not observed in the 0% and 10% MACl samples, but became evident from 20% and higher. The δ-phase appeared from 0% and gradually decreased in intensity from 20% as the MACl concentration increased, although an unusually high intensity was observed at 50%. This unexpectedly high δ-phase intensity at 50% indicates that this condition may not be favorable for high-quality perovskite formation, given the non-photoactive nature of the δ-phase. The intermediate phase was present across all concentrations, showing the highest intensity at 40%. This intermediate phase, commonly observed in NMP-based solvent systems, originates from the coordination between PbI2 and NMP [37].
A clearly observed α-phase peak in the wet state indicates the presence of a favorable α-phase seed that facilitates the formation of a strong α-phase peak in the annealed state, as shown in Figure 1c [38]. Therefore, the 20%, 30%, and 40% MACl conditions (Figure 1b), which exhibited a well-defined α-phase peak without excessively high δ-phase intensity, were selected for comparison. The δ-phase, known as a non-photoactive phase, showed a decrease in intensity as the MACl concentration increased. In contrast, the intermediate phase, which requires an appropriate amount to facilitate proper crystallization, exhibited an increasing trend. To more accurately assess the crystal quality, the FWHM of the α-phase peak observed in the wet state was calculated using Voigt function-based peak fitting.
The Voigt function, a convolution of a Gaussian and a Lorentzian function, is expressed as follows:
In this equation, I(x) denotes the XRD intensity, x0 represents the central peak position, σ corresponds to the Gaussian width, γ to the Lorentzian width, and η is the weighting factor between the two functions. The FWHM values calculated using this model for the 20%, 30%, and 40% MACl concentrations are summarized in Table 1. Among these, the 40% condition exhibited the highest FWHM values across all three fitting functions: 0.388 (Gaussian), 0.284 (Lorentzian), and 0.129 (Pseudo-Voigt). The relatively broad α-phase peak and the pronounced intensity of the intermediate phase under the 40% condition suggest inferior crystallinity and less uniform crystal growth compared to the other samples [39-41].
In the XRD patterns measured in the annealed state (Figure 1c), the intermediate phase peaks completely disappeared across all conditions, indicating full solvent evaporation and stabilization of the crystal structure [42,43]. The α-phase peak near 14° showed very low intensity under the 0% and 10% MACl conditions, making it difficult to confirm the presence of a well-formed crystal structure. In contrast, samples containing 20% or more MACl exhibited significantly stronger α-phase peaks, confirming the formation of a crystalline perovskite phase. This suggests that the crystallization behavior observed in the annealed state is strongly influenced by the initial phase formation in the wet state, where favorable α-phase seeds can serve as the foundation for high-quality crystal growth during subsequent annealing. The promotion of α-phase formation with increasing MACl content can also be visually confirmed when the substrates in the wet state are partially dried through solvent evaporation. Supporting visual evidence for this observation is provided in Figure S1.
Additionally, a new diffraction peak appeared near 13°, corresponding to residual PbI2. This peak was not observed in the 0% and 10% conditions, was faintly detected at 20% and 30%, and became markedly more intense at 40% and 50%. These results suggest that while MACl promotes the formation of the α-phase, it also leads to an increase in residual PbI2. Among the samples with well-formed α-phase (i.e., 20% and above), only the 20% and 30% conditions showed relatively low PbI2 peak intensities. These results collectively suggest that MACl concentrations of 20% and 30% are optimal for producing perovskite films with superior crystallinity, as consistently supported by both pre- and post-annealing XRD analysis.
To complement the XRD results, Figure 1d presents optical images of the perovskite films, visually illustrating the film appearance and surface evolution for each MACl concentration (0%, 10%, 20%, 30%, 40%, and 50%) at two different stages: the wet state (immediately after spin-coating) and the annealed state (after complete thermal processing). In the wet state, the film with 0% MACl appeared very light and transparent, with negligible crystallization. The 10% sample displayed an unusual brownish hue and poor crystallinity, especially at the center of the film. In contrast, samples with MACl concentrations of 20% or higher exhibited deeper coloration and more uniformly formed crystals, with the crystal size increasing with MACl content. However, in the 40% and 50% conditions, the crystal grains became excessively large, resulting in the formation of pinholes and appearance of abnormal particulate features.
In the annealed state, the films maintained a trend consistent with the wet-state observations, but showed significantly improved grain growth and surface uniformity. The visual results presented in Figure 1d are in strong agreement with the crystallization behavior observed in the XRD analysis and clearly suggest a threshold MACl concentration necessary for initiating effective perovskite crystallization.
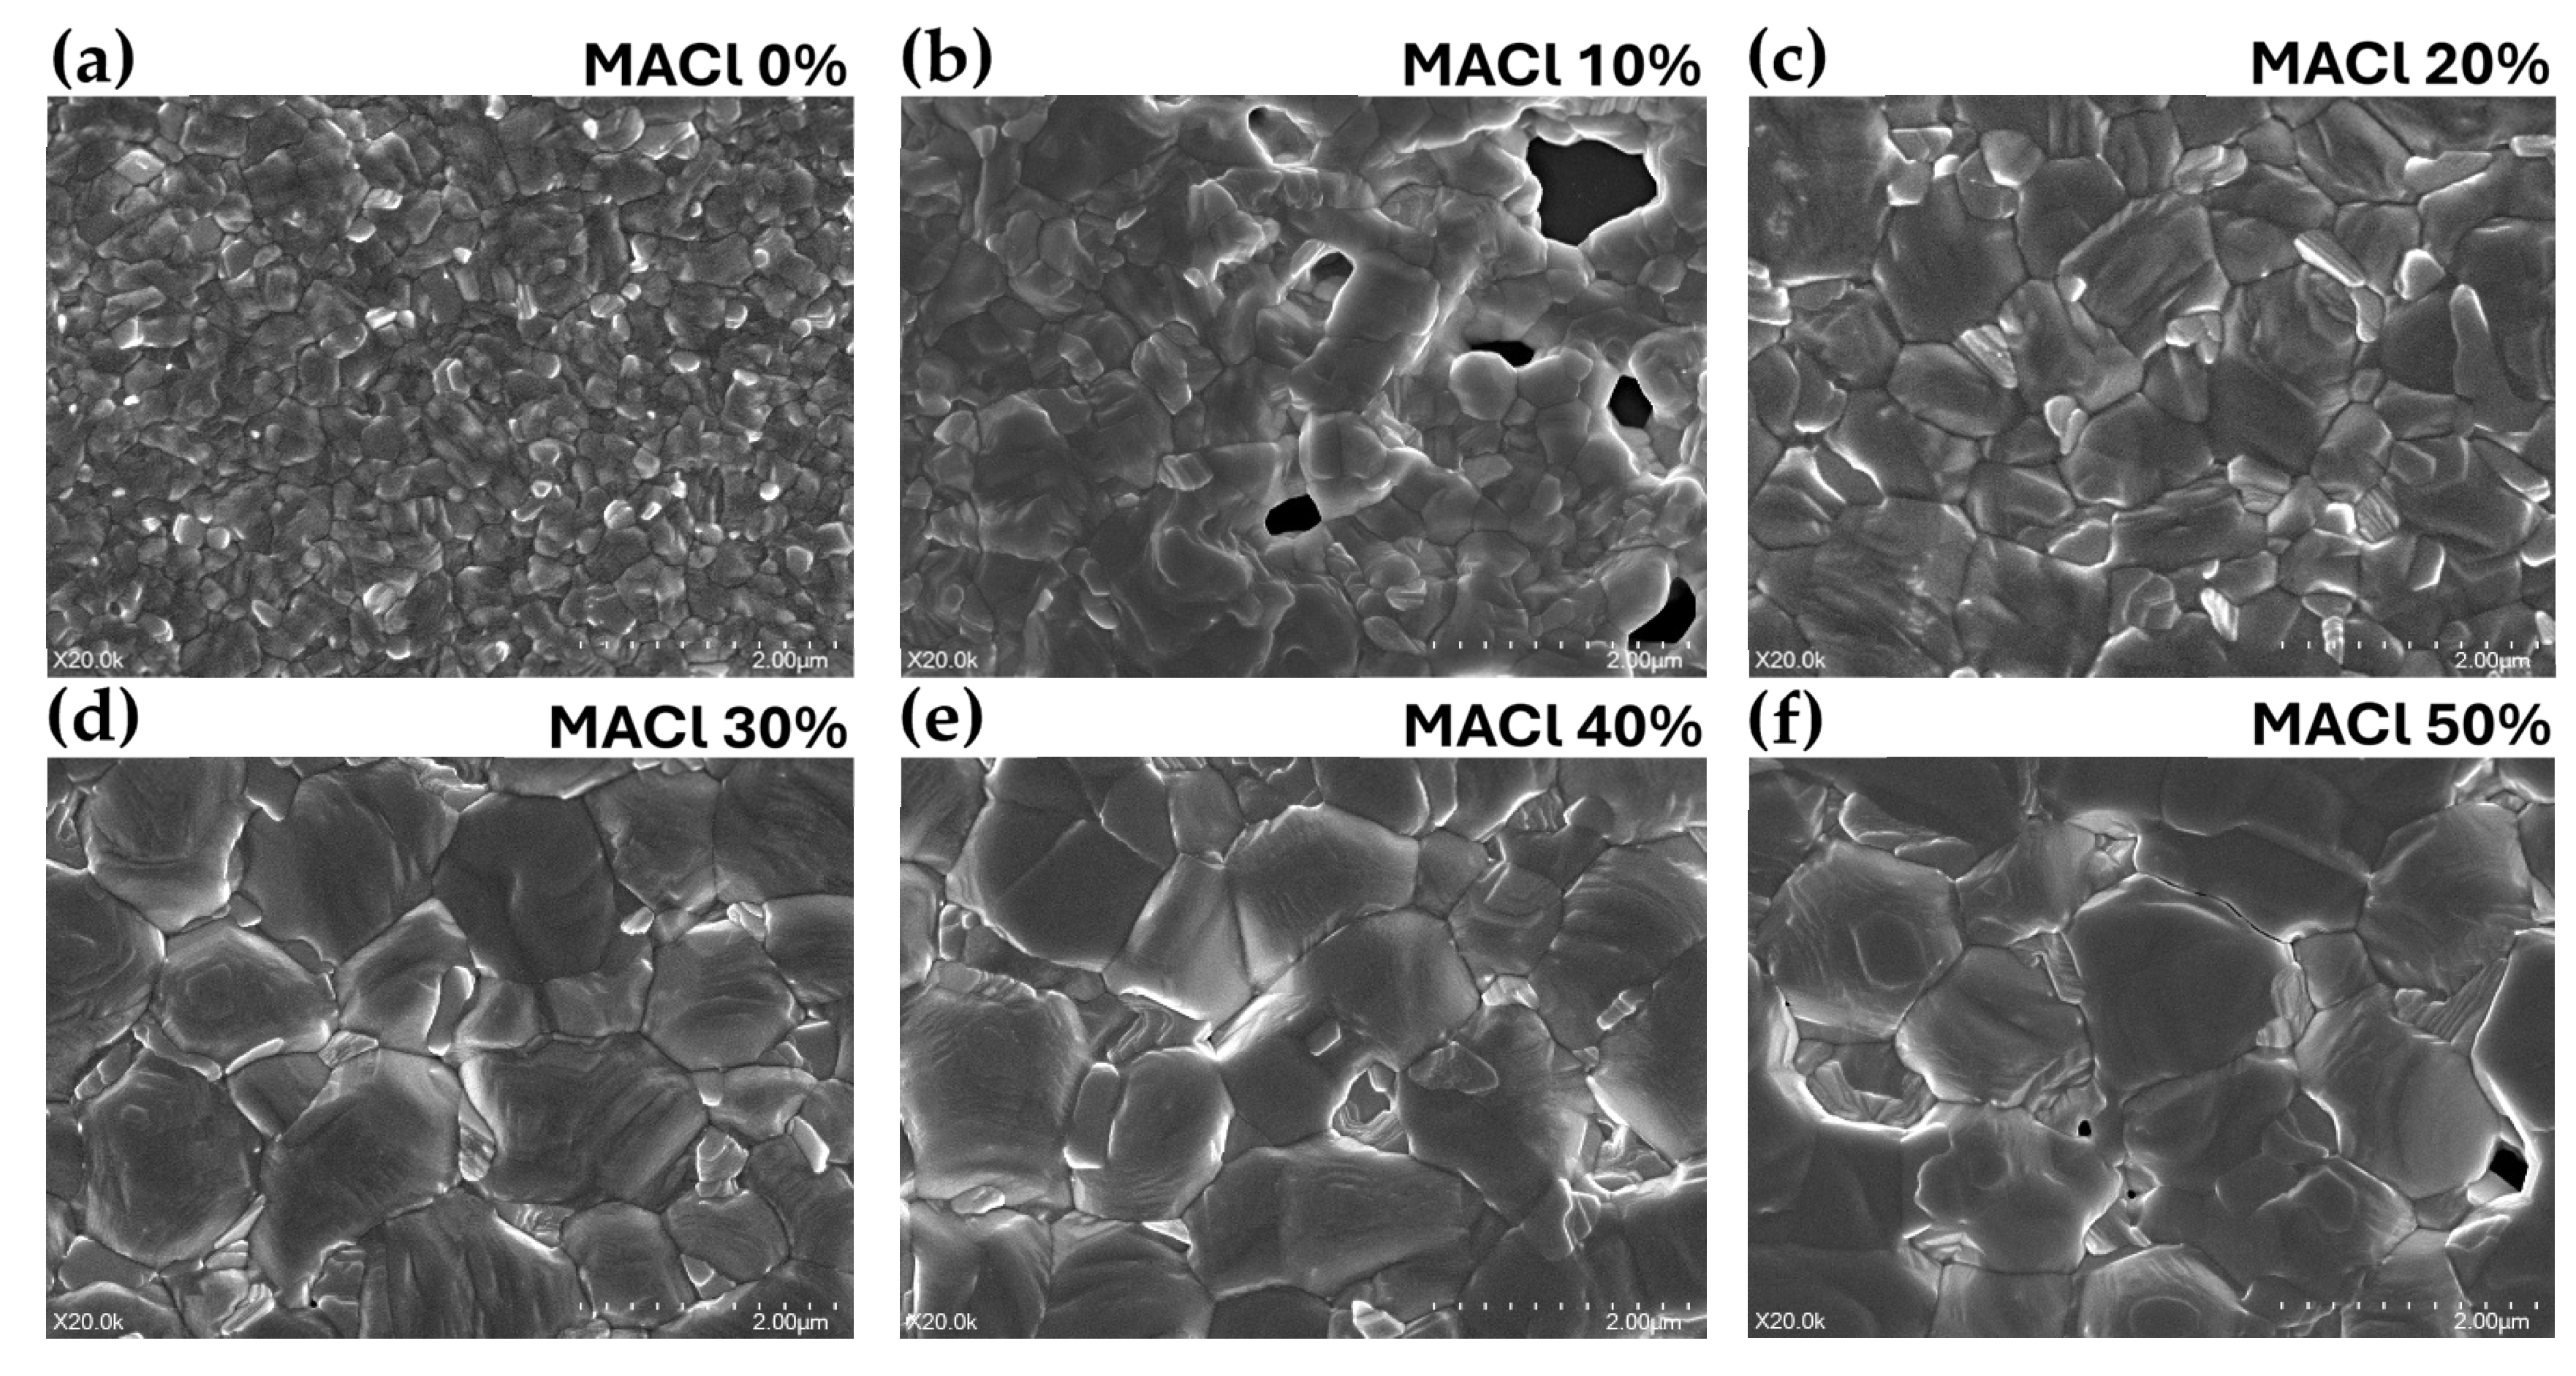
Based on the previous XRD analysis, the crystallization behavior of perovskite films was investigated as a function of MACl molar concentration in an NMP-based solvent system. To further examine the morphological characteristics of the films in greater detail, surface structures of the perovskite films in the annealed state were observed using scanning electron microscopy (SEM), as presented in Figure 2. All samples were imaged at a magnification of 20,000x, and the MACl concentrations were varied from 0% to 50%. The perovskite composition and other fabrication conditions were kept consistent with those used in prior measurements (Figure 2a–f). Under the 0% MACl condition (Figure 2a), significantly smaller grain sizes were observed compared to the other samples. Although the surface was relatively uniform and no prominent defects or pinholes were visible, the small grain size indicated poor overall crystallinity. In the case of 10% MACl (Figure 2b), the film exhibited the poorest crystallinity among all samples, with non-uniform particle distribution and numerous pinholes across a large area, suggesting incomplete crystal growth and low film density.
At 20% MACl (Figure 2c), the grains were densely packed and uniform in size, with well-defined grain boundaries and a smooth surface. No observable defects or pinholes were present, indicating the formation of a compact and high-quality crystal structure. The 30% MACl sample (Figure 2d) displayed a similarly dense and uniform morphology, though with slightly larger grains, while still maintaining excellent film uniformity and coverage. For the 40% MACl condition (Figure 2e), further grain growth was observed, accompanied by increased height variation between grains, resulting in a less uniform surface. Grain boundaries appeared more disconnected, and slight height differences were noticeable between adjacent grains. At 50% MACl (Figure 2f), the grains became even larger and more irregular in shape, leading to a notable decrease in uniformity and an increase in surface roughness. Pinholes were observed both between and within the grains, likely due to excessive grain growth.
These SEM observations highlight the evolution of perovskite film microstructure and surface morphology depending on MACl concentration. However, since SEM is limited in its ability to quantitatively assess surface topography and roughness, atomic force microscopy (AFM) was subsequently employed to more precisely evaluate height distribution and film compactness.
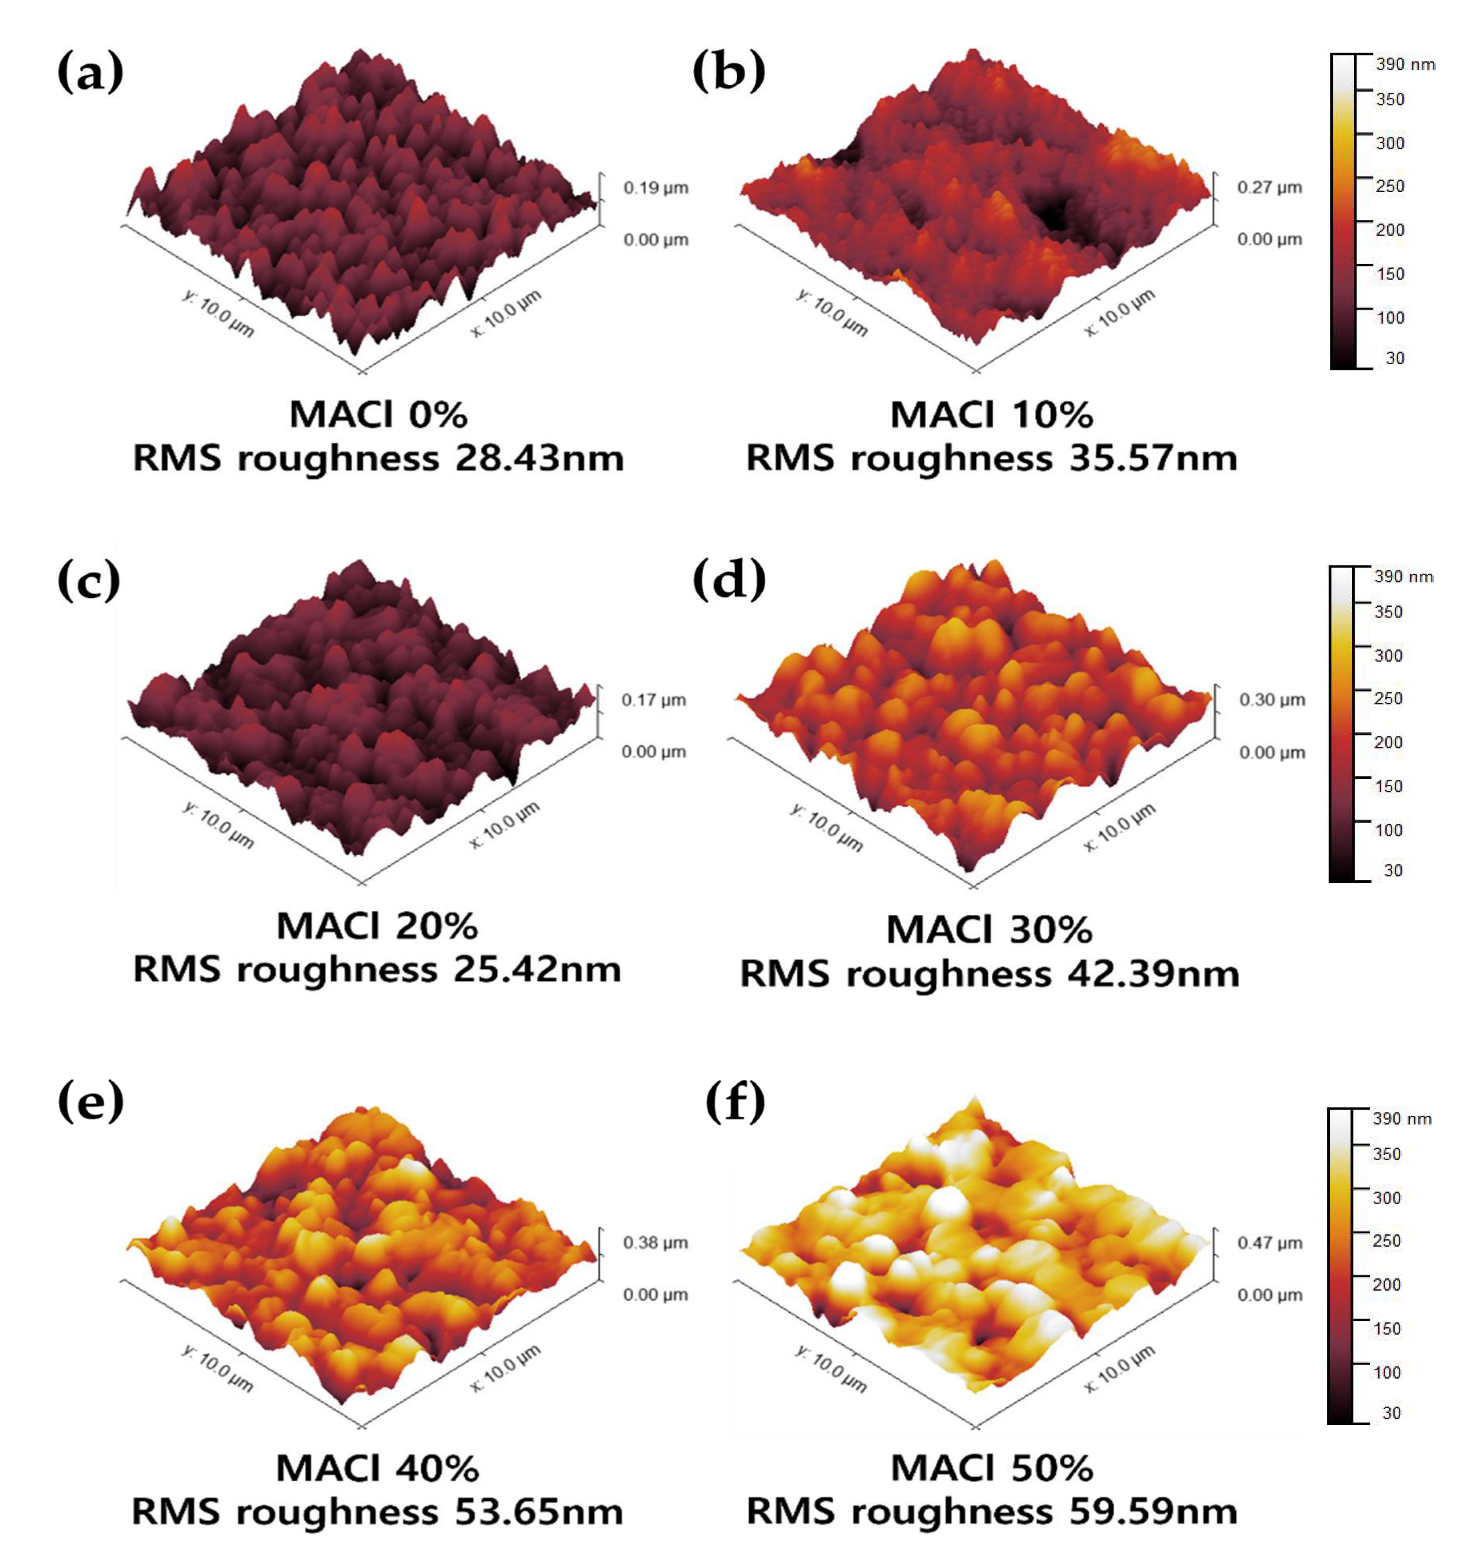
To supplement the limitations of SEM in providing detailed surface information, atomic force microscopy (AFM) was employed to more precisely evaluate the surface height distribution, roughness, and compactness of the films. Figure 3 presents 3D surface morphology images of perovskite films fabricated with six different MACl concentrations, ranging from 0% to 50%, using an NMP-based solvent system (Figure 3a–f). The perovskite composition and other fabrication conditions were kept consistent throughout all measurements. In the 0% MACl condition (Figure 3a), relatively small yet uniform crystal grains were observed, and the surface morphology appeared overall flat. The RMS (root-mean-square) roughness was measured to be 28.43 nm, which is consistent with the trend of small and dense crystal formation observed in SEM analysis. In contrast, the 10% condition (Figure 3b) exhibited highly non-uniform crystal formation, with localized depressions present on the surface, resulting in an increased RMS roughness of 35.57 nm.
The 20% condition (Figure 3c) exhibited the lowest RMS roughness of 25.42 nm and showed a dense and uniform surface morphology, representing an ideal crystal structure. This result closely aligns with the SEM observations of optimal crystal formation. The 30% condition (Figure 3d) also displayed similar uniformity and morphology; however, as the grain size slightly increased, the RMS roughness also increased to 42.39 nm. At 40% MACl (Figure 3e), excessive grain growth led to noticeable height differences between adjacent grains, increasing the RMS roughness to 53.65 nm. Both grain size irregularity and surface roughness were clearly observed. Finally, the 50% condition (Figure 3f) showed further grain growth and pronounced height variation between grains, resulting in the highest RMS roughness of 59.59 nm. The surface appeared rough and uneven, and the non-uniform grain size suggested the possibility of local defect formation.
Through AFM analysis, it was confirmed that MACl concentrations in the range of 20–30% led to the most compact and smooth surface morphologies, which closely matched the trends observed in XRD, SEM, and visual inspection. This comprehensive analysis of crystallographic structure, surface morphology, and roughness as a function of MACl concentration provided a systematic understanding of the physical property variations in perovskite films. Based on these findings, we proceeded to investigate how these differences in film properties affect the photovoltaic performance of actual solar cell devices. To this end, current–voltage (J–V) measurements and other electrical performance evaluations were conducted on devices fabricated under the same conditions.
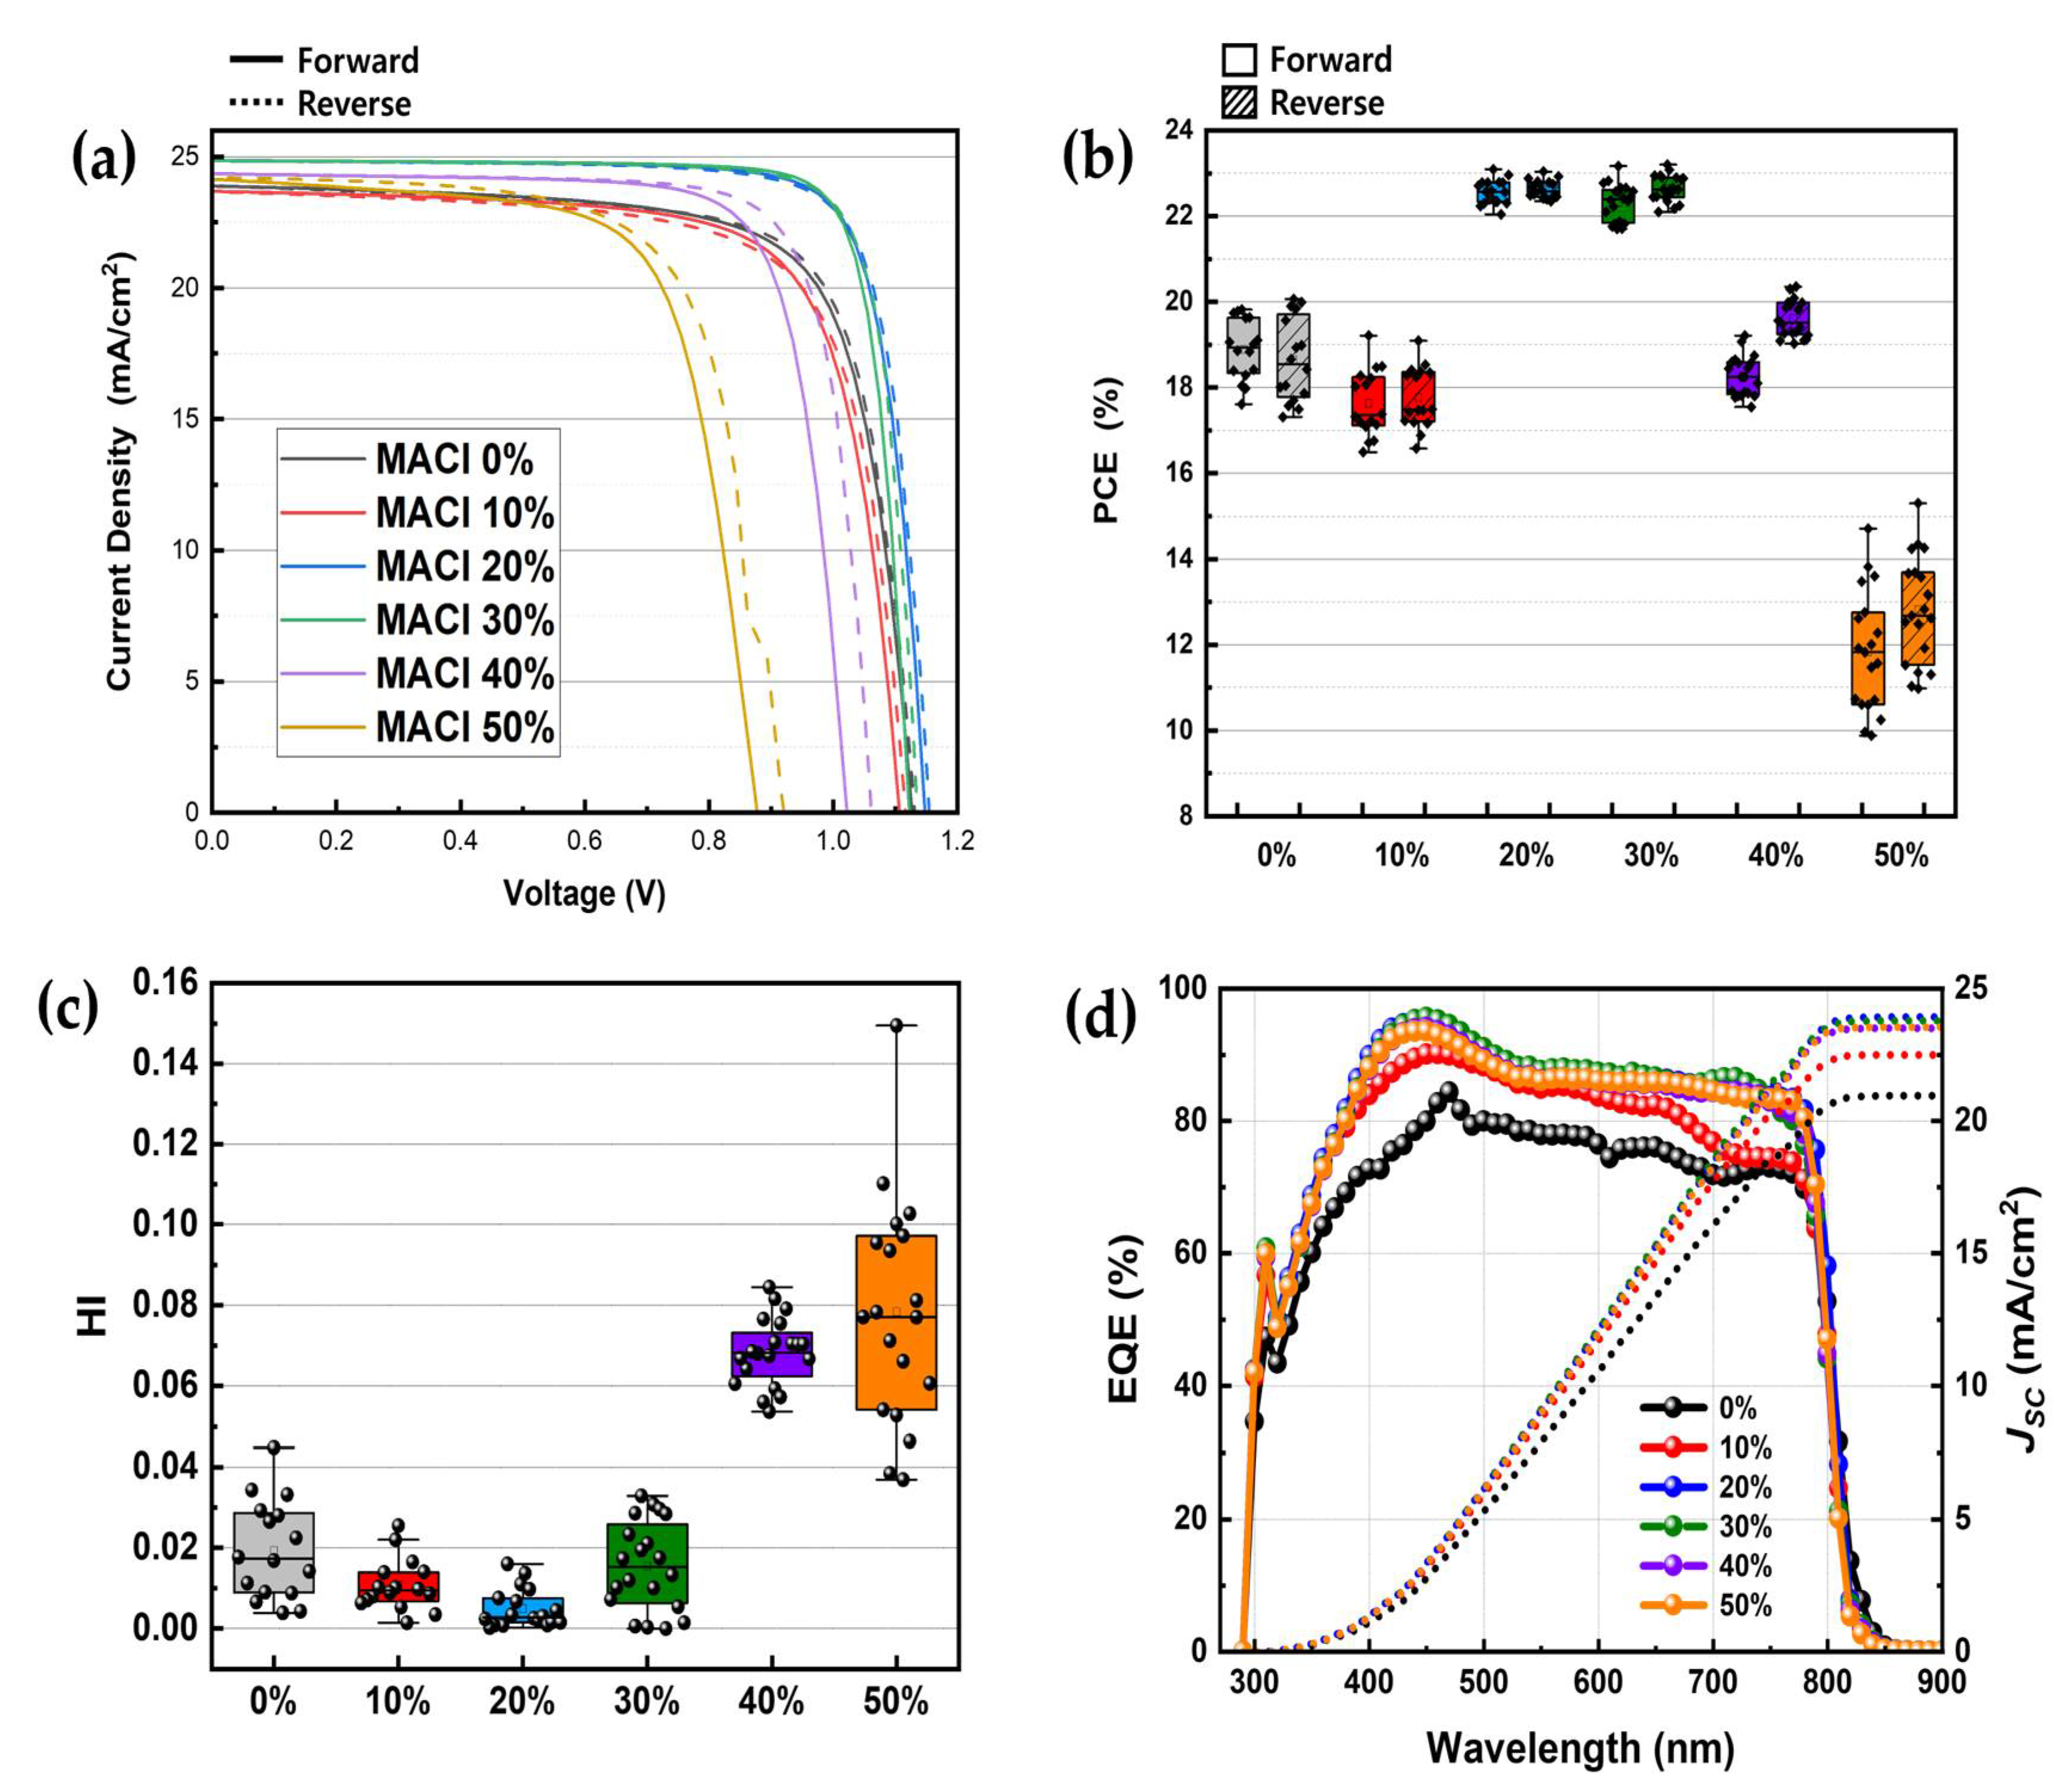
To evaluate the actual photovoltaic performance of the devices, solar cells with an ITO/ETL/Perovskite/HTL/Au structure were fabricated using an NMP-based solvent system, in which only the molar concentration of MACl added to the perovskite precursor solution was varied across samples. The resulting perovskite solar cells were characterized by J–V measurements, EQE analysis, and HI evaluation, as shown in Figure 4. In addition, more detailed distributions of short-circuit current density (JSC), open-circuit voltage (VOC) and fill factor (FF) for each MACl concentration are presented in the form of box plots in Figure S2. Figure 4a presents representative J–V curves measured under different MACl concentrations. The 20% and 30% MACl conditions exhibited the highest performance with elevated JSC, VOC, and FF. In particular, the 30% sample achieved the highest PCE of 23.2%. This aligns with earlier results in which these conditions yielded the most compact and uniform crystalline films. In contrast, devices fabricated with 0% and 10% MACl showed relatively low JSC and FF values, resulting in poor performance, consistent with prior characterization. Notably, the 10% condition yielded even lower efficiency than the 0% case, suggesting that the addition of an insufficient amount of additive may be more detrimental than excluding it entirely. Devices with 40% and 50% MACl showed a performance decline with increasing concentration, as evidenced by reductions in JSC, VOC, and FF, which supports the hypothesis that excessive grain growth can lead to surface non-uniformity and pinhole formation. A comprehensive comparison of PCE, JSC, VOC, and FF values, including their standard deviations, is provided in Table 2.
Figure 4b visualizes the distribution of PCE values for multiple devices in the form of a box plot. The 20% and 30% samples exhibited the highest average PCEs with the smallest deviations, indicating both superior performance and excellent reproducibility. Additionally, Figure 4c shows a box plot comparison of HI values, revealing the lowest hysteresis in the 20% and 30% conditions and significantly greater hysteresis in the 40% and 50% samples. Finally, Figure 4d presents the EQE spectra of selected devices, measured over a wavelength range of 290–900 nm. The JSC values calculated from EQE integration closely matched those obtained from the J–V measurements.
These final results, which reflect the true photovoltaic performance of the devices, show excellent agreement with earlier material and morphological characterizations such as XRD, SEM, and AFM. Collectively, they allow for the reliable identification of the optimal MACl additive concentration for perovskite solar cell fabrication.
5. Conclusions
In this study, the effect of MACl concentration on the crystallization and device performance of perovskite films was systematically investigated to determine the optimal MACl concentration in a DMF:NMP (9:1) solvent system. Structural and morphological analyses (XRD, SEM, AFM) showed that 20–30% MACl yielded optimal α-phase formation, grain size, and surface uniformity, while higher concentrations led to surface irregularities and pinhole formation. These trends were consistent with photovoltaic performance, with 20% and 30% samples exhibiting minimal hysteresis and achieving a maximum PCE of 23%. Although NMP is increasingly used as an alternative to DMSO, additive concentrations are often still based on DMSO-optimized formulations, which typically require around 50 mol% of MACl. This study demonstrates that only half the additive is required in NMP-based systems to form high-quality films, which also outperformed their DMSO-based counterparts, highlighting NMP’s strong potential as a scalable and efficient alternative solvent for perovskite solar cell fabrication.
Supplementary Materials
The following supporting information can be downloaded at: https://www.mdpi.com/article/doi/s1, Figure S1: Optical images of perovskite films at the semi-dried state after approximately 1 hour of ambient exposure for each MACl concentration (0%, 10%, 20%, 30%, 40%, and 50%).; Figure S2: Statistical distribution of photovoltaic parameters—(a) JSC, (b) VOC, and (c) FF—for perovskite solar cells fabricated with varying MACl concentrations (0%, 10%, 20%, 30%, 40%, and 50%).
Author Contributions
Conceptualization, J.G., S.M.J. and G.M.K.; formal analysis, J.G., S.M.J. and G.M.K.; investigation, J.G.; data curation, J.G.; writing—original draft preparation, J.G.; writing—review and editing, G.M.K.; supervision, S.M.J. and G.M.K. All authors have read and agreed to the published version of the manuscript.
Funding
This project was funded by the Korea Institute of Energy Technology Evaluation and Planning (KETEP) (RS-2022-KP002725), and the Ministry of Trade, Industry & Energy (MOTIE) of the Republic of Korea.
Data Availability Statement
The data collected in this study are presented and available in this article.
Acknowledgments
We are grateful for the XRD, SEM, and AFM measurements conducted at the Central Laboratory of Hankyong National University.
Conflicts of Interest
The authors declare no conflicts of interest.
References
- Yang, C.; Hu, W.; Liu, J.; Han, C.; Gao, Q.; Mei, A.; Zhou, Y.; Guo, F.; Han, H. Achievements, challenges, and future prospects for industrialization of perovskite solar cells. Light: Science & Applications 2024, 13, 227. [Google Scholar] [CrossRef]
- Abdi Jalebi, M. The Future of Halide Perovskite Solar Cells. Nanoscale and Advanced Materials 2024, 1, 87–94. [Google Scholar] [CrossRef]
- Manser, J.S.; Christians, J.A.; Kamat, P.V. Intriguing Optoelectronic Properties of Metal Halide Perovskites. Chemical Reviews 2016, 116, 12956–13008. [Google Scholar] [CrossRef]
- Correa-Baena, J.-P.; Saliba, M.; Buonassisi, T.; Grätzel, M.; Abate, A.; Tress, W.; Hagfeldt, A. Promises and challenges of perovskite solar cells. Science 2017, 358, 739–744. [Google Scholar] [CrossRef] [PubMed]
- Afre, R.A.; Pugliese, D. Perovskite Solar Cells: A Review of the Latest Advances in Materials, Fabrication Techniques, and Stability Enhancement Strategies. Micromachines 2024, 15, 192. [Google Scholar] [CrossRef] [PubMed]
- Seyisi, T.; Fouda Mbanga, B.G.; Mnyango, J.; Nthwane, Y.; Nyoni, B.; Mhlanga, S.; Hlangothi, P.; Tywabi-Ngeva, Z. Major challenges for commercialization of perovskite solar cells: A critical review. Energy Reports 2025, 13, 1400–1415. [Google Scholar] [CrossRef]
- Hossain, K.; Nayak, S.; Kabra, D. Challenges and opportunities in high efficiency scalable and stable perovskite solar cells. Applied Physics Letters 2024, 125. [Google Scholar] [CrossRef]
- Zhu, P.; Chen, C.; Dai, J.; Zhang, Y.; Mao, R.; Chen, S.; Huang, J.; Zhu, J. Toward the Commercialization of Perovskite Solar Modules. Advanced Materials 2024, 36, 2307357. [Google Scholar] [CrossRef]
- Jiao, J.; Yang, C.; Wang, Z.; Yan, C.; Fang, C. Solvent engineering for the formation of high-quality perovskite films:a review. Results in Engineering 2023, 18, 101158. [Google Scholar] [CrossRef]
- Petrov, A.A.; Ordinartsev, A.A.; Fateev, S.A.; Goodilin, E.A.; Tarasov, A.B. Solubility of Hybrid Halide Perovskites in DMF and DMSO. Molecules 2021, 26. [Google Scholar] [CrossRef]
- Shargaieva, O.; Näsström, H.; Smith, J.A.; Többens, D.; Munir, R.; Unger, E. Hybrid perovskite crystallization from binary solvent mixtures: interplay of evaporation rate and binding strength of solvents. Materials Advances 2020, 1, 3314–3321. [Google Scholar] [CrossRef]
- Zhang, H.; Darabi, K.; Nia, N.Y.; Krishna, A.; Ahlawat, P.; Guo, B.; Almalki, M.H.S.; Su, T.-S.; Ren, D.; Bolnykh, V.; et al. A universal co-solvent dilution strategy enables facile and cost-effective fabrication of perovskite photovoltaics. Nature Communications 2022, 13, 89. [Google Scholar] [CrossRef] [PubMed]
- Sun, K.; Wang, Z.; Li, N.; Liu, L.; Xiong, W.; Xu, Z.; Geng, Z.; Guo, X.; Jiang, Y.; Feng, S.-P.; et al. Dynamic Reconstruction of Fluid Interface Manipulated by Fluid Balancing Agent for Scalable Efficient Perovskite Solar Cells. Advanced Materials 2025, 37, 2419419. [Google Scholar] [CrossRef]
- Hu, C.; Shivarudraiah, S.B.; Sung, H.H.Y.; Williams, I.D.; Halpert, J.E.; Yang, S. Discovery of a New Intermediate Enables One-Step Deposition of High-Quality Perovskite Films via Solvent Engineering. Solar RRL 2021, 5, 2000712. [Google Scholar] [CrossRef]
- Huang, X.; Wu, B.; Zheng, N. Optimizing Solvent Chemistry for High-Quality Halide Perovskite Films. Accounts of Materials Research 2025, 6, 40–51. [Google Scholar] [CrossRef]
- Bian, Z.-K.; Su, Z.; Lou, Y.-H.; Chen, J.; Jin, R.-J.; Chen, C.-H.; Xia, Y.; Huang, L.; Wang, K.-L.; Gao, X.; et al. Removal of Residual Additive Enabling Perfect Crystallization of Photovoltaic Perovskites. Angewandte Chemie International Edition 2025, 64, e202416887. [Google Scholar] [CrossRef]
- Kim, G.M.; Oh, E.S.; Jena, A.K.; Miyasaka, T. Sensitivity of mixed cation/halide perovskites to evaporation kinetics of DMSO at an early stage. Journal of Materials Chemistry A 2021, 9, 26248–26255. [Google Scholar] [CrossRef]
- Zhu, Z.; Xu, J.; Zhou, Y.; Ge, S.; Yu, T.; Yang, J.; Bao, C.; Zou, Z. Crystallization regulation and defect suppression of CsPbI2Br perovskite using a dual-functional additive. Applied Physics Letters 2025, 126. [Google Scholar] [CrossRef]
- Wang, Z.; Duan, X.; Zhang, J.; Yuan, W.; Qu, D.; Chen, Y.; He, L.; Wang, H.; Yang, G.; Zhang, W.; et al. Manipulating the crystallization kinetics of halide perovskites for large-area solar modules. Communications Materials 2024, 5, 131. [Google Scholar] [CrossRef]
- Li, Y.; Fan, H.; Xu, F.; Wang, T.; Shan, C.; Li, W.; Gu, X.; Lai, X.; Luo, D.; Sun, Z.; et al. High-Performance Inverted Perovskite Solar Cells Enhanced via Partial Replacement of Dimethyl Sulfoxide with N-Methyl-2-Pyrrolidinone. Solar RRL 2022, 6, 2200816. [Google Scholar] [CrossRef]
- Zhang, Z.; Liang, J.; Wang, J.; Zheng, Y.; Wu, X.; Tian, C.; Sun, A.; Huang, Y.; Zhou, Z.; Yang, Y.; et al. DMSO-Free Solvent Strategy for Stable and Efficient Methylammonium-Free Sn–Pb Alloyed Perovskite Solar Cells. Advanced Energy Materials 2023, 13, 2300181. [Google Scholar] [CrossRef]
- Hu, Z.; Cai, H.; Luo, X.; Han, B.; Liu, J.; Guo, Q.; Li, Y.; Liu, C.; Ni, J.; Li, J.; et al. Nonvolatile and Strongly Coordinating Solvent Enables Blade-coating of Efficient FACs-based Perovskite Solar Cells. Small Methods n/a. [CrossRef]
- Lee, H.-J.; Seo, Y.-H.; Kim, S.-S.; Na, S.-I. Slot-die processed perovskite solar cells: effects of solvent and temperature on device performances. Semiconductor Science and Technology 2022, 37, 045007. [Google Scholar] [CrossRef]
- Zang, Y.; Tu, Y.; Jiao, C.; Li, W.; Zhou, P.; Cheng, J.; Yang, G.; Shao, T.; Ye, J.; Li, G.; et al. Green N1 additive modified perovskite precursor enables effective manufacturing of large-area solar cell modules with high efficiency and stability. Chemical Engineering Journal 2024, 480, 148133. [Google Scholar] [CrossRef]
- Stancu, V.; Tomulescu, A.G.; Leonat, L.N.; Balescu, L.M.; Galca, A.C.; Toma, V.; Besleaga, C.; Derbali, S.; Pintilie, I. Partial Replacement of Dimethylformamide with Less Toxic Solvents in the Fabrication Process of Mixed-Halide Perovskite Films. Coatings 2023, 13, 378. [Google Scholar] [CrossRef]
- Cao, Q.; Liu, H.; Xing, J.; Li, B.e.; Liu, C.; Xie, F.; Zhang, X.; Zhao, W. Optimal Methylammounium Chloride Additive for High-Performance Perovskite Solar Cells. Nanomaterials 2025, 15, 292. [Google Scholar] [CrossRef]
- Nishimura, N.; Behera, R.K.; Katoh, R.; Kanda, H.; Murakami, T.N.; Matsuzaki, H. Unveiled effects of the methylammonium chloride additive on formamidinium lead halide: expediting carrier injection from the photoabsorber to carrier transport layers through spontaneously modulated heterointerfaces in perovskite solar cells. Journal of Materials Chemistry C 2024, 12, 9130–9138. [Google Scholar] [CrossRef]
- Li, B.; Wang, H.; Liu, A.; Liu, Y.; Pu, W.; Shen, T.; Li, M.; Que, M.; Tian, J.; Dai, Q.; et al. Methylammonium Chloride as a Double-Edged Sword for Efficient and Stable Perovskite Solar Cells. Small 2023, 19, e2301061. [Google Scholar] [CrossRef]
- Bi, L.; Fu, Q.; Zeng, Z.; Wang, Y.; Lin, F.R.; Cheng, Y.; Yip, H.-L.; Tsang, S.W.; Jen, A.K.Y. Deciphering the Roles of MA-Based Volatile Additives for α-FAPbI3 to Enable Efficient Inverted Perovskite Solar Cells. Journal of the American Chemical Society 2023, 145, 5920–5929. [Google Scholar] [CrossRef]
- Gallant, B.M.; Holzhey, P.; Smith, J.A.; Choudhary, S.; Elmestekawy, K.A.; Caprioglio, P.; Levine, I.; Sheader, A.A.; Hung, E.Y.H.; Yang, F.; et al. A green solvent enables precursor phase engineering of stable formamidinium lead triiodide perovskite solar cells. Nature Communications 2024, 15, 10110. [Google Scholar] [CrossRef]
- Guo, Y.; Yuan, S.; Zhu, D.; Yu, M.; Wang, H.-Y.; Lin, J.; Wang, Y.; Qin, Y.; Zhang, J.-P.; Ai, X.-C. Influence of the MACl additive on grain boundaries, trap-state properties, and charge dynamics in perovskite solar cells. Physical Chemistry Chemical Physics 2021, 23, 6162–6170. [Google Scholar] [CrossRef]
- Su, Y.; Xue, J.; Liu, A.; Ma, T.; Gao, L. Unveiling the Effect of Solvents on Crystallization and Morphology of 2D Perovskite in Solvent-Assisted Method. Molecules 2022, 27, 1828. [Google Scholar] [CrossRef] [PubMed]
- Huang, X.; Cao, F.; Zhan, S.; Feng, Q.; Zhu, M.; Su, Z.; Gao, X.; Yin, J.; Li, J.; Zheng, N.; et al. Solvent racing crystallization: Low-solvation dispersion cosolvents for high-quality halide perovskites in photovoltaics. Joule 2023, 7, 1556–1573. [Google Scholar] [CrossRef]
- Liu, J.; Chen, B.; Wang, Q.; Li, R.; Shi, B.; Li, Y.; Hou, F.; Cui, X.; Wang, P.; Li, Y.; et al. Self-formed PbI 2 -DMSO adduct for highly efficient and stable perovskite solar cells. Applied Physics Letters 2019, 115, 233901. [Google Scholar] [CrossRef]
- Asuo, I.M.; Mahdavi Varposhti, A.; Gomez, E.D.; Doumon, N.Y. Anti-solvent engineering enables efficient ambient-processed halide perovskite solar cells. Journal of Materials Chemistry C 2024, 12, 7562–7571. [Google Scholar] [CrossRef]
- Lin, P.-A.; Zhang, W.; Yang, Y.; Yu, L.; Yin, Y.; Chen, R.; Cai, B.; Sun, J.; Zheng, X.; Huang, Y.; et al. A Facile Strategy to Suppressing Impurity Phase in Perovskite Wet Films for Efficient and Stable Photovoltaics. Advanced Functional Materials 2025, 35, 2416582. [Google Scholar] [CrossRef]
- Jo, Y.; Oh, K.S.; Kim, M.; Kim, K.-H.; Lee, H.; Lee, C.-W.; Kim, D.S. High Performance of Planar Perovskite Solar Cells Produced from PbI2(DMSO) and PbI2(NMP) Complexes by Intramolecular Exchange. Advanced Materials Interfaces 2016, 3, 1500768. [Google Scholar] [CrossRef]
- Liu, Y.; Zhou, X.; Wu, Y.; Zhang, H.; Cao, K. Interfacial seed-assisted FAPbI3 crystallization and phase stabilization enhance the performance of all-air-processed perovskite solar cells. Dalton Transactions 2025, 54, 3695–3703. [Google Scholar] [CrossRef]
- Vashista, M.; and Paul, S. Correlation between full width at half maximum (FWHM) of XRD peak with residual stress on ground surfaces. Philosophical Magazine 2012, 92, 4194–4204. [Google Scholar] [CrossRef]
- Si, H.; Zhang, Z.; Liao, Q.; Zhang, G.; Ou, Y.; Zhang, S.; Wu, H.; Wu, J.; Kang, Z.; Zhang, Y. A-Site Management for Highly Crystalline Perovskites. Advanced Materials 2020, 32, 1904702. [Google Scholar] [CrossRef]
- Singh, R.K.; Kumar, A.; Jain, N.; Singh, J.; Singh, R.K.; Kumar, R. Solution Processed Hybrid Organic-Inorganic CH3NH3PbI3 Perovskite Material and Optical Properties. Materials Today: Proceedings 2017, 4, 12661–12665. [Google Scholar] [CrossRef]
- Chen, S.; Xiao, X.; Chen, B.; Kelly, L.L.; Zhao, J.; Lin, Y.; Toney, M.F.; Huang, J. Crystallization in one-step solution deposition of perovskite films: Upward or downward? Science Advances 2021, 7, eabb2412. [Google Scholar] [CrossRef] [PubMed]
- Xiang, W.; Zhang, J.; Liu, S.; Albrecht, S.; Hagfeldt, A.; Wang, Z. Intermediate phase engineering of halide perovskites for photovoltaics. Joule 2022, 6, 315–339. [Google Scholar] [CrossRef]
Figure 1.
(a) Schematic illustration of the perovskite film fabrication process using MACl-containing precursor solutions, including static dropping, spin-coating, anti-solvent dripping, and thermal annealing. (b) XRD patterns of perovskite films with varying MACl concentrations (0–50%) measured in the wet state, immediately after spin coating without thermal annealing. (c) XRD patterns of the same samples measured after thermal annealing. (d) Optical images of perovskite films in both the wet state and annealed state for each MACl concentration.
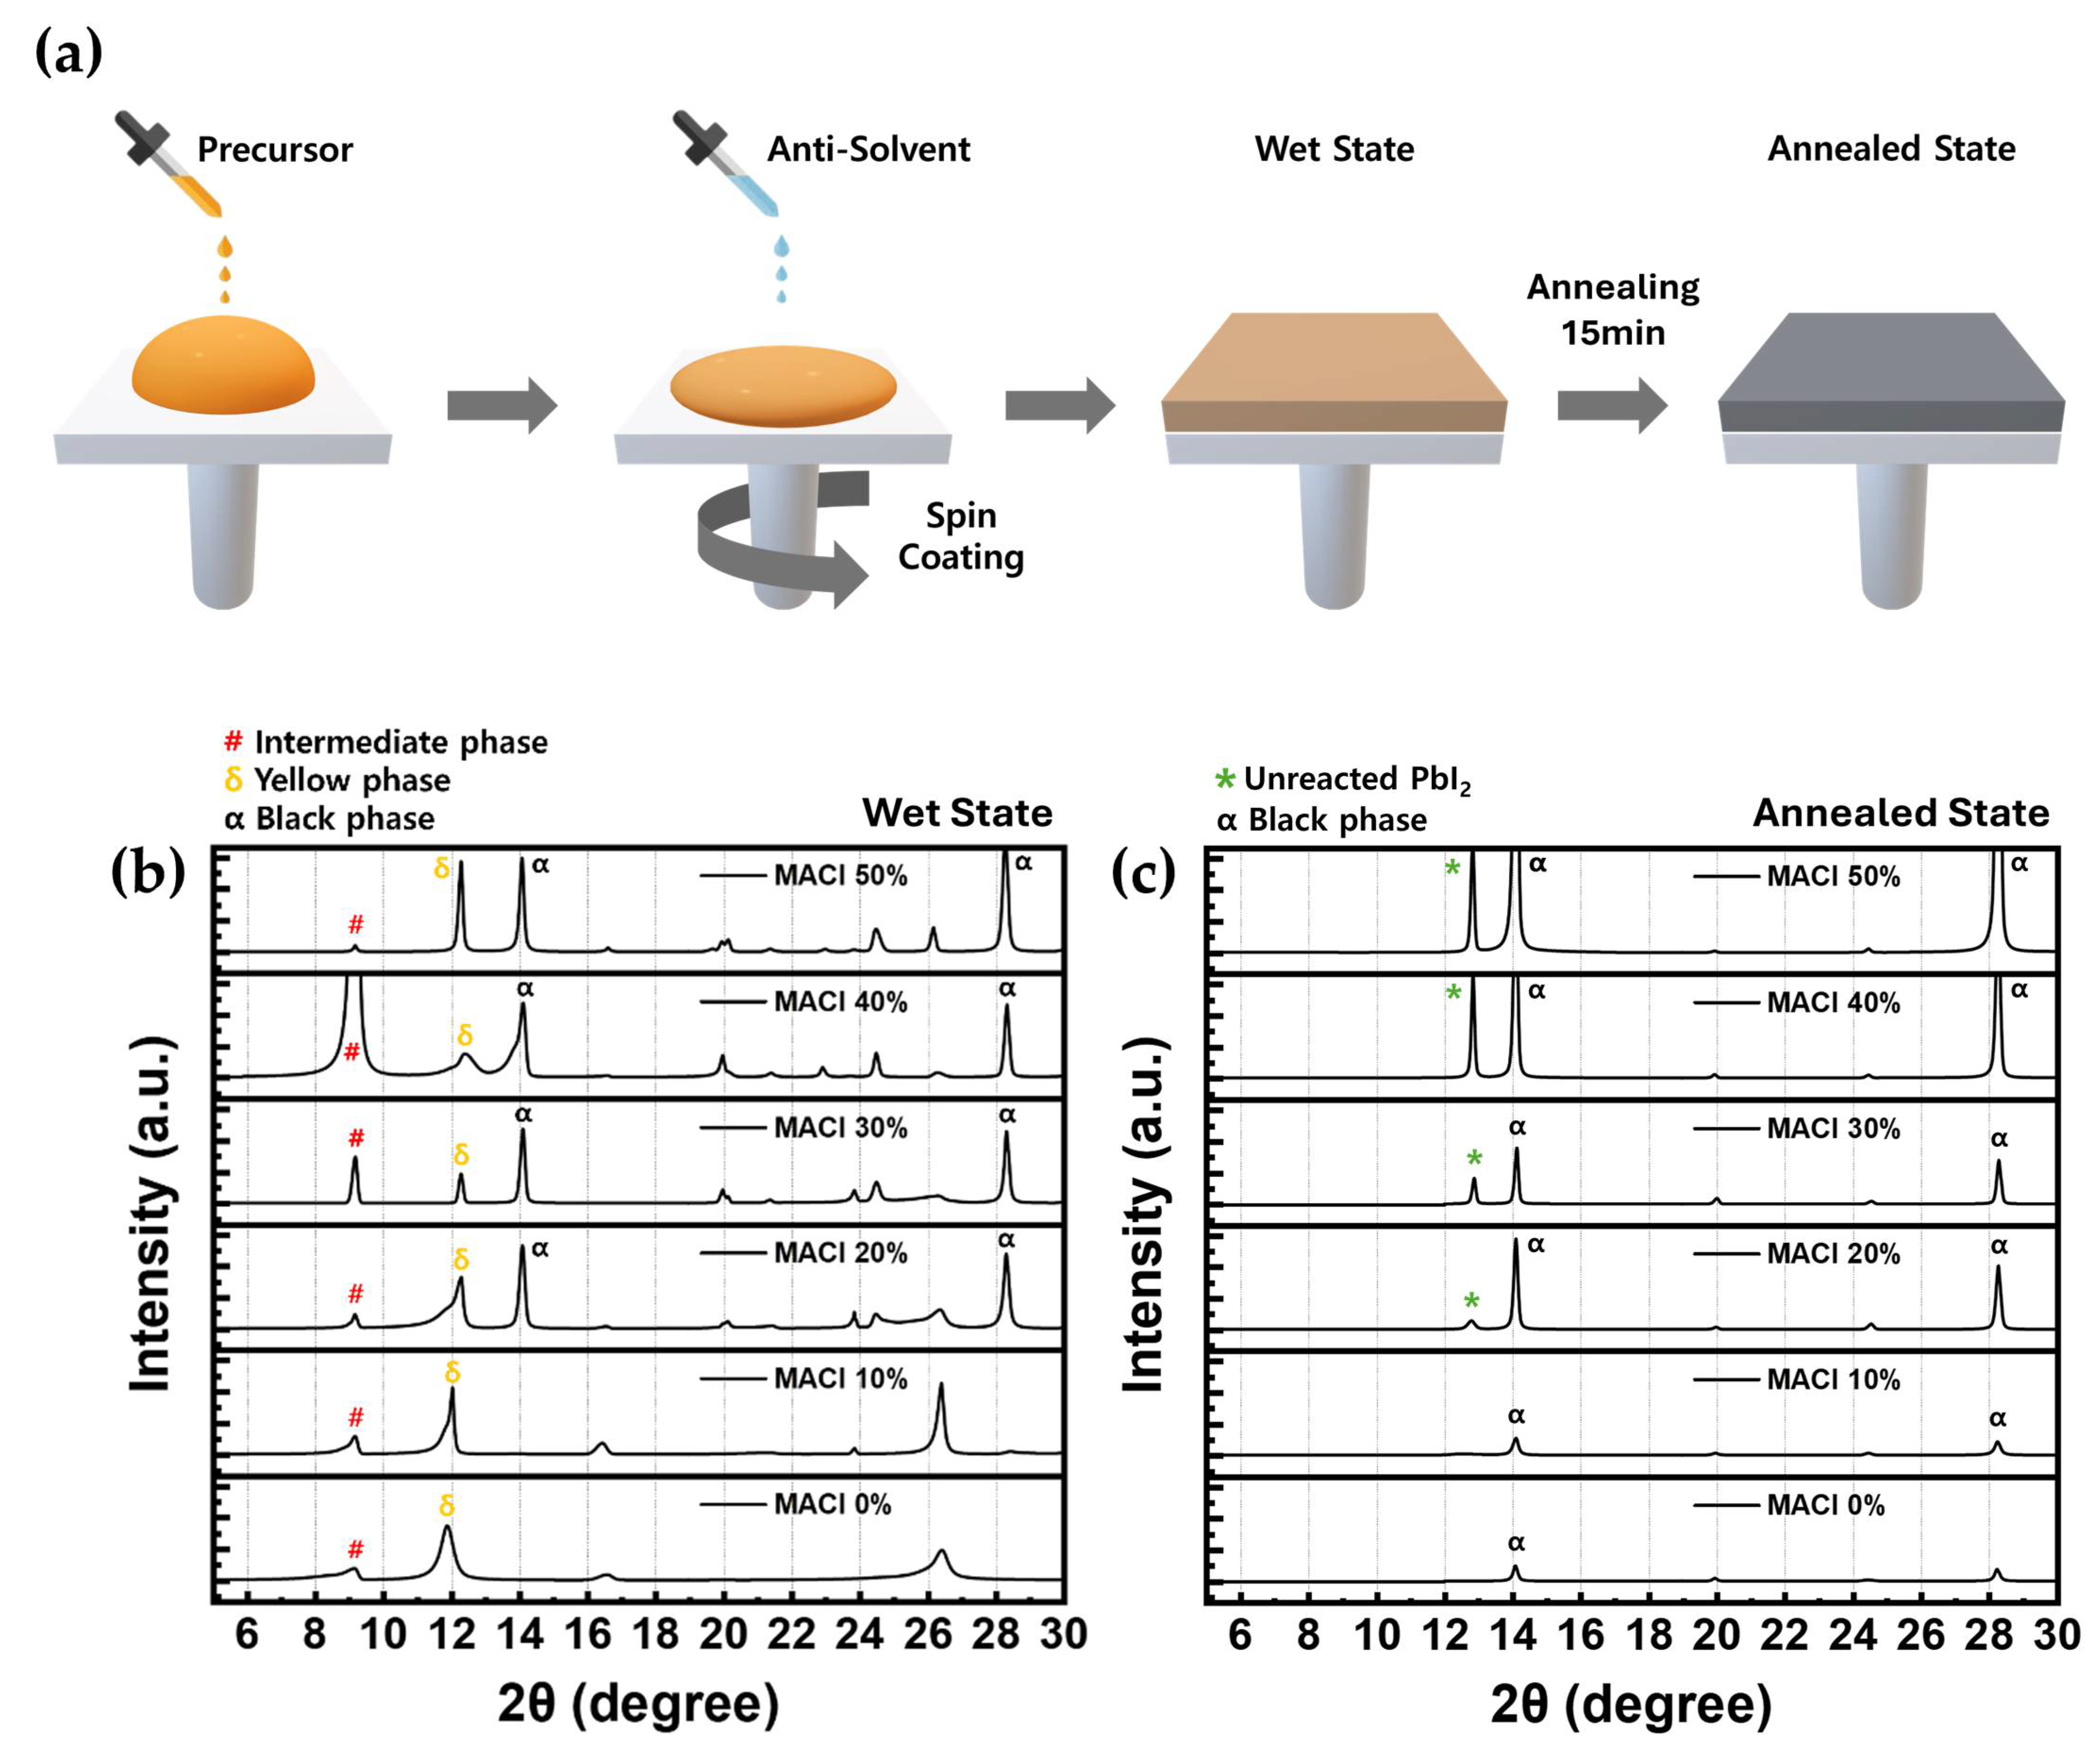
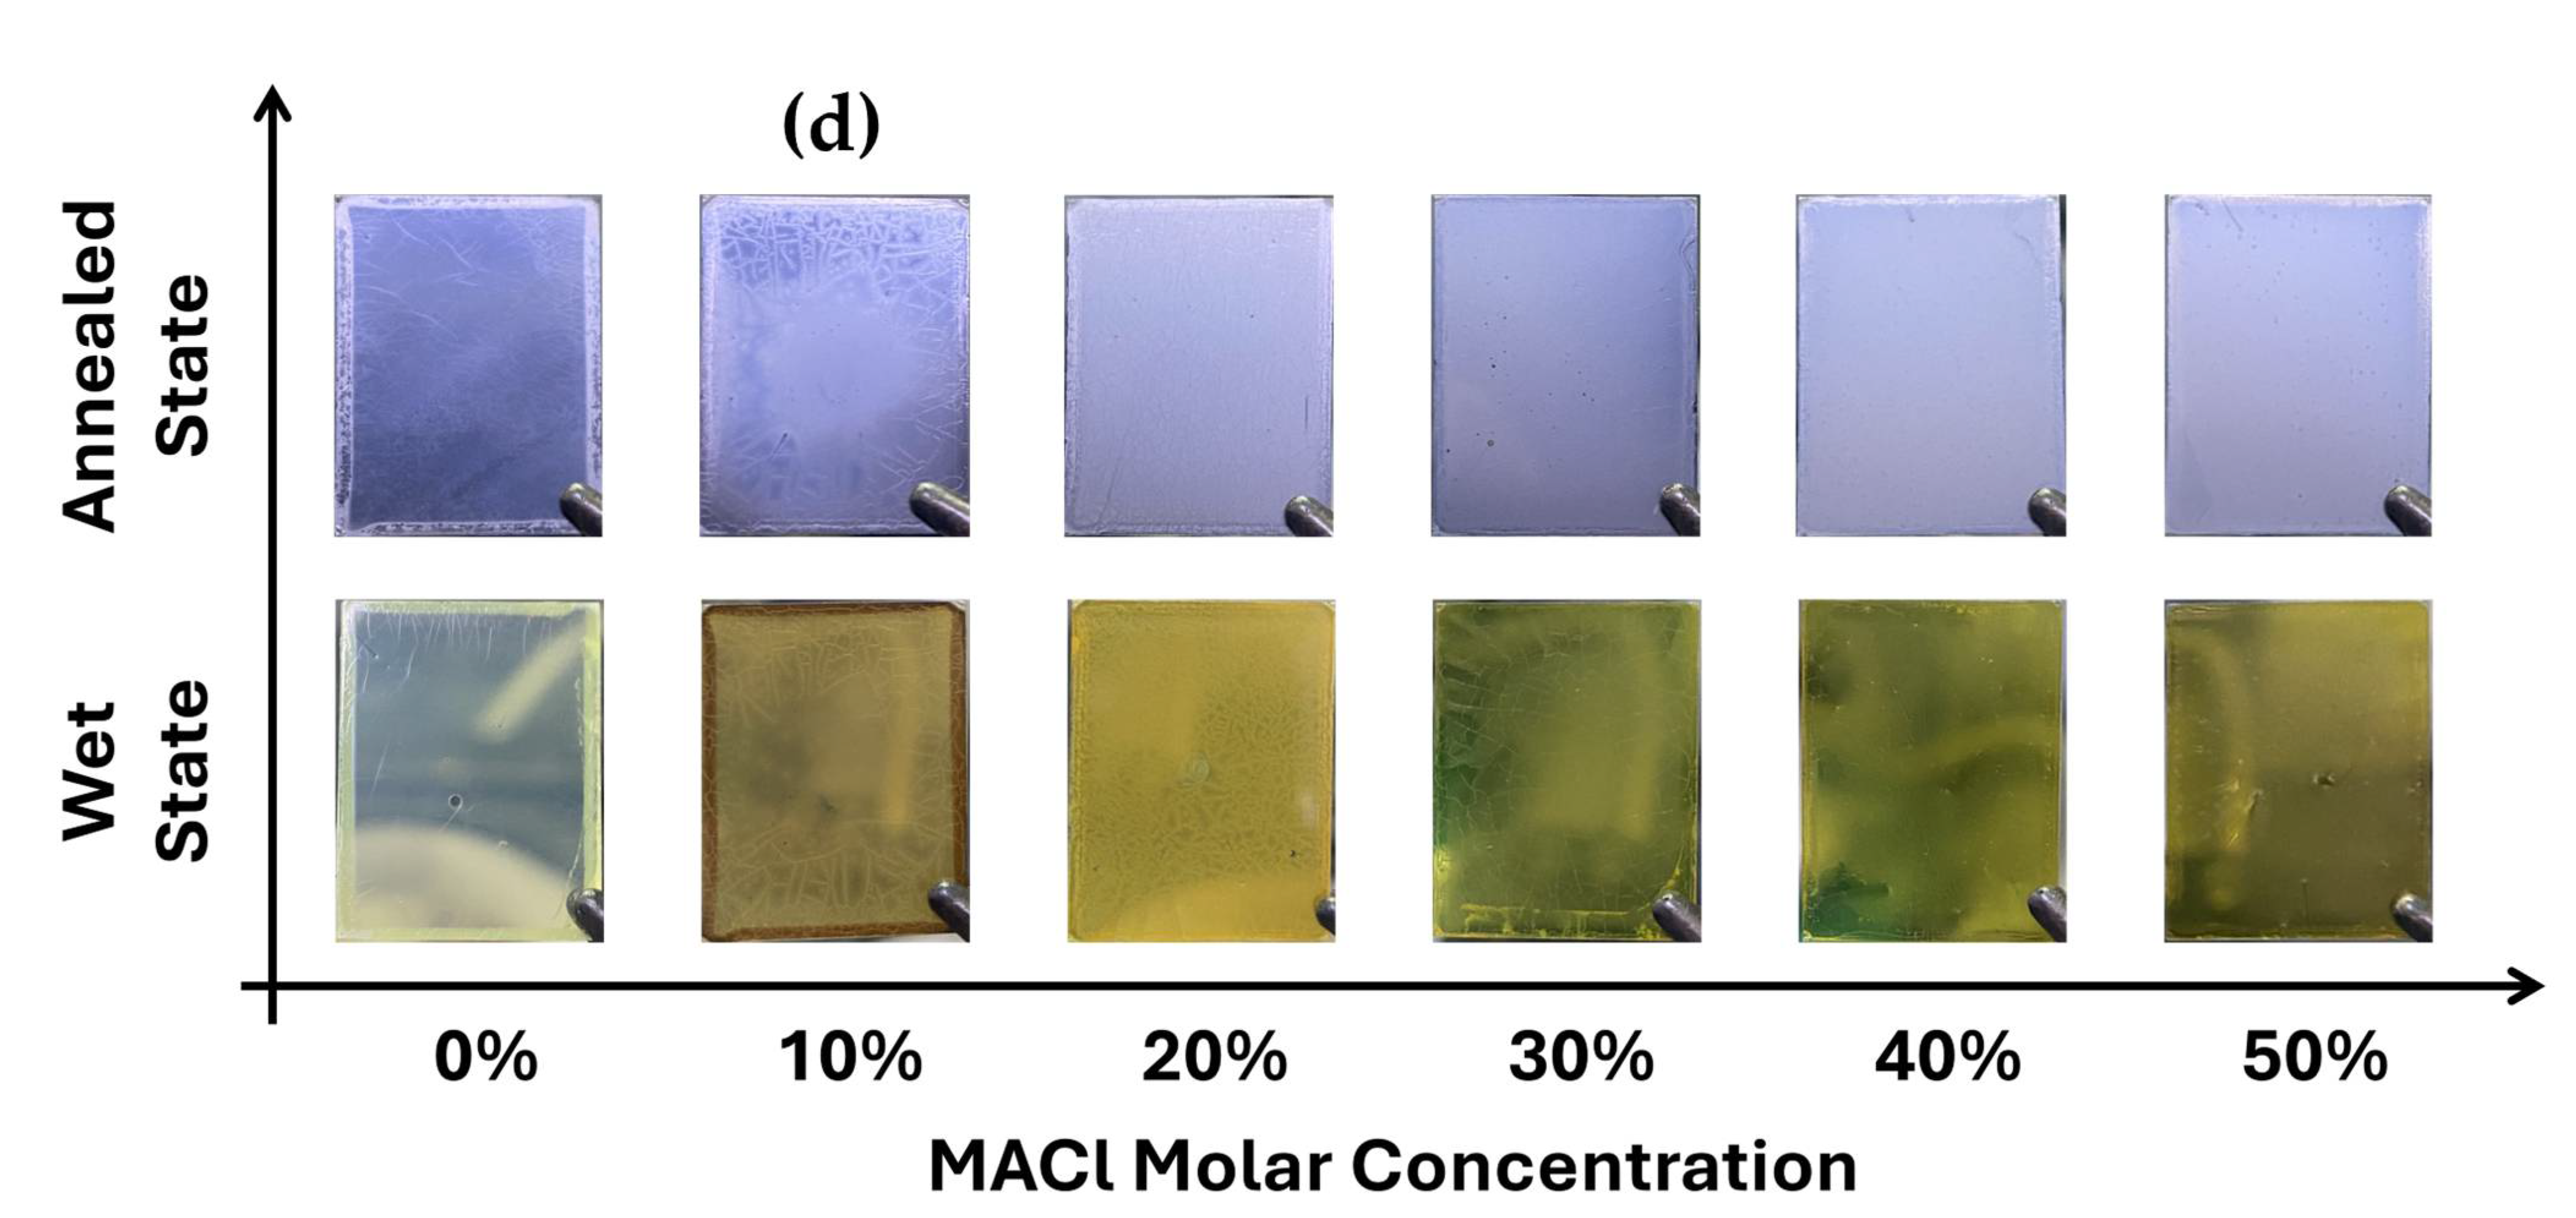
Figure 2.
Top-view SEM images of perovskite films fabricated with different MACl concentrations: (a) 0%, (b) 10%, (c) 20%, (d) 30%, (e) 40%, and (f) 50%. All images were taken at a magnification of 20,000X with a scale bar of 2 μm.
Figure 2.
Top-view SEM images of perovskite films fabricated with different MACl concentrations: (a) 0%, (b) 10%, (c) 20%, (d) 30%, (e) 40%, and (f) 50%. All images were taken at a magnification of 20,000X with a scale bar of 2 μm.
| Gaussian | Lorentzian | Pseudo-Voigt | |
|---|---|---|---|
| 20% | 0.199 | 0.159 | 0.095 |
| 30% | 0.171 | 0.136 | 0.085 |
| 40% | 0.388 | 0.284 | 0.129 |
Figure 3.
3D AFM surface morphology images of perovskite films prepared with different MACl concentrations: (a) 0%, (b) 10%, (c) 20%, (d) 30%, (e) 40%, and (f) 50%. Each scan was conducted over a 10 μm × 10 μm area.
Figure 3.
3D AFM surface morphology images of perovskite films prepared with different MACl concentrations: (a) 0%, (b) 10%, (c) 20%, (d) 30%, (e) 40%, and (f) 50%. Each scan was conducted over a 10 μm × 10 μm area.
| Gaussian | Lorentzian | Pseudo-Voigt | |
|---|---|---|---|
| 20% | 0.199 | 0.159 | 0.095 |
| 30% | 0.171 | 0.136 | 0.085 |
| 40% | 0.388 | 0.284 | 0.129 |
Figure 4.
Photovoltaic performance of perovskite solar cells fabricated with different MACl concentrations: (a) J–V curves measured under AM1.5G 1 sun illumination; (b) PCE distribution of devices; (c) Hysteresis index (HI) extracted from forward and reverse scans; (d) External quantum efficiency (EQE) spectra of selected devices.
| Gaussian | Lorentzian | Pseudo-Voigt | |
|---|---|---|---|
| 20% | 0.199 | 0.159 | 0.095 |
| 30% | 0.171 | 0.136 | 0.085 |
| 40% | 0.388 | 0.284 | 0.129 |

Table 1.
FWHM values of the α-phase XRD peak measured in the wet state, calculated using Gaussian, Lorentzian, and Pseudo-Voigt fitting functions for perovskite films with 20%, 30%, and 40% MACl concentrations.
Table 1.
FWHM values of the α-phase XRD peak measured in the wet state, calculated using Gaussian, Lorentzian, and Pseudo-Voigt fitting functions for perovskite films with 20%, 30%, and 40% MACl concentrations.
| Gaussian | Lorentzian | Pseudo-Voigt | |
|---|---|---|---|
| 20% | 0.199 | 0.159 | 0.095 |
| 30% | 0.171 | 0.136 | 0.085 |
| 40% | 0.388 | 0.284 | 0.129 |
Table 2.
Photovoltaic parameters (PCE, JSC, VOC, FF) of devices with different MACl concentrations. Average ± standard deviation from forward and reverse scans; maximum PCE values are shown in parentheses.
Table 2.
Photovoltaic parameters (PCE, JSC, VOC, FF) of devices with different MACl concentrations. Average ± standard deviation from forward and reverse scans; maximum PCE values are shown in parentheses.
| Condition | Type | PCE (%) | JSC (mA/cm2) | VOC (V) | FF |
|---|---|---|---|---|---|
| MACl 0% | Forward | 18.89±0.71 (19.82) | 24.08±0.34 (24.19) | 1.11±0.01 (1.13) | 0.71±0.02 (0.73) |
| Reverse | 18.65±0.98 (20.07) | 24.01±0.33 (23.89) | 1.11±0.02 (1.13) | 0.7±0.03 (0.74) | |
| MACl 10% | Forward | 17.63±0.77 (19.21) | 23.14±0.36 (23.68) | 1.1±0.01 (1.11) | 0.69±0.02 (0.73) |
| Reverse | 17.76±0.71 (19.09) | 23.1±0.36 (23.66) | 1.1±0.01 (1.12) | 0.7±0.02 (0.72) | |
| MACl 20% | Forward | 22.55±0.28 (23.1) | 24.66±0.1 (24.85) | 1.14±0.01 (1.15) | 0.8±0 (0.81) |
| Reverse | 22.63±0.21 (23.04) | 24.66±0.09 (24.85) | 1.15±0 (1.16) | 0.8±0 (0.8) | |
| MACl 30% | Forward | 22.32±0.43 (23.17) | 24.61±0.14 (24.84) | 1.1±0.01 (1.12) | 0.82±0.01 (0.83) |
| Reverse | 22.65±0.31 (23.2) | 24.61±0.14 (24.85) | 1.12±0.01 (1.14) | 0.82±0.01 (0.82) | |
| MACl 40% | Forward | 18.27±0.47 (19.22) | 24.31±0.12 (24.36) | 1.01±0.02 (1.02) | 0.74±0.02 (0.77) |
| Reverse | 19.61±0.43 (20.36) | 24.32±0.12 (24.35) | 1.05±0.01 (1.06) | 0.77±0.01 (0.79) | |
| MACl 50% | Forward | 11.83±1.4 (14.71) | 23.06±0.6 (24.15) | 0.85±0.03 (0.88) | 0.6±0.05 (0.69) |
| Reverse | 12.82±1.26 (15.3) | 23.46±0.56 (24.21) | 0.9±0.02 (0.92) | 0.61±0.05 (0.69) |
Disclaimer/Publisher’s Note: The statements, opinions and data contained in all publications are solely those of the individual author(s) and contributor(s) and not of MDPI and/or the editor(s). MDPI and/or the editor(s) disclaim responsibility for any injury to people or property resulting from any ideas, methods, instructions or products referred to in the content. |
© 2025 by the authors. Licensee MDPI, Basel, Switzerland. This article is an open access article distributed under the terms and conditions of the Creative Commons Attribution (CC BY) license (http://creativecommons.org/licenses/by/4.0/).
Copyright: This open access article is published under a Creative Commons CC BY 4.0 license, which permit the free download, distribution, and reuse, provided that the author and preprint are cited in any reuse.


