Submitted:
19 April 2025
Posted:
21 April 2025
You are already at the latest version
Abstract
This research investigates and forecasts multidimensional security perceptions among Serbian youth, explicitly focusing on the student population. It examines how demographic traits, socioeconomic status, and institutional trust and engagement levels affect how young people evaluate different aspects of security in their everyday lives. The study covers six primary dimensions of security perception: a) personal safety; b) safety at public events and demonstrations; c) perceived national threats; d) digital security and privacy; e) perception of emergencies and crises; and f) trust in institutions and security policies. A structured survey, involving 406 participants, titled “Multidimensional Security Perceptions Among Youth in Serbia”, was created to collect insights into modern security issues. The questionnaire employed a five-point Likert scale, where 1 represented “strongly disagree” and 5 signified “strongly agree." Analyses included multiple regression analysis, one-way ANOVA, Pearson’s correlation, and independent samples t-tests. All necessary statistical assumptions were validated to ensure the reliability and validity of the results. Descriptive statistics indicated that participants experienced moderate to moderately high perceived safety (overall M = 3.42). The personal safety domain scored the highest (M = 3.89), followed by digital security and privacy (M = 3.55) and disaster preparedness (M = 3.47). In contrast, lower perceived safety levels were noted for public events and demonstrations (M = 3.22), the perception of national threats (M = 3.07), and trust in institutional security policies, which had the lowest mean score (M = 2.93). The results showed strong links between perceived safety and factors like trust in institutions, how often individuals follow security news, and previous experiences with emergencies. Regression analysis showed that factors influencing perceived safety differed across various dimensions. Gender played a significant role in shaping personal safety perceptions, while family financial status emerged as a crucial predictor for feelings of safety at public events. Engaging in safety-related activities was linked to lower perceptions of digital security, and regularly consulting safety information sources strongly predicted both preparedness and trust in institutions. This study offers fresh perspectives on how personal traits and systemic structures influence youth security experiences. The results can guide upcoming policy initiatives, risk communication methods, and institutional changes designed to bolster youth resilience and involvement in the security sector.
Keywords:
youth
; students
; perceived safety
; personal security
; public
; national threats
; digital security
; disaster preparedness
; institutional trust
; socio-economic
; Serbia
1. Introduction
The 21st century is defined by escalating unpredictability, with societies navigating a web of complex, interdependent risks—from climate emergencies to emerging hybrid threats [1,2,3,4]. For today’s youth, coming of age amid overlapping global crises such as pandemics, armed conflict, environmental disasters, and cyber vulnerabilities has had a profound impact on how they interpret safety and risk [5,6,7,8]. In the context of modern security and resilience strategies, gaining insight into how the public—especially younger generations—perceives these threats is vital for shaping effective prevention and response policies [9,10,11,12,13,14,15]. Risk perception theory [16,17,18,19,20,21,22,23] suggests that tangible threats don't just influence people's reactions to danger; they're significantly shaped by factors such as personal experiences, trust in authorities, media influence, and cultural values.
The notion of personal safety and security encompasses a broad range of factors that influence how individuals perceive and respond to potential threats in their surroundings [24,25,26,27,28]. While we recognize that "safety" and "security" carry distinct conceptual and linguistic meanings (as noted in [29,30,31,32]), we treat them interchangeable in this study, given how closely they overlap in everyday perceptions of threat. In today's complex global risk environment, grasping individual perceptions of threats and safety is crucial for effective security governance and disaster risk reduction [17,18,19,33,34,35]. It is not limited to the absence of physical danger but also includes emotional aspects, such as the level of anxiety about crime and the belief in one's ability to avoid harm. These perceptions are deeply affected by one’s mental state, social environment, and the characteristics of the physical space they occupy [27,36,37,38].
On the other side, safeguarding public events demands a coordinated strategy that blends heightened security protocols with well-planned crowd control, supported by integrated safety management systems [39,40,41,42,43,44]. The effective use of modern technologies—alongside platforms like social media—also plays a vital role by enabling rapid situational awareness, communication, and adaptive responses as events unfold [44,45,46,47]. The use of digital platforms in daily life and emergency management underscores technology's dual function: it serves as a means of risk reduction but can also introduce new vulnerabilities [48,49,50,51,52,53].
The perception of national threats is shaped by geopolitical realities and the availability and framing of information, particularly in societies with variable levels of institutional trust [54,55,56,57,58]. Recognizing national threats is a foundational step in shaping a cohesive and resilient security strategy [59,60,61,62,63,64]. Early identification of these risks enables governments to respond effectively to emerging economic pressures and preserve both stability and sovereignty [65]. Broadly, such threats can be grouped into two primary sources: those stemming from natural or socio-economic dynamics and those triggered by political, economic, or societal actions. This classification provides a structured lens through which risks can be assessed and managed more systematically [66].
Looking at Poland as a case in point, three primary security concerns have been highlighted—issues around reprivatisation, irregularities in fuel trade, and tensions linked to Islamic immigration [67]. Each threat touches different layers of national security and demands tailored institutional responses [67]. Emerging technologies are also giving rise to new types of risk [68,69,70,71,72,73]. For example, the hostile use of artificial intelligence creates psychological vulnerabilities, with countries like China, India, and Russia already experiencing tangible disruptions in their security infrastructure [74]. In both stable and transitional societies, perceptions of safety are deeply intertwined with broader political narratives and collective memory of past crises.
Terrorism continues to represent one of the gravest and most persistent challenges to state security [75,76,77,78,79,80,81,82,83,84,85,86,87]. Its adaptive and multifaceted nature requires constant innovation in detection strategies and response mechanisms [79]. Meanwhile, in the sphere of information security, a widening divide is evident between highly developed nations—capable of withstanding sophisticated digital threats—and less resourced states that remain dangerously exposed [88].
Disaster and emergency preparedness has evolved beyond logistical readiness to include psychological readiness, adaptive behaviors, and coordination among different levels of governance [89,90,91,92,93,94,95,96,97,98,99,100,101,102,103,104]. Being prepared for disasters and emergencies is a critical component of modern resilience efforts [105,106,107,108,109,110,111,112,113,114,115,116,117,118,119,120]. It involves proactive strategies aimed at reducing risks, lowering vulnerability, and ensuring efficient coordination during crisis situations [121,122]. Building stronger preparedness requires collaboration across stakeholders, the integration of suitable technologies, and active community involvement to enhance the overall capacity for disaster response [123].
One effective way to boost individual readiness is through scenario-based exercises. Encouraging people to picture how a disaster might impact them personally has been shown to increase their motivation to take preventive actions [124]. This approach brings attention to the psychological and behavioral dimensions of preparedness, which are just as vital as operational planning [125].
At the organizational level, successful crisis response depends on early risk identification, clear communication, adaptable leadership, and flexible structures [126,127,128]. These elements play a key role in limiting disruption and supporting long-term resilience [129]. Significant disasters also demand specific protocols for delivering health and public services. The Crisis Standards of Care framework provides guidance for managing health emergencies under resource constraints, addressing ethical and legal challenges as well as the needs related to mental health and palliative care [128]. In the end, disaster readiness and emergency response are not merely logistical requirements—they are essential functions that protect public health and help communities bounce back and evolve after crises [130].
This broader view of crisis management takes on heightened significance when reflected against real-world events—such as the recent infrastructure failure in Serbia—which starkly revealed the deep-rooted systemic weaknesses and institutional failings at play. In November 2024, Serbia faced a devastating infrastructural disaster when the canopy at Novi Sad's main railway station collapsed, tragically claiming the lives of sixteen people. The incident ignited a national outcry, sparking urgent discussions around public infrastructure safety, state accountability, and the transparency of government institutions [131]. What began as student-led demonstrations quickly evolved into a well-organized civic movement, with protestors outlining clear demands: an independent investigation into the collapse, accountability for those responsible, and systemic reforms to enhance public safety. A powerful daily ritual was introduced—15-minute traffic blockades held precisely at 11:52 a.m., the exact moment the collapse occurred. These acts, part of the campaign “Srbijo, stani” (“Serbia, stop”), served as both a tribute to the victims and a call for systemic change [131].
The protests rapidly spread to cities across the country—Belgrade, Novi Sad, Kragujevac, and Niš—drawing support from university faculty, artists, civil society groups, and a wide array of professionals, including farmers and labor unions. Demonstrators gathered not only at educational institutions and government buildings but also in front of the Republic Public Prosecutor’s Office, where they submitted formal appeals demanding institutional transparency and justice [132]. In a move widely seen as an effort to disrupt the growing momentum, authorities extended the winter school break. Still, the protests endured. Student organizers emphasized that their motivations were rooted not in politics, but in a collective demand for a safer, more accountable public sphere.
This movement stands as a compelling example of youth-led mobilization in a society navigating the complexities of post-transition governance. It reveals how modern understandings of security have expanded—encompassing physical safety, institutional trust, and symbolic action. At its core, the student movement reflected not just grief over a tragic event, but a broader disillusionment with institutional reliability—affirming research that highlights the central role of trust in shaping how young people perceive their safety and place in society [133].
Although there is increasing academic interest in youth and security [5,6,8,26,52,68,69,70,134,135], limited research has provided a comprehensive perspective that combines personal, social, and institutional factors influencing perceived safety in transitional situations [24,136,137,138,139]. To address this conceptual gap, the present research adopts an integrative framework that seeks to empirically capture the interplay between individual characteristics and broader institutional dynamics in shaping youth security perceptions.
This study primarily aims to analyze and forecast how different individual and structural factors shape the perceptions of security among youth in Serbia. It specifically looks into the influence of demographic characteristics (such as gender, age, and study location), educational history (including field and level of study), socio-economic status (comprising material wealth, family structure, and academic success), trust in institutions, political participation, and access to information on six unique areas of perceived safety. By implementing a multidimensional and theory-based approach, the research aims to pinpoint crucial predictors of safety perceptions, thereby enhancing our understanding of youth security in transitional societies. The results aim to aid in developing evidence-based policies and encourage youth involvement in national and local safety initiatives.
1.1. Literature Review
The study of youth security perceptions is becoming increasingly relevant in contemporary research [5,6,8,26,134,135]. This is a fact, especially given the prevailing sense of insecurity in the political, digital, economic, and environmental spheres [140,141,142]. These studies indicate that young people's sense of security is shaped not only by their direct experiences with violence and instability but also by their understanding of what "security" truly means and how they have been treated by law enforcement [143,144,145,146,147,148]. This reveals a nuanced dynamic where emotional reactions, personal interpretations, and fairness perceptions within institutional processes intersect [149,150,151,152].
Also, young people represent a particularly vulnerable group, as they mature and develop within societies often marked by political instability, rapid technological transformation, and underperforming institutions [136,137,138,139].
Previous research in the field of risk perception demonstrates that individuals do not assess their safety solely based on objective indicators such as crime statistics [17,34,153,154,155]. Instead, subjective factors—such as levels of institutional trust, personal experiences with crises, and modes of information acquisition—play a critical role [16,17,18,19,20,21,22,23,33,34,35]. Among youth, this perception is especially influenced by media and social networks, which often generate a sense of insecurity that may exceed the actual impact of real-world events [48,49,50,51,52,53].
Furthermore, theoretical frameworks addressing institutional trust [156,157,158,159,160,161] indicate that citizens often form their security-related attitudes based on how they perceive the performance of public services, the transparency of government operations, and the prevalence of corruption [54,55,56,57,58]. In countries undergoing political and institutional transition—such as Serbia—low levels of institutional trust are further reinforced by the legacy of past crises [59,60,61,62,63,64]. In such environments, a lack of transparency and limited civic participation opportunities can severely undermine personal and collective feelings of safety.
In the digital security domain, young people exhibit both a high level of technological literacy and pronounced concerns [5,52,68,69,70]. Research highlights a dual perception of surveillance technologies: on the one hand, these tools are viewed as valuable instruments for combating crime; on the other hand, there is considerable anxiety about the potential misuse of private data [68,69,70,71,72,73,74]. Such concerns can further erode public confidence in security systems in countries with underdeveloped data protection frameworks.
Security in the context of public gatherings and protest activities is increasingly becoming a part of everyday life for young people. While some studies report a rise in youth civic engagement, others emphasize that the perception of threat and potential repression often discourages direct participation [39,40,42,162,163]. In more authoritarian systems, protests are perceived as particularly risky, prompting youth to feel ambivalence or disengagement from formal channels of political expression.
Finally, growing attention is being paid to the importance of disaster and emergency preparedness—not only as a function of state authorities but also as a component of civic culture and knowledge [59,60,61,62,63,77,80,90,91,92,108,110,112,116,123,130,164]. Literature in this field underlines that individual readiness to act in disaster or emergency is closely linked to prior education, personal experience, and the degree of trust in early warning systems [89,90,91,92,93,94,95,96,97,98,99,100,101,102,103,104].
Despite the increasing academic interest in these topics, there is still a lack of integrative models that encompass various dimensions of security—personal, institutional, digital, and crisis-related—within a unified analytical framework [24,136,137,138,139]. This gap is particularly evident in studies focused on youth in transitional societies. The present study aims to bridge this divide by offering a predictive model incorporating institutional, demographic, and socio-economic factors to analyse the security perceptions of youth in Serbia.
2. Methods
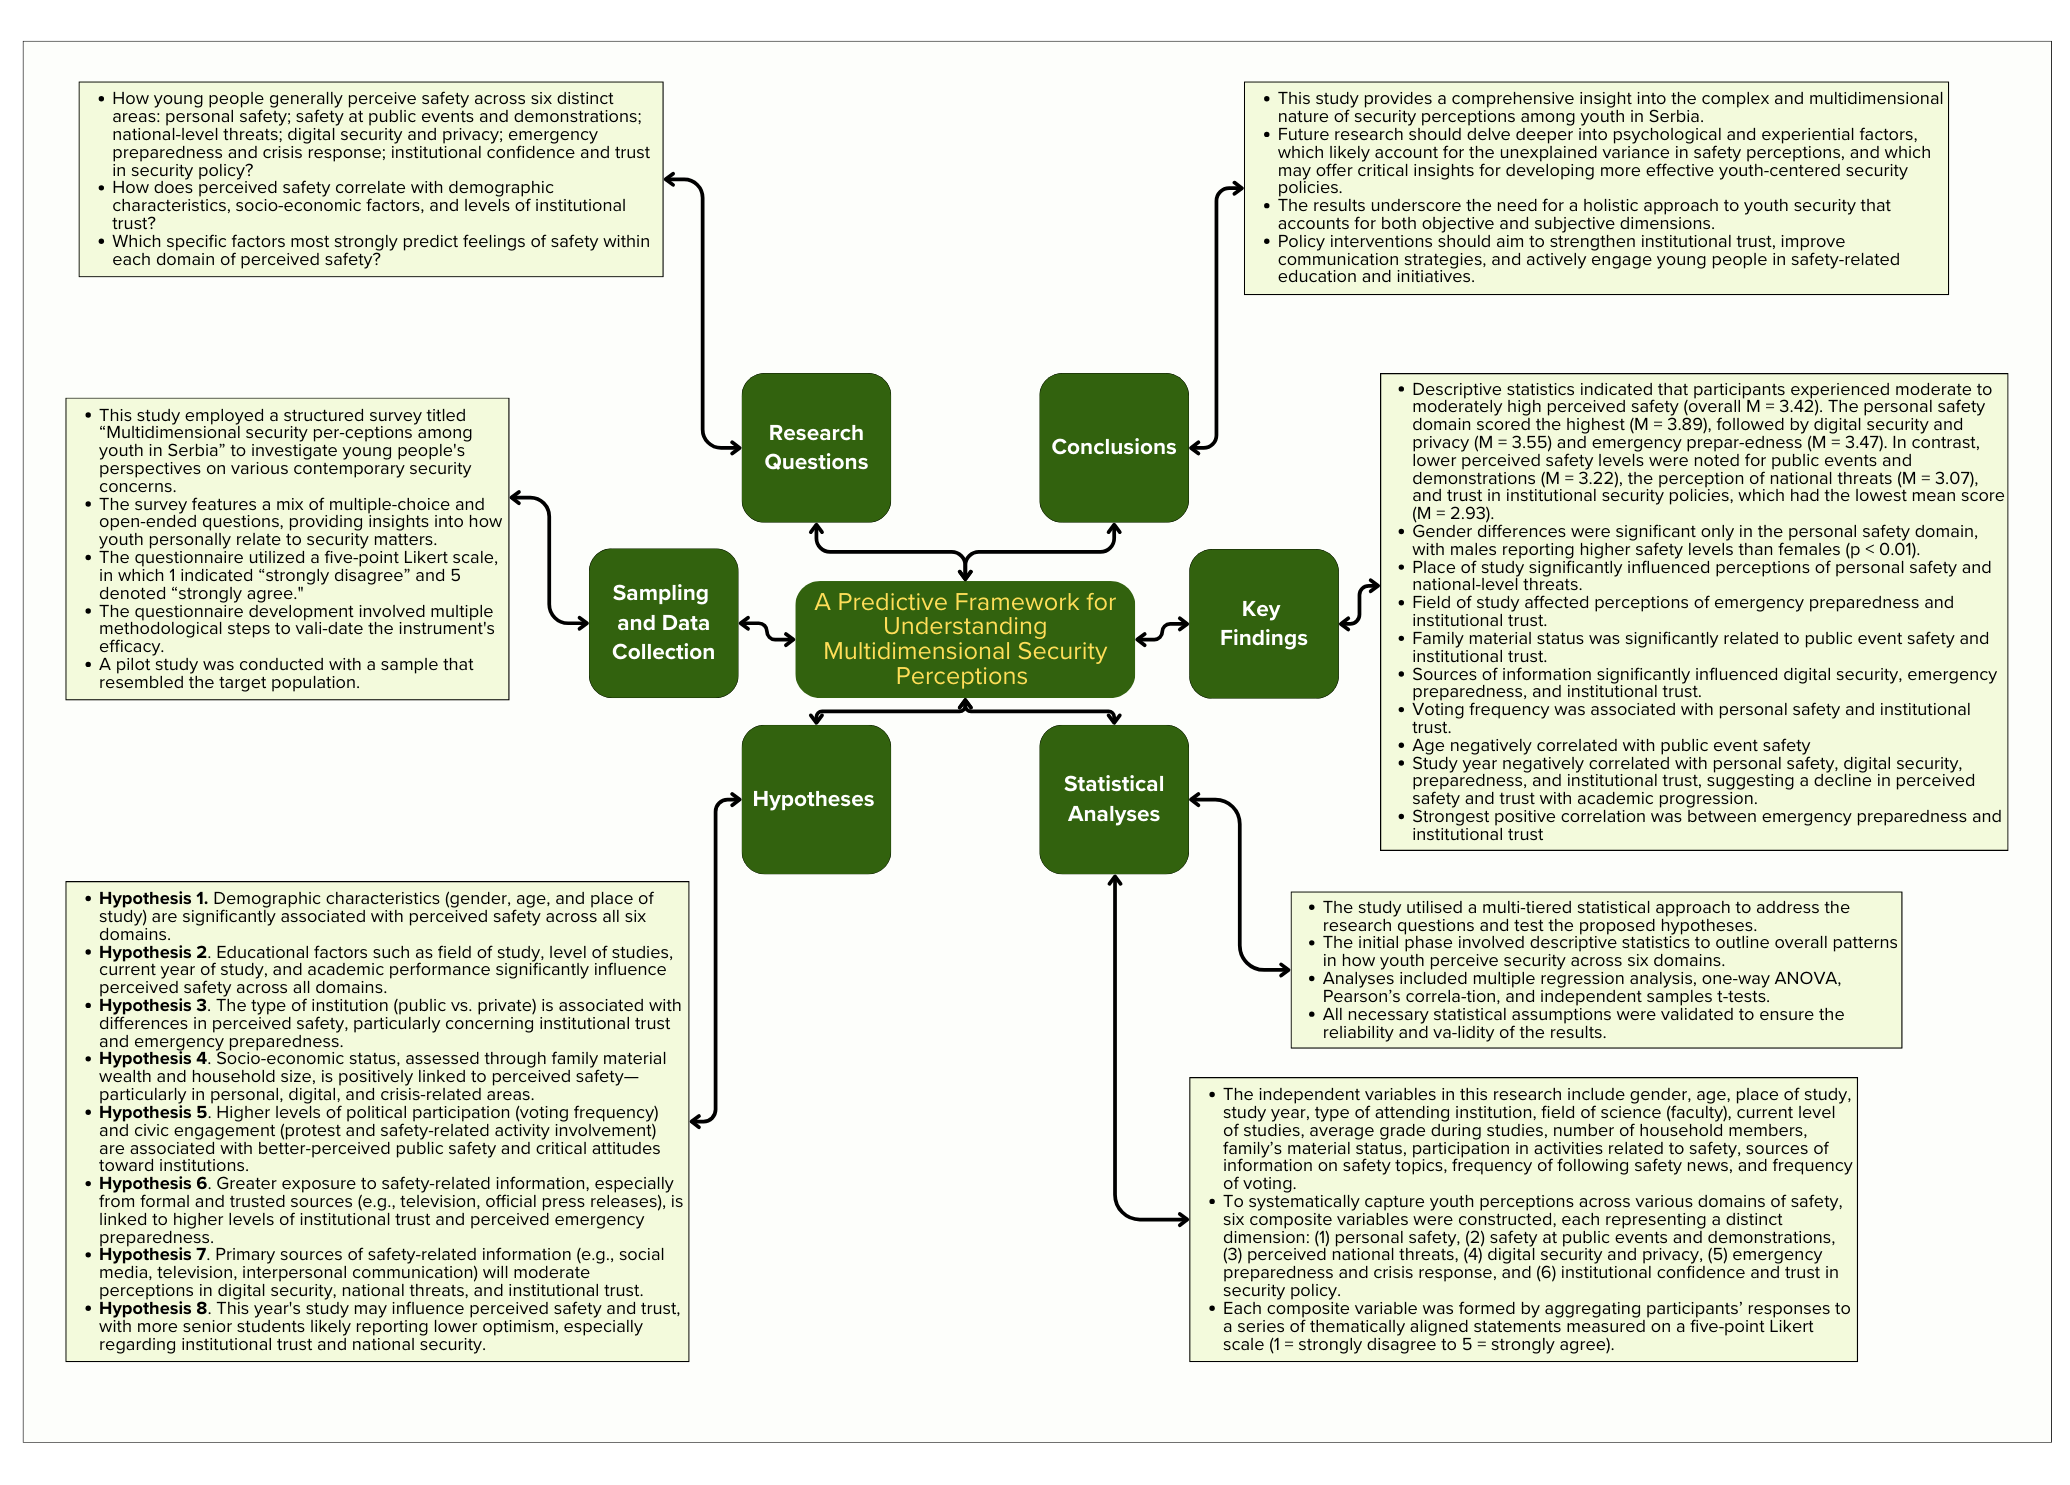
This research explores and predicts multidimensional security perceptions among youth in Serbia (Figure 1). The study focuses on how demographic characteristics, socioeconomic status, and perceived institutional trust and engagement influence how young people assess various security dimensions in their daily lives. The research spans six key domains of security perception: a) personal safety; b) safety at public events and demonstrations; c) perceived national-level threats; d) digital security and privacy; e) perception of emergency and crises; and f) trust in institutions and security policies. These domains reflect both subjective experiences and broader socio-political evaluations. They are theoretically grounded in concepts such as individual security (as defined in human security paradigms) [142,165,166,167,168,169,170], risk perception theory [16,20,23,171,172,173,174,175,176], and institutional trust theory [156,159,160,161,177].
Three central questions guide the research. Firstly, it explores how young people generally perceive safety across six distinct areas, establishing a descriptive foundation for understanding how these perceptions are structured and distributed within the population. Secondly, it delves into the connections between perceived safety and various factors—demographic details such as gender, age, and residence; socio-economic aspects like financial situation and employment; and institutional elements, including levels of trust in the police, judiciary, military, media, and government. This section of the study draws on theories of structural vulnerability and cultural cognition, which suggest that one’s social position and trust in institutions significantly influence how risks and threats are perceived.
Lastly, the research aims to identify the specific factors that most strongly predict feelings of safety in each domain. It achieves this through a predictive lens informed by social ecology theory—emphasising the interplay between individuals, their communities, and broader systems—together with psychological models that highlight perceived control, trust, and personal experience. By integrating these theoretical perspectives, the study provides a comprehensive and evidence-based examination of how young people experience and understand safety, with potential implications for policy-making and theory development.
2.1. Hypotheses
This study leverages insights from risk perception theory, institutional trust theory, and existing literature on social determinants of safety to propose several hypotheses investigating how young individuals view security through different lenses. These hypotheses, grouped by independent variables, can be classified into three primary categories: demographic attributes, socio-economic status, and levels of institutional trust and exposure.
Hypothesis 1. Demographic characteristics (gender, age, and place of study) are significantly associated with perceived safety across all six domains. Female and younger participants are expected to report lower personal and public safety, while students in large urban centers may perceive greater exposure to security risks.
Hypothesis 2. Educational factors such as field of study, level of studies, current year of study, and academic performance significantly influence perceived safety across all domains. Technical or natural science students might express more concern about digital risks. In contrast, those in social sciences may adopt a more critical perspective on institutions and national security policies.
Hypothesis 3. The type of institution (public vs. private) is associated with differences in perceived safety, particularly concerning institutional trust and disaster preparedness. Students in private institutions may evaluate public systems differently than their peers in public institutions.
Hypothesis 4. Socio-economic status, assessed through family material wealth and household size, is positively linked to perceived safety—particularly in personal, digital, and crisis-related areas. Participants from more materially secure and smaller households tend to express more significant feelings of safety and preparedness.
Hypothesis 5. Higher levels of political participation (voting frequency) and civic engagement (protest and safety-related activity involvement) are associated with better-perceived public safety and critical attitudes toward institutions. Civically active individuals may feel safer in public spaces but also exhibit more significant institutional skepticism.
Hypothesis 6. Greater exposure to safety-related information, especially from formal and trusted sources (e.g., television, official press releases), is linked to higher levels of institutional trust and perceived disaster preparedness. Participants who regularly follow safety information tend to feel more informed and confident in institutions' capabilities.
Hypothesis 7. Primary sources of safety-related information (e.g., social media, television, interpersonal communication) will moderate perceptions in digital security, national threats, and institutional trust. Reliance on informal sources may be associated with lower levels of institutional confidence and increased concerns over misinformation.
Hypothesis 8. This year's study may influence perceived safety and trust, with more senior students likely reporting lower optimism, especially regarding institutional trust and national security. Extended academic exposure may relate to increased awareness of systemic challenges.
Together, these hypotheses provide a structured foundation for examining how personal attributes, structural conditions, and institutional dynamics shape young people’s understanding of safety in both physical and digital environments.
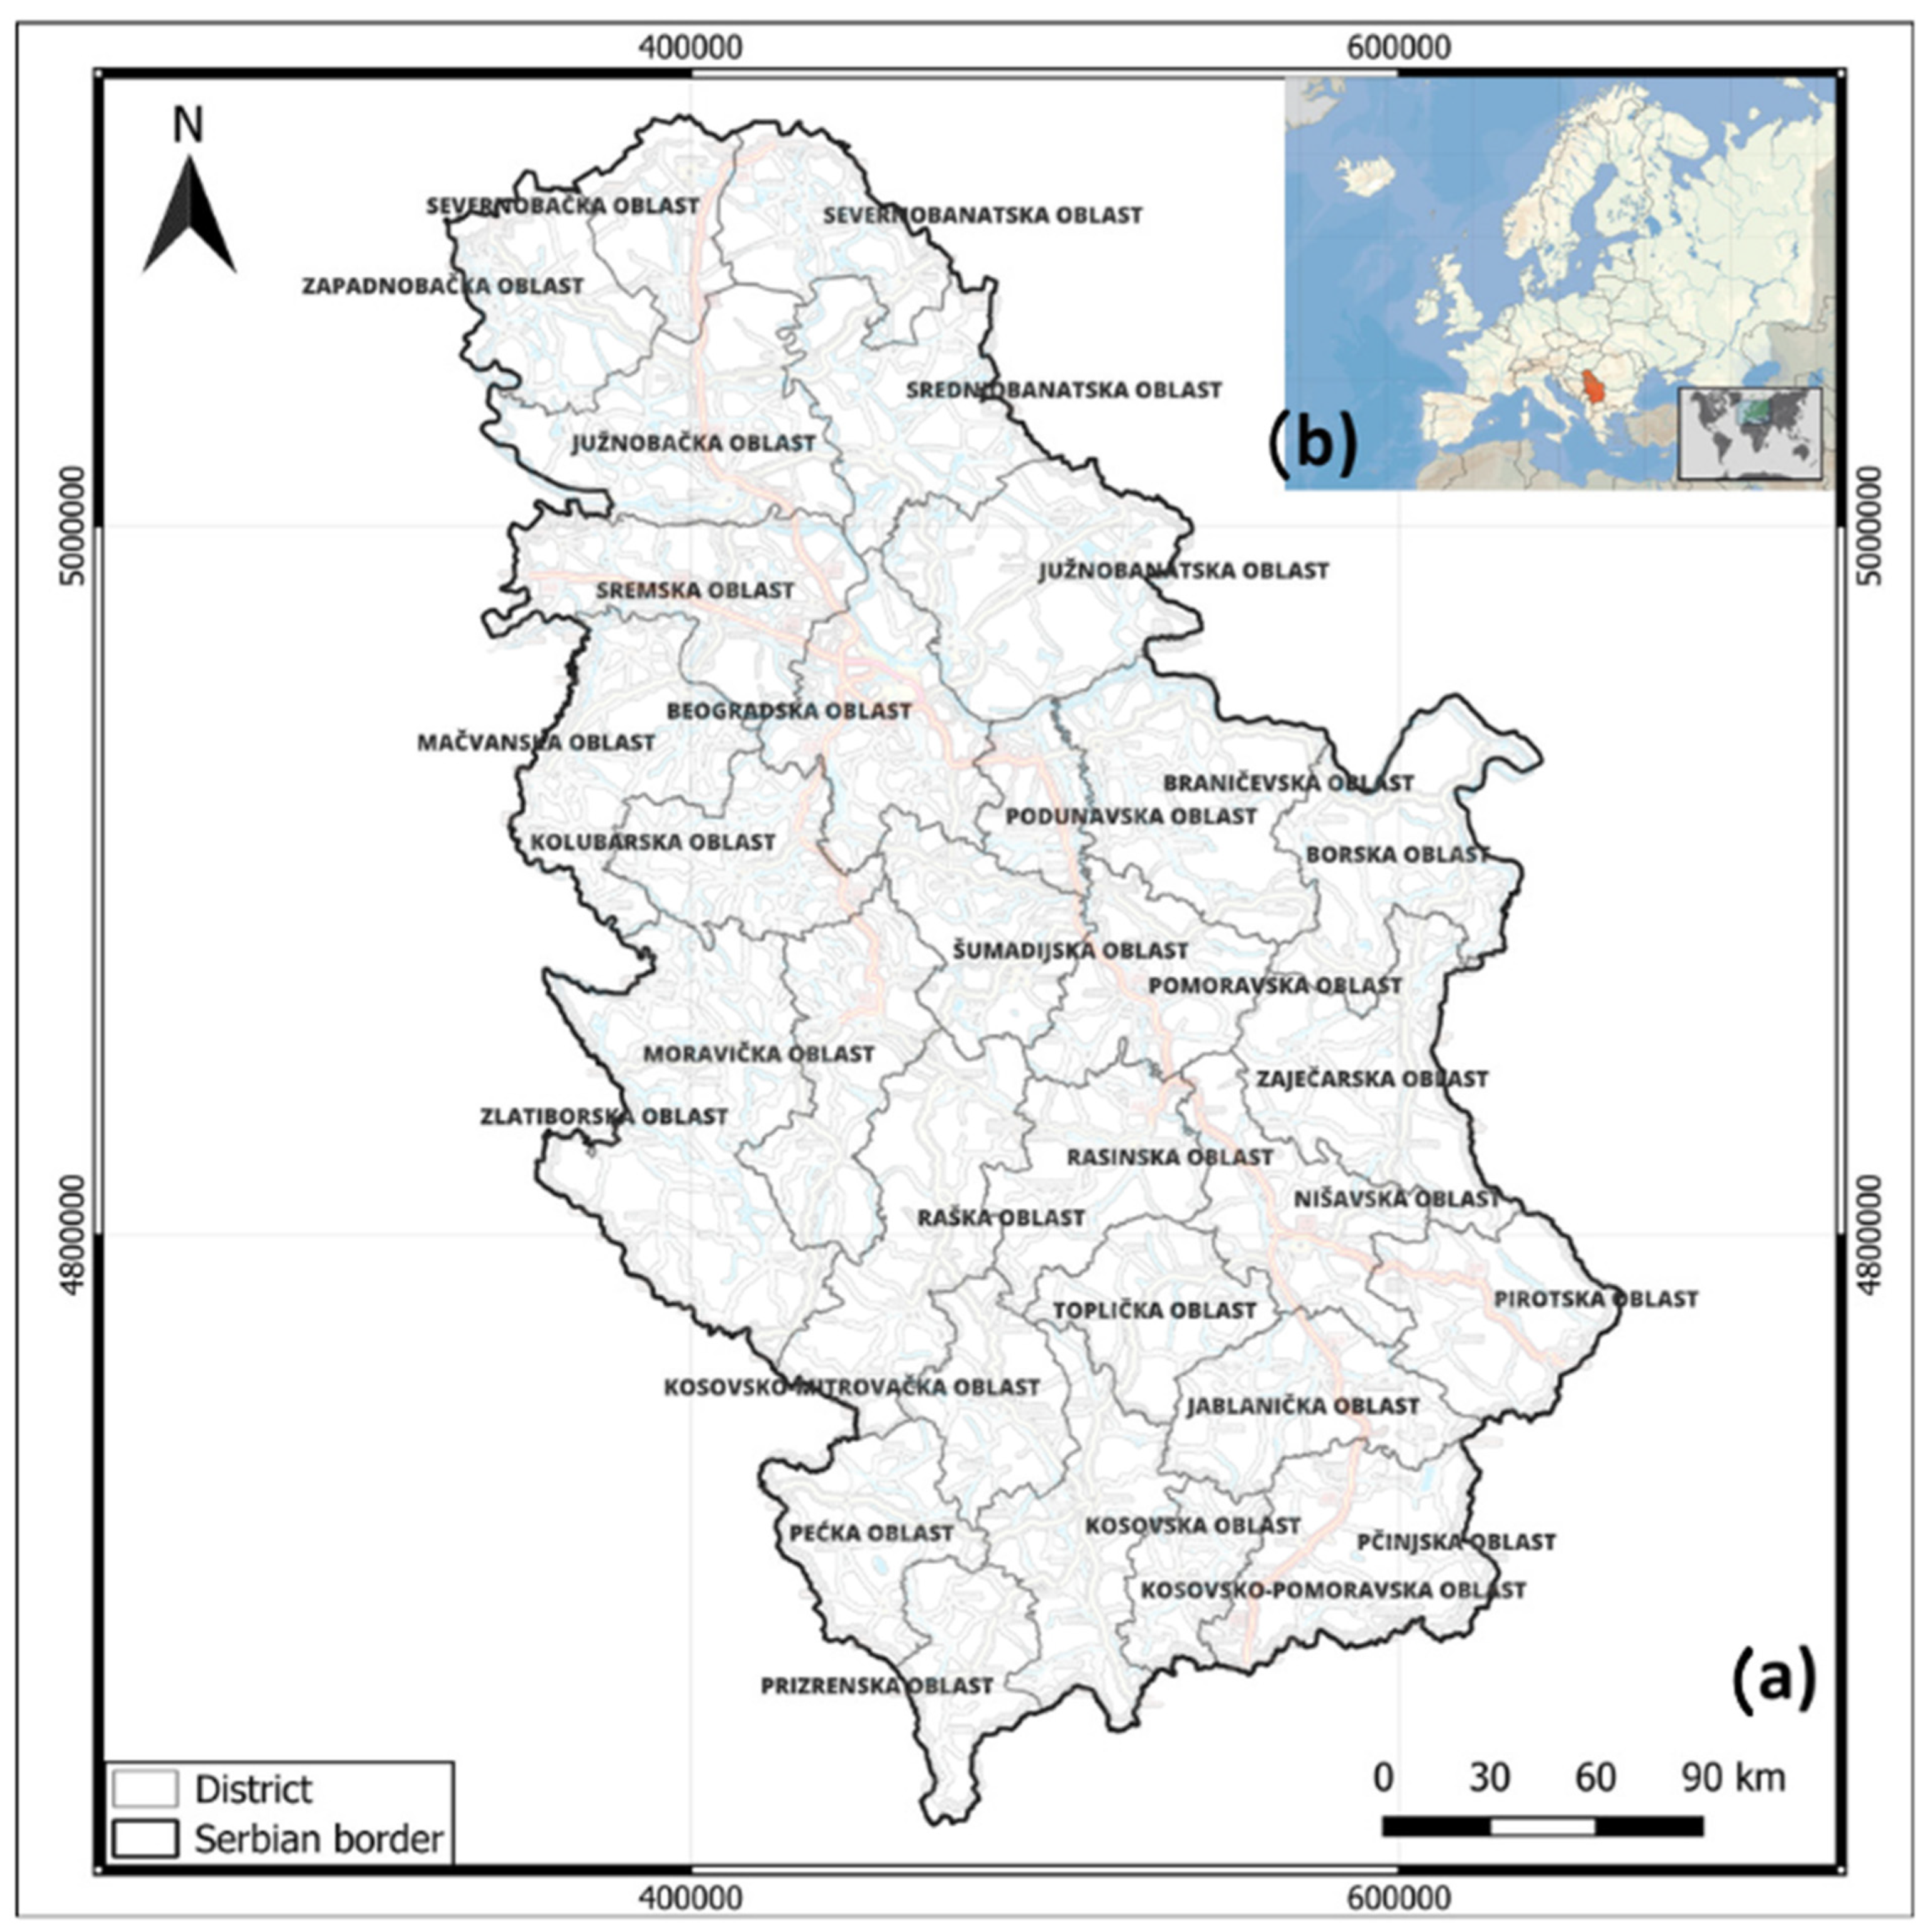
2.1. Study Area
This research was carried out in the Republic of Serbia, a Southeast European country undergoing significant political transition and facing persistent socioeconomic and security challenges. Serbia is exposed to a wide array of risks, including natural hazards such as floods, earthquakes, extreme weather conditions, and human-induced threats like industrial accidents and fires. Major natural threats include seismic activity, landslides, rock falls, and torrential floods [164]. In Serbia, approximately 5,000 disasters are reported to have occurred from the 1970s through 2002. According to the DesInventar database (https://www.desinventar.net), between 1980 and 2023, the country experienced 2,331 disasters: 6 from 1980-1990, 56 from 1990-2000, 301 from 2000-2010, 1,626 from 2010-2023, and 316 from 2020-2023. This data indicates 11 accidents, 9 hazardous material contaminations, 51 droughts, 30 explosions, 20 epidemics, 307 fires, 583 floods, 626 forest fires, 68 landslides, 270 hailstorms, 17 hazardous material leaks, and 157 snowstorms, among others. Specifically, from 2017 to 2021, Serbia faced 404 disasters: 29 in 2017 (harming 4 cities and 22 municipalities), 71 in 2018 (impacting 5 cities and 40 towns), 67 in 2019 (involving 7 cities and 42 municipalities), 204 in 2020 (spanning 37 cities and 136 towns), and 96 in 2021 (across 10 cities and 60 municipalities).
In addition, the country contends with broader societal issues, including organized crime, corruption, and vulnerabilities in cyber security [178,179,180,181]. Serbia’s post-conflict context, ongoing migration dynamics, and continued institutional reforms further shape its risk landscape and influence public confidence in national safety and crisis management systems.
Figure 2.
Study area.
2.2. Sample Characteristics
The sample comprises 406 participants, with 55% identifying as female and 45% as male. The largest age group is those aged 24 to 26 years, making up 40.39%, while the smallest group includes participants aged 27 years and older at 12.56%. A majority of respondents study in Belgrade (52.96%), followed by Novi Sad (30.79%) and Kragujevac (16.26%). Regarding their year of study, third-year students represent the largest segment at 36.27%, and most are enrolled in public institutions (84.98%).
Field-wise, most participants come from social and humanistic sciences (63.41%) and are predominantly enrolled in undergraduate programs (76.60%). The most common average grades fall within the 7.00–8.00 range (35.47%).
Household sizes typically consist of 3 to 4 members (60.90%), and most respondents report a family income between 1001 and 2000 EUR (53.49%), while only 4.82% report an above-average income of 2001 to 4000 EUR. Regarding safety engagement, 34.34% have participated in safety-related activities. Online portals and social media (33.2%) are the primary sources of safety information, followed by discussions with family and friends (27.4%) and television (19.6%). Safety news is most often followed occasionally (41.87%), with 22.17% following it daily. Regarding voting behavior, a significant majority (61.19%) reported having voted in all elections since acquiring the right, while 13.93% voted more frequently than they abstained. Only 8.71% have never voted (Table 1).
Further results indicate that most respondents (45.6%) participated in student plenums and attended various protests or blockades. In comparison, an additional 12.1% are actively engaged in working groups and organising student actions, reflecting high student mobilisation. Meanwhile, around a quarter (22.7%) follow the protests solely through social media, while less than 16% express only declarative support or remain wholly neutral and uninvolved.
Most respondents show strong support for the four student demands. Almost all participants have a favourable view, with 86.9% fully endorsing the demands and an additional 7.4% showing partial support. A neutral view is held by 3.2% of respondents, while merely 1.7% express any opposition. These findings highlight a broad consensus among the sample on the validity and significance of the student demands.
Regarding backing student protests and blockades, the results still show strong agreement, though slightly less than for the demands themselves. Around 79.3% of respondents fully support these forms of student activism, while 9.4% provide partial support. A neutral position is noted among 3.0% of participants, with 7.6% expressing some level of opposition. Overall, the sample indicates a broadly positive perspective on student activism, with somewhat more hesitance regarding protest methods compared to the actual demands.
2.3. Questionnaire Design
This study employed a structured survey titled “Multidimensional Security Perceptions Among Youth in Serbia” to investigate young people's perspectives on various contemporary security concerns. It concentrates on their perceptions of safety, trust in institutions, and attitudes regarding personal, digital, and national security, as well as disaster preparedness and civic engagement. The research was conducted through an online survey using a structured questionnaire distributed via educational and social media platforms, with participants being informed in advance about the study’s objectives and confidentiality.
The survey begins with a brief explanation for participants, emphasizing the significance of their feedback and guaranteeing confidentiality. It underscores the necessity of incorporating youth viewpoints when tackling today's security issues and formulating policies. The instrument consists of two primary sections:
I. General Information—This section collects background information such as age, gender, education level, location of studies, family income, prior involvement in safety-related activities, sources of security information, and voting behaviors. These details provide context for understanding how different demographics perceive security.
II. Attitudes - The second part encompasses six key themes, each featuring multiple statements rated on a five-point scale (from strongly disagree to strongly agree):
2.1. Personal safety – Assesses how safe participants feel daily, including their opinions on crime rates, police responsiveness, and community support.
2.2. Safety at public events and demonstrations – Examines attitudes towards civic engagement, police conduct, media reporting, and safety at public gatherings.
2.3. National-level threats—This section addresses large–scale dangers such as terrorism, cyber threats, climate change, organized crime, and political unrest.
2.4. Digital security and privacy – Investigates concerns about data privacy, surveillance, and the equilibrium between individual freedoms and safety.
2.5. Disaster preparedness and Crisis Response– Looks at trust in emergency services, public awareness, and institutional readiness for disasters.
2.6. Institutional confidence and trust in security policy – Analyze public confidence in major institutions like the judiciary, government, media, and the transparency of security policies.
The survey features a mix of multiple-choice and open-ended questions, providing insights into how youth personally relate to security matters. The questionnaire utilized a five-point Likert scale, in which 1 indicated “strongly disagree” and 5 denoted “strongly agree." Its layered structure is crucial for revealing the connections between demographic factors and security perceptions, which is vital for shaping public safety strategies and enhancing youth participation.
The questionnaire development involved multiple methodological steps to validate the instrument's efficacy (see Appendix A). Initially, a pilot study was conducted with a sample that resembled the target population. This step revealed ambiguities in both instructions and question formulation. Based on the feedback from participants, several items were modified to enhance clarity and relevance. Subsequently, we assessed the internal consistency of each thematic subscale by calculating Cronbach’s alpha coefficients, as previously mentioned. The internal consistency of each thematic subscale was satisfactory: personal safety (α = 0.82), safety at public events and demonstrations (α = 0.85), national-level threats (α = 0.80), digital security and privacy (α = 0.88), disaster preparedness and crisis response (α = 0.83), and institutional confidence and trust in security policy (α = 0.86).
All coefficients exceeded the widely accepted threshold of 0.70, confirming the scales' reliability. In addition to reliability testing, both content and construct validity were verified through expert evaluations and alignment with established theoretical frameworks. This iterative development process guaranteed that the final instrument was a psychometrically robust tool appropriate for investigating multidimensional security perceptions among youth in Serbia.
2.4. Analyses
The study utilised a multi-tiered statistical approach to address the research questions and test the proposed hypotheses. Statistical tests were conducted using a two-tailed method with a significance level of p < 0.05, utilizing IBM SPSS Statistics (Version 26, New York, NY, USA). The initial phase involved descriptive statistics to outline overall patterns in how youth perceive security across six domains: personal safety, safety at public events and demonstrations, perceptions of national threats, digital security and privacy, disaster preparedness, and trust in institutions and security-related policies. Measures of central tendency and variability—means, standard deviations, and frequency distributions—were calculated to provide an overview of trends within the sample.
Subsequently, inferential analyses were conducted to explore differences among demographic subgroups. An independent-sample t-test evaluated gender differences in perceived personal and digital safety. A one-way ANOVA was employed to compare mean scores across variables such as field of study, residential location (urban versus rural), and self-perceived financial standing. When the assumption of equal variances was violated, Welch’s ANOVA and the Brown–Forsythe test were utilised to ensure robustness. Post hoc comparisons (e.g., Tukey HSD) were employed to interpret specific group differences for significant effects.
Pearson's correlation coefficients were calculated to examine associations between predictor variables and the six domains of perceived security. These correlations helped identify the strength and direction of relationships involving factors like institutional trust, socio-economic indicators, and exposure to safety-related information, forming the basis for subsequent predictive modelling.
Subsequently, a series of multiple linear regression analyses were conducted to identify the most significant predictors of perceived security across the domains. The models adhered to a hierarchical structure: demographic variables were entered first, followed by socioeconomic factors, and finally, institutional trust and informational exposure. This approach facilitated an incremental assessment of the explanatory power of each variable group. Standard regression diagnostics, including checks for multicollinearity (Variance Inflation Factor and tolerance), were performed to validate the models.
To systematically capture young people's perceptions across various safety domains, six composite variables were developed, each representing a specific dimension: (1) personal safety, (2) safety at public events and demonstrations, (3) perceived national threats, (4) digital security and privacy, (5) disaster preparedness and crisis response, and (6) institutional confidence and trust in security policies.
Each composite variable aggregated participants’ responses to thematically aligned statements measured on a five-point Likert scale (1 = strongly disagree to 5 = strongly agree). This process involved calculating the arithmetic mean of all items in a given dimension, producing a continuous variable reflecting the overall level of perceived safety or trust in that area.
The internal consistency of each dimension was validated using Cronbach’s alpha, which confirmed acceptable reliability levels for all six scales (α ranging from 0.80 to 0.88). This approach enabled the transformation of multiple-item measures into reliable indicators, suitable for advanced statistical analyses such as correlation, ANOVA, and regression modeling. The use of mean scores ensured comparability across domains and aided in identifying key predictors of perceived safety in each area.
All analyses were executed using two-tailed tests with a significance threshold established at p < 0.05. Furthermore, the internal consistency of composite scales based on Likert-type items was evaluated using Cronbach’s alpha. The research followed the Declaration of Helsinki guidelines [98] and received approval from the Institutional Review Board of the Scientific–Professional Society for Disaster Risk Management (protocol code 002/2025, July 15, 2024).
3. Results
3.1. Descriptive Analysis of Youth Perceptions of Personal Safety in Serbia
The descriptive statistics results are organized into six thematic subsections: perceptions of personal safety, safety at public events and demonstrations, perceptions of national-level threats, digital security and privacy, disaster preparedness and crisis response, and trust in institutions and security policies.
3.1.1. Perceptions of Personal Safety
Table 2 and Figure 3 outline the descriptive statistics regarding young people's views on various aspects of personal safety. Notably, the statement "Fear of crime affects my daily life" received the highest mean score (M = 3.32, SD = 1.28), underscoring the prominent influence of crime-related fears on youths' everyday routines. A high level of agreement was also observed regarding feeling safe at home (M = 3.30, SD = 1.28), suggesting that most young individuals perceive their residences as secure environments.
In contrast, the lowest mean score emerged for the statement "People in my community are willing to help in dangerous situations" (M = 2.29, SD = 1.25), pointing to a perceived shortfall in communal support during emergencies or risky encounters. Responses related to the perceived effectiveness of the police (M = 3.17, SD = 1.52) and the safety of streets for cyclists and pedestrians (M = 3.13, SD = 1.07) fell into a more moderate range, reflecting a cautious but present sense of trust in local safety systems and infrastructure.
Some level of discomfort was evident in the responses to statements like "I avoid certain parts of the city due to feeling unsafe" (M = 2.68, SD = 1.42) and "I feel safe walking alone at night" (M = 2.91, SD = 1.38), indicating that personal safety concerns in public areas remain an issue for many (Table 2 and Figure 3). These findings suggest that while young people tend to feel secure within private or familiar spaces, public safety, community solidarity, and the ongoing impact of crime continue to weigh on their sense of well-being.
3.1.2. Perceptions of Safety at Public Events and Demonstrations
Table 3 presents descriptive statistics that capture youth perspectives on safety and civic engagement during public events and protests (Figure 4). The highest agreement was found for the statement, "I am interested in participating in demonstrations if they advocate for critical social changes" (M = 4.51, SD = 0.99). This is closely followed by sentiments highlighting broader civic involvement: "I believe that young people should be more active in socio-political life" (M = 4.50, SD = 0.88) and "Citizens should participate in protests more frequently" (M = 4.45, SD = 0.99). These responses collectively reflect a strong civic awareness among young people and a willingness to participate in collective action driven by significant causes.
High agreement levels were also recorded for concerns related to protest dynamics. Statements like "The presence of provocateurs often contributes to the escalation of violence during protests" (M = 4.31, SD = 0.98) and "Protesters are often subjected to unfounded pressure by the authorities" (M = 4.23, SD = 1.02) reflect critical attitudes toward the handling of demonstrations and the challenges participants may face (Table 3 and Figure 4).
At the same time, support for protests as a legitimate form of civic expression remains evident, as shown in the agreement with "Protests are an effective way of expressing civic dissatisfaction" (M = 4.26, SD = 1.09). However, this is coupled with a strong sense of distrust toward media narratives, with the lowest mean recorded for the statement "The media report objectively on demonstrations" (M = 1.62, SD = 0.95), underscoring skepticism about journalistic neutrality.
Moderate agreement was noted for the view that "The police use excessive force when securing protests" (M = 3.06, SD = 1.23). In contrast, opinions on the safety of protests were relatively neutral, as indicated by the score for "Demonstrations in Serbia are generally safe for participants" (M = 2.87, SD = 1.24) (Table 3 and Figure 4).
The data paints a picture of a socially conscious and civically engaged youth population—supportive of activism, yet wary of institutional responses and media portrayals surrounding public demonstrations.
3.1.3. Perceptions of National-Level Threats
The perceptions of young individuals regarding different national-level threats to Serbia’s security are outlined in Table 4 and Figure 5. The statement "Organised crime represents a serious threat to Serbia" received the highest average rating (M = 4.75, SD = 0.58), indicating broad agreement among young people regarding the severity of this issue. Following closely were concerns about "The spread of disinformation poses a risk to social stability" (M = 4.64, SD = 0.65) and "Energy dependence on other countries jeopardises our security" (M = 4.26, SD = 0.88), highlighting the substantial value placed on information integrity and energy independence.
Further, considerable apprehension was noted in responses to "Global economic instability" (M = 4.15, SD = 0.92), "Migration as a potential security challenge" (M = 4.11, SD = 1.01), and "Cyberattacks" (M = 4.01, SD = 1.07), all averaging above 4.00. These scores suggest that young people are attuned to both conventional and contemporary transnational risks.
Issues such as "Pandemics as a threat to national security" (M = 3.94, SD = 1.12), "Political instability in neighboring countries" (M = 3.84, SD = 1.01), and "Climate change" (M = 3.83, SD = 1.26) evoked a moderate level of concern, reflecting awareness of the multifaceted risks impacting national resilience.
The lowest average rating was recorded for "Terrorism poses a significant threat to our country" (M = 3.35, SD = 1.30). While this indicates that terrorism is not dismissed as irrelevant, it is perceived as less immediate than other pressing challenges like organized crime or the spread of disinformation (Table 4 and Figure 5).
The findings reveal that Serbian youth recognize a broad spectrum of traditional and emerging security threats and express exceptionally high concern over internal vulnerabilities and external dependencies.
3.1.4. Perceptions of Digital Security and Privacy
Table 5 and Figure 6 depict the youth's views on digital security and privacy. The top concern was "I support the use of surveillance technologies in the fight against crime" (M = 4.25, SD = 0.88), closely followed by "I believe it is necessary to strike a balance between privacy and national security" (M = 4.20, SD = 0.93). These findings demonstrate the respondents' awareness of broader systemic and ethical issues related to digital safety.
High levels of agreement were also seen for statements like "I believe that surveillance through public space cameras is justified for safety reasons" (M = 3.88, SD = 1.11), "I am concerned about the collection of personal data by the government" (M = 3.81, SD = 1.21), and "I am concerned about the potential misuse of my data by third parties" (M = 3.75, SD = 1.21). This trend suggests a growing recognition of hybrid threats and privacy risks linked to today's digital landscape (Table 5 and Figure 6).
Responses like "I feel uncomfortable with companies tracking online activities" (M = 3.69, SD = 1.21) and "I support the use of biometric data for identification purposes in the interest of security" (M = 3.55, SD = 1.14) indicated moderate concern. These responses reflect an awareness of emerging digital and informational risks, which is especially pertinent in today’s surveillance-oriented digital landscape.
In contrast, the lowest mean scores were recorded for statements such as "I believe my personal data is protected online" (M = 2.20, SD = 1.16), "I feel that I have control over who can access my personal information" (M = 2.54, SD = 1.29), and "I believe that data protection laws in Serbia are adequate" (M = 2.52, SD = 1.10).
These results imply that respondents feel they have limited control and that legal protections regarding digital privacy and data security are insufficient. Overall, the findings suggest that young individuals in Serbia are especially aware of the transnational and systemic issues related to surveillance, privacy, and the misuse of technology, underscoring the necessity for stronger regulatory measures and enhanced public awareness about digital rights and data protection.
3.1.5. Perceptions of Disaster Preparedness and Crisis Response
Table 6 provides an in-depth examination of how Serbian youth perceive the country’s disaster preparedness and crisis response mechanisms. The highest level of agreement was noted regarding the statement "Emergencies such as floods and earthquakes pose a serious risk in Serbia" (M = 3.90, SD = 1.11), indicating an increased awareness of natural disasters as a significant concern.
Conversely, the lowest mean scores were associated with "Citizens are sufficiently educated about how to respond in crisis situations" (M = 1.68, SD = 0.88) and "I believe that the media is a reliable source of information during crises" (M = 1.89, SD = 1.06). These findings highlight a perceived gap in both public education and trustworthy crisis communication, potentially undermining the effectiveness of responses.
Low confidence in institutional readiness was also evident. Ratings for "I believe that Serbia is adequately prepared for emergencies" (M = 1.95, SD = 1.00), "I believe that schools and universities are adequately prepared for crisis situations" (M = 2.01, SD = 1.03), and "I trust the civil protection system in Serbia" (M = 2.13, SD = 1.10) suggest a general scepticism about institutional capability.
Slightly higher, yet still limited, agreement was observed for "The disaster early warning system in Serbia is effective" (M = 2.15, SD = 1.12), "I believe that data protection laws in Serbia are adequate" (M = 2.21, SD = 1.08), and "Public services respond quickly in emergency situations" (M = 2.44, SD = 1.17), indicating a recognition of partial but inadequate functionality.
The only area demonstrating a relatively more favourable response was "I know how to respond in the event of a natural disaster" (M = 2.96, SD = 1.26), which may indicate some degree of personal awareness despite broader concerns regarding systemic readiness (Table 6 and Figure 7). Overall, the results suggest that while young people in Serbia are aware of the risks associated with emergencies, they exhibit limited trust in the institutions responsible for crisis response. The data underscores a perceived need for enhanced education, more reliable communication, and increased institutional preparedness.
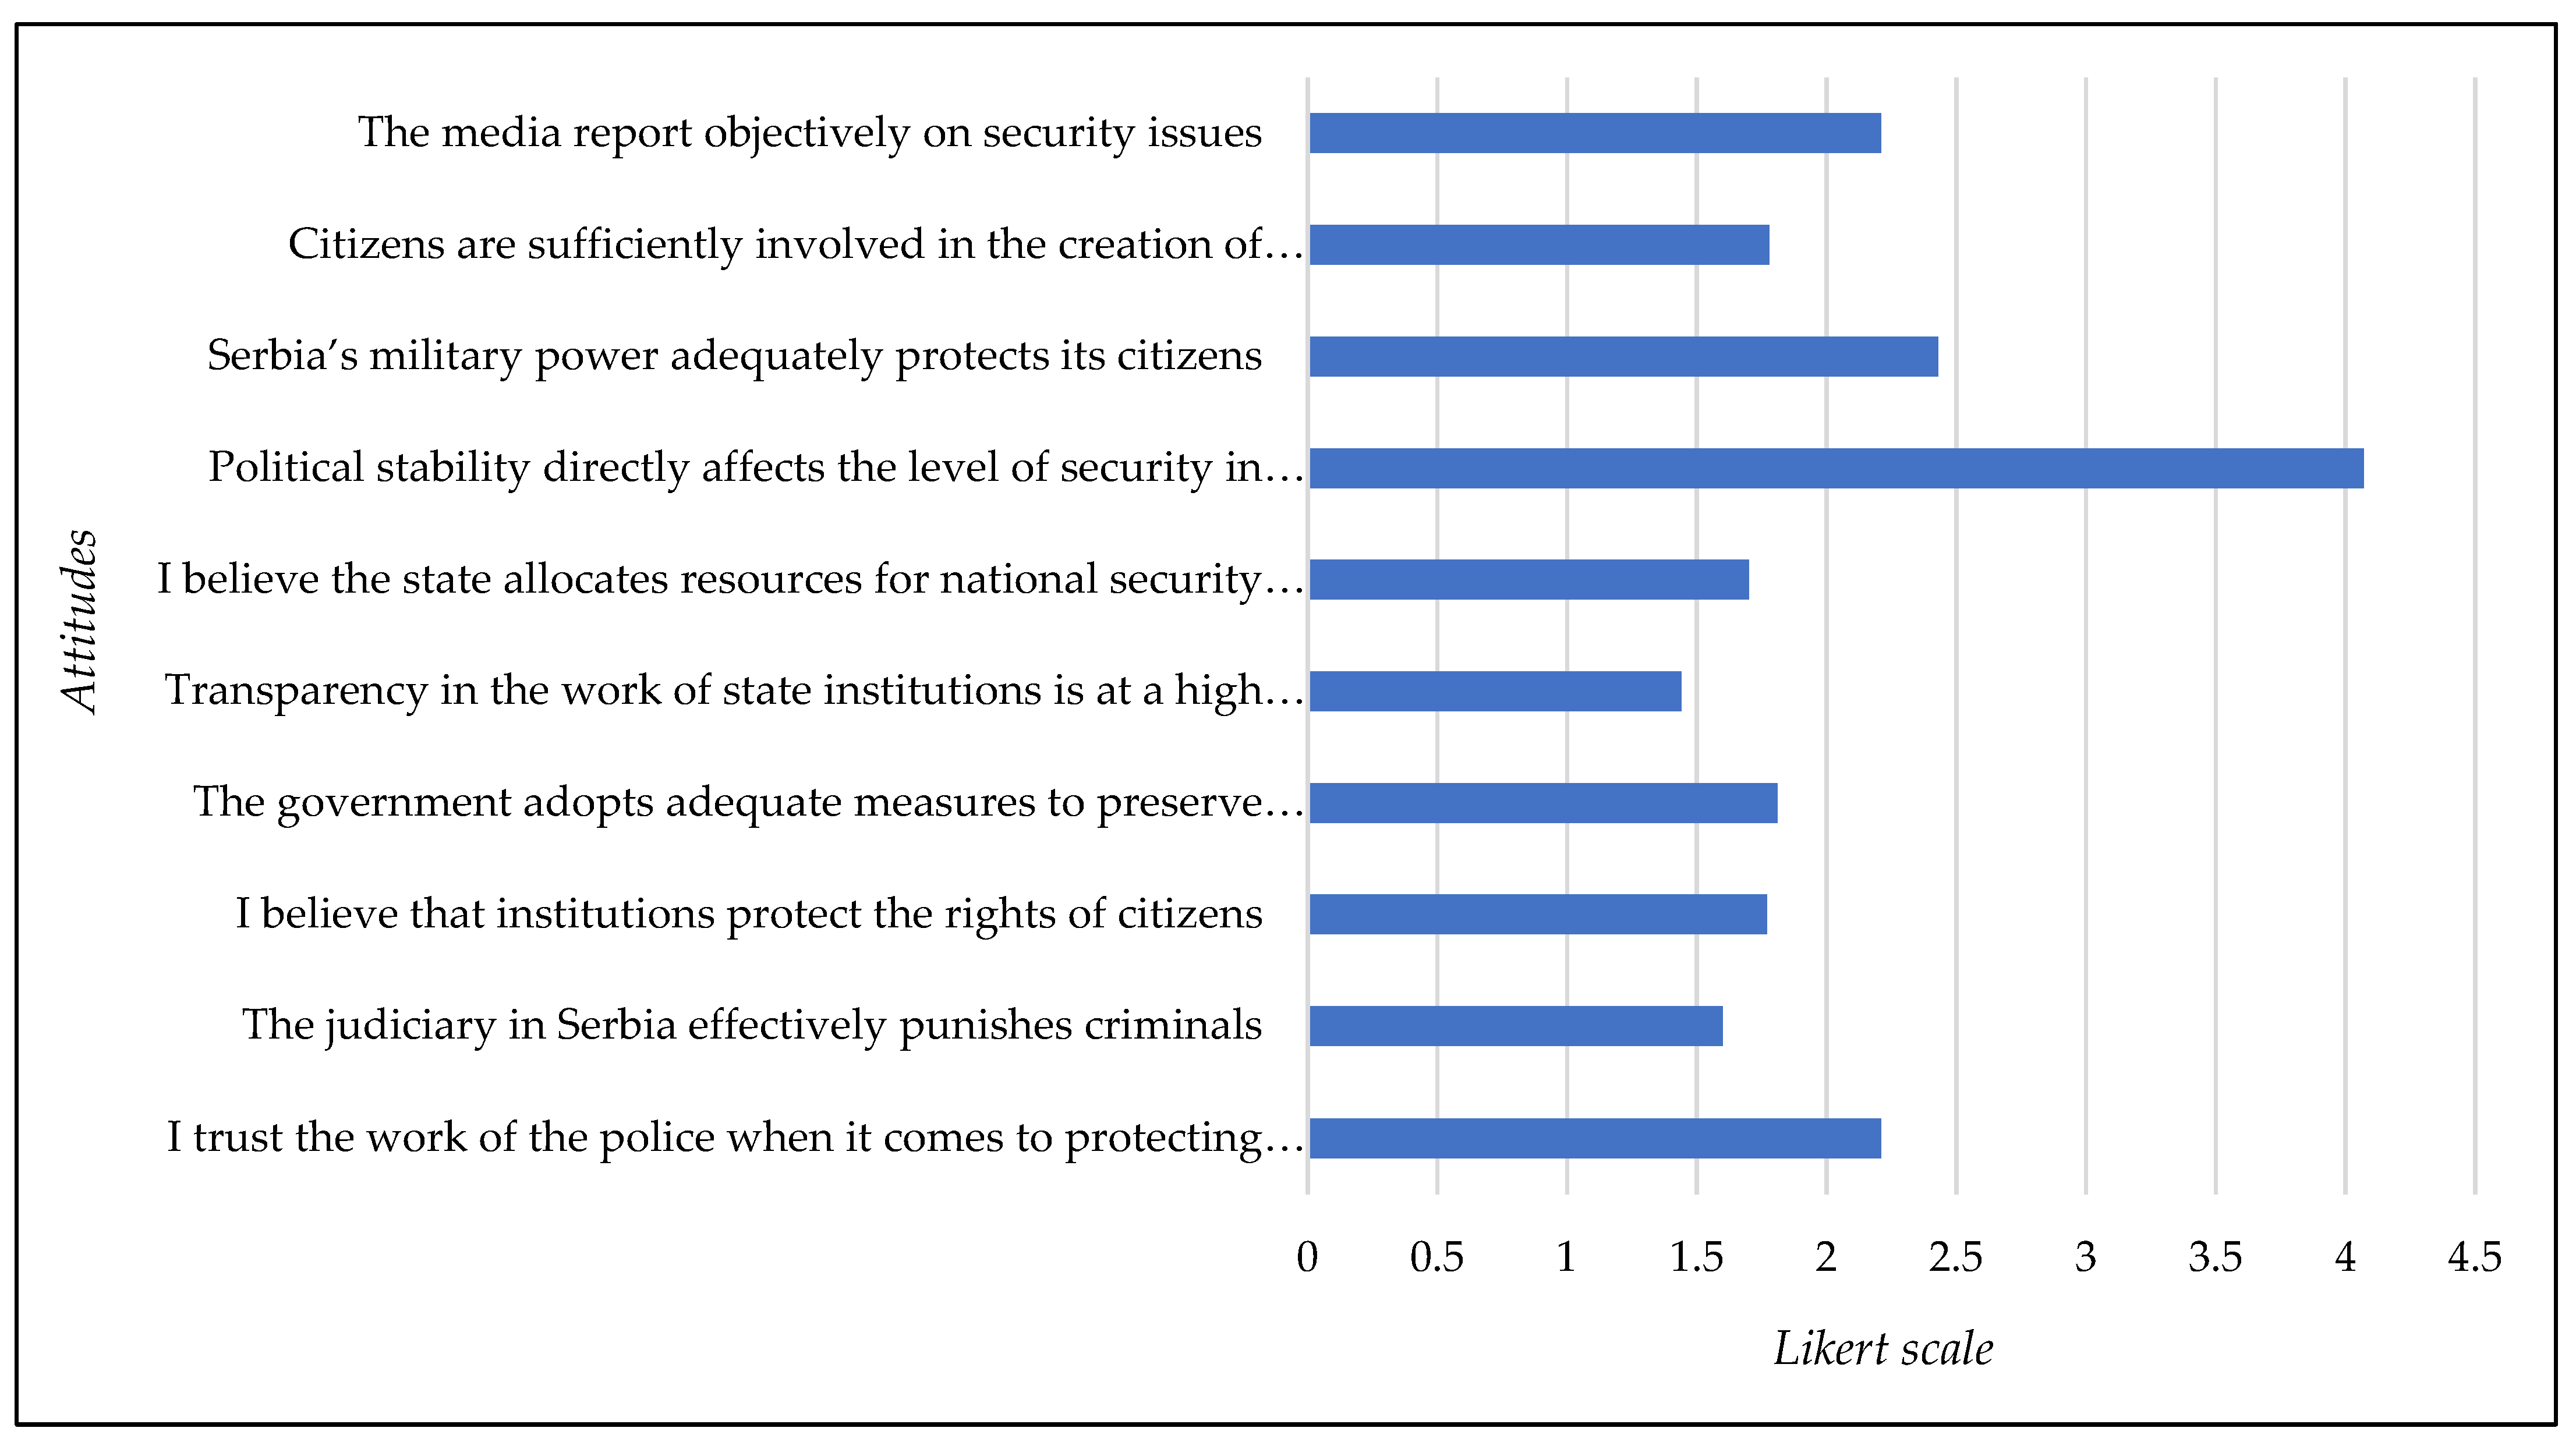
3.1.6. Perceptions of Institutional Confidence and Trust in Security Policy
The findings reflect a generally low level of trust in institutional performance. Table 7 presents Serbian youth's perceptions regarding the effectiveness, transparency, and inclusiveness of institutions responsible for national security and public safety.
The statement "Political stability directly affects the level of security in the country" garnered the highest agreement (M = 4.07, SD = 1.25), indicating that while institutional confidence is limited, the broader political context is clearly recognised as a key determinant of national security. Among specific institutions, greater trust was placed in "Serbia’s military power adequately protects its citizens" (M = 2.43, SD = 1.14), "I trust the work of the police when it comes to protecting citizens" (M = 2.21, SD = 1.19), and "The media report objectively on security issues" (M = 2.21, SD = 1.19). These responses suggest slightly more confidence in security forces compared to administrative and judicial institutions.
Conversely, the lowest mean scores were associated with "Transparency in the work of state institutions is at a high level" (M = 1.44, SD = 0.84), "The judiciary in Serbia effectively punishes criminals" (M = 1.60, SD = 0.90), and "I believe the state allocates resources for national security properly" (M = 1.70, SD = 0.97).
Similar scepticism was observed in responses about citizen participation and civil rights protection, reinforcing perceptions of limited institutional accountability and responsiveness (Figure 7). These findings indicate a pronounced lack of confidence among Serbian youth in institutional governance, particularly regarding transparency, justice, and public engagement. While security forces enjoy relatively higher trust, broader systemic concerns remain largely unaddressed in the eyes of young respondents.
Figure 8.
Descriptive statistics on perceptions of institutional confidence and trust in security policy.
Figure 8.
Descriptive statistics on perceptions of institutional confidence and trust in security policy.
3.2. Correlations and Effects of Socio-Demographic Factors on Perceived Personal Safety
3.2.1. Group Differences in Perceptions of Safety, Preparedness, and Institutional Trust: Independent Samples T-Test Results
Table 8 shows the findings from independent sample t-tests that explore gender differences across six key areas concerning youth attitudes towards safety and security. A notable difference was identified solely in the area of Perceptions of personal safety (t = 2.49, p = 0.01), where male participants indicated higher perceived personal safety levels (M = 2.97, SD = 0.53) than their female counterparts (M = 2.72, SD = 0.50). No significant gender disparities were observed in the remaining five areas: perceptions of public event safety, national threats, digital security, disaster preparedness, and confidence in institutions. These findings imply that overall perceptions of safety are comparable between genders, although men report a slightly greater sense of personal safety than women.
Table 9 elaborates on the previous findings by presenting the independent samples t-test results for each item related to youth perceptions of personal safety. Statistically significant gender differences were observed in seven out of ten items. Male respondents reported significantly higher feelings of safety in their place of residence (t = 2.92, p = 0.004), when walking alone at night (t = 7.65, p = 0.000), and while using public transportation (t = 7.07, p = 0.000). Additionally, they were less likely to avoid certain parts of the city due to feelings of unsafety (t = –4.05, p = 0.000) and expressed lower levels of fear regarding crime in their daily lives (t = –2.62, p = 0.009).
Furthermore, males were more likely to believe that street lighting and surveillance technologies enhance safety (t = 2.18, p = 0.030) and perceived lower crime levels in their area than females (t = –2.67, p = 0.008). No significant gender differences were found in perceptions of police responsiveness (p = 0.73), community willingness to assist (p = 0.78), or the perceived safety of streets for pedestrians and cyclists (p = 0.21).
These detailed results provide a clearer insight into gender-based differences. Male respondents noted higher feelings of safety, whereas female respondents voiced more concern regarding exposure to everyday safety risks and crime threats.
The independent samples t-test results indicated no statistically significant differences in perceived safety between students at public and private universities across any of the six measured dimensions (Table 10). Concerning personal safety, private university students reported slightly higher perceptions than public institutions (M = 2.90, SD = 0.52 vs. M = 2.86, SD = 0.51), though this difference was insignificant. A similar trend was noted in perceptions of safety at public events and demonstrations, where students from public universities scored somewhat higher (M = 3.77, SD = 0.50) than their private university counterparts (M = 3.64, SD = 0.60), yet the difference lacked statistical significance. Regarding perceptions of national-level threats, public university students showed slightly more significant concern (M = 4.10, SD = 0.59) compared to those from private institutions (M = 3.98, SD = 0.50). In the area of digital security and privacy, private university students indicated marginally higher perceptions (M = 3.49, SD = 0.43) than public university students (M = 3.43, SD = 0.51). Still, again, this difference was not statistically significant. Evaluations of disaster preparedness were nearly equal between both groups (public: M = 2.33, SD = 0.66; private: M = 2.35, SD = 0.68). Lastly, institutional trust was slightly higher among private university students (M = 2.10, SD = 0.65) than public university students (M = 2.01, SD = 0.69), although without statistical significance.
Overall, these results indicate that the type of university—public or private—does not substantially affect students' perceptions of safety and institutional trust.
The independent samples t-test results (Table 11) reveal that, in most areas of perceived safety, there were no significant differences between students involved in safety-related activities and those who were not (p > 0.05), except for the digital security and privacy domain.
Regarding personal safety, students engaged in safety-related activities reported slightly lower levels of perceived safety (M = 2.82, SD = 0.51) than their non-participating counterparts (M = 2.89, SD = 0.51). However, this difference was insignificant (t (396) = -1.282, p = 0.201). Perceptions of safety at public events and demonstrations were nearly the same for both groups (m = 3.76), indicating no notable difference (p = 0.976). Similarly, students involved in safety-related activities viewed national-level threats slightly more seriously (m = 4.12, SD = 0.55) than those who did not participate (M = 4.07, SD = 0.60). Still, this difference also lacked significance (p = 0.498).
A similar pattern emerged for disaster preparedness (M = 2.27 vs. 2.36) and institutional confidence (M = 1.97 vs. 2.03), both showing statistically insignificant differences. In contrast, a statistically significant difference did emerge in the digital security and privacy domain (t(396) = −2.970, p = 0.003). Non-participating students reported higher perceptions of digital security (M = 3.48, SD = 0.48) than those who participated (M = 3.33, SD = 0.52). This implies that individuals more engaged in safety-related practices might be more cognizant of digital vulnerabilities, leading to more critical evaluations of digital security. Involvement in safety-related activities had a minimal impact on students’ perceptions of most safety dimensions, except for digital security, where non-participating students felt more secure. This may indicate a difference in risk awareness between more and less active individuals.
3.2.2. Correlational Analysis of Demographic and Socioeconomic Predictors of Perceived Security
Table 9 illustrates Pearson’s correlation findings, which explore the relationships between students’ ages and six theme areas: personal safety, safety at public events and demonstrations, national threats, digital security and privacy, disaster preparedness and crisis response, and institutional confidence and trust in security policies.
A weak yet statistically significant negative correlation was identified between age and perceptions of safety at public events and demonstrations (r = –0.16, p ≤ 0.01). This suggests that younger students generally feel safer than their older counterparts in these scenarios. Other correlations involving age and the thematic variables were minor and did not reach statistical significance.
Several notable positive correlations emerged among the thematic variables. Specifically, personal safety showed a positive correlation with digital security and privacy (r = 0.22, p ≤ 0.01), disaster preparedness (r = 0.43, p ≤ 0.01), and institutional confidence (r = 0.36, p ≤ 0.01). This indicates that students who feel personally secure are also more inclined to trust institutions and feel equipped to handle emergencies.
In contrast, safety at public events and demonstrations had a negative correlation with disaster preparedness (r = –0.18, p ≤ 0.01) and institutional confidence (r = –0.32, p ≤ 0.01), implying that students who perceive more excellent safety at public events may simultaneously exhibit lower levels of trust in institutions and preparedness.
The strongest correlation identified was between disaster preparedness and institutional confidence (r = 0.64, p ≤ 0.01), highlighting a strong relationship between feelings of preparedness for crises and trust in institutions (Table 9).

Table 12.
Pearson’s correlation results for the relationship between six thematic subsections variables and their age (n = 406).
Table 12.
Pearson’s correlation results for the relationship between six thematic subsections variables and their age (n = 406).
| Variable | Age | Personal Safety | Safety at public events and demonstrations |
National-level threats | Digital security and privacy | Disaster preparedness and crisis response |
Institutional confidence and trust in security policy |
| Age | 1.00 | ||||||
| Personal Safety | –0.03 | 1.00 | |||||
| Safety at public events and demonstrations | –0.16** | 0.00 | 1.00 | ||||
| National-level threats | –0.04 | 0.03 | 0.28** | 1.00 | |||
| Digital security and privacy | –0.09 | 0.22** | 0.14** | 0.25** | 1.00 | ||
| Disaster preparedness and crisis response | –0.08 | 0.43** | –0.18** | 0.02 | 0.36** | 1.00 | |
| Institutional confidence and trust in security policy | –0.07 | 0.36** | –0.32** | –0.01 | 0.22** | 0.64** | 1.00 |
Note: * p ≤ 0.05; ** p ≤ 0.01.
A detailed examination of Pearson’s correlation coefficients uncovered several significant relationships between students’ age and their attitudes in various thematic areas.
Regarding perceptions about protest safety and public demonstrations, younger students generally viewed such events in Serbia as safer (r = –0.16, p = 0.003). They were also less inclined to believe that provocateurs primarily contribute to violence escalation during protests (r = –0.17, p = 0.001) and showed less agreement that demonstrators often face undue pressure from authorities (r = –0.14, p = 0.009). These trends indicate a more favorable and less critical view among younger participants regarding protest safety and institutional behavior during civic events. Regarding digital privacy and security, a negative correlation was found between age and government surveillance concerns (r = –0.21, p = 0.000). Younger individuals expressed more concern about gathering personal data, reflecting an increased sensitivity to privacy matters in digital environments within this age group.
When considering perceptions of national-level risks, older students were more likely to agree that climate change represents a security threat to Serbia (r = 0.11, p = 0.028). This observation might indicate generational differences in engagement with environmental issues and the framing of climate change as a national security concern. These findings emphasize that age is a crucial factor influencing youth perspectives on safety, risk, and institutional trust. The thorough, item-level analysis revealed subtle but significant age-related differences that could be overlooked in broader assessments.
Key connections emerged among various items across different themes, deepening our understanding of the links between student perceptions of safety, institutional trust, national threats, and digital security. Students who view demonstrations in Serbia as relatively safe will likely reject the notion that provocateurs escalate violence during protests (r = –0. 26, p = 0. 0.001).
Similarly, a notable negative correlation was observed between perceptions of protest safety and the belief that protesters often face unfounded pressure from authorities (r = –0. 19, p = 0. 010). General feelings of safety at public events were also negatively tied to these more critical views of institutions (r = –0. 22, p = 0. 004), suggesting that students who feel secure at demonstrations are less likely to suspect manipulation or repression by state actors. Privacy concerns were found to fit within broader frameworks of risk awareness.
The statement “I am worried about the government collecting personal data” negatively correlated with age (r = –0. 21, p = 0.000), indicating that younger students demonstrate increased sensitivity towards digital surveillance. Although not explicitly detailed in the matrix, this concern connects with attitudes regarding personal safety and institutional trust, suggesting that perceptions of digital risk are interconnected with a broader view of security. Furthermore, perceptions of national threats were significantly linked to other safety-related beliefs.
The assertion “Climate change can harm the security of Serbia” was positively associated with several views on public safety (r = 0. 11, p = 0.029), suggesting that students who acknowledge environmental dangers also exhibit more significant concern for societal vulnerabilities and long-term security issues. These item-level relationships illustrate that student perceptions extend beyond isolated areas and operate as a network of interconnected beliefs. This holistic perspective highlights the importance of examining specific statements alongside thematic scales, providing a clearer understanding of how young people view risk, safety, and institutional reliability.
Table 11 displays several statistically significant, yet generally weak, correlations between six thematic subsections and the current year of study. Notably, the current year of study negatively correlates with personal safety (r = –0.14, p ≤ 0.01), digital security and privacy (r = –0.16, p ≤ .01), disaster preparedness and crisis response (r = –0.15, p ≤ 0.01), and institutional confidence in security policy (r = –0.17, p ≤ .01). This suggests that students in later years report slightly lower levels of perceived safety, preparedness, and institutional trust compared to their peers in earlier years. Conversely, perceptions of safety at public events and national-level threats do not exhibit significant correlations with the year of study, indicating a relative stability in these perceptions throughout academic progression. These results illuminate how academic maturity may shape perceptions of safety and preparedness, emphasizing the importance of institutional engagement in fostering trust and readiness attitudes (Table 11).
Table 13.
Pearson’s correlation results for the relationship between six thematic subsection variables and the current year of study (n = 406).
Table 13.
Pearson’s correlation results for the relationship between six thematic subsection variables and the current year of study (n = 406).
| Variable | Current year of study | Personal Safety | Safety at public events and demonstrations |
National-level threats | Digital security and privacy | Disaster preparedness and crisis response |
Institutional confidence and trust in security policy |
| Age | 1.00 | ||||||
| Personal Safety | –0.14** | 1.00 | |||||
| Safety at public events and demonstrations | 0.01 | 0.00 | 1.00 | ||||
| National-level threats | 0.04 | 0.03 | 0.28** | 1.00 | |||
| Digital security and privacy | –0.16** | 0.22** | 0.14** | 0.25** | 1.00 | ||
| Disaster preparedness and crisis response | –0.15** | 0.43** | –0.18** | 0.02 | 0.36** | 1.00 | |
| Institutional confidence and trust in security policy | –0.17** | 0.35** | –0.31** | –0.01 | 0.21** | 0.64** | 1.00 |
Note: * p ≤ 0.05; ** p ≤ 0.01.
Table 12 presents the Pearson correlation coefficients investigating the link between students’ average grades and six thematic variables. The results show a significant negative correlation between average grade and digital security and privacy (r = –0.15, p ≤ .05), suggesting that students with better academic performance tend to have slightly lower perceptions of digital security. In contrast, correlations between average grade and other variables—such as personal safety, public safety, national-level threats, disaster preparedness, and institutional trust—were negative but not statistically significant. This indicates that academic performance is primarily unrelated to perceived safety and preparedness in most areas. While academic achievement seems to have a minimal direct impact on perceptions of safety issues, the internal consistency among thematic variables indicates a cohesive pattern of risk perception and institutional involvement.
Table 14.
Pearson’s correlation results for the relationship between six thematic subsections variables and average grade (n = 406).
Table 14.
Pearson’s correlation results for the relationship between six thematic subsections variables and average grade (n = 406).
| Variable | Average grade | Personal Safety | Safety at public events and demonstrations |
National-level threats | Digital security and privacy | Disaster preparedness and crisis response |
Institutional confidence and trust in security policy |
| Age | 1.00 | ||||||
| Personal Safety | 0.00 | 1.00 | |||||
| Safety at public events and demonstrations | –0.07 | 0.00 | 1.00 | ||||
| National-level threats | –0.08 | 0.03 | 0.28** | 1.00 | |||
| Digital security and privacy | –0.15* | 0.22** | 0.14** | 0.25** | 1.00 | ||
| Disaster preparedness and crisis response | –0.10 | 0.43** | –0.18** | 0.02 | 0.36** | 1.00 | |
| Institutional confidence and trust in security policy | –0.04 | 0.36** | –0.32** | –0.01 | 0.22** | 0.64** | 1.00 |
Note: * p ≤ 0.05; ** p ≤ 0.01.
The findings (Table 13) show that household size correlates insignificantly with any of the thematic variables studied. The correlation with personal safety is r = 0.00, with safety at public events and demonstrations r = 0.03, with national-level threats r = 0.01, with digital security and privacy r = 0.06, with disaster preparedness and crisis response r = 0.05, and with institutional confidence and trust in security policy r = –0.01. All coefficients are very low and statistically insignificant, suggesting that the number of household members does not significantly affect students’ perceptions in any of these areas.
Table 15.
Pearson’s correlation results for the relationship between six thematic subsections variables and household size (n = 406).
Table 15.
Pearson’s correlation results for the relationship between six thematic subsections variables and household size (n = 406).
| Variable | Household size | Personal Safety | Safety at public events and demonstrations |
National-level threats | Digital security and privacy | Disaster preparedness and crisis response |
Institutional confidence and trust in security policy |
| Age | 1.00 | ||||||
| Personal Safety | 0.00 | 1.00 | |||||
| Safety at public events and demonstrations | 0.03 | 0.00 | 1.00 | ||||
| National-level threats | 0.01 | 0.03 | 0.28** | 1.00 | |||
| Digital security and privacy | 0.06 | 0.22** | 0.14** | 0.25** | 1.00 | ||
| Disaster preparedness and crisis response | 0.05 | 0.43** | –0.18** | 0.02 | 0.36** | 1.00 | |
| Institutional confidence and trust in security policy | –0.01 | 0.36** | –0.32** | –0.01 | 0.22** | 0.64** | 1.00 |
Note: * p ≤ 0.05; ** p ≤ 0.01.
3.2.3. ANOVA Analysis of Sociodemographic and Informational Determinants of Perceived Security
ANOVA results reveal that the place of study significantly influences students’ views on personal safety (F(2, 365) = 2.87, p = 0.048) and perceptions of national-level threats (F(2, 365) = 2.94, p = 0.044) (Table 16). However, no statistically significant variations were found in other areas—such as safety at public events and demonstrations, digital security and privacy, disaster preparedness, and institutional trust—indicating consistent perceptions across various university locations (p ≥ 0.05).
Descriptive data indicates that students from Niš report the highest average perception of personal safety (M = 3.31), followed by those in Novi Sad (M = 2.95) and Belgrade (M = 2.83). A similar trend is noted for national-level threats: Students in Belgrade perceive the highest threat level (M = 4.10), while those in Novi Sad report the lowest (M = 3.83). These differences correspond with the statistical significance noted and imply that contextual or experiential factors may influence students’ perceptions based on their study location.
In other dimensions, variations are minimal. For example, perceptions regarding safety at public events are generally similar across all three places of study (M ≈ 3.75–3.82), as are evaluations of digital security (M ≈ 3.42–3.78). Disaster preparedness ratings are generally low in all locations, with slightly higher scores from students in Niš. Similarly, trust in institutions is typically low, with the lowest confidence levels found among students in Novi Sad (M = 1.91) and the highest among those in Niš (M = 2.27). Although these differences are not statistically significant, they may hint at nuanced local or regional influences on students’ experiences with public safety and institutional trust.
Further ANOVA results (Table 14) reveal that students’ field of study significantly influences two primary aspects of safety perception: disaster preparedness and crisis response (F(3, 395) = 3.89, p = 0.009), and institutional confidence and trust in security policy (F(3, 395) = 6.24, p < 0.001). Conversely, no statistically significant variations were observed in other dimensions—such as personal safety, safety at public events, national-level threats, and digital security (p ≥ 0.05), indicating that perceptions in these areas remain relatively consistent across academic fields.
Disaster preparedness and crisis response ratings show significant variation between faculties. Students in Natural and Mathematical Sciences indicated the lowest preparedness levels (M = 1.99), whereas Medical Sciences students reported the highest (M = 2.48). Additionally, notable differences emerged regarding perceptions of institutional confidence; students from Natural and Mathematical Sciences had the lowest average (M = 1.62), while those in Medical Sciences had the highest (M = 2.35). These results imply that students' academic backgrounds may shape their views on institutional effectiveness and readiness in safety and crisis management contexts.
Also, ANOVA results (Table 16) indicate that the current level of studies does not have a statistically significant effect on any of the six measured dimensions of safety perception. Specifically, there were no significant differences in personal safety perception (F(2, 396) = 1.00, p = .367), safety at public events and demonstrations (F(2, 396) = 2.61, p = 0.075), national-level threats (F(2, 396) = 0.44, p = 0.647), digital security and privacy (F(2, 396) = 1.98, p = 0.139), disaster preparedness and crisis response (F(2, 396) = 1.05, p = 0.352), or institutional confidence (F(2, 396) = 0.60, p = 0.550). Levene's test for homogeneity of variances confirmed that the assumption of equal variances was met for all variables (p ≥ 0.05).
Although the differences are not statistically significant, descriptive results show some mean-value variation. For example, Master’s students reported the highest average personal safety perception (M = 2.97), followed by Doctoral students (M = 2.94) and Undergraduate students (M = 2.85). Also, a similar trend is visible in the safety domain at public events, where both Undergraduate and Master’s students rated their perception similarly (M ≈ 3.77 and M ≈ 3.78). In contrast, Doctoral students reported slightly lower perceptions (M = 3.43).
In the area of national-level threats, all groups demonstrated relatively high levels of concern, with only slight variation between Undergraduate (M = 4.09), Master’s (M = 4.09), and Doctoral students (M = 3.93). For digital security, Undergraduate students expressed the highest concern (M = 3.45), while both Master’s (M = 3.28) and Doctoral (M = 3.32) students rated this dimension slightly lower.
Finally, the ANOVA results (Table 17) indicated statistically significant differences in students’ perceptions of two safety dimensions related to their family material status: safety at public events and demonstrations (F(3, 395) = 3.39, p = 0.018) and confidence in institutional security policy (F(3, 395) = 2.71, p = 0.045). No significant differences were found for other dimensions—personal safety, national threats, digital security, and disaster preparedness (p ≥ 0.05). The homogeneity of variances assumption was met in all cases, as confirmed by Levene's test (p ≥ 0.05).
Descriptive statistics revealed that students from families with below-average income (500–1000 EUR) had the highest average perception of safety at public events (M = 4.12), while those from significantly below-average income households reported the lowest scores (M = 3.66). Notably, students from average-income families (1001–2000 EUR) had the highest average scores across most variables. Regarding institutional confidence, students from above-average income families expressed the highest levels of trust (M = 2.14), while those from significantly below-average households showed the lowest trust (M = 1.84), which aligns with the statistically significant findings.
Although no significant differences were seen in personal safety (F = 0.54, p = 0.654), national threats (F = 0.70, p = 0.550), digital security (F = 0.20, p = 0.893), or disaster preparedness (F = 1.08, p = 0.355), notable trends in mean values were observed. For instance, perceived disaster preparedness increased slightly with higher income levels (M = 2.20 in the lowest income group vs. M = 2.36 in the highest).
ANOVA results in table 15 show that the source of information on safety topics significantly influences students’ perceptions across three main areas: digital security and privacy (F(4, 393) = 4.07, p = 0.003), disaster preparedness and crisis response (F(4, 393) = 8.41, p < 0.001), and institutional confidence and trust in security policy (F(4, 393) = 7.34, p < 0.001). In contrast, no statistically significant differences were found among groups regarding personal safety, safety at public events, and national threats (p ≥ 0.05). Levene’s test revealed violations of homogeneity of variance for disaster preparedness and institutional confidence (p < 0.01), suggesting the use of Welch's robust test of equality of means for further verification.
Descriptive statistics indicate that students relying on television and official institutions or press releases as primary information sources report the highest levels of digital security awareness, with averages of 3.51 and 3.61, respectively. In comparison, those who depend on discussions with family and friends have the lowest average (M = 3.29). Regarding disaster preparedness, students were informed through television, and official sources again reported greater perceived preparedness (M = 2.54 and M = 2.49). At the same time, those receiving information via online media and family/friends show lower preparedness levels (M ≈ 2.15).
Significant differences in institutional confidence were also noted, with students informed by television expressing the highest trust in institutions (M = 2.21), while those relying on family and friends reported the lowest trust (M = 1.78). These findings suggest that more formal or traditional information sources, such as television and official statements, correlate with increased confidence in institutional safety measures and personal preparedness. In contrast, informal or interpersonal channels are associated with lower trust and awareness levels.
Further, ANOVA results indicate that the frequency of engagement with safety-related news significantly affects students’ perception of personal safety (F(3, 394) = 2.95, p = 0.033). In contrast, no significant differences were observed in other areas, including safety at public events and demonstrations, national-level threats, digital security, disaster preparedness, and institutional confidence (p ≥ 0.05). Levene’s test confirmed that the homogeneity of variances assumption held across all dimensions (p ≥ 0.05).
Descriptive analysis shows that students who follow safety news daily and several times a week report the highest perceptions of personal safety, with mean scores of 2.92 and 2.98, respectively. Conversely, students who engage with safety news rarely or never (group 4) report the lowest personal safety perception (M = 2.77). Although this difference is modest, it is statistically significant, suggesting that regular exposure to safety-related content may enhance students’ awareness and sense of personal security.
The mean differences between groups were minimal and statistically insignificant for other domains, like safety at public events, national threats, and digital security. For instance, all groups expressed similar concerns regarding national threats (M ≈ 4.00–4.13), while digital security scores ranged narrowly between M = 3.36 and M = 3.48. This consistency was also noted in disaster preparedness and institutional confidence, where average scores displayed only slight variations, and no significant trends were identified.
The ANOVA results reveal a statistically significant link between voting frequency and two aspects of safety perception: personal safety (F(4, 393) = 2.42, p = 0.048) and trust in institutional security policies (F(4, 393) = 2.65, p = 0.033). Although disaster preparedness showed differences (p = 0.060) that are close to statistical significance, other areas- such as safety at public events, national-level threats, and digital security- display no significant variation among voting frequency groups (p > 0.05). Levene’s test upholds the assumption of homogeneity of variances, except for digital security (p = 0.007) and institutional confidence (p < 0.01), indicating that Welch’s test should be utilised as a robustness check for these variables.
Descriptive statistics reveal interesting trends. Students who have never voted report the lowest level of perceived personal safety (M = 2.66), while those who voted in all elections or voted and abstained equally report the highest levels (M ≈ 2.95). Similarly, institutional trust is lowest among those who voted only once (M = 1.78) and highest among those who voted and abstained equally often (M = 2.31), which may reflect a nuanced relationship between political engagement and confidence in public institutions.
Other safety dimensions exhibit relatively small or inconsistent differences between groups. For instance, perceptions of national-level threats remain consistently high across all voting categories (M ≈ 4.00–4.19), with no statistically significant variation (p = 0.396). Similarly, perceptions of digital security and disaster preparedness show modest group differences, but these do not reach statistical significance. However, the mean for digital security is notably highest among those relying on official participation with mixed abstention (M = 3.63), while the lowest appears in the limited participation group (M = 3.41).
3.3. Predictors of Perceived Personal Safety: Regression Model Analysis
To examine how various socio-demographic, educational, and behavioral factors affect safety perception, we conducted a multivariate linear regression analysis across six thematic areas: personal safety, safety at public events and demonstrations, threats at the national level, digital security and privacy, disaster preparedness and crisis response, and confidence in institutional security policies (Table 18). The model included a consistent set of independent variables across all aspects, such as gender, age, place of study, study year, institution type, field of science, current educational level, average academic performance, number of household members, family’s material status, engagement in safety-related activities, sources of safety information, frequency of following safety news, and voting behavior. The findings for each area are detailed in Table 18. The analysis confirmed that the assumptions of normal distribution, linearity, multicollinearity, and homogeneity of variance were satisfied, which are crucial for this analytical approach. This thorough verification significantly bolsters the reliability of the study's findings and improves the credibility of the statistical methods employed.
The multivariate regression analysis on students' perceptions of personal safety showed no statistical significance (R² = 0.045, Adj. R² = 0.016, F(12, 392) = 1.55, p = 0.103), suggesting that the predictors account for only 1.6% of the variance in perceived safety. Gender emerged as the only statistically significant predictor (β = 0.113, t = 2.23, p = 0.027), suggesting that gender disparities account for roughly 1.3% of the variance in personal safety perception (calculated as β² = 0.113² ≈ 0.013). The direction of this effect implies that male feels slightly safer than females.
Other factors, such as age, study location, study year, institution type, field of science, current educational level, average grades, number of household members, family’s financial status, involvement in safety-related activities, information sources on safety, and how often one follows safety news, did not display statistically significant effects on perceptions of personal safety. Although factors such as information sources and frequency of following safety news approached statistical significance, their overall influence on the model was limited, with very small individual contributions to the explained variance (β² ≈ 0.005–0.006). Collinearity diagnostics confirmed that multicollinearity was not an issue, with VIF values under 1.2 for all predictors and tolerance values above 0.8, ensuring stable regression estimates.
Overall, these results indicate that while gender slightly influences students' perceptions of personal safety, most of the variance remains unexplained. This suggests that further psychological, experiential, or environmental factors—such as previous exposure to risks, personal trauma, or campus security conditions—may be more relevant predictors of personal safety perception.
Additionally, a multiple linear regression analysis was performed to assess how socio-demographic, educational, and behavioral factors influence perceptions of safety at public events and demonstrations. The overall model was not statistically significant (R² = 0.031, Adj. R² = 0.001, F(12, 392) = 1.05, p = 0.404). This indicates that it explains only 0.1% of the variance in perceived safety at public events.
Among all predictors, only the family's financial status had a statistically significant negative impact on perceived safety (β = −0.107, p = 0.040), implying that students from lower-income backgrounds may view public spaces as less safe. This variable alone accounted for approximately 1.1% of the variance in the dependent variable (based on squared semi-partial correlation).
Other predictors—including gender, age, educational institution, year of study, institution type, field of science, current education level, average grades, number of household members, previous engagement in safety activities, information sources, and frequency of following safety news—did not reveal statistically significant links with the dependent variable. These results suggest that background characteristics, aside from economic status, do not significantly affect students’ perceptions of safety in public spaces.
A multiple regression analysis (Table 16) investigated whether various socio-demographic, academic, and behavioral factors could predict students’ perceptions of national-level threats. The overall model was not statistically significant (R² = 0.029, Adj. R² = −0.001, F(12, 392) = 0.98, p = 0.468) and accounted for less than 3% of the variance in perceived threats at the national level. This indicates that the predictive power of the included variables regarding this outcome is very weak.
Other variables—such as age, type of institution, field of study, level of study, academic performance, household size, financial status, engagement in safety activities, and media exposure—did not significantly contribute to the model. These results imply that students' perceptions of national-level threats are likely shaped by factors beyond the socio-demographic and behavioral variables considered in this model, potentially including psychological, cultural, or contextual influences.
Also, a multiple linear regression analysis was conducted to examine the relationship between various predictors and participants’ perceptions of digital security and privacy. The model was statistically significant (R² = 0.063, Adj. R² = 0.034, F(12, 392) = 2.19, p = 0.011), explaining only 3% of the variance in perceptions of digital security. This suggests that the selected independent variables have limited explanatory power in this context. None of the individual predictors reached statistical significance at the p ≤ 0.05 level.
Additional analyses revealed that the most significant predictor of attitudes toward digital security and privacy was prior participation in safety-related activities (β = −0.143, t = −2.754, p = 0.006). This variable independently explained approximately 1.8% of the variance in the dependent variable (β² = 0.020). Respondents who had been involved in safety initiatives tended to express slightly lower perceptions of digital security.
Other variables, such as gender, age, place of study, type of institution, field of science, level of studies, academic performance, household size, financial status, sources of safety information, and frequency of following safety news, did not demonstrate statistically significant effects. Although information sources (p = 0.073) and number of household members (p = 0.108) approached significance, their contributions remained limited.
Figure 9.
The predictors of the multidimensional security perceptions among youth in Serbia.
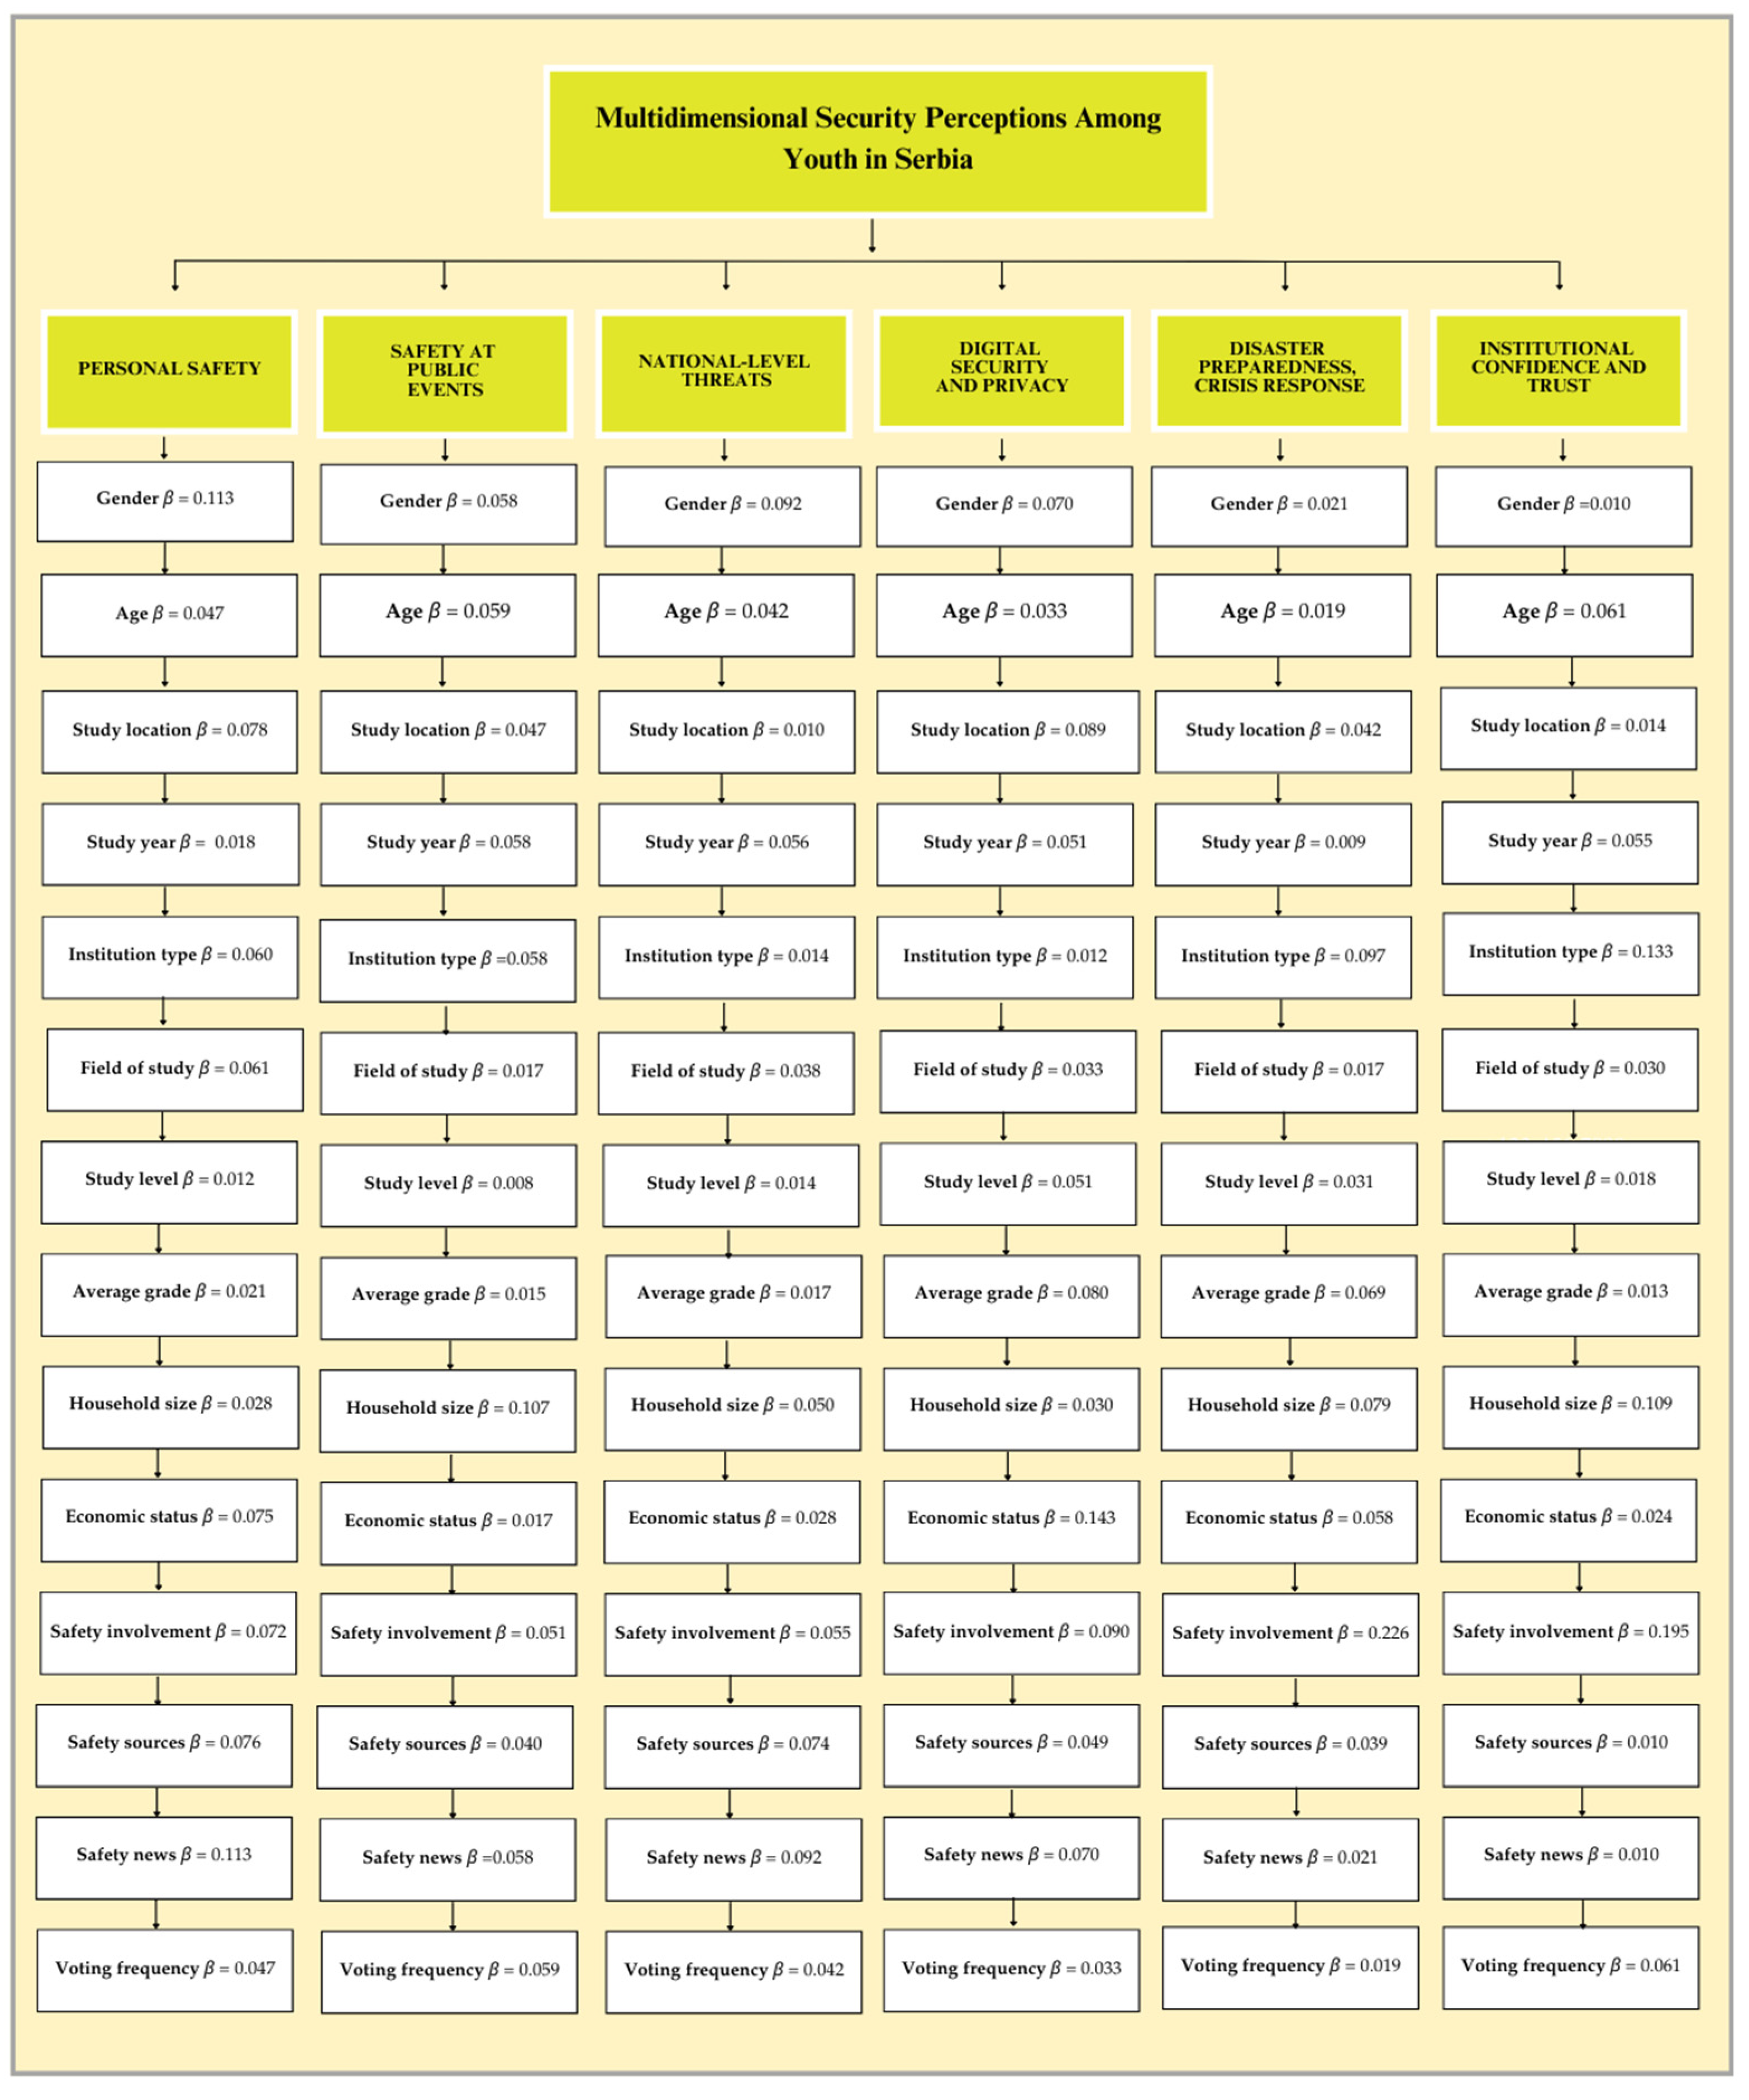
Further analyses indicated that reliance on safety-related information sources was the primary predictor of perceived disaster preparedness and crisis response, demonstrating a statistically significant positive impact (β = 0.226, t = 4.60, p < 0.001). This variable alone accounted for approximately 5.1% of the variation in the outcome (β² = 0.051), suggesting that those who consistently utilise diverse safety information sources feel more equipped for emergencies. Although the field of study (science/non-science) approached significance (p = 0.061), its effect was limited (β = 0.097). Other factors, such as gender, age, study location, type of institution, educational level, academic performance, household size, financial situation, past participation in safety activities, and frequency of engaging with safety-related news, did not significantly influence perceptions of disaster preparedness.
The overall regression model was statistically significant, explaining a modest portion of the variance in the dependent variable (R² = 0.086, Adj. R² = 0.058, F(12, 392) = 3.072, p < 0.001), indicating that these predictors collectively account for approximately 8.6% of the variation in perceived disaster preparedness.
Finally, further analyses (Table 16) revealed that the most significant predictor of institutional confidence and trust in security was the use of safety-related information sources (β = 0.195, t = 3.94, p <0.001), accounting for approximately 3.8% of the variance in the outcome (β² = 0.038). Furthermore, students from scientific fields also expressed significantly higher levels of institutional confidence (β = 0.133, t = 2.55, p = 0.011), contributing an additional 1.8% to the explained variance (β² = 0.018).
Perceived financial status showed a statistically significant negative association with institutional confidence (β = –0.109, t = –2.16, p = 0.031), indicating that students who perceive their families as being in worse financial positions tend to have lower trust in institutions. This predictor accounted for about 1.2% of the variance (β² = 0.012). The overall model was statistically significant (R² = 0.079, Adj. R² = 0.051, F(12, 392) = 2.79, p = 0.001), explaining approximately 7.9% of the variance in perceptions of institutional trust.
Other predictors, such as gender, age, place of study, study level, academic performance, number of household members, previous involvement in safety activities, and frequency of following safety news, did not show statistically significant effects in this model.
4. Discussion
The findings from this study offer valuable insight into how young people in Serbia perceive personal safety, institutional trust, and preparedness in the face of various contemporary threats. The descriptive results point to an apparent dichotomy in how safety is experienced and understood: while youth largely feel safe in private or familiar settings, they exhibit concern regarding broader social cohesion, systemic protection, and their ability to rely on institutions in times of crisis.
Perceptions of personal safety were generally moderate, with high agreement on feelings of safety at home and significant concern over crime. Notably, young people expressed discomfort when navigating public spaces, particularly when alone or in poorly lit areas, and identified the lack of community readiness to act in dangerous situations as a critical gap in their local environments. These insights suggest that while infrastructural or physical safety may be present, emotional and social security is perceived as fragile. A potential explanation for this may lie in past personal experiences, prevailing media narratives, or broader societal anxiety about crime, particularly in urban areas [140,141,163,182,183,184,185,186,187,188].
The domain of public events and demonstrations revealed strong civic awareness and willingness to engage, with high support for protest participation and demands for greater youth involvement in political life. However, these findings were tempered by widespread skepticism about media objectivity and concerns over how state authorities manage civil gatherings. This combination of engagement and distrust implies a population eager to participate but wary of institutional integrity. One possible explanation could be the historical legacy of protest suppression or media bias, which may influence perceptions even when direct experiences are limited [141,163,182,186,187,188].
Regarding national-level threats, youth showed high awareness of systemic risks—especially organized crime, disinformation, and energy dependence—highlighting their attentiveness to both internal vulnerabilities and global influences. Interestingly, terrorism and pandemics were rated as comparatively less severe, potentially reflecting shifts in perceived urgency or exposure. The environmental risk of climate change was recognized, particularly by older students, indicating emerging generational concern. Recent events could shape these perceptions, such as pandemic fatigue, the ongoing war in Ukraine, and increasing exposure to discussions on environmental sustainability in academic and digital spaces [189,190,191,192,193].
Regarding digital security and privacy, the youth's responses reflected both acceptance and anxiety. While they support surveillance technologies for crime prevention, they express limited trust in the state’s ability to safeguard their data. This paradox suggests that while safety is prioritized, it is not perceived as being guaranteed by existing digital or legal protections [194,195,196,197]. The lowest agreement levels were found for perceptions of personal control over data and confidence in Serbian data protection laws. This ambivalence may be rooted in global privacy scandals, inadequate national legislation, or the increasing pervasiveness of surveillance technologies in daily life [198,199,200,201].
The findings related to disaster preparedness and institutional responsiveness highlight a pervasive sense of vulnerability. Although young people recognize the seriousness of natural hazards and disasters, they lack confidence in governmental readiness, the role of educational institutions, and media reliability in crisis contexts. This aligns with earlier studies in this area [59,62,64,76,109,110,130,164]. The low mean scores in this domain reflect critical weaknesses in crisis communication and public education, suggesting urgent reform. This lack of confidence may stem from limited exposure to safety drills, absence of crisis training in curricula, or perceived inefficiencies in past governmental responses to emergencies [59,64,109,130].
Institutional confidence and trust in security policy were the most negatively rated dimensions overall. Students largely rejected the idea that institutions act transparently, allocate security resources properly, or effectively protect civil rights, which is consistent with previous research [202,203,204,205,206]. However, military and police institutions were rated somewhat more positively than judicial and administrative structures, hinting at a differentiated, experience-based trust framework. This may reflect everyday encounters with specific sectors of the security apparatus and varying public narratives surrounding different institutions [157,158,162,207,208].
Inferential statistics provided additional context. T-tests confirmed gender differences, particularly in perceptions of personal safety, where male respondents consistently reported higher levels of safety. No significant differences were found by type of institution, nor in most dimensions by participation in safety-related activities—except for digital security, where those not engaged in such activities reported feeling more secure. This may indicate that those involved are more aware of potential risks and, thus, more critical [209,210]. Alternatively, it may suggest a false sense of security among those less exposed to safety education or risk analysis [211,212].
Correlational analyses revealed modest but essential associations. Age and year of study negatively correlated with personal safety, preparedness, and institutional trust—implying that with time and experience, perceptions tend to become more skeptical [213]. Furthermore, disaster preparedness and institutional trust were strongly and positively correlated, suggesting that confidence in institutions is tied to the belief that they can manage crises effectively. This relationship may also reflect broader trust in governance and national identity.
Similar patterns emerge when comparing these findings to prior research. Studies in other post-socialist contexts have also highlighted low institutional trust among youth and high sensitivity to national-level threats [156,158,160,208,213]. For example, regional studies have shown that young people frequently cite organized crime, disinformation, and environmental degradation as dominant concerns, aligning closely with this study’s results [60,158,178,179,181,204,208]. Likewise, global findings have identified digital insecurity and fear of surveillance as growing sources of unease among younger generations.
Moreover, skepticism toward media and authority during public demonstrations appears consistent in international literature, especially in societies experiencing political polarisation or limited press freedom. In line with this, Serbian youth demonstrate both a desire for participation and a cautious stance toward institutional narratives. The notable lack of perceived crisis readiness and trust in educational institutions is also consistent with broader European findings indicating gaps in public risk communication and emergency training for young populations[134,135,208,214,215].
Regression analyses identified few significant predictors of perceived safety. Gender emerged as a consistent, albeit weak, predictor of personal safety. Financial status also influenced perceptions of safety in public events and institutional trust. Significantly, sources of safety-related information and voting frequency were associated with greater feelings of preparedness and institutional trust, underscoring the potential impact of media exposure and civic engagement on perceptions. Despite these findings, the models' overall explanatory power was low, indicating that many of the underlying drivers of perceived safety lie outside the scope of the analyzed variables. This points to the relevance of psychological, experiential, and possibly cultural factors that may play a more significant role in shaping security perceptions among youth [5,6,8,26].
Several limitations should be acknowledged when interpreting this study's findings. First, the data were collected through self-reported questionnaires, which may introduce subjectivity due to memory recall issues or participants' tendency to provide socially desirable responses. Furthermore, the sampling method was non-random, relying on voluntary participation and availability, which restricts the generalizability of the results to the broader youth population in Serbia.
Although efforts were made to include respondents from various regions, the sample may not fully capture the diversity of cultural, regional, or institutional factors that influence perceptions of safety. The study was also conducted within a limited time frame, meaning it does not account for shifts in public attitudes that might occur following significant security events, emergencies, or awareness campaigns in the media.
Lastly, the exclusive use of quantitative methods limits the depth of insight into the underlying motivations and dynamics behind the reported attitudes and behaviors. Future research would benefit from incorporating qualitative approaches—such as interviews or focus groups—to enrich the findings and provide a more comprehensive understanding.
5. Conclusions
This study offers a thorough and nuanced view of how youth in Serbia perceive personal safety. Utilizing both descriptive and inferential statistical methods, the research highlights key aspects of perceived safety and examines the impact of socio-demographic, educational, and behavioral factors on these perceptions.
Descriptive analyses indicate that although youth generally feel safe in their immediate environments, particularly at home, they harbor significant concerns about crime, inadequate community support during emergencies, and a lack of trust in institutional responses. There is notable civic engagement and a willingness to join social movements, accompanied by skepticism towards media coverage and the management of protests by institutions. Additionally, young people display a heightened awareness of national threats, such as organized crime, misinformation, and energy dependence, showcasing a sophisticated understanding of both established and emerging risks.
Concerns related to digital security and privacy are pronounced. While many express support for surveillance technologies aimed at crime prevention, there is widespread skepticism regarding the effectiveness of data protection laws and personal control over digital information. Youth also report low confidence in institutional crisis management and communication efforts, identifying insufficient education, unreliable media, and doubts about the preparedness of public services and educational institutions.
Trust in institutions and security policies remains notably low. Although political stability is seen as critical for national security, transparency, judicial efficacy, and citizen involvement in security governance receive poor ratings. Trust is slightly higher towards the military and police, yet overall perceptions convey disenchantment with institutional performance.
Inferential statistical analyses provide further insights into these trends. Gender differences are particularly significant in the realm of personal safety, with males reporting much higher safety perceptions. However, there are no substantial differences across most dimensions based on university type, participation in safety-related activities, or academic performance—except in digital security, where those not engaged in safety activities feel more secure.
Correlational analysis indicates that age and academic progress are negatively correlated with perceptions of safety, preparedness, and trust in institutions, suggesting increased skepticism with experience. Strong positive links between disaster preparedness and institutional trust highlight the relationship between these elements.
Regression analyses identify few significant predictors. Gender and financial status emerge as weak yet notable predictors of perceived safety and trust, while sources of information and civic engagement (e.g., voting) exert some influence on preparedness and confidence in institutions. Overall, the predictive capacity of the models is limited, with much variance in perceptions remaining unexplained.
Regarding the initial hypotheses, only partial support was found. The hypothesis positing that gender significantly influences perceptions of personal safety was upheld. Likewise, the notion that socioeconomic status (i.e., material conditions) impacts perceptions of public event safety and institutional trust also received support. However, the hypotheses related to the broader impacts of academic characteristics, participation in safety-related activities, and media consumption were not consistently validated across all areas, leading to a conclusion of partial confirmation by the findings.
Together, these results imply that youth perceptions of safety are influenced more by dynamic interactions among individual experiences, information contexts, and institutional trust than by static demographic traits. Future research should delve deeper into psychological, contextual, and experiential factors to foster a more comprehensive understanding of how youth perceive and navigate security in an increasingly complicated world.
Author Contributions
V.M.C. conceived the original idea for this study and, in collaboration with M.L. and R.R., developed the study design and questionnaire. V.M.C., M.L., R.R. and S.S. also disseminated the questionnaire, while V.M.C. analyzed and interpreted the data. M.L., R.R., S.S. and Z.R. contributed significantly by drafting the introduction, and V.M.C. and M.L. drafted the discussion. The conclusions were composed by V.M.C., S.S., Z.R., and M.L. All authors critically reviewed the data analysis and contributed to revising and finalizing the manuscript.
Funding
This research was funded by the Scientific–Professional Society for Disaster Risk Management, Belgrade (https://upravljanje-rizicima.com/, accessed on 17 February 2025) and the International Institute for Disaster Research (https://idr.edu.rs/, accessed on 17 February 2025), Belgrade, Serbia.
Institutional Review Board Statement
The study was conducted according to the guidelines of the Declaration of Helsinki and approved by the Institutional Review Board of the Scientific–Professional Society for Disaster Risk Management and the International Institute for Disaster Research (protocol code 002/2025, 15 February 2025).
Informed Consent Statement
Informed consent was obtained from all subjects involved in the study.
Data Availability Statement
Data are contained within the article.
Acknowledgements
The authors acknowledge the use of Grammarly Premium and ChatGPT 4.0 in translating and improving the clarity and quality of the English language in this manuscript. The AI tools were used to assist in language enhancement but were not involved in developing the scientific content. The authors take full responsibility for the manuscript's originality, validity, and integrity.
Conflicts of Interest
The authors declare no conflicts of interest.
Appendix A
Survey questionnaire − Multidimensional security perceptions among youth in Serbia
- Dear Participant,
Personal safety, emergency situations, security at public events and demonstrations, corruption, digital security, and trust in the work of public institutions – how safe do you really feel in your environment? Do you trust institutions to protect you? How do you cope in crisis situations, and to what extent do you feel the consequences of corruption?
This questionnaire explores the perceptions of young people in Serbia regarding key security topics—from emergency situations and personal safety to trust in institutions, experiences with demonstrations, digital privacy, corruption, and national threats. Your opinion is valuable, as the results of this research can contribute to a better understanding of the challenges young people face and potential changes in the security field.
Why is it important to participate?
- Your voice can contribute to improving the security system and protecting the rights of young people in Serbia.
- Understanding security risks allows for better protection measures in emergency situations.
- We will gain a more realistic picture of how safe young people really are – on the street, in the digital space, at public events, and during emergencies.
- The research helps identify problems and propose solutions that can enhance your safety.
What should you know about the questionnaire?
- It is anonymous – your answers will be used solely for research purposes.
- It does not require much time – completing the questionnaire takes 10–15 minutes.
- It includes different types of questions—some are open-ended, while others ask you to rate statements on a scale from 1 to 5 (1—strongly disagree, 5—strongly agree).
Your opinion matters!
We invite you to participate in this research, help us better understand the challenges, and improve safety conditions for young people in Serbia. Your voice can make a difference!
I. GENERAL INFORMATION
- Please fill out the following basic information. The data are anonymous and will be used solely for research purposes.
- Gender:
- ☐ Male
- ☐ Female
- ☐ Other / Prefer not to say
- Age:
- _______________ (enter your age, e.g., 23)
- Place of study:
- ☐ Belgrade
- ☐ Novi Sad
- ☐ Niš
- ☐ Kragujevac
- ☐ Other city (please specify): ______________
- Type of institution you are attending:
- ☐ Public
- ☐ Private
- Your faculty belongs to the following field of science:
- ☐ Technical-technological sciences
- ☐ Natural and mathematical sciences
- ☐ Medical sciences
- ☐ Social and humanistic sciences
- Current level of studies:
- ☐ Professional studies
- ☐ Undergraduate academic studies
- ☐ Specialist studies
- ☐ Master’s academic studies
- ☐ Doctoral studies
- Current year of study:
- _______________ (enter the year of study, e.g., 2)
- Your average grade during studies:
- _______________ (enter your average grade, e.g., 7.85)
- Name of the place where your family lives:
- _______________ (enter the name of the place)
- Number of household members:
- _______________ (enter the number of members)
- How would you assess your family's material status compared to the average standard of living in the Republic of Serbia?
- ☐ Significantly below average (monthly family income is less than 50,000 RSD; we face financial difficulties, and basic needs are hard to meet)
- ☐ Below average (monthly family income is between 50,000 – 100,000 RSD; we can meet basic needs but have limited resources for additional expenses)
- ☐ Average (monthly family income is between 100,000 – 200,000 RSD; we can afford basic needs and occasional additional expenses)
- ☐ Above average (monthly family income is between 200,000 – 400,000 RSD; we have stable income and can afford a comfortable life)
- ☐ Significantly above average (monthly family income is more than 400,000 RSD; we have a high standard of living and financial security)
- Have you ever participated in activities related to safety before the beginning of student protests/blockades?
- (e.g., volunteer work in civil protection, disaster preparedness training, participation in protests, etc.)?
- ☐ Yes
- ☐ No
- How often did you follow news and information related to safety before the beginning of student protests/blockades?
- ☐ Daily
- ☐ Several times a week
- ☐ Occasionally
- ☐ Rarely or never
- What are your main sources of information on safety topics? (multiple answers possible)
- ☐ Television
- ☐ Online portals and social media
- ☐ Newspapers and magazines
- ☐ Official institutions and press releases
- ☐ Conversations with family and friends
- Since gaining the right to vote, how many times have you voted?
- ☐ I voted in all elections since obtaining the right to vote
- ☐ I voted more often than I skipped elections
- ☐ I voted less often than I skipped elections
- ☐ I voted only once
- ☐ I have not voted yet
- How would you assess the level of corruption today compared to 10 years ago?
- (1 indicates no significant change, 5 indicates that corruption has significantly decreased)
- 1 ☐ Corruption is at the same level as 10 years ago
- 2 ☐ Corruption is only slightly lower than 10 years ago
- 3 ☐ Corruption is somewhat lower than 10 years ago
- 4 ☐ Corruption is significantly lower than 10 years ago
- 5 ☐ Corruption is much lower than 10 years ago
- II. ATTITUDES
2.1. Perceptions of Personal Safety
- Please indicate your level of agreement with the following statements using a Likert scale from 1 (Strongly disagree) to 5 (Strongly agree).
| Attitudes | 1 | 2 | 3 | 4 | 5 |
| I feel safe in my place of residence | |||||
| The level of crime in my area is high | |||||
| The police in my area respond to incidents effectively | |||||
| I avoid certain parts of the city due to feeling unsafe | |||||
| I feel safe walking alone at night | |||||
| I believe that street lighting and surveillance cameras have increased safety | |||||
| I feel safe using public transportation | |||||
| I believe the streets in my area are safe for cyclists and pedestrians | |||||
| People in my community are willing to help in dangerous situations | |||||
| Fear of crime affects my daily life |
2.2. Perceptions of Safety at Public Events and Demonstrations
- Please indicate your level of agreement with the following statements using a Likert scale from 1 (Strongly disagree) to 5 (Strongly agree).
| Attitudes | 1 | 2 | 3 | 4 | 5 |
| Demonstrations in Serbia are generally safe for participants | |||||
| The police use excessive force when securing protests | |||||
| Protests are an effective way of expressing civic dissatisfaction | |||||
| The presence of provocateurs often contributes to the escalation of violence during protests | |||||
| I am interested in participating in demonstrations if they advocate for critical social changes | |||||
| I believe that protests are often politically instrumentalized | |||||
| The media report objectively on demonstrations | |||||
| Protesters are often subjected to unfounded pressure by the authorities | |||||
| Citizens should participate in protests more frequently | |||||
| I believe that young people should be more active in socio-political life |
2.3. Perceptions of National-Level Threats
- Please indicate your level of agreement with the following statements using a Likert scale from 1 (Strongly disagree) to 5 (Strongly agree).
| Attitudes | 1 | 2 | 3 | 4 | 5 |
| Cyberattacks are a serious threat to Serbia’s security | |||||
| Terrorism poses a significant threat to our country | |||||
| Climate change can negatively affect the security of Serbia | |||||
| Global economic instability impacts our national security | |||||
| The spread of disinformation poses a risk to social stability | |||||
| Migration can present a security challenge for Serbia | |||||
| I believe that pandemics are a serious threat to national security | |||||
| Energy dependence on other countries jeopardizes our security | |||||
| Political instability in neighboring countries can affect our security | |||||
| Organized crime represents a serious threat to Serbia |
2.4. Perceptions of Digital Security and Privacy
- Please indicate your level of agreement with the following statements using a Likert scale from 1 (Strongly disagree) to 5 (Strongly agree).
| Attitudes | 1 | 2 | 3 | 4 | 5 |
| I am concerned about the collection of personal data by the government. | |||||
| I believe that surveillance through public space cameras is justified for safety reasons. | |||||
| I feel uncomfortable with companies tracking online activities. | |||||
| I believe it is necessary to strike a balance between privacy and national security. | |||||
| I support the use of biometric data for identification purposes in the interest of security. | |||||
| I believe my personal data is protected online. | |||||
| I am concerned about the potential misuse of my data by third parties. | |||||
| I support the use of surveillance technologies in the fight against crime. | |||||
| I feel that I have control over who has access to my personal information. | |||||
| I believe that data protection laws in Serbia are adequate. |
2.5. Perceptions of Disaster preparedness and Crisis Response
- Please indicate your level of agreement with the following statements using a Likert scale from 1 (Strongly disagree) to 5 (Strongly agree).
| Attitudes | 1 | 2 | 3 | 4 | 5 |
| I believe that Serbia is adequately prepared for emergencies | |||||
| I trust the civil protection system in Serbia | |||||
| I know how to respond in the event of a natural disaster | |||||
| I believe that the media are a reliable source of information during crises | |||||
| Public services respond quickly in emergency situations | |||||
| Emergencies such as floods and earthquakes pose a serious risk in Serbia | |||||
| Citizens are sufficiently educated about how to act in crisis situations | |||||
| The disaster early warning system in Serbia is effective | |||||
| I believe that schools and universities are adequately prepared for crisis situations | |||||
| I believe that data protection laws in Serbia are adequate |
2.6. Perceptions of Institutional Confidence and Trust in Security Policy
- Please indicate your level of agreement with the following statements using a Likert scale from 1 (Strongly disagree) to 5 (Strongly agree).
| Attitudes | 1 | 2 | 3 | 4 | 5 |
| I trust the work of the police when it comes to protecting citizens | |||||
| The judiciary in Serbia effectively punishes criminals | |||||
| I believe that institutions protect the rights of citizens | |||||
| The government adopts adequate measures to preserve national security | |||||
| Transparency in the work of state institutions is at a high level | |||||
| I believe the state allocates resources for national security properly | |||||
| Political stability directly affects the level of security in the country | |||||
| Serbia’s military power adequately protects its citizens | |||||
| Citizens are sufficiently involved in the creation of security policies | |||||
| The media report objectively on security issues |
References
- Qazi, A.; Akhtar, P. Risk matrix driven supply chain risk management: Adapting risk matrix based tools to modelling interdependent risks and risk appetite. Comput. Ind. Eng. 2020, 139, 105351. [CrossRef]
- Aven, T.; Zio, E. Globalization and global risk: How risk analysis needs to be enhanced to be effective in confronting current threats. Reliability Engineering & System Safety 2020, 205, 107270-107270. [CrossRef]
- Haimes, Y. Risk Modeling of Interdependent Complex Systems of Systems: Theory and Practice. Risk Analysis 2018, 38. [CrossRef]
- Cavallo, A.; Ireland, V. Preparing for complex interdependent risks: a system of systems approach to building disaster resilience. International journal of disaster risk reduction 2014, 9, 181-193. [CrossRef]
- Harris, A.; Johns, A. Youth, social cohesion and digital life: From risk and resilience to a global digital citizenship approach. Journal of Sociology 2020, 57, 394-411. [CrossRef]
- Graham, L.; Jordan, L.; Hutchinson, A.; De Wet, N. Risky behaviour: a new framework for understanding why young people take risks. Journal of Youth Studies 2018, 21, 324-339. [CrossRef]
- Fabiansson, C. Young People’s Perception Of Being Safe – Globally & Locally. Social Indicators Research 2007, 80, 31-49. [CrossRef]
- Kelly, P. The dangerousness of youth-at-risk: the possibilities of surveillance and intervention in uncertain times. Journal of adolescence 2000, 23 4, 463-476. [CrossRef]
- Manwaring, R.; Holloway, J. Resilience to cyber-enabled foreign interference: citizen understanding and threat perceptions. Defence Studies 2022, 23, 334-357. [CrossRef]
- Yuan, S.; Maliki, N.Z.B.; Cui, H. Public Perceptions of Resilient Design Characteristics in Urban Form. Sustainability 2025. [CrossRef]
- Gaudenzi, B.; Baldi, B. Cyber resilience in organisations and supply chains: from perceptions to actions. The International Journal of Logistics Management 2024. [CrossRef]
- He, Q.; Xu, P.; Wang, H.; Wang, S.; Yang, L.; Ba, Z.; Huang, H. The mediating role of resilience between perceived social support and sense of security in medical staff following the COVID-19 pandemic: A cross-sectional study. Frontiers in Psychiatry 2023, 14. [CrossRef]
- Grove, K. Security beyond resilience. Environment and Planning D: Society and Space 2017, 35, 184-194. [CrossRef]
- Kaufmann, M. Exercising emergencies: Resilience, affect and acting out security. Security Dialogue 2016, 47, 116-199. [CrossRef]
- Cox, A.; Prager, F.; Rose, A. Transportation security and the role of resilience: A foundation for operational metrics. Transport Policy 2011, 18, 307-317. [CrossRef]
- Siegrist, M.; Arvai, J. Risk Perception: Reflections on 40 Years of Research. Risk Analysis 2020, 40. [CrossRef]
- Wilson, R.; Zwickle, A.; Walpole, H. Developing a Broadly Applicable Measure of Risk Perception. Risk Analysis 2018, 39. [CrossRef]
- Ferrer, R.; Klein, W.; Avishai, A.; Jones, K.; Villegas, M.; Sheeran, P. When does risk perception predict protection motivation for health threats? A person-by-situation analysis. PLoS ONE 2018, 13. [CrossRef]
- Brown, V. Risk Perception: It’s Personal. Environmental Health Perspectives 2014, 122. [CrossRef]
- Slovic, P.; Peters, E. Risk Perception and Affect. Current Directions in Psychological Science 2006, 15, 322-325. [CrossRef]
- Joffe, H. Risk: from perception to social representation. The British journal of social psychology 2003, 42 Pt 1, 55-73. [CrossRef]
- Sjoberg. Factors in risk perception. Risk analysis : an official publication of the Society for Risk Analysis 2000, 20 1, 1-11.
- Bodemer, N.; Gaissmaier, W. Risk perception. Nature 1993, 361, 689-689. [CrossRef]
- Syropoulos, S.; Leidner, B.; Mercado, E.; Li, M.; Cros, S.; Gómez, A.; Baka, A.; Chekroun, P.; Rottman, J. How safe are we? Introducing the multidimensional model of perceived personal safety. Personality and Individual Differences 2024. [CrossRef]
- Francis, A.; Le, A.; Adams-Leask, K.; Procter, N. Utilising co-design to develop a lived experience informed personal safety tool within a mental health community rehabilitation setting. Australian Occupational Therapy Journal 2024, 71, 1076-1088. [CrossRef]
- Bowen-Forbes, C.; Khondaker, T.; Stafinski, T.; Hadizadeh, M.; Menon, D. Mobile Apps for the Personal Safety of At-Risk Children and Youth: Scoping Review. JMIR mHealth and uHealth 2024, 12. [CrossRef]
- Grabinska, T. Personal Safety and Security Culture – Similarities and Differences. Security Dimensions 2021. [CrossRef]
- Maria, S.; Artem, M.; Margarita, K.; Irina, K.; Mariam, A. Psychological aspects of personal safety. 2018. [CrossRef]
- Glesner, C.; Geysmans, R.; Turcanu, C. Two sides of the same coin? Exploring the relation between safety and security in high-risk organizations. Journal of safety research 2022, 82, 184-193. [CrossRef]
- Gould, K.; Bieder, C. Safety and Security: The Challenges of Bringing Them Together. The Coupling of Safety and Security 2020. [CrossRef]
- Lisova, E.; Šljivo, I.; Čaušević, A. Safety and Security Co-Analyses: A Systematic Literature Review. IEEE Systems Journal 2019, 13, 2189-2200. [CrossRef]
- Burns, A.; McDermid, J.; Dobson, J. On the Meaning of Safety and Security. Comput. J. 1992, 35, 3-15. [CrossRef]
- Bostrom, A.; Böhm, G.; Hayes, A.; O'Connor, R. Credible Threat: Perceptions of Pandemic Coronavirus, Climate Change and the Morality and Management of Global Risks. Frontiers in Psychology 2020, 11. [CrossRef]
- Taylor, W.; Snyder, L. The influence of risk perception on safety: A laboratory study. Safety Science 2017, 95, 116-124. [CrossRef]
- McDaniels, T.; Kamlet, M.; Fischer, G. Risk perception and the value of safety. Risk analysis : an official publication of the Society for Risk Analysis 1992, 12 4, 495-503. [CrossRef]
- B, T. THE CONCEPT OF PERSONAL SECURITY IN THE CONTEXT OF THE TRANSFORMATION OF LEGAL RELATIONS IN SOCIETY. Public administration and state security aspects 2022. [CrossRef]
- Tsiuman, T.; Nahula, O. ПСИХОЛОГІЧНА ФОРМУЛА БЕЗПЕКИ ЯК КОНЦЕПТУАЛЬНА ОСНОВА ФОРМУВАННЯ НАВИЧОК БЕЗПЕЧНОЇ ПОВЕДІНКИ ОСОБИСТОСТІ. 2021, 94-100. [CrossRef]
- Panzabekova, A.; Digel, I. PERSONAL SAFETY AS AN INDICATOR OF LIVING STANDARDS. 2020, 3, 60-74. [CrossRef]
- Hutton, A.; Robertson, M.; Ranse, J. Exploring safety at mass gathering events through the lens of three different stakeholders. Frontiers in Public Health 2025. [CrossRef]
- Sułek, K. Integrated Safety Management for Mass Arts and Entertainment Events Based on an Outdoor Concert in Poland: A Case Study. Journal of Public Governance 2023. [CrossRef]
- Yang, C.; Cronin, P.; Agambayev, A.; Ozev, S.; Cetin, A.; Orailoglu, A. A Crowd-Based Explosive Detection System with Two-Level Feedback Sensor Calibration. 2020 IEEE/ACM International Conference On Computer Aided Design (ICCAD) 2020, 1-9. [CrossRef]
- Sudenis, R. SAFETY OF MASS EVENTS IN INTERNAL SEA WATERS. 2020, 1-2. [CrossRef]
- Dorreboom, M.; Barry, K. Concrete, bollards, and fencing: exploring the im/mobilities of security at public events in Brisbane, Australia. Annals of Leisure Research 2020, 25, 48-70. [CrossRef]
- Bukhtoyarov, V.; Dorokhin, S.; Ivannikov, V.; Shvyriov, A.; Yakovlev, K. Safe environment for pedestrians participating in public events. IOP Conference Series: Materials Science and Engineering 2020, 918. [CrossRef]
- Xu, Z.; Yen, N.; Zhang, H.; Wei, X.; Lv, Z.; Choo, K.-K.R.; Mei, L.; Luo, X. Social Sensors Based Online Attention Computing of Public Safety Events. IEEE Transactions on Emerging Topics in Computing 2017, 5, 403-411. [CrossRef]
- Batty, M.; Desyllas, J.; Duxbury, E. Safety in Numbers? Modelling Crowds and Designing Control for the Notting Hill Carnival. Urban Studies 2003, 40, 1573-1590. [CrossRef]
- Mellor, N.; Veno, A. Planning safe public events: practical guidelines. 2002.
- Wen, C.; Liu, W.; He, Z.; Liu, C. Research on emergency management of global public health emergencies driven by digital technology: A bibliometric analysis. Frontiers in Public Health 2023, 10. [CrossRef]
- Yuan, H.; Huang, L.; Chen, T.; Chen, Y.; Zhang, H.; Chen, X.; Deng, Q.; He, Z.; Wang, J.; Wang, Y. Key technologies of the emergency platform in China. Journal of Safety Science and Resilience 2022. [CrossRef]
- Benis, A. Social Media and the Internet of Things for Emergency and Disaster Medicine Management. Studies in health technology and informatics 2022, 291, 105-117. [CrossRef]
- Misra, S.; Roberts, P.; Rhodes, M. The Ecology of Emergency Management Work in the Digital Age. Perspectives on Public Management and Governance 2020, 3, 305-322. [CrossRef]
- Mirbabaie, M.; Ehnis, C.; Stieglitz, S.; Bunker, D.; Rose, T. Digital Nudging in Social Media Disaster Communication. Information Systems Frontiers 2020, 23, 1097-1113. [CrossRef]
- Krausz, M.; Westenberg, J.; Vigo, D.; Spence, R.; Ramsey, D. Emergency Response to COVID-19 in Canada: Platform Development and Implementation for eHealth in Crisis Management. JMIR Public Health and Surveillance 2020, 6. [CrossRef]
- Tao, T.; Chan, F.; Jin, J.; Barry, T. The effects of efficacy framing in news information and health anxiety on coronavirus-disease-2019-related cognitive outcomes and interpretation bias. Journal of experimental psychology. General 2022. [CrossRef]
- Heiss, R.; Gell, S.; Röthlingshöfer, E.; Zoller, C. How threat perceptions relate to learning and conspiracy beliefs about COVID-19: Evidence from a panel study. Personality and Individual Differences 2021, 175, 110672-110672. [CrossRef]
- Shesterinina, A. Collective Threat Framing and Mobilization in Civil War. American Political Science Review 2016, 110, 411-427. [CrossRef]
- Huddy, L.; Feldman, S.; Taber, C.; Lahav, G. Threat, Anxiety, and Support of Antiterrorism Policies. American Journal of Political Science 2005, 49, 593-608. [CrossRef]
- Xie, X.; Wang, X. Risk perception and risky choice: Situational, informational and dispositional effects. Asian Journal of Social Psychology 2003, 6, 117-132. [CrossRef]
- Cvetković, V.M.; Renner, R.; Jakovljević, V. Industrial Disasters and Hazards: From Causes to Conse-quences—A Holistic Approach to Resilience. International Journal of Disaster Risk Management 2024, 6, 149-168.
- Cvetković, V.M.; Gole, S.; Renner, R.; Jakovljević, V.; Lukić, T. Qualitative insights into cultural heritage protection in Serbia: Addressing legal and institutional gaps for disaster risk resilience. Open Geosciences 2024, 16, 20220755.
- Cvetković, V.; Tanasić, J.; Renner, R.; Rokvić, V.; Beriša, H. Comprehensive Risk Analysis of Emergency Medical Response Systems in Serbian Healthcare: Assessing Systemic Vulnerabilities in Disaster Preparedness and Response. In Proceedings of the Healthcare, 2024; p. 1962.
- Cvetković, V.; Šišović, V. Understanding the Sustainable Development of Community (Social) Disaster Resilience in Serbia: Demographic and Socio-Economic Impacts. Sustainability 2024, 16, 2620.
- Cvetković, V.; Renner, R.; Aleksova, B.; Lukić, T. Geospatial and Temporal Patterns of Natural and Man-Made (Technological) Disasters (1900–2024): Insights from Different Socio-Economic and Demographic Perspectives. Applied Sciences 2024, 14, 8129.
- Cvetković, V.; Noji, E.; Filipović, M.; Marija, M.P.; Želimir, K.; Nenad, R. Public Risk Perspectives Regarding the Threat of Terrorism in Belgrade: Implications for Risk Management Decision-Making for Individuals, Communities and Public Authorities. Journal of Criminal Investigation and Criminology/Revija za kriminalistiko in kriminologijo 2018, 69, 279–298.
- Kondratenko, N.; Dobryanskyy, O. The Determination of National Threats as a Prerequisite for the Formation of an Integrated System of Economic Security at the National Level. THE PROBLEMS OF ECONOMY 2023. [CrossRef]
- Khaustova, V.; Trushkina, N. Risks and Threats to National Security: Essence and Classification. Business Inform 2024. [CrossRef]
- Falandys, K.; Łabuz, P.; Barć, M. REPRIVATISATION, FUEL TRADING AND ISLAMIC IMMIGRANTS AS THREE LEVELS OF THREATS TO NATIONAL SECURITY. PRZEGLĄD POLICYJNY 2019. [CrossRef]
- Allahrakha, N. Balancing Cyber-security and Privacy: Legal and Ethical Considerations in the Digital Age. Legal Issues in the Digital Age 2023. [CrossRef]
- Sahi, A.M.; Khalid, H.; Abbas, A.; Zedan, K.; Khatib, S.; Amosh, H.A. The Research Trend of Security and Privacy in Digital Payment. Informatics 2022, 9, 32. [CrossRef]
- Sule, M.-J.; Zennaro, M.; Thomas, G. Cybersecurity through the lens of Digital Identity and Data Protection: Issues and Trends. Technology in Society 2021. [CrossRef]
- Sun, P. Security and privacy protection in cloud computing: Discussions and challenges. J. Netw. Comput. Appl. 2020, 160, 102642. [CrossRef]
- Sánchez, M.; Urbano, A. Security in digital markets. Journal of Business Research 2019. [CrossRef]
- Toch, E.; Bettini, C.; Shmueli, E.; Radaelli, L.; Lanzi, A.; Riboni, D.; Lepri, B. The Privacy Implications of Cyber Security Systems. ACM Computing Surveys (CSUR) 2018, 51, 1-27. [CrossRef]
- Bazarkina, D.; Pashentsev, E. Malicious Use of Artificial Intelligence. Russia in Global Affairs 2020. [CrossRef]
- Milošević, G.; Cvjetković-Ivetić, C.; Baturan, L. State Aid in Reconstruction of Natural and Other Disasters’ Consequences Using the Budget Funds of the Republic of Serbia. International Journal of Disaster Risk Management 2024, 6, 169-182.
- Milenković, D.; Cvetković, V.M.; Renner, R. A Systematic Literary Review on Community Resilience Indicators: Adaptation and Application of the BRIC Method for Measuring Disasters Resilience. International Journal of Disaster Risk Management 2024, 6, 79-104.
- Beriša, H.; Cvetković, V.; Pavić, A. Implications of Artificial Intelligence and Cyberspace on Risk Management Capabilities. International Journal of Disaster Risk Management 2024, 6, 279-295.
- Cruz, R.D.D.; Ormilla, R.C.G. Disaster Risk Reduction Management Implementation in the Public Elementary Schools of the Department of Education, Philippines. International Journal of Disaster Risk Management 2022, 4, 1-15.
- Bashlueva, M.; Kartashov, I. TERRORISM AS ONE OF THE MAIN THREATS TO NATIONAL SECURITY. Lobbying in the Legislative Process 2024. [CrossRef]
- Abbas, H.S.M.; Xu, X. Topical Dynamics of Terrorism from a Global Perspective and A Call for Action on Global Risk. International Journal of Disaster Risk Reduction 2024. [CrossRef]
- Lepskiy, M.; Lepska, N. The Phenomenon of the Terrorist State in Contemporary Geopolitics: Attributive, Static, and Dynamic Characteristics. American Behavioral Scientist 2023. [CrossRef]
- Alwan, H.A.S.I.H. The impact of terrorism on government performance after 2014 (future vision). Russian Law Journal 2023. [CrossRef]
- Borichev, K.; Pavlik, M. The role of State Security bodies in countering terrorism. 2021, 2021, 94-103. [CrossRef]
- Ervine, P. Does Terrorism Pose a Real Threat to Security? 2020.
- Hendrix, C.; Young, J. State Capacity and Terrorism: A Two-Dimensional Approach. Security Studies 2014, 23, 329-363. [CrossRef]
- Ekmekçi, F. Terrorism as war by other means: national security and state support for terrorism. Revista Brasileira De Politica Internacional 2011, 54, 125-141. [CrossRef]
- Van Munster, R. The War on Terrorism: When the Exception Becomes the Rule. International journal for the semiotics of law 2004, 17, 141-153. [CrossRef]
- Yarovenko, H. Evaluating the threat to national information security. Problems and Perspectives in Management 2020. [CrossRef]
- Chang, K. Are they psychologically prepared? Examining psychological preparedness for disasters among frontline civil servants in Taiwan. International Journal of Disaster Risk Reduction 2025. [CrossRef]
- Ikican, T.Ç.; Bayındır, G.Ş.; Engin, Y.; Albal, E. Disaster preparedness perceptions and psychological first-aid competencies of psychiatric nurses. International nursing review 2024. [CrossRef]
- Abualenain, J. Psychological preparedness in disaster management: A survey of leaders in Saudi Arabia's emergency operation centers. International Journal of Disaster Risk Reduction 2024. [CrossRef]
- Richardson, J.; Kelly, L.; Mackay, A. Australian Red Cross psychosocial approach to disaster preparedness. Australian Journal of Emergency Management 2023. [CrossRef]
- Said, N.; Molassiotis, A.; Chiang, V. Psychological first aid training in disaster preparedness for nurses working with emergencies and traumas. International nursing review 2022. [CrossRef]
- McLennan, J.; Marques, M.; Every, D. Conceptualising and measuring psychological preparedness for disaster: The Psychological Preparedness for Disaster Threat Scale. Natural Hazards 2020, 101, 297-307. [CrossRef]
- Paton, D. Disaster risk reduction: Psychological perspectives on preparedness. Australian Journal of Psychology 2019, 71, 327-341. [CrossRef]
- Sergey, K. Methodology for Building Automated Systems for Monitoring Engineering (Load-Bearing) Structures, and Natural Hazards to Ensure Comprehensive Safety of Buildings and Constructions. International Journal of Disaster Risk Management 2021, 3, 1-10.
- El-Mougher, M.M.; Mahfuth, K. Indicators of Risk Assessment and Management in Infrastructure Projects in Palestine. International Journal of Disaster Risk Management 2021, 3, 23-40.
- Dukiya, J.J.; Benjamine, O. Building resilience through local and international partnerships, Nigeria experiences. International Journal of Disaster Risk Management 2021, 3, 11-24.
- Adamović, M.; Milojević, S.; Nikolovski, S.; Knežević, S. Pharmacy response to natural disasters. International Journal of Disaster Risk Management (IJDRM) 2021, 3, 25-30.
- Olawuni, P.; Olowoporoku, O.; Daramola, O. Determinants of Residents’ Participation in Disaster Risk Management in Lagos Metropolis Nigeria. International Journal of Disaster Risk Management 2020, 2, 1-18.
- Chakma, U.K.; Hossain, A.; Islam, K.; Hasnat, G.T.; Kabir. Water crisis and adaptation strategies by tribal community: A case study in Baghaichari Upazila of Rangamati District in Bangladesh. International Journal of Disaster Risk Management 2020, 2, 37-46.
- Xuesong, G.; Kapucu, N. Examining Stakeholder Participation in Social Stability Risk Assessment for Mega Projects using Network Analysis. International Journal of Disaster Risk Management 2019, 1, 1-31.
- Vibhas, S.; Adu, G.B.; Ruiyi, Z.; Anwaar, M.A.; Rajib, S. Understanding the barriers restraining effective operation of flood early warning systems. International Journal of Disaster Risk Management 2019, 1, 1-17.
- Kumiko, F.; Shaw, R. Preparing International Joint Project: Use of Japanese Flood Hazard Map in Bangladesh. International Journal of Disaster Risk Management 2019, 1, 62-80.
- Aktar, M.A.; Shohani, K.; Hasan, M.N.; Hasan, M.K. Flood Vulnerability Assessment by Flood Vulnerability Index (FVI) Method: A Study on Sirajganj Sadar Upazila. International Journal of Disaster Risk Management 2021, 3, 1-14.
- Al-ramlawi, A.; El-Mougher, M.; Al-Agha, M. The Role of Al-Shifa Medical Complex Administration in Evacuation & Sheltering Planning. International Journal of Disaster Risk Management 2020, 2.
- Carla S, R.G. School-community collaboration: disaster preparedness towards building resilient communities. International Journal of Disaster Risk Management 2019, 1, 45-59.
- Chakma, S. Water Crisis in the Rangamati Hill District of Bangladesh: A Case Study on Indigenous Community. International Journal of Disaster Risk Management 2023, 5, 29-44.
- Cvetković, V. Risk Perception of Building Fires in Belgrade. International Journal of Disaster Risk Management 2019, 1, 81-91.
- Cvetković, V. A Predictive Model of Community Disaster Resilience based on Social Identity Influences (MODERSI). International Journal of Disaster Risk Management 2023, 5, 57-80.
- El-Mougher, M.M. Level of coordination between the humanitarian and governmental organizations in Gaza Strip and its impact on the humanitarian interventions to the Internally Displaced People (IDPs) following May escalation 2021. International Journal of Disaster Risk Management 2022, 4, 15-45.
- Ivanov, A. Disaster Risk Reduction and Disaster Risk Management: State of Play in North Macedonia. International Journal of Disaster Risk Management 2024, 6, 201-212.
- Kaur, B. Disasters and exemplified vulnerabilities in a cramped Public Health Infrastructure in India. International Journal of Disaster Risk Management 2020, 2, 15-22.
- Mano, R.; A, K.; Rapaport, C. Earthquake preparedness: A Social Media Fit perspective to accessing and disseminating earthquake information. International Journal of Disaster Risk Management 2019, 1, 19-31.
- Molnár, A. A Systematic Collaboration of Volunteer and Professional Fire Units in Hungary. International Journal of Disaster Risk Management 2024, 6, 1-13.
- Rajani, A.; Tuhin, R.; Rina, A. The Challenges of Women in Post-disaster Health Management: A Study in Khulna District. International Journal of Disaster Risk Management 2023, 5, 51-66.
- Adams, R. Disabilities and Disasters: How Social Cognitive and Community Factors Influence Preparedness among People with Disabilities. 2018.
- Ainuddin, S.; Routray, J.K. Institutional framework, key stakeholders and community preparedness for earthquake induced disaster management in Balochistan. Disaster Prevention and Management: An International Journal 2012, 21, 22-36.
- Brown, B.J. Disaster preparedness and the United Nations: advance planning for disaster relief; Elsevier: 2013.
- Cretikos, M.; Eastwood, K.; Dalton, C.; Merritt, T.; Tuyl, F.; Winn, L.; Durrheim, D. Household disaster preparedness and information sources: Rapid cluster survey after a storm in New South Wales, Australia. BMC public health 2008, 8, 195.
- Alexander, D. Disaster and Crisis Preparedness. Oxford Research Encyclopedia of Politics 2021. [CrossRef]
- Chan, E. Emergency Preparedness and Disaster Response. 2019, 63-92. [CrossRef]
- Ardiansyah, M.; Mirandah, E.; Suyatno, A.; Saputra, F.; Muazzinah, M. Disaster Management and Emergency Response: Improving Coordination and Preparedness. Global International Journal of Innovative Research 2024. [CrossRef]
- Kuehnhanss, C.; Nohlen, H. A scenario study on disaster preparedness behaviours. The European Journal of Public Health 2024, 34. [CrossRef]
- Marceta, Ž.; Jurišic, D. Psychological Preparedness of the Rescuers and Volunteers: A Case Study of 2023 Türkiye Earthquake. International Journal of Disaster Risk Management 2024, 6, 27-40.
- Samimian-Darash, L.; Rotem, N. From Crisis to Emergency: The Shifting Logic of Preparedness. Ethnos 2018, 84, 910-926. [CrossRef]
- Leider, J.; DeBruin, D.; Reynolds, N.; Koch, A.; Seaberg, J. Ethical Guidance for Disaster Response, Specifically Around Crisis Standards of Care: A Systematic Review. American Journal of Public Health 2017, 107. [CrossRef]
- Hanfling, D.; Altevogt, B.; Viswanathan, K.; Gostin, L. Crisis Standards of Care: A Systems Framework for Catastrophic Disaster Response. Military medicine 2016, 181 8, 719-721. [CrossRef]
- Goel, P. Crisis Management Strategies: Preparing for and Responding to Disruptions. Journal of Advanced Management Studies 2024. [CrossRef]
- Cvetković, V. Disaster Risk Management. Scientific-Professional Society for Disaster Risk Management, Belgrade 2024.
- News, A. Serbian students demand justice after deadly train station collapse. 2024.
- News, A. Protests grow in Serbia after deadly infrastructure failure. 2024.
- Newton, K.; Norris, P. Confidence in public institutions: faith, culture, or performance? Disaffected democracies: What’s troubling the trilateral countries 2000, 52, 73.
- Anđić, T. Futurelessness, migration, or a lucky break: narrative tropes of the ‘blocked future’ among Serbian high school students. Journal of Youth Studies 2020, 23, 430-446. [CrossRef]
- Ilišin, V.; Gvozdanović, A.; Potočnik, D. Contradictory tendencies in the political culture of Croatian youth: unexpected anomalies or an expected answer to the social crisis? Journal of Youth Studies 2018, 21, 51-71. [CrossRef]
- Haynes, S.; May, D.; Lambert, E.; Keena, L. An Examination of the Effects of Personal and Workplace Variables on Correctional Staff Perceptions of Safety. American Journal of Criminal Justice 2020, 45, 145-165. [CrossRef]
- Othman, N.; Ahmad, F.; Morr, C.E.; Ritvo, P. Perceived impact of contextual determinants on depression, anxiety and stress: a survey with university students. International Journal of Mental Health Systems 2019, 13. [CrossRef]
- Allik, M.; Kearns, A. “There goes the fear”: feelings of safety at home and in the neighborhood: The role of personal, social, and service factors. Journal of Community Psychology 2017, 45, 543-563. [CrossRef]
- Baba, Y.; Austin, D. Neighborhood Environmental Satisfaction, Victimization, and Social Participation as Determinants of Perceived Neighborhood Safety. Environment and Behavior 1989, 21, 763-780. [CrossRef]
- Eisch-Angus, K. Crime and Narration: The Creation of (In)Security in Everyday Life. 2020, 87-112. [CrossRef]
- Valera, S.; Guàrdia, J. Perceived insecurity and fear of crime in a city with low-crime rates. Journal of Environmental Psychology 2014, 38, 195-205. [CrossRef]
- Roznai, Y. The Insecurity of Human Security. 2014.
- Moreno, F.; Dennis, S.H.; Cummings, E.; Boxer, P. “When someone is in a safe place, I believe that your mind rests” emotional security amid community violence: A cross-national study with youth in Newark, New Jersey, USA, and San Pedro Sula, Cortés, Honduras. International Journal of Intercultural Relations 2024. [CrossRef]
- Watson, R.; Burgess, L.; Sellars, E.; Crooks, J.; McGowan, R.; Diffey, J.; Naughton, G.; Carrington, R.; Lovelock, C.; Temple, R.; et al. A qualitative study exploring the benefits of involving young people in mental health research. Health Expectations : An International Journal of Public Participation in Health Care and Health Policy 2023, 26, 1491-1504. [CrossRef]
- Vilchez, M.; Trujillo, F. The Perception of Security and Youth: A Practical Example. Social Sciences 2023. [CrossRef]
- Slaatto, A.; Mellblom, A.; Kleppe, L.; Baugerud, G. Safety in Residential Youth Facilities: Staff Perceptions of Safety and Experiences of the “Basic Training Program in Safety and Security”. Residential Treatment for Children & Youth 2021, 39, 212-237. [CrossRef]
- Fine, A.; Beardslee, J.; Mays, R.; Frick, P.; Steinberg, L.; Cauffman, E. Measuring youths’ perceptions of police: Evidence from the crossroads study. Psychology, Public Policy, and Law 2021. [CrossRef]
- Fine, A.; Padilla, K.; Tom, K. Police legitimacy: identifying developmental trends and whether youths’ perceptions can be changed. Journal of Experimental Criminology 2020, 18, 67-87. [CrossRef]
- Azmy, A. Police studies program for at-risk youth in youth villages: program evaluation and understanding the psychological mechanism behind participation in the program and perceptions towards police legitimacy. Police Practice and Research 2020, 22, 640-656. [CrossRef]
- Wardle, H. Perceptions, people and place: Findings from a rapid review of qualitative research on youth gambling. Addictive behaviors 2018, 90, 99-106. [CrossRef]
- Heller, S.; Shah, A.; Guryan, J.; Ludwig, J.; Mullainathan, S.; Pollack, H. Thinking, Fast and Slow? Some Field Experiments to Reduce Crime and Dropout in Chicago*. 2015, 132, 1-54. [CrossRef]
- Schubert, C.; Mulvey, E.; Loughran, T.; Losoya, S. Perceptions of Institutional Experience and Community Outcomes for Serious Adolescent Offenders. Criminal Justice and Behavior 2012, 39, 71-93. [CrossRef]
- Li, L.-H.; Gan, J.; Yi, Z.; Qu, X.; Ran, B. Risk perception and the warning strategy based on safety potential field theory. Accident; analysis and prevention 2020, 148, 105805. [CrossRef]
- Xia, N.; Wang, X.; Griffin, M.; Wu, C.; Liu, B. Do we see how they perceive risk? An integrated analysis of risk perception and its effect on workplace safety behavior. Accident; analysis and prevention 2017, 106, 234-242. [CrossRef]
- Sullivan-Wiley, K.; Gianotti, A. Risk Perception in a Multi-Hazard Environment. World Development 2017, 97, 138-152. [CrossRef]
- Lounsbury, M. The Problem of Institutional Trust. Organization Studies 2023, 44, 308-310. [CrossRef]
- Fiket, I.; Pudar-Drasko, G. Possibility of non-institutional political participation within the non-responsive system of Serbia: The impact of (dis)trust and internal political efficiency. Sociologija 2021. [CrossRef]
- Džunić, M.; Golubovic, N.; Marinkovic, S. Determinants of institutional trust in transition economies: Lessons from Serbia. Ekonomski anali 2020. [CrossRef]
- Daskalopoulou, I. Individual-Level Evidence on the Causal Relationship Between Social Trust and Institutional Trust. Social Indicators Research 2018, 144, 275-298. [CrossRef]
- Kroeger, F. Trusting organizations: The institutionalization of trust in interorganizational relationships. Organization 2012, 19, 743-763. [CrossRef]
- Rothstein, B.; Stolle, D. The State and Social Capital: An Institutional Theory of Generalized Trust. Comparative politics 2008, 40, 441-459. [CrossRef]
- Pjesivac, I.; Spasovska, K.; Imre, I. The Truth Between the Lines: Conceptualization of Trust in News Media in Serbia, Macedonia, and Croatia. Mass Communication and Society 2016, 19, 323-351. [CrossRef]
- Heath, L.; Gilbert, K. Mass Media and Fear of Crime. American Behavioral Scientist 1996, 39, 379-386. [CrossRef]
- Cvetković, V.; Nikolić, N.; Lukić, T. Exploring Students' and Teachers' Insights on School-Based Disaster Risk Reduction and Safety: A Case Study of Western Morava Basin, Serbia. Safety 2024, 10, 2024040472.
- Zyla, B. Human Security. International Relations 2019. [CrossRef]
- Sokołowski, M. The concept and the essence of personal security. Kultura Bezpieczeństwa. Nauka – Praktyka - Refleksje 2019. [CrossRef]
- Kotovchevski, M.; Kotovchevska, B. National and Human Security Concept. 2017, 20, 319-325.
- Gasper, D.; Gómez, O. Human security thinking in practice: ‘personal security’, ‘citizen security' and comprehensive mappings. Contemporary Politics 2015, 21, 100-116. [CrossRef]
- Schutte, R.; Fordelone, T.Y. Human Security: a paradigm contradicting the national interest? 2006, 1, 35-40.
- Newman, E. Human Security and Constructivism. International Studies Perspectives 2001, 2, 239-251. [CrossRef]
- Wildavsky, A.; Dake, K. Theories of Risk Perception: Who Fears What and Why? 2016.
- Ferrer, R.; Klein, W. Risk perceptions and health behavior. Current opinion in psychology 2015, 5, 85-89. [CrossRef]
- Hicks, S.; Brown, S. Perceptions of risk. International Review of Victimology 2013, 19, 249-267. [CrossRef]
- Sjöberg, L. Factors in Risk Perception. Risk Analysis 2000, 20. [CrossRef]
- Sjöberg, L. Worry and Risk Perception. Risk Analysis 1998, 18. [CrossRef]
- Pollatsek, A.; Tversky, A. A theory of risk. Journal of Mathematical Psychology 1970, 7, 540-553. [CrossRef]
- Pavlou, P.; Gefen, D. Building Effective Online Marketplaces with Institution-Based Trust. Fox School of Business 2004. [CrossRef]
- Bošković, M.M.; Kostić, J. Track Record in Fight Against Corruption in Serbia – How to Increase Effectiveness of Prosecution? Journal of the University of Latvia. Law 2024. [CrossRef]
- Nikolić, K.; Petrović, V. Organized crime in Serbian politics during the Yugoslav wars. Journal of Political Power 2022, 15, 101-122. [CrossRef]
- Čvorović, D. Suppression of organized crime and Serbia's accession to the European Union. Bezbednost, Beograd 2022. [CrossRef]
- Obokata, T.; Bošković, A.; Radović, N. Serbia’s Action against Transnational Organised Crime. European Journal of Crime, Criminal Law and Criminal Justice 2016, 24, 151-175. [CrossRef]
- Silva, C.; Guedes, I. The Role of the Media in the Fear of Crime: A Qualitative Study in the Portuguese Context. Criminal Justice Review 2022, 48, 300-317. [CrossRef]
- Baranyi, G.; Di Marco, M.H.; Russ, T.; Dibben, C.; Pearce, J. The impact of neighbourhood crime on mental health: A systematic review and meta-analysis. Social science & medicine 2021, 282, 114106. [CrossRef]
- Baranauskas, A. War Zones and Depraved Violence: Exploring the Framing of Urban Neighborhoods in News Reports of Violent Crime. Criminal Justice Review 2020, 45, 393-412. [CrossRef]
- Kort-Butler, L.; Habecker, P. Framing and Cultivating the Story of Crime. Criminal Justice Review 2018, 43, 127-146. [CrossRef]
- Leverentz, A. Narratives of Crime and Criminals: How Places Socially Construct the Crime Problem1. Sociological Forum 2012, 27, 348-371. [CrossRef]
- Callanan, V. Media Consumption, Perceptions of Crime Risk and Fear of Crime: Examining Race/Ethnic Differences. Sociological Perspectives 2012, 55, 115-193. [CrossRef]
- Gross, K.; Aday, S. The Scary World in Your Living Room and Neighborhood: Using Local Broadcast News, Neighborhood Crime Rates, and Personal Experience to Test Agenda Setting and Cultivation. Journal of Communication 2003, 53, 411-426. [CrossRef]
- Mravcová, A. Environmental Sustainability under the Impact of the Current Crises. Studia Ecologiae et Bioethicae 2024. [CrossRef]
- Kryshtal, H.; Briukhovetska, I.; Khimich, S. State and Business in Financing the Goals of Sustainable Development. „Sustainable Development: Modern Trends and Challenges“ 2024. [CrossRef]
- Liobikienė, G.; Matiiuk, Y.; Krikštolaitis, R. The concern about main crises such as the Covid-19 pandemic, the war in Ukraine, and climate change's impact on energy-saving behavior. Energy Policy 2023. [CrossRef]
- Grum, B.; Grum, D.K. Urban Resilience and Sustainability in the Perspective of Global Consequences of COVID-19 Pandemic and War in Ukraine: A Systematic Review. Sustainability 2023. [CrossRef]
- Cifuentes-Faura, J. Ukraine's post-war reconstruction: Building smart cities and governments through a sustainability-based reconstruction plan. Journal of Cleaner Production 2023. [CrossRef]
- Mei, Z. Research on the balance strategy between privacy protection and crime control in the deployment of urban surveillance technology. Science of Law Journal 2024. [CrossRef]
- Karlsson, K.; Dalipi, F. Exploring the surveillance technology discourse: a bibliometric analysis and topic modeling approach. Frontiers in Artificial Intelligence 2024, 7. [CrossRef]
- Sung, C.-S.; Park, J.-Y. Design of an intelligent video surveillance system for crime prevention: applying deep learning technology. Multimedia Tools and Applications 2021, 80, 34297-34309. [CrossRef]
- Chatterjee, S. Surveillance Threating Privacy and Data Protection: A Review. 2018, 8, 20583-20590.
- Prastyanti*, R.; Sharma, R. Establishing Consumer Trust Through Data Protection Law as a Competitive Advantage in Indonesia and India. Journal of Human Rights, Culture and Legal System 2024. [CrossRef]
- Popović, D. The Pivotal Role of DPAs in Digital Privacy Protection : Assessment of the Serbian Protection Mechanism. Law, Identity and Values 2022. [CrossRef]
- Mitrović, M. Freedom of expression and protection of personal data on the Internet: The perspective of Internet users in Serbia. 2020, 15, 5-34. [CrossRef]
- Bogosavljević, M. Protection of Personal Data in Documents: Application of the Law on Personal Data Protection in Serbia and Abroad. Moderna arhivistika 2019. [CrossRef]
- Šuvaković, U.; Petrović, J.; Nikolić, I. Confessional Instruction or Religious Education: Attitudes of Female Students at the Teacher Education Faculties in Serbia. Religions 2023. [CrossRef]
- Nikolić, V.; Vukić, T.; Maletaski, T.; Andevski, M. Students’ attitudes towards sustainable development in Serbia. International Journal of Sustainability in Higher Education 2020, 21, 733-755. [CrossRef]
- Pjesivac, I.; Imre, I. Perceptions of Media Roles in Serbia and Croatia: Does News Orientation Have an Impact? Journalism Studies 2018, 20, 1864-1882. [CrossRef]
- Reinprecht, A.-M. Between Europe and the Past—Collective Identification and Diffusion of Student Contention to and from Serbia. Europe-Asia Studies 2017, 69, 1362-1382. [CrossRef]
- Angluin, D.; Scapens, R. Transparency, accounting knowledge and perceived fairness in UK universities. Resource allocation: results from a survey of accounting and finance. British Accounting Review 2000, 32, 1-42. [CrossRef]
- Tmušič, M. Misuse of institutions and economic performance: some evidence from Serbia. Post-Communist Economies 2023, 35, 546-573. [CrossRef]
- Jovanović, V. Trust and subjective well-being: The case of Serbia. Personality and Individual Differences 2016, 98, 284-288. [CrossRef]
- Debb, S.; McClellan, M. Perceived Vulnerability As a Determinant of Increased Risk for Cybersecurity Risk Behavior. Cyberpsychology, behavior and social networking 2021, 24 9, 605-611. [CrossRef]
- Schaik, P.; Jeske, D.; Onibokun, J.; Coventry, L.; Jansen, J.; Kusev, P. Risk perceptions of cyber-security and precautionary behaviour. Comput. Hum. Behav. 2017, 75, 547-559. [CrossRef]
- Aven, T. A risk science perspective on the discussion concerning Safety I, Safety II and Safety III. Reliab. Eng. Syst. Saf. 2022, 217, 108077. [CrossRef]
- Savolainen, T.; Airo, K.; Jylhä, T. Safety training needs of educational institutions. Quality Assurance in Education 2024. [CrossRef]
- Khankeh, H.; Pourebrahimi, M.; Karibozorg, M.; Hosseinabadi-Farahani, M.; Ranjbar, M.; Ghods, M.; Saatchi, M. Public trust, preparedness, and the influencing factors regarding COVID-19 pandemic situation in Iran: A population-based cross-sectional study. Asian Journal of Social Health and Behavior 2022, 5, 154-161. [CrossRef]
- Ivanović, J.; Stanković, B.; Žeželj, I. When Our History Meets Their History: Strategies Young People in Serbia Use to Coordinate Conflicting Group Narratives. European Journal of Social Psychology 2024. [CrossRef]
- Zorkić, T.J.; Mićić, K.; Cerović, T.K. Lost Trust? The Experiences of Teachers and Students during Schooling Disrupted by the Covid-19 Pandemic. Center for Educational Policy Studies Journal 2021. [CrossRef]
Figure 1.
Conceptual research design.
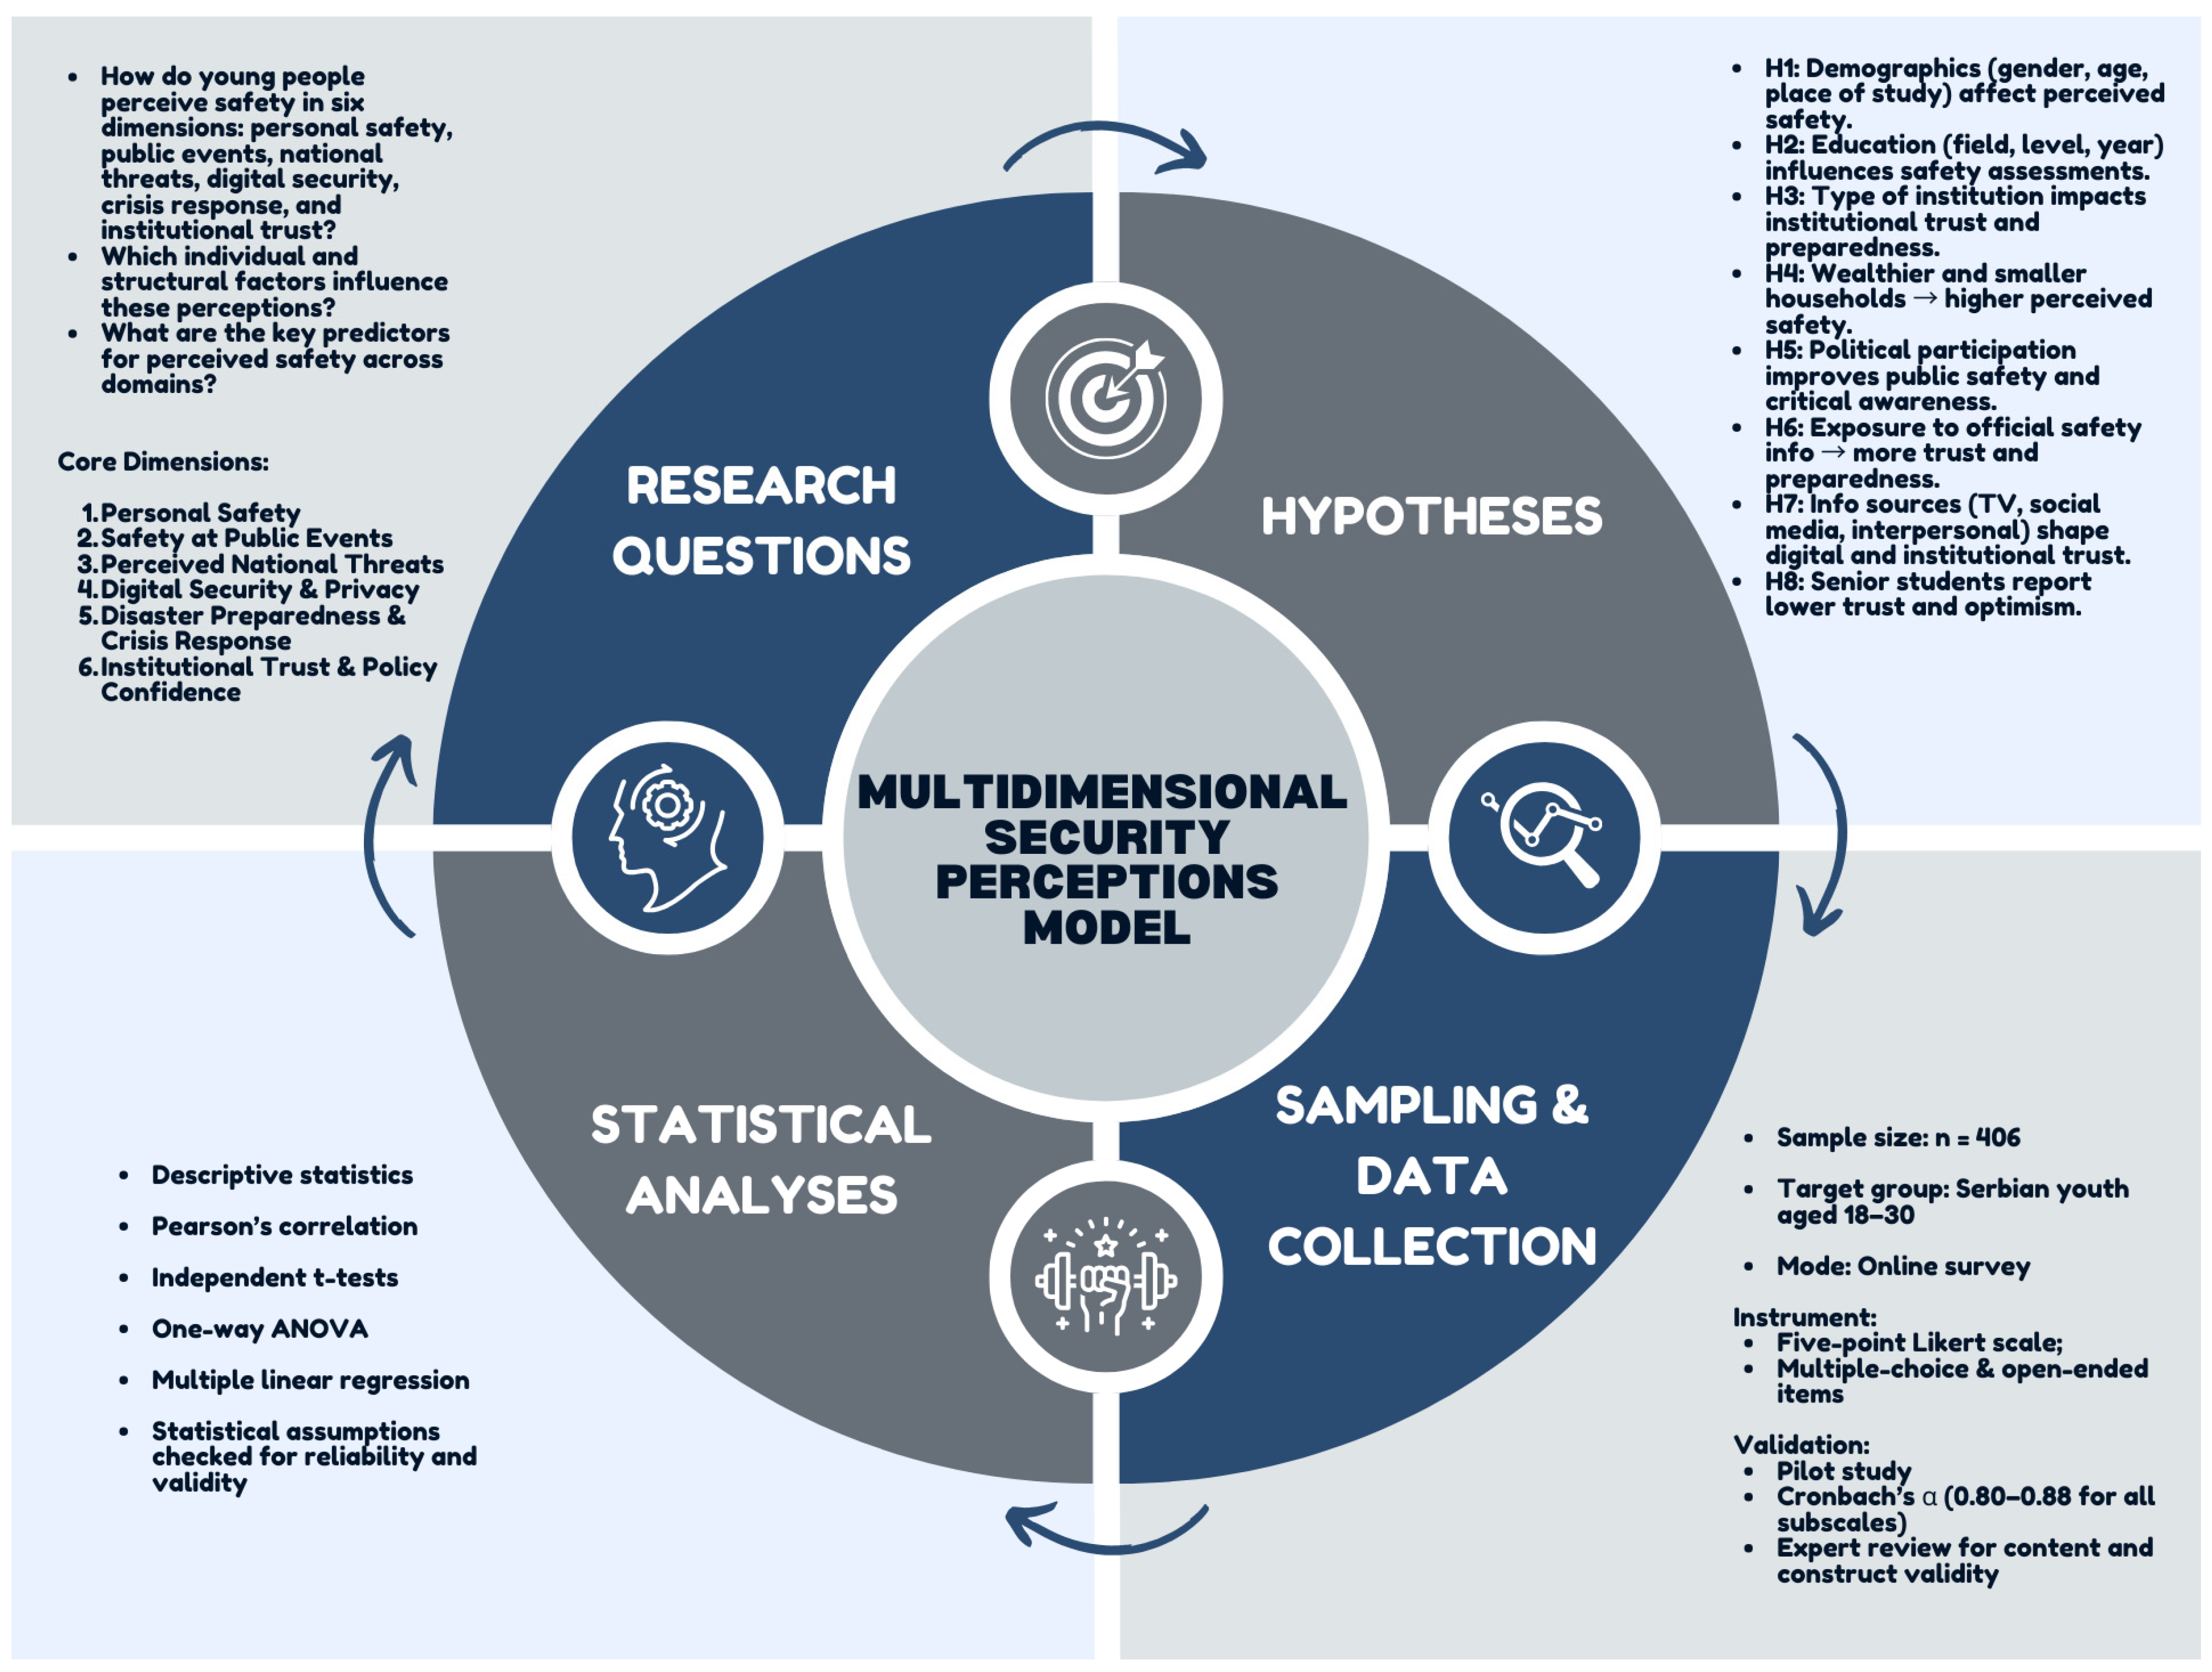
Figure 3.
Descriptive statistics of youth perceptions of personal safety.
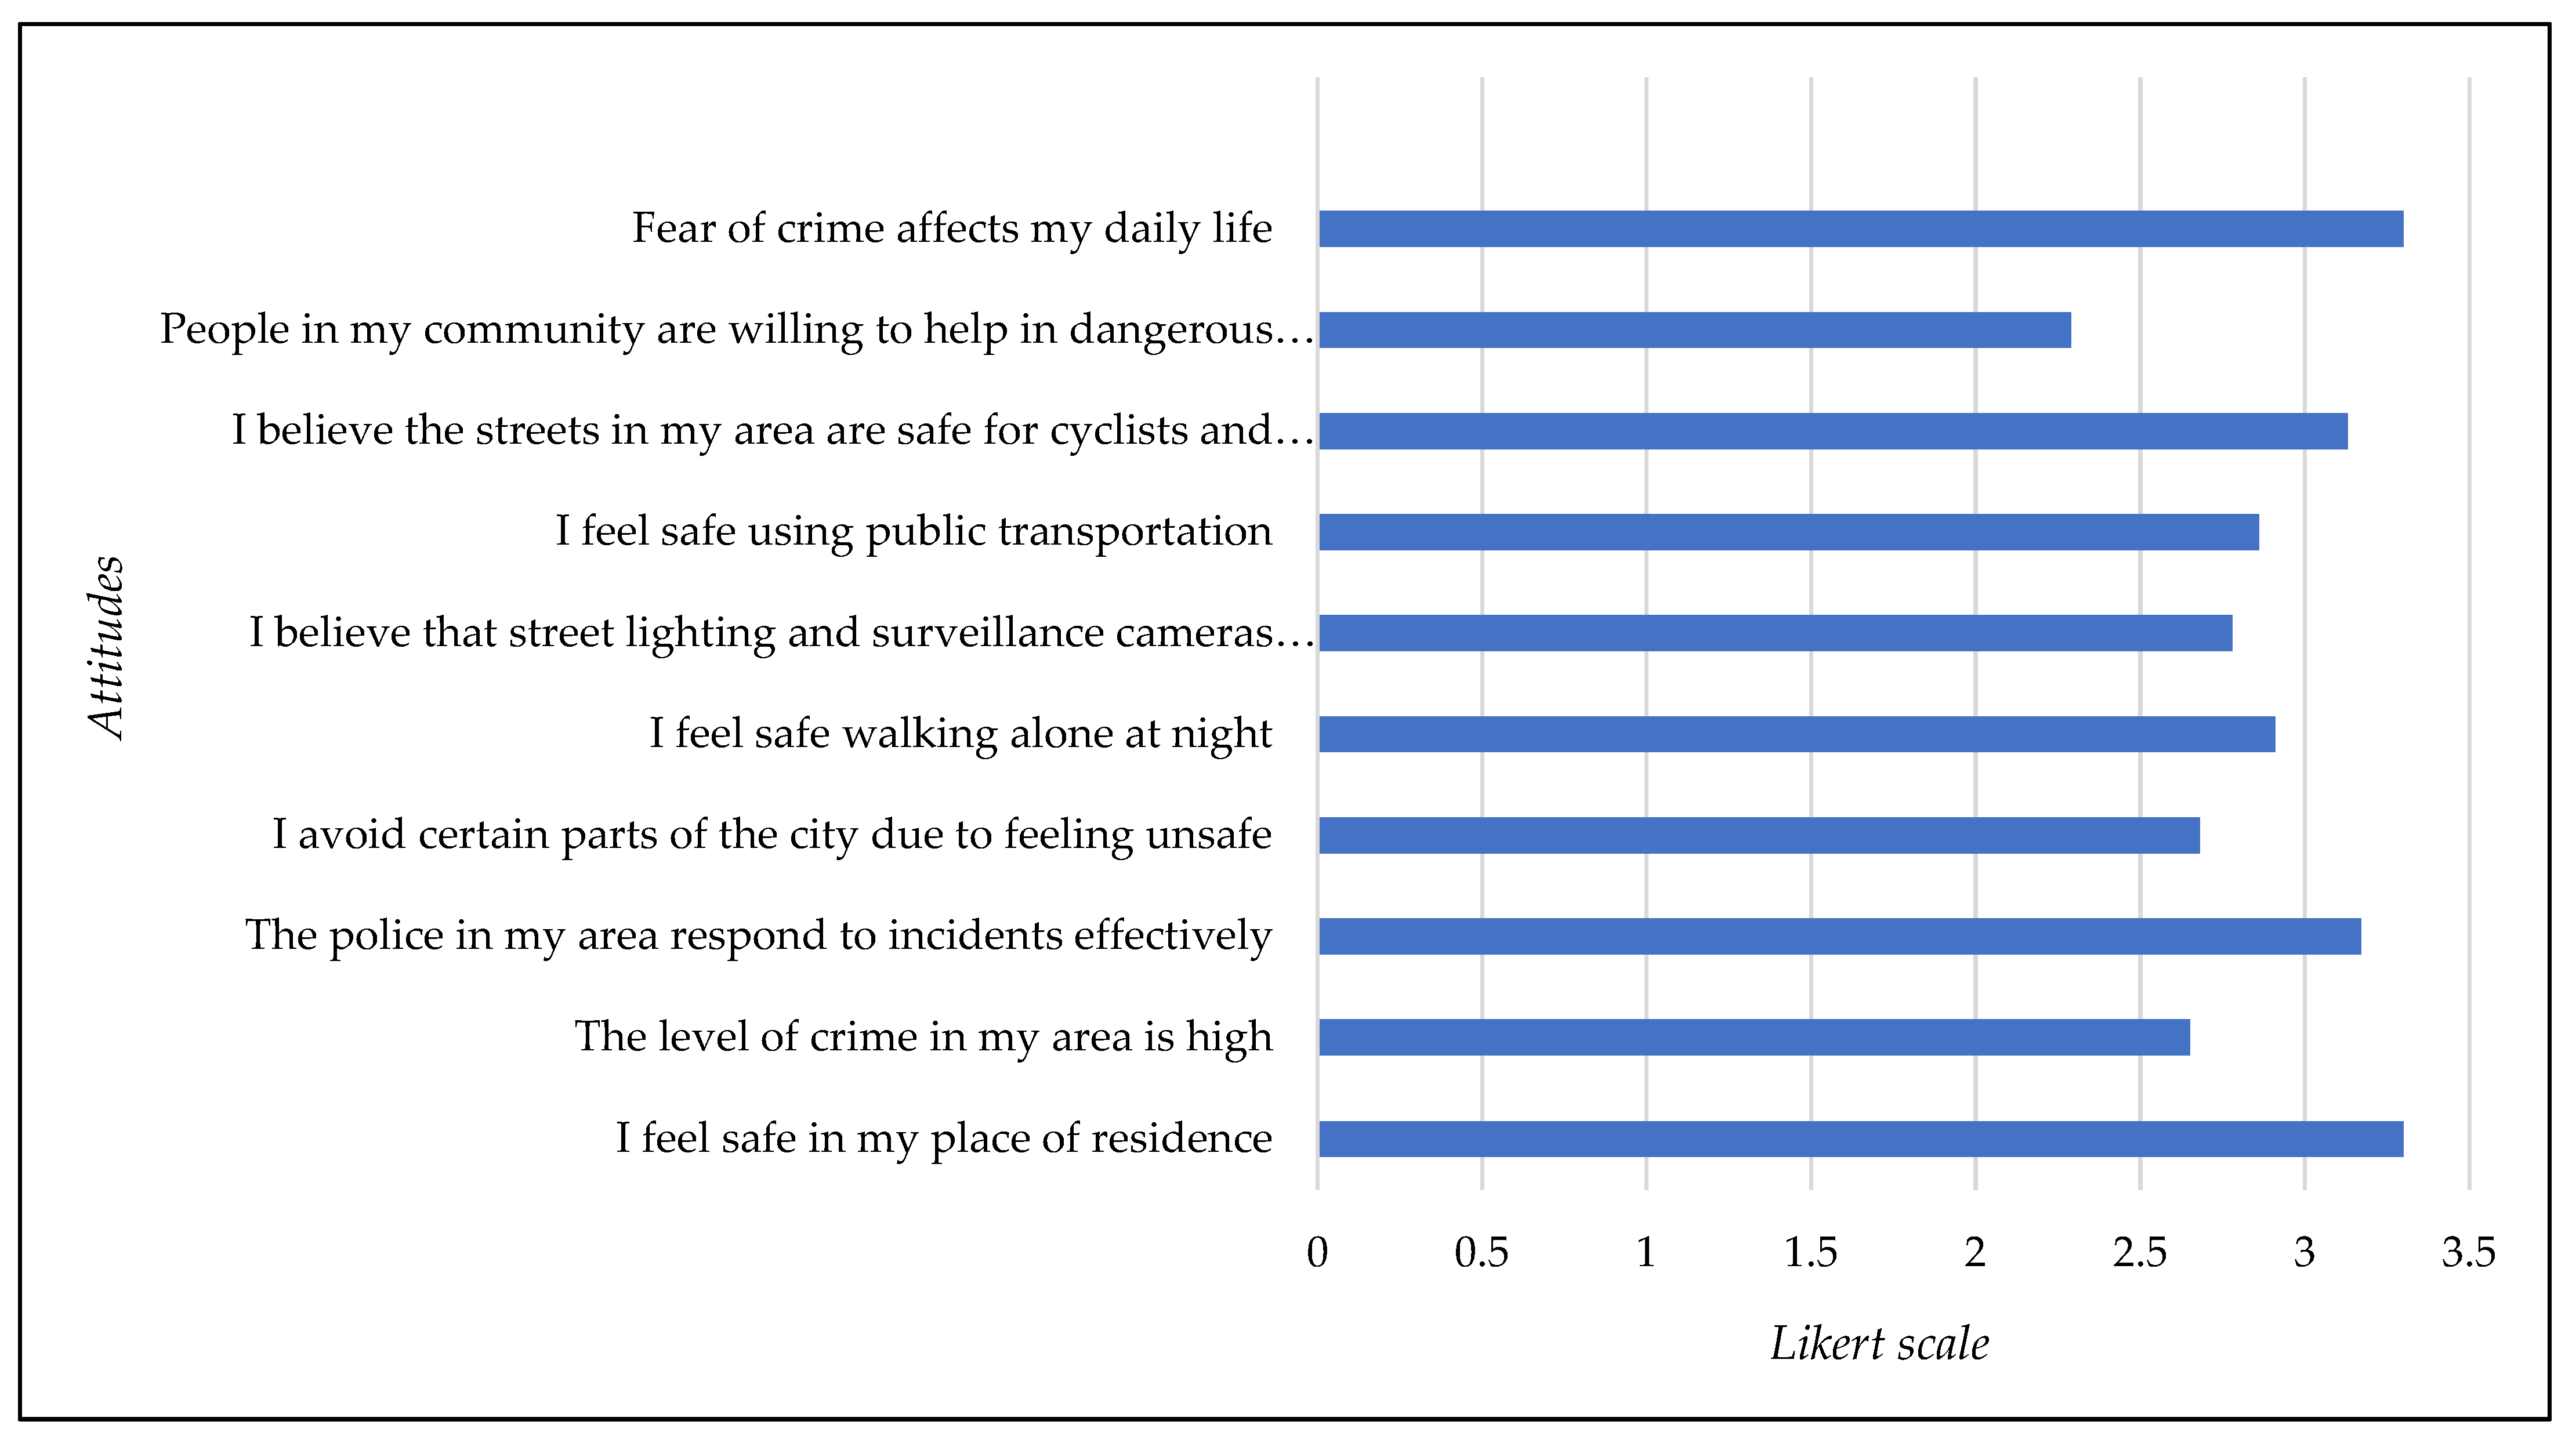
Figure 4.
Descriptive statistics on perceptions of safety at public events and demonstrations.
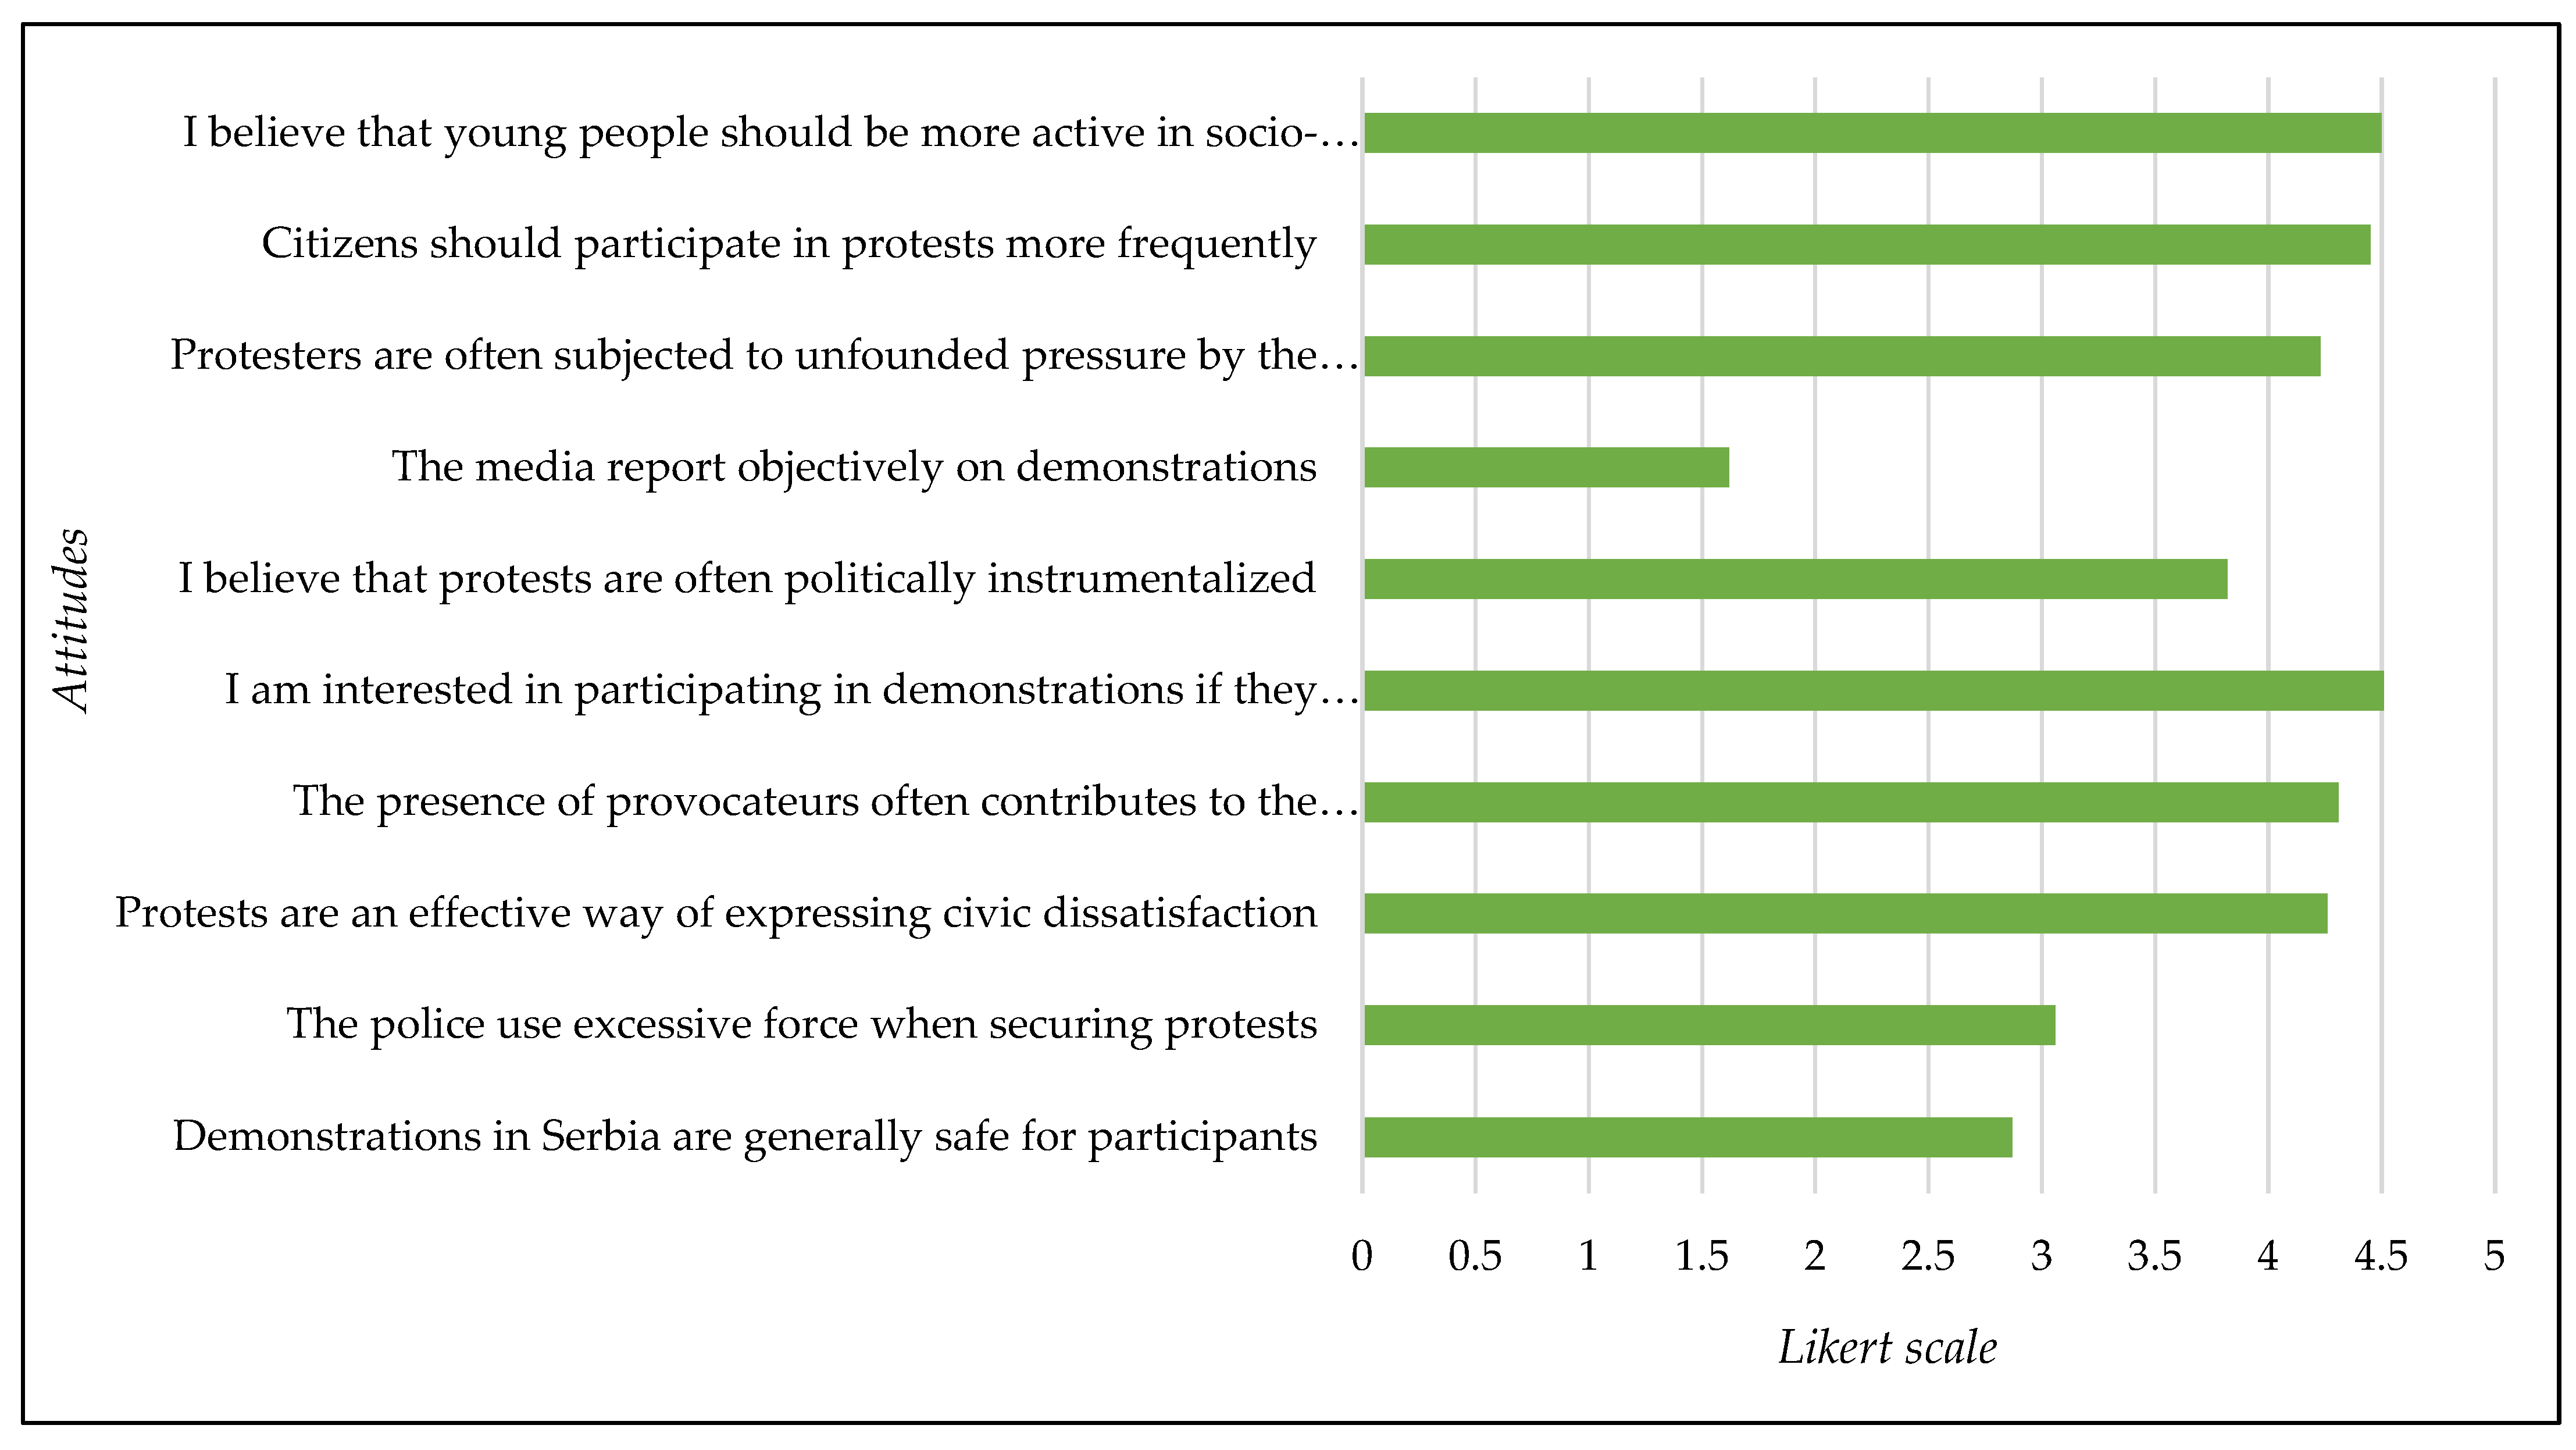
Figure 5.
Descriptive statistics on perceptions of national-level threats.
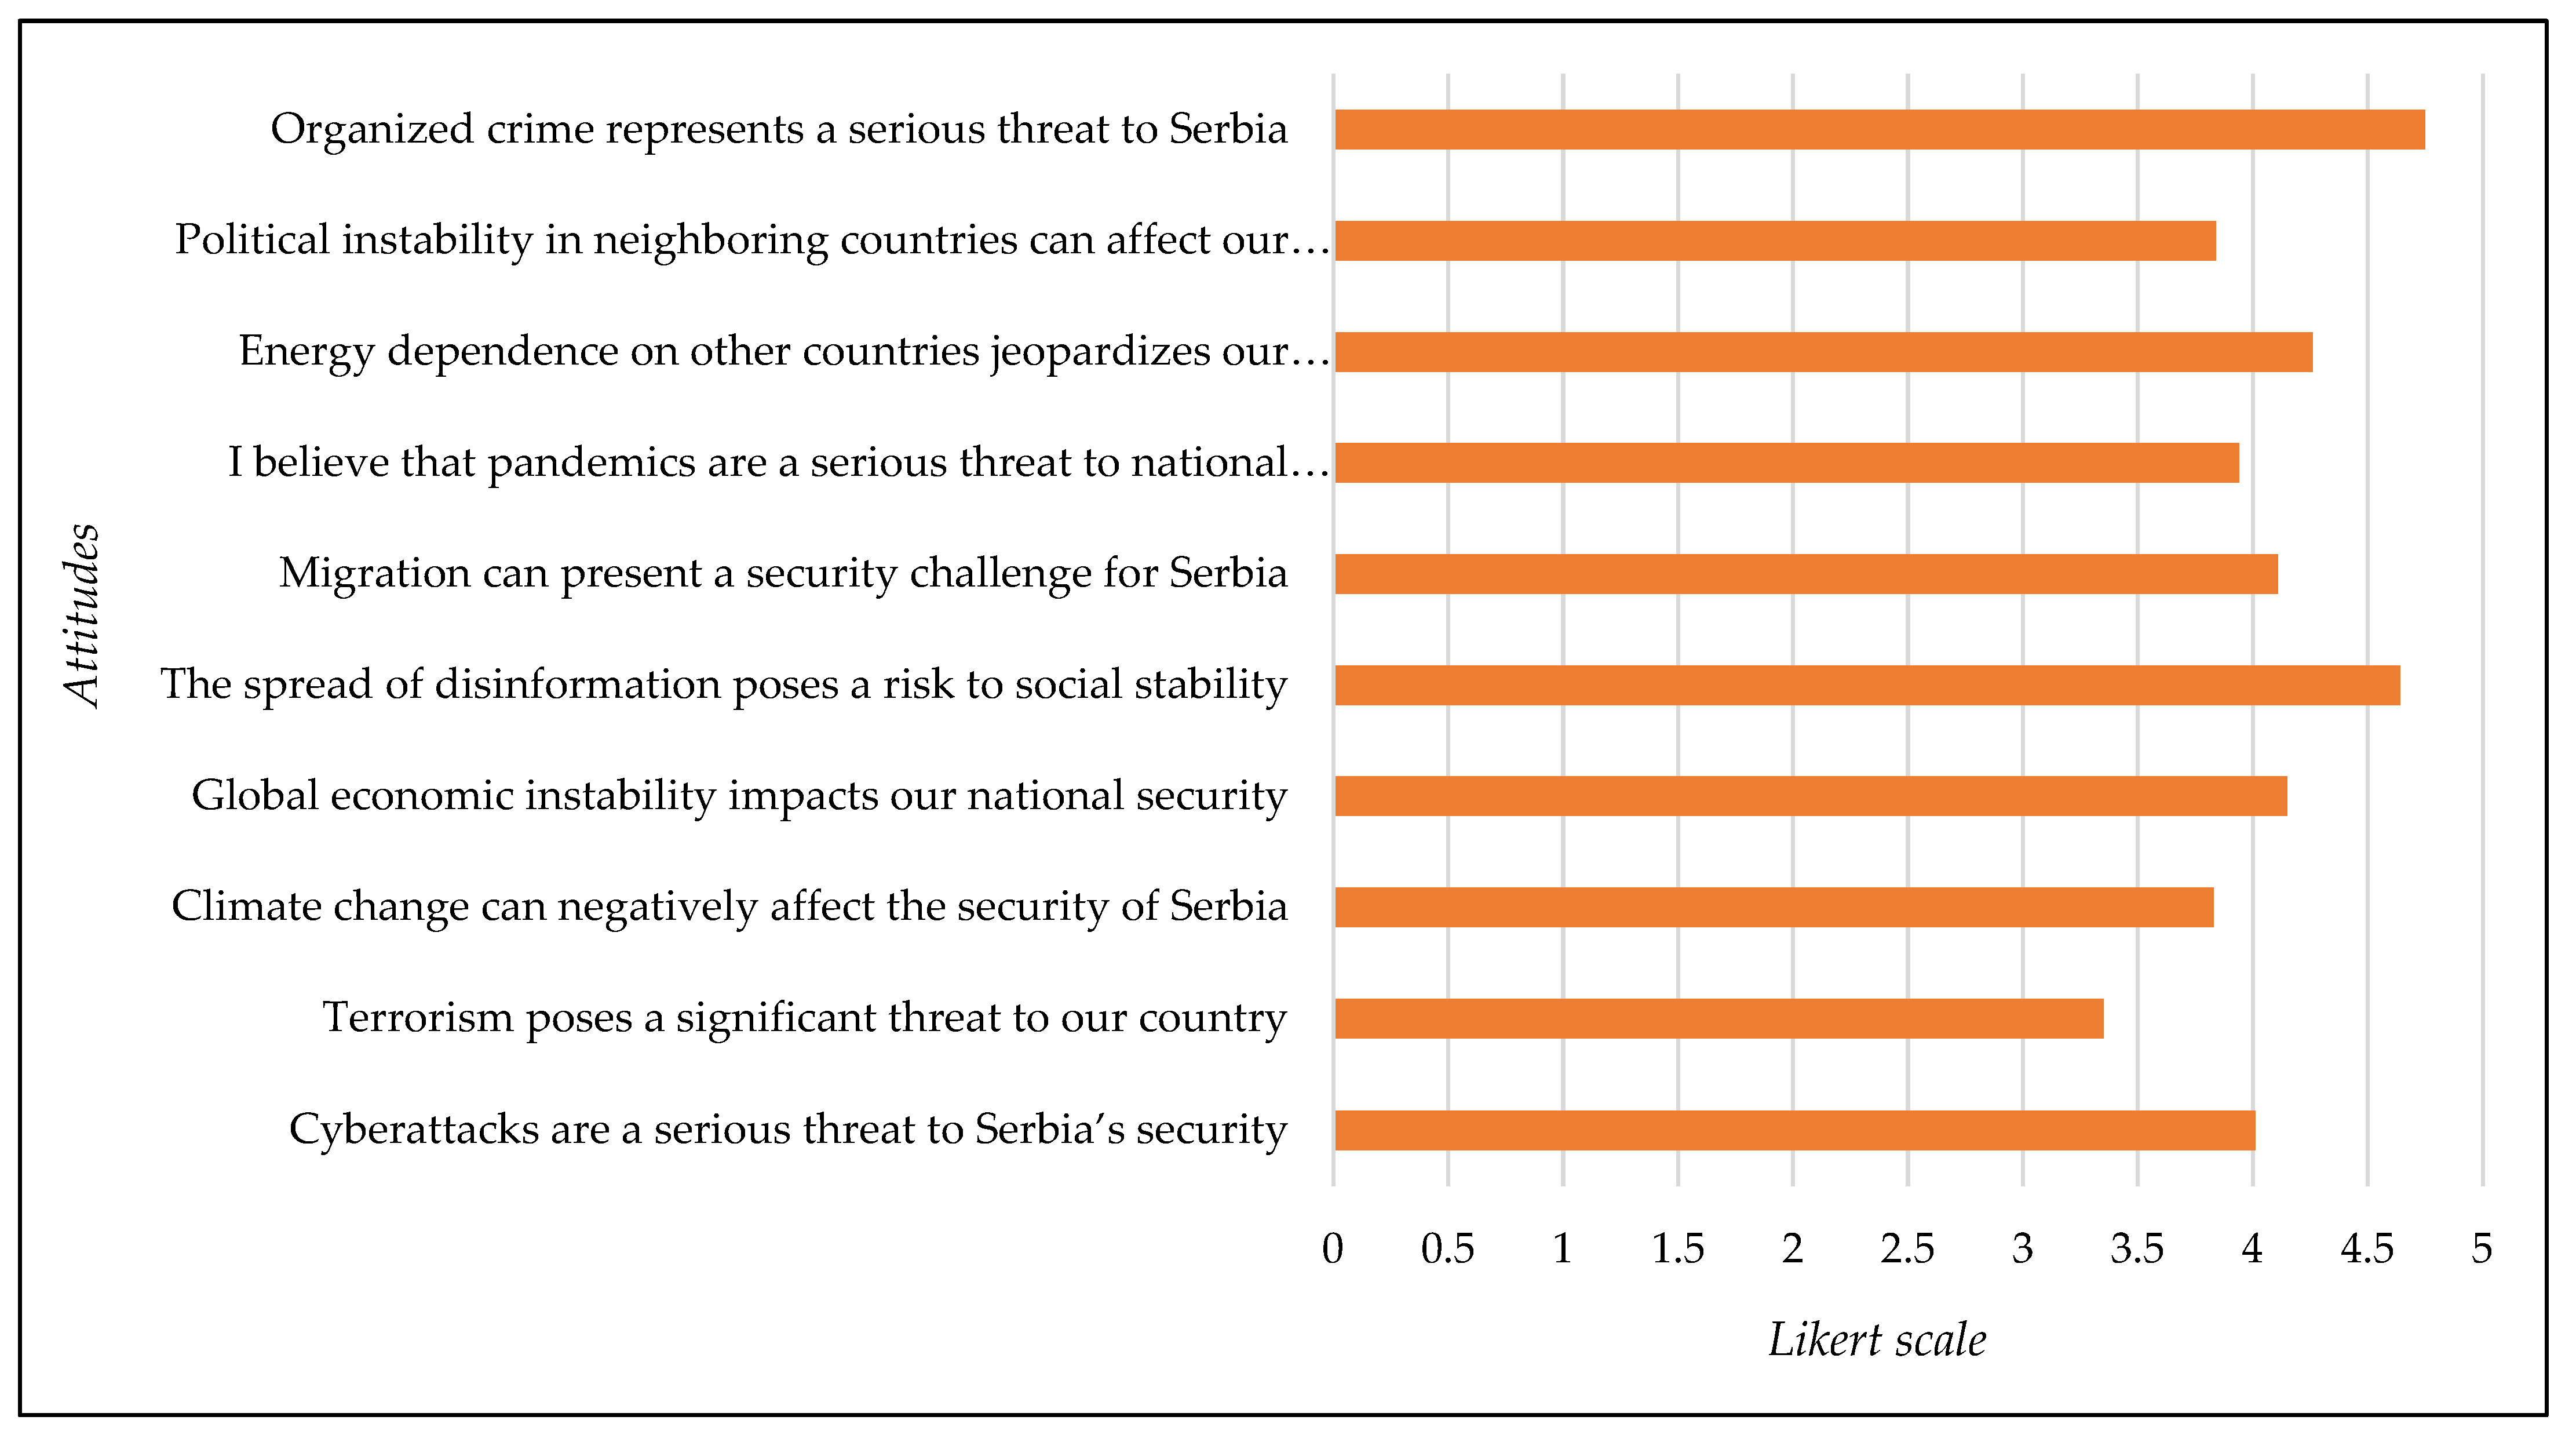
Figure 6.
Descriptive statistics on perceptions of digital security and privacy.
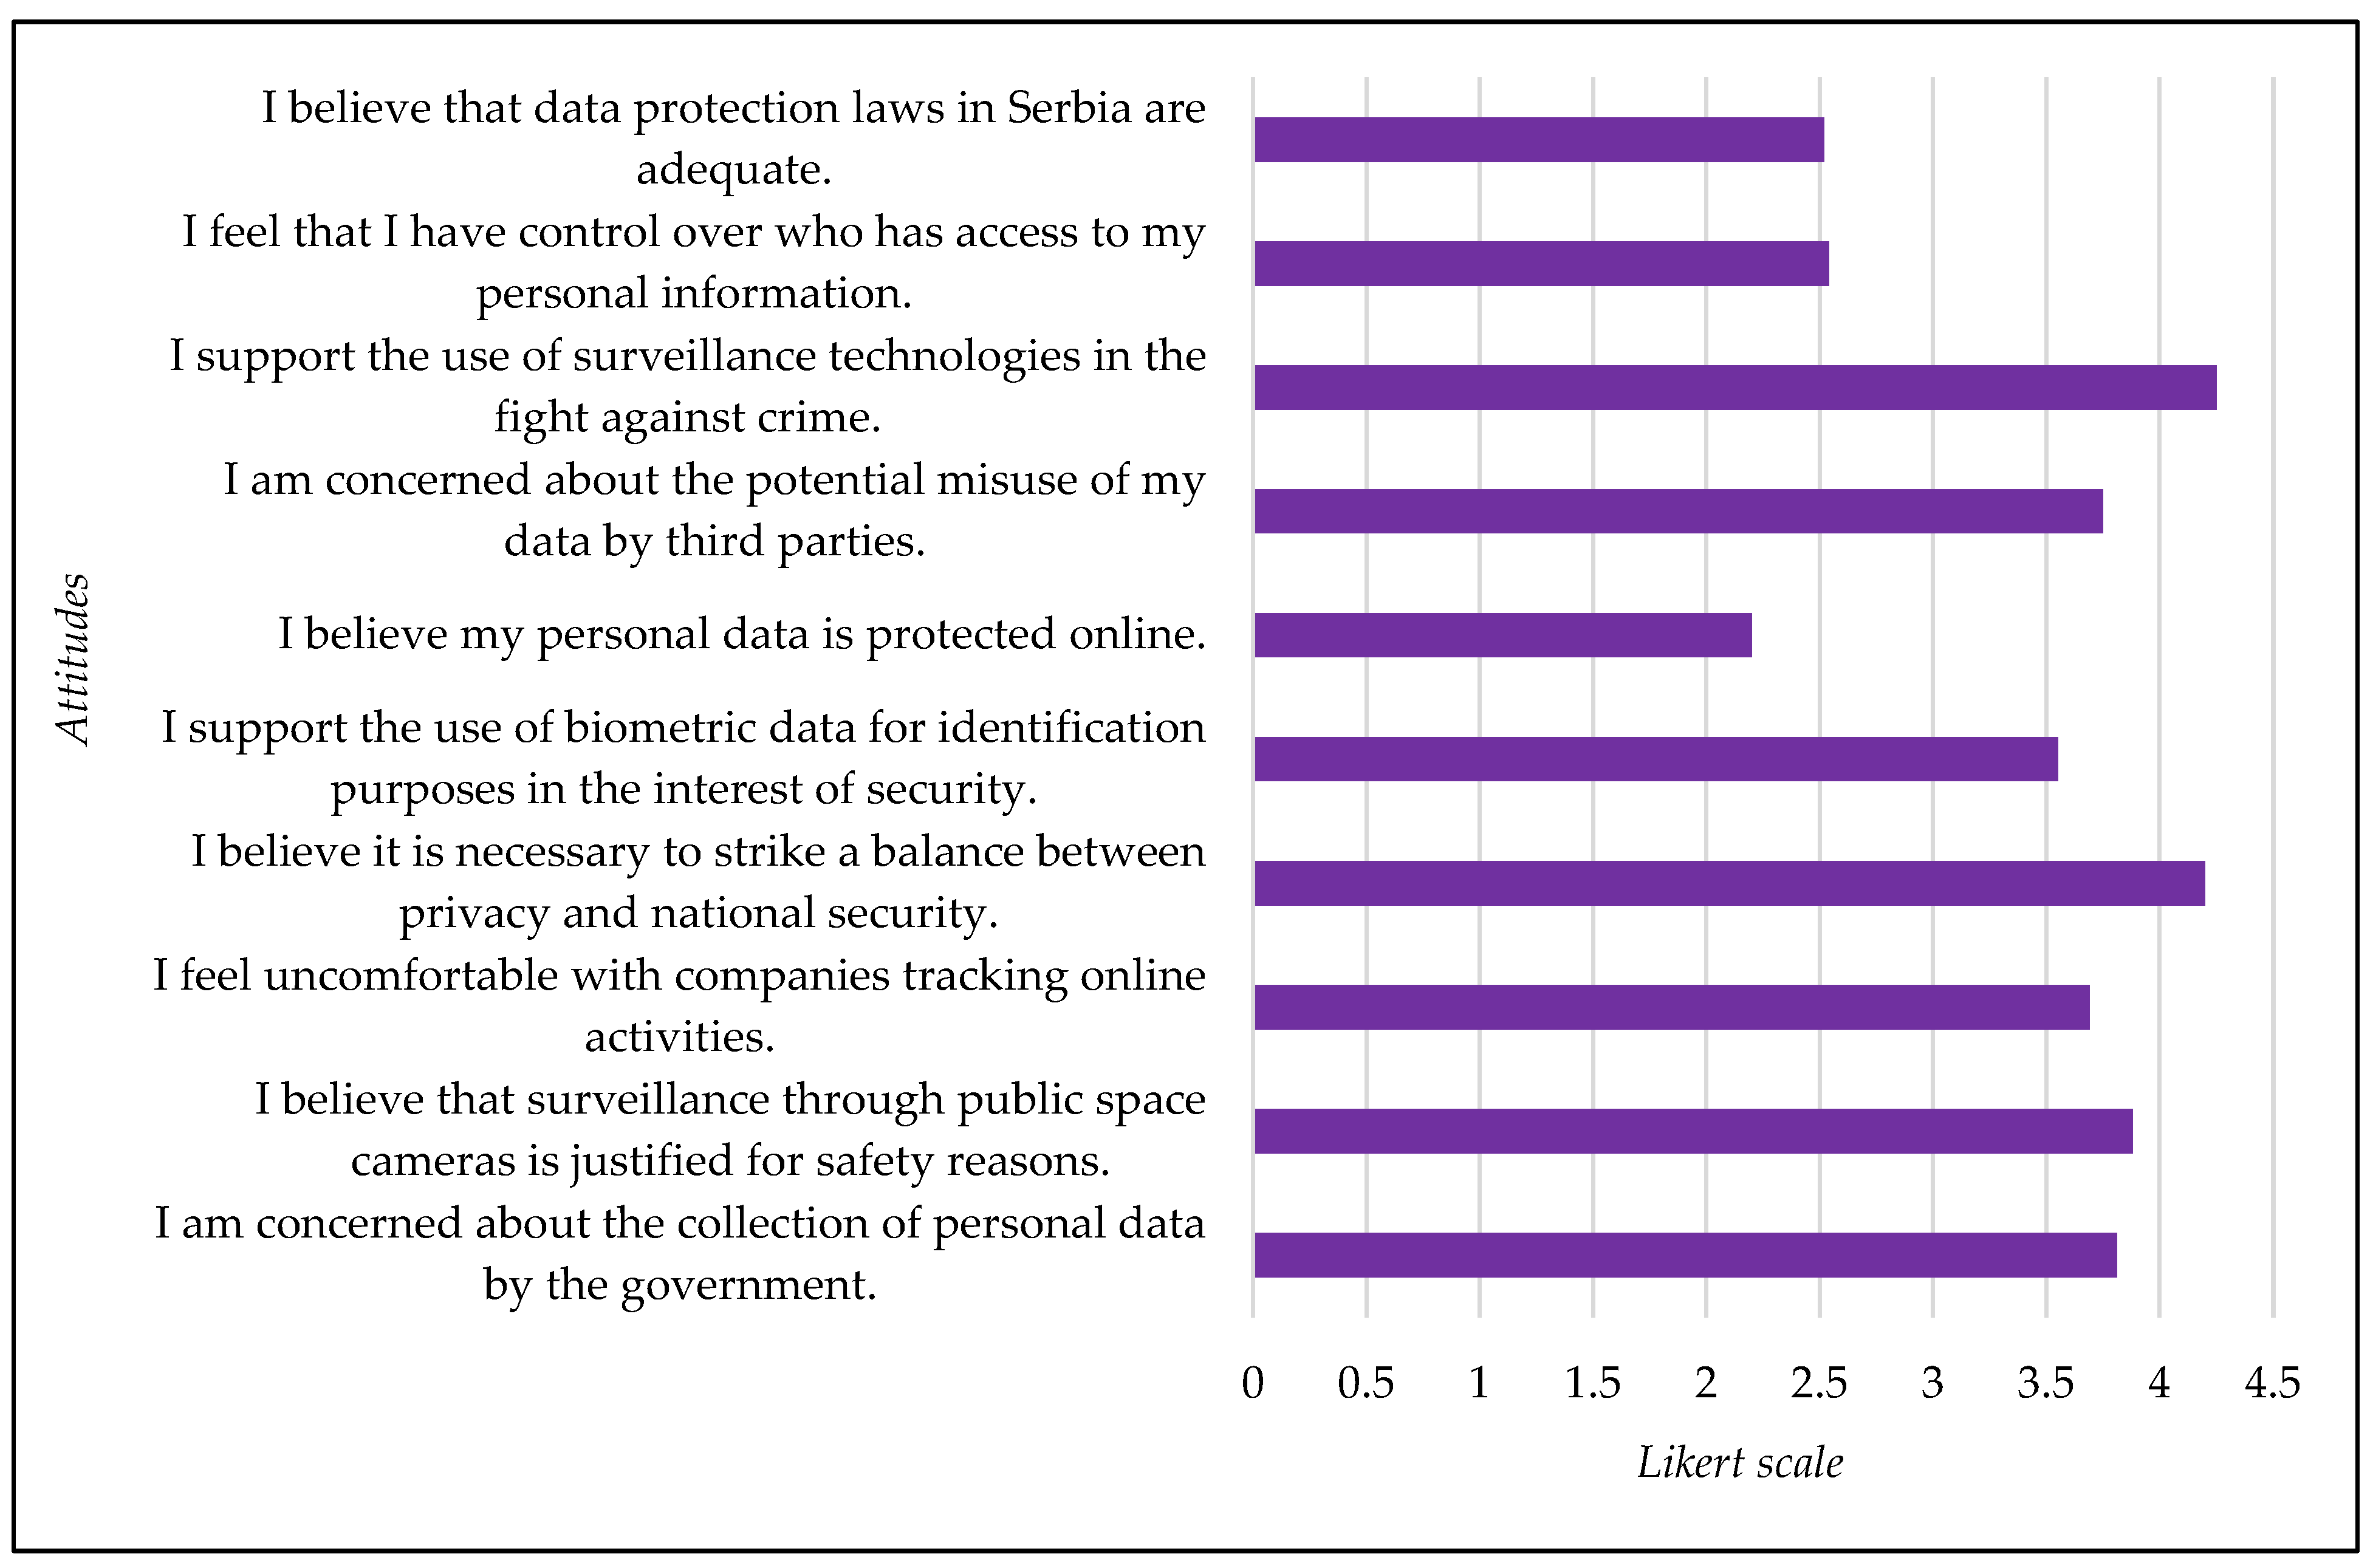
Figure 7.
Descriptive statistics on perceptions of disaster preparedness and crisis response.
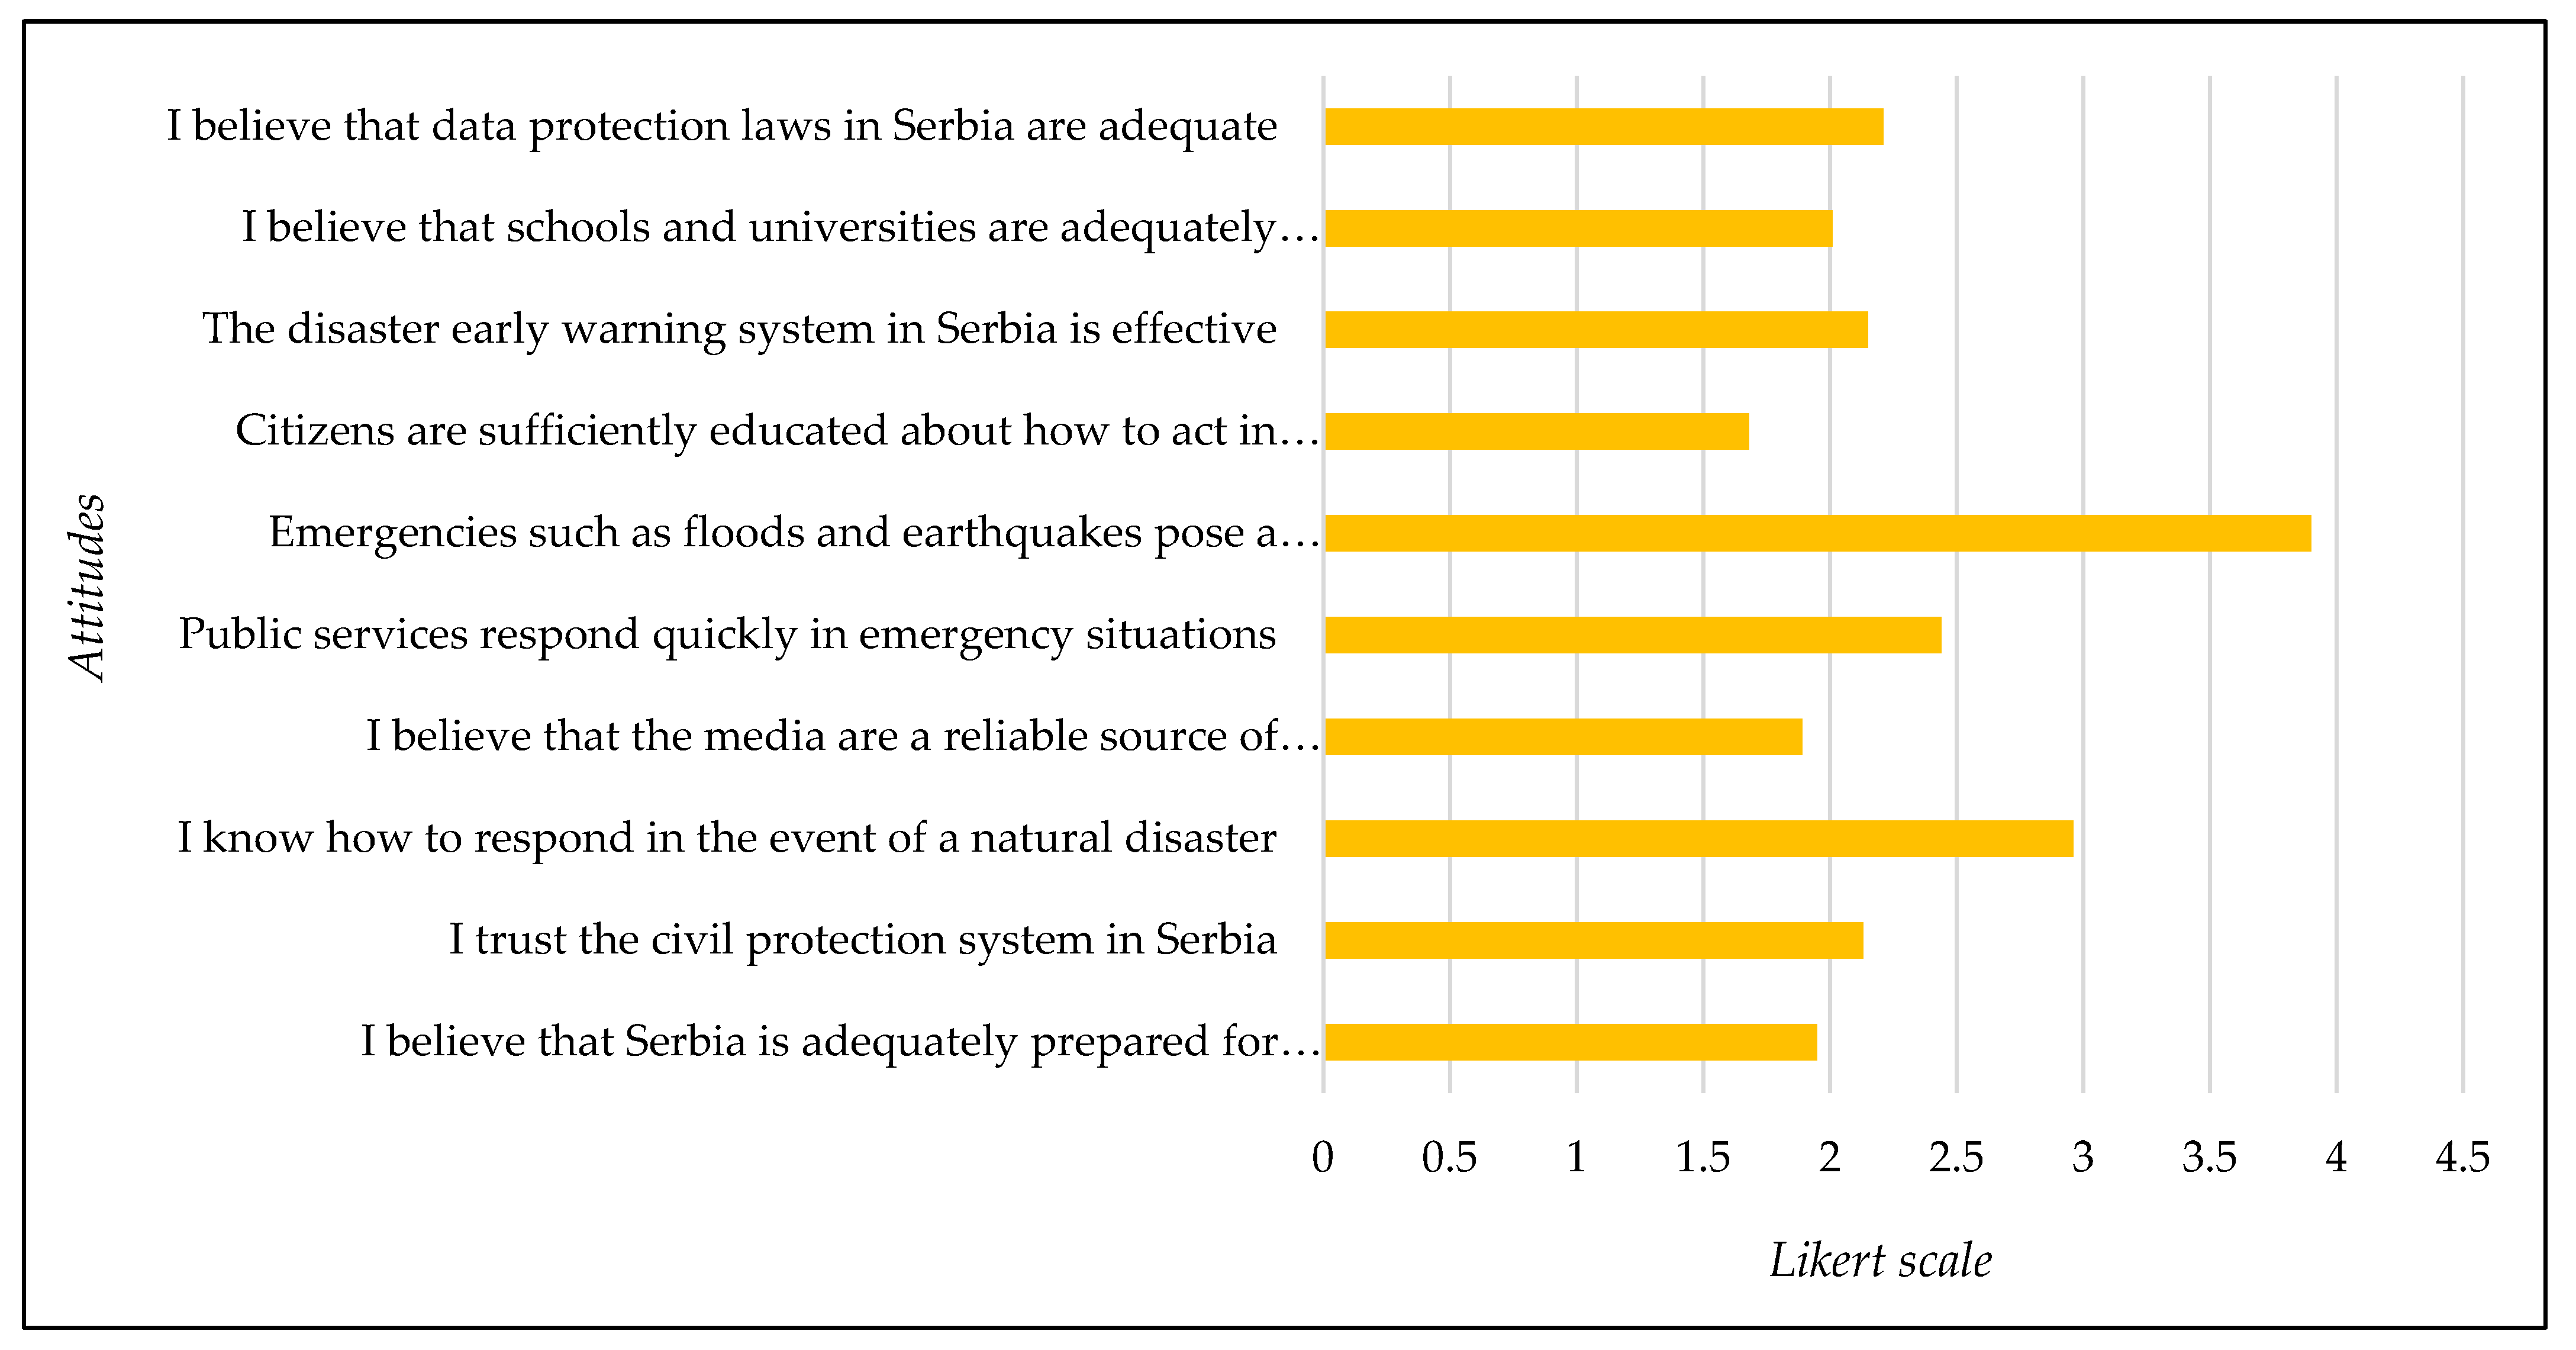
Table 1.
Basic socio-economic and demographic data (n = 406).
| Variables | Category | Total | |
|---|---|---|---|
| N | % | ||
| Gender | Male | 180 | 45 |
| Female | 220 | 55 | |
| Age | ≤20 | 57 | 14.04 |
| 21−23 | 134 | 33.00 | |
| 24−26 | 164 | 40.39 | |
| ≥27 | 51 | 12.56 | |
| Place of study | Belgrade | 215 | 52.96 |
| Novi Sad | 125 | 30.79 | |
| Kragujevac | 66 | 16.26 | |
| Study year | First | 84 | 20.59 |
| Second | 137 | 33.58 | |
| Third | 148 | 36.27 | |
| Fourth | 39 | 9.56 | |
| Type of attending institution | Public | 345 | 84.98 |
| Private | 61 | 15.02 | |
| Faculty (Field of Science) | Technical-technological sciences | 90 | 21.95 |
| Natural and mathematical sciences | 10 | 2.44 | |
| Medical sciences | 50 | 12.20 | |
| Social and humanistic sciences | 260 | 63.41 | |
| Current level of studies | Undergraduate academic studies | 311 | 76.60 |
| Master’s academic studies | 80 | 19.70 | |
| Doctoral studies | 15 | 3.69 | |
| Average grade during studies | 6.00−7.00 | 60 | 14.78 |
| 7.00−8.00 | 144 | 35.47 | |
| 8.00−9.00 | 130 | 32.02 | |
| 9.00−10.00 | 72 | 17.73 | |
| Number of household members | ≤2 | 42 | 10.53 |
| 3−4 | 243 | 60.90 | |
| ≥5 | 114 | 28.57 | |
| The family's material status | Significantly below average (≤500 EUR) | 67 | 16.14 |
| Below average (500−1000 EUR) | 106 | 25.54 | |
| Average (1001−2000 EUR) | 222 | 53.49 | |
| Above average (2001−4000 EUR) | 20 | 4.82 | |
| Participated in activities related to safety | Yes | 137 | 34.34 |
| No | 262 | 65.66 | |
| Sources of information on safety topics | Television | 131 | 19.6 |
| Online portals and social media | 222 | 33.2 | |
| Newspapers and magazines | 25 | 3.7 | |
| Official institutions and press releases | 108 | 16.1 | |
| Conversations with family and friends | 183 | 27.4 | |
| Frequencies of following safety news | Daily | 90 | 22.17 |
| Several times a week | 69 | 17.00 | |
| Occasionally | 170 | 41.87 | |
| Rarely or never | 77 | 18.97 | |
| Frequency of vote | Voted more often than abstained | 56 | 13.93 |
| Voted in all elections since obtaining the right | 246 | 61.19 | |
| Voted only once despite having multiple opportunities | 31 | 7.71 | |
| Have never voted | 35 | 8.71 | |
| Voted and abstained equally often | 34 | 8.46 | |
Table 2.
Descriptive statistics of youth perceptions of personal safety.
| Attitudes | М | SD |
|---|---|---|
| I feel safe in my place of residence | 3.30 | 1.28 |
| The level of crime in my area is high | 2.65 | 1.15 |
| The police in my area respond to incidents effectively | 3.17 | 1.52 |
| I avoid certain parts of the city due to feeling unsafe | 2.68 | 1.42 |
| I feel safe walking alone at night | 2.91 | 1.38 |
| I believe that street lighting and surveillance cameras have increased safety | 2.78 | 1.30 |
| I feel safe using public transportation | 2.86 | 1.32 |
| I believe the streets in my area are safe for cyclists and pedestrians | 3.13 | 1.07 |
| People in my community are willing to help in dangerous situations | 2.29 | 1.25 |
| Fear of crime affects my daily life | 3.32 | 1.28 |
| Total | 2.91 | 1.30 |
Note: M = Mean; SD = Standard Deviation.
Table 3.
Descriptive statistics on perceptions of safety at public events and demonstrations.
| Attitudes | М | SD |
|---|---|---|
| Demonstrations in Serbia are generally safe for participants | 2.87 | 1.24 |
| The police use excessive force when securing protests | 3.06 | 1.23 |
| Protests are an effective way of expressing civic dissatisfaction | 4.26 | 1.09 |
| The presence of provocateurs often contributes to the escalation of violence during protests | 4.31 | 0.98 |
| I am interested in participating in demonstrations if they advocate for critical social changes | 4.51 | 0.99 |
| I believe that protests are often politically instrumentalized | 3.82 | 1.05 |
| The media report objectively on demonstrations | 1.62 | 0.95 |
| Protesters are often subjected to unfounded pressure by the authorities | 4.23 | 1.02 |
| Citizens should participate in protests more frequently | 4.45 | 0.99 |
| I believe that young people should be more active in socio-political life | 4.50 | 0.88 |
| Total | 3.76 | 1.04 |
Note: M = Mean; SD = Standard Deviation.
Table 4.
Descriptive statistics on perceptions of national-level threats.
| Attitudes | М | SD |
|---|---|---|
| Cyberattacks are a serious threat to Serbia’s security | 4.01 | 1.07 |
| Terrorism poses a significant threat to our country | 3.35 | 1.30 |
| Climate change can negatively affect the security of Serbia | 3.83 | 1.26 |
| Global economic instability impacts our national security | 4.15 | 0.92 |
| The spread of disinformation poses a risk to social stability | 4.64 | 0.65 |
| Migration can present a security challenge for Serbia | 4.11 | 1.01 |
| I believe that pandemics are a serious threat to national security | 3.94 | 1.12 |
| Energy dependence on other countries jeopardizes our security | 4.26 | 0.88 |
| Political instability in neighboring countries can affect our security | 3.84 | 1.01 |
| Organized crime represents a serious threat to Serbia | 4.75 | 0.58 |
| Total | 4.19 | 0.98 |
Note: M = Mean; SD = Standard Deviation.
Table 5.
Descriptive statistics on perceptions of digital security and privacy.
| Attitudes | М | SD |
|---|---|---|
| I am concerned about the collection of personal data by the government. | 3.81 | 1.21 |
| I believe that surveillance through public space cameras is justified for safety reasons. | 3.88 | 1.11 |
| I feel uncomfortable with companies tracking online activities. | 3.69 | 1.21 |
| I believe it is necessary to strike a balance between privacy and national security. | 4.20 | 0.93 |
| I support the use of biometric data for identification purposes in the interest of security. | 3.55 | 1.14 |
| I believe my personal data is protected online. | 2.20 | 1.16 |
| I am concerned about the potential misuse of my data by third parties. | 3.75 | 1.21 |
| I support the use of surveillance technologies in the fight against crime. | 4.25 | 0.88 |
| I feel that I have control over who has access to my personal information. | 2.54 | 1.29 |
| I believe that data protection laws in Serbia are adequate. | 2.52 | 1.10 |
Note: M = Mean; SD = Standard Deviation.
Table 6.
Descriptive statistics on perceptions of disaster preparedness and crisis response.
| Attitudes | М | SD |
|---|---|---|
| I believe that Serbia is adequately prepared for emergencies | 1.95 | 1.00 |
| I trust the civil protection system in Serbia | 2.13 | 1.10 |
| I know how to respond in the event of a natural disaster | 2.96 | 1.26 |
| I believe that the media are a reliable source of information during crises | 1.89 | 1.06 |
| Public services respond quickly in emergency situations | 2.44 | 1.17 |
| Emergencies such as floods and earthquakes pose a serious risk in Serbia | 3.90 | 1.11 |
| Citizens are sufficiently educated about how to act in crisis situations | 1.68 | 0.88 |
| The disaster early warning system in Serbia is effective | 2.15 | 1.12 |
| I believe that schools and universities are adequately prepared for crisis situations | 2.01 | 1.03 |
| I believe that data protection laws in Serbia are adequate | 2.21 | 1.08 |
| Total | 2.43 | 1.08 |
Note: M = Mean; SD = Standard Deviation.
Table 7.
Descriptive statistics on perceptions of institutional confidence and trust in security policy.
Table 7.
Descriptive statistics on perceptions of institutional confidence and trust in security policy.
| Attitudes | М | SD |
|---|---|---|
| I trust the work of the police when it comes to protecting citizens | 2.21 | 1.18 |
| The judiciary in Serbia effectively punishes criminals | 1.60 | 0.90 |
| I believe that institutions protect the rights of citizens | 1.77 | 0.97 |
| The government adopts adequate measures to preserve national security | 1.81 | 1.00 |
| Transparency in the work of state institutions is at a high level | 1.44 | 0.83 |
| I believe the state allocates resources for national security properly | 1.70 | 0.97 |
| Political stability directly affects the level of security in the country | 4.07 | 1.24 |
| Serbia’s military power adequately protects its citizens | 2.43 | 1.13 |
| Citizens are sufficiently involved in the creation of security policies | 1.78 | 0.96 |
| The media report objectively on security issues | 2.21 | 1.18 |
| Total | 2.30 | 1.04 |
Note: M = Mean; SD = Standard Deviation.
Table 8.
Independent samples t-test findings on gender disparities in six thematic subsections variables (n = 406).
Table 8.
Independent samples t-test findings on gender disparities in six thematic subsections variables (n = 406).
| Variable | F | t | Sig. (2-Tailed) |
df | Male M (SD) |
Female M (SD) |
|---|---|---|---|---|---|---|
| 1. Perceptions of personal safety | 1.06 | 2.49 | 0.01** | 397 | 2.97 (0.53) | 2.72 (0.50) |
| 2. Perceptions of safety at public events and demonstrations | 1.39 | –0.91 | 0.36 | 397 | 3.72 (0.55) | 3.77 (0.49) |
| 3. Perceptions of national-level threats | 1.66 | –1.50 | 0.13 | 397 | 4.01 (0.62) | 4.11 (0.57) |
| 4. Perceptions of digital security and privacy | 1.51 | –1.71 | 0.08 | 397 | 3.36 (0.52) | 3.46 (0.49) |
| 5. Perceptions of disaster preparedness and crisis response | 0.67 | 0.35 | 0.72 | 397 | 2.35 (0.70) | 2.32 (0.65) |
| 6. Perceptions of institutional confidence and trust in security policy | 0.158 | 0.176 | 0.86 | 397 | 2.02 (0.72) | 2.01 (0.67) |
Note: * p ≤ 0.05; ** p ≤ 0.01.
Table 9.
Independent samples t-test findings on gender differences in individual items measuring youth perceptions of personal safety (n = 406).
Table 9.
Independent samples t-test findings on gender differences in individual items measuring youth perceptions of personal safety (n = 406).
| Variable | F | t | Sig. (2-Tailed) | df | Male M (SD) | Female M (SD) |
|---|---|---|---|---|---|---|
| I feel safe in my place of residence | 0.58 | 2.92 | 0.00** | 398 | 4.07 (1.11) | 3.70 (1.11) |
| The level of crime in my area is high | 2.47 | –2.67 | 0.00** | 397 | 3.00 (1.25) | 3.40 (1.28) |
| The police in my area respond | 0.01 | 0.34 | 0.73 | 397 | 2.66 (1.14) | 2.62 (1.14) |
| I avoid certain parts of the city due to feeling unsafe | 0.09 | –4.05 | 0.00** | 397 | 2.62 (1.48) | 3.33 (1.51) |
| I feel safe walking alone at night | 0.10 | 7.65 | 0.00** | 397 | 3.58 (1.34) | 2.40 (1.33) |
| I believe that street lighting and surveillance | 0.61 | 2.18 | 0.03* | 397 | 3.17 (1.42) | 2.82 (1.37) |
| I feel safe using public transportation | 1.51 | 7.07 | 0.00** | 397 | 3.55 (1.31) | 2.54 (1.20) |
| I believe the streets in my area are safe | 2.63 | 1.24 | 0.21 | 397 | 3.01 (1.41) | 2.82 (1.29) |
| People in my community are willing | 1.67 | 0.27 | 0.78 | 397 | 3.15 (1.12) | 3.12 (1.06) |
| Fear of crime affects my daily life | 1.07 | –2.62 | 0.00** | 397 | 1.99 (1.24) | 2.37 (1.24) |
Note: * p ≤ 0.05; ** p ≤ 0.01.
Table 10.
Independent samples t-test findings on type of attending institution in six thematic subsections variables (n = 406).
Table 10.
Independent samples t-test findings on type of attending institution in six thematic subsections variables (n = 406).
| Variable | F | t | Sig. (2-Tailed) |
df | Male M (SD) |
Female M (SD) |
|---|---|---|---|---|---|---|
| 1. Perceptions of personal safety | 0.095 | -0.415 | 0.679 | 397 | 2.86 (0.51) | 2.90 (0.52) |
| 2. Perceptions of safety at public events and demonstrations | 1.288 | 1.429 | 0.154 | 397 | 3.77 (0.50) | 3.64 (0.60) |
| 3. Perceptions of national-level threats | 0.917 | 1.064 | 0.288 | 397 | 4.10 (0.59) | 3.98 (0.50) |
| 4. Perceptions of digital security and privacy | 1.129 | -0.682 | 0.496 | 397 | 3.43 (0.51) | 3.49 (0.43) |
| 5. Perceptions of disaster preparedness and crisis response | 0.007 | -0.207 | 0.836 | 397 | 2.33 (0.66) | 2.35 (0.68) |
| 6. Perceptions of institutional confidence and trust in security policy | 0.015 | -0.800 | 0.424 | 397 | 2.01 (0.69) | 2.10 (0.65) |
Note: * p ≤ 0.05; ** p ≤ 0.01.
Table 11.
Independent samples t-test findings on participation in safety-related activities in six thematic subsections variables (n = 406).
Table 11.
Independent samples t-test findings on participation in safety-related activities in six thematic subsections variables (n = 406).
| Variable | F | t | Sig. (2-Tailed) |
df | Male M (SD) |
Female M (SD) |
|---|---|---|---|---|---|---|
| 1. Perceptions of personal safety | 0.002 | -1.282 | 0.201 | 396 | 2.82 (0.51) | 2.89 (0.51) |
| 2. Perceptions of safety at public events and demonstrations | 0.287 | 0.030 | 0.976 | 396 | 3.76 (0.54) | 3.76 (0.49) |
| 3. Perceptions of national-level threats | 2.708 | 0.678 | 0.498 | 396 | 4.12 (0.55) | 4.07 (0.60) |
| 4. Perceptions of digital security and privacy | 0.647 | -2.970 | 0.003 | 396 | 3.33 (0.52) | 3.48 (0.48) |
| 5. Perceptions of disaster preparedness and crisis response | 2.127 | -1.296 | 0.196 | 396 | 2.27 (0.60) | 2.36 (0.69) |
| 6. Perceptions of institutional confidence and trust in security policy | 0.002 | -0.797 | 0.426 | 396 | 1.97 (0.66) | 2.03 (0.70) |
Note: * p ≤ 0.05; ** p ≤ 0.01.
Table 16.
The one-way ANOVA results examine the relationship between place of study, faculty (field of science), current level of studies, the family's material status, and six thematic subsection variables (n = 406).
Table 16.
The one-way ANOVA results examine the relationship between place of study, faculty (field of science), current level of studies, the family's material status, and six thematic subsection variables (n = 406).
| Variables | Place of study | Faculty (field of science) | Level of studies | Family's material status | ||||
| F | p | F | p | F | p | F | p | |
| Personal Safety | 2.868 | 0.048* | 0.520 | 0.668 | 1.004 | 0.367 | 0.541 | 0.654 |
| Safety at public events and demonstrations | 0.248 | 0.780 | 1.530 | 0.206 | 2.605 | 0.075 | 3.386 | 0.018* |
| National-level threats | 2.939 | 0.044* | 1.321 | 0.267 | 0.436 | 0.647 | 0.704 | 0.550 |
| Digital security and privacy | 1.321 | 0.268 | 0.249 | 0.862 | 1.981 | 0.139 | 0.204 | 0.893 |
| Disaster preparedness and crisis response | 1.346 | 0.262 | 3.885 | 0.009* | 1.046 | 0.352 | 1.084 | 0.355 |
| Institutional confidence and trust | 0.786 | 0.456 | 6.240 | 0.000** | 0.600 | 0.550 | 2.707 | 0.045* |
Note: * p ≤ 0.05; ** p ≤ 0.01.
Table 17.
The one-way ANOVA results examine the relationship between sources of information on safety topics, the frequency of following safety news, the frequency of voting, and six thematic subsection variables (n = 406).
Table 17.
The one-way ANOVA results examine the relationship between sources of information on safety topics, the frequency of following safety news, the frequency of voting, and six thematic subsection variables (n = 406).
| Variables | Information source | Following safety news | Frequency of voting | |||
| F | p | F | p | F | p | |
| Personal Safety | 1.311 | 0.265 | 2.948 | 0.033* | 2.420 | 0.048* |
| Safety at public events and demonstrations | 0.291 | 0.884 | 0.995 | 0.395 | 1.052 | 0.380 |
| National-level threats | 1.349 | 0.251 | 0.834 | 0.476 | 1.021 | 0.396 |
| Digital security and privacy | 4.065 | 0.003* | 0.749 | 0.524 | 1.874 | 0.114 |
| Disaster preparedness and crisis response | 8.411 | 0.000** | 0.767 | 0.513 | 2.285 | 0.060 |
| Institutional confidence and trust in security | 7.344 | 0.000** | 0.962 | 0.411 | 2.647 | 0.033* |
Note: * p ≤ 0.05; ** p ≤ 0.01.
Table 18.
Results of a multivariate regression analysis concerning six thematic subsections variables (n = 406).
Table 18.
Results of a multivariate regression analysis concerning six thematic subsections variables (n = 406).
|
Predictor Variable |
Personal safety |
Safety at public events |
National-level threats |
Digital security and privacy |
Disaster preparedness, crisis response |
Institutional confidence and trust |
||||||||||||
| B | SE | β | B | SE | β | B | SE | β | B | SE | β | B | SE | β | B | SE | β | |
| Gender | 0.135 | 0.061 | 0.113* | -0.069 | 0.061 | -0.058 | -0.124 | 0.070 | -0.092 | -0.082 | 0.059 | -0.070 | 0.032 | 0.078 | 0.021 | 0.016 | 0.080 | 0.010 |
| Age | 0.053 | 0.061 | 0.047 | 0.065 | 0.060 | 0.059 | -0.054 | 0.070 | -0.042 | 0.036 | 0.059 | 0.033 | -0.028 | 0.078 | -0.019 | 0.092 | 0.080 | 0.061 |
| Study location | -0.138 | 0.092 | -0.078 | -0.083 | 0.092 | -0.047 | -0.180 | 0.106 | -0.089 | -0.137 | 0.090 | -0.079 | 0.097 | 0.118 | 0.042 | -0.033 | 0.122 | -0.014 |
| Study year | -0.031 | 0.089 | -0.018 | 0.098 | 0.088 | 0.058 | 0.111 | 0.102 | 0.056 | -0.086 | 0.086 | -0.051 | -0.020 | 0.113 | -0.009 | -0.129 | 0.117 | -0.055 |
| Institution type | 0.075 | 0.067 | 0.060 | -0.073 | 0.067 | -0.058 | -0.021 | 0.077 | -0.014 | 0.015 | 0.065 | 0.012 | 0.161 | 0.085 | 0.097 | 0.226 | 0.089 | 0.133 |
| Field of study | -0.095 | 0.084 | -0.061 | 0.027 | 0.083 | 0.017 | 0.067 | 0.096 | 0.038 | 0.051 | 0.081 | 0.033 | 0.035 | 0.107 | 0.017 | -0.062 | 0.111 | -0.030 |
| Study level | 0.013 | 0.056 | 0.012 | -0.009 | 0.056 | -0.008 | -0.017 | 0.065 | -0.014 | -0.054 | 0.055 | -0.051 | 0.043 | 0.072 | 0.031 | 0.027 | 0.075 | 0.018 |
| Average grade | 0.035 | 0.084 | 0.021 | 0.025 | 0.083 | 0.015 | 0.032 | 0.096 | 0.017 | -0.131 | 0.081 | -0.080 | -0.152 | 0.107 | -0.069 | -0.030 | 0.111 | -0.013 |
| Household size | -0.039 | 0.071 | -0.028 | -0.145 | 0.070 | -0.107 | -0.078 | 0.081 | -0.050 | 0.040 | 0.069 | 0.030 | -0.141 | 0.090 | -0.079 | -0.202 | 0.094 | -0.109 |
| Economic status | -0.081 | 0.057 | -0.075 | 0.018 | 0.056 | 0.017* | 0.035 | 0.065 | 0.028 | -0.151 | 0.055 | -0.143 | -0.081 | 0.072 | -0.058 | -0.035 | 0.075 | -0.024 |
| Safety involvement | 0.077 | 0.054 | 0.072 | -0.053 | 0.053 | -0.051 | 0.067 | 0.062 | 0.055 | 0.094 | 0.052 | 0.090* | 0.315 | 0.068 | 0.226* | 0.280 | 0.071 | 0.195 |
| Safety sources | 0.115 | 0.079 | 0.076 | -0.061 | 0.078 | -0.040 | 0.128 | 0.090 | 0.074 | 0.073 | 0.076 | 0.049 | 0.077 | 0.100 | 0.039* | -0.021 | 0.104 | -0.010* |
| Safety news | 0.135 | 0.061 | 0.113 | -0.069 | 0.061 | -0.058 | -0.124 | 0.070 | -0.092 | -0.082 | 0.059 | -0.070 | 0.032 | 0.078 | 0.021 | 0.016 | 0.080 | 0.010 |
| Voting frequency | 0.053 | 0.061 | 0.047 | 0.065 | 0.060 | 0.059 | -0.054 | 0.070 | -0.042 | 0.036 | 0.059 | 0.033 | -0.028 | 0.078 | -0.019 | 0.092 | 0.080 | 0.061 |
| R2 | 0.045 (0.016) | 0.031 (0.01) | 0.029 (-0.001) | 0.063 (0.034) | 0.086 (0.058) | 0.079 (0.051) | ||||||||||||
* p ≤ 0.05; ** p ≤ 0.01; B: unstandardized (B) coefficients; SE: std. error; β: standardised (β) coefficients. Note: male, up to 20 years old, from Belgrade, enrolled at a public university, studying social and humanistic sciences, average grade up to 7.0, significantly below-average material status, participated in activities related to safety, follows safety-related news daily, uses television as the primary source of information, votes more often than abstains — have been coded as 1; 0 has been assigned otherwise.
Disclaimer/Publisher’s Note: The statements, opinions and data contained in all publications are solely those of the individual author(s) and contributor(s) and not of MDPI and/or the editor(s). MDPI and/or the editor(s) disclaim responsibility for any injury to people or property resulting from any ideas, methods, instructions or products referred to in the content. |
© 2025 by the authors. Licensee MDPI, Basel, Switzerland. This article is an open access article distributed under the terms and conditions of the Creative Commons Attribution (CC BY) license (http://creativecommons.org/licenses/by/4.0/).
Copyright: This open access article is published under a Creative Commons CC BY 4.0 license, which permit the free download, distribution, and reuse, provided that the author and preprint are cited in any reuse.


