
Submitted:
16 April 2025
Posted:
18 April 2025
You are already at the latest version
Abstract
The objective of this study was to evaluate the effects of feeding a combination of chicory-plantain silage and supplementing Se-yeast on the response of early-lactating ewes to induce subclinical mastitis. Polypay ewes were fed either chicory-plantain si-lage or grass silage and supplemented with 3.6 mg Se-yeast /ewe/day for approximately 2 months prior to the intramammary infection (IMI) by infusing Strep. uberis into both glands. The ewes had a typical subclinical mastitis response with an 8-fold in-crease in milk somatic cells within 24h post-IMI, a decrease in milk yield, and changes in all milk components measured. The ewes experienced a mild systemic inflammation post-IMI as determined by an increase in rectal temperature and decrease in feed and water intake and, in blood, by an increase in concentration of ceruloplasmin, hapto-globin, and myeloperoxidase and decrease of paraoxonase, Zn, advanced oxidation protein products, and hematocrit with no effect on pro-inflammatory cytokines. No effect of silage type or Se-supplementation was detected in response to IMI. In sum-mary, the subclinical mastitis model used was effective in mounting an inflammatory response, although this was mild; however, feeding chicory-plantain silage and sup-plementing Se-yeast had no significant effect on the response of ewes to mammary infection.
Keywords:
Mastitis
; Chicory
; Plantain
; Selenium
1. Introduction
On dairy farms, clinical mastitis continues to be the leading economic burden, accounting for up to $2 billion annually in the United States alone. The cost of each case of clinical mastitis in the United States has been estimated to be $444 [1], with an average costs of $131 per cow per year, as proposed by a review of the literature [2]. However, complicating this issue are incidences of subclinical mastitis where physical symptoms characteristic of clinical mastitis, such as a swollen or inflamed udder and visible changes in milk quality, are not apparent. While animals with subclinical mastitis may appear healthy, they suffer from reduced milk production and elevated somatic cell counts (SCC), greatly impacting farm profitability [3]. It has been estimated that subclinical mastitis cost >$1 billion in the US alone [4]. While antibiotics are still the most common form of mastitis treatment, their use can be expensive and are not approved in all farm settings, particularly organic farms [5]. This, combined with concerns regarding the overuse of antibiotics and bacterial resistance [6], emphasizes the need for alternative therapies for treating and preventing mastitis.
One alternative method for preventing or treating mastitis currently being explored is through diet. In a recent investigation, we observed lower SCC in the mid-lactation cows grazing a chicory- and plantain-dominated pasture compared to cows grazing a more traditional grass-clover pasture. [7]. While the specific compounds present in chicory that could be generating this effect have not been investigated in ruminants, research utilizing other animal models has demonstrated a wide range of therapeutic benefits in chicory, including antioxidant, anti-inflammatory, and antimicrobial properties [8]. Plantain has primarily been investigated for its potential to reduce the environmental impact of livestock [9]; however, limited work has been done to elucidate its effects on animal health. Like chicory, plantain is also known to contain a high amount of bioactive compounds that, in addition to improving rumen nitrogen efficiency [10], can modulate the inflammatory response [11]
Given the important role that the immune system plays in preventing and eliminating intramammary infections (IMI) [12], improving the immune system that protects the mammary gland may be effective at limiting or preventing mastitis. Selenium, a critical micromineral for selenoproteins, has been extensively studied for its ability to improve the immune function [13] and the antioxidant status via increased glutathione peroxidase activity [14]. Prior investigations on sheep have shown that supplementation of Se-yeast can restore immune function in footrot-affected animals [15]. Furthermore, the supplementation of Se in dairy cows reduced the duration of mastitis symptoms by up to 46% [16] limiting the economic impact of intramammary infections.
To expand upon previous investigations on mastitis, the objectives of this study were to investigate the effect of feeding a 50%/50% mixture of chicory and plantain silage in combination with a supplementation of Se-yeast to lactating ewes subjected to IMI. Based on previous findings, it was hypothesized that sheep fed chicory+plantain silage improve the response to intramammary infection compared to ewes fed a standard grass silage, with further improvement among ewes supplemented with Se-yeast.
2. Materials and Methods
2.1. Animals
Experimental procedures in this investigation were approved by the Institutional Animal Care and Use Committee (IACUC) of Oregon State University (protocol # 2019-0042). Thirty-two Polypay ewes approximately one month into lactation from the Oregon State University Sheep Center were transitioned from a previous study (Ford et al., 2024). Details of animal management were previously described (Ford et al., 2024). Briefly, ewes were housed in individual 1.5m×1.5m pens at the HOGG Animal Metabolism Laboratory Building (HAMB) on the Oregon State University campus. The pens were bedded with wheat straw that was replaced every 3-4 days or as needed.
2.2. Diets and Experimental Design
Prior to the start of this investigation ewes were fed diets composed of either chicory silage or grass silage and supplemented with 3.6 mg/ewe/day of Se-yeast or a placebo from approx. 30 days prior parturition to 30 days post-lambing (Ford et al., 2024). For the present study, ewes receiving grass silage kept receiving the same feeding treatment while ewes that received chicory silage were fed with a 50/50 chicory/plantain silage (both donated by Don Wirth, Saddle Butte Ag, Inc. Tangent, OR). Diets are available in Table 1. The experiment involved animals in 4 groups (n=8/group; Figure 1): CPCT (chicory+plantain silage without supplementation of Se-yeast); and CPSY (chicory+plantain silage with supplementation of Se-yeast); GCT (grass silage without supplementation of Se-yeast); and GSY (grass silage with supplementation of Se-yeast).
Ewes were fed a fixed amount of grain and silage ad libitum, and residual feed was weighed to calculate feed intake. During the experiment, the amount of grain provided was 1.5% of the body weight of each of the ewes, while the amount of silage provided was approximately 110% of the amount of silage consumed the previous day. Ewes were fed 60% of the allocated feed at approximately 9 AM after they were milked, with the rest of the feed being fed at approximately 5 PM. Diets were formulated to meet the recommendations for lactating sheep [17]. Before milking, teats were treated with a pre-dip 0.5% iodine solution and cleaned using a disposable commercial paper towel. The same solution was used to perform a post-dip.
2.3. Intramammary Infection
After 4 days of adaptation to milking and diet (day 0), an infusion of 2x10⁷ cfu of Streptococcus uberis 0140J [18] in 10 mL sterile saline solution in both glands was performed in all ewes immediately after the morning milking in accordance with a previously characterized model developed by Addis et al. [19]. The Strep uberis was grown and provided as 2x10⁷ cfu aliquots in cell culture freezing vials by the Oregon Veterinary Diagnostic Laboratory, Carlson College of Veterinary Medicine. Corvallis, OR. The teats were cleaned with the pre-dip solution and cleaned with a sterile gauze and sprayed with 70% ethanol before IMI. This was performed using a 10 mL syringe with a sterile teat infusion cannula (Jorgensen Laboratories, Inc., Loveland, Colorado). The gland was thoroughly massaged to spread the inoculum after infusion.
2.4. DMI, Water Intake, Milk Yield, Milk Quality, and Rectal Temperature
Feed intake (as dry matter intake or DMI) and water intake were measured as previously described [20]. Ewes were with lambs until 5 days before the experiment started, where the lambs were weaned, and ewes started to be milked. Ewes were milked in the morning (~7 AM) and the evening (~4 PM) before feeding. Ewes were milked using a Quadruple Goat Milker Twin Bucket (Model TKKC 4-2PS, Melasty, Bursa, Turkey) and fed approximately 100 g of the control grain containing no additional Se to ease the stress of milking (Appendix A.1).
Milk yield was measured at each milking by using a graded measuring cup. Milk samples were collected during both AM and PM on days -2, -1, 0, 1, 3, 5 and 9 relative to IMI in 60mL cupped vials (cat# CPP03EDM-CL, Capitol Plastic Products, NY) containing 1 pill of Broad Spectrum Microtabs II™ (Weber Scientific, Cat# 3038-50) for assessment of milk components using a LactoScope™ FT-A and SomaScope Smart (both from Perkin Elmers, USA). The LactoScope was calibrated using 14 calibration milk samples from Dr. David Barbano at Cornell University before starting the experiment. Milk samples were preserved at 4℃ and measured, after warming at 42℃ in a water bath, within 14 hours from collection. Rectal temperature was measured at each milking using commercial digital rectal thermometers.
2.5. Milk Bacteria Sampling and Culture
Bacteria count from milk samples were evaluated at day 0 before glands were infused with Strep. uberis and on day 4 post-infection following a previous method [21]. Briefly, milk obtained for evaluation was collected aseptically in sterile Olympus 1.7ml microtubes (#24-282S, Genesee Scientific Corporation, El Cajon, CA). For total bacteria counts, milk was agitated gently, then a 1 mL sample was obtained with a 1 mL calibrated lab pipette. Milk was then placed on Petrifilm (3M Company, Maplewood, MN, USA) aerobic culture plates according to the manufacturer’s instructions. After incubation at 37℃ for 48 hours, bacterial colonies were counted and recorded. The detailed protocol is available in Appendix A.2.
2.6. Blood Collection and Analysis
Blood was collected via jugular venipuncture on days -1, 0, 1, 3, 5, and 9 relative to IMI and processed as previously described [20]. Analysis of plasma for parameters associated with metabolism, liver and kidney function, antioxidant health, inflammation, and immune status [20,22] using a clinical auto-analyzer (ILAB 650, Instrumentation Laboratory, USA Spa, Werfen Co., Milan, Italy).
2.7. Phagocytosis Assay
The leukocyte phagocytosis assay was performed using pHrodo Green S. aureus BioParticles Phagocytosis Kit for Flow Cytometry (Cat# P35382, Thermo Fisher Scientific, Waltham, MA, USA) following the manufacturer’s protocol except for the addition of DAPI to visualize nucleated cells. Flow cytometry was performed using a CytoFlex Flow Cytometer (Beckman Coulter), and cell populations were manually gated using the PB450 and APC filters.
2.8. Migration Assay
Cellular migration was assayed using a commercially available kit (Cat# CBA-104, Cell Biolabs Inc., San Diego, CA). Briefly, 100 µL of whole blood collected in EDTA vacutainer tubes was added to a migration plate containing 150 µL of endotoxin-activated sheep plasma as the chemoattractant. The latter was obtained according to Jahan et al. [23] by treating each mL of whole blood from sheep collected in heparinized vacutainer tubes with 5 µg LPS from E. Coli EH100 (cat#IAX100010M001, Adipogen, USA) for 4h at 37℃. The plasma was immediately obtained after centrifugation at 8500×g for 10 min at 4℃ and stored at -80℃ in 1 mL aliquots. Following 24-hour incubation, cells were detached from the migration plate using the provided cell detachment solution. Following detachment, the solution was mixed with the provided buffers and dye solution, incubated, and added to a black 96 well plate for fluorescence measurement. As blank, RPMI media was used instead of the LPS-activated plasma. Fluorescence was measured using a Biotek Synergy H1 Plate Reader at 480nm/520nm, and data were corrected for the blank and by the known number of neutrophils as determined by the complete blood count. This correction was performed by taking the fluorescence data for each sample and dividing it by the number of neutrophils/mL for the corresponding sample.
2.9. Statistical Analysis
Based on the power analysis performed by G*Power 3.1.9.7 and using the log2 somatic cells means and standard deviation from a prior experiment where the same mastitis model was used in goats [18], 8 animals per group provided 80% power to determine successful intramammary infection. For most parameters, data were analyzed using the PROC GLIMMIX procedure in SAS v9.4 (SAS Institute) with forage (F), selenium supplementation (Se), and time (T) and their interactions as the fixed effects and with ewe as the random effect. The TYPE=AR(1) covariance structure was used as having the lowest Akaike's information criterion. The milk bacteria count data were analyzed using the PROC GLM procedure in SAS v9.4 with F, Se, and T and interactions as the fixed effects and with ewe as the random effect. Milk bacteria frequencies were assessed using the PROC FREQ procedure in SAS v9.4 with F, Se, and T as the categorical variables with significance declared at Chi-Square≤0.05. Significance was declared at p≤0.05 and tendency when P>0.05 and P≤0.10.
3. Results
Animals (1 for CPCT, 2 for CPSY, and 1 for GCT) were removed from the study due to the presence of clinical mastitis that was independent from the Strep Uberis infused. The final number of animals in each group were n= 7 for CPCT, n = 6 for CPSY, n = 7 for GCT, and n = 7 for GSY.
3.1. Overall Response to Intramammary Infection (IMI)
The intramammary infection model used was effective in increasing the concentration of SCC in milk after 8 h post-IMI with a slight but significant increase in rectal temperature that persisted until the end of the 10-day trial (Figure 2). The count of the bacteria tended to increase after IMI (P=0.06) (Figure 3). Cultured milk had a higher frequency of various bacteria after IMI compared to prior IMI (Chi-Square P=0.003; Figure 3), but the type of forage or Se supplementation did not affect the type of bacteria in the milk. There was a numerical (P=0.11) increase in the frequency of Strep. uberis after IMI but not in the GCT group, so the frequency of Strep uberis was higher (Chi-square P=0.03) in animals supplemented vs. non-supplemented with Se. Also increased (Chi-square P=0.02) was the frequency of Staph. aureus after IMI.
Feed intake, milk yield, blood urea, and water intake were decreased after IMI, with DMI and urea being significantly lower than baseline only 1 day after IMI (Figure 4). Most of milk components measured were affected by IMI, with a decrease of lactose, SNF, total and other solids, C18:0, and medium chain fatty acids and an increase of proportion of protein, fat, C16:0, C18:1, de novo and mixed fatty acids, acetone, β-hydroxybutyrate (BHBA), and various nitrogen components (i.e., NPN and MUN) (Figure 5 and Figure 6). Most of the parameters related to milk fat were affected only during the first 120 hours (5 days) post-IMI.
Parameters in blood were also affected by IMI (Figure 7 and Figure 8). Total protein, globulin, albumin, haptoglobin, ceruloplasmin, interleukin 6 (IL6), myeloperoxidase, ROM, and ROM/FRAP (Ferric Reducing Ability of the Plasma) ratio increased starting at 3-day post-IMI and remained high compared to pre-IMI until the end of the experiment. Decreased after IMI until the end of the experiment were the concentration of paraoxonase and albumin:globulin ratio while decreased temporarily after IMI were the concentration of zinc and AOPP (Advanced Oxidation Protein Products). Nitric oxide (NOx) and nitrate (NO3) increased significantly after IMI but briefly, only in animals supplemented with Se-yeast.
3.2. Response of Ewes Fed with Chicory-Plantain and Se-Yeast
Rectal temperature was overall lower in animals supplemented vs. not supplemented with Se-yeast (Table 2). The type of silage had a tendency (P=0.07) to affect DMI, with ewes fed chicory+plantain silage having less DMI than ewes fed grass silage, especially after IMI, but milk yield and SCC were not affected by silage type or Se-yeast (Table 2 and Figure 4). The significant Se×T effect for SCC was due to a higher SCC in animals receiving Se before IMI (Figure 2). The count of bacteria in milk was overall higher in animals supplemented with Se compared to non-supplemented animals, although this was due to a higher value in GSY group compared to the other groups already prior IMI (Figure 3 and Table 2).
Among milk components (Table 2), compared to ewes fed grass silage, ewes fed chicory+plantain silage had higher levels of milk protein, butterfat (due to higher de novo-derived fatty acid), and total solids, with a lower level of medium-chain fatty acids (Table 2). Se-yeast supplemented ewes had lower milk fat due to a decrease in C16:0 and de novo-derived fatty acids (Table 2). A significant interaction F×Se was observed for preformed fatty acids, especially C18:0 and C18:1, and acetone, where a decrease in animals fed chicory-plantain silage and an increase in animals fed grass silage when supplemented with Se-yeast were observed (Figure 5 and Figure 6).
The type of silage offered, and Se-yeast supplementation had minor effects on blood parameters (Table 3). Ewes that were fed chicory+plantain silage had lower blood levels of IL6 and higher levels of BHBA and FRAP. Ewes supplemented with Se had higher blood NEFA:Albumin ratio, driven in part by the tendency for these ewes to have higher levels of NEFA (P=0.08) and lower levels of albumin (P=0.09) in comparison to ewes that were not supplemented with selenium.
The interaction between forage type and Se-yeast was significant on a few parameters (Table 3 and Figure 7, Figure 8 and Figure 9). Globulin level was higher in animals supplemented vs. non-supplemented with Se prior IMI, but no difference was observed post-IMI. Ceruloplasmin had a similar pattern in all groups (i.e., increased after IMI), except for the GSY, which was numerically higher prior to IMI compared to the other groups and was not affected by IMI. The concentration of IL6 was overall lower in ewes fed chicory-plantain vs. grass silage and increased after IMI only in the latter. The concentration of ROM was numerically higher prior to IMI, and ROM/FRAP increased faster after IMI in ewes fed grass vs. chicory-plantain silage.
Except for the significant Se×T for lymphocytes and MCH, few of the CBC parameters were affected by forage or Se supplementation (Table 4 and Figure 10). Overall, forage or Se supplementation did not affect leukocytes phagocytosis. Neutrophil migration was highest amongst ewes fed chicory+plantain vs. grass silage before IMI; however, a similar level of migration was observed after IMI.
Few parameters of the complete blood count were affected by the IMI. Among those, the number of lymphocytes increased after IMI, but mainly due to an increase observed in animals supplemented with Se-yeast, while the hematocrit and related parameters such as red blood cells, hemoglobin, and mean corpuscular hemoglobin were decreased by IMI (Figure 9). Migration of neutrophils was decreased while phagocytosis of PMN was increased after IMI (Figure 10).
4. Discussion
4.1. Characterization of the IMI Model
The data presented in this study indicate successful establishment of IMI as demonstrated by a rapid and consistent increase SCC in milk and the increase and maintenance of a higher rectal temperature compared to prior IMI until the end of the experiment without eliciting a large systemic response, confirming that the original method developed by Addis et al. [19] is working correctly. The 40% reduction in milk production in response to IMI observed in the present study is consistent with other studies assessing subclinical mastitis in sheep [24] and goats [18].
The effects of IMI on main components of milk, including the increase in % protein and the decrease in % lactose, were also consistent with the data obtained in goats after IMI induced using the same bacteria [18] and dairy cows with E coli [25]. Different than IMI in goats [18] but similar to IMI in dairy cows [25], we observed an increase in % milk fat. Among fat components, our data indicated that IMI negatively affected the proportion of long-chain fatty acids but had a positive effect on the proportion of de novo synthesized and short-chain fatty acids, confirming prior field observation in dairy cows [26], suggesting at the least a maintenance of milk fat synthesis using acetic acid and butyrate by the mammary gland [27]. Similarly, mastitis increased the concentration of BHBA and acetone in milk, similar to what was observed in dairy cows with IMI induced by E. coli [25].
As observed in the goat model of subclinical IMI [18], a mild systemic inflammatory response was observed with parameters following an expected pattern, such as an increase in concentration of positive acute phase proteins haptoglobin and ceruloplasmin and oxidative stress, as observed by the increase in ROM, and a decrease in concentration of paraoxonase [18], typical of inflammatory response [28]. An exception was albumin, where a peculiar increase after IMI was observed in our study but not in the study where subclinical IMI was induced in goats [18]. Albumin generally has a very long half-life in circulation, and the replacement of albumin is low, thus, an increase in plasma can be the only consequence of acute dehydration. The sheep after IMI drank less water, which could have caused dehydration that is also supported by an increased concentration of urea in milk after IMI, as previously observed [29]. It is unclear the reason for the decreased water intake.
In our study, we did not observe a change in NEFA, glucose, and BHBA in blood plasma as was observed in prior studies [18,25]. The latter indicates a likely peculiar difference of the response to IMI of sheep compared to goats and dairy cows.
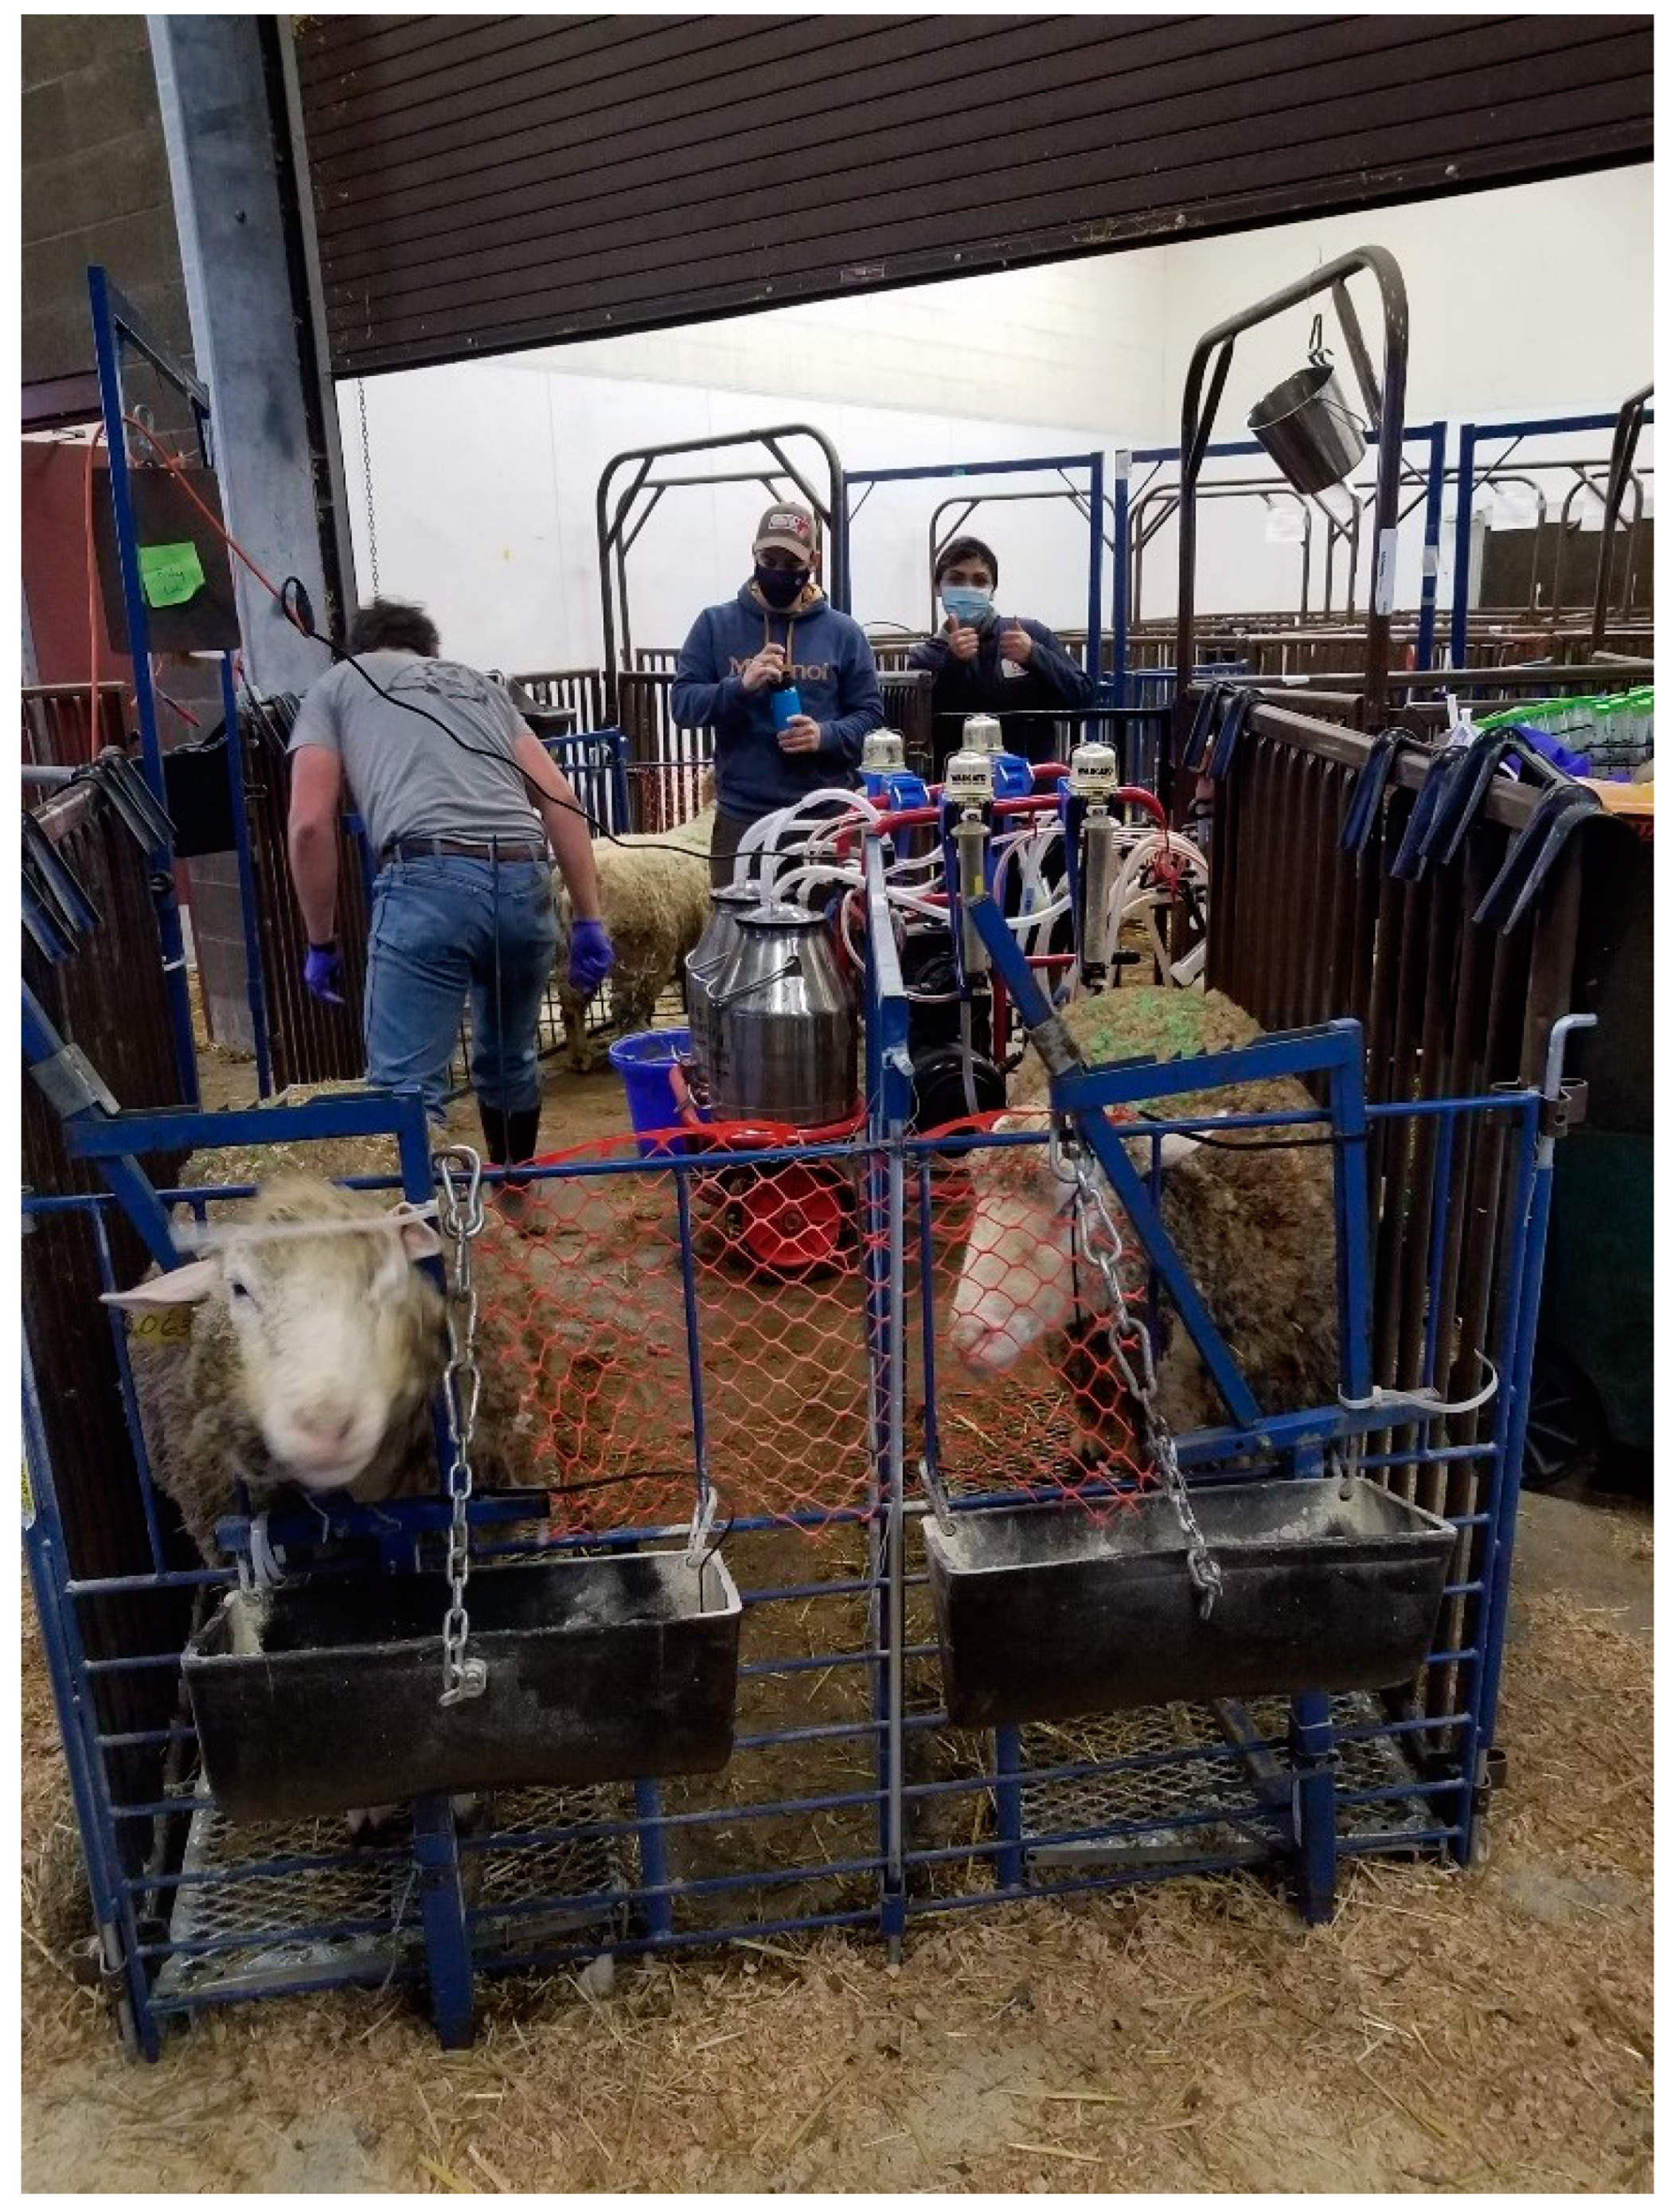
Despite the well-established subclinical IMI model, the bacteria count in milk was not very different between prior and after IMI in our study. Also, around 50% of the glands did not have any significant growth when milk was cultured, and we expected to detect Streptococcus in milk from all glands after IMI; despite a significant increase after IMI of those bacteria, only up to 25% of the glands had Streptococcus without any case in the GCT group. The majority of milk from the mammary glands after IMI had growth in a culture of Staph. aureus. The latter is very diffuse in glands of lactating ewes and a major cause of IMI in sheep farms [30]. It is possible that our animals experienced an IMI as also consequence of contamination during the injection of Strep. uberis. Although we try to maximize sterility during the intramammary infusion of Strep uberis, the milking parlor we used was not an ideal place to keep sterility (see [Suppl. Figure S1). In any case, our purpose was not to study specifically the IMI induced by Strep. uberis, but a general IMI, which was obtained. The inconsistency in the type of bacteria found, including the ones that were not detected as there was no growth in the agar, could have affected the consistency of the response. However, all the animals had a very consistent increase in SCC and a general inflammatory response.
In addition, our data revealed higher bacteria count and SCC in milk of GSY vs. the other groups prior IMI. The same group also had higher levels of ceruloplasmin prior IMI, indicating a possible mild inflammation as consequence of a pre-existent subclinical IMI. The same group also presented a few cases of presence of yeast in milk and was the only group with no effect on concentration of ceruloplasmin in blood post-IMI. It is unclear why feeding grass silage in combination with Se yeast could have increased the bacteria presence and/or a mild intramammary infection in the mammary gland of the ewes.
4.2. The Type of Silage Had A Minimal Effect on the Response to IMI
Chicory and plantain forages have gained increased attention recently due to their high concentration of bioactive compounds and can provide additional benefits that serve to improve animal health and reduce the environmental impact of livestock production [9,31,32]. In a previous study, late-lactation cows grazing pastures rich in chicory and plantain were found to have lower milk SCC than cows grazing grass or legume-dominated pastures indicating that forb pastures may be able to improve animal health, particularly at the level of the mammary gland [7]. In the current study, no differences in milk SCC were found between ewes fed chicory+plantain silage and ewes fed grass silage, somewhat in contrast to this previous finding.
An important difference between the previous study in grazing cattle and the present investigation was the utilization of silage as opposed to fresh forages in a pasture setting. While studies specific to the effects of ensilement on the secondary compound profile of chicory and plantain are limited, prior studies in other forage varieties have observed changes in secondary compound concentrations following the silage process. In one study, silage made from Paulownia leaves had higher concentrations of phenolic acids and flavonoids than the fresh plant material [33], whereas another study examining sainfoin and sulla found decreases in polyphenols and proanthocyanins and a lower antioxidant activity in both silages when compared to fresh forages [34]. As demonstrated by Martens et al. [35], the effects of ensilement on secondary compound concentrations is highly species-dependent, even without considering the effect of different ensilement methods or the properties of the forages used to produce the silage. Further work is necessary to determine if the different results obtained in this study compared to previous studies using chicory and/or plantain silage can be attributed to changes in secondary compound concentrations due to the ensilement process or are driven by other factors.
While feeding chicory+plantain silage did not have a significant effect on the response of the ewes to IMI in terms of milk production or quality, the reduced plasma levels of IL-6 and higher FRAP may indicate that these forages and their bioactive components can improve the basal antioxidant function and inflammatory status. Prior studies have shown that serum levels of IL6 are elevated in cows with subclinical mastitis [36,37]. High levels of IL6 have been associated with poor outcomes in humans with sepsis [38]. IL6 is one of the primary pro-inflammatory cytokines controlling the acute phase reaction [39] although it acts in a hermetic fashion, where high doses induce inflammation and low doses decrease inflammation [40]. In our experimental model, only ewes fed grass silage had an increase in IL6 after IMI. Despite the increase in IL6, the ewes fed grass silage did not experience a higher or lower inflammation compared to the ewes fed chicory-plantain silage. Thus, it is unclear the importance of the response of IL6 level to IMI. Reduction in FRAP has also been found among goats suffering from subclinical mastitis [41]; however, in our study, FRAP was not affected by IMI, but the ROM/FRAP ratio was better in ewes fed chicory-plantain vs. grass silage, indicating a possible better antioxidative status of the former [42]. The role of FRAP on mastitis appears somewhat unclear as FRAP in plasma of dairy cows with subclinical mastitis from Staph. aureus was lower when a spontaneous healing was observed vs. cows that did not have a spontaneous healing [43].
Overall, the data do not support a significant effect of chicory-plantain silage in improving the response to mastitis.
4.3. Se Supplementation Does Not Affect the Response to IMI
Selenium has been extensively studied for its apparent benefits on immune and antioxidant function. Blood selenium levels have been negatively associated with somatic cell count [44], an effect that may be mediated by Se-sensitive long non-coding RNAs that modulate antioxidant and inflammatory gene networks [45]. Supplementation of Se-yeast has also been shown to reduce the presence of mastitis pathogens in healthy quarters [46]. Selenium deficiency has been associated with a higher frequency and severity of mastitis and poorer immune function [47]. It has been proposed that supplementing dairy animals with higher than recommended organic Se in the diet could improve the health of the mammary gland [48].
In our study, we did not observe any significant effects of Se-yeast supplementation on any of the immune or antioxidant parameters measured, except for a larger increase in a number of circulating leukocytes after IMI. It is unclear the reason for our observation; however, a mild effect of Se level on subclinical mastitis has been observed in dairy cows that were deficient in Se [44]. In our study, ewes without supplementation of Se yeast were not deficient of Se as the basal diet contained inorganic Se [20]. Thus, our study does not support an improved response to sub-clinical mastitis with supplementation of Se above the recommendation.
4.4. Limitations
Although our research confirmed that the subclinical model used is robust, the lack of effect on helping to address the IMI by either chicory and plantain silage and Se-yeast (or their combination) detected may be limited by the low number of animals used. The statistical power needed to observe differences was calculated after we obtained the results using the one-way ANOVA Proc Power of SAS, considering all time points after the IMI. The analysis was performed for milk components, milk yield, and blood parameters. The analysis revealed that for a few parameters (albumin, glucose, and milk protein) 8 animals/groups would suffice to have an 80% power with an α=0.05, other parameters required 12 animals/group, such as ceruloplasmin and myeloperoxidase; however, other parameters required a larger number of animals/group, including haptoglobin.
5. Conclusions
In summary, the IMI model was successful, but neither chicory+plantain silage nor Se-yeast supplementation was found to have a significant effect on the response of early-lactation ewes to IMI, disproving our hypothesis. Despite previous work supporting the positive effects of both treatments on udder health and animal immune and antioxidant response, no differences were observed in the present trial. Multiple factors may have contributed to this outcome, such as the utilization of silage as opposed to fresh forage, as well as the fact that none of the ewes were in a state of Se deficiency before this experiment was conducted.
Supplementary Materials
The following supporting information can be downloaded at: www.mdpi.com/xxx/s1, Figure S1.
Author Contributions
Conceptualization, M.B. and S.A.; methodology, H.R.F, J.K., S.B., and E.T.; validation H.R.F, J.K., S.B., and E.T.; formal analysis, H.R.F, J.K., S.B., and E.T.; investigation, H.R.F, J.K., M.B.; resources, J.K., E.T., and M.B.; data curation, E.T and M.B.; writing—original draft preparation, H.R.F. and M.B.; writing—review and editing, J.K., S.A., S.B., E.T., and M.B.; visualization, H.R.F. and M.B.; supervision, M.B.; project administration, M.B.; funding acquisition, J.K., A.S., and M.B. All authors have read and agreed to the published version of the manuscript.
Funding
The experiment was funded by the USDA NIFA ORE (project #ORE00170) to M.B., S. A. and J.K. The USDA NIFA multistate project # NE-1748 financially supported M.B.
Institutional Review Board Statement
Experimental procedures in this investigation were approved by the Institutional Animal Care and Use Committee (IACUC) of Oregon State University (protocol # 2019-0042).
Data Availability Statement
Data are available from the corresponding author upon reasonable request.
Acknowledgments
The authors thank the following people for their great help during the experiment: Benjamin Grismer for managing the animals and helping through all the aspects of the experiment, including feeding, milking, and collecting samples; Maria Gracia Puerto-Hernandez for the measurement of water intake and milk analysis; Daniella Hasan for helping collect blood samples; Sebastiano Busato for running the migration assay, and the following undergraduate students for helping managing the animals, feeding them, milking, and helping collecitng samples: Kate Ness, Magdalena Ibarra, Samantha Heney, Jula VanDerZant, Tyler Quinones, Mariangel Torres, Caitlynn Dougherty, Sarah Kemp, Alyssa Thibodeau, Corinna Cauchy, Callan Stowell, Michele McCann, Carolyn Pearce, Mustafa Bozkus, Shelby Park, and Paige Tafoya.
Conflicts of Interest
The authors declare no conflicts of interest.
Abbreviations
The following abbreviations are used in this manuscript:
| AOPP | Advanced Oxidation Protein Products |
| BHBA | β-hydroxybutyric acid |
| FRAP | Ferric-reducing ability of the plasma |
| IL6 | Interleukin 6 |
| IMI | Intramammary infection |
| NEFA | Non-esterified fatty acid |
| NO | Nitric Oxide |
| SCC | Milk somatic cells |
Appendix A
Appendix A.1
Appendix A.2.
Bacterial Count Protocol from Milk Samples of Infected Ewes
- Samples were plated on MacConkey (Gram-negative specific) and blood agar with esculin (sheep blood, supports general growth).
- Plates were placed in a humidified incubator at 37C
- Agar plates were observed for growth at 24 and 48 hours after inoculation.
- If no growth on blood or MacConkey agars was observed after 48 hours, the sample was identified as “No Growth”
- If growth occurred on MacConkey agar after 24 hours, colonies were identified as gram-negative organisms. Identification was by colony morphology on blood and MacConkey agar.
- If growth occurred on blood agar but not on MacConkey agar at 24 or 48 hours, colonies were identified as gram-positive organisms.
- Initial identification was based on colony morphology on blood agar.
-
Organisms were identified as Staphylococcus or Streptococcus organisms using the catalase test and esculin fermentation on the plate:
- Catalase positive = Staphylococcus
- Catalase negative = Streptococcus
-
Staphylococcal organisms were further speciated using the coagulase test and colony morphology:
- Coagulase positive = Staphylococcus aureus
- Coagulase negative = “Staphylococcus species”
- 7.
- If 2-3 species were present on the blood agar, the sample was classified as mixed. If more than 3 species occurred on the blood agar, the sample was classified as contaminated.
- 8.
- Organisms not identifiable with colony morphology or basic biochemical tests were evaluated by gram stain and microscopic evaluation.
References
- Rollin E, Dhuyvetter KC, Overton MW. The cost of clinical mastitis in the first 30 days of lactation: An economic modeling tool. Prev Vet Med. 2015;122(3):257-64. Epub 20151107. [CrossRef] [PubMed]
- Hogeveen H, Steeneveld W, Wolf CA. Production Diseases Reduce the Efficiency of Dairy Production: A Review of the Results, Methods, and Approaches Regarding the Economics of Mastitis. Annual Review of Resource Economics. 2019;11(Volume 11, 2019):289-312. [CrossRef]
- Cheng WN, Han SG. Bovine mastitis: risk factors, therapeutic strategies, and alternative treatments - A review. Asian-Australas J Anim Sci. 2020;33(11):1699-713. Epub 20200512. [CrossRef] [PubMed]
- Weersink A, Vanleeuwen J, Chi J. Direct Production Losses and Treatment Costs due to Four Dairy Cattle Diseases. Advances in Dairy Technology. 2002;14.
- Ruegg, PL. Management of mastitis on organic and conventional dairy farms. J Anim Sci. 2009;87(13 Suppl):43-55. Epub 20080926. [CrossRef] [PubMed]
- White DG, McDermott PF. Emergence and Transfer of Antibacterial Resistance. Journal of Dairy Science. 2001;84:E151-E5. [CrossRef]
- Wilson RL, Bionaz M, MacAdam JW, Beauchemin KA, Naumann HD, Ates S. Milk production, nitrogen utilization, and methane emissions of dairy cows grazing grass, forb, and legume-based pastures. J Anim Sci. 2020;98(7). [CrossRef] [PubMed]
- Saeed M, Abd El-Hac ME, Alagawany M, A. Arain M, Arif M, A. Mirza M, et al. Chicory (Cichorium intybus) Herb: Chemical Composition, Pharmacology, Nutritional and Healthical Applications. Int J Pharmacol. 2017;13:351-60. [CrossRef]
- Gardiner CA, J. CT, C. CK, J. DH, R. EG, and de Klein CAM. Potential for forage diet manipulation in New Zealand pasture ecosystems to mitigate ruminant urine derived N2O emissions: a review. New Zealand Journal of Agricultural Research. 2016;59(3):301-17. [CrossRef]
- Navarrete S, Kemp PD, Pain SJ, Back PJ. Bioactive compounds, aucubin and acteoside, in plantain (Plantago lanceolata L.) and their effect on in vitro rumen fermentation. Animal Feed Science and Technology. 2016;222:158-67. [CrossRef]
- Park, KS. Aucubin, a naturally occurring iridoid glycoside inhibits TNF-alpha-induced inflammatory responses through suppression of NF-kappaB activation in 3T3-L1 adipocytes. Cytokine. 2013;62(3):407-12. Epub 20130420. [CrossRef] [PubMed]
- Sordillo, LM. Mammary Gland Immunobiology and Resistance to Mastitis. Vet Clin North Am Food Anim Pract. 2018;34(3):507-23. [CrossRef] [PubMed]
- Avery JC, Hoffmann PR. Selenium, Selenoproteins, and Immunity. Nutrients. 2018;10(9). Epub 20180901. [CrossRef] [PubMed]
- Jaaf S, Batty B, Krueger A, Estill CT, Bionaz M. Selenium biofortified alfalfa hay fed in low quantities improves selenium status and glutathione peroxidase activity in transition dairy cows and their calves. J Dairy Res. 2020;87(2):184-90. Epub 20200416. [CrossRef] [PubMed]
- Hall JA, Vorachek WR, Stewart WC, Gorman ME, Mosher WD, Pirelli GJ, et al. Selenium supplementation restores innate and humoral immune responses in footrot-affected sheep. PLoS One. 2013;8(12):e82572. Epub 20131205. [CrossRef] [PubMed]
- Smith KL, Harrison JH, Hancock DD, Todhunter DA, Conrad HR. Effect of vitamin E and selenium supplementation on incidence of clinical mastitis and duration of clinical symptoms. J Dairy Sci. 1984;67(6):1293-300. [CrossRef] [PubMed]
- Council, NR. Nutrient Requirements of Small Ruminants: Sheep, Goats, Cervids, and New World Camelids. Washington, DC: The National Academies Press; 2007. 384 p.
- Rosa F, Osorio JS, Trevisi E, Yanqui-Rivera F, Estill CT, Bionaz M. 2,4-Thiazolidinedione Treatment Improves the Innate Immune Response in Dairy Goats with Induced Subclinical Mastitis. PPAR Res. 2017;2017:7097450. Epub 20170627. [CrossRef] [PubMed]
- Addis MF, Pisanu S, Marogna G, Cubeddu T, Pagnozzi D, Cacciotto C, et al. Production and release of antimicrobial and immune defense proteins by mammary epithelial cells following Streptococcus uberis infection of sheep. Infect Immun. 2013;81(9):3182-97. Epub 20130617. [CrossRef] [PubMed]
- Ford H, Hasan D, Ates S, Puerto-Hernandez G, Klopfenstein JJ, Trevisi E, et al. Feeding chicory silage, but not Se-yeast or a single injection of inorganic Se, affects metabolism, fat in milk, and type I immunity in transition ewes. Frontiers in Animal Science. 2024;5. [CrossRef]
- Ginn RE, Packard VS, Fox TL. Evaluation of the 3M Dry Medium Culture Plate (Petrifilm SM) Method for Determining Numbers of Bacteria in Raw Milk (1). J Food Prot. 1984;47(10):753-5. [CrossRef] [PubMed]
- Michelotti TC, Trevisi E, Osorio JS. An Exploration of the Effects of an Early Postpartum Intravenous Infusion with Carnosic Acid on Physiological Responses of Transition Dairy Cows. Antioxidants (Basel). 2021;10(9). Epub 20210916. [CrossRef] [PubMed]
- Jahan N, Minuti A, Trevisi E. Assessment of immune response in periparturient dairy cows using ex vivo whole blood stimulation assay with lipopolysaccharides and carrageenan skin test. Vet Immunol Immunopathol. 2015;165(3-4):119-26. Epub 20150411. [CrossRef] [PubMed]
- Alba DF, da Rosa G, Hanauer D, Saldanha TF, Souza CF, Baldissera MD, et al. Subclinical mastitis in Lacaune sheep: Causative agents, impacts on milk production, milk quality, oxidative profiles and treatment efficacy of ceftiofur. Microb Pathog. 2019;137:103732. Epub 20190907. [CrossRef] [PubMed]
- Moyes KM, Larsen T, Sorensen P, Ingvartsen KL. Changes in various metabolic parameters in blood and milk during experimental Escherichia coli mastitis for primiparous Holstein dairy cows during early lactation. J Anim Sci Biotechnol. 2014;5(1):47. Epub 20141017. [CrossRef] [PubMed]
- Randolph HE, Erwin RE. Influence of mastitis on properties of milk. X. Fatty acid composition. J Dairy Sci. 1974;57(8):865-8. [CrossRef] [PubMed]
- Bionaz M, Loor JJ. Gene networks driving bovine milk fat synthesis during the lactation cycle. BMC Genomics. 2008;9:366. Epub 20080731. [CrossRef] [PubMed]
- Bionaz M, Trevisi E, Calamari L, Librandi F, Ferrari A, Bertoni G. Plasma paraoxonase, health, inflammatory conditions, and liver function in transition dairy cows. J Dairy Sci. 2007;90(4):1740-50. [CrossRef] [PubMed]
- Robinson BE, Weber H. Dehydration despite drinking: beyond the BUN/Creatinine ratio. J Am Med Dir Assoc. 2004;5(2 Suppl):S67-71. [CrossRef] [PubMed]
- Vasileiou NGC, Chatzopoulos DC, Sarrou S, Fragkou IA, Katsafadou AI, Mavrogianni VS, et al. Role of staphylococci in mastitis in sheep. J Dairy Res. 2019;86(3):254-66. Epub 20190819. [CrossRef] [PubMed]
- Nwafor IC, Shale K, Achilonu MC. Chemical Composition and Nutritive Benefits of Chicory (Cichorium intybus) as an Ideal Complementary and/or Alternative Livestock Feed Supplement. ScientificWorldJournal. 2017;2017:7343928. Epub 20171213. [CrossRef] [PubMed]
- Pena-Espinoza M, Valente AH, Thamsborg SM, Simonsen HT, Boas U, Enemark HL, et al. Antiparasitic activity of chicory (Cichorium intybus) and its natural bioactive compounds in livestock: a review. Parasit Vectors. 2018;11(1):475. Epub 20180822. [CrossRef] [PubMed]
- Huang H, Szumacher-Strabel M, Patra AK, Ślusarczyk S, Lechniak D, Vazirigohar M, et al. Chemical and phytochemical composition, in vitro ruminal fermentation, methane production, and nutrient degradability of fresh and ensiled Paulownia hybrid leaves. Animal Feed Science and Technology. 2021;279:115038. [CrossRef]
- Rufino-Moya PJ, Bertolin JR, Blanco M, Lobon S, Joy M. Fatty acid profile, secondary compounds and antioxidant activities in the fresh forage, hay and silage of sainfoin (Onobrychis viciifolia) and sulla (Hedysarum coronarium). J Sci Food Agric. 2022;102(11):4736-43. Epub 20220319. [CrossRef] [PubMed]
- Martens SD, Hoedtke S, Avila P, Heinritz SN, Zeyner A. Effect of ensiling treatment on secondary compounds and amino acid profile of tropical forage legumes, and implications for their pig feeding potential. J Sci Food Agric. 2014;94(6):1107-15. Epub 20131002. [CrossRef] [PubMed]
- Bochniarz M, Zdzisinska B, Wawron W, Szczubial M, Dabrowski R. Milk and serum IL-4, IL-6, IL-10, and amyloid A concentrations in cows with subclinical mastitis caused by coagulase-negative staphylococci. J Dairy Sci. 2017;100(12):9674-80. Epub 20170928. [CrossRef] [PubMed]
- Osman KM, Hassan HM, Ibrahim IM, Mikhail MM. The impact of staphylococcal mastitis on the level of milk IL-6, lysozyme and nitric oxide. Comp Immunol Microbiol Infect Dis. 2010;33(1):85-93. Epub 20081001. [CrossRef] [PubMed]
- Spittler A, Razenberger M, Kupper H, Kaul M, Hackl W, Boltz-Nitulescu G, et al. Relationship between interleukin-6 plasma concentration in patients with sepsis, monocyte phenotype, monocyte phagocytic properties, and cytokine production. Clin Infect Dis. 2000;31(6):1338-42. Epub 20001122. [CrossRef] [PubMed]
- Uciechowski P, Dempke WCM. Interleukin-6: A Masterplayer in the Cytokine Network. Oncology. 2020;98(3):131-7. Epub 20200120. [CrossRef] [PubMed]
- Forcina L, Franceschi C, Musaro A. The hormetic and hermetic role of IL-6. Ageing Res Rev. 2022;80:101697. Epub 20220716. [CrossRef] [PubMed]
- Silanikove N, Merin U, Shapiro F, Leitner G. Subclinical mastitis in goats is associated with upregulation of nitric oxide-derived oxidative stress that causes reduction of milk antioxidative properties and impairment of its quality. J Dairy Sci. 2014;97(6):3449-55. Epub 20140403. [CrossRef] [PubMed]
- Mezzetti M, Minuti A, Piccioli-Cappelli F, Gabai G, Trevisi E. Administration of an Immune Stimulant during the Transition Period Improved Lipid Metabolism and Rumination without Affecting Inflammatory Status. Animals (Basel). 2019;9(9). Epub 20190828. [CrossRef] [PubMed]
- Tabatabaee N, Heidarpour M, Khoramian B. Milk metabolites, proteins and oxidative stress markers in dairy cows suffering from Staphylococcus aureus subclinical mastitis with or without spontaneous cure. J Dairy Res. 2021;88(3):326-9. Epub 20210812. [CrossRef] [PubMed]
- Wang D, Jia D, He R, Lian S, Wang J, Wu R. Association Between Serum Selenium Level and Subclinical Mastitis in Dairy Cattle. Biol Trace Elem Res. 2021;199(4):1389-96. Epub 20200625. [CrossRef] [PubMed]
- Jing H, Chen Y, Qiu C, Guo MY. LncRNAs Transcriptome Analysis Revealed Potential Mechanisms of Selenium to Mastitis in Dairy Cows. Biol Trace Elem Res. 2022;200(10):4316-24. Epub 20220111. [CrossRef] [PubMed]
- Malbe M, Klaassen M, Fang W, Myllys V, Vikerpuur M, Nyholm K, et al. Comparisons of selenite and selenium yeast feed supplements on Se-incorporation, mastitis and leucocyte function in Se-deficient dairy cows. Zentralbl Veterinarmed A. 1995;42(2):111-21. [CrossRef] [PubMed]
- Smith KL, Hogan JS, Weiss WP. Dietary vitamin E and selenium affect mastitis and milk quality. J Anim Sci. 1997;75(6):1659-65. [CrossRef] [PubMed]
- Salman S, Khol-Parisini A, Schafft H, Lahrssen-Wiederholt M, Hulan HW, Dinse D, et al. The role of dietary selenium in bovine mammary gland health and immune function. Anim Health Res Rev. 2009;10(1):21-34. Epub 20090206. [CrossRef] [PubMed]
Figure 1.
Experimental design with treatments and timeline for the collection of samples.
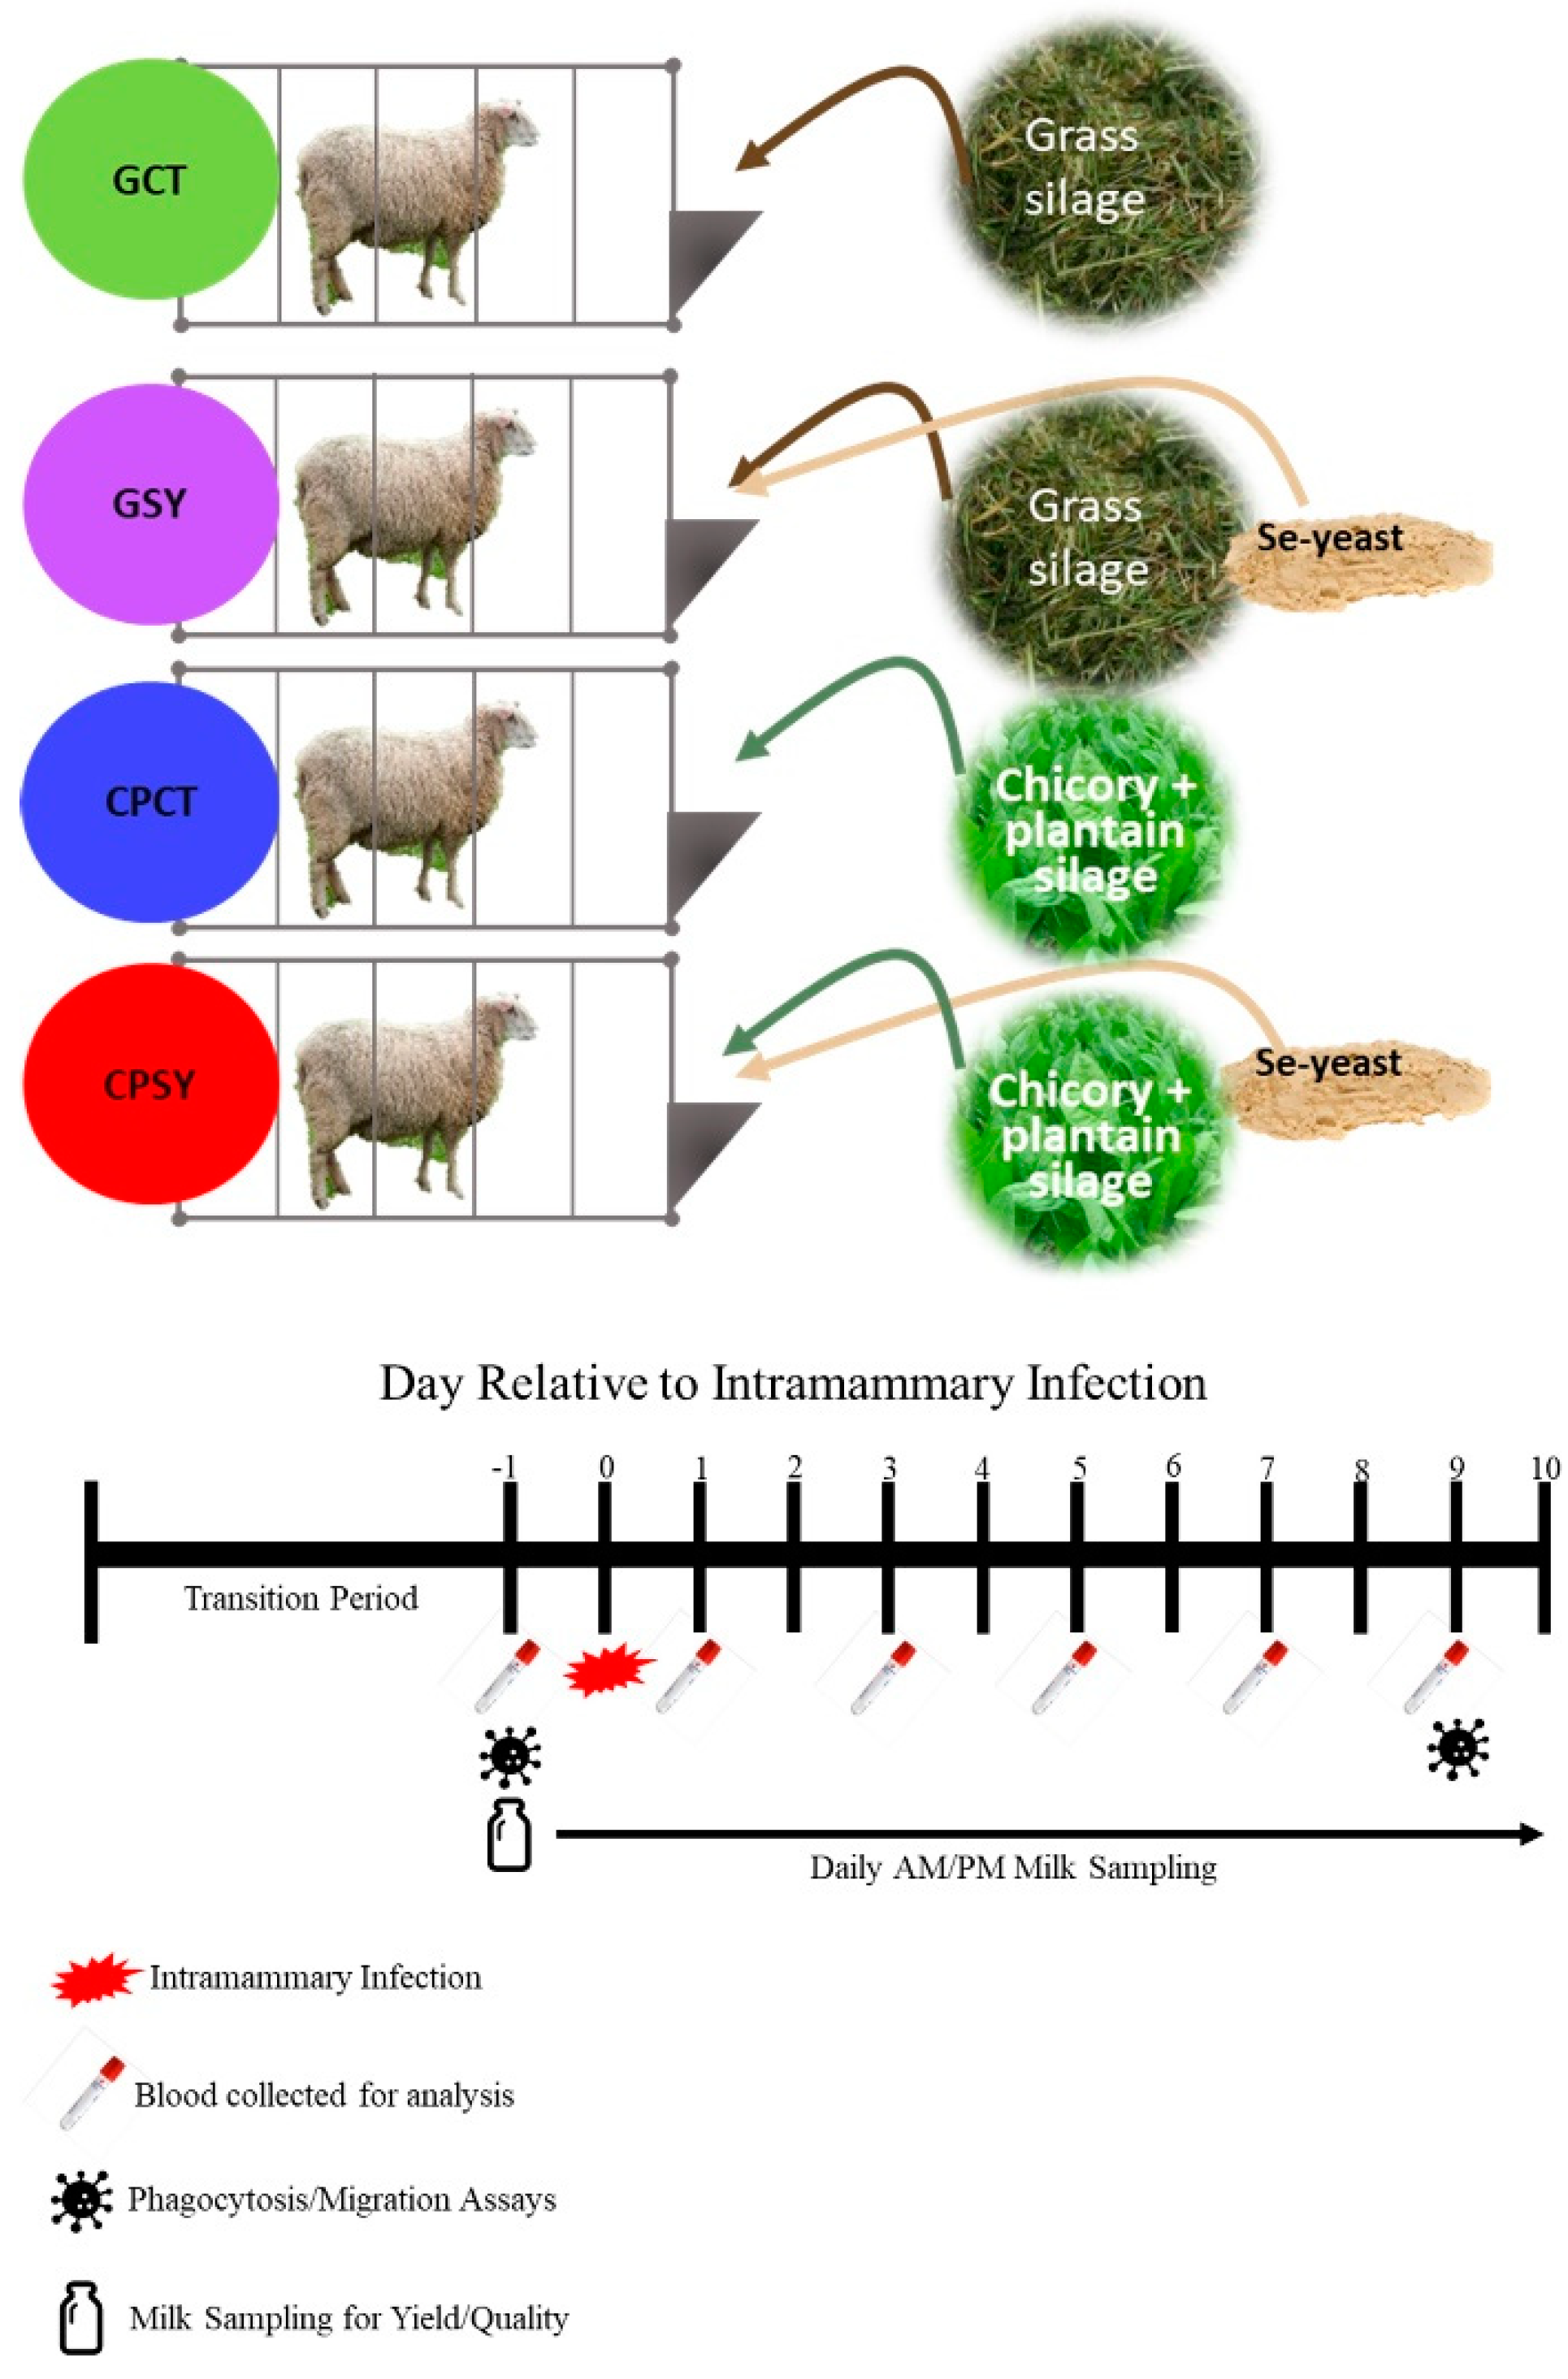
Figure 2.
Somatic cells count in milk and rectal temperature in ewes fed chicory+plantain (CP) or grass (G) silage and either supplemented with Se-yeast (SY) or not (CT). An intramammary infection (IMI) was induced in both mammary glands using Strep. Uberis (dotted line; time 0 from IMI). Indicated in the graph as T (Time), (Se) Se supplementation, and/or F (type of forage), and their interactions when significant (P<0.05). For a tendency, the P-value is reported. * denotes significant (P<0.05) difference relative to -24 h relative to IMI.
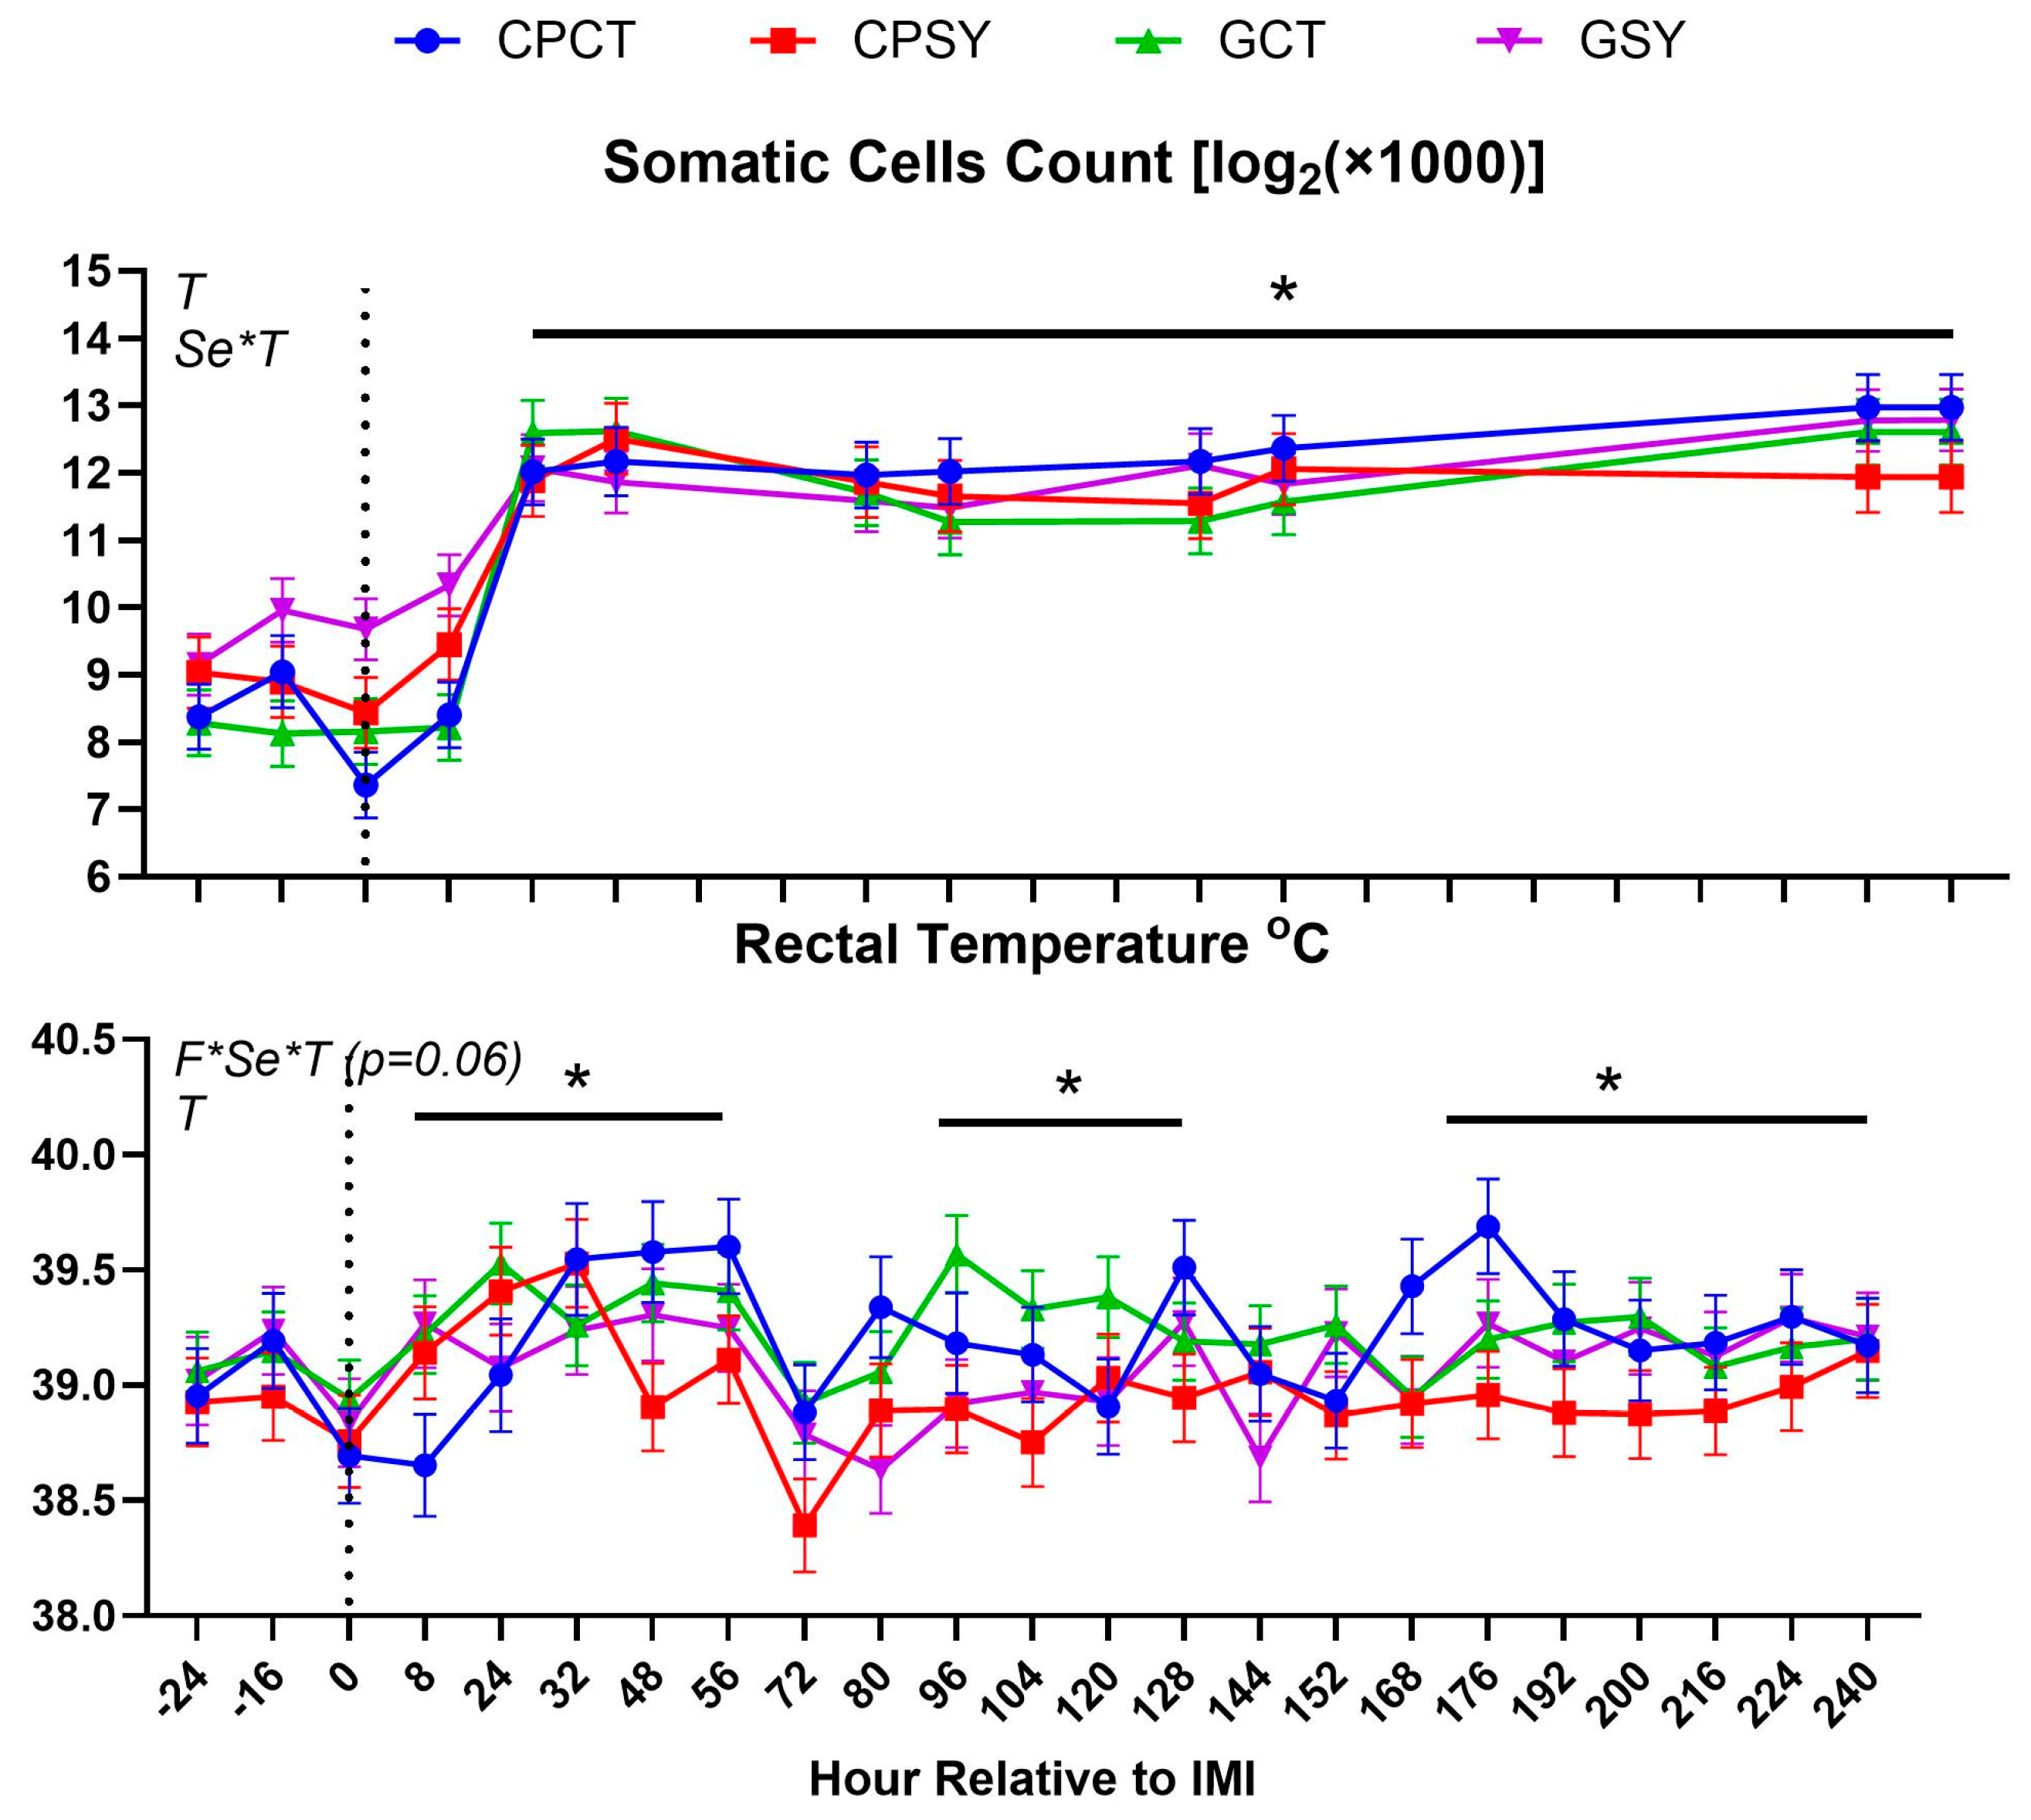
Figure 3.
Frequency of different bacterium types and yeast and mean bacteria count in milk of ewes fed chicory+plantain (CP) or grass (G) silage and either supplemented with Se-yeast (SY) or not (CT). An intramammary infection was induced in both mammary glands using Strep. Uberis. ). Indicated in the graph as T (Time), (Se) Se supplementation, and/or F (type of forage), and their interactions when significant (P<0.05). For a tendency, the P-value is reported.
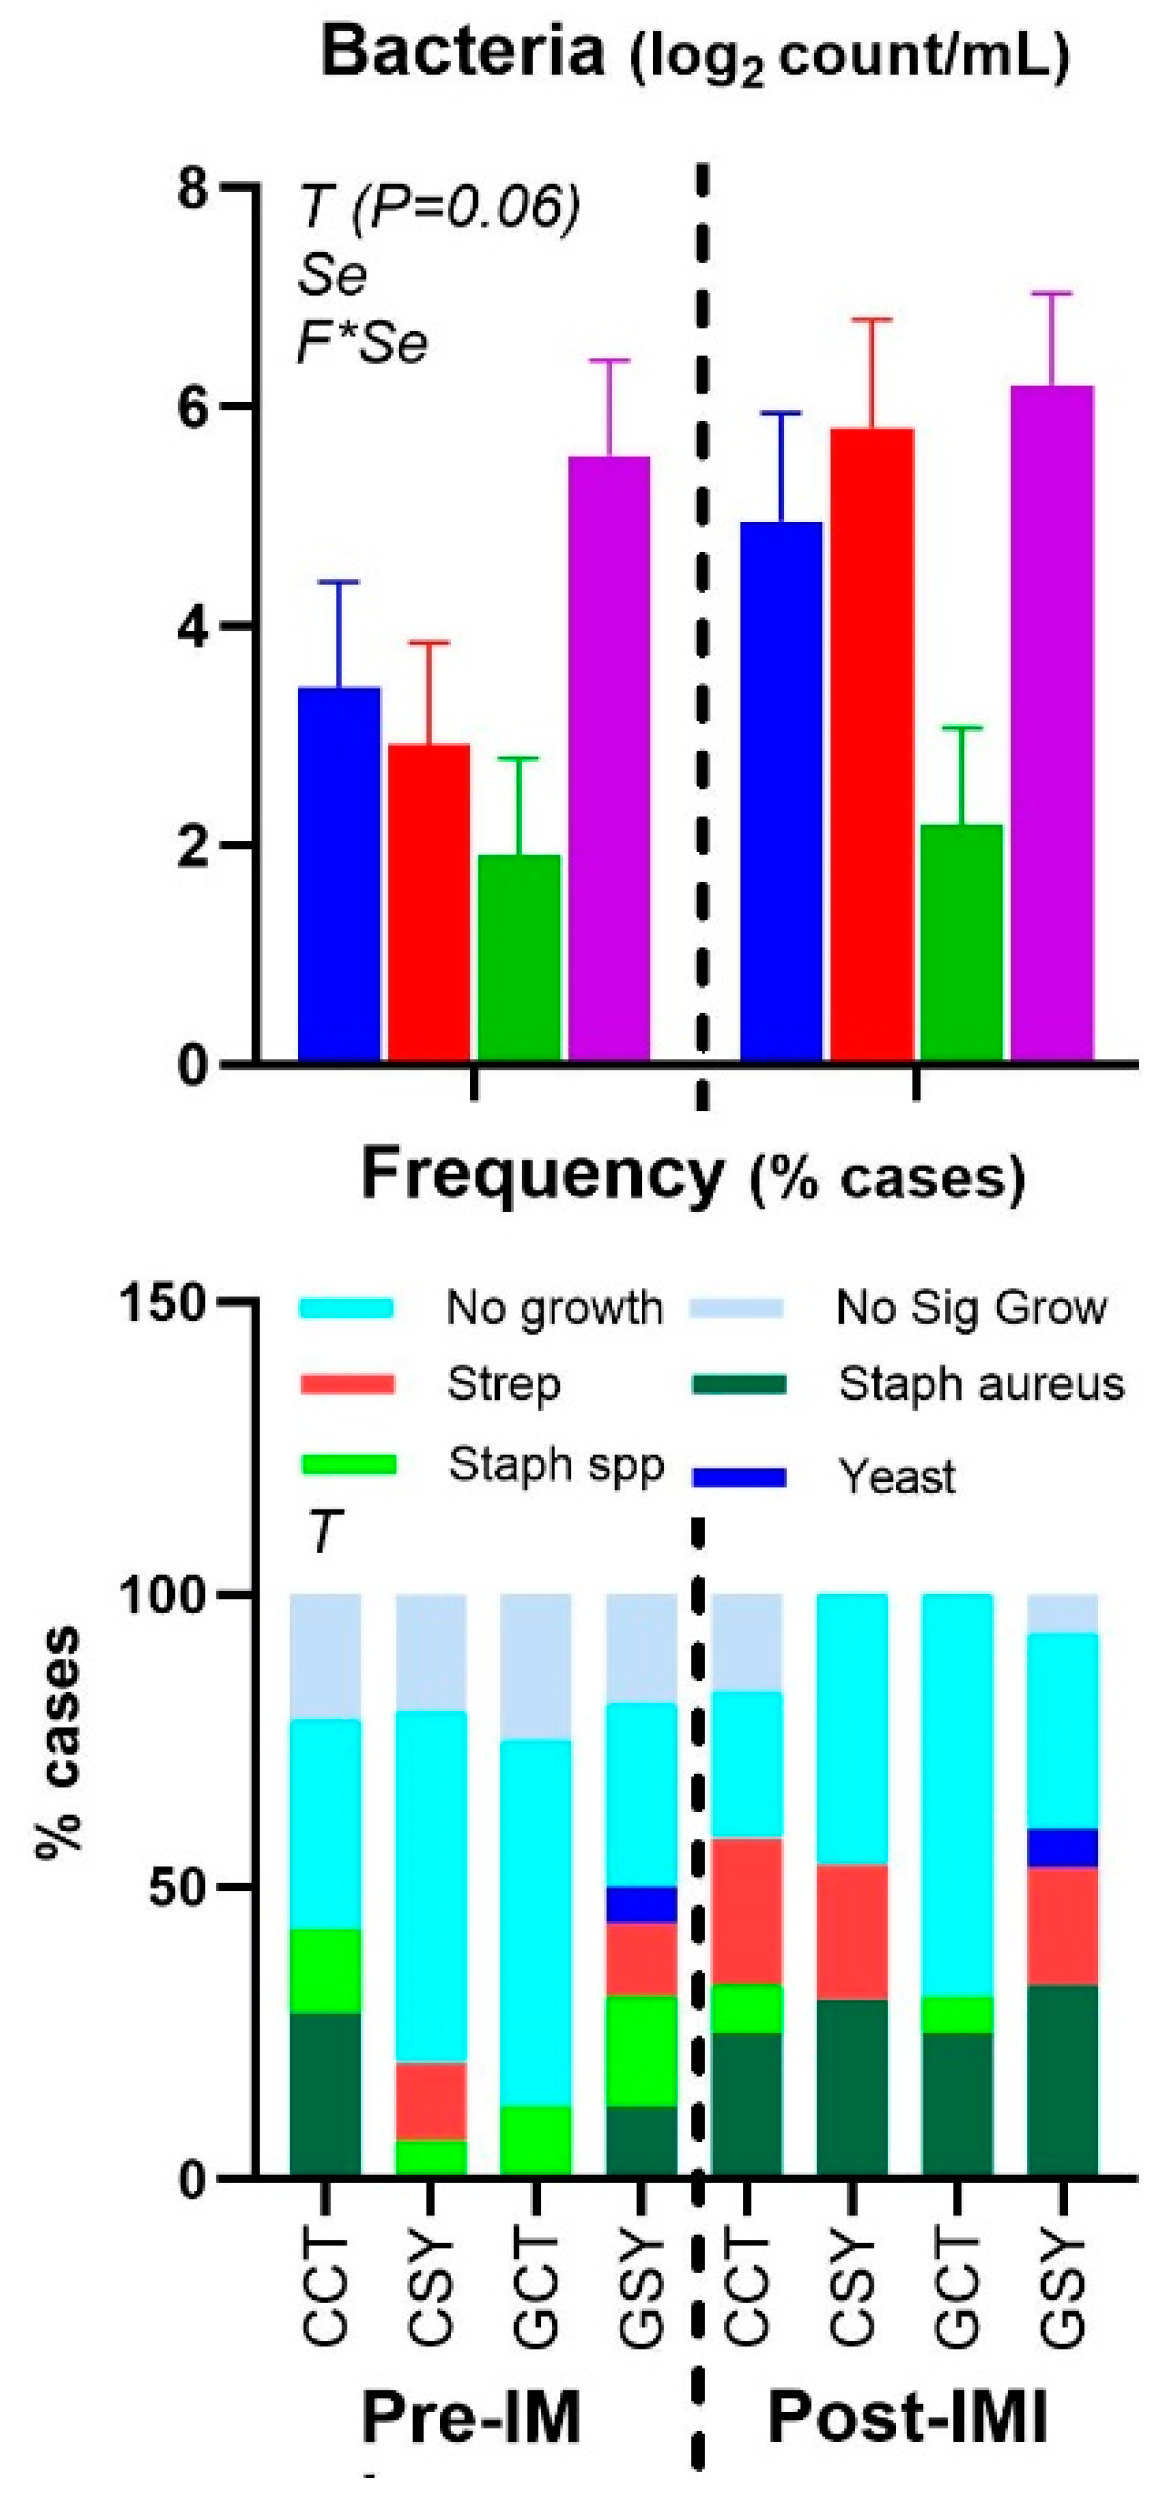
Figure 4.
Dry matter intake (DMI), milk yield, water intake, and blood urea in ewes fed chicory+plantain (CP) or grass (G) silage and either supplemented with Se-yeast (SY) or not (CT). An intramammary infection (IMI) was induced in both mammary glands using Strep. Uberis (dotted line). ). Indicated in the graph as T (Time), (Se) Se supplementation, and/or F (type of forage), and their interactions when significant (P<0.05). For a tendency, the P-value is reported. * denotes significant (P<0.05) difference relative to time -1 relative to IMI. Different letters denote significant (P<0.05) differences between groups at the same time point.
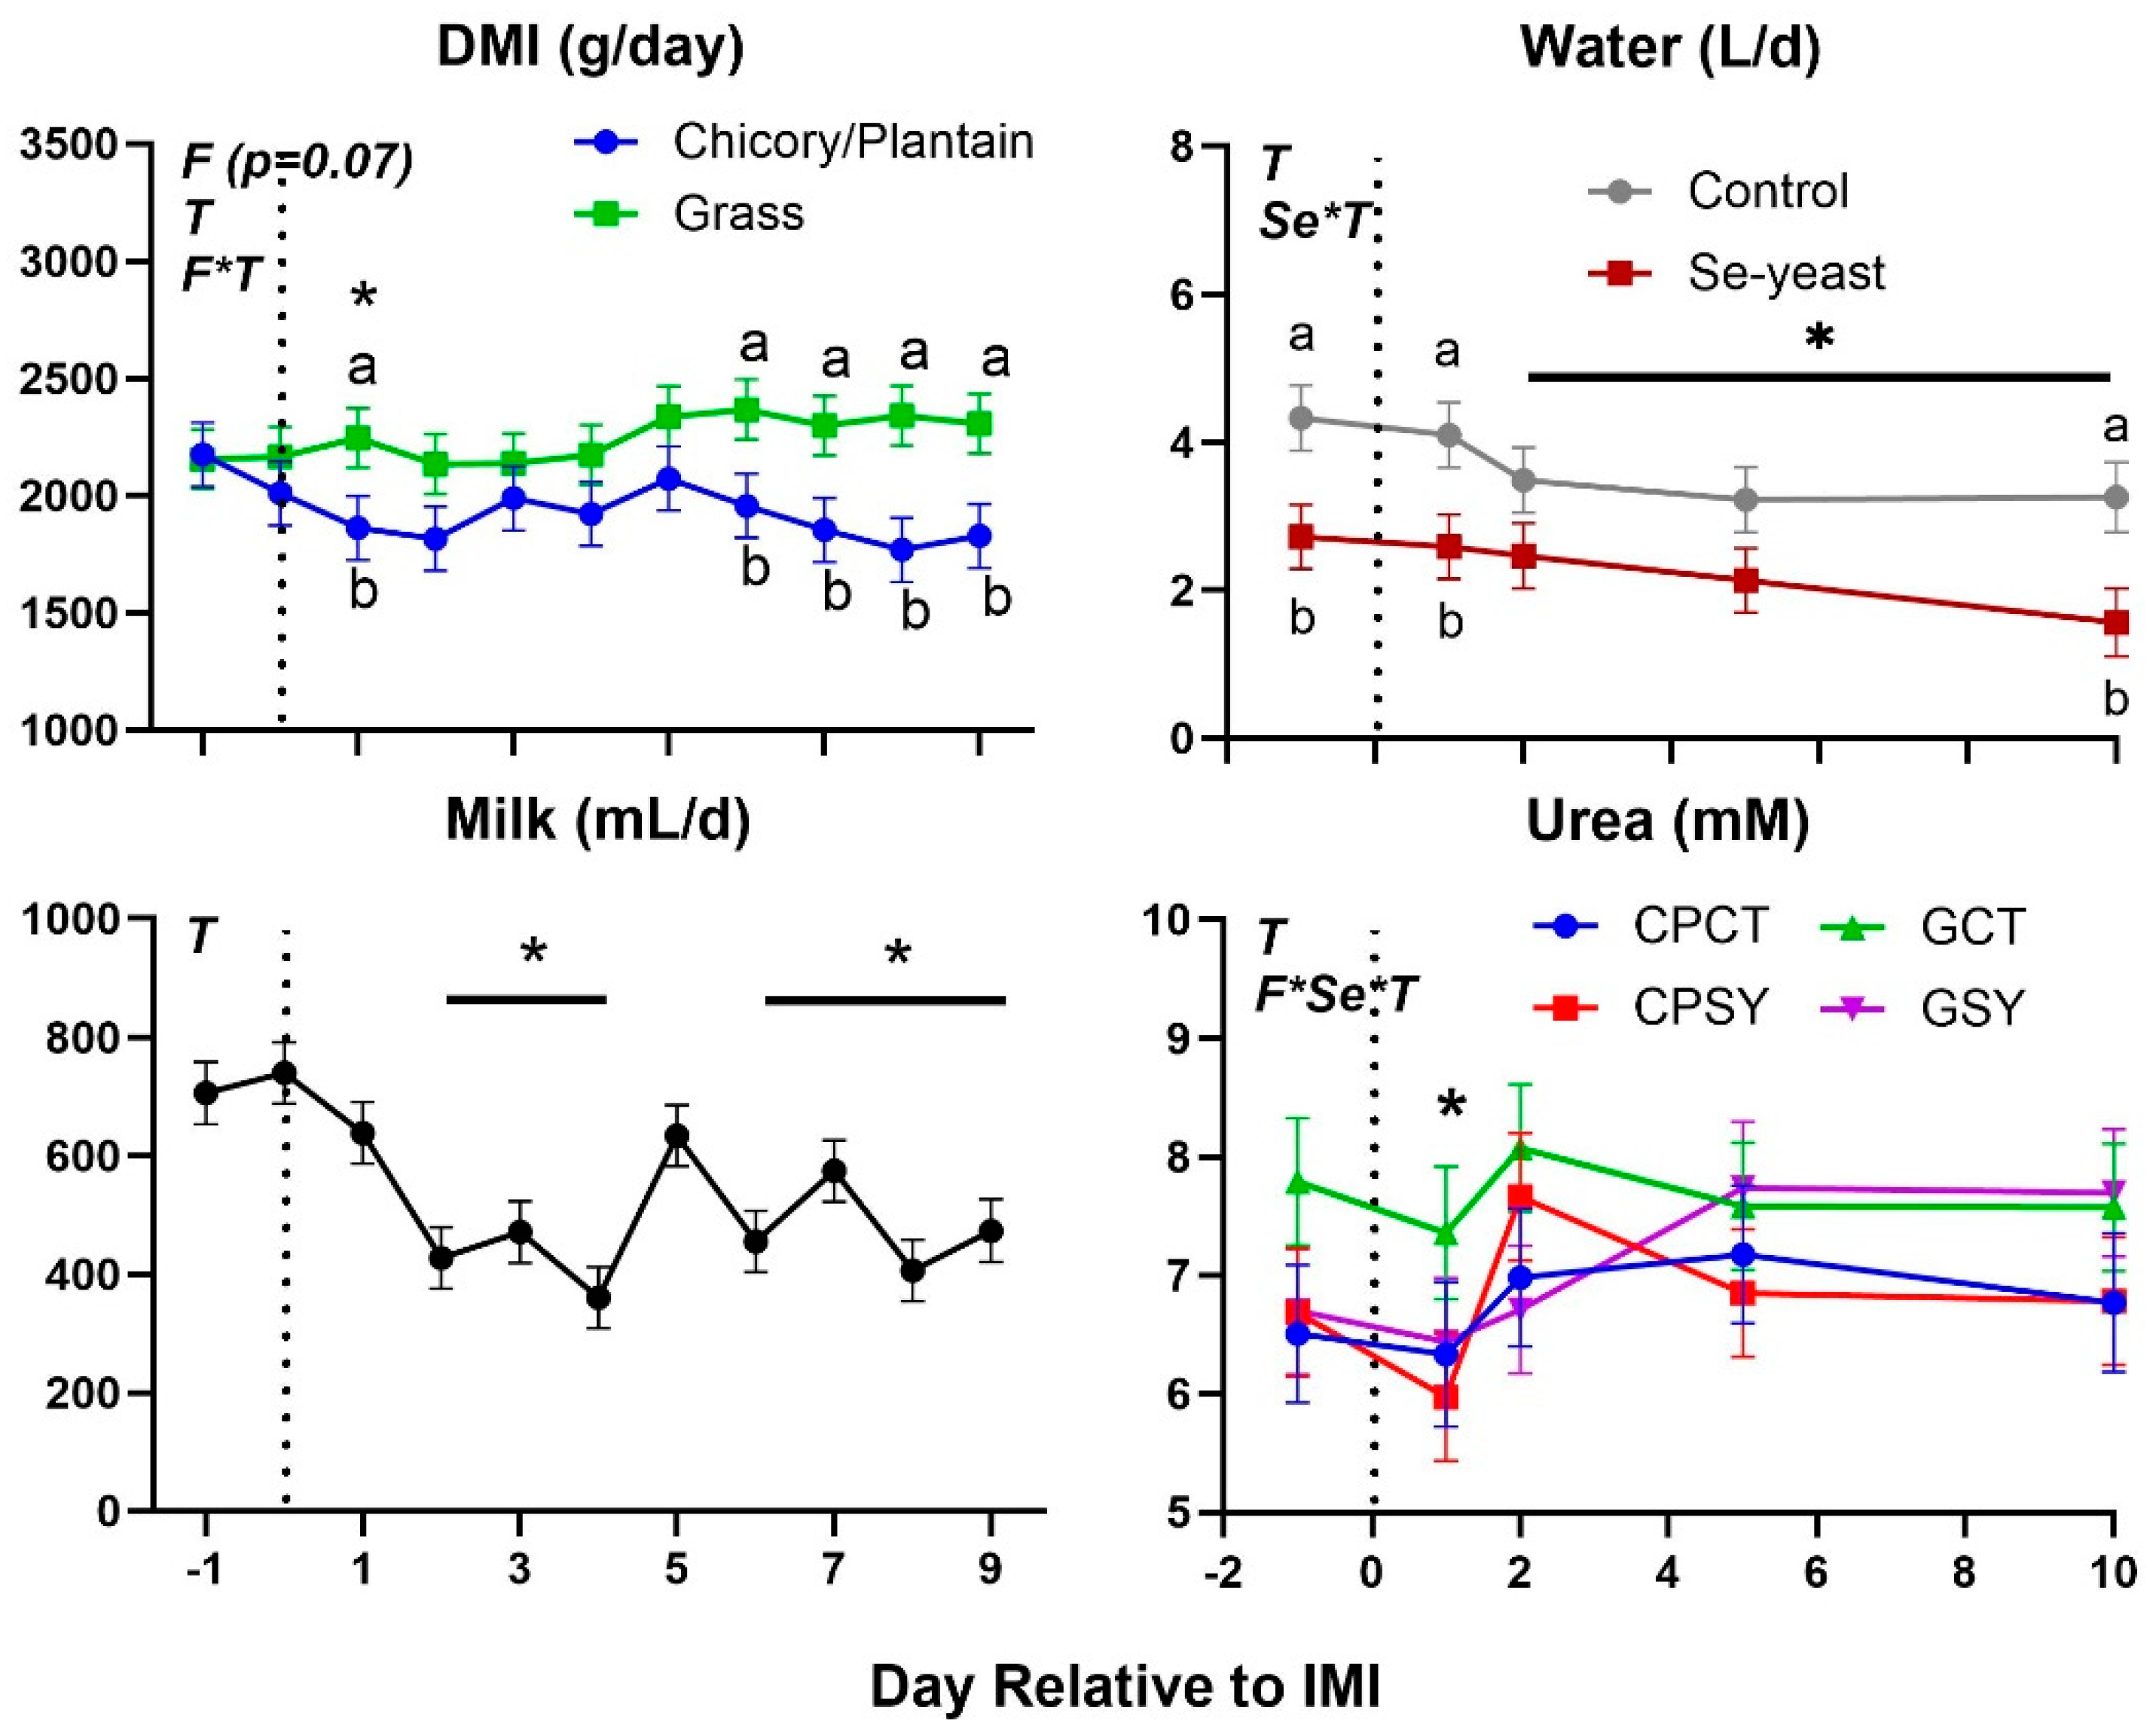
Figure 5.
Trend of the non-fat milk components in ewes fed chicory+plantain (CP) or grass (G) silage and either supplemented with Se-yeast (SY) or not (CT). An intramammary infection (IMI) was induced in both mammary glands using Strep. Uberis (dotted line). Time was significant (P<0.05) in all the reported parameters. A significant (P<0.05) Forage×Time was detected for % of protein. * denotes significant (P<0.05) difference relative to time-1 relative to IMI. Different letters denote significant (P<0.05) differences between forage groups at the same time point.
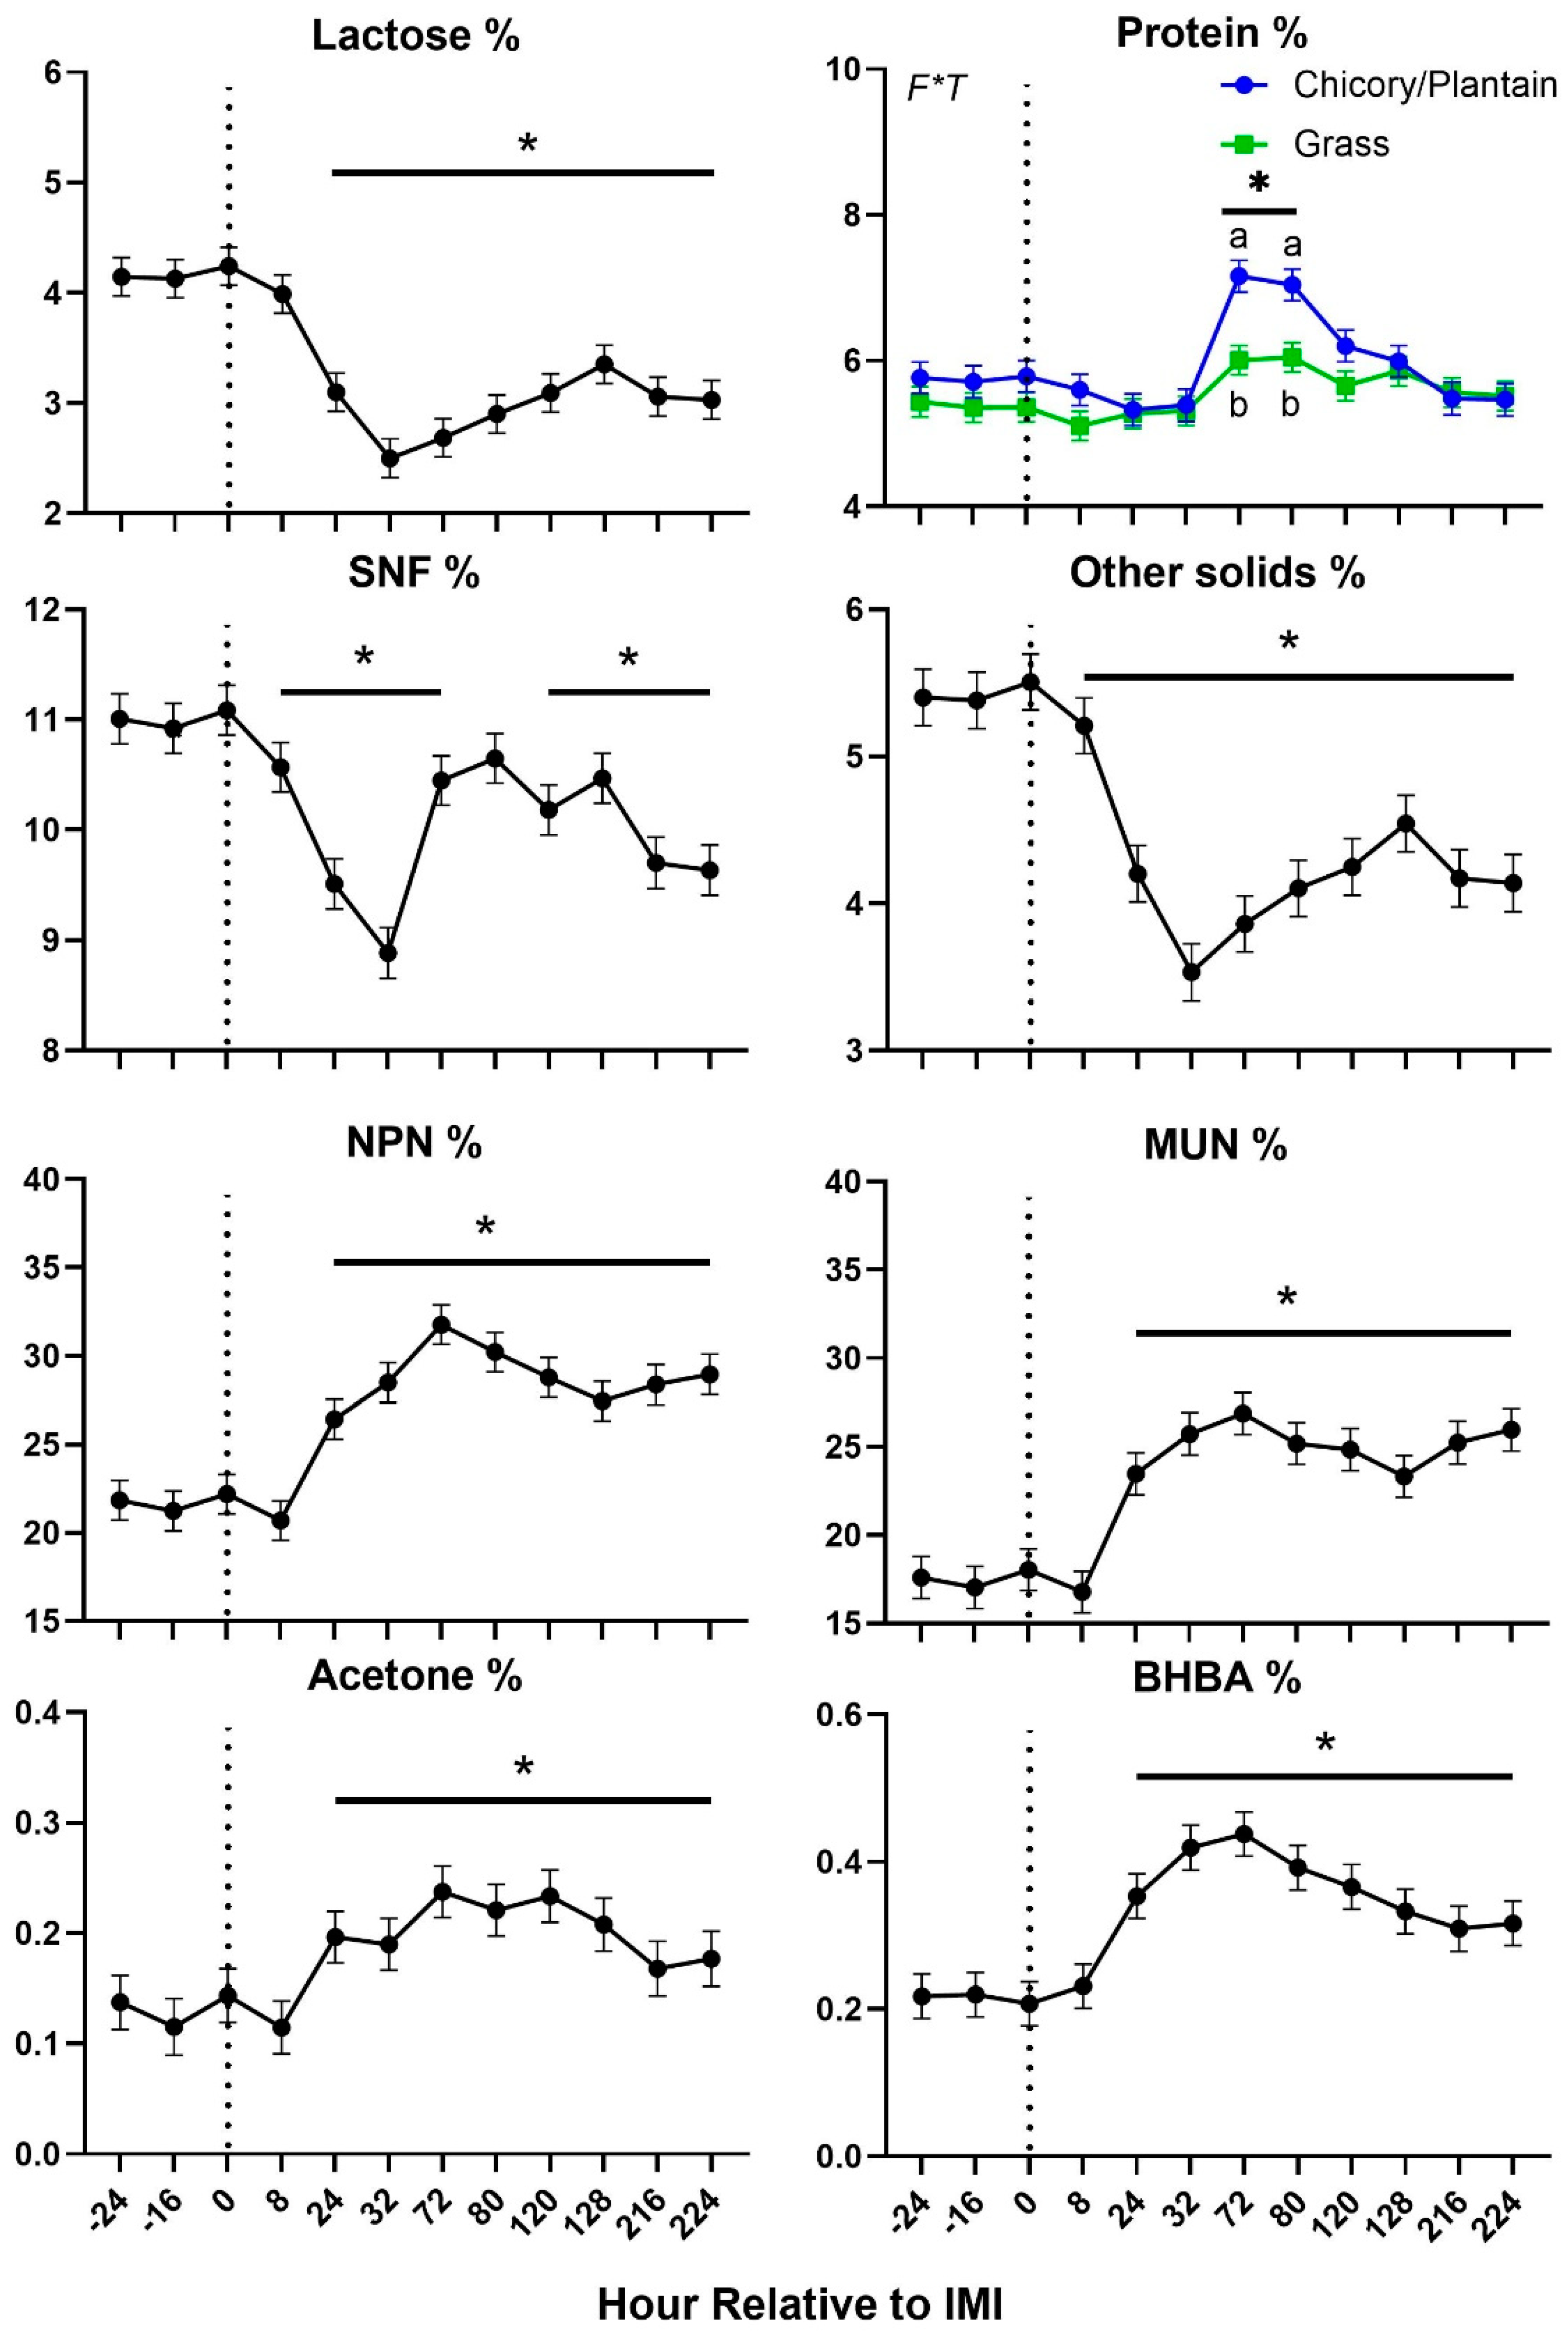
Figure 6.
Trend of fat-related milk components in ewes fed chicory+plantain (CP) or grass (G) silage and either supplemented with Se-yeast (SY) or not (CT). An intramammary infection (IMI) was induced in both mammary glands using Strep. Uberis (dotted line). Time was significant (P<0.05) in all the reported parameters. * denotes significant (P<0.05) difference relative to time-1 relative to IMI.
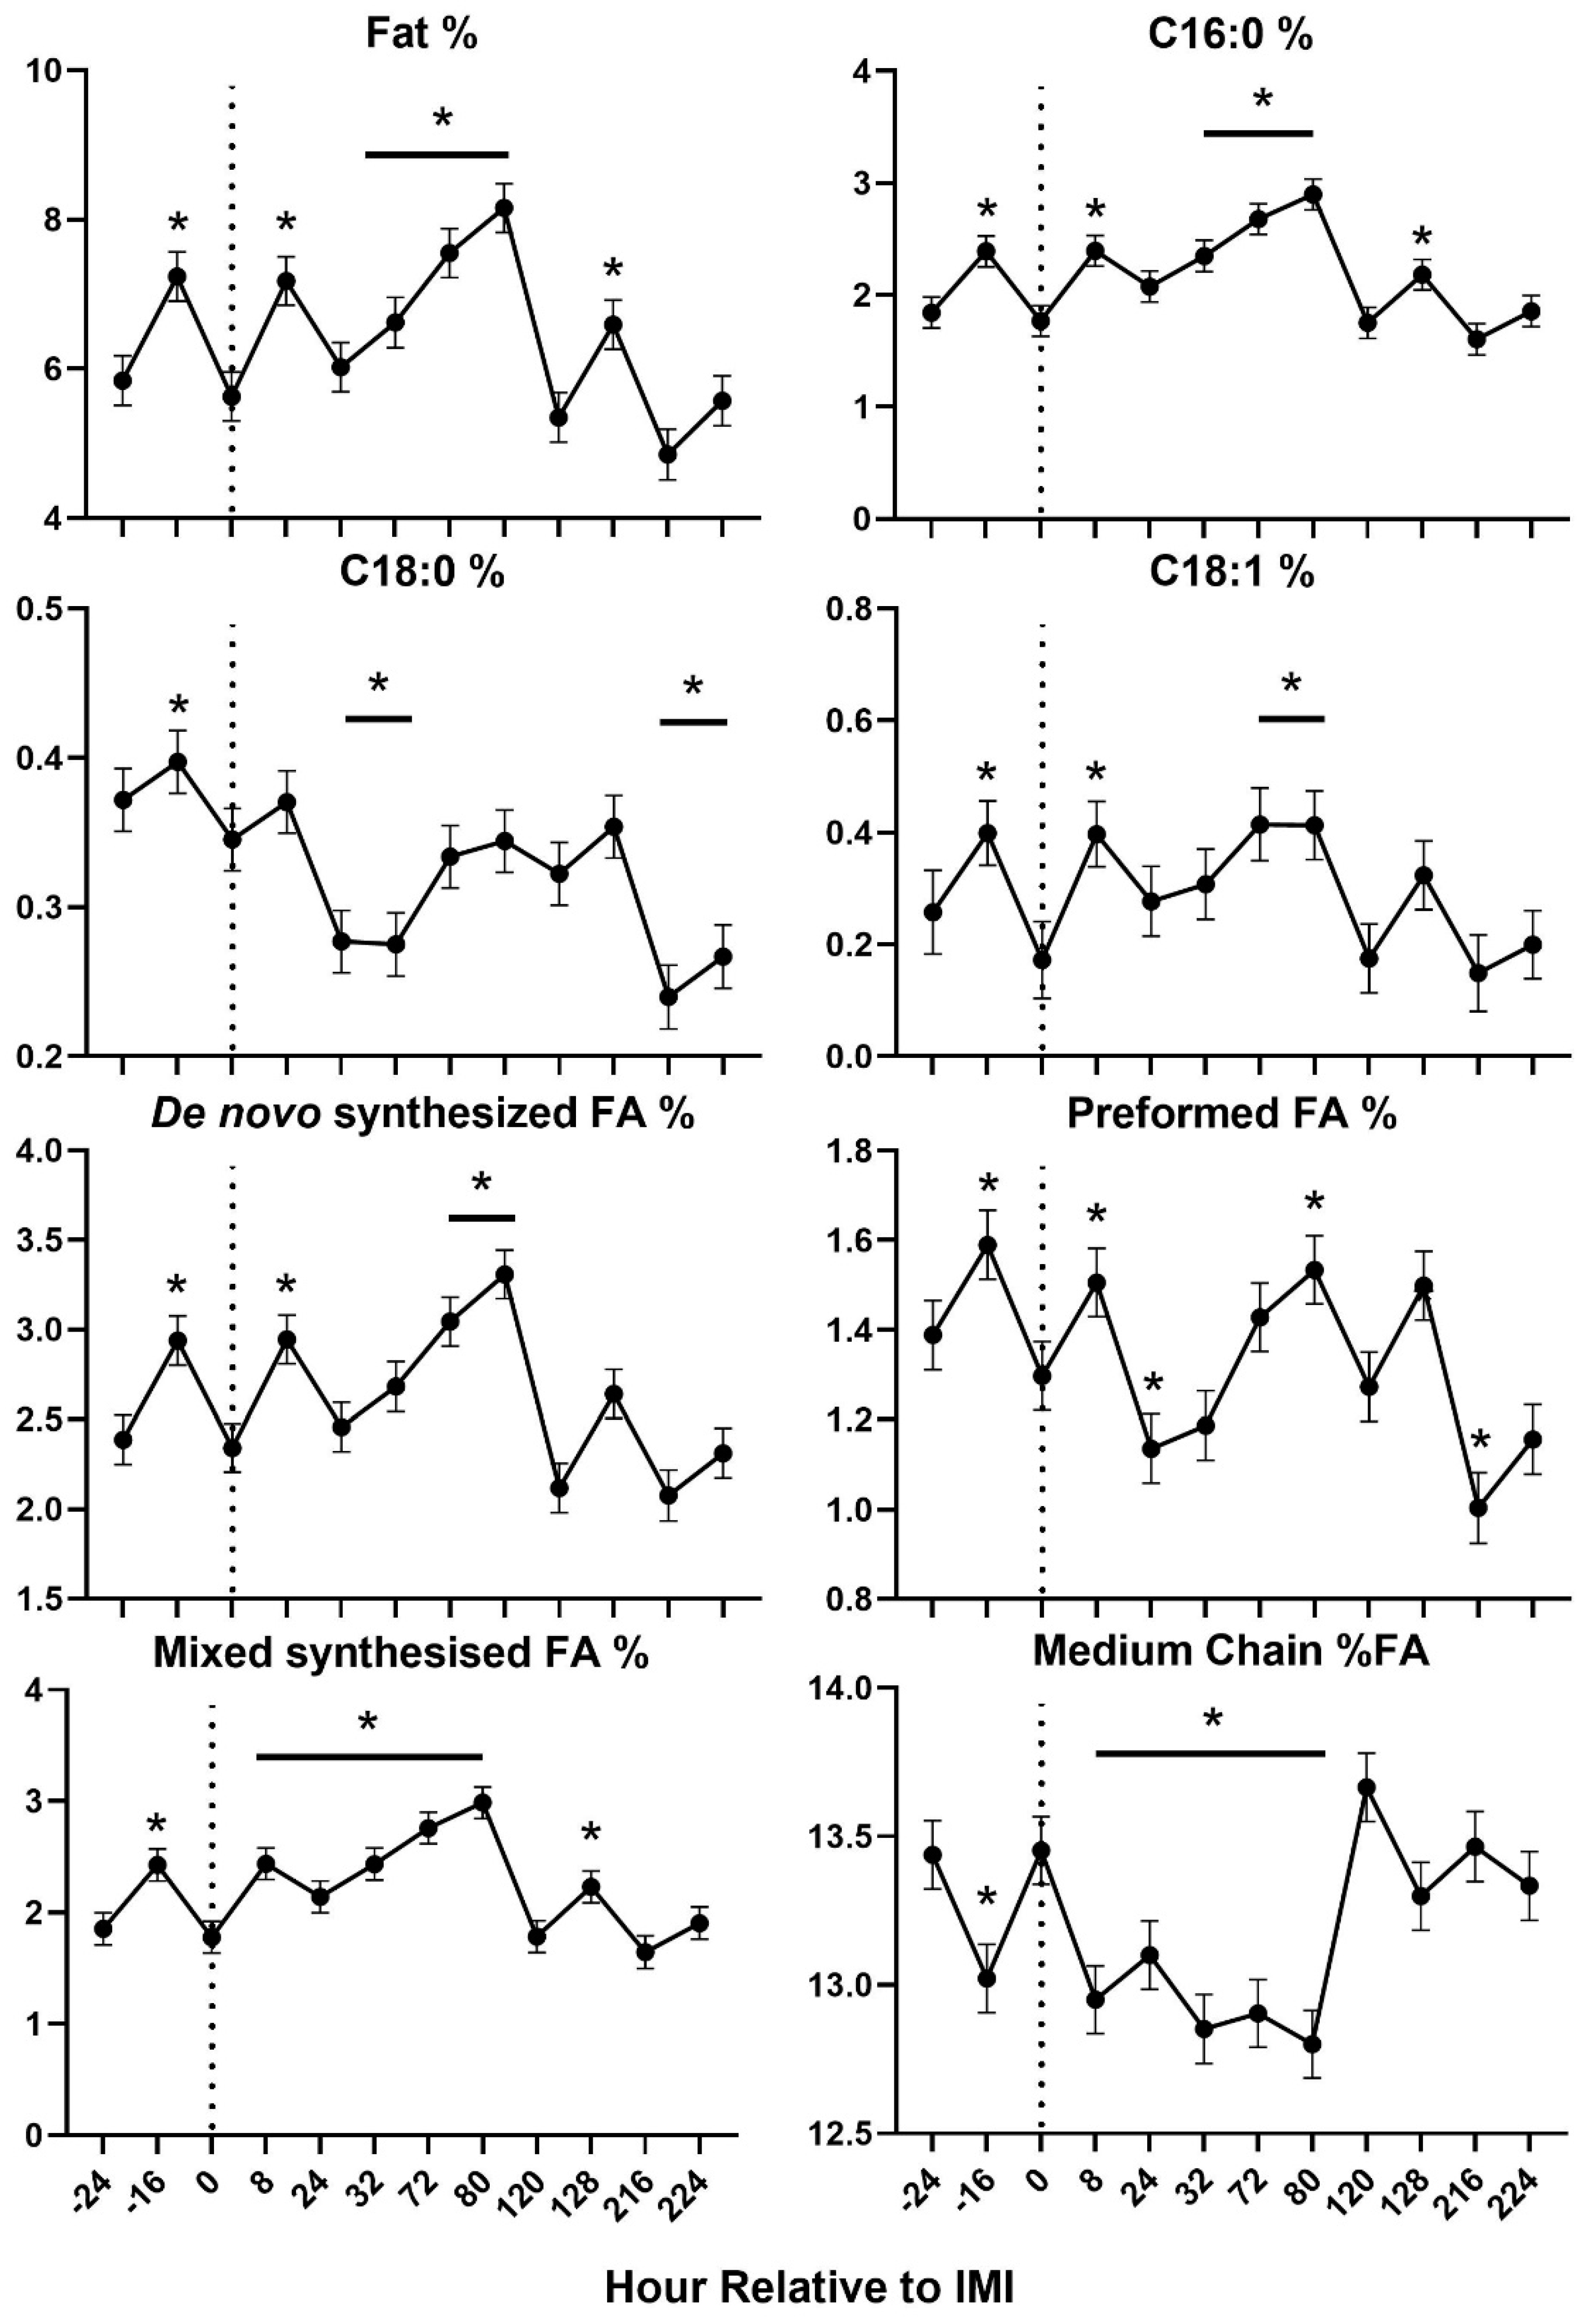
Figure 7.
Trend of blood parameters related to inflammation in ewes fed chicory+plantain (CP) or grass (G) silage and either supplemented with Se-yeast (SY) or not (CT). An intramammary infection (IMI) was induced in both mammary glands using Strep. Uberis (dotted line). Time was significant (P<0.05) in all the reported parameters. Few parameters were significantly (P<0.05) affected by Forage (F), Se supplementation×Time (Se*T), and F*T. * denotes significant (P<0.05) difference relative to time -1 relative to IMI. Different letters denote significant (P<0.05) differences between groups at the same time point.
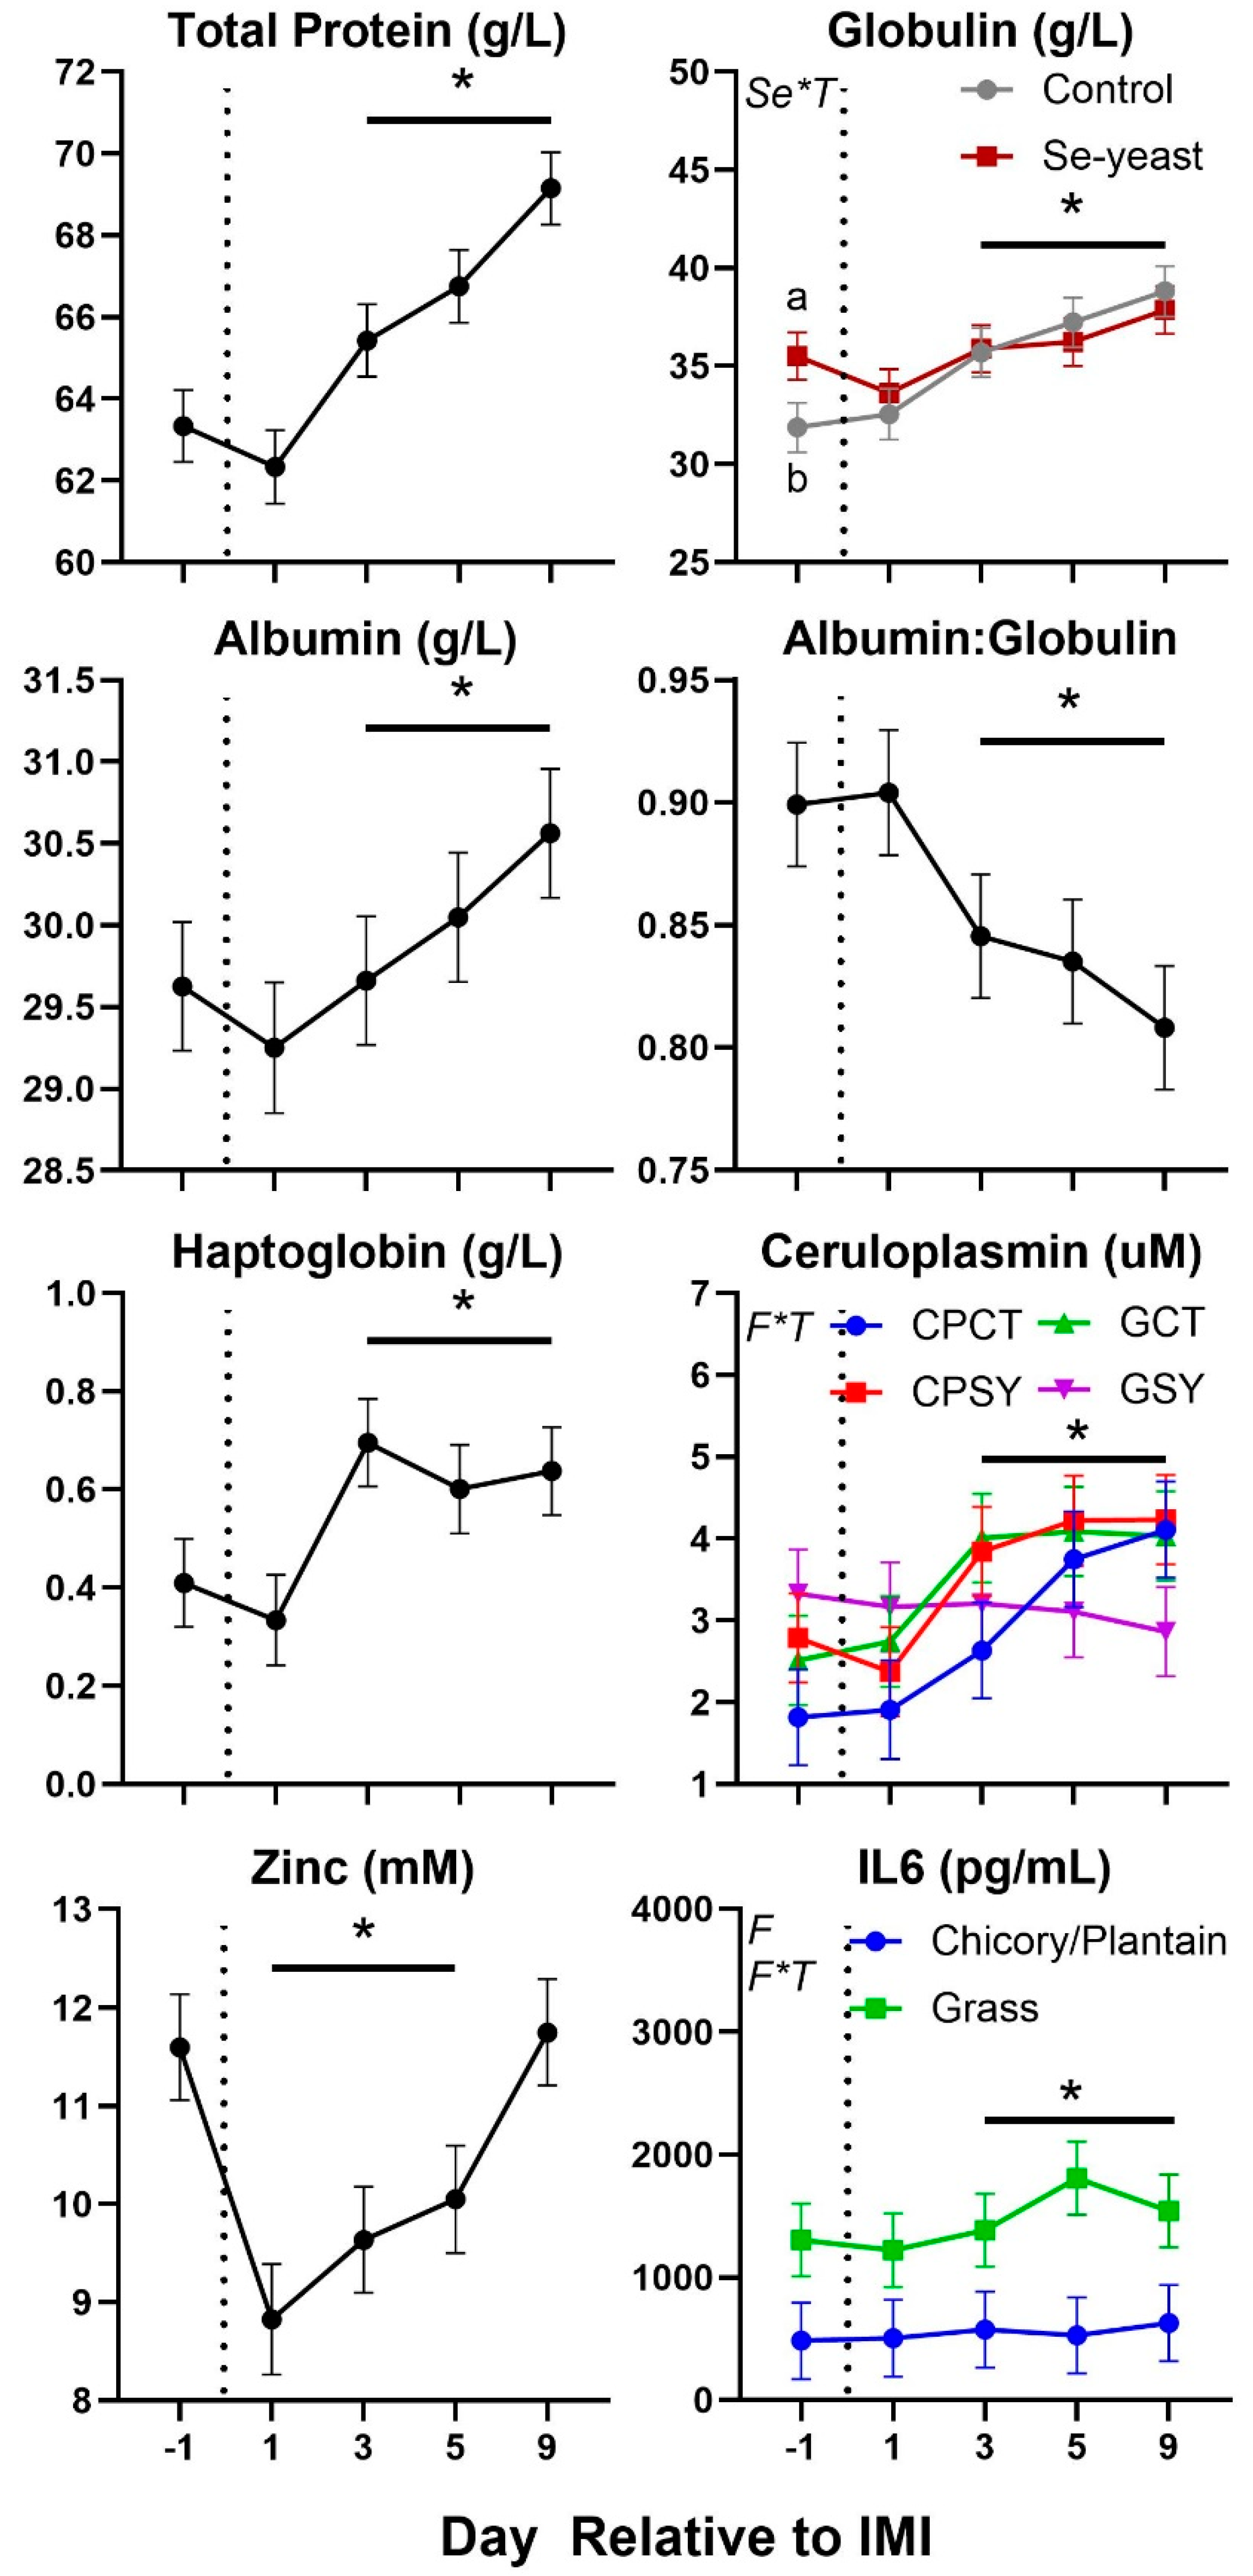
Figure 8.
Trend of parameters related to oxidative stress in ewes fed chicory+plantain (CP) or grass (G) silage and either supplemented with Se-yeast (SY) or not (CT). An intramammary infection (IMI) was induced in both mammary glands using Strep. Uberis (dotted line). Time was significant (P<0.05) in all the reported parameters. Few parameters were significantly (P<0.05) affected by Se supplementation×Time (Se*T) and Forage×Time (F*T). * denotes significant (P<0.05) difference relative to time -1 relative to IMI. Different letters denote significant (P<0.05) differences between groups at the same time point.
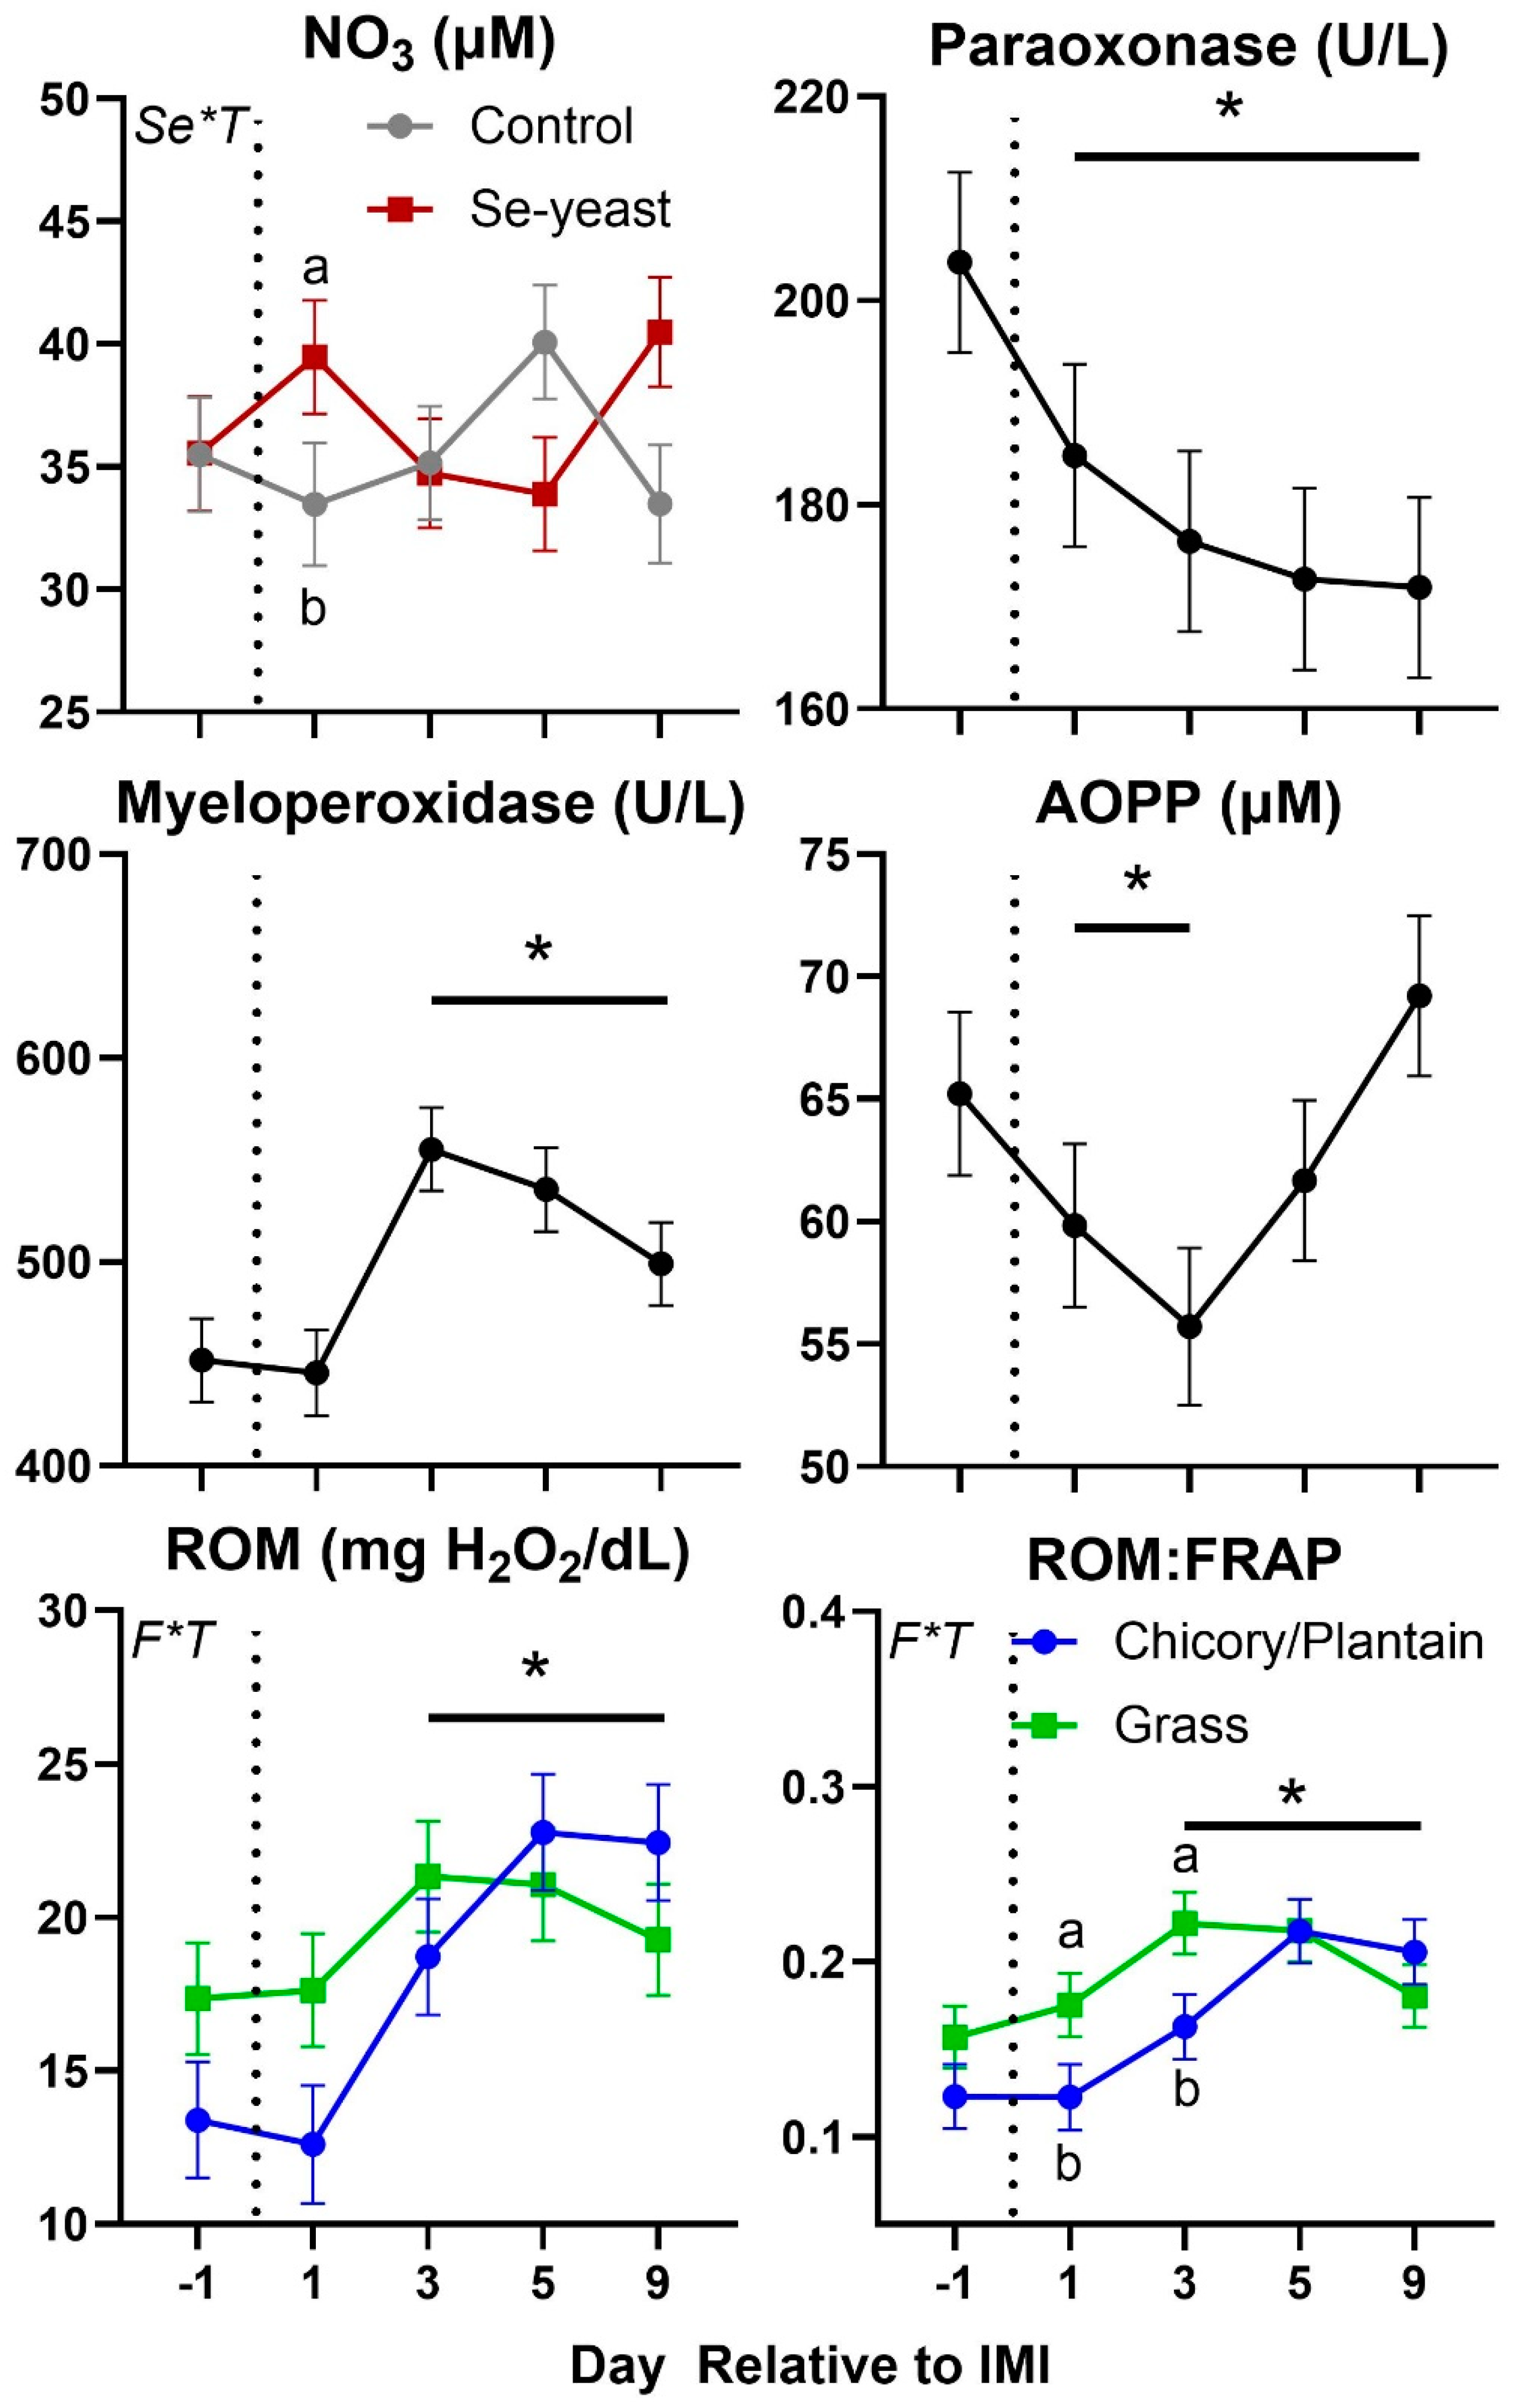
Figure 9.
Trend of blood parameters related to complete blood counts in ewes fed chicory+plantain (CP) or grass (G) silage and either supplemented with Se-yeast (SY) or not (CT). An intramammary infection (IMI) was induced in both mammary glands using Strep. Uberis (dotted line). ). Time was significant (P<0.05) in all the reported parameters. Few parameters were significantly (P<0.05) affected by Se supplementation×Time (Se*T). * denotes significant (P<0.05) difference relative to time -1 relative to IMI. Different letters denote significant (P<0.05) differences between groups at the same time point.
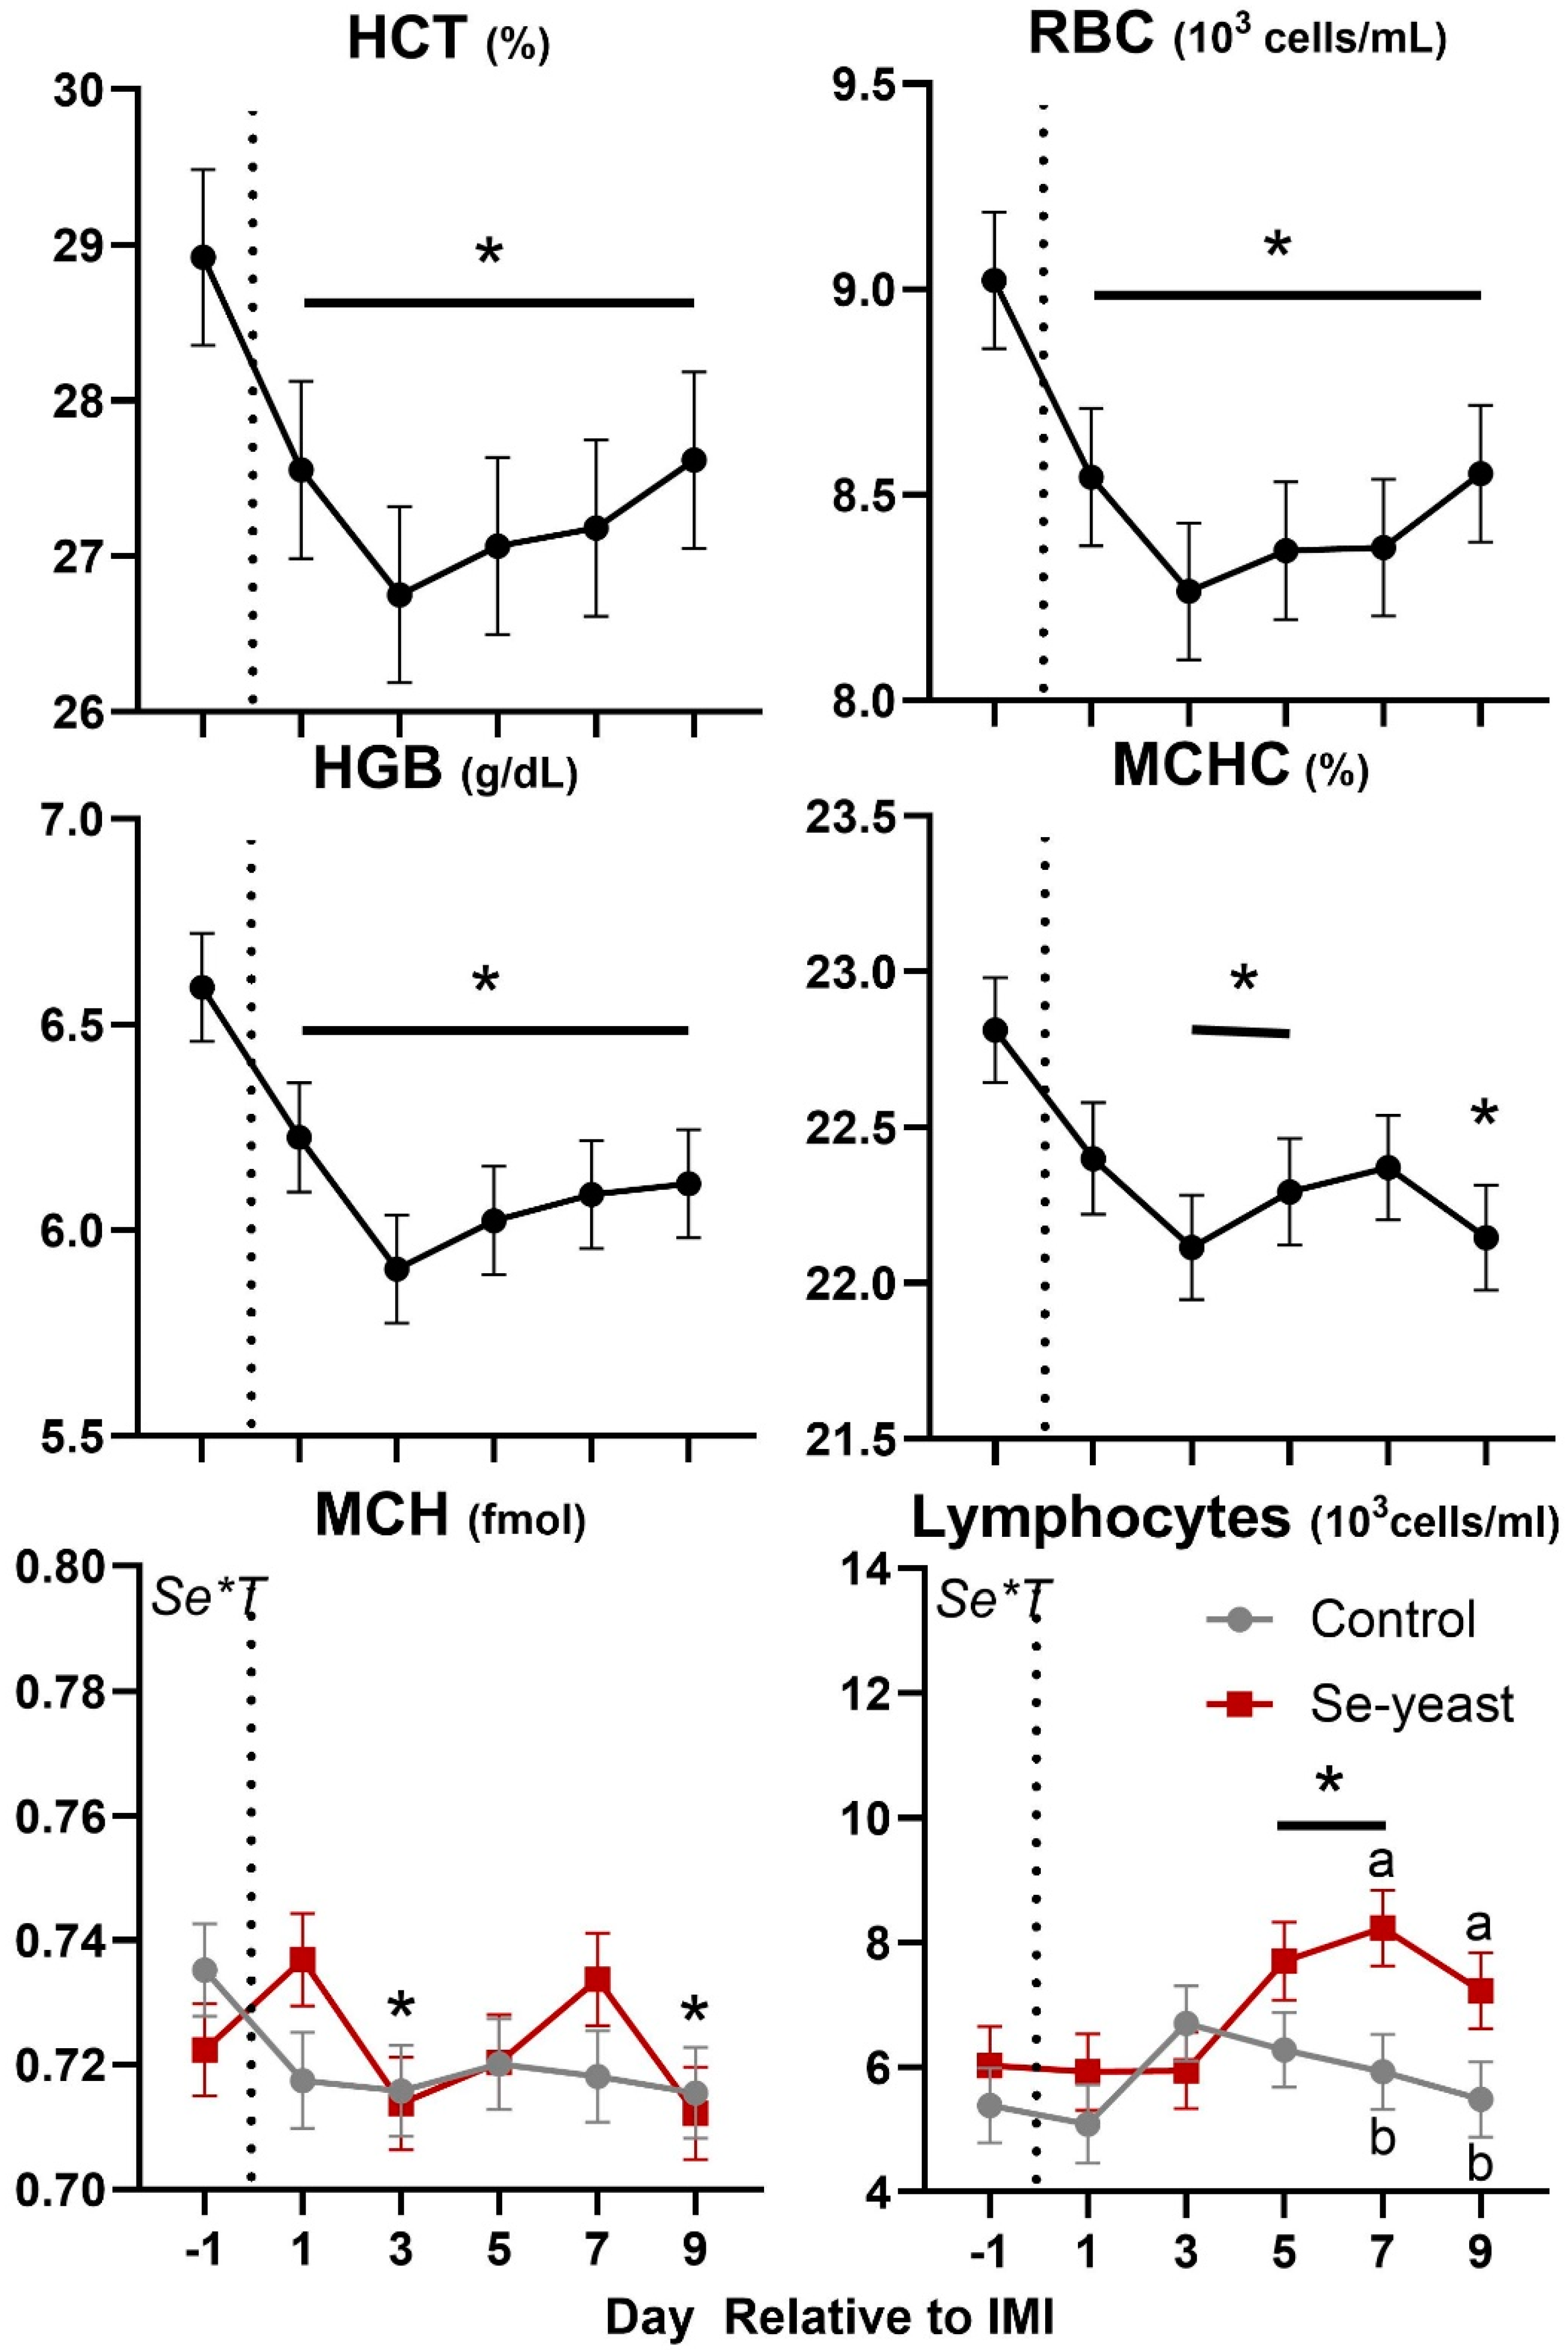
Figure 10.
Trend of leukocytes phagocytosis and neutrophil migration in ewes fed chicory+plantain (CP) or grass (G) silage and either supplemented with Se-yeast (SY) or not (CT). An intramammary infection (IMI) was induced in both mammary glands using Strep. Uberis (dotted line). ). Indicated in the graph as T (Time), (Se) Se supplementation, and/or F (type of forage), and their interactions when significant (P<0.05). For a tendency, the P-value is reported. Different letters denote significant (P<0.05) difference.
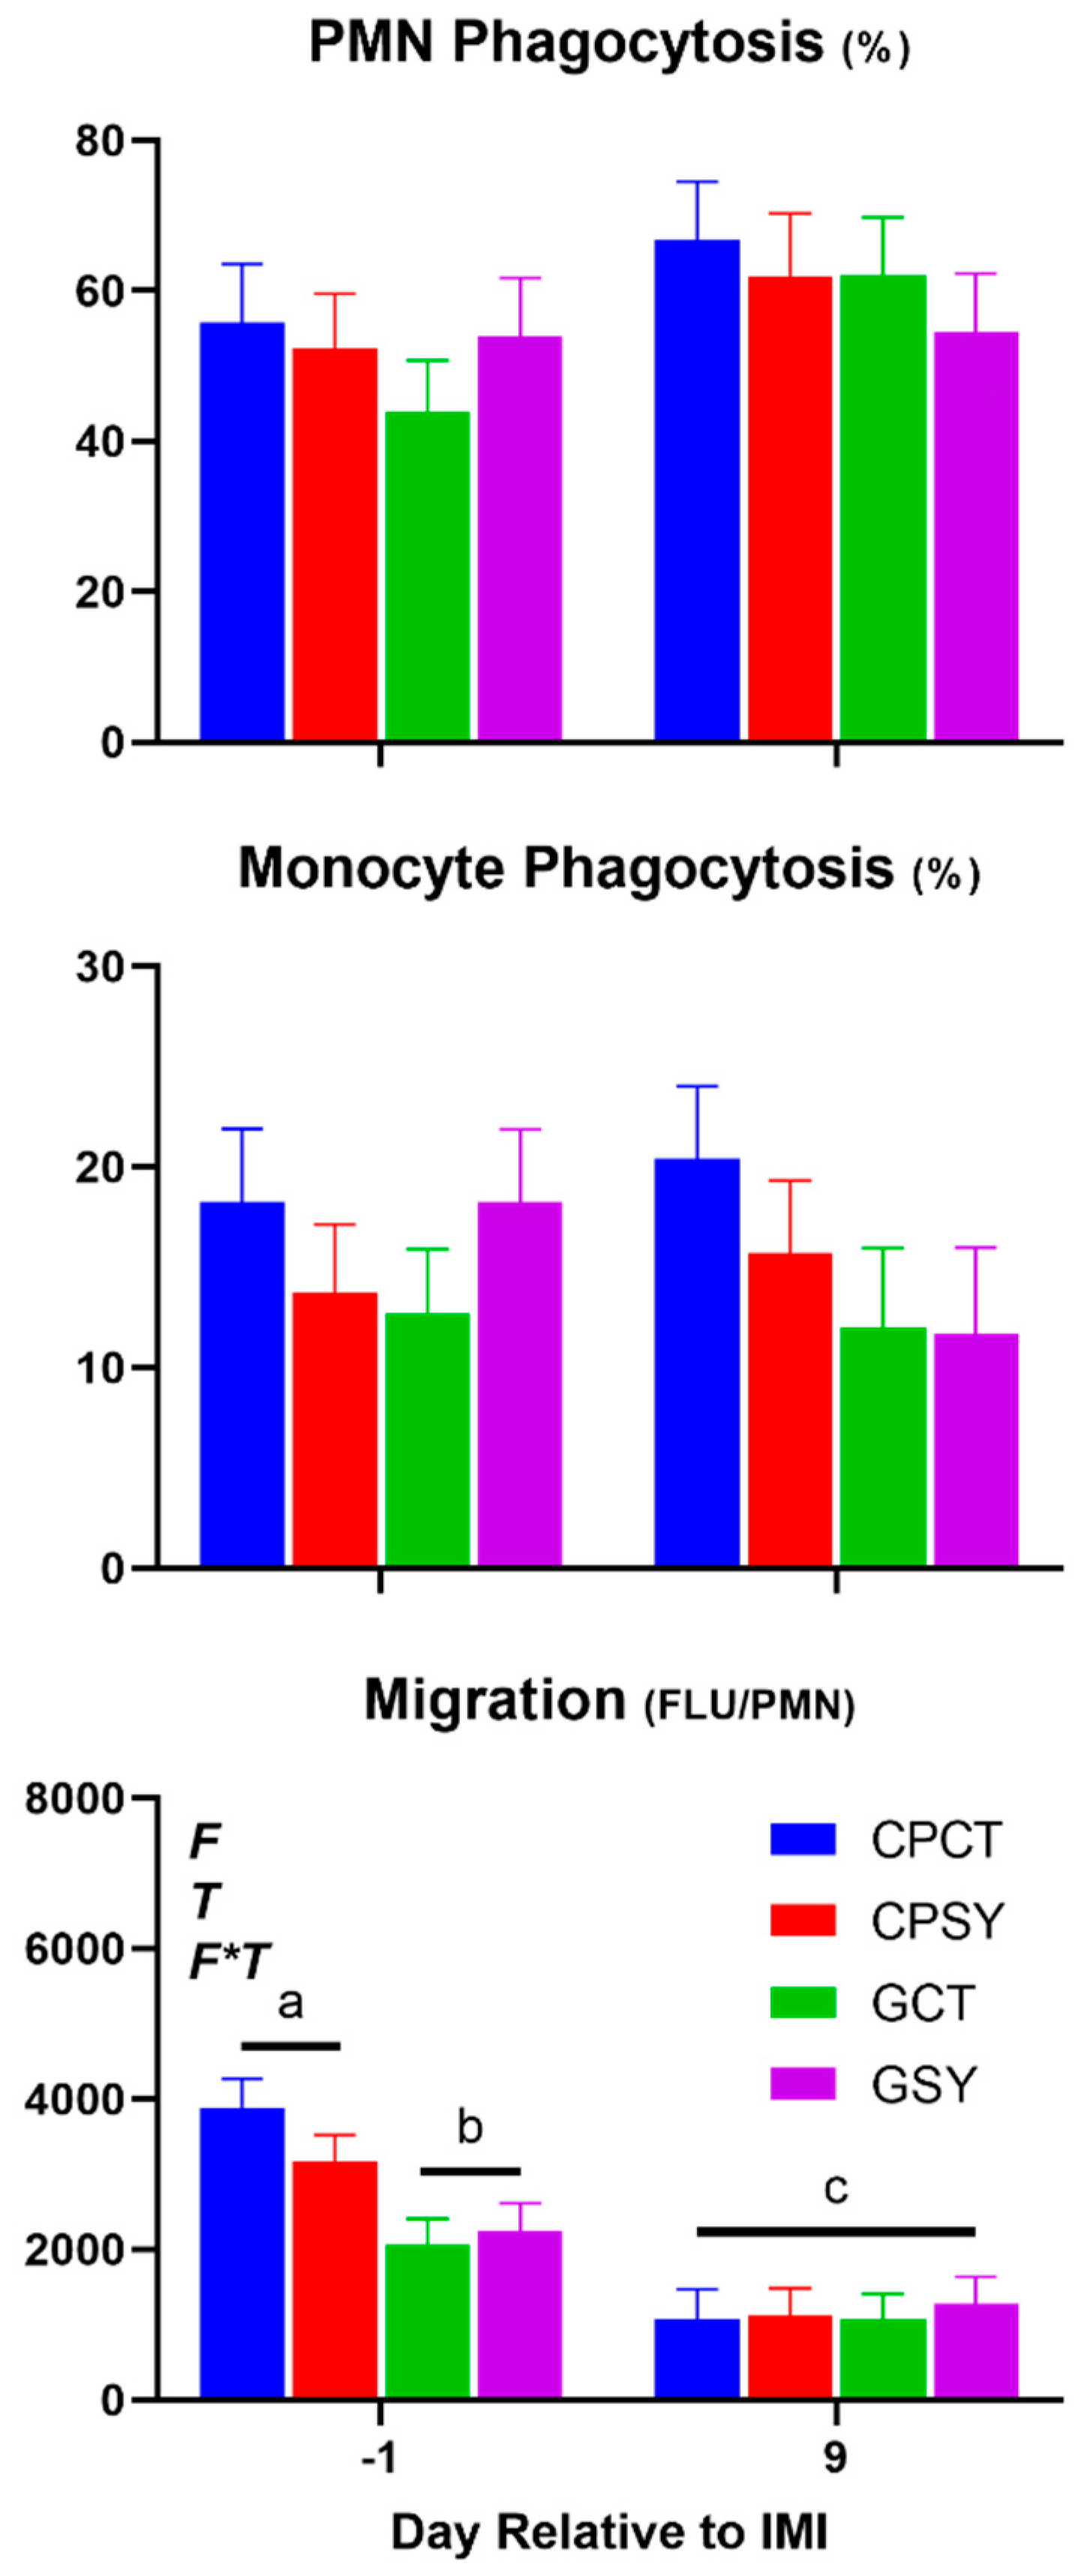

Table 1.
Diet composition and chemical characteristics for each of the treatment groups during late gestation and early lactation.
Table 1.
Diet composition and chemical characteristics for each of the treatment groups during late gestation and early lactation.
| Treatment Group | ||||
|---|---|---|---|---|
| GCT | GSY | CPCT | CPSY | |
| Ingredients, % DM | ||||
| Grass silage | 50.0 | 50.0 | 0.00 | 0.00 |
| Chicory silage | 0.00 | 0.00 | 25.0 | 25.0 |
| Plantain silage | 0.00 | 0.00 | 25.0 | 25.0 |
| Corn | 16.5 | 16.5 | 20.7 | 20.7 |
| Barley | 20.5 | 20.5 | 14.8 | 14.8 |
| Soybean meal | 11.4 | 11.4 | 13.2 | 13.2 |
| Alfalfa meal | 0.62 | 0.00 | 0.62 | 0.00 |
| Se-yeast | 0.00 | 0.62 | 0.00 | 0.62 |
| CaCO3 | 0.75 | 0.75 | 0.40 | 0.40 |
| NaCl | 0.20 | 0.20 | 0.20 | 0.20 |
| Mineral mix1 | 0.10 | 0.10 | 0.10 | 0.10 |
| Chemical composition* | ||||
| CP % | 14.7 | 14.7 | 14.7 | 14.7 |
| NDF % | 34.9 | 34.9 | 30.7 | 30.7 |
| NFC % | 42.5 | 42.5 | 44.2 | 44.2 |
| Ca % | 0.57 | 0.57 | 0.82 | 0.82 |
| P % | 0.26 | 0.26 | 0.34 | 0.34 |
| Ca/P | 2.19 | 2.19 | 2.41 | 2.41 |
| ME Mcal/kg DM | 2.69 | 2.69 | 2.47 | 2.47 |
1Composition reported (min or min-max): Ca = 8.0-9.6%; P = 6%; NaCl = 34-39%; Mg = 2.7%; Cu = 0-40 ppm; Se = 90 ppm; Vitamin A = 160,000 IU/lb; *calculated.
Table 2.
Rectal temperature, feed intake, and milk yield and quality in ewes fed chicory+plantain (CP) or grass (G) silage and either supplemented (SY) or not (CT) with Se-yeast. An intramammary infection was induced in both mammary glands using Strep. Uberis.
Table 2.
Rectal temperature, feed intake, and milk yield and quality in ewes fed chicory+plantain (CP) or grass (G) silage and either supplemented (SY) or not (CT) with Se-yeast. An intramammary infection was induced in both mammary glands using Strep. Uberis.
| Parameter1 | Unit | Chicory | Grass | P-value | ||||||||
|---|---|---|---|---|---|---|---|---|---|---|---|---|
| CPCT | CPSY | GCT | GSY | SEM | F | Se | F*Se | F*T | Se*T | F*Se*T | ||
| Rectal Temp. | ℃ | 39.2 | 39.0 | 39.2 | 39.1 | 0.07 | 0.28 | 0.01 | 0.45 | 0.09 | 0.76 | 0.05 |
| DMI | g/d | 1879 | 1997 | 2226 | 2221 | 163 | 0.07 | 0.71 | 0.69 | 0.02 | 0.46 | 0.99 |
| Milk Yield | mL/d | 470 | 561 | 649 | 557 | 64.8 | 0.19 | 1.00 | 0.17 | 0.66 | 0.52 | 0.32 |
| Water intake | L/d | 4.03 | 2.10 | 3.32 | 2.48 | 0.56 | 0.75 | 0.01 | 0.31 | 0.31 | 0.55 | 0.74 |
| Bacteria count | log2/mL | 4.20b | 4.36b | 2.04c | 5.88a | 0.69 | 0.79 | <0.01 | <0.01 | 0.18 | 0.53 | 0.70 |
| SCC | log2(×103) | 11.0 | 11.0 | 10.7 | 11.3 | 0.28 | 0.80 | 0.35 | 0.26 | 0.44 | 0.03 | 0.31 |
| Lactose | % | 3.24 | 3.43 | 3.44 | 3.29 | 0.22 | 0.90 | 0.93 | 0.43 | 0.79 | 0.76 | 0.47 |
| Protein | % | 6.14 | 5.69 | 5.46 | 5.63 | 0.19 | 0.05 | 0.44 | 0.09 | 0.00 | 0.18 | 0.50 |
| Fat | % | 7.11 | 6.26 | 6.33 | 5.94 | 0.29 | 0.05 | 0.03 | 0.10 | 0.30 | 0.64 | 0.87 |
| Solids | % | 17.9 | 16.4 | 16.2 | 16.0 | 0.54 | 0.05 | 0.09 | 0.18 | 0.11 | 0.64 | 0.95 |
| SNF | % | 10.6 | 10.3 | 10.1 | 10.1 | 0.26 | 0.14 | 0.59 | 0.53 | 0.11 | 0.76 | 0.83 |
| Other Solids | % | 4.45 | 4.61 | 4.60 | 4.45 | 0.24 | 0.98 | 0.98 | 0.50 | 0.78 | 0.80 | 0.53 |
| NPN | mg/dL | 26.9 | 25.0 | 26.9 | 26.6 | 1.44 | 0.56 | 0.44 | 0.54 | 0.18 | 0.41 | 0.76 |
| MUN | mg/dL | 21.5 | 21.3 | 23.3 | 23.3 | 1.34 | 0.24 | 0.51 | 0.83 | 0.45 | 0.59 | 0.84 |
| C16:0 | % | 2.45 | 2.03 | 2.14 | 1.97 | 0.15 | 0.19 | 0.04 | 0.36 | 0.29 | 0.63 | 0.81 |
| C18:0 | % | 0.38a | 0.30ab | 0.28b | 0.33ab | 0.03 | 0.22 | 0.58 | 0.03 | 0.08 | 0.74 | 0.74 |
| C18:1 | % | 0.45a | 0.15b | 0.24b | 0.32ab | 0.09 | 0.77 | 0.16 | 0.02 | 0.08 | 1.00 | 0.19 |
| De novo FA | % | 2.94 | 2.62 | 2.55 | 2.31 | 0.14 | 0.01 | 0.05 | 0.76 | 0.31 | 0.60 | 0.66 |
| Mixed FA | % | 2.51 | 2.07 | 2.20 | 2.08 | 0.15 | 0.21 | 0.04 | 0.38 | 0.29 | 0.62 | 0.79 |
| Preformed FA | % | 1.61a | 1.18b | 1.17b | 1.37ab | 0.10 | 0.21 | 0.22 | <0.01 | 0.28 | 0.83 | 0.58 |
| Unsaturated FA | % | 0.12 | 0.11 | 0.11 | 0.14 | 0.02 | 0.60 | 0.58 | 0.16 | 0.69 | 0.58 | 0.39 |
| Acetone | % | 0.20ab | 0.13b | 0.14b | 0.24a | 0.04 | 0.43 | 0.69 | 0.03 | 0.29 | 0.34 | 0.17 |
| BHBA | % | 0.33 | 0.28 | 0.29 | 0.36 | 0.05 | 0.73 | 0.78 | 0.17 | 0.27 | 0.13 | 0.45 |
| De novo FA | % FA | 41.6b | 44.8a | 43.3ab | 40.7b | 1.15 | 0.28 | 0.77 | 0.01 | 0.11 | 0.91 | 0.36 |
| Mixed FA | % FA | 34.7 | 34.6 | 37.2 | 35.3 | 1.11 | 0.15 | 0.35 | 0.40 | 0.30 | 0.94 | 0.75 |
| Preformed FA | % FA | 23.7a | 20.5ab | 19.8b | 24.0a | 1.40 | 0.86 | 0.69 | 0.01 | 0.33 | 0.75 | 0.18 |
| Medium Chain FA | % FA | 13.1 | 13.1 | 13.2 | 13.4 | 0.13 | 0.05 | 0.35 | 0.27 | 0.33 | 0.60 | 0.37 |
1DMI=Dry Matter Intake; SCC=Somatic Cells Count; NPN=Non-protein Nitrogen; MUN=milk urea nitrogen; BHBA=β-hydroxybutyrate; FA=fatty acids; 2Overall statistical effect of: F= silage type; Se = Se supplementation; T = time; and their interactions. All the parameters were significantly affected by Time.
Table 3.
Parameters in blood plasma in ewes fed chicory+plantain (CP) or grass (G) silage and either supplemented (SY) or not (CT) with Se-yeast. An intramammary infection was induced in both mammary glands using Strep. Uberis.
Table 3.
Parameters in blood plasma in ewes fed chicory+plantain (CP) or grass (G) silage and either supplemented (SY) or not (CT) with Se-yeast. An intramammary infection was induced in both mammary glands using Strep. Uberis.
| Parameter1 | Unit | Chicory | Grass | P-value2 | |||||||||
|---|---|---|---|---|---|---|---|---|---|---|---|---|---|
| CPCT | CPSY | GCT | GSY | SEM | F | Se | Time | F*Se | F*T | Se*T | F*Se*T | ||
| Metabolism | |||||||||||||
| Glucose | mM | 4.27 | 4.24 | 4.19 | 4.21 | 0.10 | 0.57 | 0.92 | 0.07 | 0.81 | 0.99 | 0.21 | 0.85 |
| Cholesterol | mM | 1.78 | 1.79 | 2.15 | 1.75 | 0.22 | 0.44 | 0.35 | 0.19 | 0.32 | 0.21 | 0.58 | 0.07 |
| BHBA | mM | 0.51 | 0.56 | 0.43 | 0.45 | 0.05 | 0.05 | 0.39 | 0.83 | 0.69 | 0.82 | 0.21 | 0.69 |
| NEFA | mM | 0.31 | 0.35 | 0.31 | 0.34 | 0.01 | 0.80 | 0.08 | 0.22 | 0.66 | 0.47 | 0.25 | 0.97 |
| Total Protein | g/L | 68.4a | 63.0b | 63.1b | 67.1ab | 1.54 | 0.69 | 0.64 | <0.01 | <0.01 | 0.42 | 0.06 | 0.20 |
| Urea | mM | 6.75 | 6.79 | 7.67 | 7.05 | 0.46 | 0.18 | 0.51 | <0.01 | 0.45 | 0.43 | 0.87 | 0.04 |
| Ca | mM | 2.40 | 2.35 | 2.37 | 2.42 | 0.04 | 0.65 | 0.97 | 0.09 | 0.23 | 0.32 | 0.68 | 0.51 |
| NEFA:Albumin | 0.67 | 0.87 | 0.69 | 0.78 | 0.06 | 0.53 | 0.01 | 0.21 | 0.34 | 0.32 | 0.58 | 0.49 | |
| Acute phase indexes/inflammation/liver status | |||||||||||||
| Albumin | g/L | 30.5 | 29.3 | 30.4 | 29.1 | 0.70 | 0.79 | 0.09 | 0.03 | 0.95 | 0.15 | 0.38 | 0.36 |
| Haptoglobin | g/L | 0.54 | 0.49 | 0.44 | 0.67 | 0.14 | 0.80 | 0.51 | <0.01 | 0.31 | 0.17 | 0.63 | 0.73 |
| Ceruloplasmin | µM | 2.84 | 3.49 | 3.48 | 3.13 | 0.52 | 0.78 | 0.76 | <0.01 | 0.32 | 0.05 | 0.15 | 0.05 |
| Paraoxonase | U/L | 170 | 178 | 189 | 192 | 17.1 | 0.32 | 0.73 | <0.01 | 0.88 | 0.23 | 0.61 | 0.37 |
| Zn | mM | 10.0 | 10.0 | 10.3 | 11.1 | 0.68 | 0.28 | 0.54 | <0.01 | 0.52 | 0.34 | 0.92 | 0.68 |
| IL6 | pg/mL | 390 | 699 | 1317 | 1590 | 422 | 0.03 | 0.47 | 0.19 | 0.96 | 0.05 | 0.46 | 0.69 |
| IL1B | pg/mL | 396 | 165 | 55 | 156 | 173 | 0.33 | 0.72 | 0.37 | 0.36 | 0.28 | 0.49 | 0.42 |
| Bilirubin | µM | 1.13 | 0.82 | 0.94 | 0.89 | 0.16 | 0.41 | 0.57 | 0.13 | 0.80 | 0.22 | 0.76 | 0.30 |
| GGT | U/L | 74.3a | 63.6b | 61.5b | 71.9ab | 4.08 | 0.57 | 0.97 | 0.09 | 0.01 | 0.36 | 0.93 | 0.06 |
| Immune system | |||||||||||||
| Globulin | g/L | 37.7a | 33.7ab | 32.8b | 38.0a | 1.63 | 0.85 | 0.70 | <0.01 | 0.01 | 0.19 | 0.05 | 0.13 |
| Albumin:Globulin | 0.81ab | 0.90ab | 0.94a | 0.78b | 0.05 | 0.97 | 0.41 | <0.01 | 0.01 | 0.07 | 0.07 | 0.23 | |
| Myeloperoxidase | U/L | 494 | 480 | 478 | 538 | 32.5 | 0.51 | 0.46 | <0.01 | 0.24 | 0.26 | 0.10 | 0.52 |
| Oxidative status | |||||||||||||
| AOPP | µM | 61.7 | 62.8 | 61.8 | 63.1 | 4.73 | 0.96 | 0.79 | 0.01 | 0.99 | 0.89 | 0.19 | 0.62 |
| ROM | mg H2O2/dL | 16.3 | 19.6 | 19.8 | 18.9 | 2.33 | 0.55 | 0.59 | <0.01 | 0.36 | 0.04 | 0.11 | 0.11 |
| FRAP | µM | 108 | 111 | 99 | 106 | 2.79 | 0.02 | 0.12 | 0.08 | 0.41 | 0.37 | 0.31 | 0.77 |
| ROM/FRAP | 0.15 | 0.18 | 0.20 | 0.18 | 0.02 | 0.25 | 0.92 | <0.01 | 0.28 | 0.02 | 0.25 | 0.19 | |
| NOX | µM | 50.3 | 52.8 | 50.9 | 51.4 | 1.88 | 0.83 | 0.43 | 0.42 | 0.57 | 0.74 | 0.02 | 0.54 |
| NO2 | µM | 14.9 | 14.3 | 15.2 | 16.2 | 0.91 | 0.23 | 0.82 | 0.31 | 0.35 | 0.08 | 0.40 | 0.49 |
| NO3 | µM | 35.4 | 38.5 | 35.7 | 35.2 | 1.95 | 0.43 | 0.49 | 0.80 | 0.33 | 0.57 | <0.01 | 0.28 |
1BHBA=β-hydroxybutyrate; NEFA = non-esterified fatty acids; IL6 = interleukin 6; IL1β = interleukin 1 beta; GGT = γ glutamyl transferase; AOPP = Advanced Oxidation Protein Products; ROM = Reactive Oxygen Metabolites; FRAP = Ferric Reducing Ability of the Plasma; nitric oxide (NOX), nitrite (NO2-) and nitrate. 2Overall statistical effect of: F= silage type; Se = Se supplementation; T = time; and their interactions.
Table 4.
Complete blood count, phagocytosis and migration of leukocytes in ewes fed chicory+plantain (CP) or grass (G) silage and either supplemented (SY) or not (CT) with Se-yeast. An intramammary infection was induced in both mammary glands using Strep. Uberis.
Table 4.
Complete blood count, phagocytosis and migration of leukocytes in ewes fed chicory+plantain (CP) or grass (G) silage and either supplemented (SY) or not (CT) with Se-yeast. An intramammary infection was induced in both mammary glands using Strep. Uberis.
| Parameter1 | Unit | Chicory | Grass | P-value2 | |||||||||
|---|---|---|---|---|---|---|---|---|---|---|---|---|---|
| CPCT | CPSY | GCT | GSY | SEM | F | Se | Time | F*Se | F*T | Se*T | F*Se*T | ||
| WBC | 103/ml | 10.8 | 12.1 | 9.2 | 12.5 | 1.31 | 0.76 | 0.28 | 0.25 | 0.11 | 0.11 | 0.09 | 0.96 |
| Lymphocytes | 103/ml | 6.20 | 6.07 | 5.42 | 7.62 | 0.65 | 0.53 | 0.10 | 0.04 | 0.06 | 0.55 | 0.03 | 1.00 |
| Monocytes | 103/ml | 0.054 | 0.051 | 0.046 | 0.062 | 0.006 | 0.82 | 0.28 | 0.21 | 0.10 | 0.12 | 0.14 | 0.93 |
| Neutrophils | 103/ml | 4.40 | 4.00 | 3.73 | 4.58 | 0.69 | 0.94 | 0.73 | 0.28 | 0.33 | 0.23 | 0.59 | 0.87 |
| Lymphocytes | % | 58.5 | 61.4 | 59.7 | 62.3 | 2.82 | 0.68 | 0.29 | 0.09 | 0.94 | 0.58 | 0.87 | 0.89 |
| Monocytes | % | 0.50 | 0.51 | 0.50 | 0.50 | 0.01 | 0.36 | 0.84 | 0.62 | 0.62 | 0.29 | 0.32 | 0.94 |
| Neutrophils | % | 41.0 | 38.1 | 39.8 | 37.2 | 2.82 | 0.68 | 0.30 | 0.09 | 0.94 | 0.58 | 0.86 | 0.89 |
| RBC | 106/µL | 8.43 | 8.59 | 8.57 | 8.48 | 0.32 | 0.95 | 0.89 | <0.01 | 0.67 | 0.32 | 0.26 | 0.49 |
| HGB | g/dL | 6.04 | 6.21 | 6.22 | 6.16 | 0.24 | 0.78 | 0.82 | <0.01 | 0.63 | 0.58 | 0.59 | 0.70 |
| HCT | g/dL | 27.7 | 28.1 | 27.2 | 27.0 | 1.06 | 0.39 | 0.94 | <0.01 | 0.76 | 0.36 | 0.41 | 0.48 |
| MCV | fL | 33.0 | 32.6 | 31.8 | 31.7 | 0.41 | 0.01 | 0.66 | 0.32 | 0.70 | 0.61 | 0.78 | 0.49 |
| MCH | fmol | 0.72 | 0.72 | 0.72 | 0.73 | 0.01 | 0.38 | 0.66 | 0.03 | 0.79 | 0.44 | 0.02 | 0.14 |
| MCHC | g/dL | 21.8 | 22.1 | 22.8 | 22.8 | 0.22 | 0.00 | 0.58 | 0.02 | 0.36 | 0.80 | 0.15 | 0.66 |
| RDW | fL | 28.6 | 27.9 | 27.7 | 27.4 | 0.40 | 0.06 | 0.19 | 0.17 | 0.57 | 0.53 | 0.36 | 0.63 |
| RDW | % | 21.4 | 21.1 | 21.5 | 21.4 | 0.31 | 0.43 | 0.49 | 0.08 | 0.81 | 0.53 | 0.19 | 0.30 |
| PLT | 103/dL | 151 | 102 | 115 | 190 | 42.3 | 0.51 | 0.74 | 0.10 | 0.12 | 0.51 | 0.08 | 0.49 |
| PCT | % | 0.09 | 0.06 | 0.06 | 0.11 | 0.02 | 0.61 | 0.68 | 0.09 | 0.08 | 0.29 | 0.07 | 0.31 |
| MPV | fL | 6.16 | 5.91 | 5.72 | 5.88 | 0.16 | 0.12 | 0.76 | 0.07 | 0.17 | 0.40 | 0.21 | 0.95 |
| PDW | fL | 7.91a | 7.20ab | 6.31b | 7.19ab | 0.35 | 0.02 | 0.79 | 0.20 | 0.02 | 0.08 | 0.91 | 0.97 |
| PDW | % | 30.5a | 28.9ab | 27.5b | 29.4ab | 0.71 | 0.06 | 0.85 | 0.18 | 0.01 | 0.08 | 0.69 | 0.97 |
| PMN phagoc | % | 61.3 | 55.3 | 53.1 | 58.6 | 5.38 | 0.63 | 0.96 | 0.04 | 0.27 | 0.60 | 0.49 | 0.84 |
| Monoc phagoc | % | 19.4 | 14.9 | 13.0 | 18.1 | 3.21 | 0.62 | 0.92 | 0.58 | 0.14 | 0.72 | 0.99 | 0.98 |
| Migration | RFU | 92960 | 80502 | 66035 | 68464 | 8820 | 0.02 | 0.53 | <0.01 | 0.36 | 0.06 | 0.58 | 0.82 |
| Migration/PMN | RFU | 2657 | 2281 | 1572 | 1809 | 304 | <0.01 | 0.80 | <0.01 | 0.27 | <0.01 | 0.34 | 0.34 |
1RBC=red blood cells; HGB = hemoglobin; HCT = hematocrit; MCV = Mean Corpuscular Volume; MCH = Mean Corpuscular Hemoglobin; MCHC = MCH concentration; RDW = Red Cell Distribution Width; PLT = platelet; PCT = Plateletcrit; MPV = Mean platelet volume; PDW = Platelet Distribution Width 2Overall statistical effect of: F= silage type; Se = Se supplementation; T = time; and their interactions.
Disclaimer/Publisher’s Note: The statements, opinions and data contained in all publications are solely those of the individual author(s) and contributor(s) and not of MDPI and/or the editor(s). MDPI and/or the editor(s) disclaim responsibility for any injury to people or property resulting from any ideas, methods, instructions or products referred to in the content. |
© 2025 by the authors. Licensee MDPI, Basel, Switzerland. This article is an open access article distributed under the terms and conditions of the Creative Commons Attribution (CC BY) license (http://creativecommons.org/licenses/by/4.0/).
Copyright: This open access article is published under a Creative Commons CC BY 4.0 license, which permit the free download, distribution, and reuse, provided that the author and preprint are cited in any reuse.


