
Submitted:
17 April 2025
Posted:
17 April 2025
You are already at the latest version
Abstract
This study focuses on enhancing the photoelectro - catalytic (PEC) performance of LaFeO₃ photocathodes by incorporating Ag nanocrystals. LaFeO₃, a perovskite - type metal oxide semiconductor, has potential in PEC water splitting but suffers from fast charge carrier recombination. Ag nanoparticles are introduced due to their surface plasmon resonance (SPR) property and ability to form Schottky junctions with LaFeO₃. A series of Ag/LaFeO₃ materials are prepared using the molten salt method for LaFeO₃ synthesis and the direct reduction method for Ag loading. The results show that Ag nanoparticles are uniformly dispersed on LaFeO₃. The 3 mol% Ag loading significantly enhances the photocurrent density, about 9 - fold higher than that of pure LaFeO₃. Ag loading improves light absorption, reduces the band gap, and optimizes charge kinetics. EIS and Mott - Schottky analysis reveal that 3 mol% Ag/LaFeO₃ has the lowest charge transfer impedance and the highest carrier concentration. This work provides valuable insights into the interaction between Ag and LaFeO₃, and offers experimental and theoretical support for developing efficient photocatalytic materials for PEC water splitting.
Keywords:
LaFeO₃
; photocathodes
; Ag Nanocrystals
; PEC water splitting
1. Introduction
LaFeO₃ is a typical perovskite-type metal oxide semiconductor with a wide range absorbing ability of solar spectrum due to the appropriate band gap of ~ 2.1 eV [1,2]. This material exhibits numerous advantages such as high chemical stability, easy regulation of structure and morphology, non-toxicity, easy preparation, low cost, moderate band gap, and adjustable specific surface area, which are considered to be a potential PEC material for effectively utilizing visible light to drive the water splitting process [3,4]. However, challenges still exist. For example, fast recombination of photo-generated electrons and holes significantly limits the photoelectrode efficiency[5,6,7]. To address this issue, various strategies are used to improve the performance, including nanostructure regulation [8,9,10], surface passivation [11,12,13,14], and cocatalyst deposition [15,16,17,18]. For instance, Andrei et al. prepared a LaFeO₃ loaded Nb:SrTiO₃ substrate using a self-assembly process. The composite exhibited excellent stability over time, and the optimal LFO/Nb:SrTiO₃ sample had the highest photocurrent density J value (up to 1.2 mA·cm⁻²) [19].
Improving the performance of photoelectrocatalysts using noble metals has been proven to enhance the light absorption and carrier dynamics of semiconductor materials. For example, Chertkova et al. proposed that the photoelectrochemical properties of nanostructured LaFeO₃ thin films depend largely on the presence of passivation coatings or cocatalysts. Depositing Pt nanoparticles on the surface of the thin film could triple the photocurrent, reaching 30 μA·cm⁻² [20]. Decorating LaFeO₃ with Ru nanolayers resulted in a high hydrogen production amount (10000 μmol·L⁻¹ H2 within 4 h of irradiation) in the presence of methanol. After multiple reuses, the composite material also showed very high stability [21].
Ag nanoparticles have unique surface plasmon resonance (SPR) property. When irradiated by light, the free electrons in Ag nanoparticles will undergo collective oscillation, producing a surface plasmon resonance phenomenon, which can achieve strong light absorption in the visible light region, thereby broadening the light response range of photoelectrodes [22]. Besides, when Ag nanoparticles contact with perovskite oxide nanoparticles, due to their different work functions, a Schottky junction will be formed at the interface. The built-in electric field of the Schottky junction can effectively separate photogenerated electron-hole pairs, enabling photogenerated electrons to be quickly transferred to Ag nanoparticles and then transmitted to the external circuit, reducing the recombination probability of photogenerated carriers [23]. Furthermore, Ag has good electrical conductivity. When Ag nanoparticles are modified on the surface of semiconductor nanoparticles, Ag can serve as an efficient electron transport channel, accelerate the transfer of photogenerated electrons within the material, increase the photocurrent density, and thus promote the progress of the photoelectrochemical water splitting reaction [24]. Silver nanoparticles may regulate the electronic structure of the photoelectrode surface through interaction with perovskite oxide nanoparticles, reduce the activation energy of the water splitting reaction, and improve the catalytic efficiency of the photoelectrode [25]. However, there is lack of a deep insight of the interaction between Ag nanoparticles and perovskite oxide photoelectrode during the PEC process.
Herein, a series of Ag/LaFeO₃ materials were prepared by loading Ag nanoparticles on the surface of LaFeO₃ particles as efficient photoelectrocatalysts. Aiming to comprehensively analyze the effects of Ag loading on the optical, structural, and electrochemical properties of LaFeO₃ and to relate these changes to the improvement of PEC water splitting efficiency. The photocurrent density of the 3 a.t.% Ag/LaFeO₃ photoelectrocatalyst increased approximately 9 - fold compared to that of the original LaFeO₃. Through systematic characterization and performance evaluation, the mechanism by which Ag loading enhances the PEC activity of LaFeO₃ was elucidated, providing guidance for the development of more effective photoanodes for sustainable hydrogen production.
2. Experimental Section
2.1. Chemicals
Fe(NO3)3⋅9H2O (99.0 %), La(NO3)3⋅6H2O (99.0 %, AR), NaCl (99.0%), AgNO3 and Na2CO3 (99.0 %) were purchased from Sinopharm Chemical Reagent Co., Ltd. Nickel foam was obtained from Ansu Electronic Materials Business Co.Ltd. All the chemicals used in the experiments were analytical grade (AR) without further purification. All aqueous solutions were prepared by deionized water with a resistivity > 18.0 MΩ cm.
2.2. Preparation of Pristine LaFeO3 Particles
The LaFeO3 particles were prepared by a simple molten salt method. NaCl, Na2CO3, Fe(NO3)3⋅9H2O, and La(NO3)3⋅6H2O were mixed in the molar ratio of 50:40:1:1. After completely dehydrating at 60 °C, the grounded mixture was heated in a muffle furnace at 600°C for 1 h. After cooling to room temperature, the prepared sample was washed with ethanol and ultrapure water several times for further characterization.
2.3. Preparation of Ag Nanoparticles Modified LaFeO3 Particles
0.01 mmol LaFeO3 particles were dispersed into 15 mL ethylene glycol with stirring. Afterward, 0.01 - 0.05 M AgNO3 aqueous solution and 60 μL haxylamine were added to this suspension. After stirring for 30 min, 0.05 M NaBH4 was added to the mixture, and the mixture was left standing at room temperature for 2 h. The prepared sample was collected by a centrifuge, washed with ethanol, and collected after vacuum drying at 60 °C for several hours.
2.4. Characterization
The crystal structure was characterized by XRD (Phillips X′pert, Cu Kα, 2θ range of 20–80°), with a scanning rate of 5° min-1. Cu Kα radiation (λ = 0.15418 nm) was employed. The morphology and microstructures of prepared samples were characterized by a Zeiss field emission scanning electron microscopy (ZEISS Gemini 300). Before observation, the sample was coated for 45 seconds using a Quorum SC 7620 sputter coater at a current of 10 mA to enhance its conductivity. The detailed morphology was further investigated by a high-resolution transmission electron microscope (HRTEM FEI Tecnai G2s-Twin F20). An Energy dispersive spectrometer (EDS, Oxford Xplore 80 mm2) equipped with the HRTEM was performed to conduct the elemental analysis of the sample. X-ray photoelectron spectroscopy (XPS) was used to analyze the elemental composition and chemical states (using Al Kα radiation (1468 eV)). All XPS spectra were calibrated by C1s peak (284.8 eV). UV-vis absorption spectra of the LaFeO3 composites were measured via a UV-vis absorption spectrophotometer (Shimadzu UV-2600). The fluorescence spectra of the particles were collected by an FSL 1000 steady-state/transient fluorescence spectrometer.
2.5. PEC Electrode Assembly and Measurements
A nickel foam (2 cm× 2 cm× 1 mm) was cut and soaked in a 1 M H2SO4 solution for 10 minutes, then rinsed with acetone and ethanol, respectively. Meanwhile, 5 mg of the prepared LaFeO3-based particles was poured in a mixture of 1ml ethanol and 20 μL 5% Nafion solution. The above suspension was sonicated for 20 mins to prevent particle aggregation, and dripped by drop on the surface of the pre-treated nickel foam. The sample was allowed to be dried naturally at room temperature to get the final working electrode. The photoelectrochemical performance of the samples was tested using a CHI660E electrochemical workstation with a typical three-electrode system. The as-prepared photoelectrode, Ag/AgCl electrode, and Pt foil (2cm × 2cm× 1mm) were used as the working electrode, reference electrode and counter electrode, respectively. A 0.1 M NaOH solution (pH = 13) was employed as the electrolyte. Simulated solar illumination was achieved by illuminating the samples with a 300 W Xe arc lamp equipped with an AM 1.5 G filter. Electrochemical impedance spectroscopy (EIS) measurements were conducted under AM 1.5G illumination, with a frequency range of 0.01 Hz to 100 kHz and an AC voltage amplitude of 10 mV. Mott-Schottky (M-S) curves were tested at a frequency of 1000 Hz using the three-electrode system. Linear sweep voltammetry (LSV) was achieved with a scan rate of 10 mV/s in the voltage window of -0.4 to 0.8 V vs. RHE (reversible hydrogen electrode) to obtain the photocurrent-potential curve. The incident photon-to-current conversion efficiency (IPCE) was tested at 420 nm, 475 nm, 550 nm, and 650 nm using monochromatic filters and a 300 W Xe arc lamp as a simulated light source in a 0.1 M NaOH solution at 0.6 V vs. RHE. Photocurrent density measurements were conducted under intermittent illumination with 20 s intervals in the same electrolyte conditions (0.6 V vs. RHE). The stability of the electrode was evaluated by measuring the photocurrent density under continuous light illumination for 4 hours in the same electrolyte conditions. Cyclic voltammetry (CV) measurements were performed to determine the current density in the range of -0.45 to -0.55 eV vs. RHE at scan rates of 20 mV/s to 120 mV/s.
3. Results and Discussion
3.1. Morphology and Structure Characterization
The crystal structure and microstructure of the Ag/LaFeO₃ composites were analyzed by XRD, SEM, and TEM. In the black curve of Figure 1, the characteristic peaks accurately match the crystal structure of LaFeO₃, conforming to the characteristics of the cubic phase crystal structure. The major diffraction peak, such as (002), (112), (004), (204), and (116), is clearly visible, indicating that the sample has good crystallinity. In the Ag nanoparticle loaded samples, the newly appeared characteristic peaks at 38° and 44° correspond to the (111) and (200) planes of the face - centered cubic (FCC) structure of metallic Ag. As the Ag loading amount increases (from 1% to 5%), the relative intensities of these peaks increase, indicating that more Ag particles are successfully loaded on the surface of LaFeO₃. The characteristic peak of the (112) crystal plane at 32° is significantly enhanced with the increase in Ag loading. This can be explained by the following reasons: the interface effect leads to the redistribution of electron density at the interface between Ag particles and LaFeO₃[26]. The rearrangement of electrons near the interface may enhance the diffraction signal of specific crystal planes, such as (112). Adding foreign substances in the crystal plane orientation direction can promote the preferential growth of the substrate material on specific crystal planes. This change in grain orientation leads to an increase in the intensity of the diffraction peaks of specific crystal planes. Since there are no new peaks or abnormally broadened peaks after loading, it is inferred that the Ag and LaFeO3 particles are with high purity.
The SEM image of 3 mol% Ag/LaFeO₃ at low magnification (Figure 2 a) suggests that. the morphology of the composite material is irregular spherical particles. and a certain degree of agglomeration occurs. The SEM image at a high magnification (Figure 2 b) shows the detailed morphology of single particles with ~300 nm in diameters. These rough-surfaced LaFeO₃ particles are wrapped by smaller nanoparticles, which helps to provide more active sites. HRTEM was used to describe the material morphology and crystal structure in more detail. Figure 2 d shows the area marked in Figure 2 c, scanning near the contact point between the Ag nanoparticles and LaFeO₃. The crystal structure of the nanoparticles was clearly observed. The marked (112) and (002) crystal planes of LaFeO₃ and the (111) crystal plane of Ag show clear lattice spacings of 0.274 and 0.394 nm, verifying the crystal phase and purity of the material. The presence of Ag facilitates electron transfer and distribution, thereby affecting the catalytic performance of the LaFeO3 nanoparticles. The TEM electron diffraction image indicates that the sample has good crystallinity (Figure 2e). The diffraction spots correspond to the (112) and (022) crystal planes of LaFeO₃, reconfirming the phase structure of the composite material. Due to the low Ag loading amount, its characteristic spots are not found. Figure 2f-j shows the EDX element mapping images of the 3 mol% Ag/LaFeO₃ composites. Figure 2 g, h, i, and j correspond to the distributions of elements Fe, La, O, and Ag. The uniform distribution of elements indicates that Ag is uniformly distributed on the surface of LaFeO₃, which helps to enhance the electron transfer efficiency and provide additional reactive sites. These images indicate that the 3 mol% Ag/LaFeO₃ composite has excellent microstructural characteristics, such as good nanoparticle dispersion, high crystallinity, and uniform element distribution, which is beneficial to its photoelectron-catalytic performance.
3.2. Elemental Analysis
To study the key information such as the chemical state and surface composition of the material before and after loading Ag particles, the XPS spectra of LaFeO₃ and 3 mol% Ag/LaFeO₃ materials were analyzed in detail. The XPS survey spectra of the two materials are shown in Figure 3. The 3d peaks of La and the 2p peaks of Fe are clearly visible in both materials, and there is no obvious change in the chemical environment. The position of the O1s peak is slightly different in the two materials, which may reflect a slight change in the oxygen environment. The Ag 3d peak was also found in the 3 mol% Ag/LaFeO₃ material, further confirming the successful loading of Ag.
XPS high-resolution spectra provide detailed electron state information of pure LaFeO₃ and 3 mol% Ag/LaFeO₃ composites, which is crucial for understanding their performance as PEC cathode materials. In Figure 4 a, the peak positions of the Fe 2p orbit in pure LaFeO₃ are located at 710.2 eV and 723.5 eV, which are attributed to Fe 2p3/2 and Fe 2p1/2, respectively. Satellite peaks are accompanied, which can be attributed to the high-spin state of Fe³⁺ in LaFeO₃[27]. In the Ag-loaded material, the peaks of Fe 2p show a slight shift to a higher energy state (red shift), which is due to the charge redistribution or change in electron density caused by the addition of Ag. The electron density around Fe decreases. This change may be due to the migration of electrons from Fe to Ag caused by the addition of Ag, thus affecting the effective charge of Fe. In Figure 4 b, the La 3d peaks of pure LaFeO₃ are mainly near 834.0 eV and 850.7 eV, corresponding to the peaks of La 3d5/2 and La 3d3/2, which is consistent with the chemical state of La³⁺. The peaks of La 3d in the composite show a slight energy shift because the local charge environment around La changes due to the introduction of Ag. In Figure 4 c, the peak positions of the O1s are at 529.7 eV and 533.1 eV, which mainly corresponds to the state of oxygen in the oxide. OA represents adsorbed oxygen, and OL represents lattice oxygen. After Ag loading, the O 1s peaks are located at 529.0 eV and 531.4 eV, respectively. The increase in the proportion of OL may reflect the diversity of the oxygen environment. The introduction of Ag may lead to the redistribution of electron density in the surface and near-surface regions of the composite material. Due to the low work function and high electrical conductivity, Ag may cause electrons to migrate from LaFeO₃ to Ag, affecting the charge state of local oxygen atoms. This charge rearrangement may increase the proportion of surface-adsorbed oxygen species. The Ag 3d peaks appear at 368.1 eV and 374.1 eV, corresponding to Ag 3d5/2 and Ag 3d3/2, indicating that silver exists in a metallic state on the surface of LaFeO₃ (Figure 4 d). The peak position is stable, indicating that the chemical state of silver is relatively simple. These detailed XPS analysis results show that the introduction of Ag not only changes the surface electronic structure of LaFeO₃ but also may enhance the catalytic activity by providing more charge separation and transfer paths[28]. In particular, the different chemical states of oxygen and the introduction of metallic silver play a key role in improving the hydrogen production amount and the efficiency of the catalytic reaction.
3.3. Optical Absorption Properties of Ag/LaFeO₃
The introduction of Ag nanoparticles can affect the light absorption property and electron transport pathway of the LaFeO3 photoelectrode. Due to the surface plasmon resonance effect of Ag nanoparticles, it may enhance light absorption and provide additional carrier paths, thereby enhancing the catalytic efficiency[29]. Therefore, the UV - Vis absorption spectra of all samples were tested, as shown in Figure 5 a. The band energy of the sample was estimated using the Tauc plot, which was converted into a Kubellka - Munk function curve. The calculation formula is as follows:
where α, h, and v represent the absorption coefficient, Planck’s constant, and the speed of light, respectively.
(αℎυ)
n =(ℎυ–Eg)
The Ag/LaFeO₃ samples exhibit moderate absorption in the visible light region, and the absorption rate increases sharply in the ultraviolet region. Compared with pure LaFeO₃, the absorption of the 1% Ag loaded sample is slightly enhanced, especially in the 400 - 600 nm range. This is because the low Ag loading amount affects the electronic structure of the material, leading to a slight improvement in the absorption of visible light. Among all the samples, the sample with 5% Ag loading shows the highest absorption in the visible light region. This is due to the local surface plasmon resonance (LSPR) effect of Ag nanoparticles, which can enhance the material’s ability to absorb sunlight[30].
The Tauc plot (Figure 4b) shows that the band gap of LaFeO₃ is approximately 2.07 eV, while the 3% Ag loaded LaFeO₃ exhibits the minimum band gap of 1.92 eV, indicating that the Ag loading significantly affects the band structure of the material. The loading of Ag introduces new energy levels, changes the electron cloud distribution of LaFeO₃, and enhances its ability to absorb low-energy photons. The change in the band gap can affect the transition of photo-generated electron-hole pairs and the PEC water-splitting performance of the material, suggesting that the introduction of Ag particles has a positive impact on the absorption of sunlight and the improvement of its catalytic performance.
3.4. PEC Performance and Charge Transfer of the Ag/LaFeO₃ Photoelectrode
The transfer of photo-generated charge carriers is one of the key factors determining the overall hydrogen evolution efficiency. The PEC performance of all samples was evaluated in a 0.1 mol·L⁻¹ NaOH solution (Figure 6). Figure 6 a shows the transient photocurrent curves (I - t) of pure LaFeO₃ and the LaFeO₃ composites loaded with different Ag concentrations (1%, 3%, 5%) under the irradiation of simulated sunlight (AM 1.5G). Pure LaFeO₃ shows the lowest photocurrent intensity. After loading with Ag nanoparticles, the photocurrent is significantly enhanced, especially in the 3 mol% Ag/LaFeO₃ sample. This indicates that the addition of Ag nanoparticles effectively improves the photo-response performance. Figure 6b shows the LSV curves measured at a scanning rate of 2 mV·s⁻¹ in the potential range of 0.5 - 2.0 V vs. RHE (the hollow line represents the dark state and the solid line represents the illuminated state). All samples show higher current densities under illumination than in the dark state. The 3 mol% Ag/LaFeO₃ shows higher current densities under both illuminated and dark conditions, indicating its better photo-electrocatalytic performance. This suggests that the addition of Ag nanoparticles significantly enhances the driving force of the catalytic reaction and reduces the recombination rate of photo-generated carriers. The Ag/LaFeO₃ samples shows the increase in photocurrent density at the same voltage compared with the original LaFeO₃ (Figure 6c). The current density is the largest when the Ag loading reaches 3%. At -0.2 eV vs. RHE, the current density of 3 mol% Ag/LaFeO₃ is 15 mA·cm⁻², which is twice that of pure LaFeO₃ under the same conditions. This is related to the optimal distribution of Ag nanoparticles and the excellent electron transfer efficiency between the interface of Ag and LaFeO3. The presence of Ag enhances the light absorption ability and surface reactivity of the material. In addition, the onset potential of the 3 mol% Ag/LaFeO₃ photocathode is lower, indicating that the introduction of Ag nanoparticles is beneficial to reducing the kinetic potential barrier of hydrogen reduction, further reducing the impact of the cathode overpotential on hydrogen evolution.
The LSV curves were further processed to obtain the Tafel slopes for evaluating the kinetics of the catalysts. As shown in Figure 6d, the Tafel slopes are: LaFeO₃ (529.2 mV·dec⁻¹) > 1 mol% Ag/LaFeO₃ (433.1 mV·dec⁻¹) > 5 mol% Ag/LaFeO₃ (426.5 mV·dec⁻¹) > 3 mol% Ag/LaFeO₃ (264.0 mV·dec⁻¹). The 3% Ag loaded sample has the best HER catalytic kinetic activity, suggesting that the interface coupling between Ag and LaFeO₃ can provide more efficient charge transfer for the photo-electrocatalytic reaction. The above data show that the loading of Ag nanoparticles significantly improves the photoelectrochemical performance of LaFeO₃, especially for the 3% Ag loaded sample. The introduction of Ag nanoparticles optimizes the charge kinetics of the material, improves the separation efficiency and transfer speed of photo-generated electrons, and thus enhances the photo-electrocatalytic water splitting performance of the material. By adjusting the loading amount of noble metals, the performance of the photoanode can be significantly enhanced, providing important references for the design of more efficient photo-electrocatalytic systems.
To study the charge transfer kinetics at the electrode/electrolyte interface, electrochemical impedance spectroscopy (EIS) tests were carried out (as shown in Figure 7a). A Randles equivalent circuit model was established to calculate the charge transfer resistance Rct at the electrode/electrolyte interface and the electrolyte resistance RS. The calculation results are listed in Table 1. The impedance radius of 5 mol% Ag/LaFeO₃ is the smallest, while those of 1% and 3% Ag - modified Ag/LaFeO₃ are slightly larger. The Ag nanoparticle modification improves the conductivity of the electrodes, reduces the charge transfer impedance at the interface, thus facilitating the efficient collection and transfer of charges. The Rct value of the 5 mol% Ag/LaFeO₃ photoelectrode is 345 Ω, which is the smallest among the above - mentioned photoelectrodes and is in good agreement with the Nyquist plot.
Mott - Schottky analysis is used to determine the carrier concentration, and flat band potential of semiconductors. As shown in Figure 6b, the slopes of all samples are negative, indicating that the samples are all p-type semiconductors. The intercept of the linear part of the curve with the horizontal axis can predict the flatband potential of the material. With the increase of the Ag loading, the flatband potential gradually shifts to more negative values. Especially, the 3% Ag/LaFeO3 sample exhibits the most significant shift. This indicates that the electron affinity or the energy level of electrons has been improved, which is beneficial to the rapid movement and separation of photo-generated electrons. From the perspective of capacitance change, the space - charge region capacitance first decreases and then increases with the Ag loading ratio at the same potential, reaching the minimum at 3 mol% Ag/LaFeO₃. This also indicates that the 3 mol% Ag/LaFeO₃ material has the highest carrier concentration.
The introduction of Ag nanoparticles changes the electronic environment of the composite, especially affecting the state of oxygen. This may be related to the electronic properties of Ag and the contribution to the electron density. It may promote the effective separation of electron-hole pairs, which is beneficial for improving the photo-electrocatalytic performance. In the application of PEC cathode materials, effective charge separation and efficient electron conduction are crucial. The 3 mol% Ag/LaFeO₃ composite significantly improves the efficiency of the water-splitting reaction by improving these properties, especially when using sunlight as an energy source. The Ag nanoparticles provide an effective way to optimize the photo-electrocatalytic performance of this material by enhancing the light-capturing ability and improving the charge kinetics.
XPS measurements show the maximum energy position of the valence band, which helps to analyze in detail the electronic structure of the Ag/LaFeO₃ composites. The position of the valence-band of LaFeO₃ is about 2.10 eV (Figure 7c), While the position of the valence-band of 1 mol% Ag/LaFeO₃ slightly decreases to 1.63 eV, indicating that the introduction of Ag causes the position of the valence-band to shift to lower energy. It reaches 1.48 eV in 3 mol% Ag/LaFeO₃ (the red curve), showing a large energy-level drop, which can enhance the separation efficiency of photo-generated charges.
3.5. Photo-Electrocatalytic Mechanism
The photo-electrocatalytic mechanism of Ag/LaFeO₃ is illustrated in Figure 7d. The specific positions of the valence band and the conduction band of LaFeO₃ is determined according to XPS and Mott-Schottky results. The introduction of Ag nanoparticles is beneficial for absorbing more photons in the visible-light region. Electrons are excited from the valence band to the conduction band under the light irradiation due to the electron affinity of Ag particles, electron transfer occurs, achieving a more efficient electron-hole separation, which is crucial for improving the PEC performance. Moreover, we speculate that the introduction of Ag nanoparticles increases the active sites of the catalytic reaction, which can be confirmed using the electrochemical active surface area.
Figure 8a shows the CV curves of LaFeO₃ and LaFeO₃ samples with different Ag loading ratios at different scanning rates. The peak current increases with the scanning rate. This is because the charge-transfer reaction is faster at a higher scanning rate, and there is less accumulation of unreacted charges. The Ag-loaded samples show a higher current response than pure LaFeO₃, especially at high scanning rates, indicating that the Ag loading improves the electrical conductivity and electrochemical activity of the material. Figure 8b shows the relationship between the change in current response ΔJ/2 and the scanning rate. Here, ΔJ/2 refers to half of the difference between the peak current density and the scanning rate, which is usually used to evaluate the electrochemical capacitance. The ΔJ/2 values of all samples increase with the scanning rate. Pure LaFeO₃ shows the lowest ΔJ/2 slope while the Ag-doped samples show higher slopes, indicating that the doped samples have higher electrochemical activity and/or larger surface capacitance. The slope of the curve can be approximately regarded as the electrochemical capacitance of the sample. The 5 mol% Ag/LaFeO₃ sample has the highest slope (the highest electrochemical capacitance), about 1.87 mF·cm⁻², which is beneficial for energy-storage applications and fast charge transfer.
The above data indicate that the electrochemical performance of LaFeO3 can be significantly improved by loading Ag nanoparticles, especially in terms of electrochemical capacitance and current response ability. This improvement in performance is due to the high electrical conductivity and electron transport ability of Ag nanoparticles, as well as the potentially increased electrocatalytic active surface area. These properties make the Ag/LaFeO3 composites as a very promising candidate for PEC photoelectrode materials.
4. Conclusion
In conclusion, Ag nanoparticles modified LaFeO3 photoelectrodes were prepared for PEC water splitting by a molten salt method and direct reduction method. The experimental results show that LaFeO3 loaded with 3% Ag exhibits the best photo response performance in the transient photocurrent test, proving that the modification of Ag nanoparticles promotes the effective generation and separation of photogenerated charges. EIS and MS analysis further confirm that the loading of Ag nanoparticles reduces the charge transfer impedance and increases the electron density and electrochemical activity of the electrode. The charge transfer efficiency and flat band potential are significantly improved in the Ag/LaFeO3 nanocomposites. The 3 mol% Ag/LaFeO3 nanocomposite has the maximum photocurrent density (29.8 µA·cm-2) under sunlight illumination and the smallest Tafel slope (264.0 mV dec-1). In addition, Ag nanoparticles significantly enhance the light absorption ability of LaFeO3 and effectively reduces the optical bandgap, which is beneficial for capturing more photons in the visible light region. The Ag/LaFeO3 nanocomposites also exhibit a higher electrochemical capacitance, indicating their excellent ability for rapid charge storage and release.
Acknowledgments
This work was supported by the National Natural Science Foundation of China (No. 51974086) and the Fundamental Research Funds for the Central Universities (N25YJS003). We would like to appreciate Northeastern University’s Analysis and Testing Center for supplying the instruments and assistance with data analysis. We also thank Jilong Gao from Shiyanjia Lab for performing the PL spectra and XPS analysis (http://www.shiyanjia.com).
References
- Reddy N M, Kothandan D, Reddy V P, et al. Collating the structural, vibrational, and photocatalysis properties of LaFeO3 rare-earth orthoferrite nanoparticles synthesized by the sol-gel method. J Sol-Gel Sci Technol 2025, 113, 322–330. [Google Scholar] [CrossRef]
- Sukumar M, Simon D, Kumar A, et al. A comparative study of structural, optical, and magnetic properties of LaFeO3 and La2CuO4 perovskite nanoparticles. J Mater Sci-Mater Electron 2024, 35, 10. [Google Scholar]
- Hamdani, I.R.; Bhaskarwar, A.N. Recent progress in material selection and device designs for photoelectrochemical water-splitting. Renew. Sust. Energ. Rev. 2021, 138, 20. [Google Scholar] [CrossRef]
- Aslam, S.; Awais, M.; Ahmed, S.; Safdar, M.; Buksh, A.A.; Haroone, M.S. Photoelectrochemical Water Splitting by Using Nanomaterials: A Review. J. Electron. Mater. 2024, 53, 1–15. [Google Scholar] [CrossRef]
- Wu, W.H.; Nie, Z.F.; Huang, P.A.; Zhang, M.M.; Zhang, S.N.; Zhu, X.R.; Wang, L.J.; Zhu, L.P. Enhanced photoelectrochemical performance of BiVO<sub>4</sub> nanoparticle-modified TiO<sub>2</sub> nanorod arrays. Surf. Interfaces 2024, 55, 11. [Google Scholar] [CrossRef]
- Lu, P.; Zhang, Z.H.; Gu, Z.X.; Li, Z.; Su, H.N.; Shen, X.Z.; Xu, Q. Construction of Fe<sub>2</sub>O<sub>3</sub>-CuO Heterojunction Photoelectrode for Enhanced Efficiency of Solar Redox Flow Batteries. Processes 2024, 12, 13. [Google Scholar] [CrossRef]
- Dong, F.L.; Zhang, P.F.; Cheng, J.Y.; Chen, J.N.; Liu, T.; Ma, X.Y.; Song, S.; Nie, S.X. Triboelectric-photocatalytic coupling enhanced photogenerated electrons and holes utilization for efficient algal inactivation. Nano Energy 2023, 118, 10. [Google Scholar] [CrossRef]
- Abdullah, A.; Tariq, F.; Kulkarni, M.A.; Thaalbi, H.; Din, H.U.; Kang, S.H.; Ha, J.S.; Ryu, S.W. Cost-effective and efficient CuS/GaN/n-Si photoanode engineered for water splitting through extended light absorption and optimized charge transport. Mater. Today Energy 2025, 49, 9. [Google Scholar] [CrossRef]
- Cao, Y.F.; Liu, D.Y.; Ni, X.; Meng, X.R.; Zhou, Y.; Sun, Z.F.; Kuang, Y.B. Better Charge Separation in CuO Nanowire Array Photocathodes: Micro-/Nanostructure Regulation for Photoelectrochemical Reaction. ACS Appl. Energ. Mater. 2020, 3, 6334–6343. [Google Scholar] [CrossRef]
- Yang, H.M.; Xu, M.L.; Li, Z.L.; Ge, S.G.; Zhang, L.N.; Zhu, P.H.; Yu, J.H. Dual-photocathode array propelled lab-on-paper ratiometric photoelectrochemical sensing platform for ultrasensitive microRNA bioassay. Sens. Actuator B-Chem. 2020, 316, 9. [Google Scholar] [CrossRef]
- Garvey, S.; Holmes, J.D.; Kim, Y.S.; Long, B. Vapor-Phase Passivation of Chlorine-Terminated Ge(100) Using Self-Assembled Monolayers of Hexanethiol. ACS Appl. Mater. Interfaces 2020, 12, 29899–29907. [Google Scholar] [CrossRef] [PubMed]
- Zhu, Z.M.; Plis, E.; Amtout, A.; Bhattacharya, P.; Krishna, S. Investigation of surface passivation in InAs/GaSb strained-layer-superlattices using picosecond excitation correlation measurement and variable-area diode array surface recombination velocity measurement. In Proceedings of the Symposium on Progress in Semiconductor Materials V held at the 2005 MRS Fall Meeting, Boston, MA, 2005, Nov 28-Dec 01; p. 37.
- Cao, S.Y.; Zhang, Z.; Liao, Q.L.; Kang, Z.; Zhang, Y. Interface Engineering for High-Performance Photoelectrochemical Cells via Atomic Layer Deposition Technique. Energy Technol. 2021, 9, 14. [Google Scholar] [CrossRef]
- Liu, J.B.; Zhang, H.; Navarro-Pardo, F.; Selopal, G.S.; Sun, S.H.; Wang, Z.M.M.; Zhao, H.G.; Rosei, F. Hybrid surface passivation of PbS/CdS quantum dots for efficient photoelectrochemical hydrogen generation. Appl. Surf. Sci. 2020, 530, 9. [Google Scholar] [CrossRef]
- Zhao, Z.R.; Wang, M.Y.; Zheng, S.Y.; Zhang, Q.Q.; Han, L.; Li, X.B. Synergistic enhancement of photoelectrocatalytic activity and photostability in CdS photoanodes by ultrathin polydopamine layer. Sci. Technol. Energ. Transit 2024, 79, 9. [Google Scholar] [CrossRef]
- Xu, D.D.; Fu, Z.W.; Wang, D.J.; Lin, Y.H.; Sun, Y.J.; Meng, D.D.; Xie, T.F. A Ni(OH)<sub>2</sub>-modified Ti-doped α-Fe<sub>2</sub>O<sub>3</sub> photoanode for improved photoelectrochemical oxidation of urea: the role of Ni(OH)<sub>2</sub> as a cocatalyst. Phys. Chem. Chem. Phys. 2015, 17, 23924–23930. [Google Scholar] [CrossRef]
- Chen, D.S.; Duan, M.N.; Wang, M.; Ma, W.; Zhang, X.L.; Wu, X.F. Nanostructured Fe<sub>2</sub>TiO<sub>5</sub> photoanode with enhanced photoelectrochemical water splitting performance by Zn<SUP>2+</SUP> doping and FeNi(OH)<sub><i>x</i></sub> cocatalyst deposition. Crystengcomm 2024, 26, 5820–5825. [Google Scholar] [CrossRef]
- Sun, Q.; Cheng, T.; Liu, Z.R.; Qi, L.M. A cobalt silicate modified BiVO<sub>4</sub> photoanode for efficient solar water oxidation. Appl. Catal. B-Environ. 2020, 277, 9. [Google Scholar] [CrossRef]
- Andrei, F.; Ion, V.; Bîrjega, R.; Dinescu, M.; Enea, N.; Pantelica, D.; Mihai, M.D.; Maraloiu, V.A.; Teodorescu, V.S.; Marcu, I.C.; et al. Thickness-Dependent Photoelectrochemical Water Splitting Properties of Self-Assembled Nanostructured LaFeO<sub>3</sub> Perovskite Thin Films. Nanomaterials 2021, 11, 17. [Google Scholar] [CrossRef]
- Chertkova, V.P.; Iskortseva, A.N.; Pazhetnov, E.M.; Arkharova, N.A.; Ryazantsev, S.V.; Levin, E.E.; Nikitina, V.A. Evaluation of the Efficiency of Photoelectrochemical Activity Enhancement for the Nanostructured LaFeO<sub>3</sub> Photocathode by Surface Passivation and Co-Catalyst Deposition. Nanomaterials 2022, 12, 16. [Google Scholar] [CrossRef]
- Iervolino, G.; Vaiano, V.; Sannino, D.; Rizzo, L.; Palma, V. Enhanced photocatalytic hydrogen production from glucose aqueous matrices on Ru-doped LaFeO<sub>3</sub>. Appl. Catal. B-Environ. 2017, 207, 182–194. [Google Scholar] [CrossRef]
- Aissa, B.; Ali, A. Piezo inkjet formation of Ag nanoparticles from microdots arrays for surface plasmonic resonance. Sci Rep 2024, 14, 12. [Google Scholar] [CrossRef] [PubMed]
- Li, M.J.; Wang, J.P.; Zhou, Y.; Chen, Y.; Xia, L.Y. Photoelectrochemical biosensor with Au@PTCA Schottky junction and multiple sandwich structures for Hg2+sensitive detection. Microchem J. 2024, 196, 10. [Google Scholar] [CrossRef]
- Michalska, M.; Matejka, V.; Pavlovsky, J.; Praus, P.; Ritz, M.; Serencísová, J.; Gembalová, L.; Kormunda, M.; Foniok, K.; Reli, M.; et al. Effect of Ag modification on TiO<sub>2</sub> and melem/g-C<sub>3</sub>N<sub>4</sub> composite on photocatalytic performances. Sci Rep 2023, 13, 20. [Google Scholar] [CrossRef]
- Pleshanov, I.M.; Marasanov, D.; Sgibnev, Y.M.; Gets, D.S.; Kuzmenko, N.K.; Belorus, A.O. Influence of silver nanoparticles in the ion-exchange layer of photo-thermo-refractive porous glass on the spectral-luminescent properties of CsPbBr3 perovskite nanocrystals. Chem. Phys. Lett. 2023, 823, 6. [Google Scholar] [CrossRef]
- Li, Y.M.; Fan, L.; Shui, X.L.; Fan, J.; Feng, X.A.; Tao, T. Boosted photocatalytic activity of LaFeO<sub>3</sub>/Ag<sub>3</sub>PO<sub>4</sub> heterojunction via carbon quantum dots: Higher conductivity, stability, and dispersivity br. Colloid Surf. A-Physicochem. Eng. Asp. 2022, 652, 12. [Google Scholar] [CrossRef]
- Jia, D.S.; Pan, J.X.; Zhang, D.L.; Wang, M.T.; Li, Y. Construction of novel spherical ZnIn<sub>2</sub>S<sub>4</sub>-Ag-LaFeO<sub>3</sub> heterostructures for enhancing photocatalytic efficiency. J. Rare Earths 2025, 43, 295–303. [Google Scholar] [CrossRef]
- Humayun, M.; Bahadur, A.; Khan, A.; Bououdina, M. Exceptional Photocatalytic Performance of the LaFeO<sub>3</sub>/g-C<sub>3</sub>N<sub>4</sub> Z-Scheme Heterojunction for Water Splitting and Organic Dyes Degradation. Catalysts 2023, 13, 14. [Google Scholar] [CrossRef]
- Abbas, N.H.; Rasuli, R.; Panahi, P.N. Decorated titanium oxide with Ag nanoparticles as an efficient photocatalyst under visible light: a novel synthesis approach. Sci Rep 2025, 15, 17. [Google Scholar] [CrossRef]
- Sekrafi, H.E.; Costa, D.S.; Proença, M.; Meira, D.I.; Vaz, F.; Borges, J. Experimental and Theoretical Studies on Ag Nanoparticles with Enhanced Plasmonic Response, Formed Within Al<sub>2</sub>O<sub>3</sub> Thin Films Deposited by Magnetron Sputtering. Plasmonics 2024, 19, 3177–3188. [Google Scholar] [CrossRef]
Figure 1.
XRD patterns of LaFeO₃, 1 mol% Ag/LaFeO₃, 3 mol% Ag/LaFeO₃, and 5 mol% Ag/LaFeO₃ composites.
Figure 1.
XRD patterns of LaFeO₃, 1 mol% Ag/LaFeO₃, 3 mol% Ag/LaFeO₃, and 5 mol% Ag/LaFeO₃ composites.
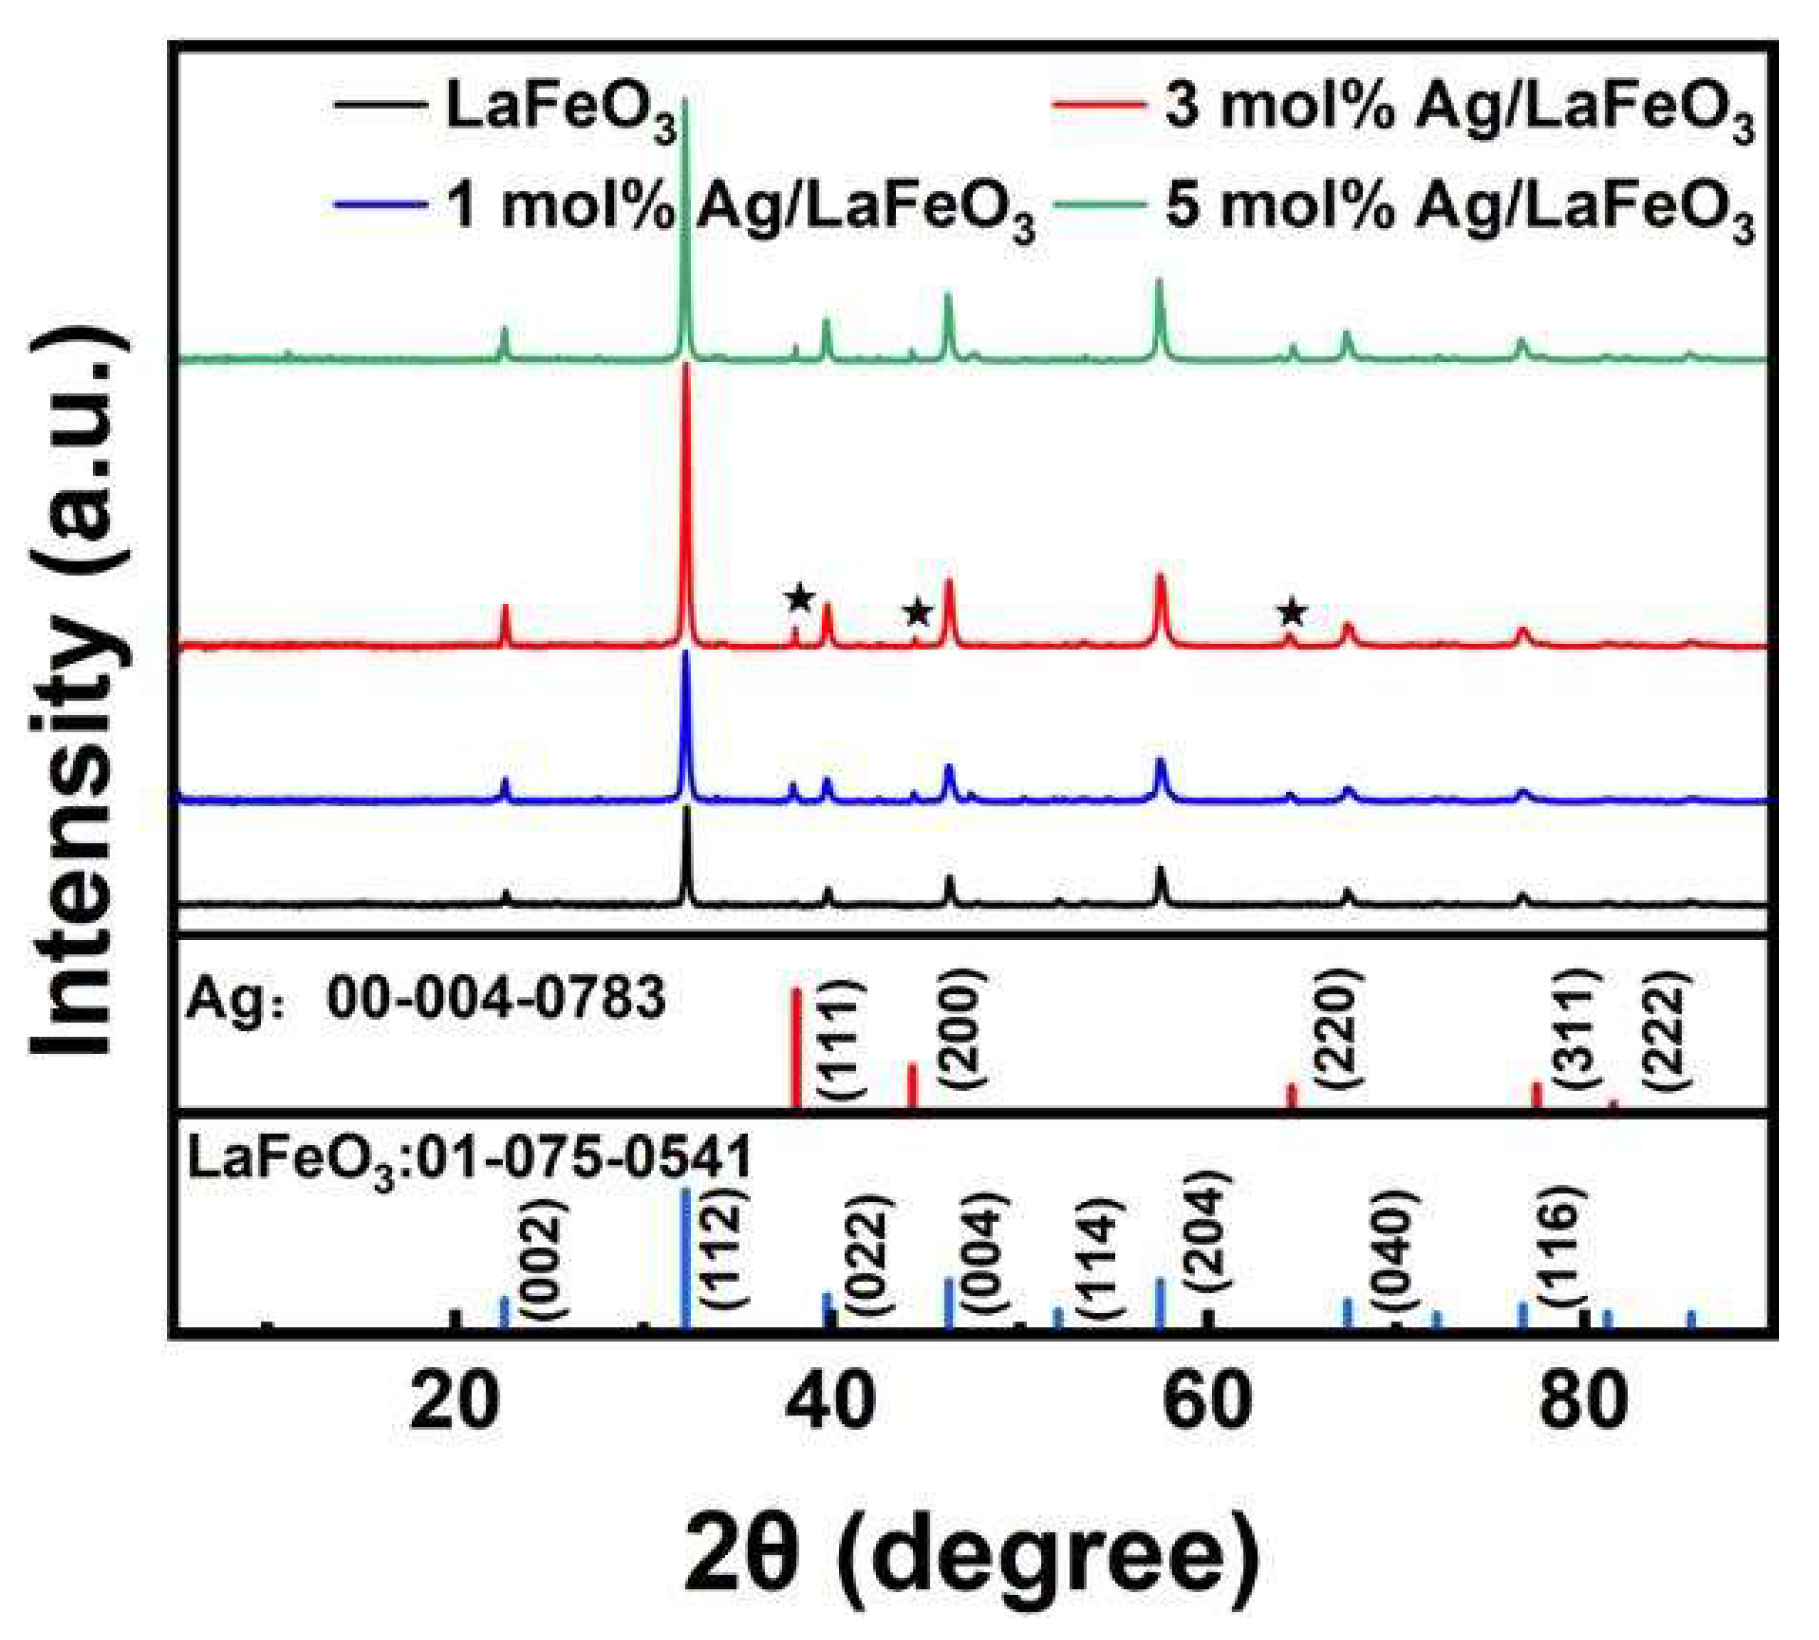
Figure 2.
(a) (b) SEM images of 3 mol% Ag/LaFeO₃ at different magnifications; (c) TEM and (d) HRTEM images of 3 mol% Ag/LaFeO₃ composites; (e) TEM electron diffraction image of 3 mol% Ag/LaFeO₃; (f) STEM image of 3 mol% Ag/LaFeO₃ nanocomposites and corresponding element distributions (g) Fe; (h) La; (i) O and (j) Ag.
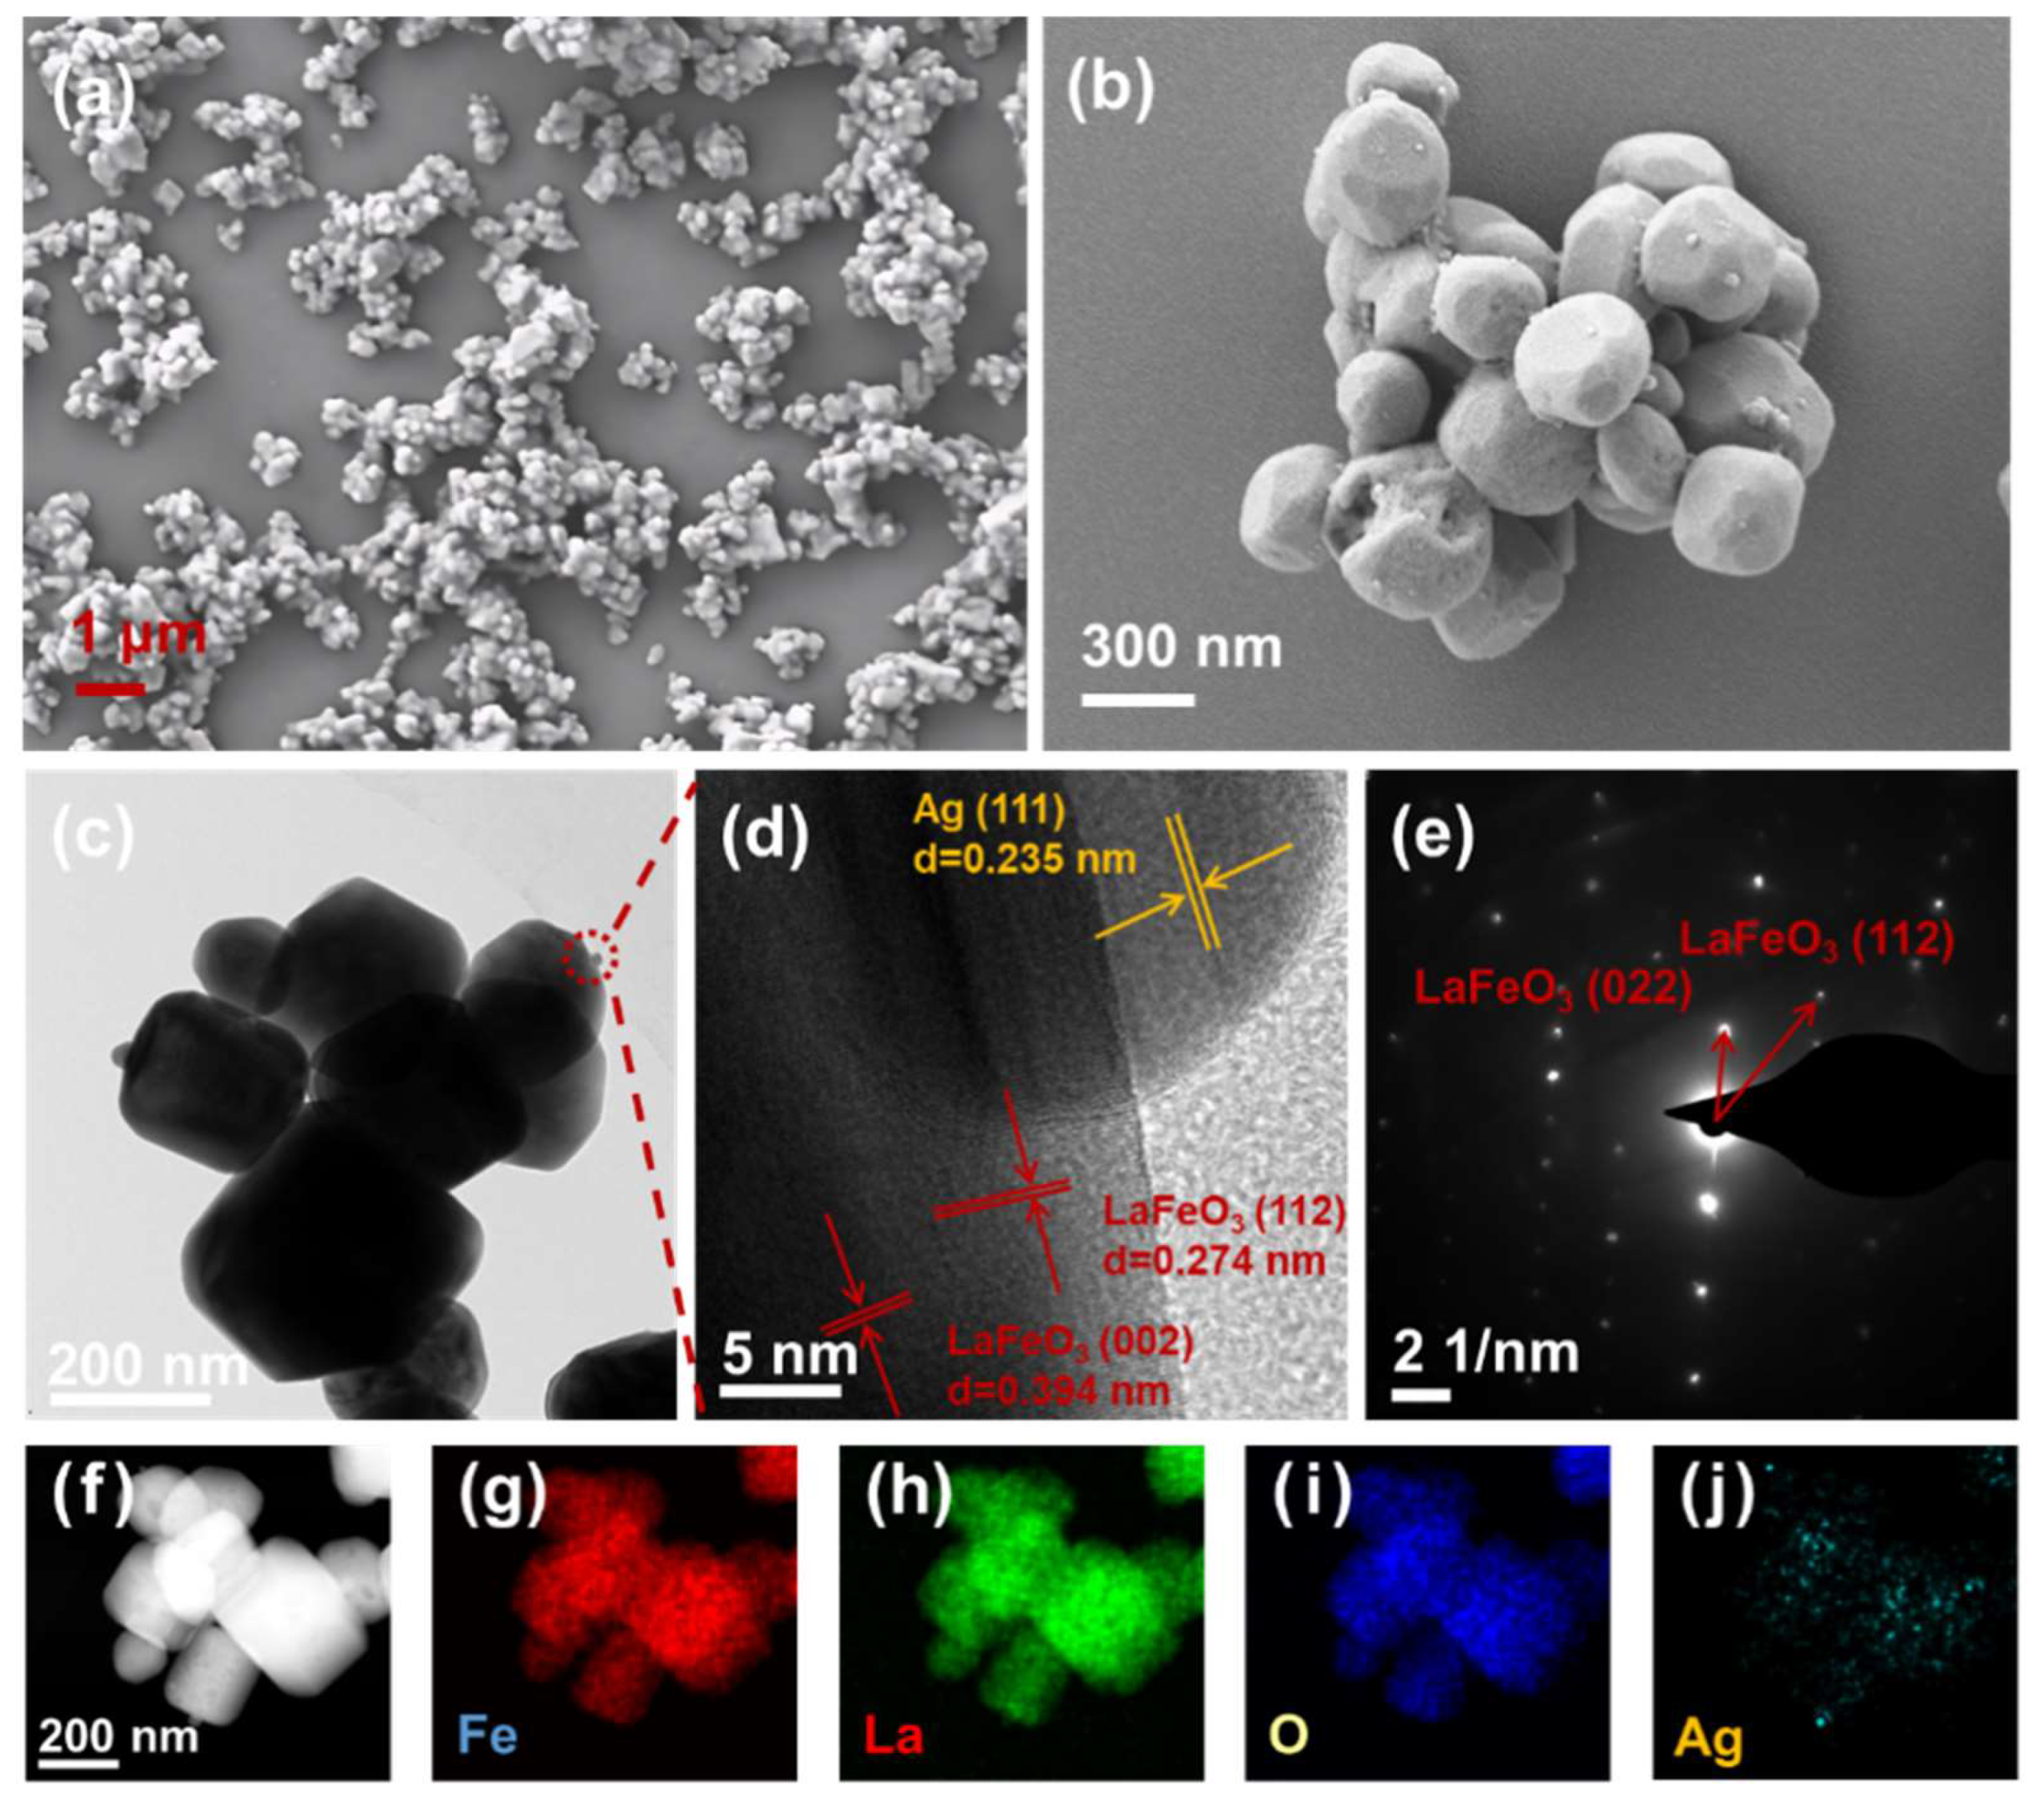
Figure 3.
XPS survey spectra of raw LaFeO₃ and 3 mol% Ag/LaFeO₃.
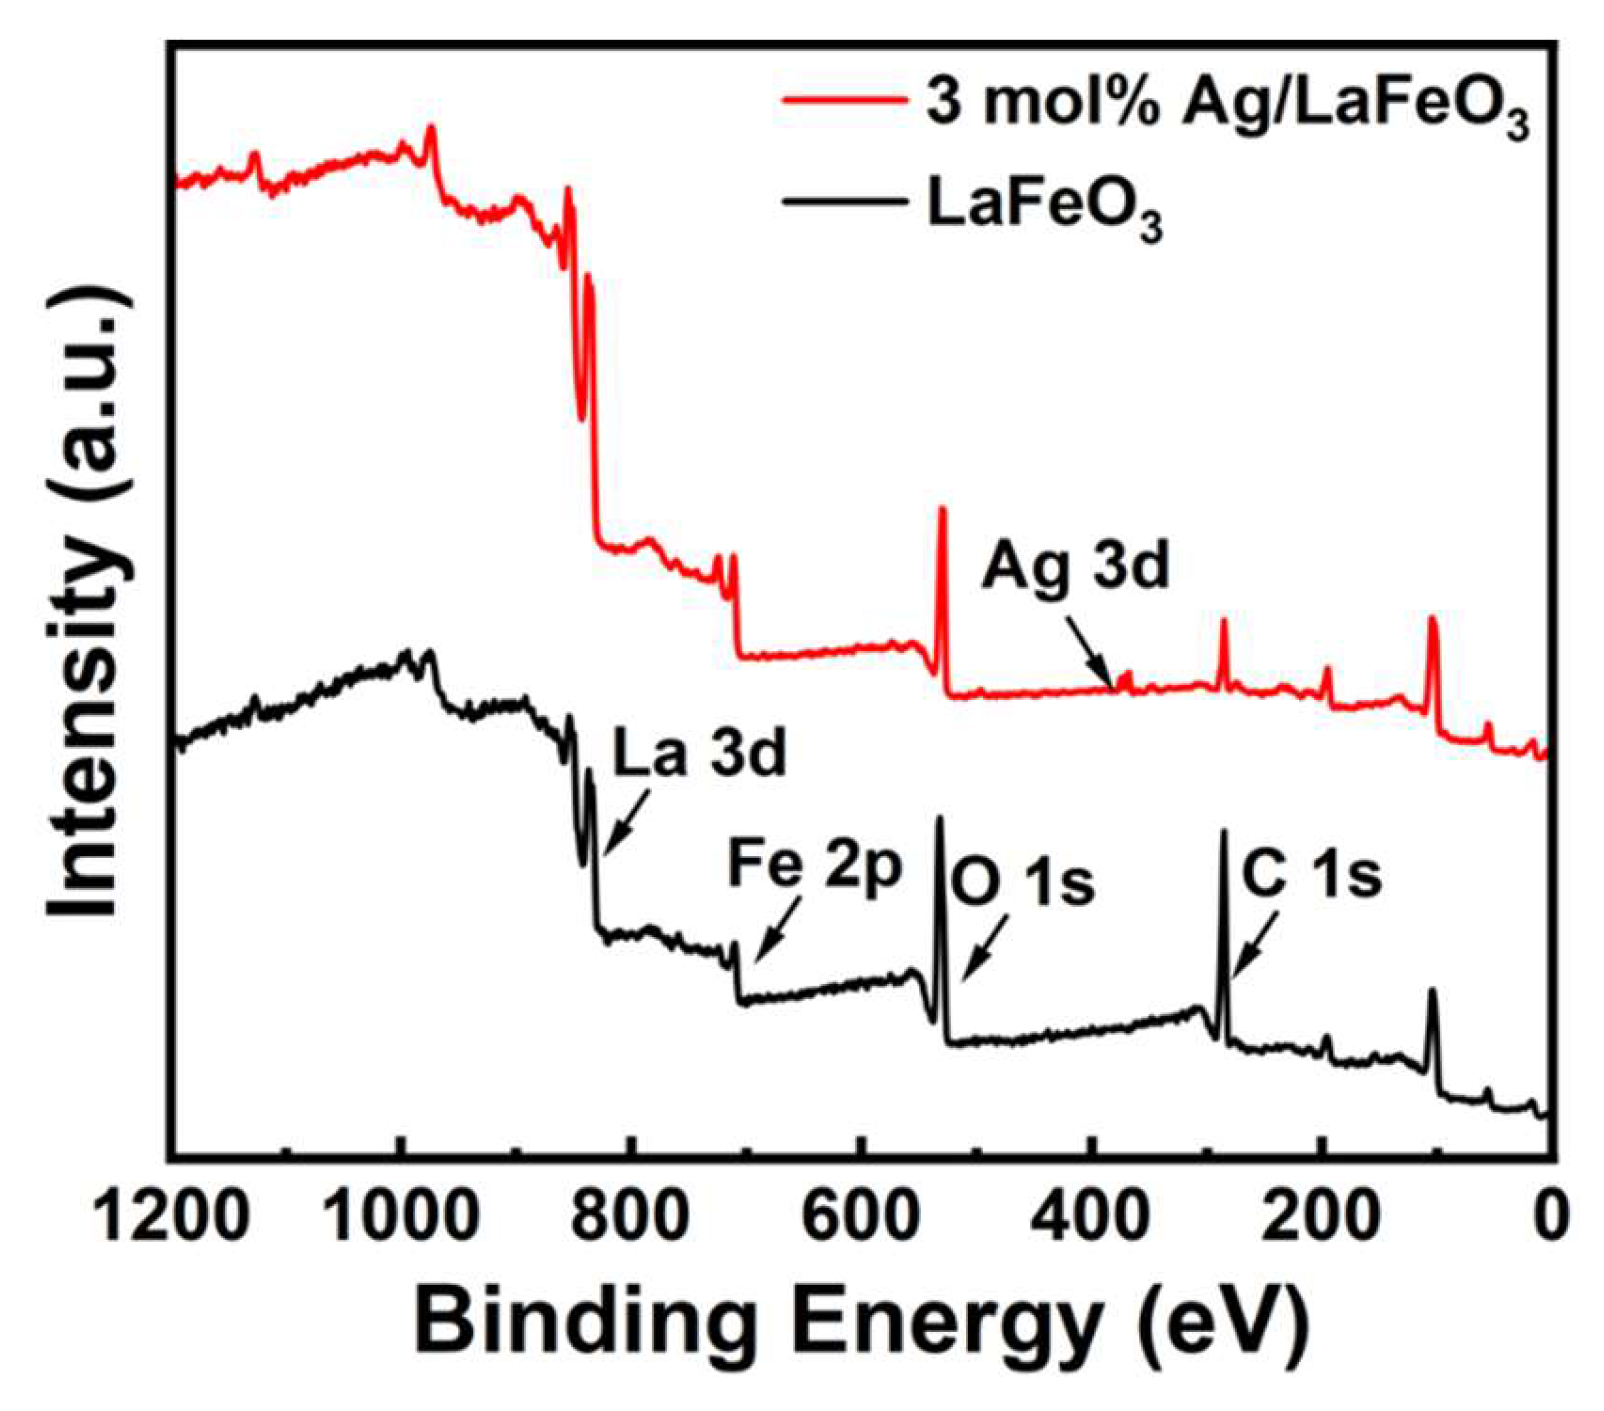
Figure 4.
High - resolution XPS spectra of (a) Fe 2p; (b) La 3d; (c) O 1s and (d) Ag 3d of the original LaFeO₃ and 3 mol% Ag/LaFeO₃ composites.
Figure 4.
High - resolution XPS spectra of (a) Fe 2p; (b) La 3d; (c) O 1s and (d) Ag 3d of the original LaFeO₃ and 3 mol% Ag/LaFeO₃ composites.
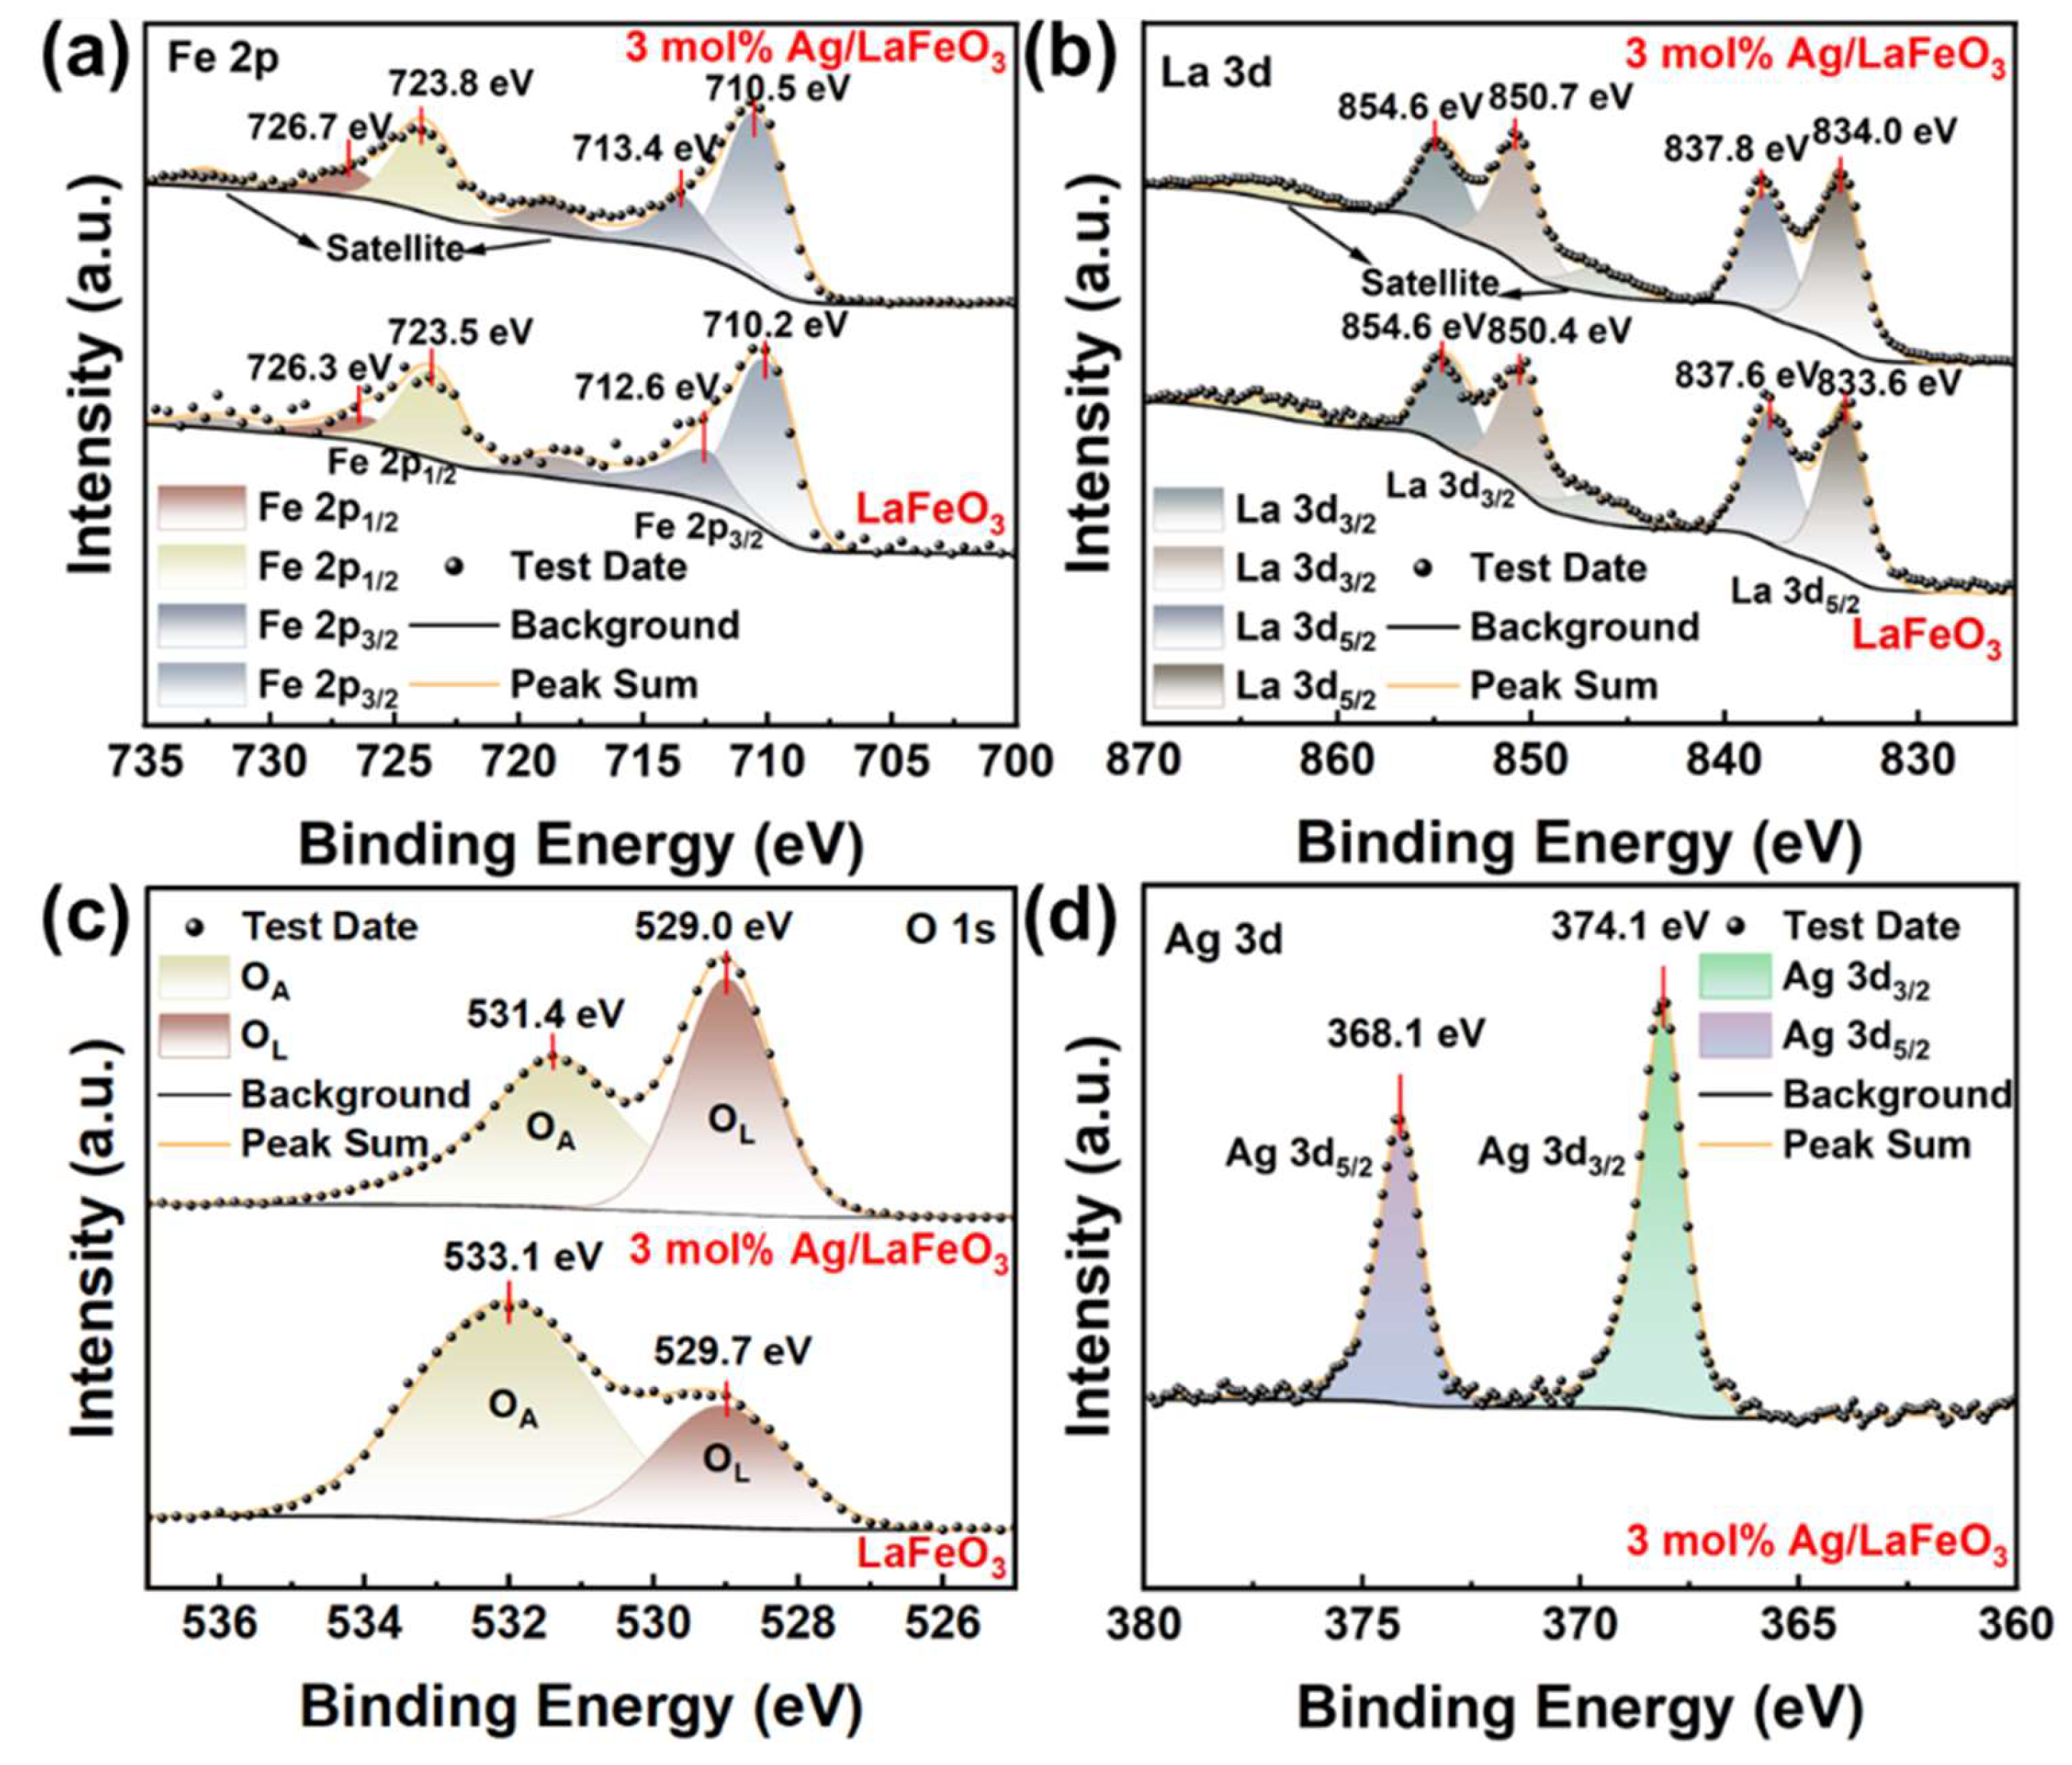
Figure 5.
(a) UV - Vis absorption spectra of LaFeO₃, 1 mol% Ag/LaFeO₃, 3 mol% Ag/LaFeO₃, and 5 mol% Ag/LaFeO₃ composites, and (b) Band gap energy estimated by the Tauc plot.
Figure 5.
(a) UV - Vis absorption spectra of LaFeO₃, 1 mol% Ag/LaFeO₃, 3 mol% Ag/LaFeO₃, and 5 mol% Ag/LaFeO₃ composites, and (b) Band gap energy estimated by the Tauc plot.
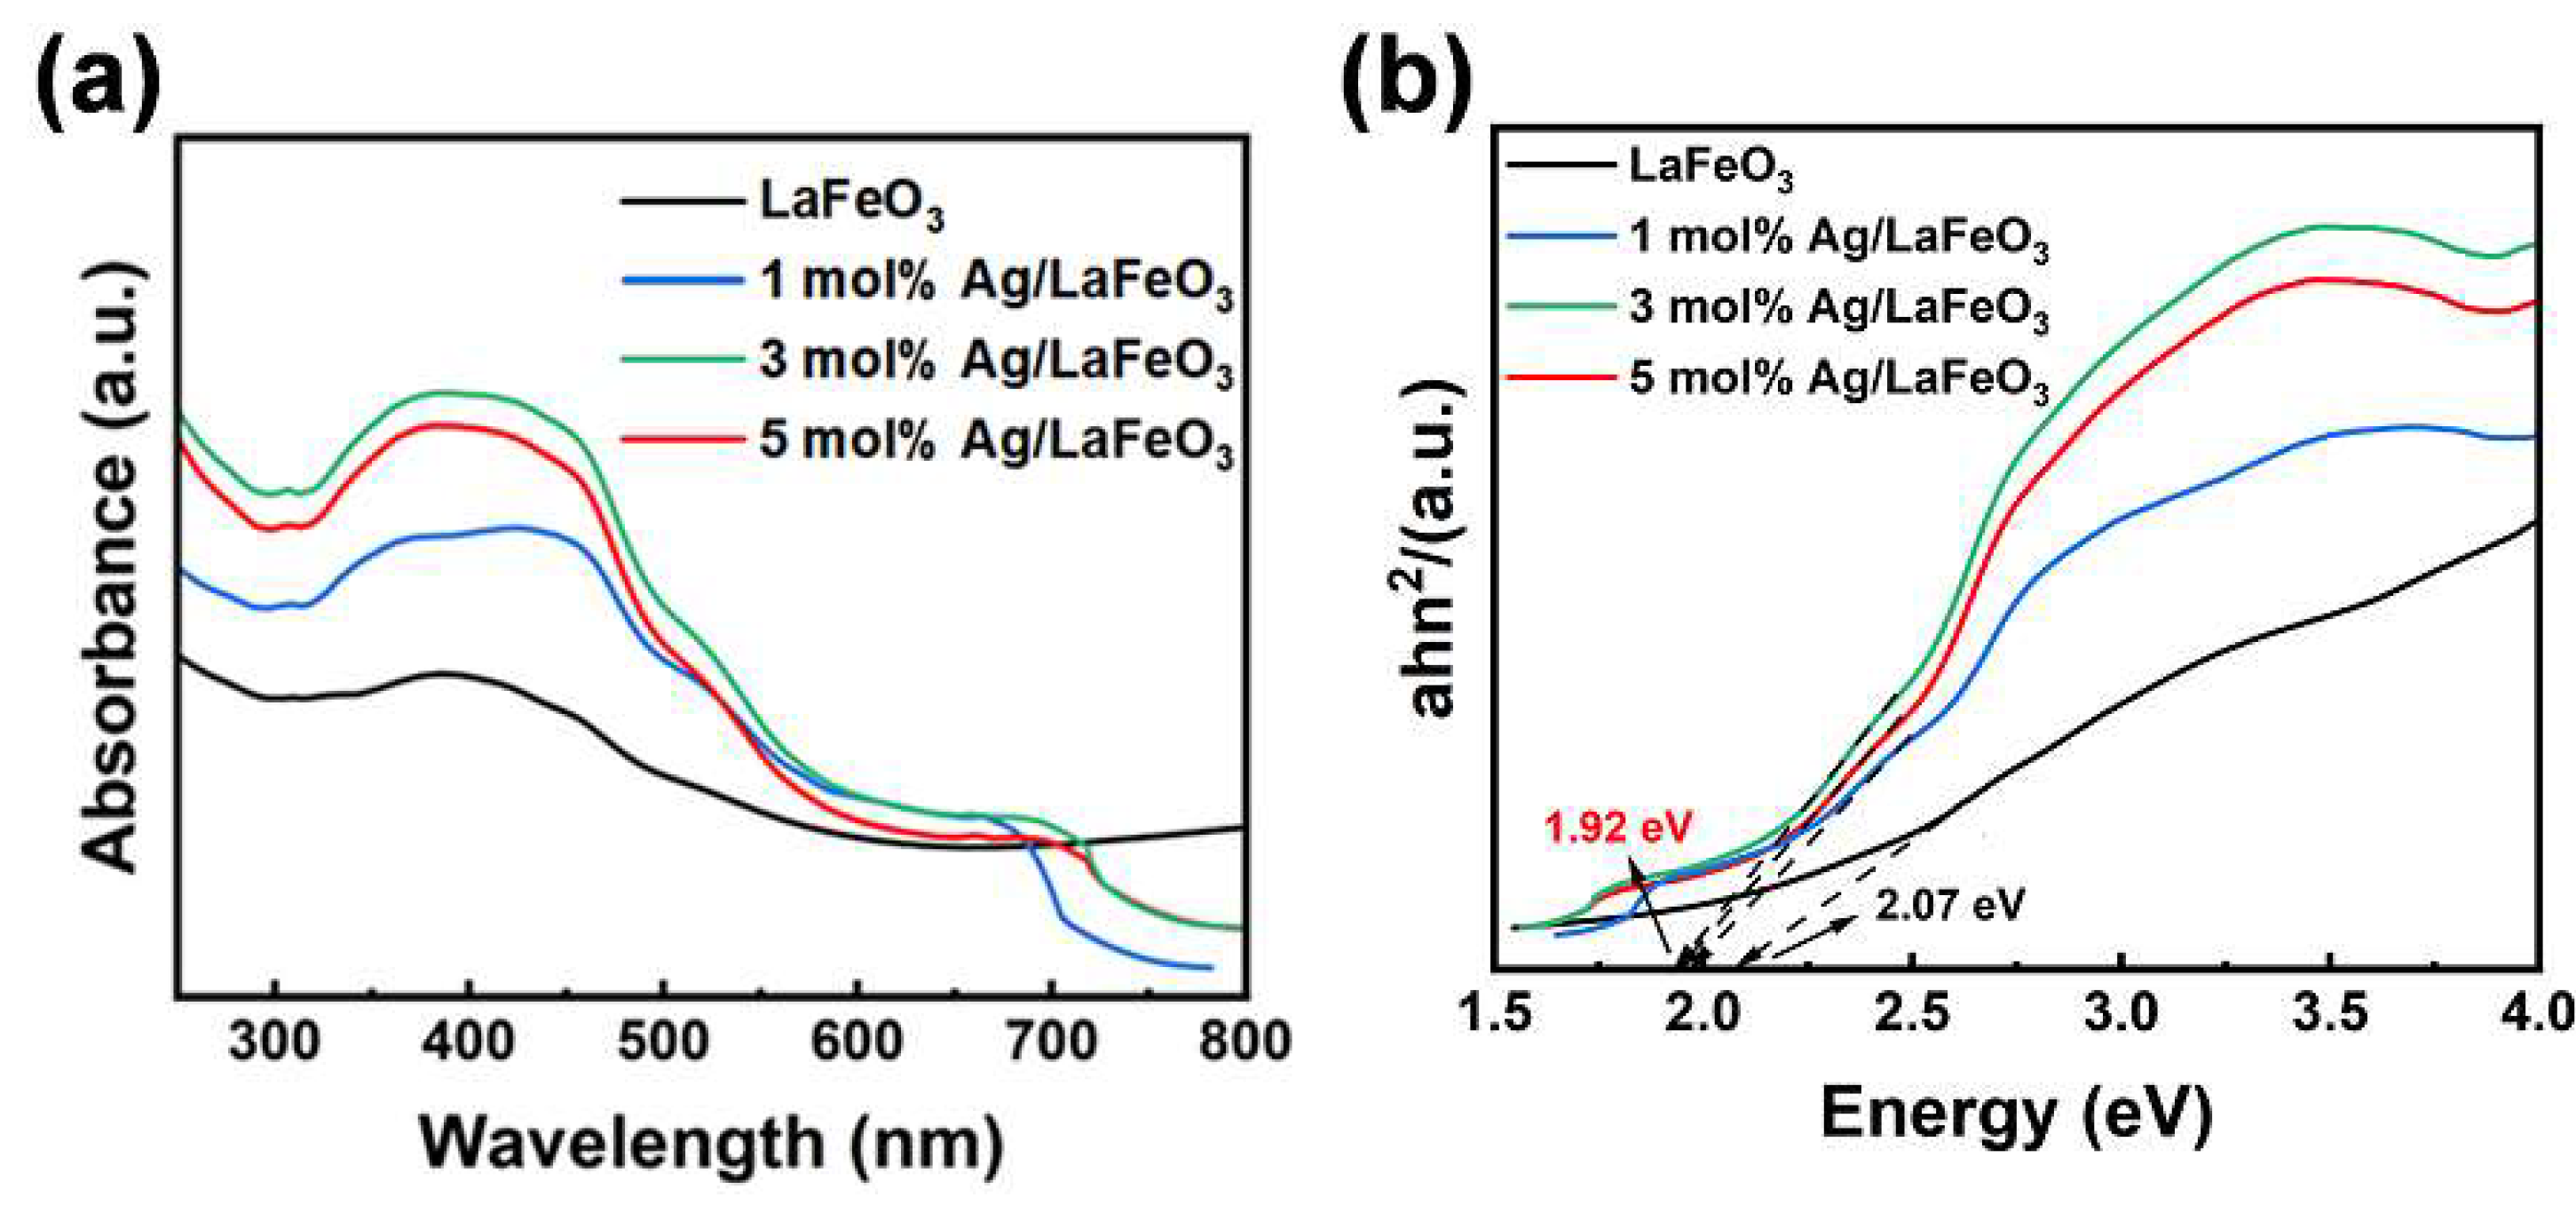
Figure 6.
Photochemical test: (a) Transient photocurrent curve I-t under AM 1.5G; (b) LSV curves of LaFeO3 and 3 mol% Ag/LaFeO3 photoelectrodes under light and dark conditions (1.23 V RHE); (c) LSV curve and (d) Tafel slope of photoelectrode prepared by the composite material under AM1.5G.
Figure 6.
Photochemical test: (a) Transient photocurrent curve I-t under AM 1.5G; (b) LSV curves of LaFeO3 and 3 mol% Ag/LaFeO3 photoelectrodes under light and dark conditions (1.23 V RHE); (c) LSV curve and (d) Tafel slope of photoelectrode prepared by the composite material under AM1.5G.
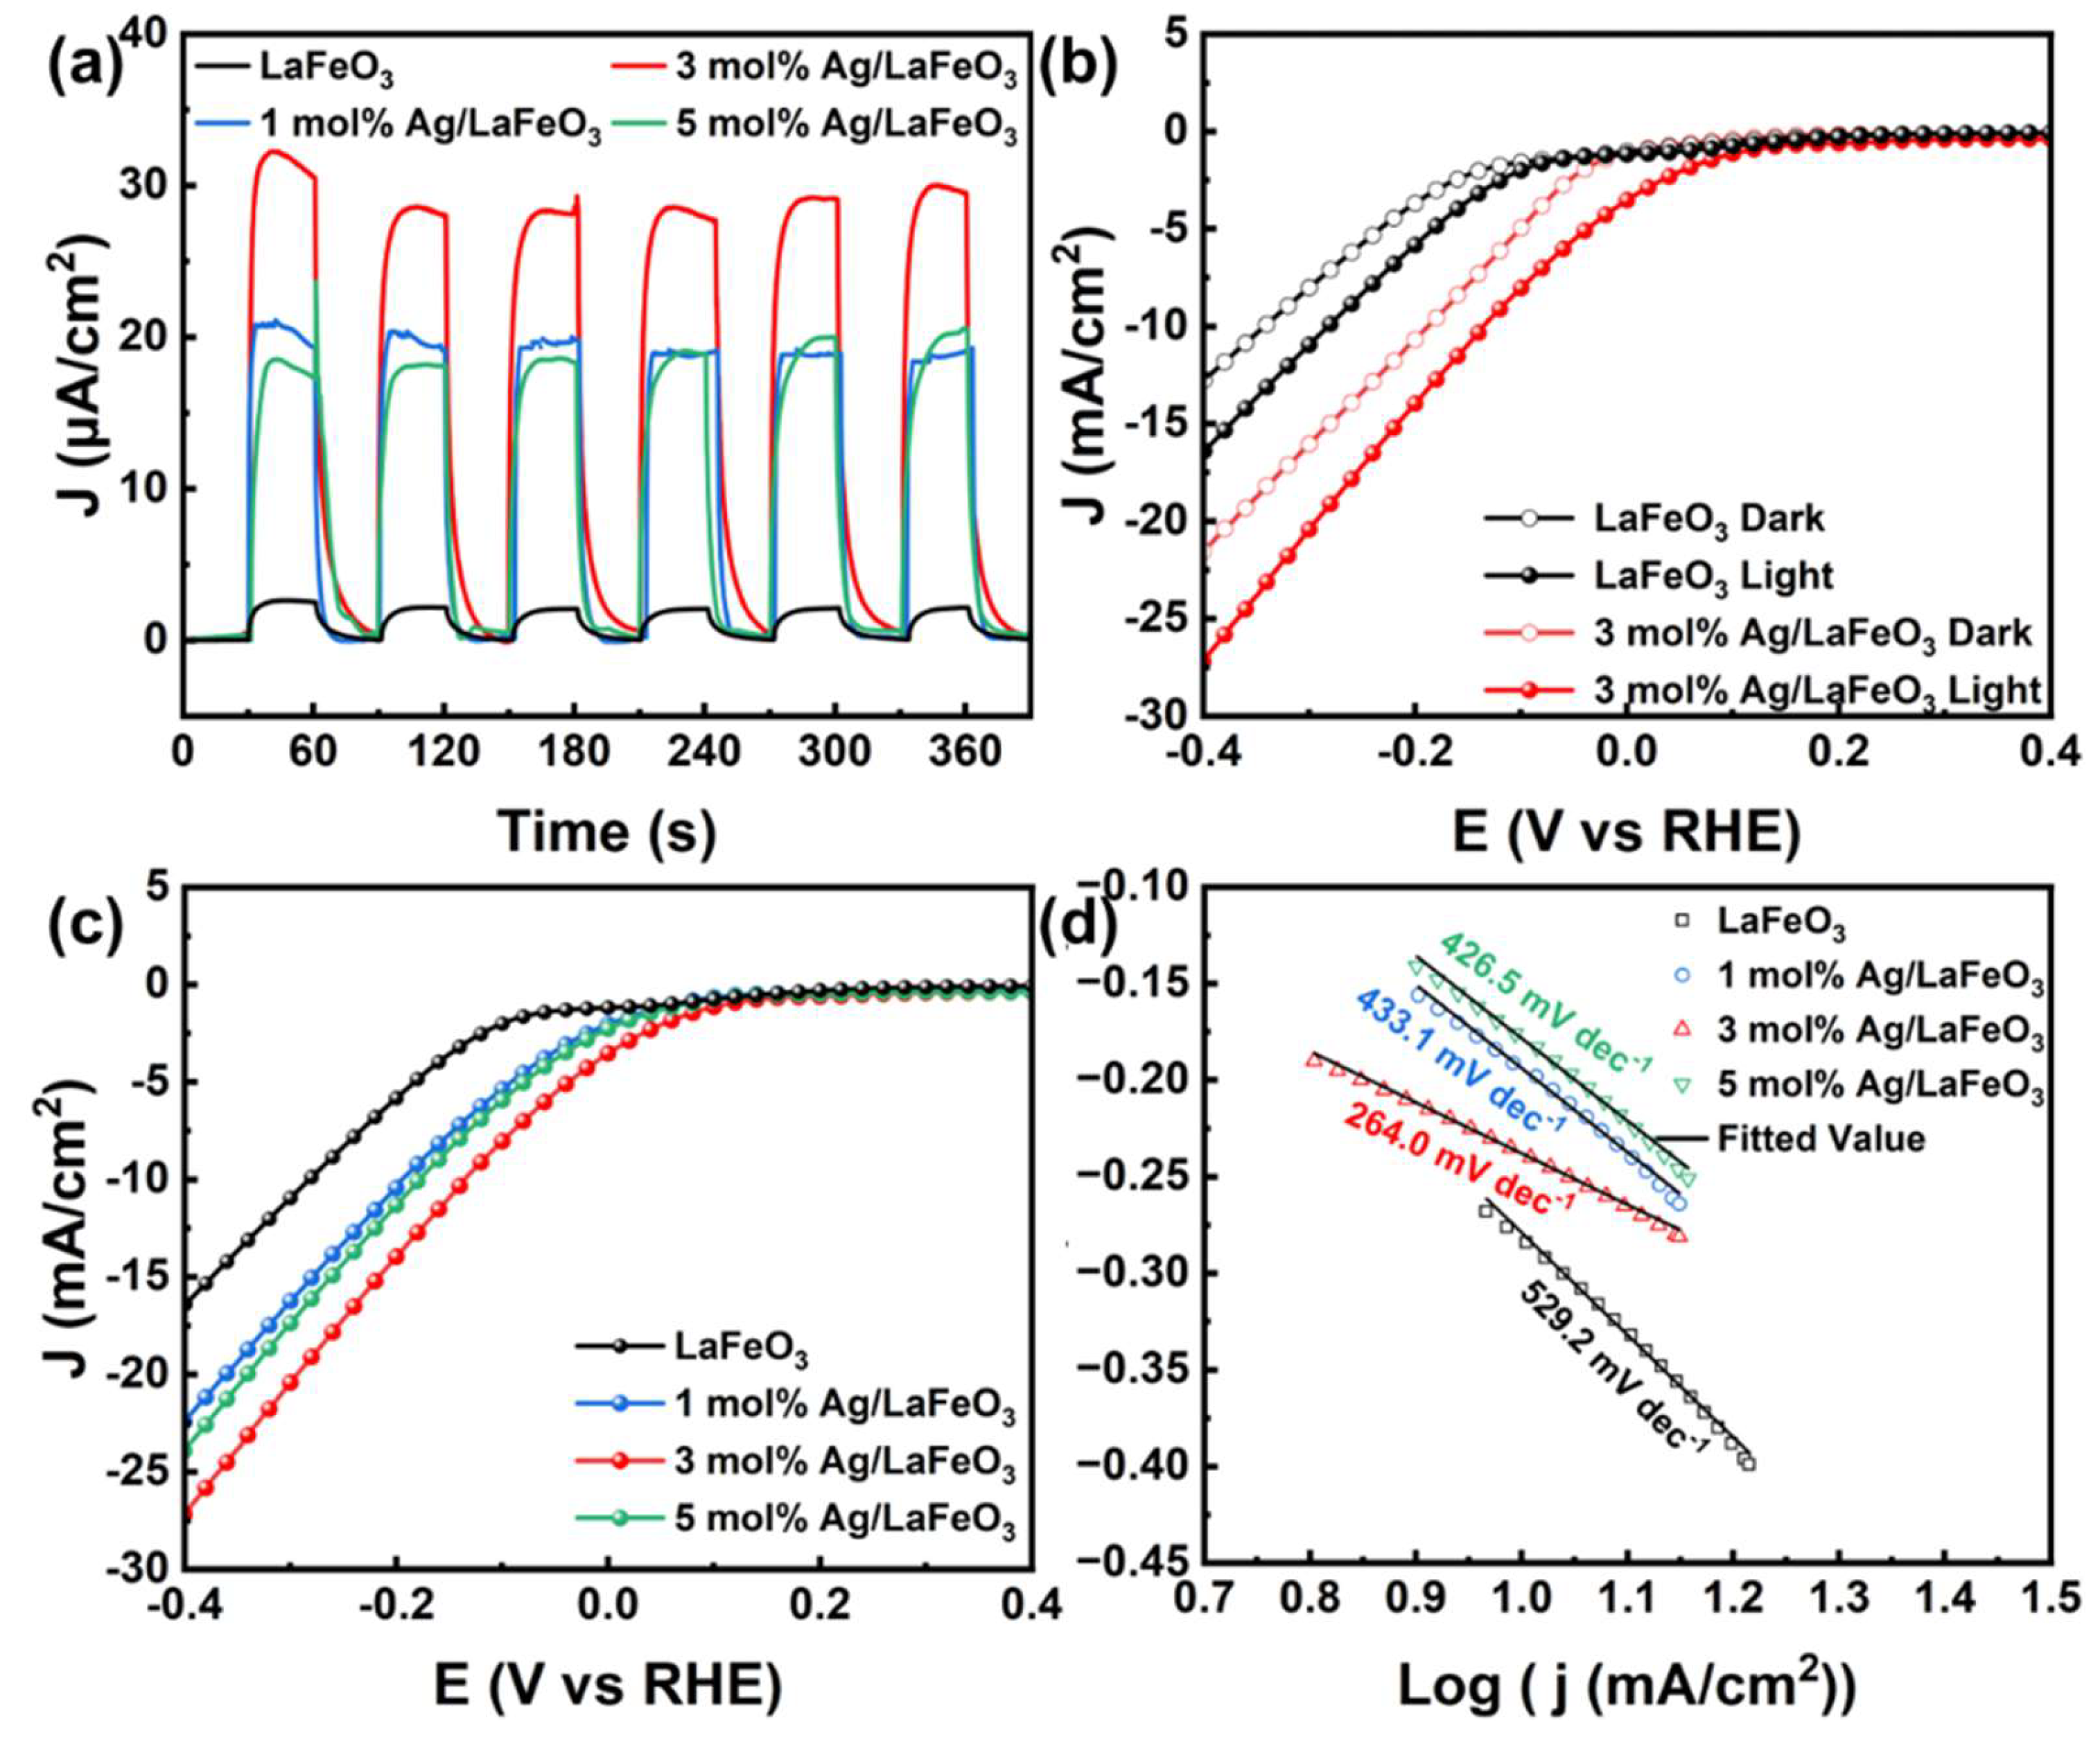
Figure 7.
EIS (a); Mott-Schottky curve (b) and XPS measure valence with Vb (c) of LaFeO3, 1 mol% Ag/LaFeO3, 3 mol% Ag/LaFeO3 and 5 mol% Ag/LaFeO3; (d) Schematic diagram of Ag/LaFeO3 photocatalytic mechanism.
Figure 7.
EIS (a); Mott-Schottky curve (b) and XPS measure valence with Vb (c) of LaFeO3, 1 mol% Ag/LaFeO3, 3 mol% Ag/LaFeO3 and 5 mol% Ag/LaFeO3; (d) Schematic diagram of Ag/LaFeO3 photocatalytic mechanism.
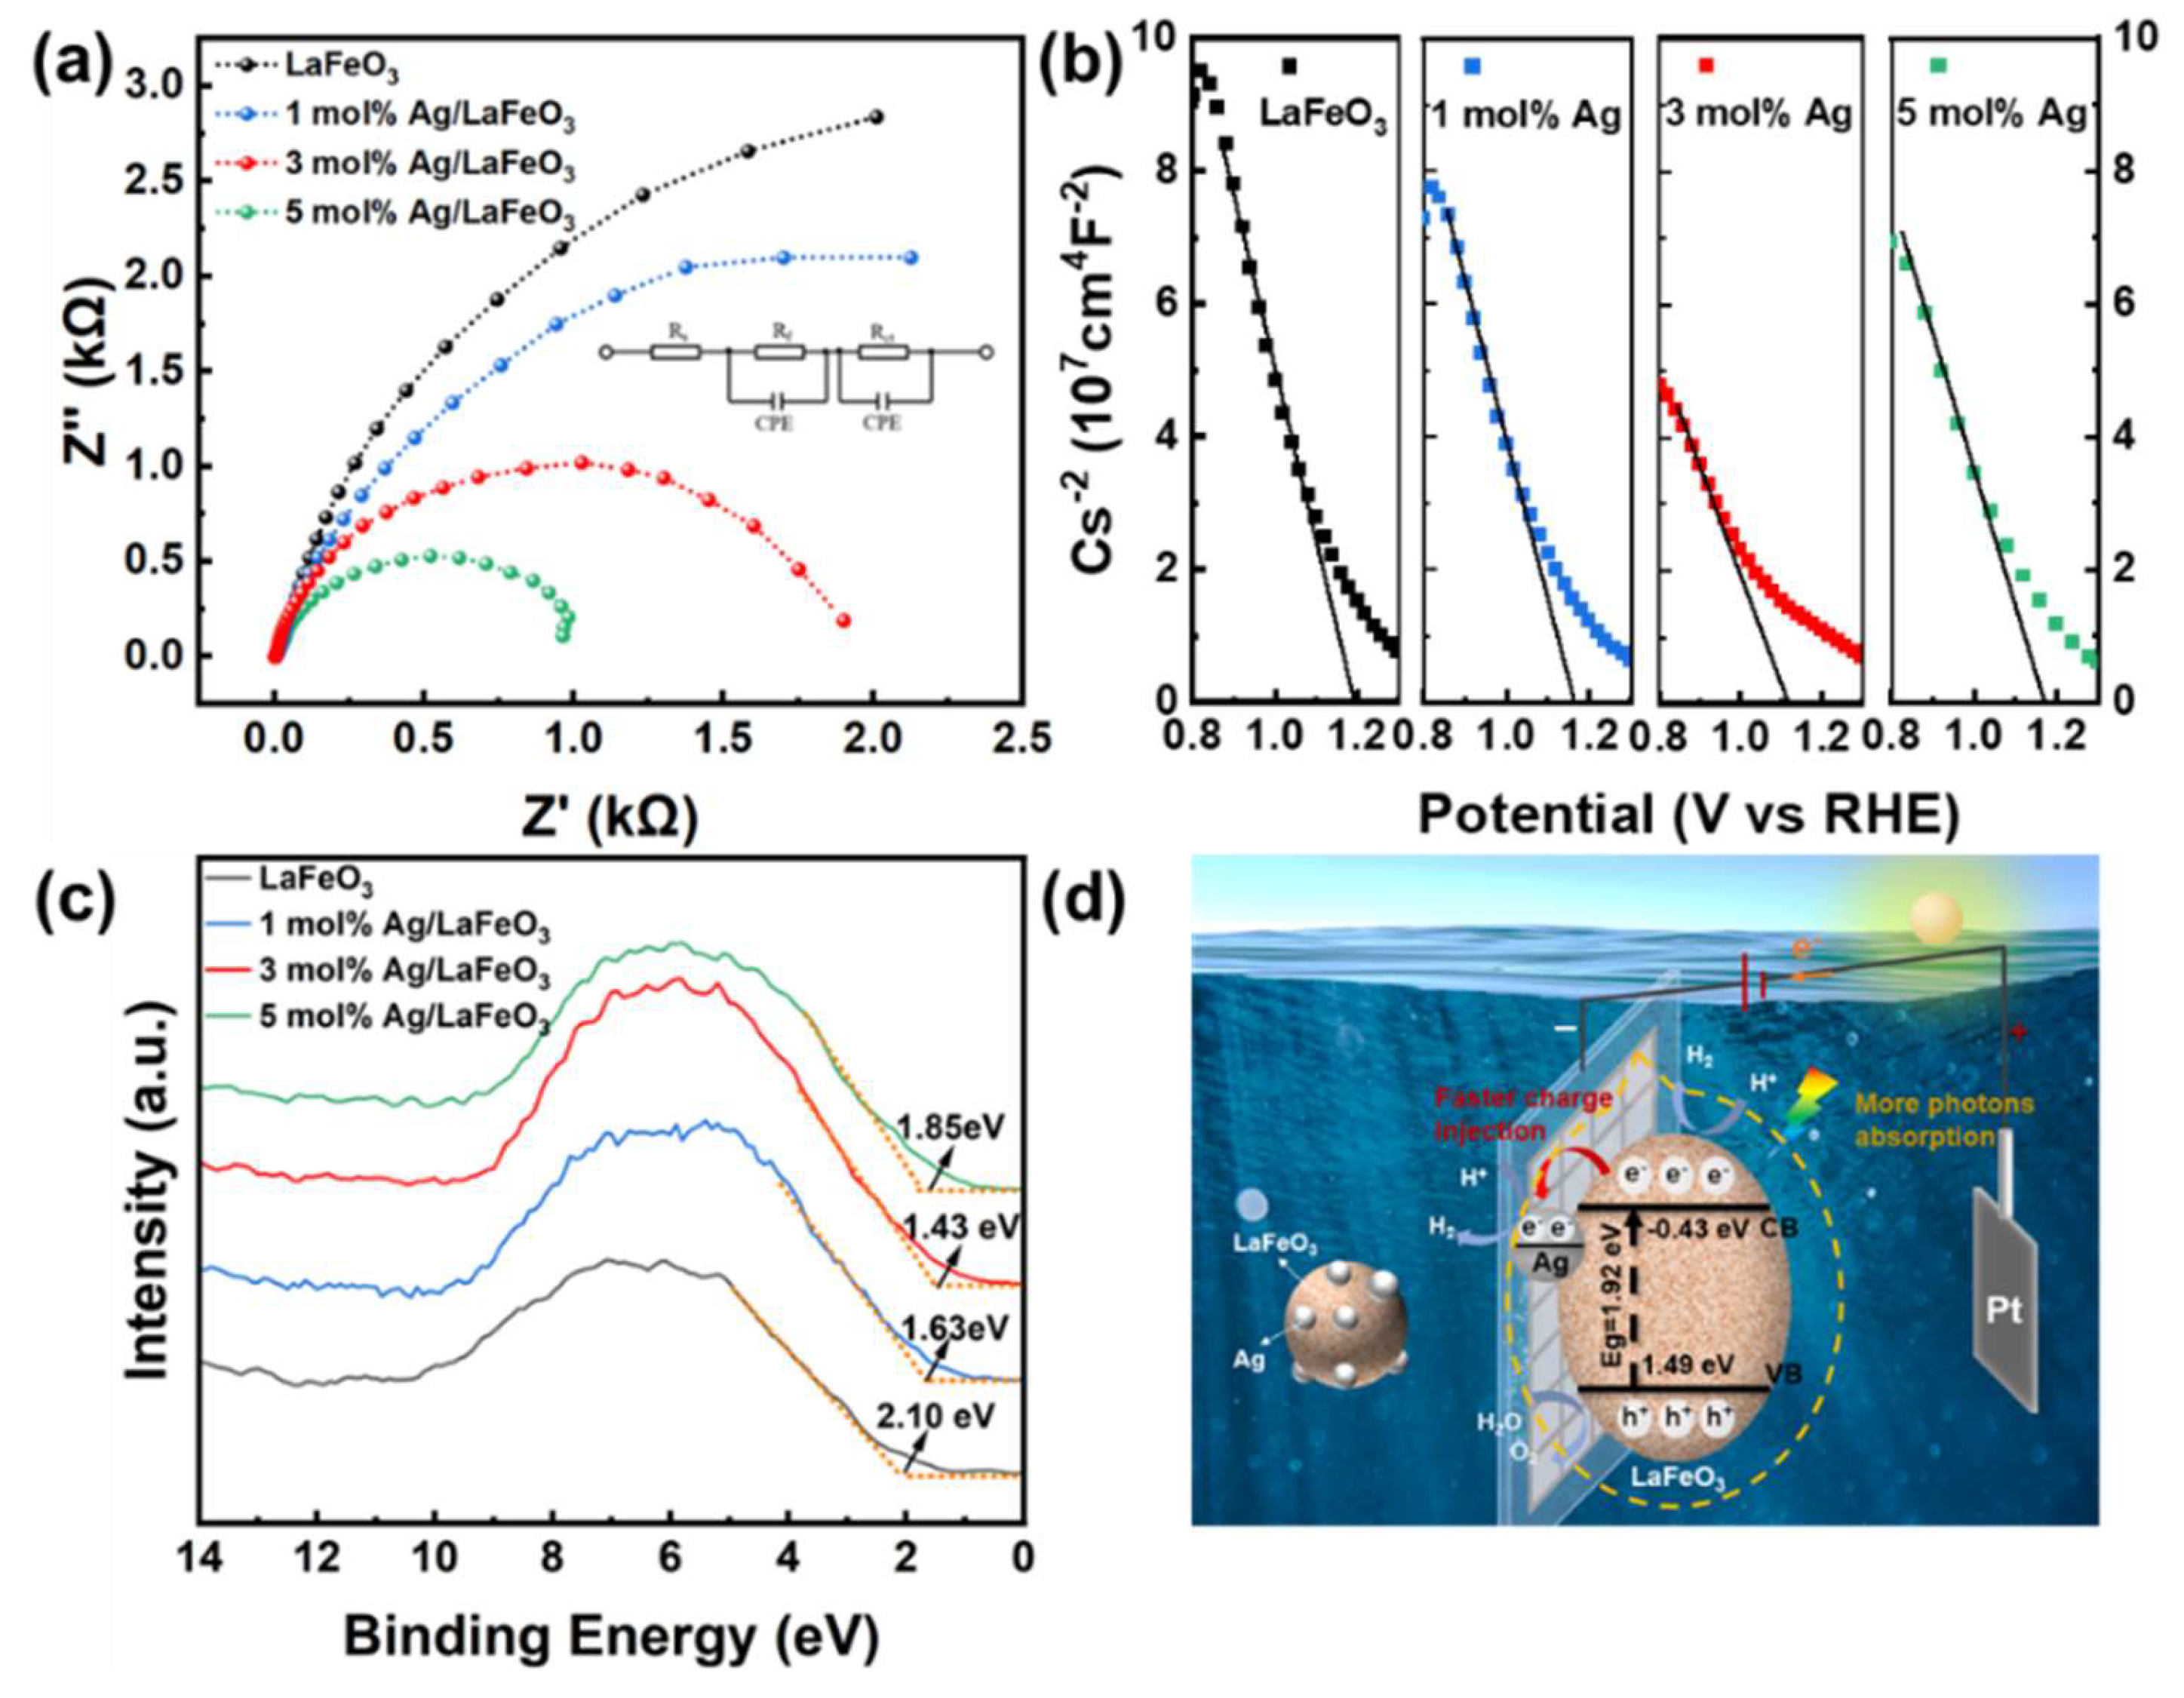
Figure 8.
CV curves of LaFeO3 (a), 1 mol% Ag/LaFeO3 (b), 3 mol% Ag/LaFeO3 (c) and 5 mol% Ag/LaFeO3 (d) at different scanning rates.
Figure 8.
CV curves of LaFeO3 (a), 1 mol% Ag/LaFeO3 (b), 3 mol% Ag/LaFeO3 (c) and 5 mol% Ag/LaFeO3 (d) at different scanning rates.
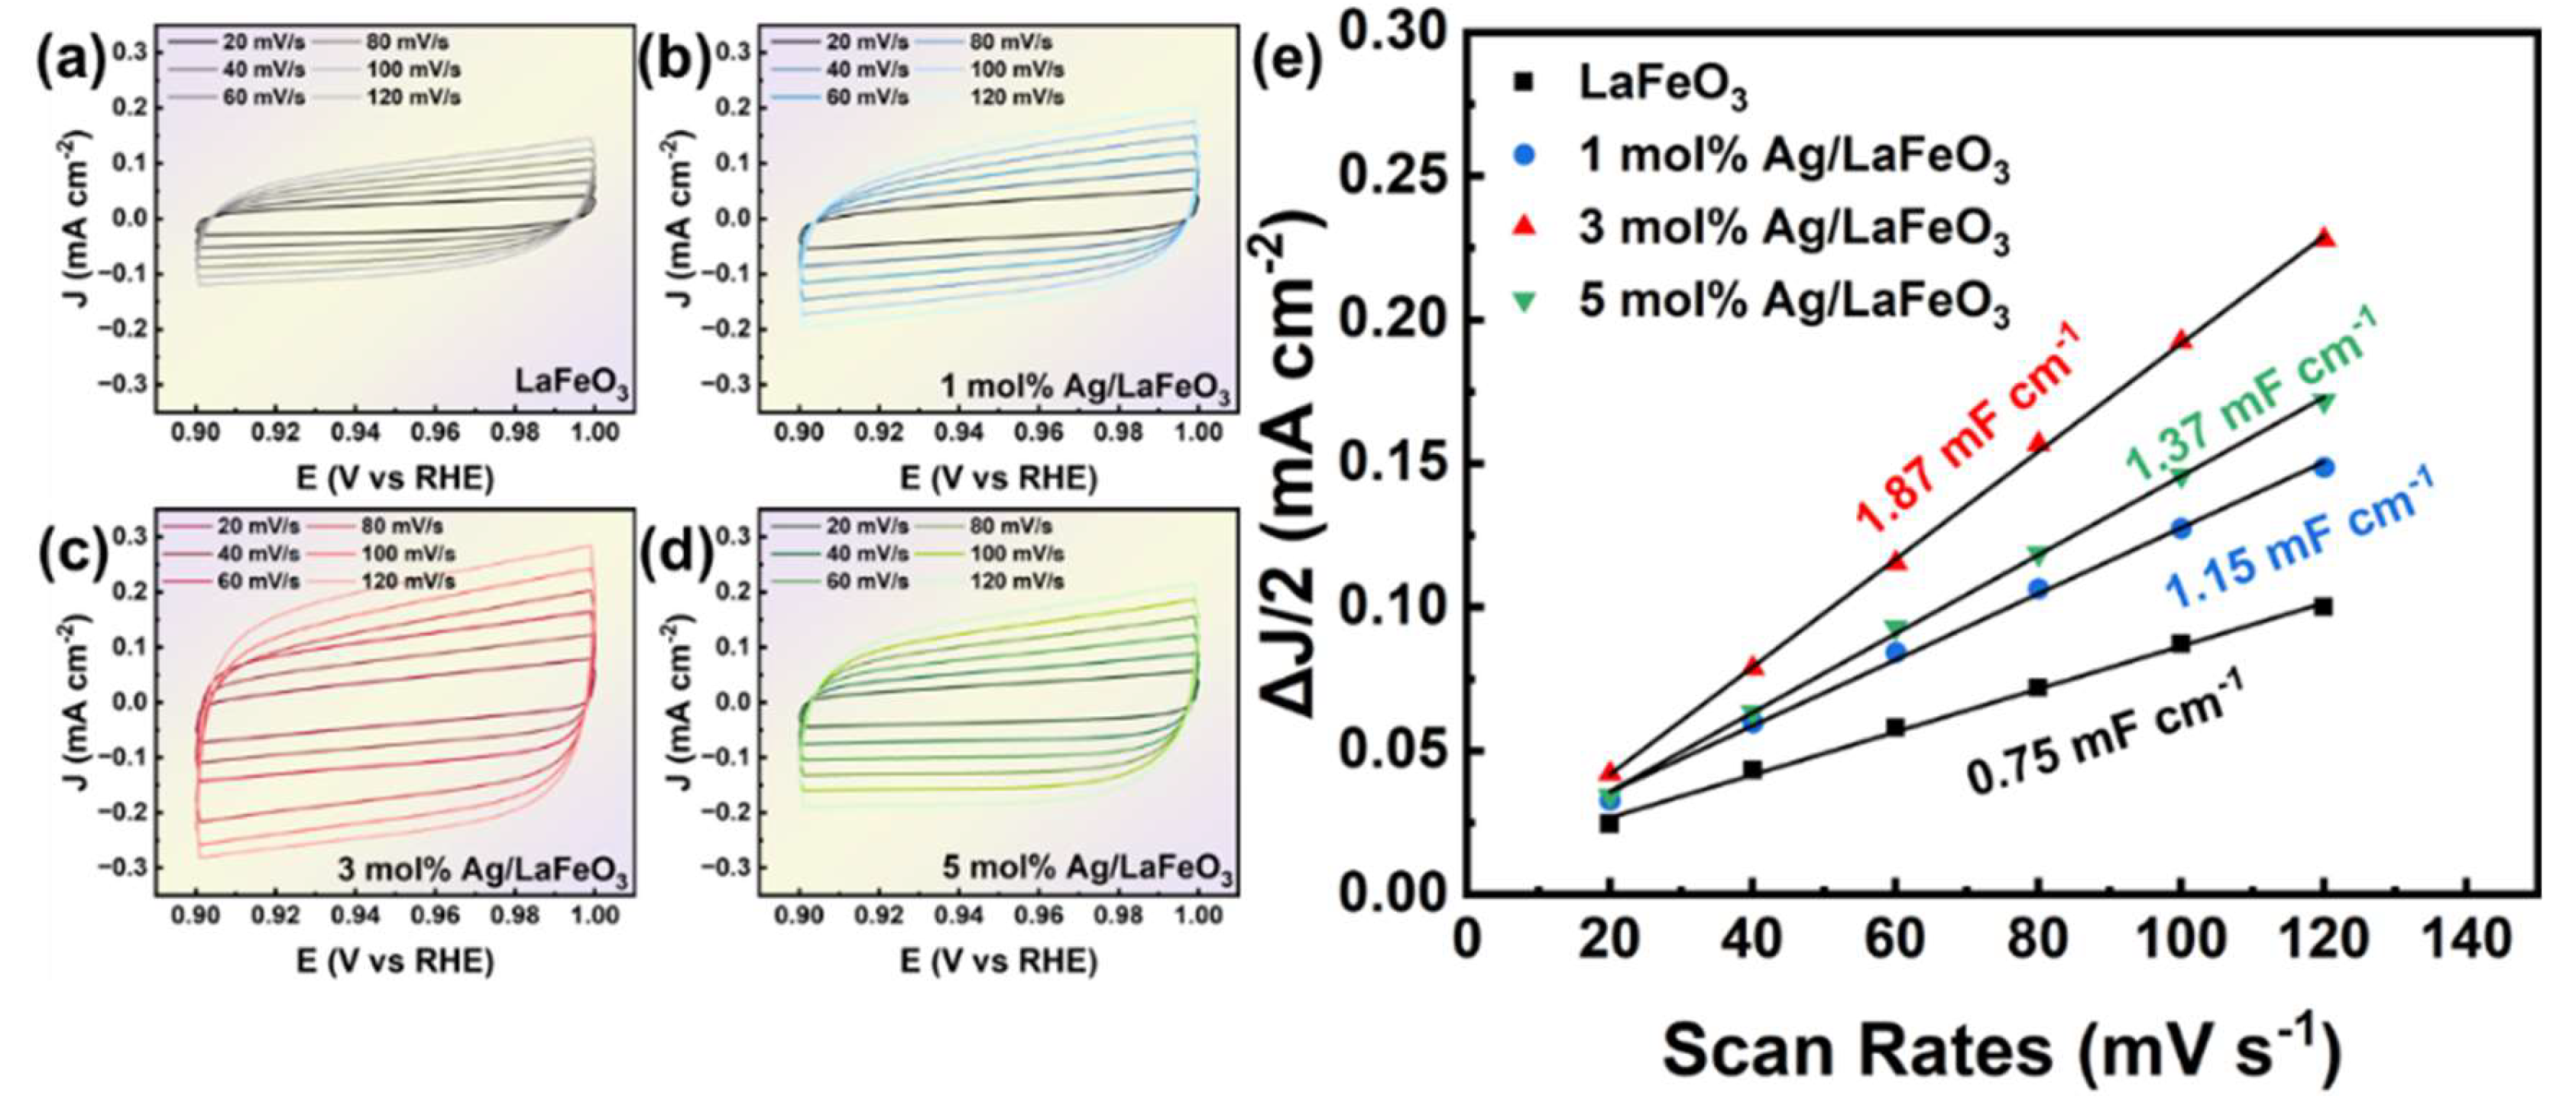

Table 1.
Fitting results for equivalent circuits of the different prepared samples.
| Materials | Rs (Ω) | Rf (Ω) | CPE1-T (Ω) | CPE1-P (Ω) | Rct (Ω) | CPE2-T (Ω) | CPE2-P (Ω) |
|---|---|---|---|---|---|---|---|
| LaFeO3 | 0.62 | 3940 | 0.55×10⁻² | 1.15 | 3390 | 6.44×10⁻³ | 1.15 |
| 1% Ag/LaFeO3 | 0.35 | 2865 | 0.55×10⁻² | 1.27 | 1115 | 6.28×10⁻³ | 1.27 |
| 3% Ag/LaFeO3 | 0.47 | 1959 | 0.47×10⁻² | 1.05 | 984 | 5.87×10⁻³ | 1.05 |
| 5% Ag/LaFeO3 | 0.58 | 889 | 0.43×10⁻² | 1.29 | 345 | 5.73×10⁻³ | 1.29 |
Disclaimer/Publisher’s Note: The statements, opinions and data contained in all publications are solely those of the individual author(s) and contributor(s) and not of MDPI and/or the editor(s). MDPI and/or the editor(s) disclaim responsibility for any injury to people or property resulting from any ideas, methods, instructions or products referred to in the content. |
© 2025 by the authors. Licensee MDPI, Basel, Switzerland. This article is an open access article distributed under the terms and conditions of the Creative Commons Attribution (CC BY) license (http://creativecommons.org/licenses/by/4.0/).
Copyright: This open access article is published under a Creative Commons CC BY 4.0 license, which permit the free download, distribution, and reuse, provided that the author and preprint are cited in any reuse.


