
Submitted:
25 July 2024
Posted:
26 July 2024
You are already at the latest version
Abstract
Photocatalytic processes offer promising solutions for environmental remediation and clean energy production, yet their efficiency under visible light remains a significant challenge. Here, we report a novel silver-graphene (Ag-G) modified TiO2 (Ag-G-TiO2) nanocomposite photocatalyst that demonstrates remarkably enhanced photocatalytic activity for both dye wastewater degradation and hydrogen production under visible and UV light irradiation. Through comprehensive characterization and performance analysis, we reveal that the Ag-G modification narrows the TiO2 bandgap from 3.12 eV to 1.79 eV, enabling efficient visible light absorption. The nanocomposite achieves a peak hydrogen production rate of 191 μmolesg-1h-1 in deionized water dye solution under visible light, significantly outperforming unmodified TiO2. Intriguingly, we observe an inverse relationship between dye degradation efficiency and hydrogen production rates in dye solutions with tap water versus deionized water, highlighting the critical role of water composition in photocatalytic processes. Our findings demonstrate sustained hydrogen production under visible light and rapid initial rates under UV irradiation, underscoring the versatility of Ag-G-TiO2 catalyst. This work not only advances our understanding of fundamental photocatalytic mechanisms but also presents a promising material for solar-driven environmental and energy applications, potentially contributing to the global transition towards sustainable technologies.
Keywords:
photocatalysis
; Ag-G-TiO2 nanocomposite
; dye degradation
; hydrogen production
; visible and UV light spectrum
1. Introduction
The escalating pace of industrialization and urbanization has led to severe water pollution, with various industries—including food, pharmaceutical, paint, paper, textile, and cosmetic sectors—annually discharging over 10,000 types of synthetic organic dyes into wastewater, totaling more than 106 tons globally [1,2,3]. Effluents laden with persistent dyes and auxiliary chemical additives inflict irreparable harm on aquatic ecosystems and their inhabitants [4]. Methylene blue (MB), a ubiquitous organic dye extensively researched and employed across diverse industrial domains such as textiles, pharmaceuticals, and healthcare, has become a significant wastewater contaminant due to its widespread industrial application, necessitating focused remediation efforts [5,6]. Research has demonstrated that the uncontrolled release of dye-laden effluents into ecosystems poses severe health risks to humans, including carcinogenicity, mutagenicity, and teratogenicity, underscoring the urgent need for developing cost-effective and efficient treatment methodologies for dye-contaminated wastewater [7]. To mitigate the environmental hazards posed by dyeing effluents, a spectrum of techniques has been rigorously investigated for the decolorization and decomposition of organic components, encompassing adsorption, membrane filtration, microbial degradation, ozonation, and notably, advanced oxidation processes [8,9]. Despite their widespread application, conventional treatment methods often prove inadequate in reducing dye concentrations to acceptable levels and lack economic viability, highlighting the critical need for developing more effective and cost-efficient dye removal strategies [10].
Photocatalytic processes have emerged as a compelling approach for water purification, addressing the trifecta of cost-effectiveness, environmental sustainability, and energy efficiency requirements in modern treatment technologies [11,12]. This photocatalytic mechanism employs a semiconductor catalyst that, upon light absorption, generates electron-hole pairs. The electrons interact with atmospheric oxygen, producing superoxide radicals, while water molecules enhance the process by allowing hydroxyl ions (OH-) to react with holes (h+), forming hydroxyl free radicals (•OH). These highly reactive, non-selective radicals then engage with MB, initiating demethylation through the cleavage of N-CH3 bonds [5].
Semiconductor + hν → Semiconductor (e-/h+)
O2 + e- → •O2-
OH- + h+ → •OH
A synergistic benefit of this process is the concurrent production of hydrogen alongside dye degradation, presenting a dual-purpose approach to wastewater treatment and clean energy generation [13]. The semiconductor, upon light absorption, generates electron-hole pairs that facilitate the dissociation of water molecules into hydrogen and oxygen through photocatalytic water splitting [14,15].
Reduction: 2H+ + 2e- → H2
Oxidation: H2O + 2h+ → 2H+ + ½ O2
Titanium dioxide (TiO2) stands out as a widely studied photocatalyst, offering numerous advantages and diverse applications. Its exceptional properties, including non-toxicity, high photocatalytic degradation efficiency, and remarkable thermal and chemical stability, make TiO2 particularly effective for both organic dye degradation in wastewater and hydrogen generation through water splitting [16,17]. Despite its advantages, TiO2 is constrained by a wide bandgap of 3.2 eV, limiting its photoactivity to the ultraviolet spectrum and rendering it inert under visible light irradiation. Moreover, the rapid recombination of photogenerated electron-hole pairs in pristine TiO2 significantly impedes its photocatalytic efficiency, presenting a major challenge in its application [5,18].
e- + h+ → heat energy → deactivated semiconductor
To address the limitation posed by the wide bandgap, metal doping is utilized as a dopant for TiO2 to shift its absorption onset into the visible light region (λ > 400 nm) [19,20].
This investigation employed silver as a dopant for TiO2, exploiting its dual capacity to reduce the semiconductor's bandgap and induce surface plasmon resonance. The plasmonic effect on the TiO2 surface effectively impedes photoexcited electron migration and retards electron-hole pair recombination, consequently augmenting the material's photocatalytic performance [21,22]. Furthermore, graphene oxide was integrated into the TiO2 matrix, serving a trifold purpose: further reducing the bandgap, enhancing photo-induced charge separation, and facilitating electron mobility within the photocatalytic structure [23]. The dye degradation experiments utilized MB as the model pollutant, with solutions prepared at a concentration of 10 mg/L in both deionized and tap water. Experiments investigating concurrent dye degradation and hydrogen production were conducted using both the synthesized Silver-Graphene-TiO2 (Ag-G-TiO2) ternary nanocomposite and pristine TiO2 as photocatalysts. The photocatalytic experiments were conducted under dual spectral illumination, employing both artificial visible and ultraviolet light sources.
2. Materials and Methods
2.1. Preparation of 2 Millimole Silver Nitrate (2 mM AgNO3):
A 2 mM AgNO3 solution was prepared by dissolving 0.17 g of AgNO3 (ACS reagent, ≥99.0%, Sigma Aldrich) in 500 mL of deionized (DI) water. To ensure complete dissolution, the mixture was subjected to continuous stirring at 500 rpm for a duration of 30 minutes.
2.2. Preparation of 2 Millimole Sodium Citrate Dihydrate:
To prepare a 2 mM sodium citrate solution, 0.294 g of sodium citrate dihydrate (granular certified, Fisher Chemical, USA) was dissolved in 500 mL of DI water. The mixture underwent continuous agitation for 30 minutes to ensure complete solubilization.
2.3. Synthesis of Silver-Graphene-TiO2 (Ag-G-TiO2) Catalyst:
The synthesis of the nanocomposite catalyst began with dispersing TiO2 (P25, primary particle size 21 nm, ≥99.5%, Sigma Aldrich) in a mixture of 60 mL DI water and 30 mL ethanol (ACS reagent, ≥99.5%, Sigma Aldrich). Ethanol inclusion enhanced TiO2 particle dispersion in the aqueous medium [24]. Subsequently, 5 mL of graphene oxide aqueous dispersion (5 mg/mL) was introduced into the suspension. The resulting mixture underwent sonication for 1 hour to ensure homogeneous component distribution. Following sonication, the mixture was subjected to a hydrothermal reaction at 120 °C for 24 hours, during which the solution color transitioned from off-white to dark blue. The product was then purified via centrifugation, performed five times at 1500 rpm for 10 minutes each, using DI water. The purified product was then combined with 30 mL of 2 mM AgNO3 and 30 mL of 2 mM sodium citrate dihydrate solutions. This mixture underwent microwave irradiation for 3 minutes at 50% power (350W). Microwave treatment facilitates rapid, volumetric, and uniform heating, resulting in improved structural and morphological characteristics of the synthesized nanomaterials [25,26]. Finally, the product was dried in an oven at 60 °C for 24 hours to obtain the final catalyst.
2.4. Characterization of the Catalyst:
2.4.1. Transmission Electron Microscopy (TEM) Analysis:
Structural and morphological characterization of TiO2 and Ag-G-TiO2 samples was conducted using an H-7650 Transmission Electron Microscope (TEM) (Hitachi High-Tech America, Inc., Pleasanton, CA). Sample preparation involved depositing dry catalyst powder onto a holey carbon film supported by a 200-mesh copper TEM grid. TEM analysis facilitated the measurement of nanoparticle dimensions. Quantitative analysis of particle size distribution was performed using ImageJ software, which enabled the determination of nanoparticle diameters, generation of size histograms, and calculation of standard deviations.
2.4.2. X-ray Diffraction (XRD) Analysis
Crystalline phase analysis of the catalyst was performed using an Empyrean Powder Diffractometer (PANalytical, Netherlands). XRD spectra were acquired by scanning 0.5 g of the catalyst, placed in a sample holder, over a 2θ range of 5° to 80° at a rate of 0.11 deg/s in reflection mode. The diffraction patterns were plotted as intensity versus diffraction angle (2θ). Highscore software was employed for spectral analysis, and the resultant XRD profiles were compared with literature data for phase identification.
2.4.3. Bandgap Analysis
Bandgap determination for the catalysts (TiO2 and Ag-G-TiO2) was conducted using a HACH DR6000 ultraviolet-visible spectrophotometer. Samples were prepared by dispersing 0.05g of catalyst in 50 mL of deionized water. Absorbance spectra were acquired over a wavelength range of 200-700 nm. Bandgap analysis employed the Tauc plot method [27], utilizing the following equation:
where α represents the energy-dependent absorption coefficient, h is Planck's constant, ν denotes the incident photon frequency, Eg is the bandgap energy, and B is a constant. The γ factor indicates the nature of the electronic transition: γ = 2 for direct transitions and γ = 1/2 for indirect transitions. The transition type was determined by comparing the goodness of fit for plots of (αhν)^γ versus (hν) using both γ values.
(αhν)1/γ = B(hν - Eg)
2.4.4. Energy Dispersive Spectroscopy (EDS) analysis
Elemental composition analysis was performed using Energy-Dispersive X-ray Spectroscopy (EDS) with an Ultra-High-Resolution Schottky Scanning Electron Microscope SU7000 (Hitachi), equipped with an Ultim Max EDS detector. Sample preparation involved adhering approximately 0.2 g of the catalyst to a double-sided carbon tape affixed to the sample holder. The EDS analysis was conducted at an accelerating voltage of 15 kV.
2.5. Preparation of Dye Solution
Methylene Blue (MB) dye (Baker analyzed reagent, J.T. Baker Chemical Co., Phillipsburg, NJ) was used to prepare two 10 mg/L solutions, one in deionized (DI) water and another in tap water. A series of standard solutions with concentrations of 2.5, 5, 10, and 20 mg/L were also prepared. Absorbance measurements were obtained using a HACH DR6000 ultraviolet-visible spectrophotometer. A calibration curve was constructed in Excel to determine the final dye concentrations following the experimental procedure.
2.6. Experimental Setup and Photocatalytic Activity Test
The photocatalytic experiments were conducted in a 50 mL quartz round-bottom flask reactor. For each experiment, 50 mL of the dye solution was introduced into the reactor, followed by the addition of 0.01 g of catalyst. To ensure homogeneous dispersion of the catalyst, the system was subjected to ultrasonication for 10 minutes. Two light sources were employed: a high-pressure UV mercury vapor lamp (160W PUV-10, Zoo Med Laboratories, San Luis Obispo, CA) for UV irradiation, and an R40 Dimmable Mercury Free Incandescent heat lamp (250W, KOR Lighting, Miami, FL) for visible light experiments. The tightly sealed reactors were positioned 6 inches away from the light source on a magnetic stirrer, maintaining continuous agitation at 400 rpm throughout the experiment. Separate experiments were conducted for durations of 1, 3, 6, 12, and 24 hours to assess the progression of the photocatalytic reaction over time. The efficiency of dye degradation was quantified using the following equation:
E = (1 - C/C0) × 100
Where E represents the degradation efficiency (%), C denotes the dye concentration after a specific experimental duration, and C0 is the initial dye concentration.
2.7. Hydrogen Gas Analysis
Hydrogen gas production was analyzed using an Agilent 7890A gas chromatograph (GC) equipped with a thermal conductivity detector (TCD) and an HP-5 molecular sieve column. Nitrogen was employed as the carrier gas. The instrument was calibrated using a pure H2 standard. For each analysis, 1 mL of headspace gas was directly injected into the GC inlet. The method parameters included a purge time of 1 minute, followed by a 10-minute chromatographic run post-injection. Quantification of hydrogen was achieved by comparing the retention time and peak area of the sample to those of the H2 standard.
3. Results and Discussion
3.1. Catalyst Characterization
3.1.1. TEM Analysis
TEM analysis revealed distinct morphological differences between pure TiO2 and Ag-G-TiO2 samples. While pure TiO2 particles appeared well-dispersed, Ag-G-TiO2 exhibited an aggregated structure, likely resulting from the deposition of graphene oxide and silver on TiO2 particles. Particle size distribution analysis corroborated these observations, demonstrating that pure TiO2 particles had a smaller average size of 21.08 nm, compared to the larger Ag-G-TiO2 composite particles, which averaged 37.05 nm. This size increase is attributed to the successful incorporation of graphene oxide and silver onto the TiO2 substrate. Examination of Figure 1(B) revealed larger, nearly transparent structures consistent with the presence of graphene oxide, as previously reported [23]. From Figure 1(C), the distributed dark spots observed in the Ag-G-TiO2 were identified as silver nanoparticles [28], indicating successful deposition of Ag. EDS analysis provided further confirmation of the presence of silver particles in the composite.
3.1.2. EDS Analysis
EDS analysis provided quantitative elemental composition of the Ag-G-TiO2 composite. Titanium constituted the highest weight percentage at 47.2%, primarily from TiO2. Oxygen, originating from TiO2, graphene oxide, AgNO3, and sodium citrate dihydrate, represented 44.1% of the total weight. Carbon, derived from graphene oxide and sodium citrate dihydrate, accounted for 5.9% of the composite mass. Silver comprised 1.9% of the total weight, corroborating the TEM observations of Ag deposition on TiO2 particles. A minor sodium content (0.9%) was attributed to the sodium citrate dihydrate used in the synthesis process. These results, in conjunction with the TEM analysis, confirm the successful deposition of Ag on the TiO2 substrate.
3.1.3. Bandgap Analysis
UV-vis spectroscopy revealed that the absorption edge for TiO2 occurred at 385 nm, while for Ag-G-TiO2, it redshifted to 494 nm. This redshift indicates the presence of electron acceptors, likely due to the surface plasmon absorption of Ag0. The observed absorption phenomenon can be attributed to charge transfer from the valence band to the conduction band, specifically the transition of electrons from 2p orbitals of oxide anions to 3d orbitals of Ti4+ cations [29]. Bandgap calculations showed a significant reduction from 3.12 eV for pure TiO₂ (Figure 3A) to 1.79 eV for Ag-G-TiO₂ (Figure 3B). This narrowing of the bandgap in the nanocomposite facilitates effective assimilation of photoinduced electrons, resulting in the formation of a closed Fermi level energy between the valence and conduction bands [30]. The consequent decrease in Fermi energy promotes the migration and separation of photoinduced electron-hole pairs, potentially enhancing the photocatalytic performance of the catalyst [30].
3.1.4. XRD Analysis
X-ray diffraction analysis was employed to determine the crystal phase and crystallite size of both unmodified TiO2 and Ag-G-TiO2 (Figure 4). Both samples exhibited characteristic peaks corresponding to anatase (JCPDS 78-2486) and rutile (JCPDS 21-1276) phases [31]. Notably, diffraction peaks attributable to Ag were not observed in the Ag-G-TiO2 sample, likely due to its low concentration [32]. Typically, XRD peaks associated with Ag appear at 38.1° and 64.5° when the Ag doping exceeds 2 wt% [33]. A slight shift in the primary TiO2 peak from 25.10° to 24.93° was observed, suggesting the incorporation of Ag+ ions into the Ti4+ lattice [34]. The rutile phase content was calculated using the following equation:
Rutile phase content (%) = AR / (0.884 × (AA + AR))
Where AA and AR represent the integrated intensities of the diffraction peaks from the (101) and (110) planes of the anatase and rutile phases, respectively. Upon Ag-doping, a slight decrease in the anatase phase of TiO2 was observed, as shown in Table 1. This finding aligns with previous reports in the literature [35].
3.2. Photocatalytic Dye Wastewater Degradation
The visible light experiments revealed a rapid dye degradation within the first hour using the Ag-G-TiO2 catalyst, indicating efficient purification. In contrast, TiO2 alone exhibited significantly slower degradation under visible light. This performance disparity suggests that silver and graphene modifications enhance purification efficiency by lowering the catalyst's bandgap, enabling visible light absorption. Optimal dye degradation was achieved using Ag-G-TiO2 in tap water, with dye concentration decreasing from 10 mg/L to 0.03 mg/L over 6 hours, yielding 97% efficiency. Under identical conditions with deionized (DI) water, the concentration decreased to 1.67 mg/L, corresponding to 83.3% efficiency. Similar trends were observed with pure TiO2, indicating higher performance in tap water compared to DI water. This difference may be attributed to the presence of ions or compounds in tap water acting as sacrificial agents, facilitating electron migration and separation of charge carriers [36]. Extended experiments beyond 12 hours showed convergence to low concentration ratios across all conditions, suggesting high overall purification efficiency regardless of the specific treatment.
TiO2 becomes an active semiconductor under UV irradiation (< 400 nm) [37]. UV light experiments demonstrated an extremely rapid decrease in concentration ratio (C/C0) for both DI and tap water solutions within the first hour. This indicates a faster and more effective purification process compared to visible light. Under UV irradiation, dye concentration decreased from 10 mg/L to 0.06 mg/L (DI) and 0.05 mg/L (tap), corresponding to efficiencies of 99.43% and 99.50%, respectively. The marked difference between visible and UV light performance can be attributed to the superior activation of Ag-G-TiO2 under UV light, which more effectively generates electron-hole pairs on the catalyst surface, leading to rapid formation of reactive oxygen species for dye degradation. The performance under visible light suggests that Ag-G modification successfully extends the photocatalyst's activity into the visible spectrum, potentially through mechanisms such as plasmonic enhancement (Ag) and improved charge separation (graphene).
3.3. Photocatalytic Hydrogen Production:
Photocatalytic hydrogen production experiments revealed significant differences between modified (Ag-G-TiO2) and unmodified TiO2 catalysts under both visible and UV light conditions. The Ag-G-TiO2 catalyst demonstrated markedly superior activity, indicating the profound impact of graphene and silver modification on catalytic performance. Under visible light irradiation, Ag-G-TiO2 achieved a peak hydrogen production rate of 191 μmoles g-1 h-1 in deionized (DI) water dye solution, substantially higher than the 108 μmoles g⁻¹ h⁻¹ observed in tap water. This trend was consistent across both catalyst types and light sources, with DI water consistently outperforming tap water in terms of hydrogen evolution. Intriguingly, while dye degradation efficiency was superior in tap water (Figure 5(C)), hydrogen production rates were lower compared to DI water. This inverse relationship may be attributed to the presence of ions and compounds in tap water that potentially adsorb onto the catalyst surface, blocking active sites for hydrogen evolution [38]. Furthermore, these species might engage in competitive reactions, consuming some of the photogenerated electrons and reducing their availability for hydrogen production [39].
Comparative analysis of visible and UV light experiments revealed distinct kinetic profiles. UV irradiation induced a more rapid initial hydrogen production rate, whereas visible light facilitated a more sustained production, ultimately achieving the highest overall rate. Both conditions exhibited a decline in production rates after peak performance (6 hours for UV, 12 hours for visible light), potentially indicating photocorrosion of the catalyst [40,41]. The accelerated dye degradation under UV light may have contributed to catalyst degradation, resulting in lower hydrogen production rates compared to visible light conditions.
4. Conclusion
This study demonstrates the significant enhancement of photocatalytic performance achieved through the modification of TiO2 with silver and graphene (Ag-G-TiO2). Our findings reveal a complex interplay between catalyst composition, irradiation wavelength, and water chemistry in both dye wastewater degradation and hydrogen production processes. The Ag-G-TiO2 nanocomposite exhibited superior photocatalytic activity compared to pure TiO2, particularly under visible light. This enhancement is attributed to the narrowing of the bandgap from 3.12 eV to 1.79 eV, facilitating more efficient light absorption and charge carrier separation. The synergistic effects of plasmonic silver nanoparticles and graphene sheets contribute to extended light absorption and improved electron transport, respectively. Intriguingly, we observed an inverse relationship between dye degradation efficiency and hydrogen production rates in tap water versus deionized water. This phenomenon highlights the critical role of water composition in determining the dominant photocatalytic pathway and suggests potential strategies for optimizing either water treatment or hydrogen production applications.
The sustained hydrogen production under visible light, coupled with the rapid initial rates under UV irradiation, underscores the versatility of the Ag-G-TiO2 catalyst. However, the observed decline in production rates over time points to the need for further research into catalyst stability and regeneration strategies. Future work should focus on elucidating the precise mechanisms of charge transfer and reactive species generation, optimizing catalyst composition for specific applications, and exploring strategies to mitigate photocorrosion effects. Additionally, scaling up these systems for practical implementation remains an important challenge to be addressed.
6. Patents
A patent has been applied for this research
Author Contributions
Conceptualization, H.W. and P.X.; methodology, H.W. and T.A.; software, T.A..; validation, H.W. and T.A.; formal analysis, T.A.; investigation, T.A.; data curation, T.A.; writing—original draft preparation, T.A.; writing—review and editing, H.W. and P.X.; visualization, T.A.; supervision, H.W.; project administration, H.W. and P.X.; funding acquisition, H.W. and P.X.; All authors have read and agreed to the published version of the manuscript.
Funding
This research was partially funded by New Mexico Water Resources Research Institute, grant number NMWRRI-SG-FALL2023.
Conflicts of Interest
The authors declare no conflicts of interest
References
- Behera, A. K. , Shadangi, K. P., & Sarangi, P. K. Efficient removal of Rhodamine B dye using biochar as an adsorbent: Study the performance, kinetics, thermodynamics, adsorption isotherms and its reusability. Chemosphere 2024, 354, 141702. [Google Scholar] [PubMed]
- Oladoye, P. O. , Ajiboye, T. O., Omotola, E. O., & Oyewola, O. J. Methylene blue dye: Toxicity and potential elimination technology from wastewater. RINENG 2022, 16, 100678. [Google Scholar]
- Alver, E. , Metin, A. Ü., & Brouers, F. Methylene blue adsorption on magnetic alginate/rice husk bio-composite. Int. J. Biol. Macromol. 2020, 154, 104–113. [Google Scholar] [PubMed]
- Yang, J. , Han, Y., Sun, Z., Zhao, X., Chen, F., Wu, T., & Jiang, Y. PEG/sodium tripolyphosphate-modified chitosan/activated carbon membrane for rhodamine B removal. ACS omega 2021, 6, 15885–15891. [Google Scholar] [PubMed]
- Din, M. I. , Khalid, R., Najeeb, J., & Hussain, Z. Fundamentals and photocatalysis of methylene blue dye using various nanocatalytic assemblies-a critical review. J. Clean. Prod. 2021, 298, 126567. [Google Scholar]
- Muzammal, S. , Ahmad, A., Sheraz, M., Kim, J., Ali, S., Hanif, M. B.,... & Motola, M. Polymer-supported nanomaterials for photodegradation: Unraveling the methylene blue menace. ENERG CONVERS MAN-X 2024, 22, 100547. [Google Scholar]
- Yao, X. , Fang, Y., Guo, Y., & Xu, M. Degradation of methylene blue using a novel gas-liquid hybrid DDBD reactor: Performance and pathways. Chemosphere 2023, 336, 139172. [Google Scholar] [PubMed]
- Deng, F. , & Brillas, E. Advances in the decontamination of wastewaters with synthetic organic dyes by electrochemical Fenton-based processes. Sep. Purif. Technol. 2023, 316, 123764. [Google Scholar]
- Alardhi, S. M. , Salih, H. G., Ali, N. S., Khalbas, A. H., Salih, I. K., Saady, N. M. C.,... & Harharah, H. N. Olive stone as an eco-friendly bio-adsorbent for elimination of methylene blue dye from industrial wastewater. Sci. Rep. 2023, 13, 21063. [Google Scholar]
- Jabbar, N. M. , Alardhi, S. M., Mohammed, A. K., Salih, I. K., & Albayati, T. M. Challenges in the implementation of bioremediation processes in petroleum-contaminated soils: A review. Environmental Nanotechnology, Monitoring & Management 2022, 18, 100694. [Google Scholar]
- Swain, J. , Priyadarshini, A., Hajra, S., Panda, S., Panda, J., Samantaray, R.,... & Sahu, R. Photocatalytic dye degradation by BaTiO3/zeolitic imidazolate framework composite. Alloys Compd. 2023, 965, 171438. [Google Scholar]
- Lee, D. E. , Kim, M. K., Danish, M., & Jo, W. K. State-of-the-art review on photocatalysis for efficient wastewater treatment: Attractive approach in photocatalyst design and parameters affecting the photocatalytic degradation. Catal. Commun. 2023, 183, 106764. [Google Scholar]
- Gonuguntla, S. , Kamesh, R., Pal, U., & Chatterjee, D. Dye sensitization of TiO2 relevant to photocatalytic hydrogen generation: Current research trends and prospects. JPPC 2023, 57, 100621. [Google Scholar]
- Nyamai, N. , & Phaahlamohlaka, T. Significantly advanced hydrogen production via water splitting over Zn/TiO2/CNFs and Cu/TiO2/CNFs nanocomposites. J. Ind. Eng. Chem. 2024, 134, 312–326. [Google Scholar]
- Deng, A. , Sun, Y., Gao, Z., Yang, S., Liu, Y., He, H.,... & Wang, S. Internal electric field in carbon nitride-based heterojunctions for photocatalysis. Nano Energy 2023, 108, 108228. [Google Scholar]
- Sari, Y. , Gareso, P. L., Armynah, B., & Tahir, D. A review of TiO2 photocatalyst for organic degradation and sustainable hydrogen energy production. Int. J. Hydrogen Energy 2023, 55, 984–996. [Google Scholar]
- Chen, Y. , Soler, L., Cazorla, C., Oliveras, J., Bastús, N. G., Puntes, V. F., & Llorca, J. Facet-engineered TiO2 drives photocatalytic activity and stability of supported noble metal clusters during H2 evolution. Nat. Commun. 2023, 14, 6165. [Google Scholar] [PubMed]
- Rashid, R. , Shafiq, I., Gilani, M. R. H. S., Maaz, M., Akhter, P., Hussain, M.,... & Park, Y. K. Advancements in TiO2-based photocatalysis for environmental remediation: strategies for enhancing visible-light-driven activity. Chemosphere 2023, 349, 140703. [Google Scholar] [PubMed]
- Ahmed, T. Y. , Aziz, S. B., & Dannoun, E. M. Role of Outer shell Electron-Nuclear Distant of Transition Metal Atoms (TMA) on Band Gap Reduction and Optical Properties of TiO2 Semiconductor. RINENG 2024, 23, 102479. [Google Scholar]
- Edirisooriya, E. T. , Senanayake, P. S., Wang, H. B., Talipov, M. R., Xu, P., & Wang, H. Photo-reforming and degradation of waste plastics under UV and visible light for H2 production using nanocomposite photocatalysts. J. Environ. Chem. Eng. 2023, 11, 109580. [Google Scholar]
- Liza, T. Z. , Tusher, M. M. H., Anwar, F., Monika, M. F., Amin, K. F., & Asrafuzzaman, F. N. U. Effect of Ag-doping on morphology, structure, band gap and photocatalytic activity of bio-mediated TiO2 nanoparticles. Results in Materials 2024, 22, 100559. [Google Scholar]
- Sukhadeve, G. K. , Bandewar, H., Janbandhu, S. Y., Jayaramaiah, J. R., & Gedam, R. S. Photocatalytic hydrogen production, dye degradation, and antimicrobial activity by Ag-Fe co-doped TiO2 nanoparticles. J. Mol. Liq. 2023, 369, 120948. [Google Scholar]
- Lin, L. , Wang, H., & Xu, P. Immobilized TiO2-reduced graphene oxide nanocomposites on optical fibers as high performance photocatalysts for degradation of pharmaceuticals. Chem. Eng. J. 2017, 310, 389–398. [Google Scholar]
- Zhu, J. , Cao, X., & Li, J. Ethanol-Induced Aggregation of Nonpolar Nanoparticles in Water/Ethanol Mixed Solvents. LANGMUIR 2022, 38, 13910–13915. [Google Scholar] [PubMed]
- Pentsak, E. O. , Cherepanova, V. A., Sinayskiy, M. A., Samokhin, A. V., & Ananikov, V. P. Systematic study of the behavior of different metal and metal-containing particles under the microwave irradiation and transformation of nanoscale and microscale morphology. Nanomater. 2018, 9, 19. [Google Scholar]
- Periyat, P. , Leyland, N., McCormack, D. E., Colreavy, J., Corr, D., & Pillai, S. C. Rapid microwave synthesis of mesoporous TiO 2 for electrochromic displays. J. Mater. Chem. 2010, 20, 3650–3655. [Google Scholar]
- Tauc, J. , Grigorovici, R., & Vancu, A. Optical properties and electronic structure of amorphous germanium. Phys. Status Solidi B, 1966, 15, 627–637. [Google Scholar]
- Gogoi, D. , Namdeo, A., Golder, A. K., & Peela, N. R. Ag-doped TiO2 photocatalysts with effective charge transfer for highly efficient hydrogen production through water splitting. Int. J. Hydrogen Energy 2020, 45, 2729–2744. [Google Scholar]
- Rathi, V. H. , Jeice, A. R., & Jayakumar, K. Green synthesis of Ag/CuO and Ag/TiO2 nanoparticles for enhanced photocatalytic dye degradation, antibacterial, and antifungal properties. APPL SURF SCI ADV 2023, 18, 100476. [Google Scholar]
- Jadhav, S. , Kalubarme, R., Chauhan, R., Singh, A., Kale, B., Ashokkumar, M., & Gosavi, S. Nanocrystalline Ag-doped cobalt oxide as a flexible electrode material for high performance supercapacitor application. J. Energy Storage 2023, 58, 106326. [Google Scholar]
- Liu, W. , Chen, D., Yoo, S. H., & Cho, S. O. Hierarchical visible-light-response Ag/AgCl@ TiO2 plasmonic photocatalysts for organic dye degradation. Nanotechnology 2013, 24, 405706. [Google Scholar] [PubMed]
- Santos, L. M. , Machado, W. A., França, M. D., Borges, K. A., Paniago, R. M., Patrocinio, A. O., & Machado, A. E. Structural characterization of Ag-doped TiO 2 with enhanced photocatalytic activity. RSC adv. 2015, 5, 103752–103759. [Google Scholar]
- Ali, T. , Ahmed, A., Alam, U., Uddin, I., Tripathi, P., & Muneer, M. Enhanced photocatalytic and antibacterial activities of Ag-doped TiO2 nanoparticles under visible light. Mater. Chem. Phys 2018, 212, 325–335. [Google Scholar]
- Rabhi, S. , Belkacemi, H., Bououdina, M., Kerrami, A., Brahem, L. A., & Sakher, E. Effect of Ag doping of TiO2 nanoparticles on anatase-rutile phase transformation and excellent photodegradation of amlodipine besylate. Mater. Lett. 2019, 236, 640–643. [Google Scholar]
- Mogal, S. I. , Gandhi, V. G., Mishra, M., Tripathi, S., Shripathi, T., Joshi, P. A., & Shah, D. O. Single-step synthesis of silver-doped titanium dioxide: influence of silver on structural, textural, and photocatalytic properties. Ind. Eng. Chem. Res. 2014, 53, 5749–5758. [Google Scholar]
- Benz, D. , Van Bui, H., Hintzen, H. T., Kreutzer, M. T., & van Ommen, J. R. Mechanistic insight into the improved photocatalytic degradation of dyes for an ultrathin coating of SiO2 on TiO2 (P25) nanoparticles. CHEM ENG J ADV 2022, 10, 100288. [Google Scholar]
- Jandaghian, F. , Pirbazari, A. E., Tavakoli, O., Asasian-Kolur, N., & Sharifian, S. Comparison of the performance of Ag-deposited ZnO and TiO2 nanoparticles in levofloxacin degradation under UV/visible radiation. HAZARD MATER ADV 2023, 9, 100240. [Google Scholar]
- Gebremariam, G. K. , Jovanović, A. Z., & Pašti, I. A. The effect of electrolytes on the kinetics of the hydrogen evolution reaction. Hydrogen 2023, 4, 776–806. [Google Scholar]
- Huang, Y. , Wang, C., Wang, R., Zhang, Y., Li, D., Zhu, H.,... & Zhang, X. Ethanol solution plasma loads carbon dots onto 2D HNb3O8 for enhanced photocatalysis. ACS Appl. Mater. Interfaces 2022, 15, 1157–1166. [Google Scholar] [PubMed]
- Huang, K. , Li, C., Zheng, Y., Wang, L., Wang, W., & Meng, X. Recent advances on silver-based photocatalysis: Photocorrosion inhibition, visible-light responsivity enhancement, and charges separation acceleration. Sep. Purif. Technol. 2022, 283, 120194. [Google Scholar]
- Weng, B. , Qi, M. Y., Han, C., Tang, Z. R., & Xu, Y. J. Photocorrosion inhibition of semiconductor-based photocatalysts: basic principle, current development, and future perspective. ACS Catal. 2019, 9, 4642–4687. [Google Scholar]
Figure 1.
TEM images of the catalysts and their particle size distribution: A) Pure TiO2, B) Ag-G-TiO2, C) 200K magnification of Ag-G-TiO2, D) Pure TiO2, E) Ag-G-TiO2.
Figure 1.
TEM images of the catalysts and their particle size distribution: A) Pure TiO2, B) Ag-G-TiO2, C) 200K magnification of Ag-G-TiO2, D) Pure TiO2, E) Ag-G-TiO2.
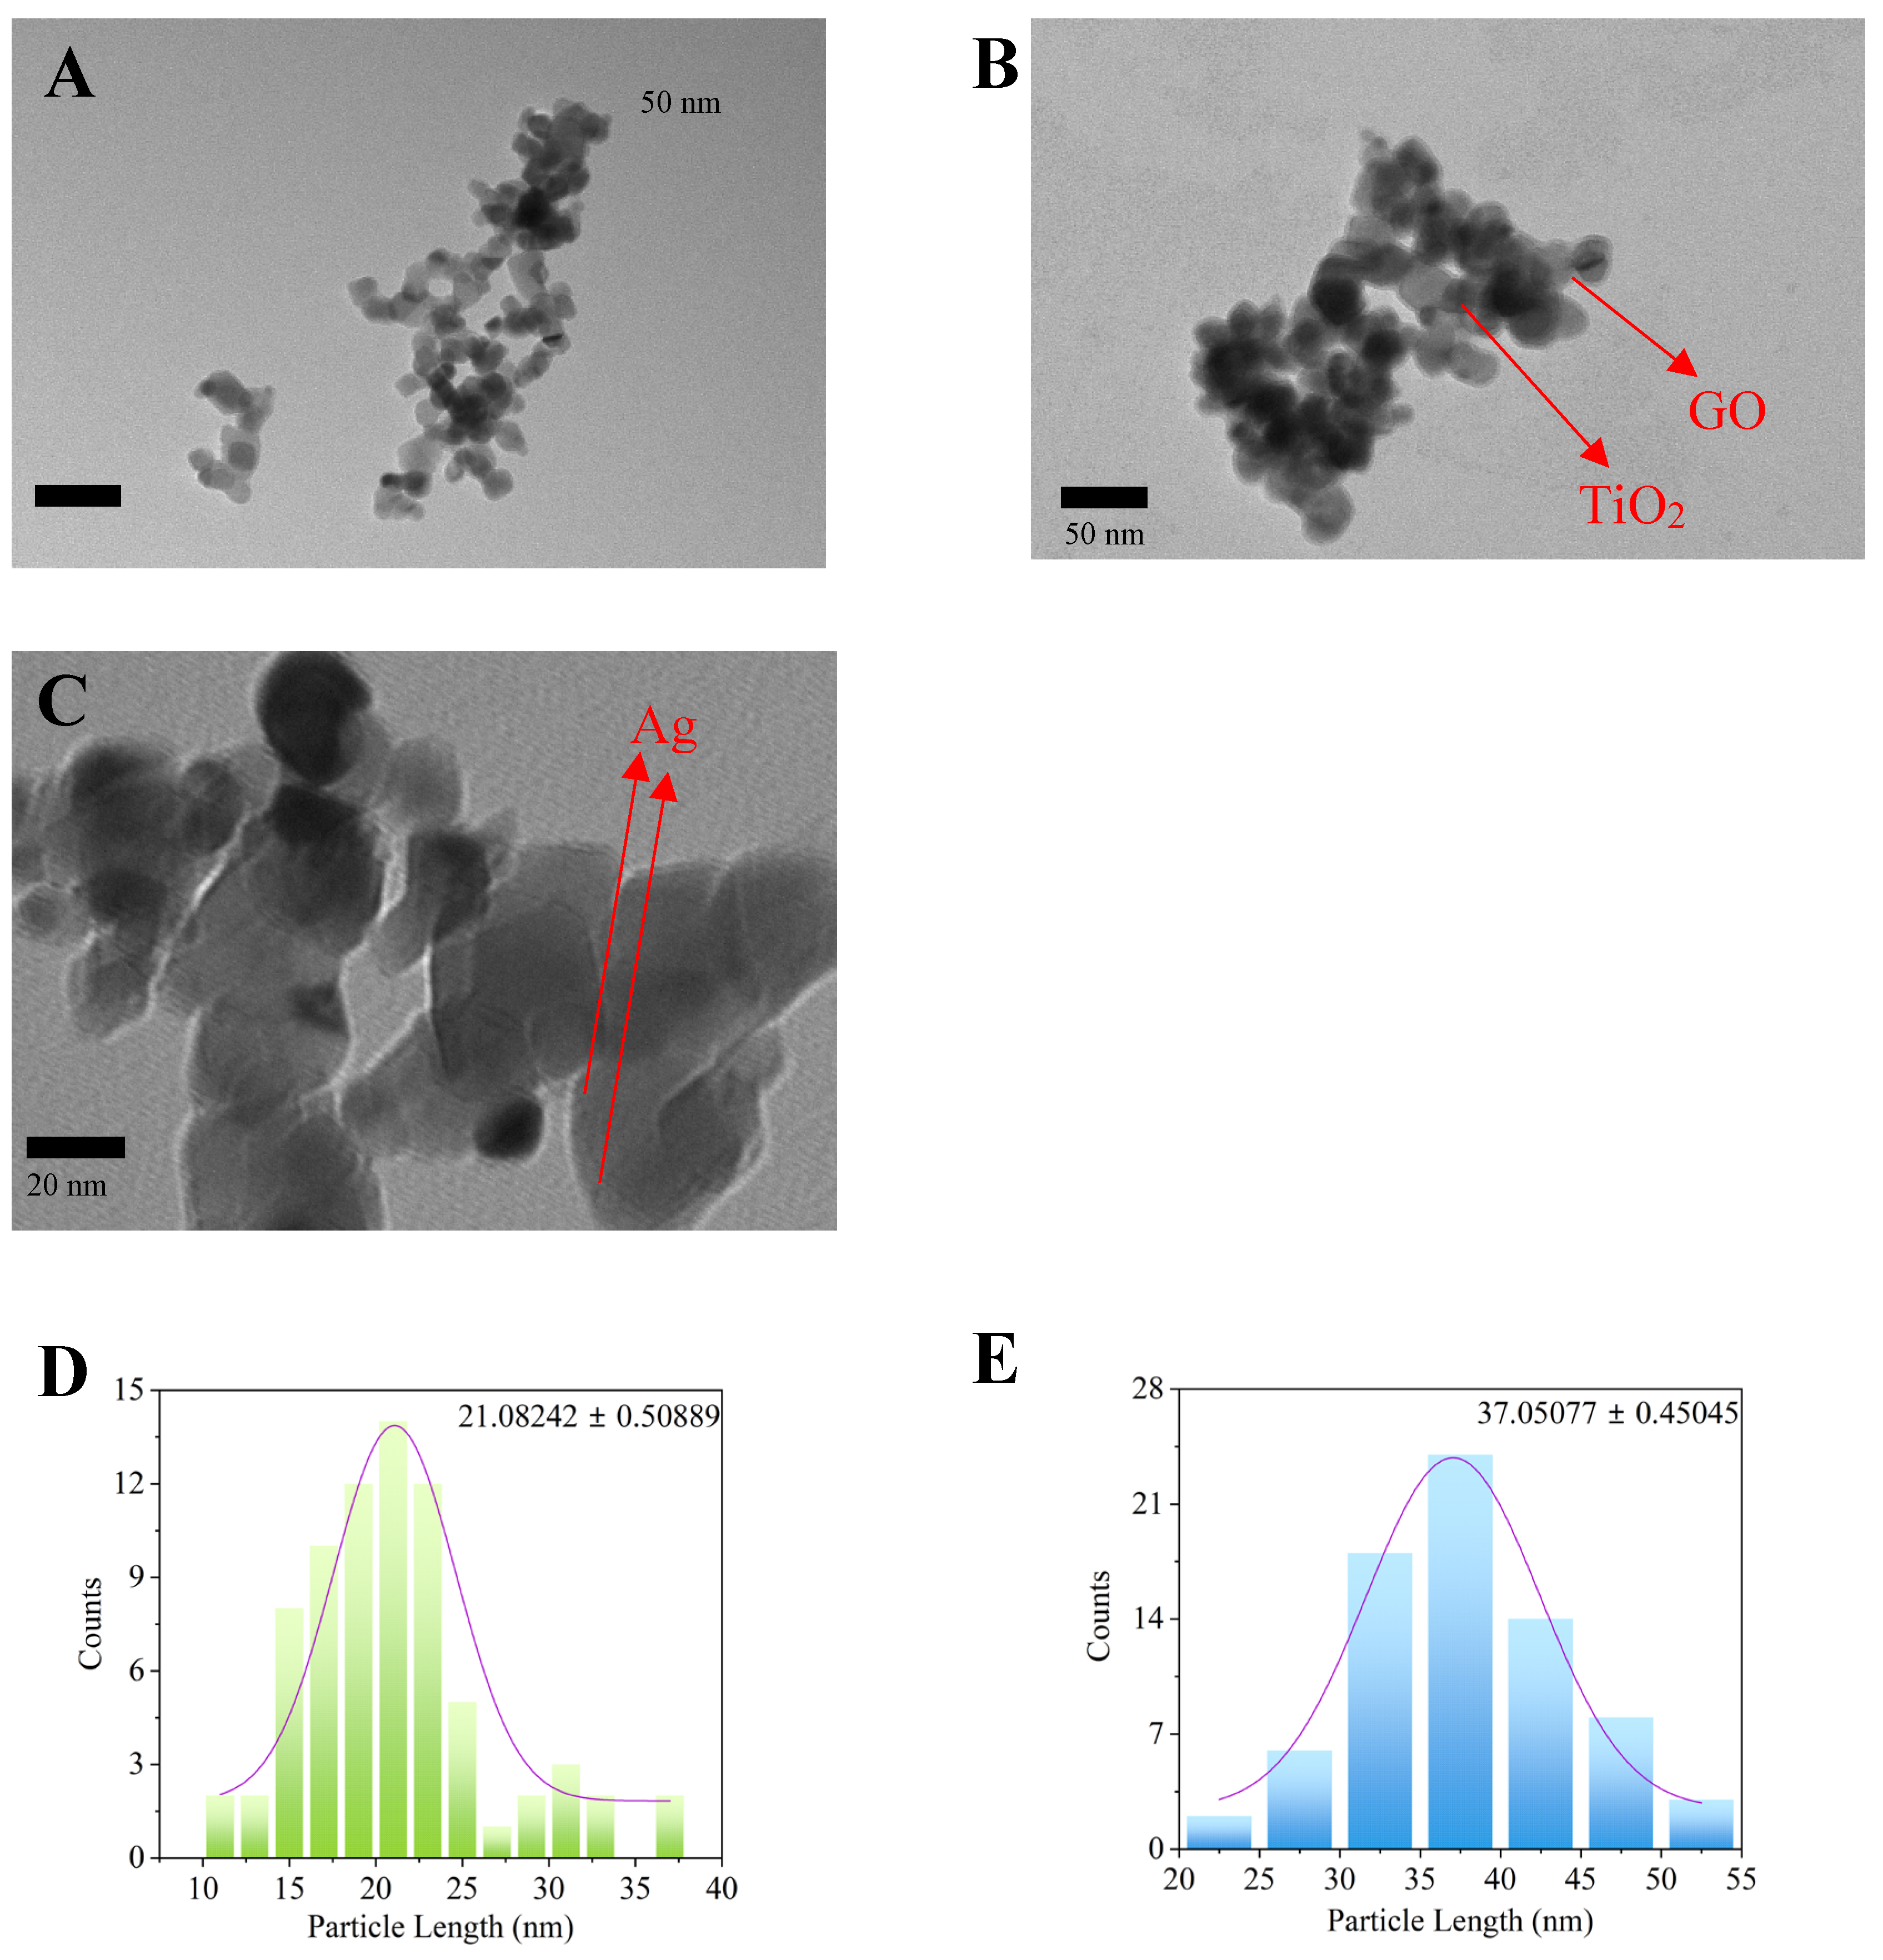
Figure 2.
A) EDS analysis of Ag-G-TiO2, B) Weight percentage bar chart of the elements.
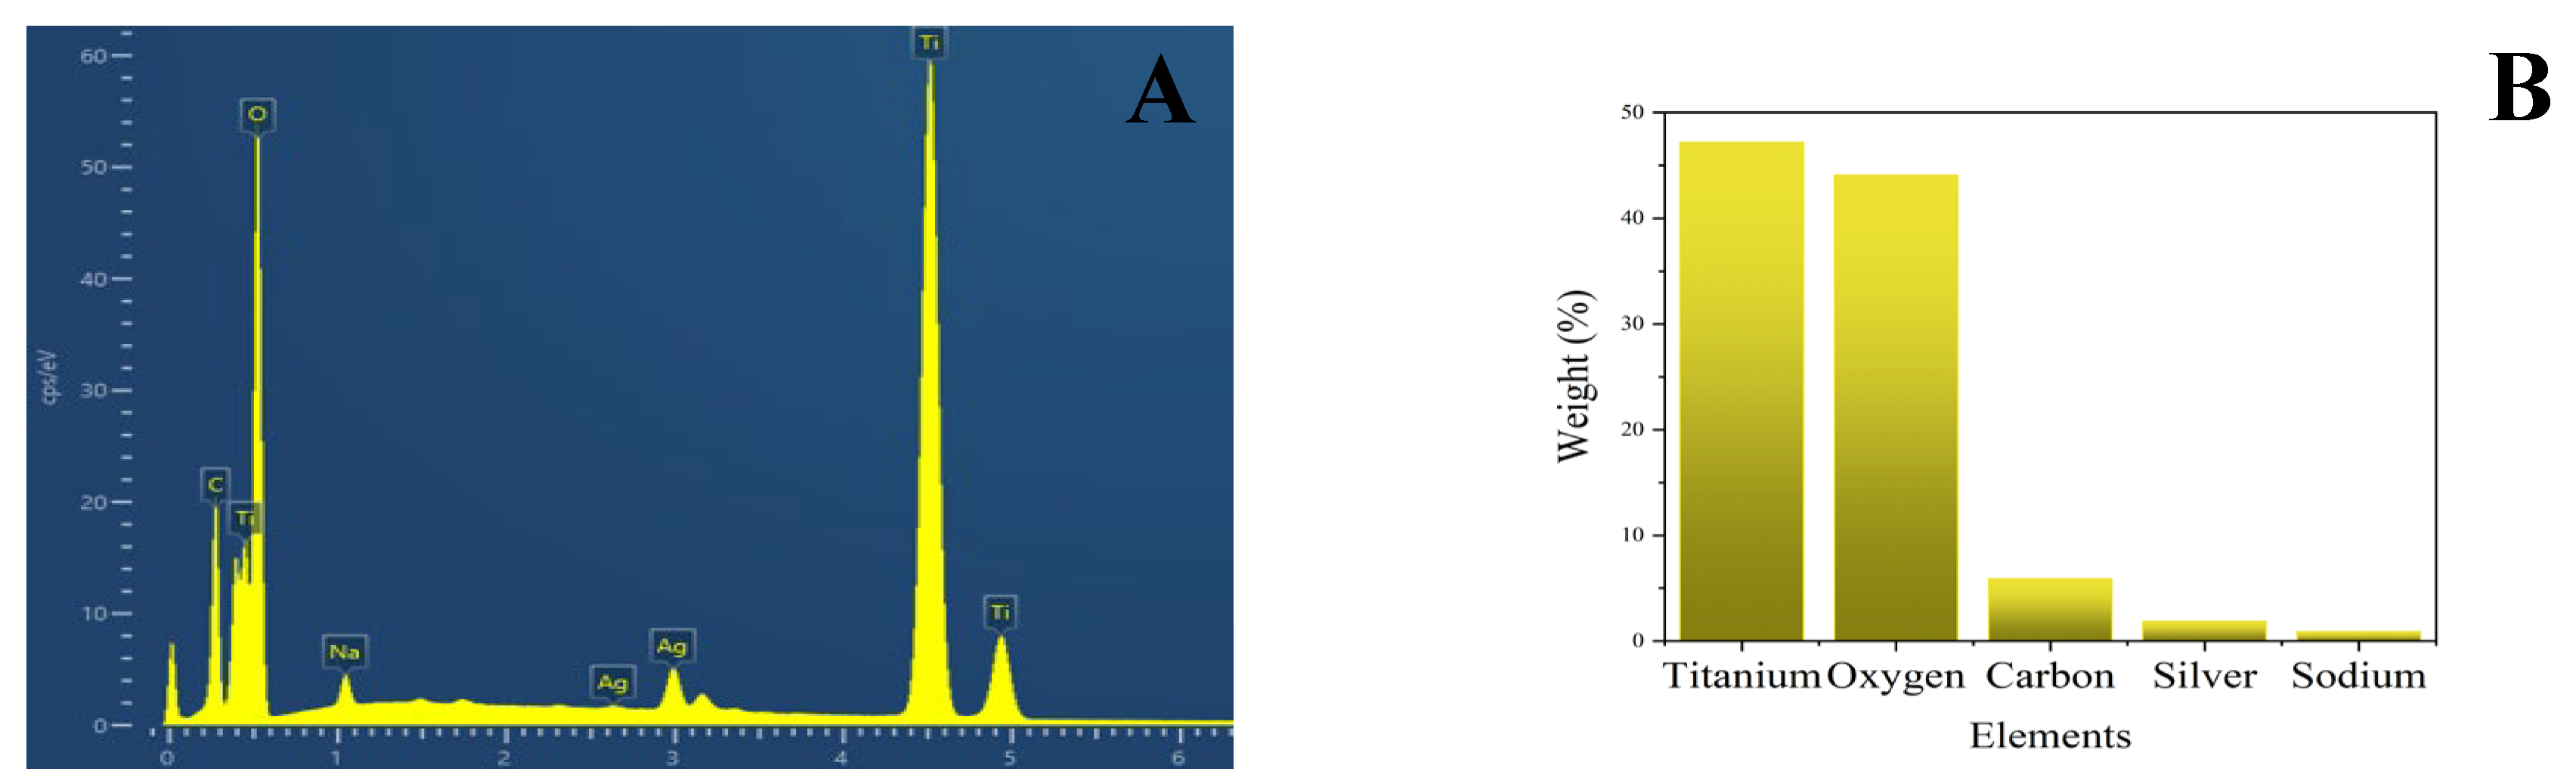
Figure 3.
Bandgap analysis for the catalysts A) Pure TiO2, B) Ag-G-TiO2 C) Absorbance comparison between pure TiO2 and Ag-G-TiO2.
Figure 3.
Bandgap analysis for the catalysts A) Pure TiO2, B) Ag-G-TiO2 C) Absorbance comparison between pure TiO2 and Ag-G-TiO2.
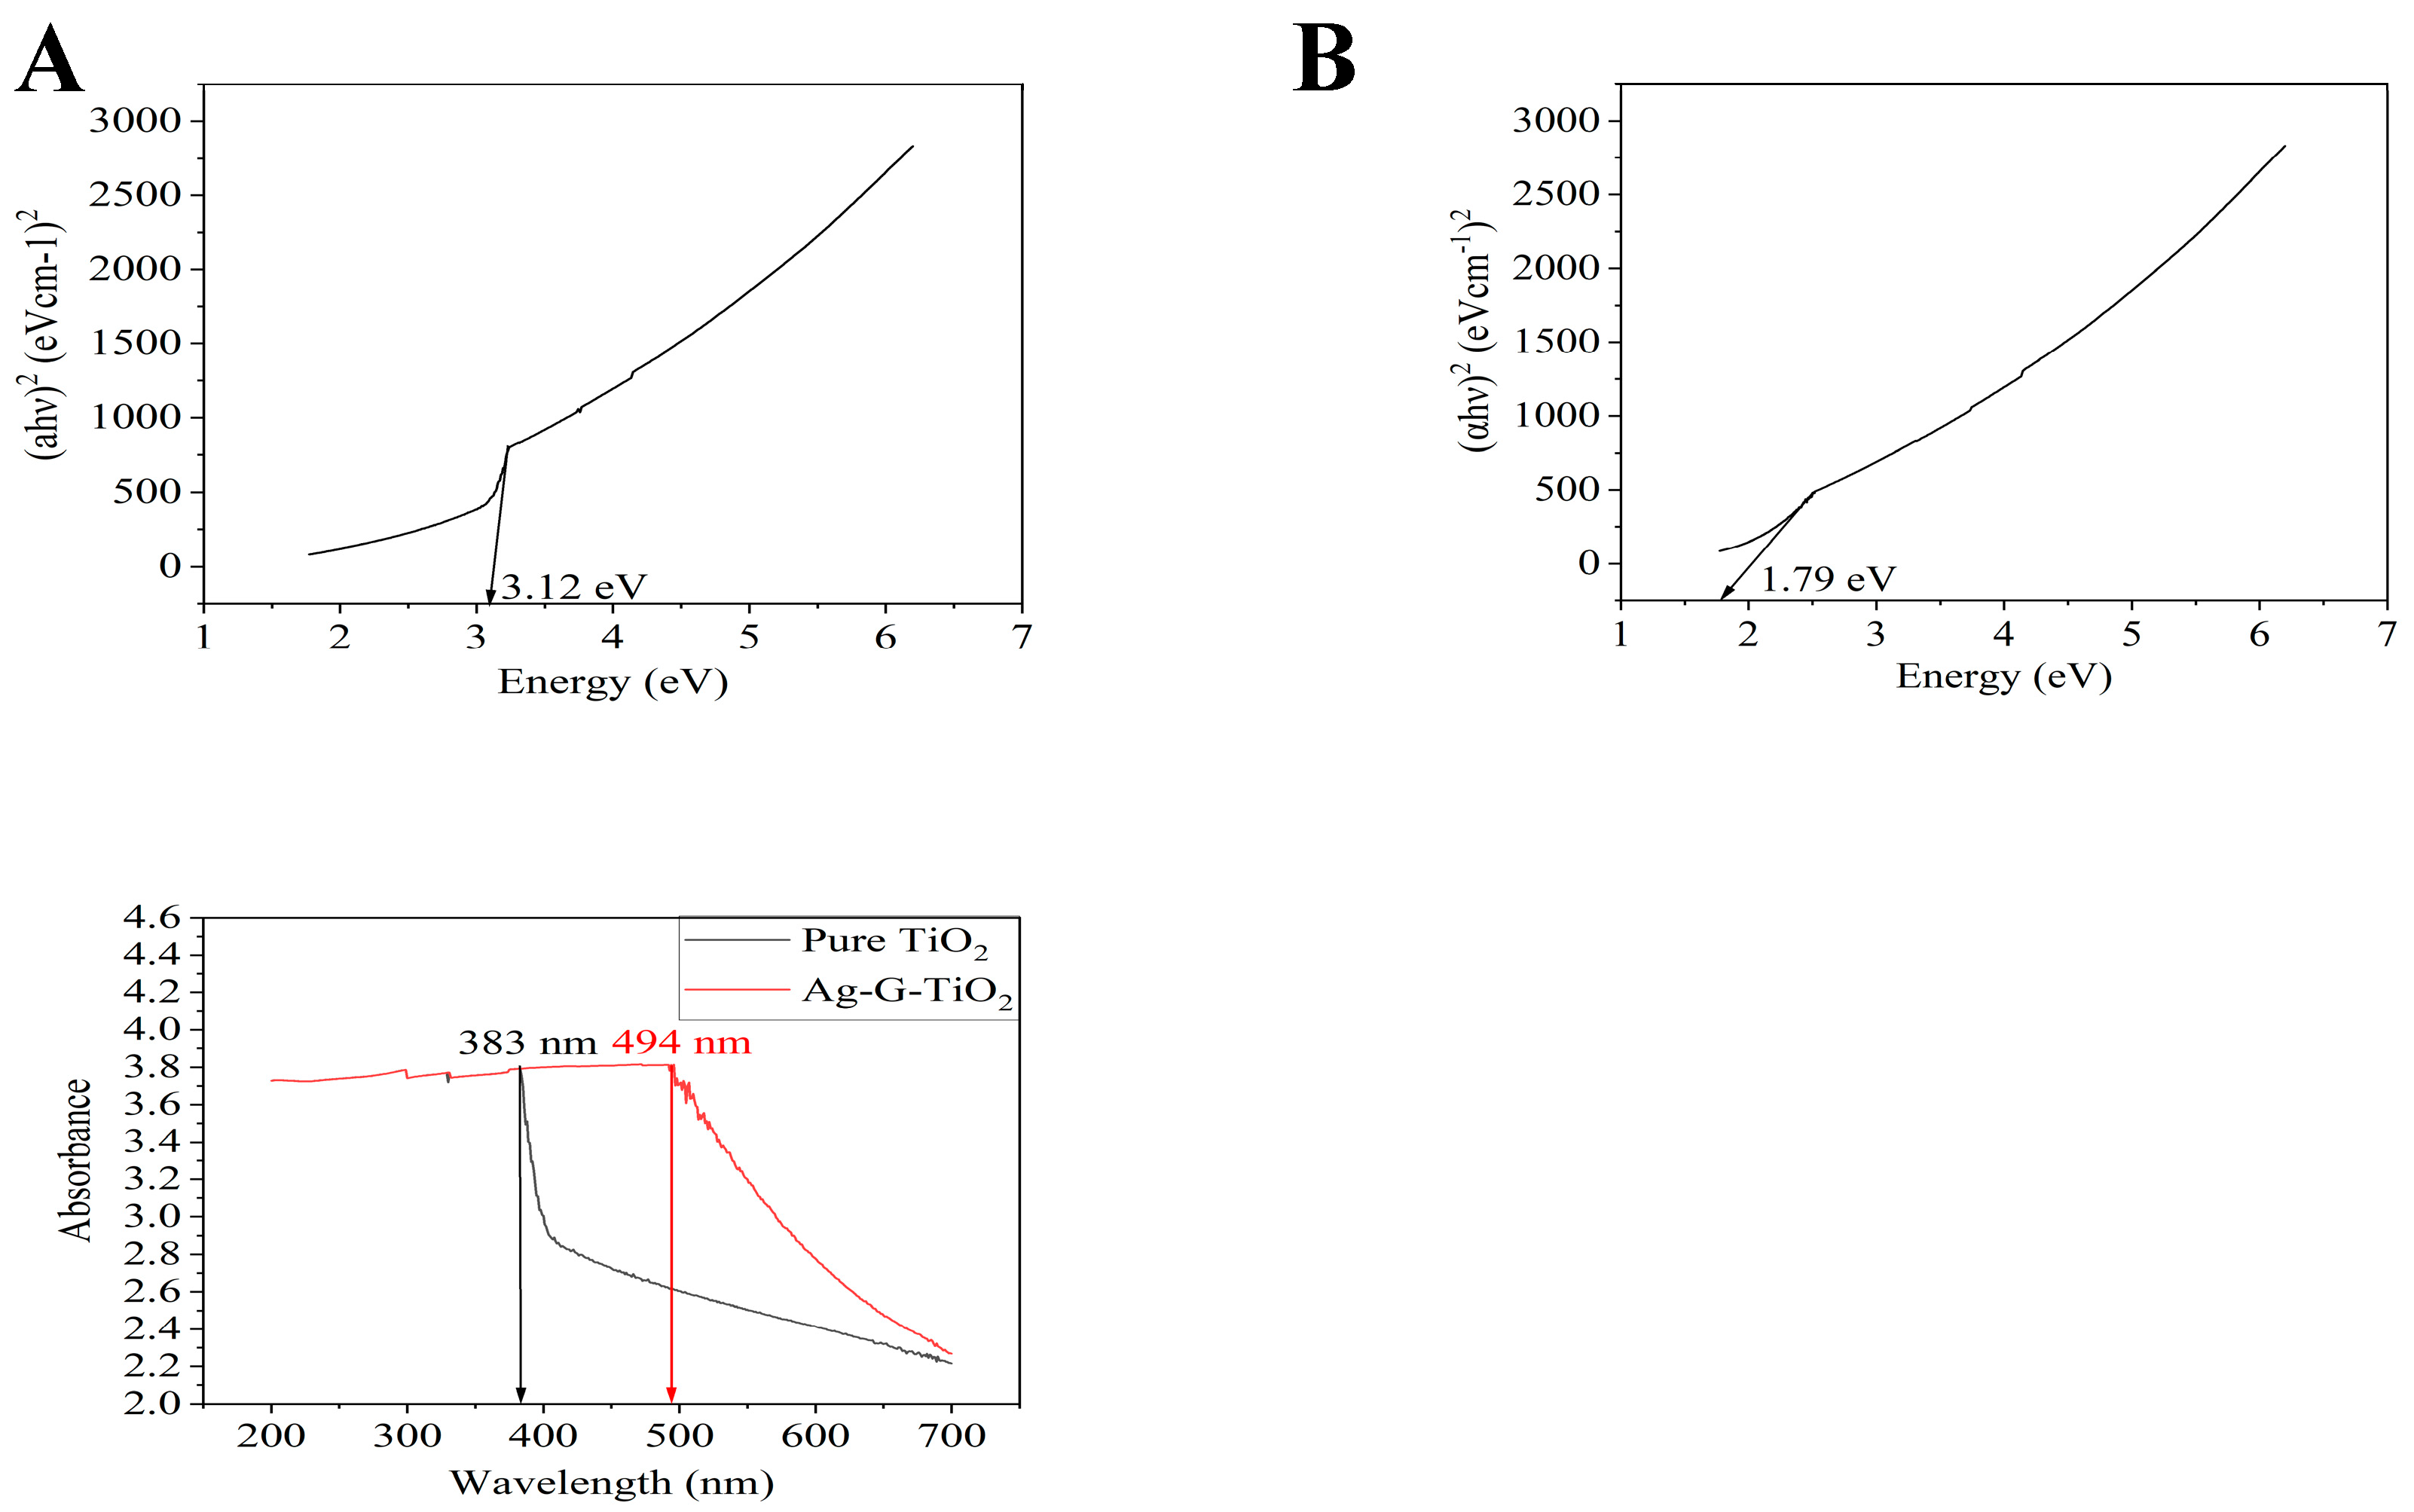
Figure 4.
XRD patterns of the pure TiO2 and Ag-G-TiO2.
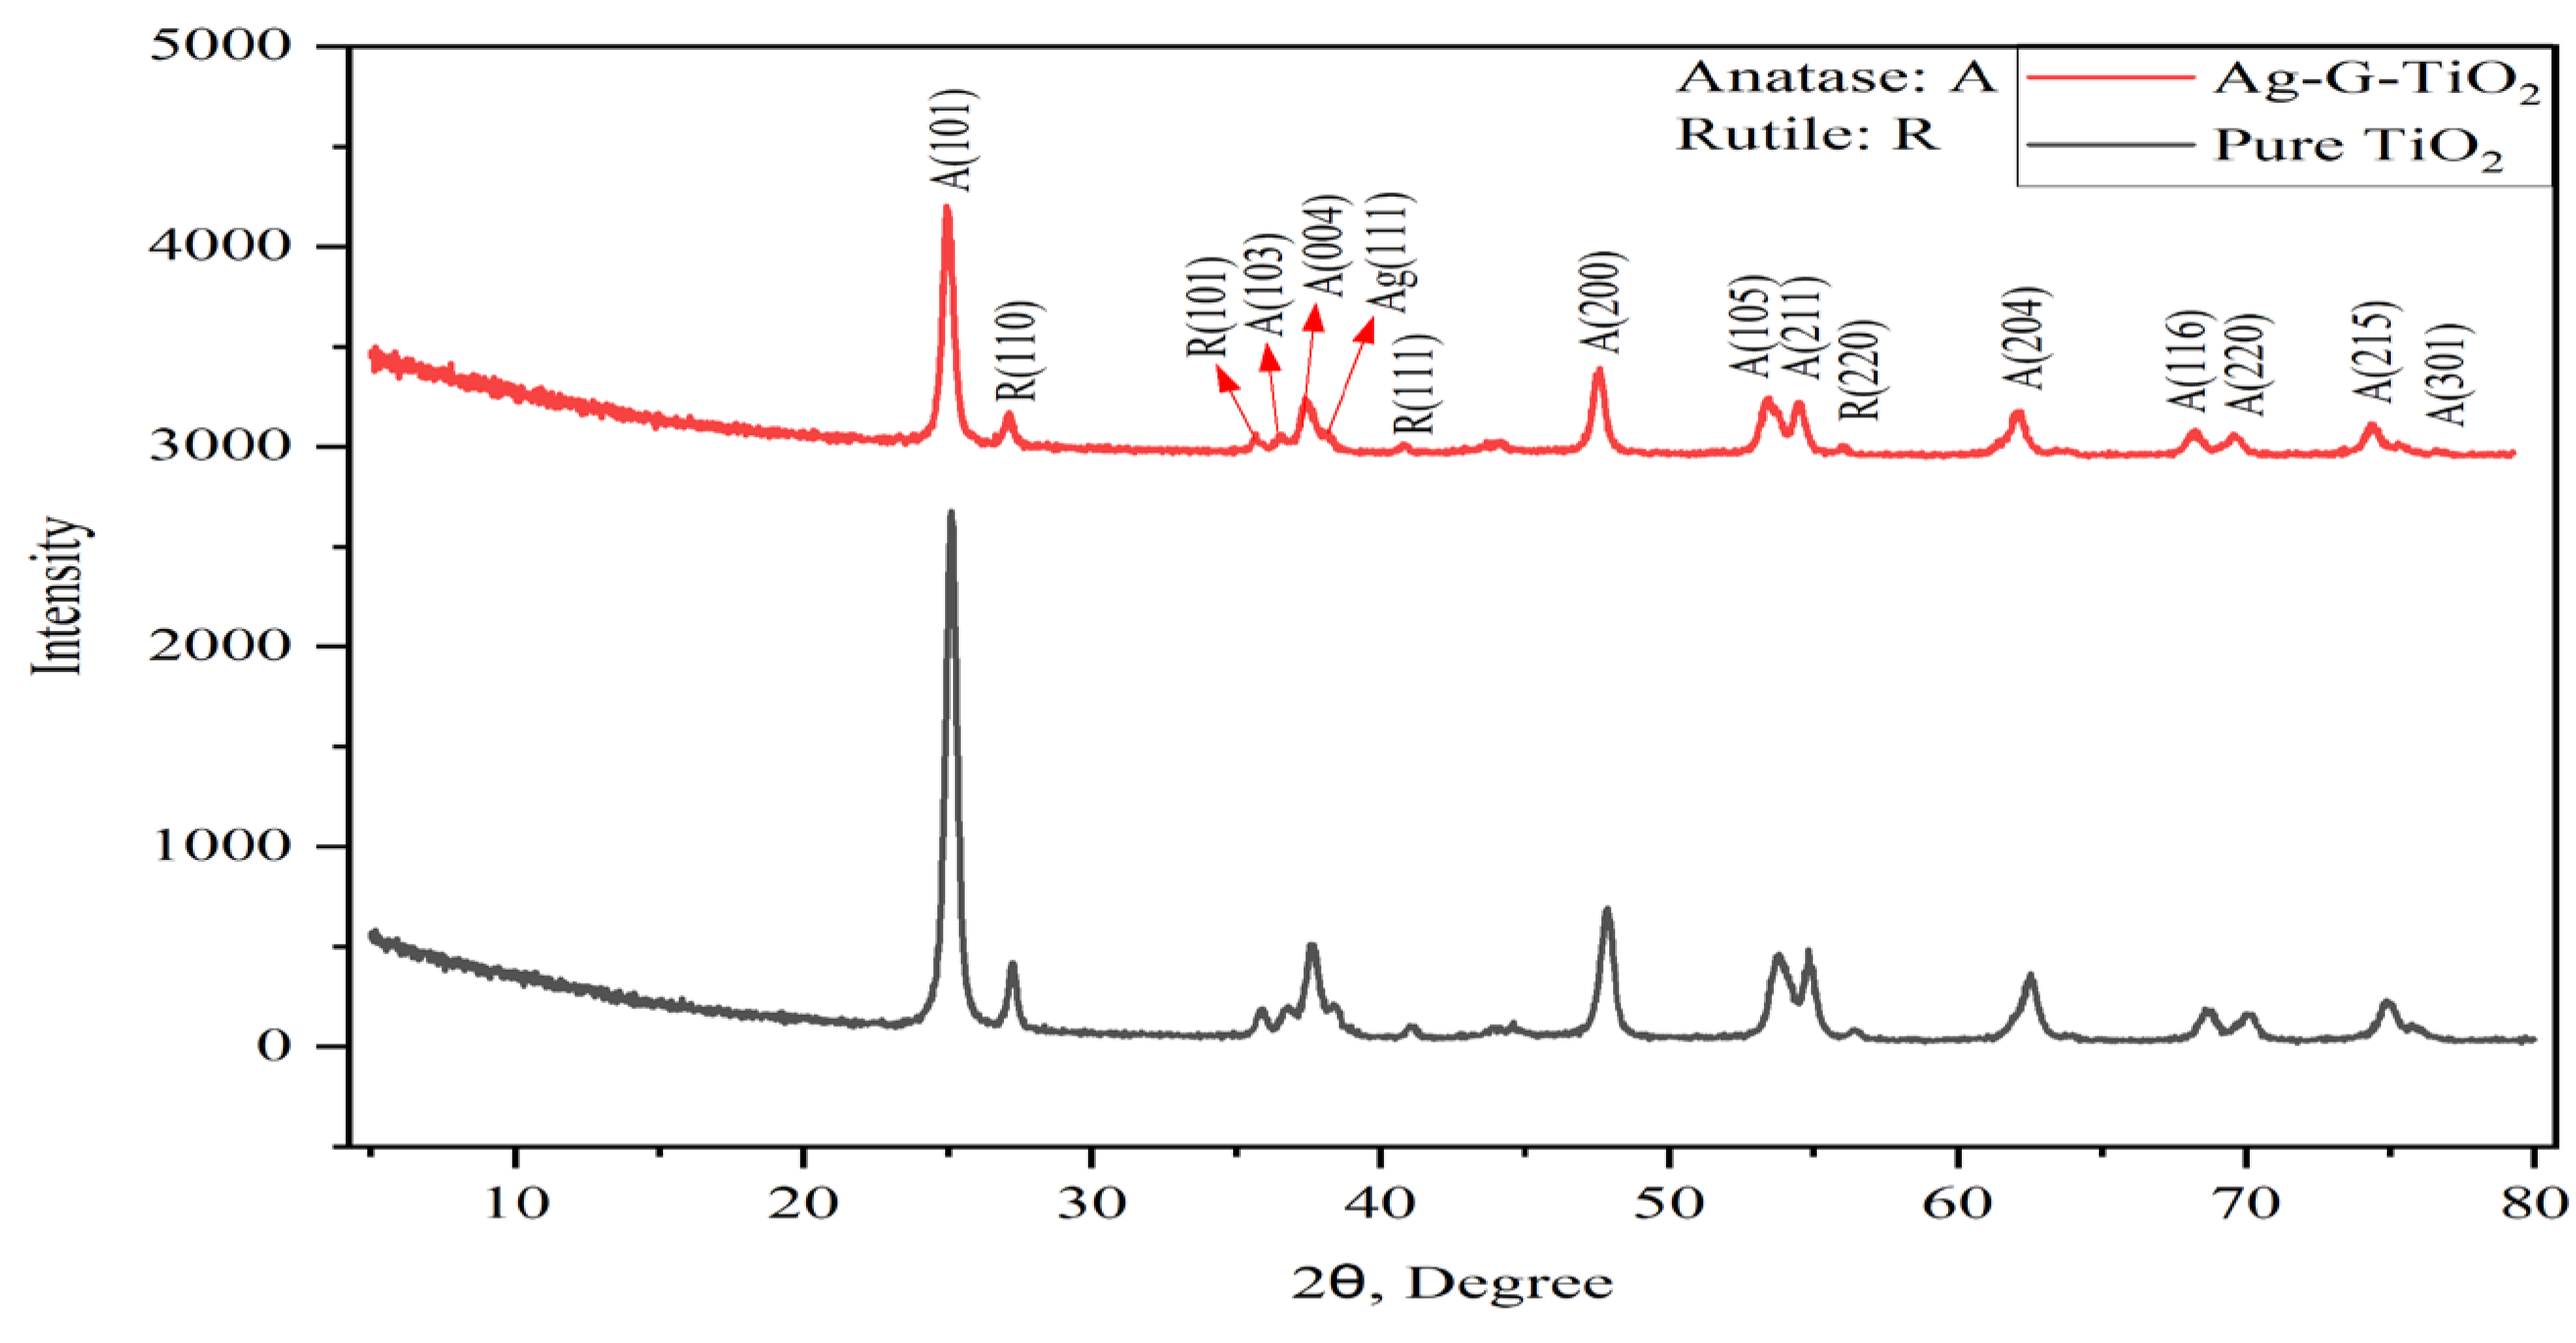
Figure 5.
Photocatalytic dye wastewater degradation and catalyst efficiency over time A) Visible Light, B) UV Light, C) Visible Light, D) UV Light.
Figure 5.
Photocatalytic dye wastewater degradation and catalyst efficiency over time A) Visible Light, B) UV Light, C) Visible Light, D) UV Light.
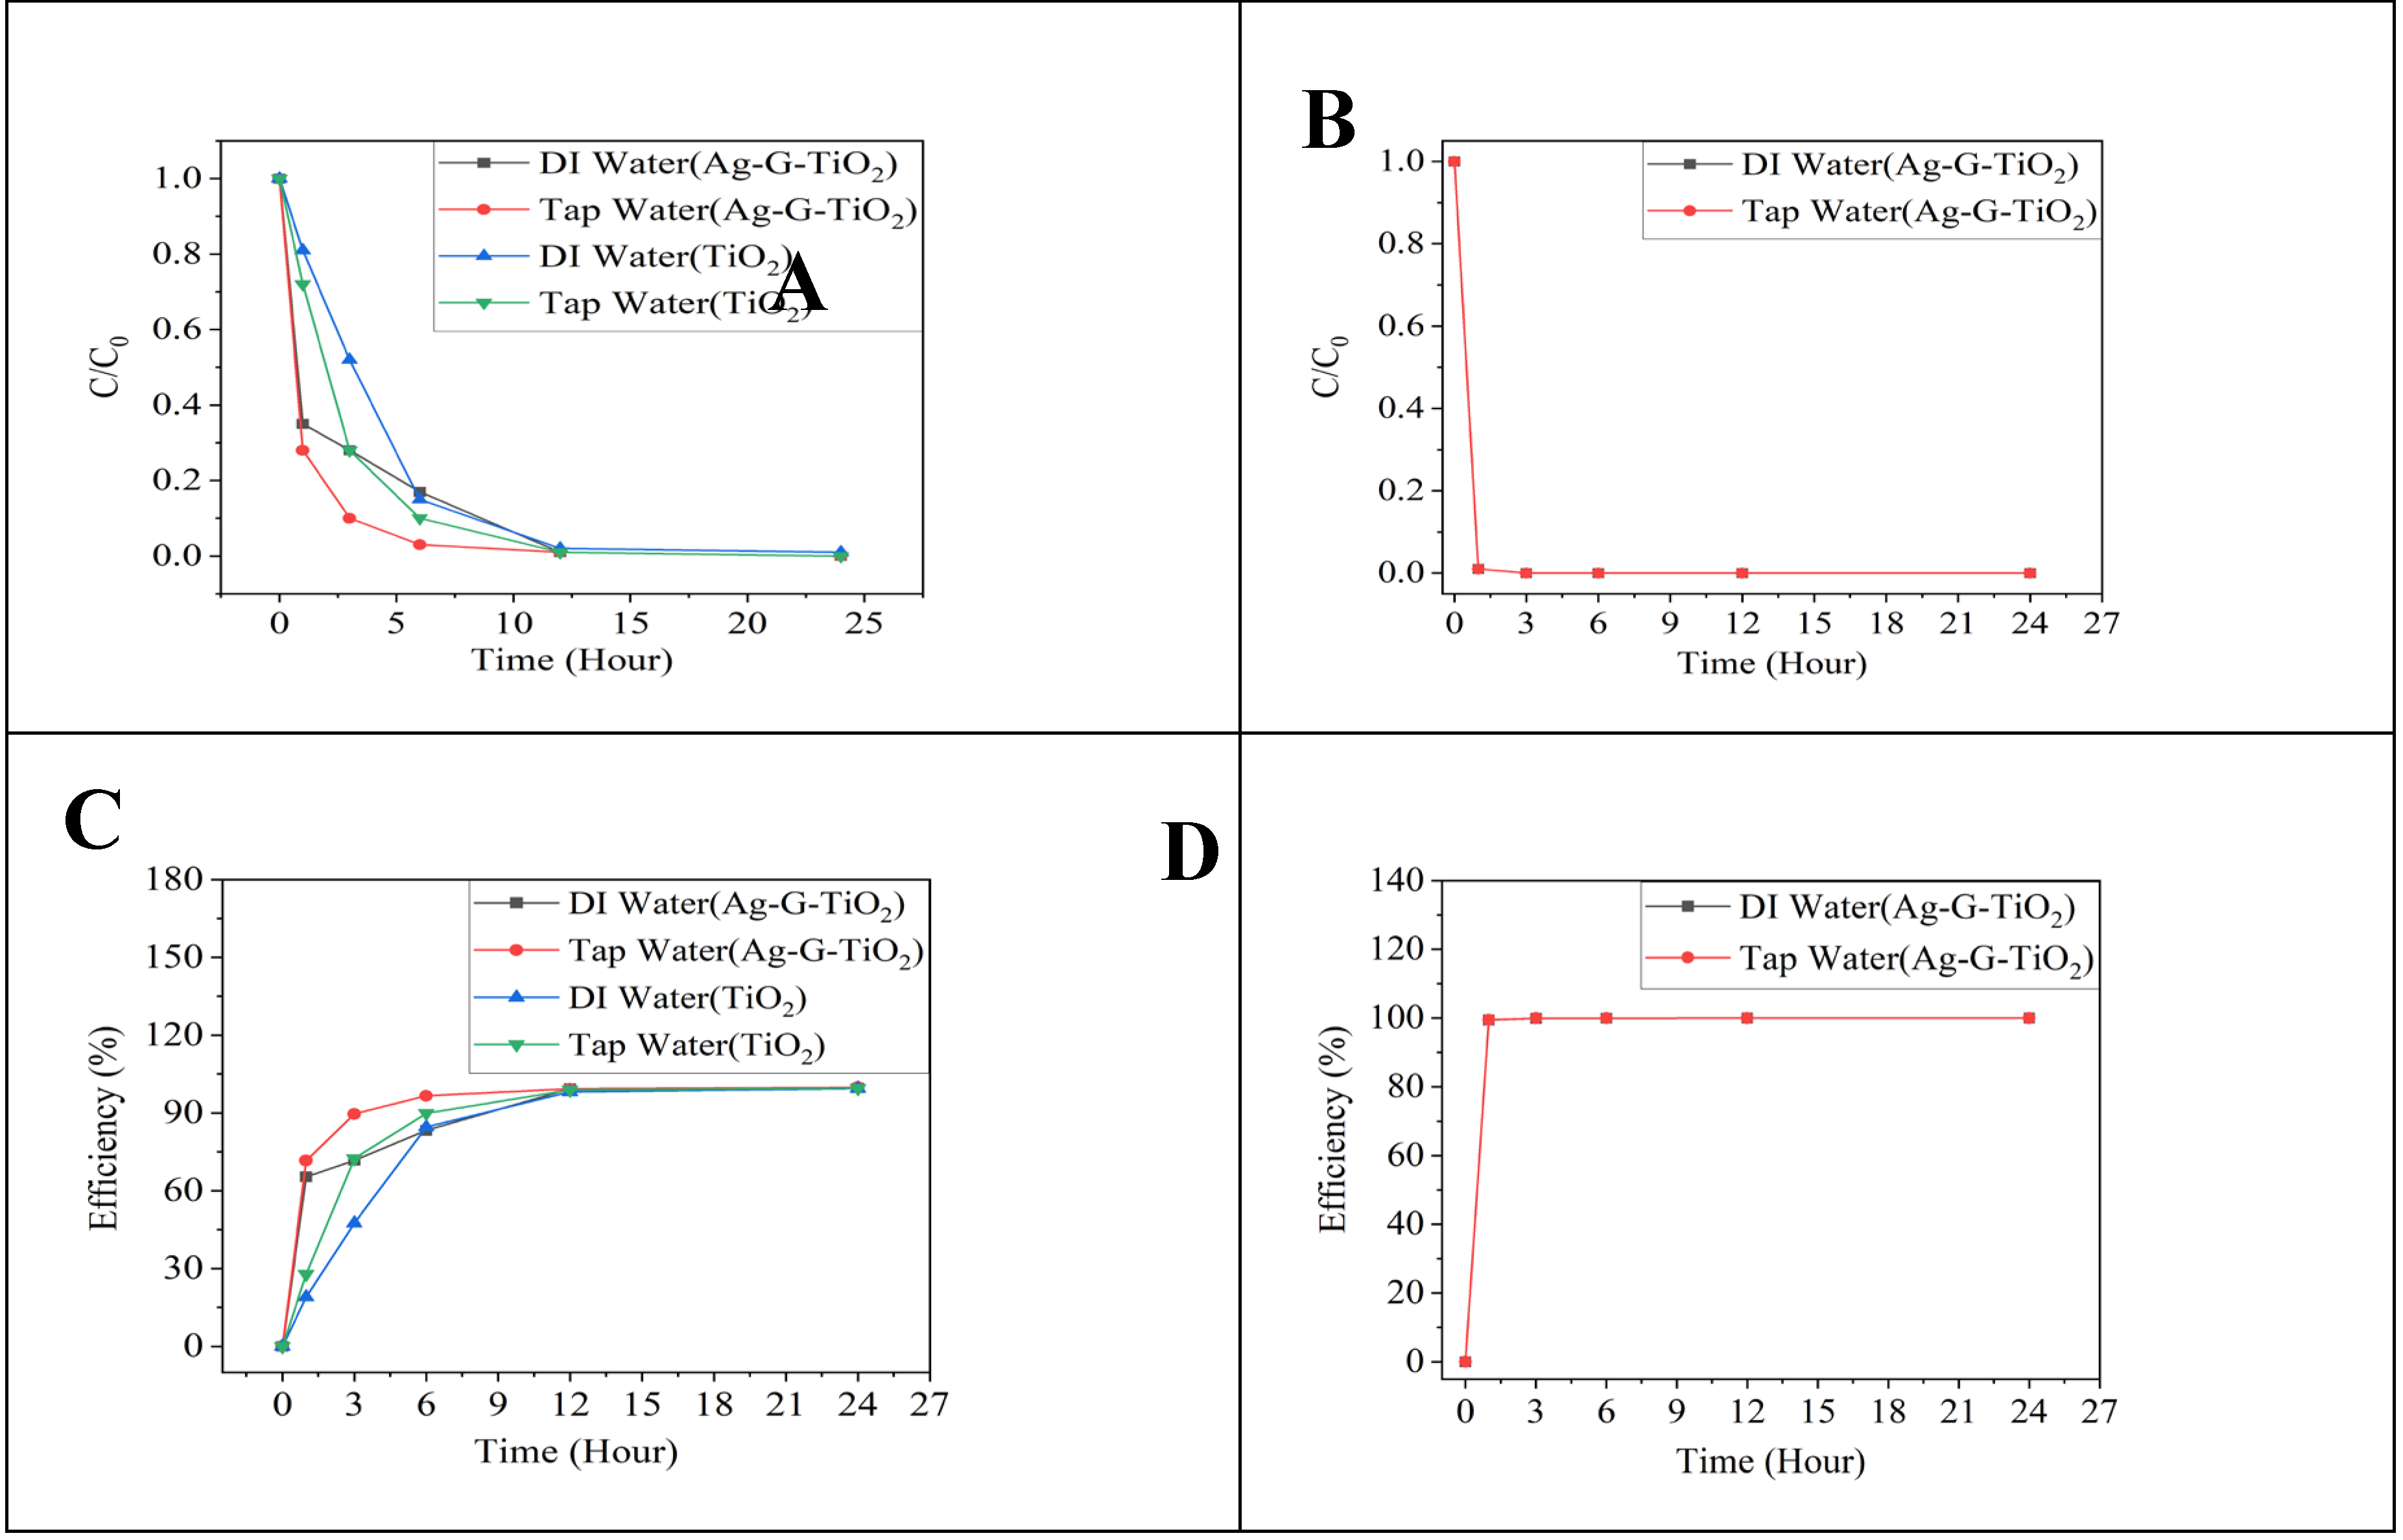
Figure 6.
Photocatalytic hydrogen production A) Visible Light, B) UV Light.
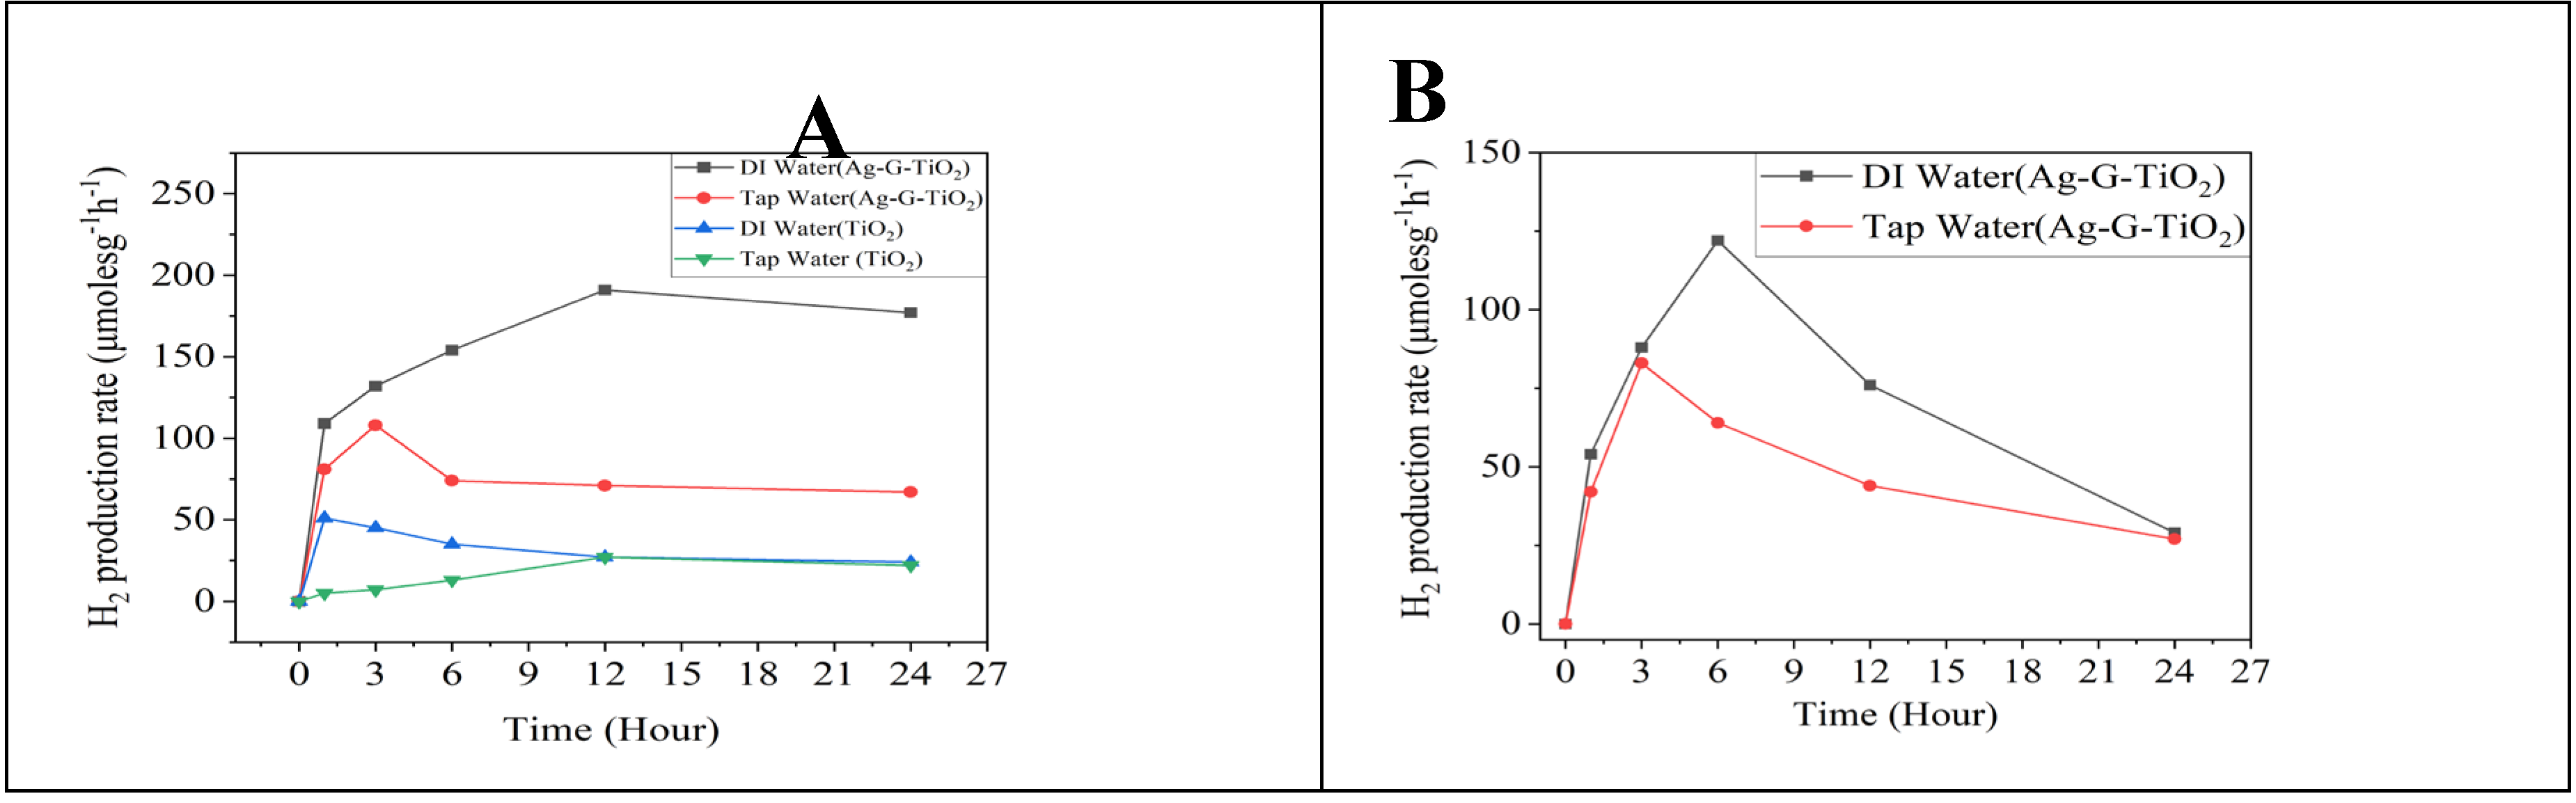

Table 1.
Crystalline phases composition of the photocatalysts.
| Photocatalysts. | Crystalline Phase, % | |
|---|---|---|
| Anatase | Rutile | |
| TiO2 | 89.23 | 10.77 |
| Ag-G-TiO2 | 88.89 | 11.11 |
Disclaimer/Publisher’s Note: The statements, opinions and data contained in all publications are solely those of the individual author(s) and contributor(s) and not of MDPI and/or the editor(s). MDPI and/or the editor(s) disclaim responsibility for any injury to people or property resulting from any ideas, methods, instructions or products referred to in the content. |
© 2024 by the authors. Licensee MDPI, Basel, Switzerland. This article is an open access article distributed under the terms and conditions of the Creative Commons Attribution (CC BY) license (https://creativecommons.org/licenses/by/4.0/).
Copyright: This open access article is published under a Creative Commons CC BY 4.0 license, which permit the free download, distribution, and reuse, provided that the author and preprint are cited in any reuse.


