
Submitted:
01 October 2024
Posted:
02 October 2024
You are already at the latest version
Abstract
This study explores the hydrogen generation potential via water-splitting reactions under UV-vis radiation, by using a synergistic assembly of ZnO nanoparticles integrated with MoS2, single-walled carbon nanotubes (SWNTs), and crystalline silicon nanowires (SiNWs) to create the MoS2-SiNWs-SWNTs@ZnONPs nanocomposites. A comparative analysis of MoS2 synthesized through chemical and physical exfoliation methods revealed that the chemically exfoliated MoS2 exhibited superior performance, thereby being selected for all subsequent measurements. The nanostructured materials demonstrated exceptional surface characteristics, with specific surface areas exceeding 300 m²g⁻¹. Notably, the hydrogen production rate achieved by a composite comprising 5% MoS2, 1.7% SiNWs, and 13.3% SWNTs at an 80% ZnONPs base was approximately 3909 µmol h⁻¹g⁻¹ under 500 nm wavelength radiation, marking a significant improvement of over 40-fold relative to pristine ZnONPs. This enhancement underscores the remarkable photocatalytic efficiency of the composites, maintaining high hydrogen production rates above 1500 µmol h⁻¹g⁻¹ even under radiation wavelengths exceeding 600 nm. Furthermore, the potential of these composites for energy storage and conversion applications, specifically within rechargeable lithium-ion batteries, was investigated. Composites, similar to those utilized for hydrogen production but excluding ZnONPs to address its limited theoretical capacity and electrical conductivity, were developed. The focus was on utilizing MoS2, and SiNWs, and SWNTs, as anode materials for Li-ion batteries. This strategic combination significantly improved the electronic conductivity and mechanical stability of the composite. Specifically, the composite with 56% MoS2, 24% SiNWs and 20% SWNTs offered remarkable cyclic performance with high specific capacitance values, achieving a complete stability of 1000 mA h⁻¹g⁻¹ after 100 cycles at 1 A g⁻¹. These results illuminate the dual utility of the composites, not only as innovative catalysts for hydrogen production but also as advanced materials for energy storage technologies, showcasing their potential in contributing to sustainable energy solutions.
Keywords:
Li-ion Battery
; Hydrogen
; HER
; Water Splitting
; Photocatalysis
1. Introduction
In the face of a rapidly evolving global energy landscape, the transition to renewable and efficient energy sources has become imperative [1]. This shift is driven by the urgent need to combat climate change and reduce our reliance on fossil fuels [1,2]. Among the numerous strategies under exploration, advanced materials, particularly nanomaterials, have emerged as frontrunners in revolutionizing energy generation and storage technologies [3]. Carbon nanotubes (CNTs) [4,5], silicon nanowires (SiNWs) [6,7,8], and molybdenum disulfide (MoS₂) [9] stand out due to their unique properties, which make them ideal candidates for enhancing both hydrogen production and lithium-ion battery (Li-ion) performance. This paper investigates the innovative integration of these nanomaterials into composites optimized for photocatalytic hydrogen generation [3,10,11,12,13,14,15,16,17], and energy storage [6,18,19,20,21,22,23], capitalizing on their synergistic properties to significantly boost efficiency.
Carbon nanotubes are well-known for their exceptional mechanical strength and high electrical conductivity, properties that make them indispensable in energy applications [4,5]. In hydrogen production, CNTs enhance electron transport, improving the efficiency of photocatalytic water splitting [24]. Furthermore, CNTs provide robust structural support in battery electrodes, promoting durability and electron mobility—key factors for high-performance batteries [25]. Their role in these nanocomposites is to serve as a backbone, facilitating both electron flow and mechanical stability, which collectively improves the overall efficiency of the system [25,26]. Silicon nanowires, on the other hand, offer a high surface area-to-volume ratio, a feature that is advantageous for both catalytic and battery applications [27]. In photocatalysis, SiNWs expose a greater number of active sites for water-splitting reactions, thereby increasing hydrogen production rates [28]. For Li-ion batteries, this increased surface area facilitates enhanced interaction with the electrolyte, allowing for improved lithium-ion storage and retrieval [29]. This is critical for achieving high energy densities and faster charging times. MoS₂, a transition metal dichalcogenide, is recognized for its outstanding catalytic properties, particularly in hydrogen evolution reactions (HER) [9,30]. Its layered structure hosts active sites that are pivotal in catalyzing hydrogen production from water. Beyond catalysis, MoS₂ also contributes to the structural integrity and conductivity of battery electrodes when combined with other nanomaterials like CNTs and SiNWs [31].
In this study, we focus on the synthesis and performance of MoS₂-SiNWs-SWNTs@ZnONPs nanocomposites, created through a strategic assembly that integrates zinc oxide nanoparticles (ZnONPs), MoS₂, single-walled carbon nanotubes (SWNTs), and SiNWs. The selection of ZnONPs as a base material is driven by their excellent absorption properties, essential for initiating photocatalytic water splitting. We compare the performance of MoS₂ synthesized through chemical and physical exfoliation, finding that the chemically exfoliated MoS₂ exhibits superior catalytic activity. This formulation was then chosen for further testing. Photocatalytic tests of the nanocomposites under UV-visible light showed a marked increase in hydrogen production, with the optimized composite achieving a hydrogen generation rate of approximately 3909 µmol h⁻¹g⁻¹ under 500 nm wavelength radiation, more than 40 times higher than that of pristine ZnO nanoparticles. This significant enhancement is attributed to improved charge separation and increased catalytic activity due to the synergistic interactions among the nanocomposite components.
In addition to its application in hydrogen production, the potential of these nanocomposites for use in Li-ion batteries was also explored. Given the limitations of ZnO nanoparticles in terms of electrical conductivity and theoretical capacity, we developed a scalable synthesis process for MoS₂ nanocomposites to be used as anode materials. Initial tests on pristine MoS₂ electrodes revealed insufficient electrochemical performance. However, the integration of MoS₂ nanosheets with CNTs in an 80:20 wt/wt ratio (MoS₂@CNT) improved the performance significantly. Further enhancement was achieved by incorporating silicon nanowires into the MoS₂-CNT matrix, forming a second series of free-standing electrodes (MoS₂@SiNW@CNT) in a 56:24:20 wt.% composition. This composite exhibited a stable and homogeneous microstructure, free from agglomeration, as confirmed by energy-dispersive X-ray (EDX) mapping and field emission scanning electron microscopy (FESEM). The optimized electrode achieved a remarkable specific capacity of 1000 mAh g⁻¹ after 100 cycles at a current density of 1 A g⁻¹, demonstrating the potential of these nanocomposites to contribute to the development of high-capacity, long-life battery systems.
The primary objective of this study was to demonstrate the dual functionality of the synthesized nanocomposites in advancing both hydrogen production and energy storage technologies. By harnessing the unique properties of each nanomaterial, this research highlights not only their individual contributions but also their combined potential to significantly improve the efficiency of energy systems. The comprehensive analysis of the photocatalytic and electrochemical performance of these nanocomposites underscores their promise as key components in sustainable energy solutions.
2. Materials and Methods
2.1. Materials
The solutions used in the synthesis were prepared with ultrapure deionized water (Milli-Q water) having a resistivity of 18.2 MΩ·cm at 25°C to ensure high quality and consistency in experimental results. Zinc oxide nanoparticles (ZnONPs) were synthesized using zinc acetate dihydrate (Zn(C₂H₃O₂)₂·2H₂O, 98.99% purity) and sodium hydroxide (NaOH, 99.0% purity), both sourced from Sigma Aldrich (Milwaukee, WI, USA). Molybdenum disulfide (MoS₂), with 99% purity and an average particle size of 90 nm in nanopowder form (Sigma Aldrich, St. Louis, MO, USA), was later exfoliated as described in subsequent sections. Silicon nanowires (SiNWs) were obtained from Floatech S.L. (Madrid, Spain) and used as received. Ethylenediaminetetraacetic acid disodium salt (EDTA-Na₂, ACS reagent grade, 99.4-100.6% purity) in powder form was also employed, along with sodium sulfide nonahydrate (Na₂S·9H₂O, >99.99% purity), sodium sulfite (Na₂SO₃, Puriss. p.a. Ph. Eur. grade, anhydrous, 98-100% purity), and sodium sulfate (Na₂SO₄, anhydrous, ACS reagent, >99.99% purity), all obtained from Sigma Aldrich. Nafion (5% wt solution, Grade D520CS) was sourced from Chemours Company (Wilmington, DE, USA). High-purity isopropanol (>99.9% for HPLC) and absolute ethanol (200 Proof, >99.5% purity, HPLC/Spectrophotometric grade) were both supplied by Sigma Aldrich. Ethylenediamine (EDA), purified by redistillation to >99.5% purity, and N,N-dimethylformamide (DMF, for HPLC, >99.9% purity) were also provided by Sigma Aldrich.
For the preparation of Li-ion battery electrodes, single-walled carbon nanotubes (SWNTs) in aqueous suspension (0.2 wt%, without surfactants) were used, supplied by TUBALL™ BATT (Luxembourg). Additional materials used in the preparation of Li-ion batteries included a polyvinylidene fluoride (PVDF) membrane (Celgard 3501, PP-coated, Charlotte, NC, USA) and a 1M solution of LiPF₆ electrolyte in a 1:1:1 mixture of ethylene carbonate (EC), diethyl carbonate (DEC), and dimethyl carbonate (DMC), also from Sigma Aldrich. Glass microfiber filter disks (Whatman grade GF/B, thickness 0.68 mm) used as spacers were likewise provided by Sigma Aldrich.
2.2. Synthesis of the ZnONPs
The methodology for synthesizing zinc oxide nanoparticles (ZnONPs) is well-documented in previous literature [32]. The process begins with the preparation of a zinc acetate dihydrate solution, where 25 mL of a 0.2 M solution of Zn(C2H3O2)2.2H2O is thoroughly mixed with 50 mL of deionized water. This mixture is then heated to maintain a constant temperature of 60 °C. Once the target temperature is achieved, 25 mL of a 4 M sodium hydroxide (NaOH) solution is gradually introduced into the mixture in a controlled, dropwise manner. Following the addition of the sodium hydroxide solution, the resultant mixture is maintained at 60 °C and continuously stirred for two hours to ensure complete reaction and homogeneity of the solution. After that, the heating is discontinued, and the solution is allowed to naturally cool to room temperature. Subsequent to cooling, the precipitated solids are collected by centrifugation. To purify the product, the collected solids are subjected to multiple washing cycles. Each cycle involves resuspending the precipitate in deionized water and centrifuging it again to remove any residual impurities and unreacted materials. This process is repeated several times until the wash waters achieve a neutral pH, indicating the removal of excess reactants and byproducts. Finally, the washed and purified zinc oxide nanoparticles are gathered and spread out to dry. The drying process is carried out in a controlled environment where the material is exposed to a constant temperature of 60 °C overnight. This step is crucial as it removes any remaining moisture and ensures the stability of the ZnONPs. The result is a dry, fine powder of zinc oxide nanoparticles, ready for subsequent experimental use.
2.3. Exfoliation of MoS2
The exfoliation of MoS₂ was carried out following the method described by Ghorai et al. [33], with slight modifications, combining intercalation with ethylenediamine (EDA) and subsequent ultrasonication in an organic solvent. Initially, 0.5 g of bulk MoS2 powder was transferred to a 100 mL round-bottom flask. To this, 25 mL of ethylenediamine (EDA) and then subjected to magnetic stirring at room temperature. This stirring was maintained for 24 hours, to allow for thorough adsorption of the EDA molecules onto the MoS2 surface. Next, the mixture was centrifuged at 6000 rpm for 40 minutes to separate the unadsorbed EDA from the MoS2 particles. The supernatant, containing the excess EDA, was decanted and discarded. The precipitate, now containing EDA-intercalated MoS2, was redispersed in 40 mL of N,N-dimethylformamide (DMF) and the mixture was magnetically stirred for 3 hours. After that, the mixture was subjected to centrifugation at 6000 rpm for 30 minutes to remove any remaining unadsorbed EDA and excess solvent. The supernatant was discarded, and the purified EDA-intercalated MoS2 precipitate was collected. This process of redispersion in DMF and centrifugation was repeated twice. The purified EDA-intercalated MoS2 was then transferred to a 100 mL Erlenmeyer flask containing 50 mL of fresh DMF. The mixture was sonicated using a tip sonicator for 4 hours at room temperature. The sonicator was operated at 500 W and 20 kHz frequency. To maintain the temperature below 30 °C throughout the sonication process, the sample was placed in a water bath, and ice was periodically added. Following sonication, the resulting suspension exhibited a greenish colloidal appearance, indicating successful exfoliation of MoS2 into few-layer or single-layer nanosheets. To isolate these exfoliated nanosheets, the suspension was centrifuged at 6000 rpm. The supernatants from this centrifugation step contained the exfoliated MoS2 nanosheets, which were carefully collected and stored in clean glass vials for further use. The yield of this exfoliation process was very low, necessitating 15 repetitions to obtain a sufficient quantity of material for the preparation of the composites. All synthesized batches were combined into a single vial and further homogenized with DMF to ensure that the MoS₂ in all composites had consistent characteristics.
2.4. Synthesis of Composites
The synthesis of MoS2-SiNWs-SWNTs@ZnONPs composites was carried out through a multi-step process as follows. Initially, 500 mg of ZnONPs were dispersed in 50 mL of deionized water. The dispersion was subjected to ultrasonication for 20 minutes to ensure a homogeneous suspension. Concurrently, the appropriate amounts of SWNTs and SiNWs were combined in a separate Erlenmeyer flask and dispersed in 20 mL of deionized water. This SWNTs/SiNWs mixture was also ultrasonicated for 10 minutes to achieve a uniform dispersion. Subsequently, this mixture was added dropwise to the previously prepared ZnONPs solution under continuous magnetic stirring. The resulting composite suspension was maintained under magnetic stirring at room temperature for 1 hour to facilitate interaction between the components. Following this, a predetermined quantity of pre-exfoliated MoS₂ was added to the mixture. The addition of MoS₂ was performed slowly to ensure proper integration into the composite. The entire suspension was then stirred for an additional 2 hours. After completion of the stirring process, the suspension was centrifuged at 6000 rpm for 15 minutes to separate the solid phase from the supernatant. The resulting precipitate was washed several times with deionized water to remove any unreacted species or residual contaminants. This washing process was coupled with two additional cycles of centrifugation to ensure purity of the composite material. The final solid product was dried in a vacuum oven at 70 °C for 6 hours to remove any residual moisture. Subsequently, the dried material underwent thermal treatment at 300 °C for 2 hours under a continuous nitrogen flow (300 mL min⁻¹) to enhance the stability of the composite. The composite material obtained after thermal treatment was carefully collected and stored in an airtight container for further characterization and potential application studies.
2.5. Characterization of Composites
The surface area of the composites was quantified using the Brunauer-Emmett-Teller (BET) method on a Micrometrics ASAP 2020 instrument, which employed nitrogen adsorption isotherms at 77 K (Micrometrics Instrument Corporation, Norcross, GA, USA). The morphology and structural details of the composite materials were examined through field emission scanning electron microscopy (FESEM) with a FEI Verios 460L system, integrated with a Quantax energy-dispersive X-ray spectroscopy (EDS) analyzer (Thermo Fisher Scientific, Hillsboro, OR, USA). High-resolution transmission electron microscopy (HRTEM) analysis was performed on a JEM 3000F microscope (JEOL, Peabody, MA, USA) to gain insights into the nanoscale features and lattice fringes of the samples. The crystalline phases present in the composites were determined using X-ray diffraction (XRD) analysis, carried out with a Bruker D8 Advance diffractometer operating at 40 kV and 40 mA (Bruker Corporation, Billerica, MA, USA). Raman spectroscopy measurements were conducted with a DXR Raman microscope (Thermo Fisher Scientific, Waltham, MA, USA), utilizing a 532 nm laser at 5 mW power and a resolution of 5 cm–1, to investigate the vibrational modes of the materials. X-ray photoelectron spectroscopy (XPS) was employed to analyze the surface elemental composition and chemical states using an ESCALAB 220i-XL spectrometer with non-monochromatic magnesium Kα radiation (1253.6 eV) operating at 20 mA and 12 kV (Thermo Fisher Scientific, Waltham, MA, USA). The optical bandgap energies of the composites were obtained using a Perkin Elmer Lambda 1050 UV-Visible-NIR Spectrophotometer (Perkin Elmer, Waltham, MA, USA). Photoluminescence (PL) spectra were recorded to study the electronic properties using an FS900 Fluorescence Spectrometer (Edinburgh Instruments Ltd., Livingston, UK). The produced hydrogen was quantified by gas chromatography (GC), using a thermal conductivity detector (GC–TCD, Perkin-Elmer Clarus 600). The photoelectrochemical properties (transient photocurrent response) of the different materials were characterized using a CHI660D electrochemical system workstation (Shanghai Chenhua Instrument Co., Shanghai, China). Electrochemical measurements, including galvanostatic charge/discharge (GCD) curves, were conducted at room temperature using a 12-channel Arbin Instruments BT2143 workstation, with a potential window of 0.01 V to 3.0 V (vs Li/Li⁺) at various current densities. Cyclic Voltammetry (CV) was performed using a Potentiostat/Galvanostat (Princeton Applied Research, PAR, VersaSTAT 3) at a scan rate of 0.2 mV/s, over the same potential range of 0.01 V to 3.0 V. Electrochemical Impedance Spectroscopy (EIS) was also carried out with the PAR VersaSTAT 3, applying a 5 mV amplitude over a frequency range from 0.1 Hz to 1 MHz.
2.6. Photocatalytic Experiments
Optimal conditions for the catalytic hydrogen evolution reaction (HER) studies were determined in terms of catalyst dosage (0.5 g/L to 1.5 g/L), and pH levels (4 to 11) prior to initiating the experimental procedures. The photocatalytic hydrogen generation was evaluated by introducing 50 mg of the selected catalyst into a 200 mL quartz reactor flask containing 100 mL of deionized water. The reaction mixture was maintained at a constant temperature of 20 °C, agitated using a magnetic stirrer set at 20 rpm, and purged with nitrogen gas for a minimum of 20 minutes to remove any dissolved oxygen.
Subsequently, the solution was exposed to ultraviolet-visible (UV-vis) radiation for 120 minutes. Various filters were used to select the specific irradiation wavelengths appropriate for the study. To facilitate the reaction, solutions of 0.5 M sodium sulfide (Na2S) and 0.03 M sodium sulfite (Na2SO3) were added as sacrificial agents. The hydrogen produced during the reaction was carried by a nitrogen gas stream, collected, and subsequently analyzed. The evolved hydrogen was captured, and its volume quantitatively measured using a gas chromatographic system equipped with a thermal conductivity detector (GC-TCD). A Perkin-Elmer Clarus 600 instrument was specifically used for this analysis.
2.7. Fabrication of Free-Standing SiNWs-SWNTs-MoS2 Electrodes
Three types of electrodes were prepared, each with varying proportions of MoS₂ as the active material: pure MoS₂, MoS₂@CNTs (80:20 wt.%), and MoS₂@SiNWs@CNTs (56:24:20 wt.%). The exfoliation of MoS₂ followed the procedure previously described. The carbon nanotubes (CNTs) used had diameters ranging from 40 to 60 nm and lengths between 1 to 50 μm, with a purity exceeding 95%, as indicated by the supplier. The silicon nanowires (SiNWs) had diameters between 25 and 70 nm and straight lengths of 0.5 to 2 μm, as confirmed by field-emission scanning electron microscopy (FESEM). Some nanowires showed thicker diameters, up to 140 nm, and longer, curved lengths reaching 20 μm.
Freestanding electrodes were fabricated by preparing isopropanol (IPA) solutions with varying concentrations of MoS₂ or a mixture of MoS₂/SiNWs as the active material. These solutions were then poured into a funnel and filtered through a porous polyvinylidene fluoride (PVDF) membrane with a thickness of 25 μm, using positive pressure applied by a vacuum pump. Before preparing the composite, the CNT solutions in deionized water were sonicated using a probe sonicator for 20 minutes. New solutions were then prepared by mixing the sonicated CNTs with the corresponding active materials (MoS₂ or MoS₂@SiNWs) in deionized water, ensuring the appropriate weight proportion of dried CNTs. After thorough mixing, the dispersion was sonicated again for 10 minutes at room temperature, leading to good entanglement between the CNTs and MoS₂ (or MoS₂@SiNWs), effectively preventing aggregate formation. All production steps were conducted under open-atmosphere conditions. Filtration was carried out immediately after sonication to prevent precipitate formation. This step is essential, as inhomogeneities from MoS₂ agglomerates, SiNWs clusters, or CNT bundles can disrupt network continuity and significantly affect battery performance. The amount of material used during filtration was standardized to 1 mg cm⁻² of membrane area. After vacuum filtration, the compounds deposited on the PVDF membrane were placed in a desiccator for at least 2 hours. The resulting electrodes, still attached to the membrane, were then cut into 12 mm discs and further dried under vacuum at 10⁻³ mbar and 90 °C for 10 hours. Following this, the electrodes were transferred to an Ar-filled glovebox (GP Campus, Jacomex) with moisture and oxygen levels below 1.0 ppm, for battery assembly. The 2032 coin-type half-cells were assembled using pure lithium (Li) as the counter electrode. The electrolyte employed was a 1.0 M solution of LiPF₆ in EC:DEC:DMC (1:1:1). A 16 mm diameter glass microfiber filter disk was placed in direct contact with the PVDF membrane supporting the electrode, serving as both the separator and the support. After assembly, the cells were allowed to stabilize for a minimum of 4 hours before measurement.
2.8. Post-Mortem Characterization of Li-Ion Coin Cells
After electrochemical cycling, selected coin cells were disassembled inside a glove box under an inert atmosphere using a precision non-conductor screwdriver. The lithium metal was carefully removed, and the electrode was extracted using fine-tipped tweezers. The electrode was subsequently cleaned with a dimethyl terephthalate (DMT) solution, followed by rinsing with an anhydrous solvent, and dried under controlled environmental conditions.
For post-mortem characterization, the cycled electrodes were transferred with care and analyzed using Scanning Electron Microscopy (SEM) and Nuclear Reaction Analysis (NRA). NRA was employed to investigate lithium diffusion profiles within the cycled electrodes. The measurements were conducted using a tandem setup of high-current coaxial tandetron accelerators operating at a terminal voltage of 5 MV [34]. This technique, based on the nuclear reaction 7Li(p,α) 4He, is highly sensitive to the depth distribution of lithium atoms [35,36]. To optimize the NRA signal for lithium detection, 3 MeV H+ ions were used, following the conditions established by Paneta et al. [37]. Backscattered ions were detected with two surface barrier detectors, having energy resolutions of 12 keV and 18 keV, positioned at scattering angles of 170° and 165° relative to the beam direction, respectively. The resulting NRA spectra were processed and analyzed using SIMNRA software [38,39,40].
3. Results
3.1. Hydrogen Evolution Reaction (HER)
3.1.1. Characterization of Composites
The synthesized nanomaterials were employed in the fabrication of photocatalysts, which were then tested for their efficiency in hydrogen production via water splitting (HER). Additionally, these nanomaterials were used to assemble electrodes for Li-ion batteries. The photocatalyst that demonstrated the highest efficiency in HER was 6.7%(MoS₂-SiNWs)@ZnONPs-CNTs, making this material the focus of a thorough characterization.
The BET surface area of the different composites was measured, and the results are summarized in Table S1. The unmodified ZnONPs exhibited a surface area of 62 m²g⁻¹, which increased to approximately 297 m²g⁻¹ with the addition of CNTs and SiNWs. This increase in surface area is primarily attributed to the presence of CNTs in the composite. The introduction of exfoliated MoS₂ (see Table S1) initially reduced the surface area to 231 m²g⁻¹ for the 5%(MoS₂-SiNWs)@ZnONPs-CNTs catalyst and then slightly increased it to 246 m²g⁻¹ with a higher MoS₂ content, as observed in the 6.7%(MoS₂-SiNWs)@ZnONPs-CNTs catalyst.
The catalyst precursors were thoroughly characterized using Field Emission Scanning Electron Microscopy (FESEM), as shown in Figure 1. The ZnONPs (Figure 1a) exhibit heterogeneous particles with diameters ranging from approximately 15 to 25 nm. The chemically exfoliated MoS₂ (Figure 1b) consists of small, thin sheets with highly variable sizes, ranging from 1 micron to several microns in average diameter. These sheets appear to be composed of multiple layers of MoS₂; however, as will be discussed later in the High-Resolution Transmission Electron Microscopy (HRTEM) analysis, some of these sheets are actually single-layer MoS₂. The variability in sheet thickness and lateral dimensions is expected to impact the electronic properties and catalytic activity of the material, as single-layer MoS₂ typically exhibits distinct electronic characteristics compared to its multilayer counterparts. Figure 1c illustrates the adduct formed by MoS₂ and carbon nanotubes (CNTs), revealing a highly homogeneous interweaving of both materials. This uniform integration is anticipated to be crucial for the catalytic performance, as the intimate contact between MoS₂ and CNTs can enhance electron transport and catalytic efficiency. The well-dispersed CNT network provides mechanical support and electrical conductivity, which are likely to play a significant role in the overall activity and stability of the catalysts. Finally, Figure 1d displays the combination of all the materials—MoS₂, CNTs, SiNWs, and ZnONPs. The image reveals a relatively homogeneous dispersion among all components, which is essential for ensuring consistent catalytic activity across the composite material. The uniform distribution of these components suggests effective mixing and interaction at the nanoscale, which may contribute to enhanced catalytic properties due to the synergistic effects of the individual materials.
The different components were further characterized using HRTEM. Figure 2a shows the HRTEM image of the ZnONPs, which exhibit heterogeneous dimensions, consistent with the observations made using FESEM. The nanoparticles display a range of sizes, reinforcing the earlier findings and suggesting a complex synthesis process that results in a non-uniform particle distribution. Figure 2b provides a magnified view of the highlighted region in Figure 2a, with an inset showing an even higher magnification where the material’s lattice fringes are clearly visible. The characteristic interplanar spacing of 0.32 nm observed in these fringes has been definitively attributed to the ZnO wurtzite structure [41], confirming the crystalline phase of the ZnONPs. Figure 2c illustrates an HRTEM image of a monolayer MoS₂ sheet, where several defects can be observed (highlighted with yellow circles). These defects are hypothesized to contribute to the enhanced catalytic activity of the material, as defect sites can serve as active sites for catalytic reactions. Although the nature and exact influence of these defects are currently under investigation in a separate study, it is likely that they were introduced during the rigorous chemical exfoliation process that the material underwent. The presence of these defects may alter the electronic properties of the MoS₂ monolayer, potentially leading to improved performance in catalytic applications [42]. Figure 2d shows a detailed HRTEM image of a SiNW, revealing its high crystallinity and a diameter of approximately 11-12 nm. The well-defined crystalline structure observed in the SiNW, which even reveals individual Si atoms, is indicative of a high-quality material, essential for applications where electronic properties are critical. The carbon nanotubes (CNTs) are not shown in the HRTEM images, as they are commercially sourced and have been extensively characterized. Given their well-documented properties, their detailed characterization was deemed unnecessary for this investigation.
Figure 3 shows the Raman spectra of CNTs, SiNWs, ZnONPs, MoS₂, and the 6.7%(MoS₂-SiNWs)@ZnONPs-CNTs catalyst. The CNTs (Figure 3a) exhibit two peaks at approximately 1338 cm⁻¹ and 1576 cm⁻¹, corresponding to the D band, which is associated with the presence of defects in the material, and the G band, respectively, both of which are characteristic of carbon nanotubes [43]. Figure 3b shows the Raman spectrum of the SiNWs, showing a characteristic peak at approximately 518 cm⁻¹, which can be attributed to the first-order phonon mode [44]. The Raman spectrum of ZnONPs (Figure 3c) displays distinct peaks at ca. 327 cm⁻¹, 437 cm⁻¹, 560 cm⁻¹, and a broad band around 1160 cm⁻¹. The 327 cm⁻¹ peak is attributed to the second-order Raman spectrum, while the 437 cm⁻¹ peak is assigned to the E2 modes of Zn motion, corresponding to the characteristic band of the wurtzite phase [45,46]. The 560 cm⁻¹ band is associated with the E1 mode, typically originating from second-order Raman scattering, and the broad band at 1160 cm⁻¹ is attributed to overtones and/or combination bands [45,46,47]. The Raman spectrum of MoS₂ (Figure 3d) shows two characteristic bands at approximately 384 cm⁻¹ and 408 cm⁻¹, which have been assigned to the E¹₂g and A₁g modes, respectively [48]. These bands are indicative of the exfoliation process and the formation of MoS₂ flakes with few layers [49,50]. The 6.7%(MoS₂-SiNWs)@ZnONPs-CNTs catalyst (Figure 3e) exhibits peaks corresponding to the various components within the sample, albeit with differing intensities due to the proportions of the components in the catalyst. The detection of significant peaks from all catalyst components confirms the heterostructured nature of the composite.
Figure 4 shows the X-ray diffraction (XRD) patterns of the 6.7%(MoS₂-SiNWs)@ZnONPs-CNTs catalyst, along with the individual XRD patterns of ZnONPs, CNTs, SiNWs, and MoS₂ for comparison purposes. The diffraction peaks observed for ZnONPs (Figure 4a) can be clearly indexed to the hexagonal wurtzite ZnO phase, which dominates the diffraction pattern of the 6.7%(MoS₂-SiNWs)@ZnONPs-CNTs catalyst, as shown in Figure 4e. The strong and distinct reflections are indicative of the crystalline nature of the ZnONPs and confirm their predominant presence within the composite catalyst [51]. The XRD pattern of CNTs (Figure 4b) reveals several peaks, which have been assigned to the (002) and (100) reflections characteristic of single-walled carbon nanotubes [52]. These reflections are consistent with the graphitic structure of CNTs, confirming their structural integrity within the composite. The diffraction pattern of SiNWs (Figure 4c) exhibits very weak intensities, characterized by three faint reflections assigned to the (111), (220), and (311) planes [53]. These weak reflections are typical of highly homogeneous and crystalline silicon nanowires, similar to those employed in this study. The low intensity of these peaks can be attributed to the small size and high dispersion of the SiNWs within the catalyst matrix. The MoS₂ XRD pattern (Figure 4d) displays multiple diffraction peaks located at approximately 32°, 36°, 39°, 49°, and 58°, corresponding to the (100), (102), (103), (105), and (110) crystalline planes of the 2H-type MoS₂ hexagonal phase, in accordance with the JCPDS # 75-1539 standard [48,54,55]. These reflections confirm the hexagonal crystalline structure of the MoS₂ layers used in the catalyst preparation. In Figure 4e, the XRD pattern of the 6.7%(MoS₂-SiNWs)@ZnONPs-CNTs catalyst is shown, highlighting the diffraction peaks of the composite’s constituents. To facilitate the identification of each component, a consistent color-coding scheme has been employed across the figures. The XRD pattern is dominated by the intense peaks from ZnONPs, the major component of the catalyst. Additionally, a minor peak at a low angle can be attributed to the presence of CNTs. The absence of discernible peaks from other components, such as MoS₂ and SiNWs, in the catalyst’s XRD pattern can be explained by the high degree of dispersion and the relatively low proportions of these materials within the composite. This high dispersion effectively reduces the crystallite size to the point where the diffraction signals from these components are below the detection limit of the XRD technique, further emphasizing the successful integration and distribution of the various components in the catalyst structure.
The representative elements of the most efficient catalyst, 6.7%(MoS₂-SiNWs)@ZnONPs-CNTs, were thoroughly characterized by X-ray photoelectron spectroscopy (XPS). The Zn2p spectrum (Figure 5a) reveals two distinct components at binding energies of 1044.2 eV and 1020.5 eV, corresponding to the Zn2p1/2 and Zn2p3/2 transitions of Zn²⁺, respectively [56]. The characteristic spin-orbit splitting of 23.7 eV confirms the oxidation state of Zn as Zn²⁺ [56]. Both transitions exhibit high symmetry, and attempts to fit the data to other possible zinc states yielded no significant results, thereby ruling out any additional contributions from other oxidation states. Figure 5b shows the O1s transition, which displays a clear asymmetry. This transition has been deconvoluted into three components at approximately 530.1, 532.3, and 535.3 eV. The peak at 530.1 eV is attributed to O²⁻ species within the ZnO lattice, indicating the presence of oxygen in a well-defined crystalline environment [57]. The component at 532.3 eV is assigned to O²⁻ in oxygen-deficient regions, suggesting the presence of defects or non-stoichiometric areas within the ZnO structure [57]. The highest binding energy peak at 535.3 eV likely corresponds to species generated by the interaction of ZnO nanoparticles with other components in the catalyst, possibly indicating surface modifications or interactions with other phases [57]. The C1s spectrum (Figure 5c) is also asymmetric and has been deconvoluted into two components at approximately 284.7 eV and 286.7 eV. The dominant peak at 284.7 eV is assigned to sp²-hybridized carbon, characteristic of the CNTs present in the catalyst [56,58]. The secondary peak at 286.7 eV is attributed to C-OH groups, likely arising from structural defects in the CNTs, which could be introduced during the synthesis or functionalization process [58]. The Mo3d and S2s transitions are presented in Figure 5d. The Mo3d spectrum features two well-defined and symmetrical peaks at 232.1 eV and 228.9 eV, corresponding to the Mo3d3/2 and Mo3d5/2 doublet, respectively [56]. These peaks are indicative of the Mo⁴⁺ state in MoS₂, confirming the presence of MoS₂ as a component of the catalyst [59,60]. Additionally, a peak observed at approximately 226.4 eV is attributed to the S2s transition, further confirming the presence of MoS₂ within the catalyst [59]. The Si2p transition, as shown in Figure 5e, exhibits two deconvoluted peaks. The most intense peak, observed below 100 eV, is clearly asymmetric and was deconvoluted into two peaks at 99.8 eV and 99.2 eV. These peaks correspond to the Si2p1/2 and Si2p3/2 transitions of elemental silicon (Si) [56], with a characteristic spin-orbit coupling of approximately 0.6 eV. Additionally, a less intense peak at 103.7 eV is assigned to oxidized silicon (SiOx) [56], which likely originates from the surface oxidation of the silicon nanowires (SiNWs). This oxidation could be a result of exposure to ambient conditions or interactions with other components within the catalyst.
Diffuse reflectance spectroscopy was used to characterize both the precursors and the catalysts. The reflectance data, expressed in Kubelka-Munk units, enabled the determination of bandgaps via Tauc plots (see Figure 6). The bandgap energy of the wurtzite phase of ZnO is typically around 3.37 eV [61], but the synthesized ZnO nanoparticles (ZnONPs) exhibited a slightly lower bandgap of 3.26 eV, likely due to variations in morphology and particle size, which influence the semiconductor’s properties. Incorporating carbon nanotubes (CNTs) into the ZnONPs further reduced the bandgap to 2.90 eV (Figure 6b), a result expected from the interaction between ZnONPs and CNTs, which modifies the composite’s electronic structure [62]. MoS₂, with a bandgap of approximately 2.5 eV [63], is known to shift the bandgap towards the visible region when forming heterostructures [63]. Similarly, silicon nanowires (SiNWs) exhibit a bandgap ranging from 1.5 to 1.8 eV, depending on their diameter [64]. The MoS₂-SiNWs adduct (Figure 6e) displayed a bandgap of 2.67 eV, which aligns with the results observed in the catalysts (Figure 6c and 6d). The 5%(MoS₂-SiNWs)@ZnONPs-CNTs catalyst showed a bandgap of 2.87 eV, placing it within the visible spectrum, and this shift was further shifted to 2.83 eV in the 6.7%(MoS₂-SiNWs)@ZnONPs-CNTs catalyst. The incorporation of SiNWs, like MoS₂, consistently reduced the bandgap, enhancing visible light absorption and catalytic efficiency. The results in Figure 6 demonstrate that these catalysts effectively utilize visible light for catalytic processes, a conclusion further supported by hydrogen evolution reaction (HER) results to be discussed later.
3.1.2. Photocatalytic Hydrogen Production
Before proceeding to the characterization of these catalysts in the hydrogen production reaction from water, an investigation into the optimal process conditions was conducted. For this investigation, the catalyst that exhibited the highest efficiency, namely 6.7%(MoS2-SiNWs)@ZnONPs-CNTs, was selected. The impact of the medium’s pH (Figure S1) and catalyst loading (Figure S2) was evaluated. The optimal conditions were found to be pH=7 and a catalyst loading of 60 mg/100 mL. Control experiments (Figure S3) were also performed to determine whether the reaction could occur without light, thus distinguishing between purely catalytic and photocatalytic processes. As shown in Figure S3, the hydrogen production mechanism is predominantly photocatalytic, but in the absence of light, a small hydrogen yield of approximately 83 μmol/hg was observed, attributable solely to catalysis.
Figure 7 shows the results for hydrogen production via photocatalysis using the different materials studied. The photocatalytic efficiency was measured using Na2SO3 (0.02 M) and Na2S (0.4 M) as sacrificial agents. Activities were tested under different irradiation wavelengths of 220, 280, 320, 400, 500, 600, and 700 nm for all samples.
As illustrated in Figure 7, the base material (ZnONPs-CNTs) exhibits significant activity in the visible region, specifically between 400 and 500 nm (Figure 7a). When 5% of MoS2-SiNWs (comprising 3.3% MoS2 and 1.7% SiNWs) is added to this composite, there is a substantial increase in hydrogen production (Figure 7b). This enhancement is not limited to the visible region but extends across the entire spectral range studied. Moreover, when the percentage of MoS2 is increased to 5% (5% MoS2 and 1.7% SiNWs), the hydrogen production sees an even more pronounced boost, with the maximum observed production reaching 3909 μmol/hg at 500 nm. This significant enhancement underscores the synergistic effect of both additives (MoS2 and SiNWs) in enhancing the catalytic performance of the material. The results demonstrate that the integration of MoS2 and SiNWs into the CNTs-ZnONPs framework not only broadens the active spectral range but also dramatically amplifies the efficiency of hydrogen generation. The pronounced activity in the visible spectrum, coupled with the remarkable overall increase in hydrogen production, highlights the potential of these hybrid materials in photocatalytic applications. The synergy between MoS2 and SiNWs appears to play a crucial role in improving the charge separation and light absorption properties, thereby leading to enhanced catalytic activity.
The photoelectrochemical properties of the different materials were investigated using a CHI660D electrochemical system in a 0.1 mol/L Na2SO4 solution (see Figure 8). Initially, 25 mg of the nanomaterial (either ZnONPs, CNTs-ZnONPs, 5%(MoS2-SiNWs)@ZnONPs-CNTs, or 6.7%(MoS2-SiNWs)@ZnONPs-CNTs) was dispersed in 3 mL of ethanol mixed with 10 μL of a 5 wt% Nafion solution. Then, 200 μL of this suspension was applied to a 1×1 cm² piece of Fluorine-doped Tin Oxide (FTO) conductive glass, which served as the working electrode. The setup included a saturated calomel electrode (SCE) as the reference electrode and a 1×1 cm² platinum sheet as the counter electrode. Transient photocurrent measurements were performed at a potential of 0.5 V (see Figure 8). Upon analysis, the transient photocurrent responses of the samples under cyclical light interruption at 500 nm revealed that ZnONPs exhibited a significantly lower photocurrent density compared to the CNTs-ZnONPs composite. However, when 5%(MoS2-SiNWs) were incorporated into this composite, a substantial enhancement in photocurrent was observed, with an increase up to almost 16 times the value shown by ZnONPs alone. This demonstrates that the addition of CNTs, and particularly the incorporation of MoS2-SiNWs, can effectively promote the dispersion of photo-induced carriers due to the formation of heterojunctions. This effect is even more pronounced when the MoS2 content is increased to 5% (5%MoS2-1.7%SiNWs), as seen in Figure 8d, where the hydrogen production under 500 nm radiation was analyzed. The results highlight the superior performance of the hybrid material, emphasizing its potential in enhancing photoelectrochemical processes. The creation of heterojunctions between the different components significantly improves charge separation and carrier mobility, thereby boosting the overall photocatalytic efficiency.
To further explore the impact of photogenerated carriers on hydrogen production, an additional study was performed using EDTA-Na2 as a hole (h+) scavenger. As shown in Figure S4, incorporating EDTA-Na2 into the reaction mixture led to a notable increase in hydrogen production for the most efficient catalyst, 6.7%(MoS2-SiNWs)@ZnONPs-CNTs, under irradiation across all tested wavelengths.
Previously presented results have already indicated that the catalysts in this study exhibit efficient electron-hole separation. However, the enhanced hydrogen production observed with the addition of EDTA-Na2 can be explained by the further reduction of electron-hole recombination, resulting in improved H2 generation. This additional scavenger study underscores the catalysts’ capability to maintain efficient charge separation and further optimizes their photocatalytic performance by mitigating recombination effects. The use of EDTA-Na2 provides a clearer understanding of the mechanisms at play and highlights the potential for further enhancing hydrogen production by fine-tuning the interaction between photogenerated carriers and scavengers.
A recyclability study of the most active catalyst, namely 6.7%(MoS2-SiNWs)@ZnONPs-CNTs, was conducted to assess its durability. The catalyst underwent 10 usage cycles. After each cycle, the catalyst was recovered from the reaction mixture via centrifugation at 5000 rpm for 15 minutes and subsequently washed through two centrifugation-washing cycles using water. The catalyst was then dried at 60°C for 4 hours in a vacuum oven before the next cycle. The results, as shown in Figure S5, indicate a noticeable decline in hydrogen production starting from the first cycle and continuing throughout the 10 cycles. After the final cycle, the measured H2 production was 3787 mol/hg, reflecting an efficiency drop of ca. 17%. This reduction in performance could be due to the potential leaching of MoS2-SiNWs during the catalyst’s use and regeneration processes. To further investigate this, a quantitative analysis of Mo and Si was performed using XPS (data not shown). Initially, the elemental composition of the catalyst (6.7%(MoS2-SiNWs)@ZnONPs-CNTs) was: Mo 3.05%, S 1.98%, C 14.42%, Si 1.61%, Zn 61.33%, and O 17.64%, which provided a Mo/O ratio of 0.172 and a Mo/Si ratio of 1.89. After the 10th cycle of catalyst use, the composition changed, resulting in elemental ratios of Mo/O ratio of 0.113 and Mo/Si ratio of 1.30. This confirmed the possible leaching of Mo after the use and regeneration of the catalyst, which may explain the observed loss of efficiency over the cycles of catalyst use and regeneration. The remaining chemical elements did not exhibit significant changes that could be associated with leaching processes.
To elucidate the underlying mechanism, a comprehensive photoluminescence (PL) study was conducted on ZnONPs, ZnONPs-CNTs, and the catalysts 5%(MoS₂-SiNWs)@ZnONPs-CNTs and 6.7%(MoS₂-SiNWs)@ZnONPs-CNTs (Figure S6). The photoluminescence spectrum of ZnONPs alone (Figure S6a) exhibits a strong emission, indicative of significant electron-hole recombination within the material, which could limit its photocatalytic efficiency. Upon incorporating CNTs into the ZnONPs (Figure S6b), there is a slight decrease in luminescence intensity. This reduction suggests that the CNTs facilitate charge separation by providing efficient pathways for electron transfer, thereby reducing the likelihood of recombination. The catalyst 5%(MoS₂-SiNWs)@ZnONPs-CNTs (Figure S6c) demonstrates a substantial reduction in fluorescence intensity, with the emission peak slightly red-shifted to approximately 547 nm. This red shift, coupled with the decreased PL intensity, aligns with the hypothesis that the introduction of MoS₂ and SiNWs into the heterostructure effectively suppresses electron-hole recombination. The red shift may also indicate enhanced electron transfer processes, as the formation of more effective catalytic sites within the heterostructure leads to improved photocatalytic activity. In the 6.7%(MoS₂-SiNWs)@ZnONPs-CNTs catalyst (Figure S6d), where the MoS₂ content is further increased, the fluorescence intensity decreases even further. The emission maximum remains nearly identical to that observed in Figure S6c, suggesting that the additional MoS₂ continues to enhance charge separation efficiency, but the system may have reached a saturation point where further increases in MoS₂ content do not significantly alter the emission properties. The findings from this photoluminescence study establish a clear correlation between the incorporation of various cocatalysts into the ZnONPs structure and the substantial reduction in electron-hole recombination processes. The enhanced charge separation efficiency, as evidenced by the decreased PL intensity and red shift, indicates that these catalysts are particularly effective at minimizing recombination losses. This, in turn, maximizes the availability of charge carriers for the hydrogen evolution reaction (HER), ultimately leading to superior catalytic performance.
Based on these results and the established bandgaps (see Figure 6), a catalytic mechanism has been proposed (Figure 9). The Mulliken electronegativity concept [65,66] was applied to determine the band edge positions of the catalyst’s components, which allowed for the identification of the pathways followed by the photogenerated charge carriers within the composite material (see Equations 1 and 2).
ECB=X−EC−0.5Eg
EVB=ECB+Eg
In these equations, ECB and EVB represent the conduction band (CB) and valence band (VB) edge potentials, respectively. X is the absolute electronegativity, and EC is the free electron energy on the hydrogen scale (4.50 eV) [67]. The values of X for ZnONPs, MoS₂, and SiNWs are 5.75 eV [68], 5.32 eV [69], and 4.3 eV [70], respectively. With a bandgap (Eg) of 3.26 eV for ZnONPs, the calculated conduction and valence band edge positions for ZnONPs are -0.38 eV and 2.88 eV, respectively. For MoS₂, the corresponding band positions are -0.43 eV for the CB and 2.07 eV for the VB. For SiNWs, the computed band edge positions are -0.98 eV and 0.58 eV, respectively. These calculations provide critical insights into the relative alignment of the energy bands, which is essential for understanding the flow of photogenerated electrons and holes within the composite.
Figure 9 presents a schematic representation of the proposed catalytic mechanism for the hydrogen evolution reaction (HER). In this mechanism, ZnONPs and MoS₂ serve as the primary light-absorbing materials, with bandgaps of 3.26 eV for ZnONPs and approximately 2.5 eV for MoS₂. When exposed to radiation, ZnONPs absorb photons, resulting in the excitation of electrons from the valence band (VB) to the conduction band (CB). The conduction band edge of ZnO is positioned at -0.38 eV, while its valence band edge is at 2.88 eV relative to the normal hydrogen electrode (NHE). The photogenerated electrons in the conduction band of ZnONPs are then transferred, possibly through a Z-scheme mechanism, to MoS₂. This alignment facilitates the efficient transfer of electrons from ZnO to MoS₂, enabling electron promotion across a broad range of wavelengths. Simultaneously, silicon nanowires (SiNWs), which may act as electron sinks as described in other studies, facilitate reduction processes leading to H₂ production. MoS₂ also serves as an active site where the reduction of protons (H⁺) occurs, ultimately producing hydrogen gas (H₂). This mechanism explains the effect of MoS₂ and SiNWs incorporation on the reduction of electron-hole recombination, as evidenced by photoluminescence studies. Additionally, carbon nanotubes (CNTs) play a critical role in this system by providing a conductive network that enhances electron transport from ZnONPs to MoS₂ and SiNWs. This network reduces electron-hole recombination, thereby improving the efficiency of charge separation. The integration of CNTs within the catalyst not only maintains structural integrity but also ensures that electrons are efficiently delivered to the active sites. As the photogenerated electrons are transferred through the composite, they participate in proton reduction to generate hydrogen. Meanwhile, the holes left in the valence band of ZnONPs may also engage in oxidation reactions, although the primary focus here is on the reduction processes that lead to hydrogen evolution.
As summary, the catalytic efficiency of the MoS₂-SiNWs-SWNTs@ZnONPs composites in hydrogen production, observed under 500 nm wavelength irradiation and yielding ca. 3909 µmol h⁻¹ g⁻¹, is notably high when compared with published results. This efficiency significantly surpasses that of simpler catalytic systems, such as MoS₂-TiO₂ nanocomposites, which achieved a maximum of 150.7 µmol h⁻¹ g⁻¹ for a composition containing 4.0 wt% MoS₂-TiO₂ [71]. Furthermore, even advanced MoS₂/g-C₃N₄ composites with an optimized flower-like MoS₂ structure reached only up to 867.6 µmol h⁻¹ g⁻¹ [72]. These results underscore the superior hydrogen production capability of the MoS₂-SiNWs-SWNTs@ZnONPs composites, attributed to the synergistic interaction among silicon nanowires (SiNWs), single-walled carbon nanotubes (SWNTs), and MoS₂ within a zinc oxide nanoparticle (ZnONP) matrix. The strategic integration of these components enhances electron transport and improves light absorption, resulting in significantly elevated photocatalytic activity under visible light. Nevertheless, despite the excellent performance of the MoS₂-SiNWs-SWNTs@ZnONPs composites, more complex ternary MoS₂-based systems can exhibit even higher catalytic efficiencies. For instance, MoS₂/ZnCdS/ZnS nanocomposites have demonstrated hydrogen production rates reaching up to 79.3 mmol g⁻¹ h⁻¹ [73], highlighting the potential for further enhancements in MoS₂-based photocatalytic systems through the inclusion of additional semiconductors and co-catalysts. These systems often benefit from multiple mechanisms of synergy between their components, such as improved charge carrier separation, a broadened light absorption spectrum, and efficient spatial separation of oxidation and reduction sites, all of which collectively contribute to their high performance. Our results suggest potential pathways for further optimizing the MoS₂-SiNWs-SWNTs@ZnONPs composite. Future work, which is already underway, aims to explore the integration of additional semiconductor materials that could introduce new charge separation mechanisms or further extend the light absorption range. Additionally, fine-tuning the proportions and distribution of MoS₂, SiNWs, and SWNTs within the composite could optimize the interface interactions and electronic properties, potentially leading to even higher rates of hydrogen production.
3.2. Li-Ion Batteries
3.2.1. Morphology of Electrodes
The morphology of the synthesized electrodes, including pure MoS₂, MoS₂@CNTs (80:20 wt.%), and MoS₂@SiNW@CNTs (56:24:20 wt.%) composites, was investigated by FESEM. The pure MoS₂ electrode consists of irregularly shaped flakes, predominantly measuring between 1 to 1.5 micrometers. FESEM images distinctly reveal the layered structure of these sheets, while Transmission Electron Microscopy (TEM) images confirm their nanoscale thickness, indicating the presence of nanometric steps. Upon the introduction of CNTs to the MoS₂ nanosheets (see Figure 10a), a thin network of nanotubes is observed to permeate through the MoS₂ layers, facilitating interconnection. The incorporation of SiNWs alongside CNTs does not markedly alter the overall morphology (Figure 10b); instead, it forms a denser network comprising SiNWs and CNTs, which envelops the MoS₂ layers, leading to the formation of a more uniform composite structure, as confirmed by Energy Dispersive X-ray Spectroscopy (EDX) analysis (Figure 11).
The integration of CNTs and SiNWs into MoS₂ is anticipated to significantly enhance the electrochemical performance of the resultant electrodes. Pure MoS₂ exhibits a tendency to aggregate, which compromises its performance during cycling. The inclusion of CNTs enhances the electrical conductivity, thereby improving electron transport within the electrode and enabling faster charge/discharge rates. This improved conductivity is expected to result in superior electrochemical performance, including increased specific capacities and enhanced rate capabilities. Moreover, the incorporation of SiNWs within the MoS₂ matrix aids in mitigating aggregation during charge and discharge cycles, particularly under high current densities. This is achieved by providing structural stability, which prevents issues such as layer exfoliation and material degradation. Consequently, the combined presence of CNTs and SiNWs not only reduces volume expansion and aggregation but also enhances the capacity and stability of the electrode material. These findings suggest that the incorporation of CNTs and SiNWs contributes to improved stability and longevity of the composite under high energy density conditions. Additionally, these composites offer the advantage of tunability, allowing for optimization of conductivity, capacity, and mechanical strength to meet specific application requirements. Overall, MoS₂-based composites reinforced with CNTs and SiNWs are promising candidates for high-performance applications in energy storage and conversion technologies [74,75,76].
3.2.2. Electrochemical Study
The electrochemical performance of MoS₂-based electrodes as an anode material for Li-ion batteries was investigated through galvanostatic charge/discharge (GCD) cycling. Initially, exfoliated pure MoS₂ was tested by cycling coin cells in a half-cell configuration. In the first discharge curve (Figure 12), recorded at a current density of 100 mA/g, two distinct plateaus were observed at 1.09 V and 0.56 V, corresponding to the initial insertion of lithium ions with the formation of LixMoS₂ and the subsequent formation of lithium sulfide (Li₂S) along with the Solid Electrolyte Interphase (SEI) layer, respectively [77,78,79]. A specific capacity of 856 mAh/g was achieved; however, no further transitions were detected during the charge cycle, indicating the absence of a reversible process. These results show the irreversible behavior of pure MoS₂, likely due to the agglomeration of MoS₂ sheets, the formation of a non-conductive SEI, and insufficient electrical conductivity. Additionally, the SEI may have exhibited high electrical resistance and instability, further contributing to the rapid capacity fade observed. To address the issues observed with pure MoS₂, a composite of MoS₂ and carbon nanotubes (MoS₂@CNT, 80:20 wt.%) was tested in new cells. The introduction of CNTs with the MoS2 active material enabled the reversibility of the electrodes, as shown in Figure 12. The first discharge curve exhibited longer plateaus at 1.14 V and 0.56 V, with charging transitions around 2.2 V, indicating clear redox processes and high reversibility.
Figure 13a illustrates the enhanced electrochemical performance obtained in MoS₂@CNT composite electrode, which demonstrated superior stability over 25 cycles at a current density of 100 mA/g. The composite electrode achieved a high specific capacity of 1278 mAh/g during the first discharge, with a corresponding charge capacity of 1112 mAh/g, resulting in a coulombic efficiency of 93.83%. Moreover, the electrode showed excellent cycling performance, maintaining a stable specific capacity around 1100 mAh/g, with a coulombic efficiency of 99.67%, after 25 cycles. Following this, the rate performance of the MoS₂@CNT composite electrode was evaluated at various current densities (Figure 13b), including 0.2, 0.5, 1.0, and 2.0 A/g, before returning to 0.1 mA/g. At these higher current densities, the electrode exhibited reversible capacities of 1000, 700, 500, and 350 mAh/g, respectively. Notably, upon reverting to the lower current density of 0.1 mA/g, the electrode demonstrated a remarkable recovery of its capacity to 1080 mAh/g, which is close to its initial value. This result highlights the excellent rate capability and cycling stability of the MoS₂@CNT composite, indicating its robust performance and ability to maintain high capacity even under varying charge and discharge conditions. All these significant performance enhancements can be attributed to the increased electrical conductivity and structural stability provided by the CNTs [80], which support and stabilize the MoS₂ sheets and facilitate the reversibility of redox processes in the battery. Following the favorable electrochemical performance observed in the MoS₂@CNTs composite, extended cycling tests were conducted at a higher current density of 1 A/g. Figure 13c illustrates the GCD curves of these composites in red symbols. The first two cycles were performed at a low current density of 0.1 A/g to ensure the formation of a stable SEI layer on the electrodes. The remaining cycles, up to 100, were measured at the higher current density of 1 A/g. The GCD curves of the MoS₂@CNTs composite reveal the strong reduction of the specific capacity (from 970 to 520 mAh/g) from 0.1 A/g to 1 A/g, and a significant decline over cycling, with the capacity decreasing from 500 to 400 mAh/g during the first 25 cycles and reaching around 350 mAh/g after 100 cycles. To develop electrodes with enhanced capacity and shorter cycling times, alternative composites were proposed. New composites incorporating silicon nanowires (SiNWs) were investigated, with composition MoS₂@SiNW@CNT (56:24:20 wt.%). These new composites showed significant improvements in both stability and capacity compared to the previous materials. Figure 13c also illustrates the electrochemical performance of the MoS₂@SiNW@CNT composite (blue symbols) under the same cycling conditions as the MoS₂@CNT electrode. A significant increase in specific discharge capacity is observed, reaching 2330 mAh/g in the first cycle and 1915 mAh/g in the second cycle at 0.1 A/g, despite an irreversible loss of capacity. The composite demonstrates good performance at high current density, with a gradual decrease in capacity from 1400 to 1000 mAh/g during the first 30 cycles at 1 A/g, followed by excellent cyclic stability over extended cycling periods, maintaining a capacity of 990 mAh/g up to the 100th cycle.
When dealing with two active materials like Si and MoS₂ in a composite electrode, it is crucial to accurately calculate the overall specific capacity. This is influenced by the individual capacities of Si and MoS₂ and their respective weight fractions in the composite. Si offers a much higher theoretical specific capacity (4200 mAh/g) compared to MoS₂ (669 mAh/g) [81,82]. Therefore, determining the ratio of Si to MoS₂ is essential for predicting and optimizing the composite’s electrochemical performance. Additionally, it is important to consider how the distribution and interaction of these materials within the electrode impact the actual specific capacity during cycling. Taking into account the proportion of each active material, the MoS₂@SiNW@CNT (56:24:20 wt.%) composite cycled at 1 A/g corresponds to 0.578 C. This C-rate is equivalent to 1.5 C for the MoS₂@CNT (80:20 wt.%) composite, which cycles at a current density of 386.5 mA/g (~0.4 A/g). A realistic comparison in specific capacities, under the same C-rate and cycling conditions, shows that introducing SiNWs into MoS₂@CNT, changing the active material composition from 100% MoS₂ to 70% MoS₂ and 30% SiNWs, leads to a capacity increase from 800 mAh/g for MoS₂@CNT (see Figure 13b for rates between 0.2 A/g and 0.5 A/g) to 1000 mAh/g for MoS₂@SiNW@CNT (see Figure 13c at 1 A/g). The incorporation of SiNWs and MoS₂ into the composite, combined with CNTs, significantly enhances the electrochemical performance by creating a more robust electrode structure. This synergy between MoS₂, SiNWs, and CNTs results in a 20% increase in specific capacity (at equivalent C-rates) and, most importantly, enables long cycling at high current densities, effectively overcoming the limitations observed in MoS₂@CNT composites. The electrochemical performances of both MoS₂@CNT and MoS₂@SiNW@CNT composites were investigated by cyclic voltammetry (CV). Representative CV of composites after long cycling at high current density, in the voltage range of 0.01–3.0 V at a scan rate of 0.2 mV/s are shown in Figure 13d. Distinct peaks are observed, corresponding to the reactions of the active materials: layered MoS₂ (indicated by red voltage values) and Si nanowires (indicated by blue voltage values), as explained below. For the MoS₂@SiNW@CNT electrode, voltammetry of the first and second cycles was also recorded, as shown in Figure 13e. During the initial discharge (pink curve, Figure 13e), the reduction process (cathodic sweep) in the MoS₂@SiNW@CNT composite primarily exhibits behavior characteristic of reactions of MoS₂ with Li, as indicated by the presence of two distinct reduction peaks. Specifically, a minor reduction peak at 0.93 V and a more pronounced reduction peak at 0.43 V, suggesting a complex multi-step reduction process. The 0.93 V peak is likely due to the transition of MoS₂ from a trigonal prismatic to an octahedral structure as lithium ions intercalate, consistent with previous reports [83], it is a two-phase transition and, consequently, the peak is narrow. The 0.43 V reduction peak is attributed to the conversion of MoSₓ into Mo nanoparticles within a Li₂S matrix process [84] and the formation of the Solid Electrolyte Interphase (SEI) layer. The peak at 0.43 V does not appear at subsequent cycles (see Figure 13d). This absence indicates these reactions are predominantly irreversible. After the first cycle, the electrode’s structure, including MoS₂ and SiNWs, undergoes significant changes, leading to the formation of a stable SEI layer and altering the electrochemical response in later cycles. Also, it should be noted that this specific CV curve (pink curve, Figure 13e), starts at 1.4 V, so any additional step-down peaks occurring at higher voltages may be present but are not captured in the plot. On the oxidation curve (anodic sweep) of the first cycle, two small peaks at low voltages, 0.29 V and 0.48 V, indicate the oxidation processes of Li and Si. The peak at 0.29 V is likely related to the oxidation of lithium (Li), where lithium ions (Li⁺) are released into the electrolyte, possibly forming lithium compounds such as Li₂O or Li₂CO₃ on the electrode surface. The peak at 0.48 V corresponds to the oxidation of silicon (Si), where silicon reacts with lithium ions (Li⁺) to form lithium silicides (Li₄Si or similar compounds) or other lithium-silicon intermetallic [85]. Additionally, a prominent peak at 2.31 V is observed, associated with the re-oxidation of molybdenum and lithium sulfide back to MoS₂, indicating the regeneration of the MoS₂ structure from Mo and Li₂S.
In the second discharge/charge cycle (blue curve, Figure 13e) of MoS₂@SiNW@CNT, a new reduction peak appears at 1.96 V that was not recorded in the first cycle, as indicated above. This peak may correspond to the formation of new lithium intercalation compounds or phases that develop as the electrode material evolves during cycling. The narrow peaks observed in the first cycle at 0.93 V and 0.43 V become rounded, decrease in intensity, and shift slightly to 1.14 V and 0.40 V, respectively. Such changes are commonly attributed to the alteration of the electrode’s microstructure and the formation of SEI layers that affect peak characteristics over multiple cycles. For the oxidation curve, only a small decrease in the intensity of the peak at 2.3 V is observed, reflecting the reversible behavior of the electrode and indicating that the re-oxidation process of MoS₂ is largely preserved despite cycling.
Each representative peak observed in the CV curves of the MoS₂@SiNW@CNT composite corresponds to the distinct intercalation and conversion reactions of MoS₂ and Si during discharge and charge, as detailed below (refer to Figure 13d for a visual representation).
- (1) xLi+ + xe- + MoS2 → Li xMoS2
- (1b) Li xMoS2 + (4 - x) Li++ (4 - x)e- → Mo + 2Li2S
- (2) xLi+ + xe- + Si (crystalline) → LixSi (amorphous)
- (3) LixSi (amorphous) + (3.75-x)Li+ +(3.75 - x)e- → Li15Si4 (crystalline)
- (4) Li15Si4 (crystalline) → 4Si (amorphous) + 15Li+ + 15e-
- (5) Li2MoS2 → MoS2 + 2Li+ + 2e-
- (6) Mo + 2Li2S → MoS2 + 4Li+ + 4e-
- Reduction (Cathodic sweep)
- (1) Reduction Peak at 1.9 V: This peak corresponds to the initial insertion of lithium ions into the MoS₂ structure. During this stage, MoS₂ undergoes a phase transformation, where Li ions intercalate into the MoS₂ layers, leading to the formation of LixMoS₂. This process is reversible and is characteristic of the layered structure of MoS₂.
- (1b) Reduction Peak at 1.3 V: This peak is associated with the further reduction of MoS₂ to form lithium sulfide (Li₂S) and metallic molybdenum (Mo).
- (2,3) Small reduction peak at 0.14 V: The reactions of Si and Li occur at low voltages [90] and may not be clearly detected in CV reduction curves recorded at 0.2 mV/s. The lithiation of silicon nanowires follows reaction (2) and is observed only in the first cycle. Subsequently, more Li is incorporated into the amorphous alloy LixSi, following reaction (3). These transformations are evident in the oxidation curves, where corresponding peaks are observed, and are clearly seen in the dQ/dV derivative curves from GCD (see Figure S7). These dQ/dV curves are essential for detecting redox transitions in electrochemical systems, revealing subtle voltage changes linked to oxidation and reduction processes and providing insights into the material’s redox behavior and stability during cycling. Therefore, the small peak at 0.14 V is attributed to reaction (3), representing the lithiation of silicon nanowires.
- Oxidation (Anodic sweep)
- (4) Oxidation peaks at low voltages (0.34 and 0.52 V): These peaks indicate the initial delithiation of lithium silicide (LixSi) and are observed exclusively in the MoS₂@SiNW@CNT composite (blue curve in Figure 13d). The peak at 0.34 V is likely associated with the delithiation of LiSi, where lithium is extracted from the silicon component, leading to the formation of silicon (Si) and the corresponding release of lithium ions (reaction 4). Similarly, the peak at 0.52 V may reflect the delithiation of intermediate phases or lithium silicide compounds, suggesting that multiple stages of lithiation and delithiation occur. These processes are characteristic of the interactions between lithium and silicon nanowires within the composite, highlighting the active role of Si in the electrochemical behavior of the MoS₂@SiNW@CNT composite. The observation of these peaks only in the composite indicates that the presence of SiNWs significantly impacts the electrochemical response, distinguishing it from other materials like MoS₂ alone.
- (5, 6) Oxidation peaks at higher voltages (1.45 and 2.45 V): The peak at 1.45 V corresponds to the initial delithiation of the LixMoS2 phase, where lithium ions are extracted (reaction 5), reversing the intercalation process. This process may not completely revert to the original MoS₂ structure, leading to partial reformation of the MoS2 phase. The peak at 2.45 V is associated with the re-oxidation of molybdenum and lithium sulfide back to MoS₂ (reaction 6), indicating the regeneration of the MoS₂ structure from Mo and Li₂S. This peak represents the final oxidation step, completing the delithiation process and restoring the electrode to its original state.
As previously mentioned, the reactions of Si and Li are well-defined in the differential capacity (dQ/dV) curves derived from GCD profiles. Figure S7b shows the dQ/dV curves for MoS₂@SiNW@CNT at a current density of 0.1 A/g. Reduction/oxidation transitions are observed around 0.3/0.4 V and 0.2/0.3 V, respectively, which are attributed to the electrochemical redox reactions of Si. These observations are consistent with the results obtained using pure SiNW electrodes (without MoS₂ and CNT) [91]. Accordingly, the peaks at low voltages are absent in MoS₂@CNT (Figure S7a, 0.1 A/g MoS₂@CNT). The transitions of MoS₂ occurs at higher voltages and are present in both composites’ electrodes, with redox transitions around 1.9/2.3 V and 1.1/1.7 V. It is worth noting that as cycling progresses, the main peaks for redox (1.9/2.3 V) undergo more significant changes in decreasing/increasing intensities and shift to lower/higher voltages in the MoS₂@CNT electrodes compared to the MoS₂@SiNW@CNT electrodes, indicating that the SiNW structure helps stabilize the redox behavior, potentially leading to enhanced cycling stability and performance of the composite material.
Finally, it is important to note that the transitions are also observed when cycling at a high current density (1 A/g) (Figure S7c). However, the double peaks at low voltages merge into a single, more rounded peak. The good recyclability and stability of the MoS₂@SiNW@CNT composite are still evident, as indicated by the minimal variation in voltages and slight changes in the intensities of the peaks corresponding to the redox transitions of MoS₂ up to the 50th cycle.
The electrochemical impedance spectroscopy (EIS) plots of pure MoS₂ and the MoS₂@SiNW@CNT composite before cycling are shown in Figure 13f. It is evident that the conductivity of MoS₂ is much lower than that of MoS₂@SiNW@CNT, as indicated by the two different X scales of the figure, which reveal a charge transfer resistance more than seven times higher for MoS₂ compared to MoS₂@SiNW@CNT. During the electrochemical reaction, the SiNWs and CNTs enhance the conductivity of MoS₂ and reduce the charge transfer resistance, potentially leading to faster Li-ion diffusion and improved electrochemical performance, as discussed earlier. After the first CV cycle, EIS measurements were also recorded for the MoS₂@SiNW@CNT electrode, showing an impressive reduction in resistance by almost five times. This significant decrease in resistance underscores the effectiveness of the SiNW and CNT components in enhancing the overall conductivity and performance of the composite material. This innovative composite integrates MoS₂ and CNTs with SiNWs. The synergy between these materials leverages their individual advantages: MoS₂ serves as the main active material, providing significant electrochemical activity and capacity; CNTs enhance structural stability and conductivity, as previously corroborated; and SiNWs contribute additional capacity, electrochemical activity, and stability at high current densities. The performance of these new composites demonstrated significant improvements over the previous materials. Specifically, they exhibited enhanced stability during extended cycling and a notable increase in capacity. The improved performance attributes make MoS₂@SiNW@CNTs a promising candidate for advanced electrode materials in high-capacity and high-performance energy storage applications.
3.3. Postmortem Study
A postmortem study of the electrodes was conducted using SEM imaging and Ion Beam Analysis techniques as Nuclear Reaction Analysis (NRA measurements) [92]. Figure S8 presents cross-sectional SEM images of pristine MoS₂@CNT (80:20 wt.%) (a) and MoS₂@SiNW@CNT (56:24:20 wt.%) (c) composites. After subjecting the cells to 100 charge/discharge cycles at a high current density of 1 A/g, the batteries were disassembled as outlined in the experimental section, and the cycled electrodes were analyzed (Figure S8b and S8d, respectively). SEM analysis of the cycled electrodes reveals a marked increase in electrode thickness compared to the pristine samples, indicating significant volumetric expansion. This substantial thickening is likely due to the formation of a thick solid-electrolyte interphase (SEI) layer. Figure 14 shows the spectra of the postmortem electrodes, obtained using 3-MeV H⁺. The total spectrum has been divided into two graphs: one highlighting the Li signal obtained through Nuclear Reactions (i.e., the NRA spectrum at higher energies) and another showing the region below 3 MeV, which represents the RBS processes where the other elements are observed. This setup allows for the determination of the concentration depth profile of Li atoms. A quantitative analysis of the Li depth profiles was performed using SIMNRA simulations, with both experimental and simulated data plotted in the corresponding graphs. For the MoS₂@CNTs (80:20 wt.%) composite (Figure 14a), the SIMNRA simulations yielded the following atomic concentrations: 22.5% Li, 24.3% C, 21.1% O, 25.3% F, 4.5% S, and 2.23% Mo. These changes correspond to mass increases of 35.08% from Li, 45.18% from excess C, 75.13% from O, and 107.17% from F. For the MoS₂@SiNW@CNTs (56:24:20 wt.%) composite (Figure 14b), the NRA spectra results indicate a slightly higher concentration of Li after cycling. The presence of Si is less clear, potentially due to dilution effects, and no signals for F or Fe are detected. However, there is a noticeable increase in carbon concentration beyond the expected value, as well as a significant amount of oxygen. The atomic concentrations obtained are 28.9% Li, 21.7% C, 35.0% O, 0% F, 5.8% Si, 5.8% S, and 2.9% Mo. The corresponding mass increases relative to the original composition are 27.5% due to Li, 8.4% due to increased C, and 76.7% due to O (Table S2). For both electrodes, it is observed that Li has penetrated significantly into the bulk volume, according with the good performance exhibited for the corresponding batteries. The introduction of SiNWs into the composite seems to further enhance this penetration, suggesting an improvement in the electrochemical behavior. The concentrations of Mo and S align well with those expected for MoS₂, confirming the integrity of the MoS₂ structure post-cycling. However, the excess carbon detected could be due to carbonaceous byproducts formed during cycling, such as those from the solid electrolyte interphase (SEI) or electrolyte decomposition. Additionally, the cleaning process with DMT may have increased surface reactivity, leading to further carbon adsorption, especially when exposed to the atmosphere. This combination of intrinsic material reactivity and post-cleaning atmospheric contamination likely contributes to the observed excess carbon, though it is less likely to explain the uniform distribution across the entire electrode volume. This increase in carbon, while unexpected, does not appear to adversely affect the battery performance, which remains strong. These results highlight the effectiveness of the prepared electrodes, particularly the MoS₂@SiNW@CNTs composite, in maintaining structural integrity and facilitating efficient Li diffusion, making them promising candidates for high-performance lithium-ion batteries.
4. Conclusions
The study successfully demonstrated the synthesis and performance evaluation of MoS₂-SiNWs-SWNTs@ZnONPs nanocomposites for HER and MoS₂-SiNWs-SWNTs composites for Li-ion battery applications. For HER, the integration of MoS₂, SiNWs, and CNTs into a ZnO nanoparticle (ZnONP) matrix resulted in a significant enhancement in catalytic efficiency under visible light irradiation. The optimized composite, containing 6.7% MoS₂-SiNWs, achieved an impressive hydrogen production rate of approximately 3909 µmol h⁻¹ g⁻¹ under 500 nm light, more than 40 times higher than pristine ZnONPs. This improvement is due to the synergistic effects of the materials, which enhance charge separation, extend the absorption spectrum into the visible range, and provide more active sites for the HER. MoS₂ played a key role in enhancing the photocatalytic efficiency, while the combination with SWNTs and SiNWs further improved electron transport and stability, making the composite highly effective for practical hydrogen production. In contrast, for lithium-ion batteries, the study focused on the MoS₂-SiNWs-SWNTs composites without ZnONPs as electrode materials. These composites exhibited excellent electrochemical performance, particularly in terms of specific capacity and cycling stability. The MoS₂@SiNWs@SWNTs composite (56:24:20 wt.%) demonstrated a high specific capacity of up to 1000 mAh g⁻¹ after 100 cycles at a current density of 1 A g⁻¹. The integration of SiNWs provided mechanical stability, mitigating issues such as volume expansion and aggregation that typically affect the cycling performance of silicon-based electrodes. Meanwhile, the inclusion of SWNTs enhanced electrical conductivity, improving electron transport during charge/discharge cycles and contributing to higher capacity retention.
Despite these promising results, challenges remain, particularly in the durability of the HER catalysts, where a decline in hydrogen production was observed after several cycles. This degradation is likely due to the leaching of MoS₂ during operation and regeneration. Future work should focus on improving the stability of the composites, possibly through the addition of stabilizing agents or surface modifications to prevent material loss. Additionally, exploring alternative co-catalysts or semiconductor materials may further enhance both the photocatalytic and electrochemical performance of the composites. In conclusion, the MoS₂-SiNWs-SWNTs@ZnONPs nanocomposites for HER and the MoS₂-SiNWs-SWNTs composites for lithium-ion batteries offer significant potential as dual-function materials for sustainable energy applications. Their demonstrated efficiency in hydrogen production and energy storage underscores their versatility and value in the development of renewable energy technologies. Future efforts should aim to optimize these composites further, focusing on improving their long-term stability and scalability for practical, large-scale applications
Supplementary Materials
The following supporting information can be downloaded at the website of this paper posted on Preprints.org, Table S1. BET surface area of different composites; Table S2. Elemental composition of MoS₂@SiNWs@CNT and MoS₂@CNT electrodes after 100 charge/discharge cycles, measured by Nuclear Reaction Analysis (NRA); Figure S1. Effect of pH on the photocatalytic activity of the 6.7%(MoS2-SiNWs)@ZnONPs-CNTs catalyst for hydrogen production; Figure S2. Evaluation of the initial concentration of the 6.7%(MoS2-SiNWs)@ZnONPs-CNTs catalyst on the efficiency of hydrogen production; Figure S3. Control experiments for 6.7%(MoS2-SiNWs)@ZnONPs-CNTs on the efficiency of hydrogen production; Figure S4. Hydrogen production via water splitting using 6.7%(MoS2-SiNWs)@ZnONPs-CNTs under irradiation, and also in the presence of a hole scavenger, namely EDTA-Na2; Figure S5. Recyclability of 6.7%(MoS2-SiNWs)@ZnONPs-CNTs after 10 consecutive catalytic cycles of hydrogen production, under irradiation at 500 nm; Figure S6. Photoluminescence of ZnONPs (a); ZnONPs-CNTs (b); 5%(MoS2-SiNWs)@ZnONPs-CNTs (c); and 6.7%(MoS2-SiNWs)@ZnONPs-CNTs (d), by a 350 nm excitation at room temperature; Figure S7. Differential capacity (dQ/dV) curves for (a) MoS₂@CNT at 0.1 A/g, (b) MoS₂@SiNW@CNT at 0.1 A/g, and (c) MoS₂@SiNW@CNT at 1 A/g; Figure S8. Cross-sectional SEM images of pristine and cycled electrodes: (a) MoS₂@CNT (80:20 wt.%) before cycling, (b) MoS₂@CNT after 100 cycles at 1 A/g, (c) MoS₂@SiNW@CNT (56:24:20 wt.%) before cycling, and (d) MoS₂@SiNW@CNT after 100 cycles at 1 A/g.
Author Contributions
Conceptualization, C.M., and F.M.; methodology, C.M., and F.M.; formal analysis, C.M., J.D., A.M., and F.M.; investigation, C.M., F.M., A.M., M.C., J.D., C.P.; resources, C.M., F.M., M.C., A.M., C.P.; writing—original draft preparation, C.M., and F.M.; writing—review and editing, C.M., A.M., and F.M.; supervision, C.M., and F.M.; project administration, C.M. and F.M.; funding acquisition, C.M., C.P., and F.M. All authors have read and agreed to the published version of the manuscript.
Funding
The authors gratefully acknowledge financial support from the NSF Center for the Advancement of Wearable Technologies (CAWT, Grant 1849243), the Consortium of Hybrid Resilient Energy Systems (CHRES, Grant DE-NA0003982). This work was also supported by the Spanish Ministry of Science, Innovation and Universities and the State Research Agency (MICIU/AEI) within the framework of the EU M-ERA.NET Programme (SOLIMEC project, Spanish subproject PCI2022-132998), as well as through the “Proyectos de Generación de Conocimiento” (NanoCat-Com, PID2021-124667OB-I00).
Institutional Review Board Statement
Not applicable for studies not involving humans or animals.
Data Availability Statement
The data is contained in the article and is available from the corresponding authors on reasonable request.
Acknowledgments
The authors would like to thank Raúl S. García for his contributions to the development of part of the catalytic measurements. The use of facilities at the National Center for Electron Microscopy (ICTS - ELECMI) at Complutense University of Madrid (Spain), the Instituto de Micro y Nanotecnología IMN-CNM (CSIC, CEI UAM+CSIC), and the FESEM Microscopy at the “Servicio Interdepartamental de Investigación (SIdI)” at Universidad Autónoma de Madrid is also gratefully acknowledged.
Conflicts of Interest
The authors declare no conflict of interest.
References
- Hassan, Q.; Viktor, P.; J. Al-Musawi, T.; Mahmood Ali, B.; Algburi, S.; Alzoubi, H.M.; Khudhair Al-Jiboory, A.; Zuhair Sameen, A.; Salman, H.M.; Jaszczur, M. The Renewable Energy Role in the Global Energy Transformations. Renewable Energy Focus 2024, 48, 100545. [CrossRef]
- World Economic Forum Fostering Effective Energy Transition 2024.
- Peter Simpa; Nko Okina Solomon; Olubunmi Adeolu Adenekan; Scholar Chinenye Obasi Nanotechnology’s Potential in Advancing Renewable Energy Solutions. Eng. Sci. Technol. J. 2024, 5, 1695–1710. [CrossRef]
- Wang, P.; Dong, Q.; Gao, C.; Bai, W.; Chu, D.; He, Y. A Comprehensive Review of Carbon Nanotubes: Growth Mechanisms, Preparation and Applications. Fullerenes, Nanotubes and Carbon Nanostructures 2024, 32, 415–429. [CrossRef]
- Hughes, K.J.; Iyer, K.A.; Bird, R.E.; Ivanov, J.; Banerjee, S.; Georges, G.; Zhou, Q.A. Review of Carbon Nanotube Research and Development: Materials and Emerging Applications. ACS Appl. Nano Mater. 2024, 7, 18695–18713. [CrossRef]
- Raman, S.; Sankar, R.; M, S. Advances in Silicon Nanowire Applications in Energy Generation, Storage, Sensing, and Electronics: A Review. Nanotechnology 2023, 34, 182001. [CrossRef]
- Srivastava, T.; Shrivastav, A.M.; Sinha, S.; Polley, D.; Alee, K.S.; Sujatha, R.A.; Mishra, A.; Saxena, S.K. Silicon Nanowire: From Fabrication to Its Application. In Materials for Electronic, Magnetic, and Spintronic Technologies; Mishra, A., Dixit, V., Somvanshi, D., Singh, A., Mishra, A., Eds.; Engineering Materials; Springer Nature Switzerland: Cham, 2024; pp. 41–63 ISBN 978-3-031-64541-9. [CrossRef]
- Ingsel, T.; Gupta, R.K. Nanostructured Silicon for Energy Applications. In Silicon-Based Hybrid Nanoparticles; Elsevier, 2022; pp. 169–197 ISBN 978-0-12-824007-6. [CrossRef]
- Samy, O.; El Moutaouakil, A. A Review on MoS2 Energy Applications: Recent Developments and Challenges. Energies 2021, 14, 4586. [CrossRef]
- Gunawan, D.; Zhang, J.; Li, Q.; Toe, C.Y.; Scott, J.; Antonietti, M.; Guo, J.; Amal, R. Materials Advances in Photocatalytic Solar Hydrogen Production: Integrating Systems and Economics for a Sustainable Future. Advanced Materials 2024, 2404618. [CrossRef]
- Singla, S.; Sharma, S.; Basu, S.; Shetti, N.P.; Aminabhavi, T.M. Photocatalytic Water Splitting Hydrogen Production via Environmental Benign Carbon Based Nanomaterials. International Journal of Hydrogen Energy 2021, 46, 33696–33717. [CrossRef]
- Ganguly, P.; Harb, M.; Cao, Z.; Cavallo, L.; Breen, A.; Dervin, S.; Dionysiou, D.D.; Pillai, S.C. 2D Nanomaterials for Photocatalytic Hydrogen Production. ACS Energy Lett. 2019, 4, 1687–1709. [CrossRef]
- Gupta, A.; Likozar, B.; Jana, R.; Chanu, W.C.; Singh, M.K. A Review of Hydrogen Production Processes by Photocatalytic Water Splitting – From Atomistic Catalysis Design to Optimal Reactor Engineering. International Journal of Hydrogen Energy 2022, 47, 33282–33307. [CrossRef]
- Chu, X.; Sathish, C.I.; Yang, J.; Guan, X.; Zhang, X.; Qiao, L.; Domen, K.; Wang, S.; Vinu, A.; Yi, J. Strategies for Improving the Photocatalytic Hydrogen Evolution Reaction of Carbon Nitride-Based Catalysts. Small 2023, 19, 2302875. [CrossRef]
- Zhang, Y.; Heo, Y.-J.; Lee, J.-W.; Lee, J.-H.; Bajgai, J.; Lee, K.-J.; Park, S.-J. Photocatalytic Hydrogen Evolution via Water Splitting: A Short Review. Catalysts 2018, 8, 655. [CrossRef]
- Molaei, M.J. Recent Advances in Hydrogen Production through Photocatalytic Water Splitting: A Review. Fuel 2024, 365, 131159. [CrossRef]
- Nazir, M.A.; Najam, T.; Altaf, M.; Ahmad, K.; Hossain, I.; Assiri, M.A.; Javed, M.S.; Rehman, A.U.; Shah, S.S.A. Tuning the Photocatalytic Hydrogen Production via Co-Catalyst Engineering. Journal of Alloys and Compounds 2024, 990, 174378. [CrossRef]
- Suman, N.; Irfan, H.; Shanmugharaj, A.M.; Mohamed Riyaz, A.K.; Pai, R.K. Layered Transition Metal Dichalcogenide-Based Nanomaterials for Lithium-Ion Batteries. In Nanostructured Materials for Energy Storage; Deshmukh, K., Pandey, M., Eds.; Wiley, 2024; pp. 319–370 ISBN 978-3-527-35067-4. [CrossRef]
- Hossain, Md.H.; Chowdhury, M.A.; Hossain, N.; Islam, Md.A.; Mobarak, M.H. Advances of Lithium-Ion Batteries Anode Materials—A Review. Chemical Engineering Journal Advances 2023, 16, 100569. [CrossRef]
- Dang, L.; Yuan, Y.; Wang, Z.; Li, H.; Yang, R.; Fu, A.; Liu, X.; Li, H. Carbon Nanofibers Decorated by MoS2 Nanosheets with Tunable Quantity as Self-Supporting Anode for High-Performance Lithium Ion Batteries. Nanomaterials 2023, 13, 2689. [CrossRef]
- Poorshakoor, E.; Darab, M. Advancements in the Development of Nanomaterials for Lithium-Ion Batteries: A Scientometric Review. Journal of Energy Storage 2024, 75, 109638. [CrossRef]
- Li, W.; Qian, X.; Hou, S.; Xia, X.; He, D.; Xia, J.; He, G.; Chen, H. Recent Progress of Self-Supported Anode Materials for Li-Ion Batteries. Journal of Energy Storage 2024, 99, 113188. [CrossRef]
- Department of Physics, Noorul Islam Center for Higher Education, Kumaracoil, Thuckalay, Kanyakumari district, Tamilnadu, 629180, India.; Shams, S.; Bindhu, B.; Department of Physics, Noorul Islam Center for Higher Education, Kumaracoil, Thuckalay, Kanyakumari district, Tamilnadu, 629180, India. Recent Advancements in Hybrid Two Dimensional Materials for Energy Applications. ES Energy Environ. 2024. [CrossRef]
- Sun, J.; Guo, F.; Ai, X.; Tian, Y.; Yang, J.; Zou, X.; Zhu, G. Constructing Heterogeneous Interface by Growth of Carbon Nanotubes on the Surface of MoB2 for Boosting Hydrogen Evolution Reaction in a Wide pH Range. Small 2024, 20, 2304573. [CrossRef]
- Kim, J.H.; Kim, S.; Han, J.H.; Seo, S.B.; Choi, Y.R.; Lim, J.; Kim, Y.A. Perspective on Carbon Nanotubes as Conducting Agent in Lithium-Ion Batteries: The Status and Future Challenges. Carbon Lett. 2023, 33, 325–333. [CrossRef]
- Sehrawat, P.; Julien, C.; Islam, S.S. Carbon Nanotubes in Li-Ion Batteries: A Review. Materials Science and Engineering: B 2016, 213, 12–40. [CrossRef]
- Chen, X.; Bi, Q.; Sajjad, M.; Wang, X.; Ren, Y.; Zhou, X.; Xu, W.; Liu, Z. One-Dimensional Porous Silicon Nanowires with Large Surface Area for Fast Charge–Discharge Lithium-Ion Batteries. Nanomaterials 2018, 8, 285. [CrossRef]
- Ray, U.; Sarkar, S.; Banerjee, D. Silicon Nanowires as an Efficient Material for Hydrogen Evolution through Catalysis: A Review. Catalysis Today 2023, 423, 113964. [CrossRef]
- Yang, C.; Chandran, K.S.R. A Critical Review of Silicon Nanowire Electrodes and Their Energy Storage Capacities in Li-Ion Cells. RSC Adv. 2023, 13, 3947–3957. [CrossRef]
- Li, G.; Zhang, D.; Qiao, Q.; Yu, Y.; Peterson, D.; Zafar, A.; Kumar, R.; Curtarolo, S.; Hunte, F.; Shannon, S.; et al. All The Catalytic Active Sites of MoS 2 for Hydrogen Evolution. J. Am. Chem. Soc. 2016, 138, 16632–16638. [CrossRef]
- Wang, J.; Lu, L.; Lotya, M.; Coleman, J.N.; Chou, S.; Liu, H.; Minett, A.I.; Chen, J. Development of MoS2 –CNT Composite Thin Film from Layered MoS2 for Lithium Batteries. Advanced Energy Materials 2013, 3, 798–805. [CrossRef]
- Machín, A.; Cotto, M.; Duconge, J.; Arango, J.C.; Morant, C.; Pinilla, S.; Soto-Vázquez, L.; Resto, E.; Márquez, F. Hydrogen Production via Water Splitting Using Different Au@ZnO Catalysts under UV–Vis Irradiation. Journal of Photochemistry and Photobiology A: Chemistry 2018, 353, 385–394. [CrossRef]
- Ghorai, A.; Ray, S.K.; Midya, A. Ethylenediamine-Assisted High Yield Exfoliation of MoS2 for Flexible Solid-State Supercapacitor Application. ACS Appl. Nano Mater. 2019, 2, 1170–1177. [CrossRef]
- Redondo-Cubero, A.; Borge, M.J.G.; Gordillo, N.; Gutiérrez, P.C.; Olivares, J.; Pérez Casero, R.; Ynsa, M.D. Current Status and Future Developments of the Ion Beam Facility at the Centre of Micro-Analysis of Materials in Madrid. Eur. Phys. J. Plus 2021, 136, 175. [CrossRef]
- Mathayan, V.; Moro, M.V.; Morita, K.; Tsuchiya, B.; Ye, R.; Baba, M.; Primetzhofer, D. In-Operando Observation of Li Depth Distribution and Li Transport in Thin Film Li Ion Batteries. Applied Physics Letters 2020, 117, 023902. [CrossRef]
- Mathayan, V.; Morita, K.; Tsuchiya, B.; Ye, R.; Baba, M.; Moro, M.V.; Primetzhofer, D. Assessing the Potential of Ion Beam Analytical Techniques for Depth Profiling Li in Thin Film Li Ion Batteries. Journal of Applied Physics 2021, 130, 125306. [CrossRef]
- Paneta, V.; Kafkarkou, A.; Kokkoris, M.; Lagoyannis, A. Differential Cross-Section Measurements for the 7Li(p,p0)7Li, 7Li(p,p1)7Li, 7Li(p,α0)4He, 19F(p,p0)19F, 19F(p,α0)16O and 19F(p,α1,2)16O Reactions. Nuclear Instruments and Methods in Physics Research Section B: Beam Interactions with Materials and Atoms 2012, 288, 53–59. [CrossRef]
- Mayer, M. SIMNRA User’s Guide.; Max-Planck-Institut fur Plasmaphysik, Garching, 1997.
- Mayer, M. Ion Beam Analysis of Rough Thin Films. Nuclear Instruments and Methods in Physics Research Section B: Beam Interactions with Materials and Atoms 2002, 194, 177–186. [CrossRef]
- Mayer, M. SIMNRA, a Simulation Program for the Analysis of NRA, RBS and ERDA. In Proceedings of the AIP Conference Proceedings; AIP: Denton, Texas (USA), 1999; pp. 541–544. [CrossRef]
- Baruah, S.; Thanachayanont, C.; Dutta, J. Growth of ZnO Nanowires on Nonwoven Polyethylene Fibers. Science and Technology of Advanced Materials 2008, 9, 025009. [CrossRef]
- Miralrio, A.; Rangel Cortes, E.; Castro, M. Electronic Properties and Enhanced Reactivity of MoS2 Monolayers with Substitutional Gold Atoms Embedded into Sulfur Vacancies. Applied Surface Science 2018, 455, 758–770. [CrossRef]
- Dresselhaus, M.S.; Jorio, A.; Hofmann, M.; Dresselhaus, G.; Saito, R. Perspectives on Carbon Nanotubes and Graphene Raman Spectroscopy. Nano Lett. 2010, 10, 751–758. [CrossRef]
- Iatsunskyi, I.; Nowaczyk, G.; Jurga, S.; Fedorenko, V.; Pavlenko, M.; Smyntyna, V. One and Two-Phonon Raman Scattering from Nanostructured Silicon. Optik 2015, 126, 1650–1655. [CrossRef]
- Mottola, S.; Mancuso, A.; Sacco, O.; Vaiano, V.; De Marco, I. Photocatalytic Systems Based on ZnO Produced by Supercritical Antisolvent for Ceftriaxone Degradation. Catalysts 2023, 13, 1173. [CrossRef]
- Cuscó, R.; Alarcón-Lladó, E.; Ibáñez, J.; Artús, L.; Jiménez, J.; Wang, B.; Callahan, M.J. Temperature Dependence of Raman Scattering in ZnO. Phys. Rev. B 2007, 75, 165202. [CrossRef]
- Sharma, A.; Singh, B.P.; Dhar, S.; Gondorf, A.; Spasova, M. Effect of Surface Groups on the Luminescence Property of ZnO Nanoparticles Synthesized by Sol–Gel Route. Surface Science 2012, 606, L13–L17. [CrossRef]
- Fontánez, K.; García, D.; Ortiz, D.; Sampayo, P.; Hernández, L.; Cotto, M.; Ducongé, J.; Díaz, F.; Morant, C.; Petrescu, F.; et al. Biomimetic Catalysts Based on Au@TiO2-MoS2-CeO2 Composites for the Production of Hydrogen by Water Splitting. IJMS 2022, 24, 363. [CrossRef]
- Castellanos-Gomez, A.; Quereda, J.; van der Meulen, H.P.; Agraït, N.; Rubio-Bollinger, G. Spatially Resolved Optical Absorption Spectroscopy of Single- and Few-Layer MoS2 by Hyperspectral Imaging. Nanotechnology 2016, 27, 115705. [CrossRef]
- Li, H.; Zhang, Q.; Yap, C.C.R.; Tay, B.K.; Edwin, T.H.T.; Olivier, A.; Baillargeat, D. From Bulk to Monolayer MoS2 : Evolution of Raman Scattering. Adv Funct Materials 2012, 22, 1385–1390. [CrossRef]
- Ahmad, M.; Rehman, W.; Khan, M.M.; Qureshi, M.T.; Gul, A.; Haq, S.; Ullah, R.; Rab, A.; Menaa, F. Phytogenic Fabrication of ZnO and Gold Decorated ZnO Nanoparticles for Photocatalytic Degradation of Rhodamine B. Journal of Environmental Chemical Engineering 2021, 9, 104725. [CrossRef]
- Ngoma, M.M.; Mathaba, M.; Moothi, K. Effect of Carbon Nanotubes Loading and Pressure on the Performance of a Polyethersulfone (PES)/Carbon Nanotubes (CNT) Membrane. Sci. Rep. 2021, 11, 23805. [CrossRef]
- Al-Taay, H.F.; Mahdi, M.A.; Parlevliet, D.; Jennings, P. Fabrication and Characterization of Solar Cells Based on Silicon Nanowire Homojunctions. Silicon 2017, 9, 17–23. [CrossRef]
- Ghasemipour, P.; Fattahi, M.; Rasekh, B.; Yazdian, F. Developing the Ternary ZnO Doped MoS2 Nanostructures Grafted on CNT and Reduced Graphene Oxide (RGO) for Photocatalytic Degradation of Aniline. Sci. Rep. 2020, 10, 4414. [CrossRef]
- Ren, B.; Shen, W.; Li, L.; Wu, S.; Wang, W. 3D CoFe2O4 Nanorod/Flower-like MoS2 Nanosheet Heterojunctions as Recyclable Visible Light-Driven Photocatalysts for the Degradation of Organic Dyes. Applied Surface Science 2018, 447, 711–723. [CrossRef]
- Briggs, D.; Seah, M. Practical Surface Analysis; Wiley: New York, NY, USA, 1994.
- Lee, H.-J.; Kim, J.S.; Lee, K.Y.; Park, K.H.; Bae, J.-S.; Mubarak, M.; Lee, H. Elucidation of an Intrinsic Parameter for Evaluating the Electrical Quality of Graphene Flakes. Sci. Rep. 2019, 9, 557. [CrossRef]
- Kim, B.-J.; Kim, J.-P.; Park, J.-S. Effects of Al Interlayer Coating and Thermal Treatment on Electron Emission Characteristics of Carbon Nanotubes Deposited by Electrophoretic Method. Nanoscale Res. Lett. 2014, 9, 236. [CrossRef]
- Tan, S.M.; Ambrosi, A.; Chua, C.K.; Pumera, M. Electron Transfer Properties of Chemically Reduced Graphene Materials with Different Oxygen Contents. J. Mater. Chem. A 2014, 2, 10668–10675. [CrossRef]
- Morimoto, N.; Kubo, T.; Nishina, Y. Tailoring the Oxygen Content of Graphite and Reduced Graphene Oxide for Specific Applications. Sci. Rep. 2016, 6, 21715. [CrossRef]
- Zagorac, D.; Zagorac, J.; Pejić, M.; Matović, B.; Schön, J.C. Band Gap Engineering of Newly Discovered ZnO/ZnS Polytypic Nanomaterials. Nanomaterials 2022, 12, 1595. [CrossRef]
- Hanif, Md.A.; Kim, Y.-S.; Akter, J.; Kim, H.G.; Kwac, L.K. Fabrication of Robust and Stable N-Doped ZnO/Single-Walled Carbon Nanotubes: Characterization, Photocatalytic Application, Kinetics, Degradation Products, and Toxicity Analysis. ACS Omega 2023, 8, 16174–16185. [CrossRef]
- Rahman, I.A.; Purqon, A. First Principles Study of Molybdenum Disulfide Electronic Structure. J. Phys.: Conf. Ser. 2017, 877, 012026. [CrossRef]
- Hutagalung, S.D.; Fadhali, M.M.; Areshi, R.A.; Tan, F.D. Optical and Electrical Characteristics of Silicon Nanowires Prepared by Electroless Etching. Nanoscale Res. Lett. 2017, 12, 425. [CrossRef]
- Prabavathi, S.L.; Saravanakumar, K.; Nkambule, T.T.I.; Muthuraj, V.; Mamba, G. Enhanced Photoactivity of Cerium Tungstate-Modified Graphitic Carbon Nitride Heterojunction Photocatalyst for the Photodegradation of Moxifloxacin. J. Mater. Sci: Mater. Electron. 2020, 31, 11434–11447. [CrossRef]
- Jourshabani, M.; Shariatinia, Z.; Badiei, A. Synthesis and Characterization of Novel Sm2O3/S-Doped g-C3N4 Nanocomposites with Enhanced Photocatalytic Activities under Visible Light Irradiation. Applied Surface Science 2018, 427, 375–387. [CrossRef]
- Cao, J.; Li, X.; Lin, H.; Chen, S.; Fu, X. In Situ Preparation of Novel p–n Junction Photocatalyst BiOI/(BiO)2CO3 with Enhanced Visible Light Photocatalytic Activity. Journal of Hazardous Materials 2012, 239–240, 316–324. [CrossRef]
- Chen, C.; Bi, W.; Xia, Z.; Yuan, W.; Li, L. Hydrothermal Synthesis of the CuWO4/ZnO Composites with Enhanced Photocatalytic Performance. ACS Omega 2020, 5, 13185–13195. [CrossRef]
- Barpuzary, D.; Banik, A.; Gogoi, G.; Qureshi, M. Noble Metal-Free Counter Electrodes Utilizing Cu2ZnSnS4 Loaded with MoS2 for Efficient Solar Cells Based on ZnO Nanowires Co-Sensitized with CuInS2 –CdSe Quantum Dots. J. Mater. Chem. A 2015, 3, 14378–14388. [CrossRef]
- Zhang, Y.; Mandal, R.; Ratchford, D.C.; Anthony, R.; Yeom, J. Si Nanocrystals/ZnO Nanowires Hybrid Structures as Immobilized Photocatalysts for Photodegradation. Nanomaterials 2020, 10, 491. [CrossRef]
- Zhu, Y.; Ling, Q.; Liu, Y.; Wang, H.; Zhu, Y. Photocatalytic H2 Evolution on MoS2–TiO2 Catalysts Synthesized via Mechanochemistry. Phys. Chem. Chem. Phys. 2015, 17, 933–940. [CrossRef]
- Liu, Y.; Xu, X.; Zhang, J.; Zhang, H.; Tian, W.; Li, X.; Tade, M.O.; Sun, H.; Wang, S. Flower-like MoS2 on Graphitic Carbon Nitride for Enhanced Photocatalytic and Electrochemical Hydrogen Evolutions. Applied Catalysis B: Environmental 2018, 239, 334–344. [CrossRef]
- Dong, J.; Fang, W.; Yuan, H.; Xia, W.; Zeng, X.; Shangguan, W. Few-Layered MoS2/ZnCdS/ZnS Heterostructures with an Enhanced Photocatalytic Hydrogen Evolution. ACS Appl. Energy Mater. 2022, 5, 4893–4902. [CrossRef]
- Zeimpekis, I.; Rahman, T.; Leung, O.M.; Tyson, J.; Ebert, M.; Boden, S.A.; Ponce De Leon, C.; Morgan, K.A. Scalable Large-Area 2D-MoS2/Silicon-Nanowire Heterostructures for Enhancing Energy Storage Applications. ACS Appl. Energy Mater. 2024, 7, 2299–2308. [CrossRef]
- Stoica, I.; Abraham, A.R.; Haghi, A.K. Advances in Energy Materials: New Composites and Techniques for Future Energy Applications; 1st ed.; Apple Academic Press: New York, 2023; ISBN 978-1-00-334607-4. [CrossRef]
- Anushya, G.; Benjamin, M.; Sarika, R.; Pravin, J.C.; Sridevi, R.; Nirmal, D. A Review on Applications of Molybdenum Disulfide Material: Recent Developments. Micro and Nanostructures 2024, 186, 207742. [CrossRef]
- Fang, X.; Hua, C.; Guo, X.; Hu, Y.; Wang, Z.; Gao, X.; Wu, F.; Wang, J.; Chen, L. Lithium Storage in Commercial MoS2 in Different Potential Ranges. Electrochimica Acta 2012, 81, 155–160. [CrossRef]
- Ma, L.; Ye, J.; Chen, W.; Chen, D.; Yang Lee, J. Gemini Surfactant Assisted Hydrothermal Synthesis of Nanotile-like MoS2/Graphene Hybrid with Enhanced Lithium Storage Performance. Nano Energy 2014, 10, 144–152. [CrossRef]
- Chen, B.; Meng, Y.; He, F.; Liu, E.; Shi, C.; He, C.; Ma, L.; Li, Q.; Li, J.; Zhao, N. Thermal Decomposition-Reduced Layer-by-Layer Nitrogen-Doped Graphene/MoS2/Nitrogen-Doped Graphene Heterostructure for Promising Lithium-Ion Batteries. Nano Energy 2017, 41, 154–163. [CrossRef]
- Cheng, Y.; Lu, S.; Zhang, H.; Varanasi, C.V.; Liu, J. Synergistic Effects from Graphene and Carbon Nanotubes Enable Flexible and Robust Electrodes for High-Performance Supercapacitors. Nano Lett. 2012, 12, 4206–4211. [CrossRef]
- Wang, Y.; Yu, L.; Lou, X.W. (David) Synthesis of Highly Uniform Molybdenum–Glycerate Spheres and Their Conversion into Hierarchical MoS 2 Hollow Nanospheres for Lithium-Ion Batteries. Angew. Chem. Int. Ed. 2016, 55, 7423–7426. [CrossRef]
- Kong, X.; Xi, Z.; Wang, L.; Zhou, Y.; Liu, Y.; Wang, L.; Li, S.; Chen, X.; Wan, Z. Recent Progress in Silicon−Based Materials for Performance−Enhanced Lithium−Ion Batteries. Molecules 2023, 28, 2079. [CrossRef]
- Chang, K.; Chen, W. L -Cysteine-Assisted Synthesis of Layered MoS2/Graphene Composites with Excellent Electrochemical Performances for Lithium Ion Batteries. ACS Nano 2011, 5, 4720–4728. [CrossRef]
- Shi, Y.; Wang, Y.; Wong, J.I.; Tan, A.Y.S.; Hsu, C.-L.; Li, L.-J.; Lu, Y.-C.; Yang, H.Y. Self-Assembly of Hierarchical MoSx/CNT Nanocomposites (2<x<3): Towards High Performance Anode Materials for Lithium Ion Batteries. Sci. Rep. 2013, 3, 2169. [CrossRef]
- Magali Gauthier. Electrodes negatives a Base de Silicium Pour Accumulateurs Au Lithium : Mecanisme reactionnel a l’ echelle Nanometrique et Optimisation Des Performances, 2013, Doctoral These.
- Obrovac, M.N.; Chevrier, V.L. Alloy Negative Electrodes for Li-Ion Batteries. Chem. Rev. 2014, 114, 11444–11502. [CrossRef]
- Chhowalla, M.; Shin, H.S.; Eda, G.; Li, L.-J.; Loh, K.P.; Zhang, H. The Chemistry of Two-Dimensional Layered Transition Metal Dichalcogenide Nanosheets. Nature Chem 2013, 5, 263–275. [CrossRef]
- Beaulieu, L.Y.; Eberman, K.W.; Turner, R.L.; Krause, L.J.; Dahn, J.R. Colossal Reversible Volume Changes in Lithium Alloys. Electrochem. Solid-State Lett. 2001, 4, A137. [CrossRef]
- Xiu, Z.; Kim, D.; Alfaruqi, M.H.; Song, J.; Kim, S.; Duong, P.T.; Mathew, V.; Baboo, J.P.; Kim, J. Ultrafine Molybdenum Oxycarbide Nanoparticles Embedded in N-Doped Carbon as a Superior Anode Material for Lithium-Ion Batteries. Journal of Alloys and Compounds 2017, 696, 143–149. [CrossRef]
- Obrovac, M.N.; Christensen, L. Structural Changes in Silicon Anodes during Lithium Insertion/Extraction. Electrochem. Solid-State Lett. 2004, 7, A93. [CrossRef]
- Pinilla, S.; Park, S.-H.; Fontanez, K.; Márquez, F.; Nicolosi, V.; Morant, C. 0D-1D Hybrid Silicon Nanocomposite as Lithium-Ion Batteries Anodes. Nanomaterials 2020, 10, 515. [CrossRef]
- Mathayan, V.; Moro, M.V.; Morita, K.; Tsuchiya, B.; Ye, R.; Baba, M.; Primetzhofer, D. In-Operando Observation of Li Depth Distribution and Li Transport in Thin Film Li Ion Batteries. Applied Physics Letters 2020, 117, 023902. [CrossRef]
Figure 1.
FESEM images showing ZnONPs (a); chemically exfoliated MoS₂ (b); the adduct formed by MoS₂ and CNTs (c); and the catalyst composed of ZnONPs, MoS₂, CNTs, and SiNWs (d).
Figure 1.
FESEM images showing ZnONPs (a); chemically exfoliated MoS₂ (b); the adduct formed by MoS₂ and CNTs (c); and the catalyst composed of ZnONPs, MoS₂, CNTs, and SiNWs (d).
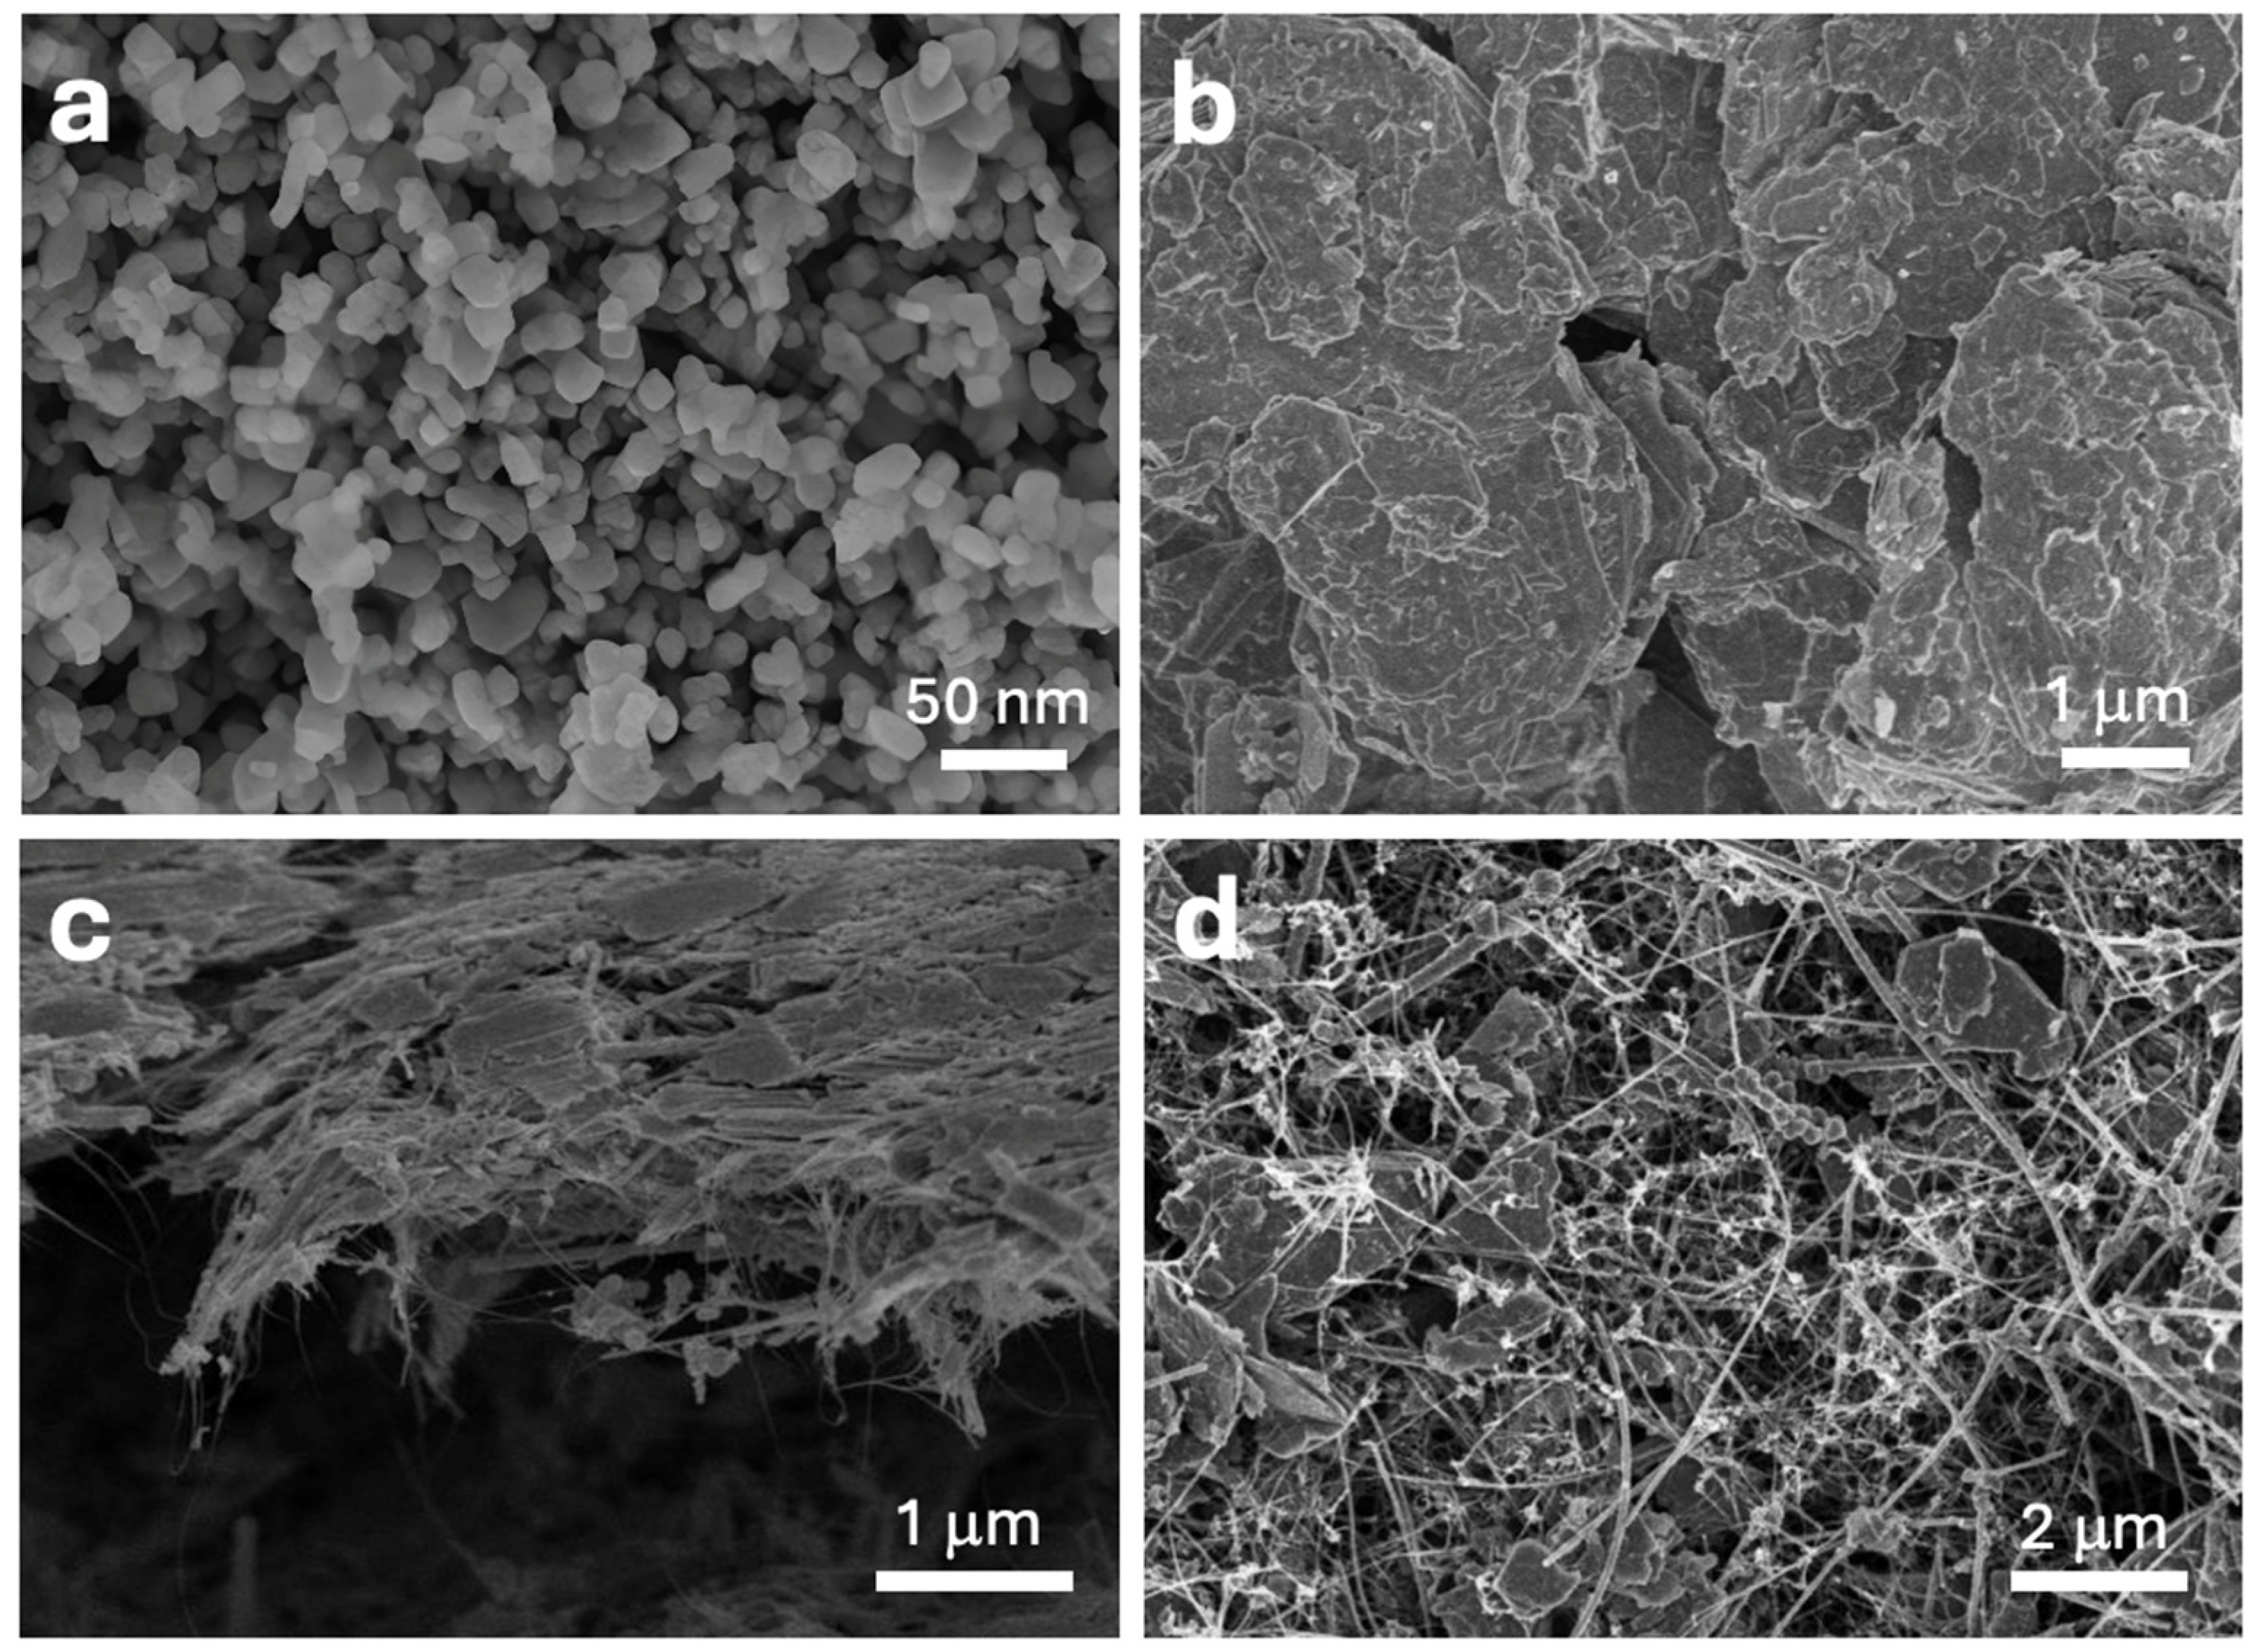
Figure 2.
HRTEM images showing ZnO nanoparticles (ZnONPs) at different magnifications (a and b). The inset in (b) corresponds to a further magnified region, highlighting the lattice fringes. Chemically exfoliated MoS₂ monolayer, with some regions displaying structural defects marked by yellow circles and SAED pattern (c), and the detailed image of a highly crystalline silicon nanowire (SiNW) (d).
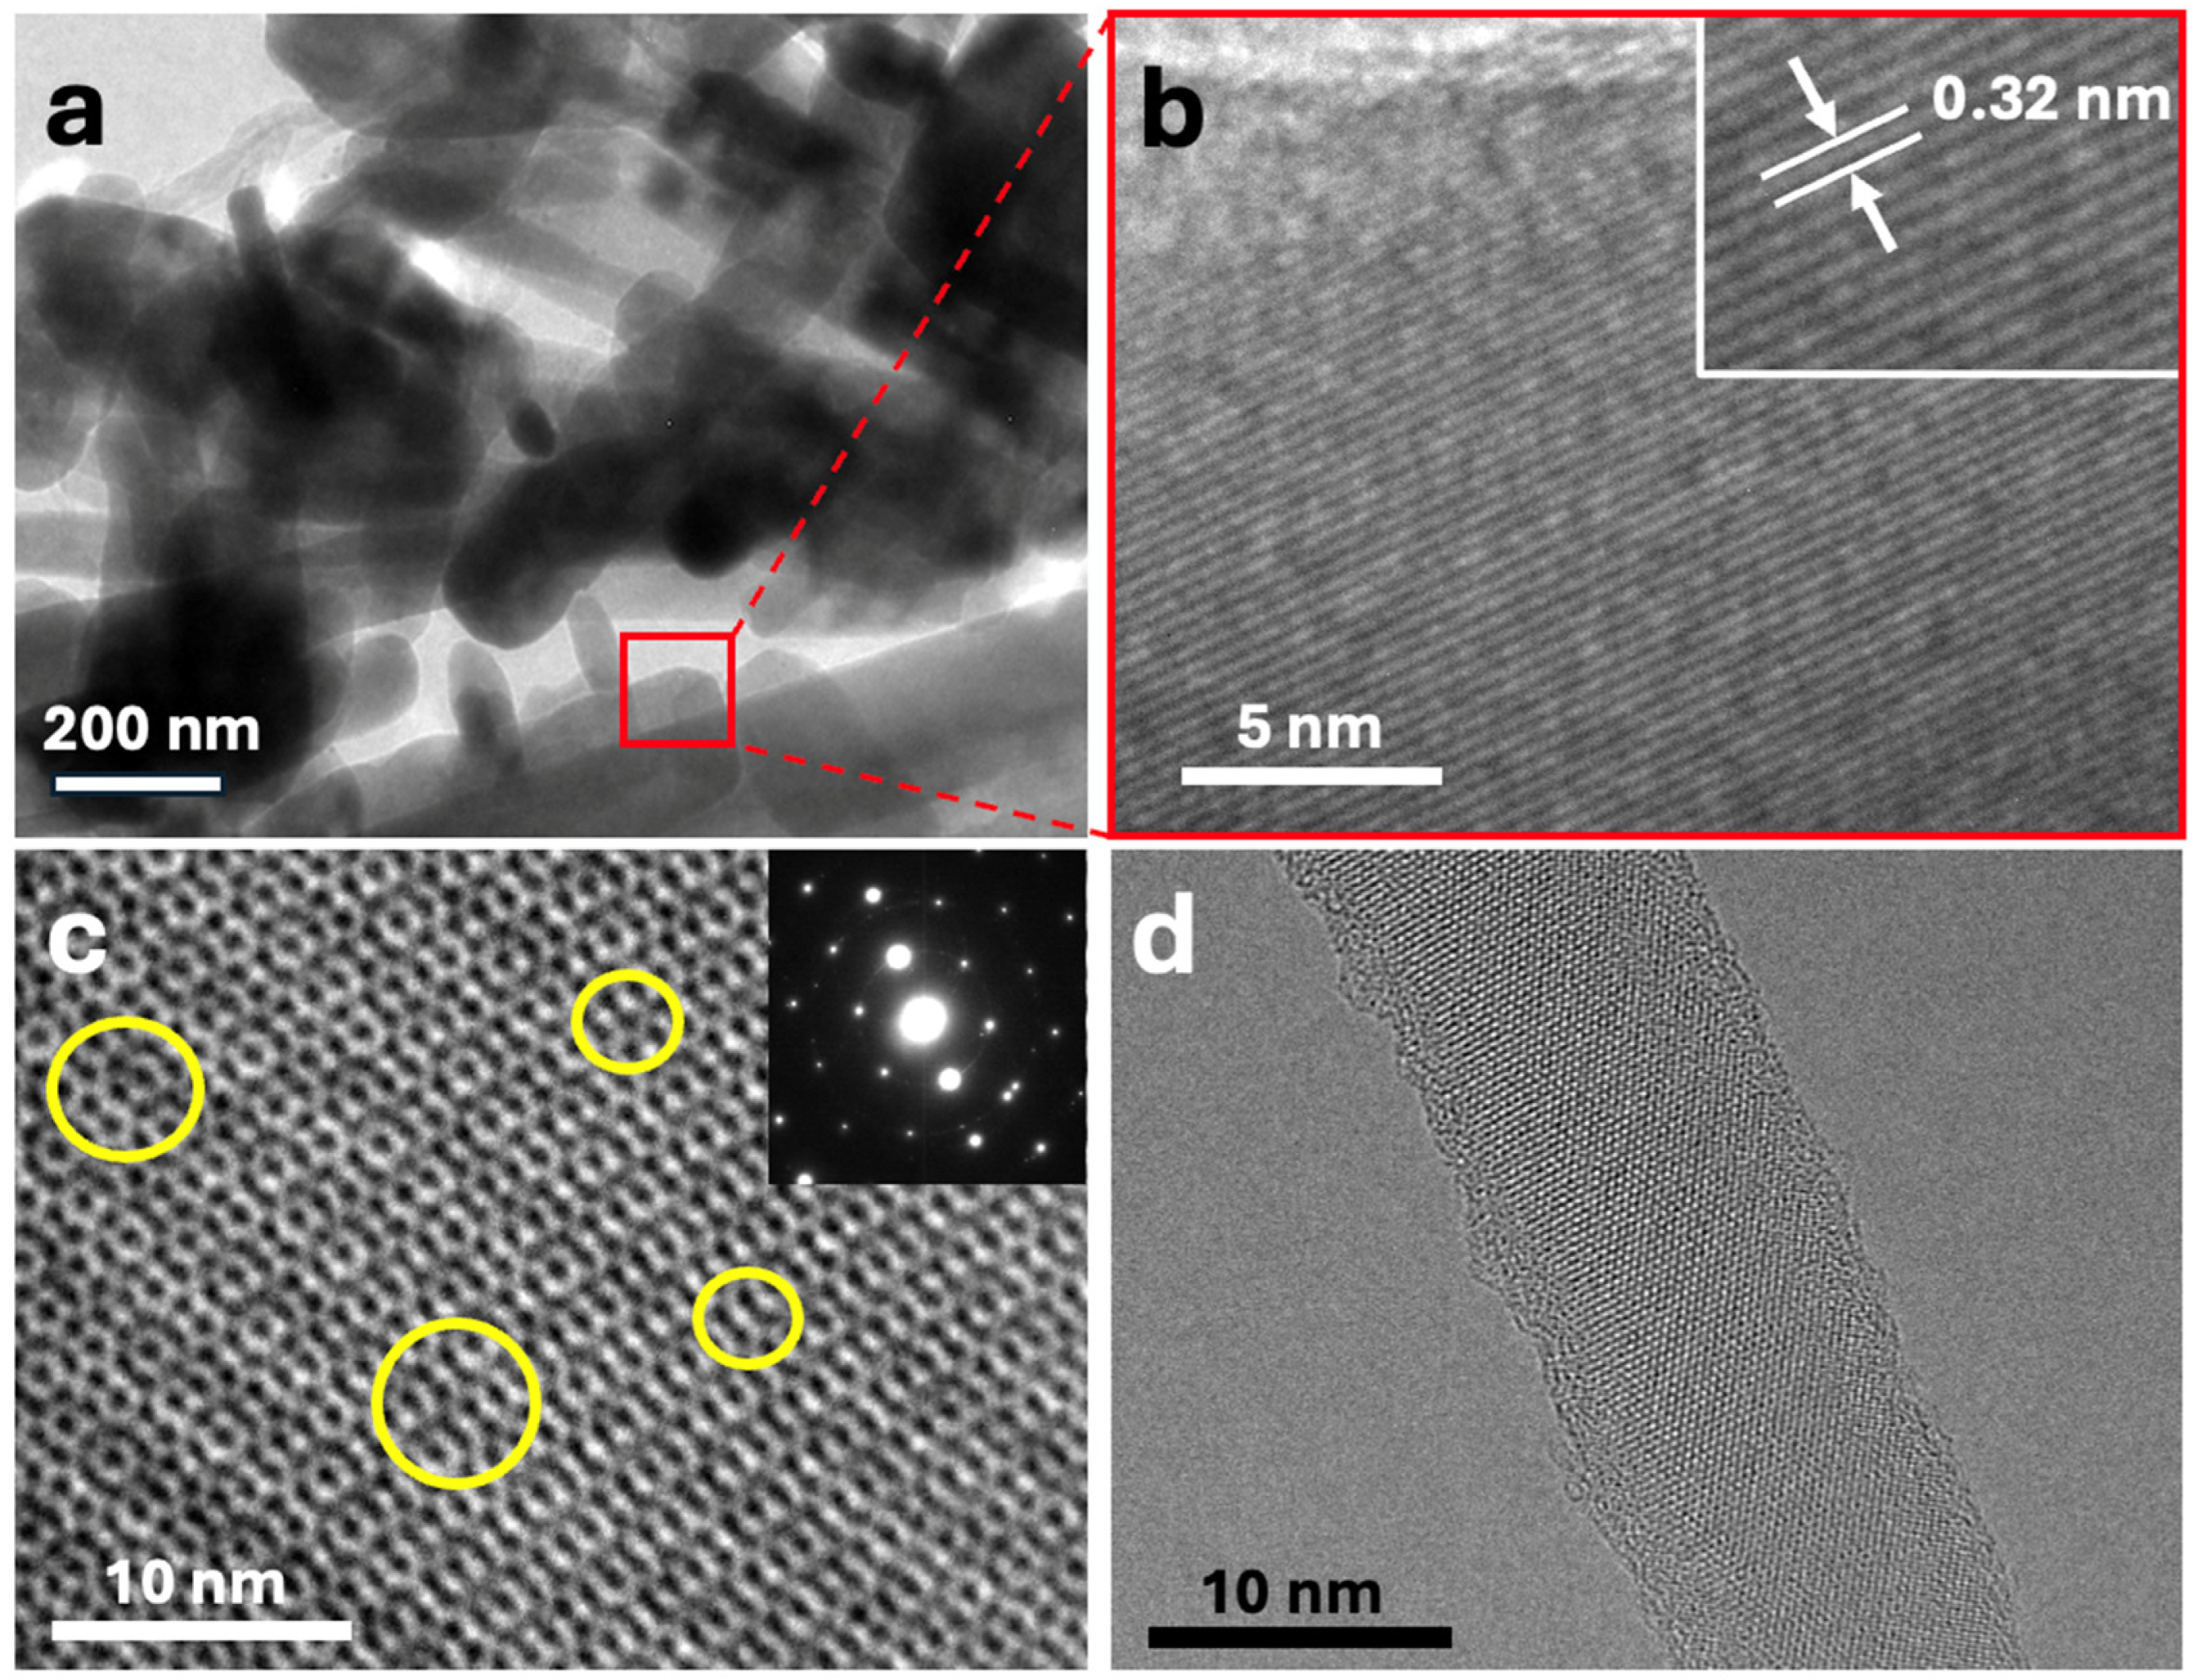
Figure 3.
Raman spectra of CNTs (a); SiNWs (b); ZnONPs (c); MoS2 (d); and 6.7%(MoS₂-SiNWs)@ZnONPs-CNTs (e).
Figure 3.
Raman spectra of CNTs (a); SiNWs (b); ZnONPs (c); MoS2 (d); and 6.7%(MoS₂-SiNWs)@ZnONPs-CNTs (e).
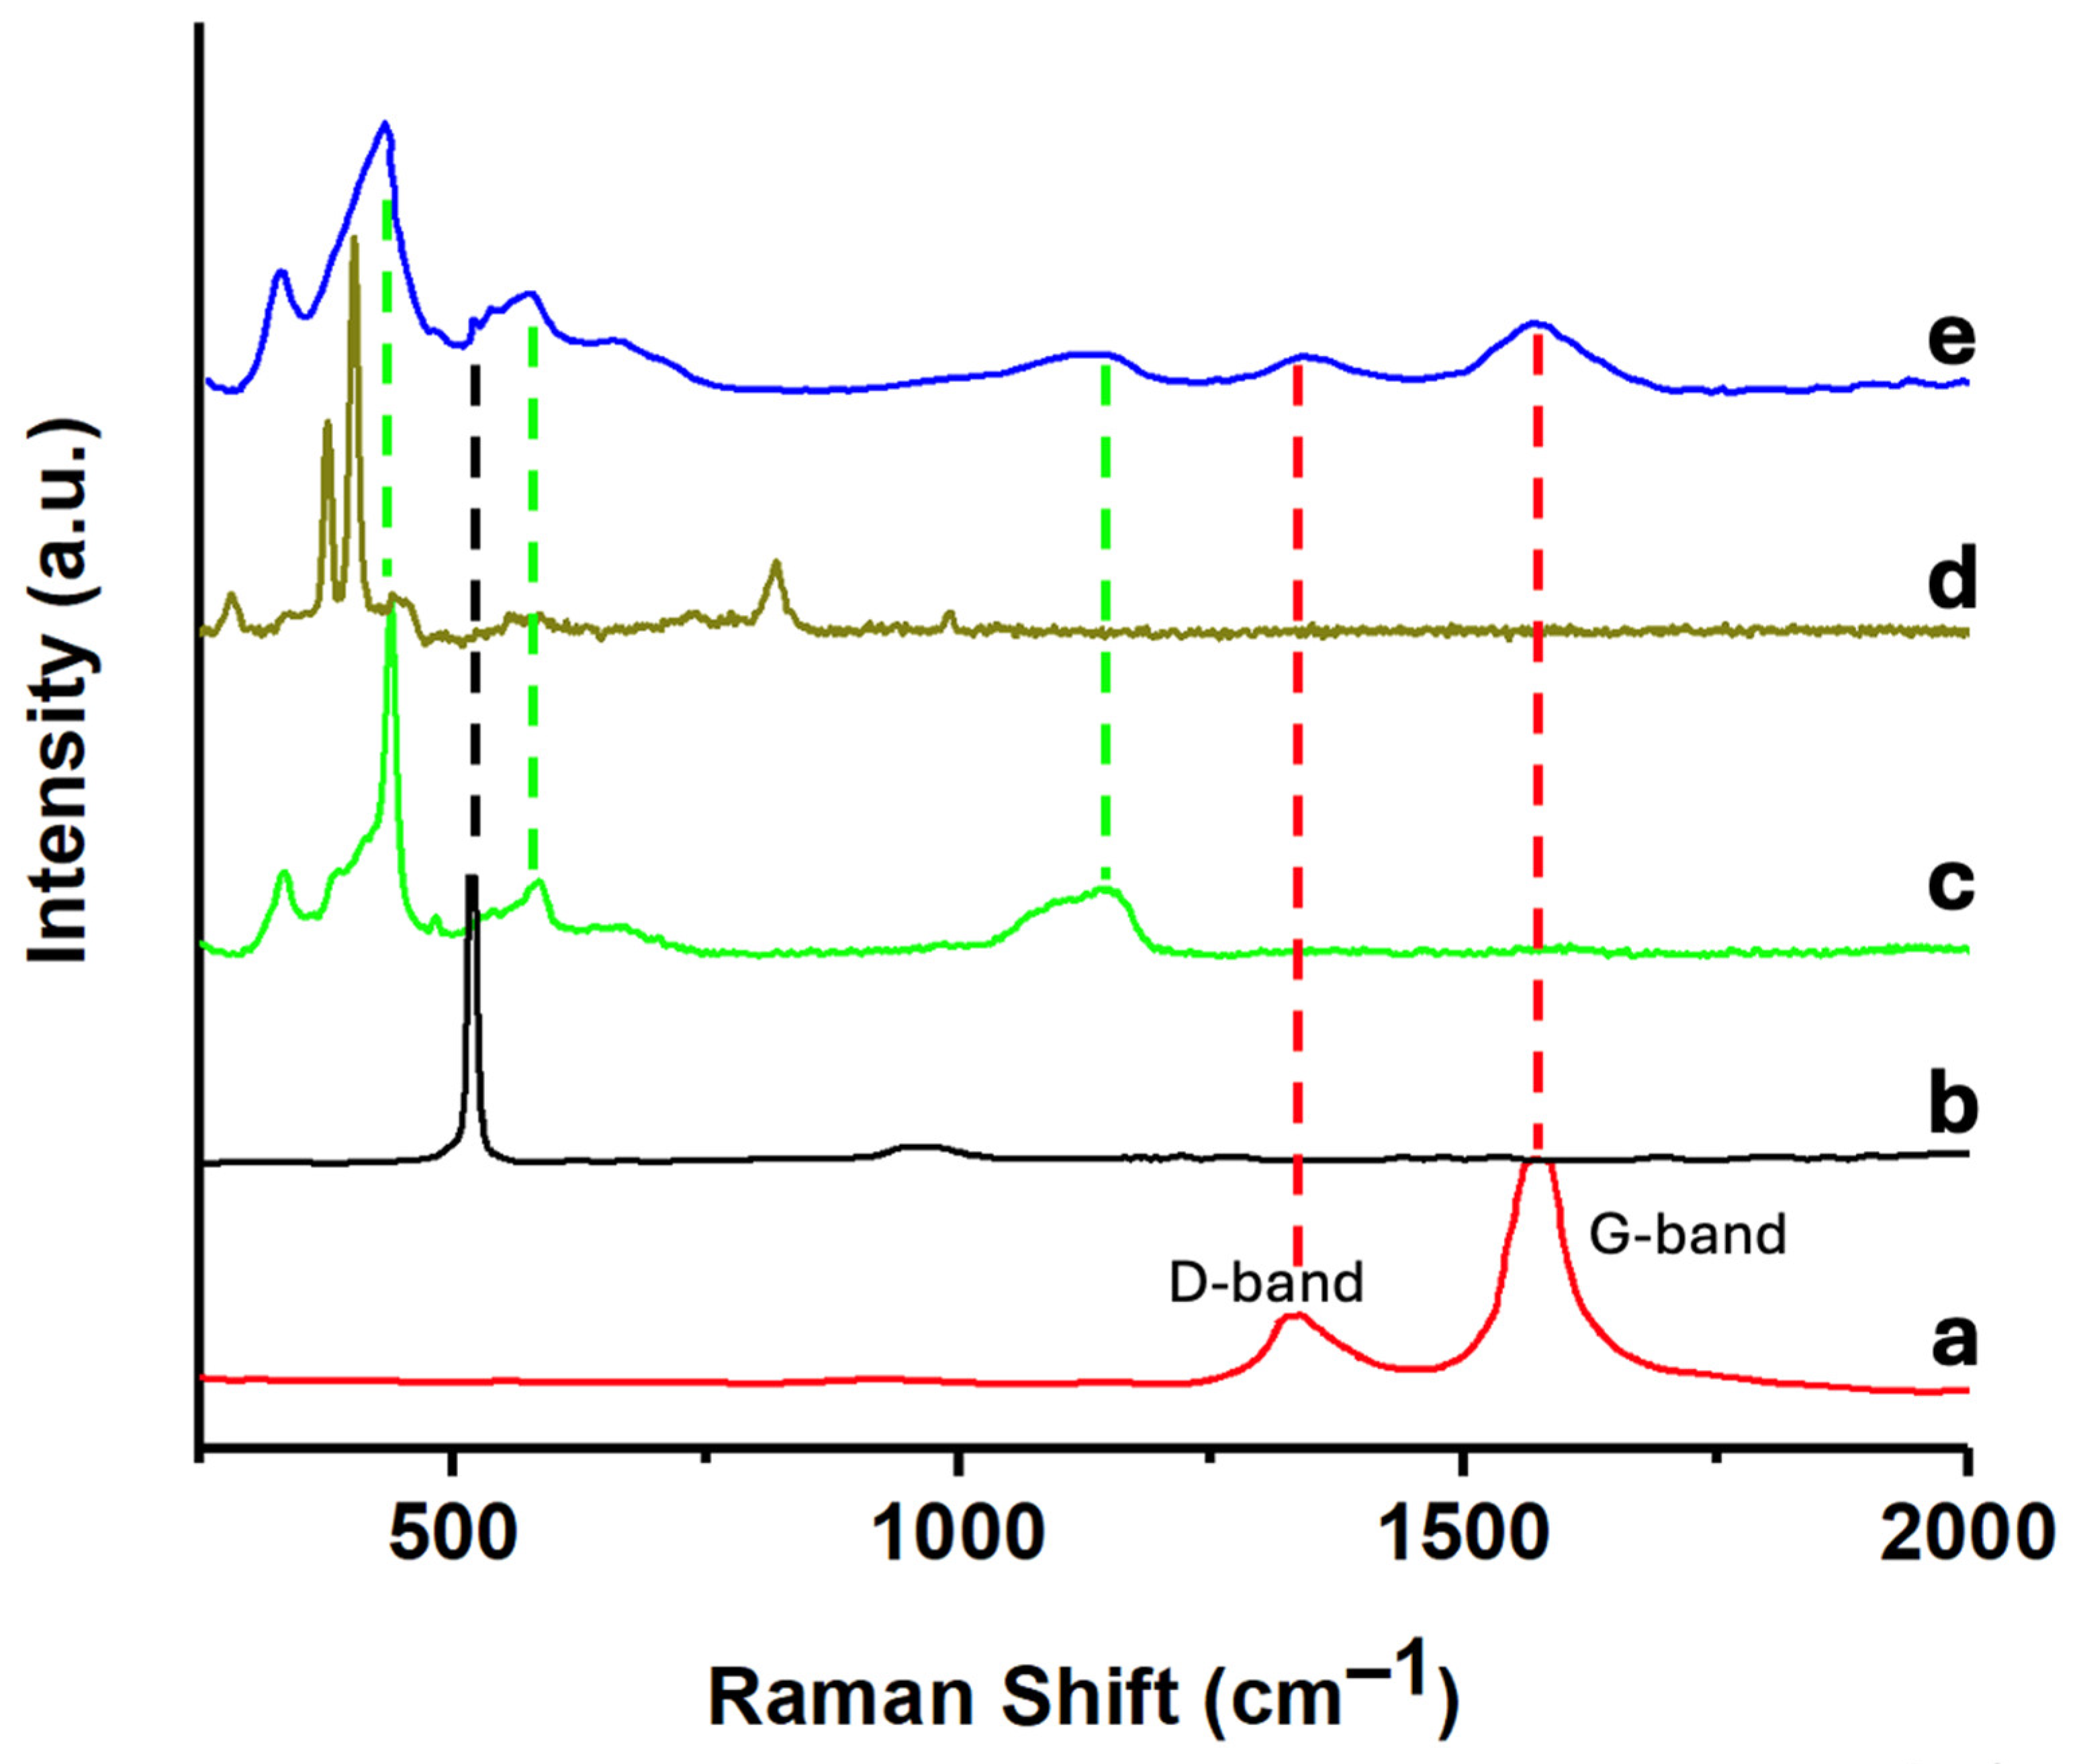
Figure 4.
XRD patterns of ZnONPs (a); CNTs (b); SiNWs (c); MoS2 (d); and 6.7%(MoS₂-SiNWs)@ZnONPs-CNTs (e).
Figure 4.
XRD patterns of ZnONPs (a); CNTs (b); SiNWs (c); MoS2 (d); and 6.7%(MoS₂-SiNWs)@ZnONPs-CNTs (e).
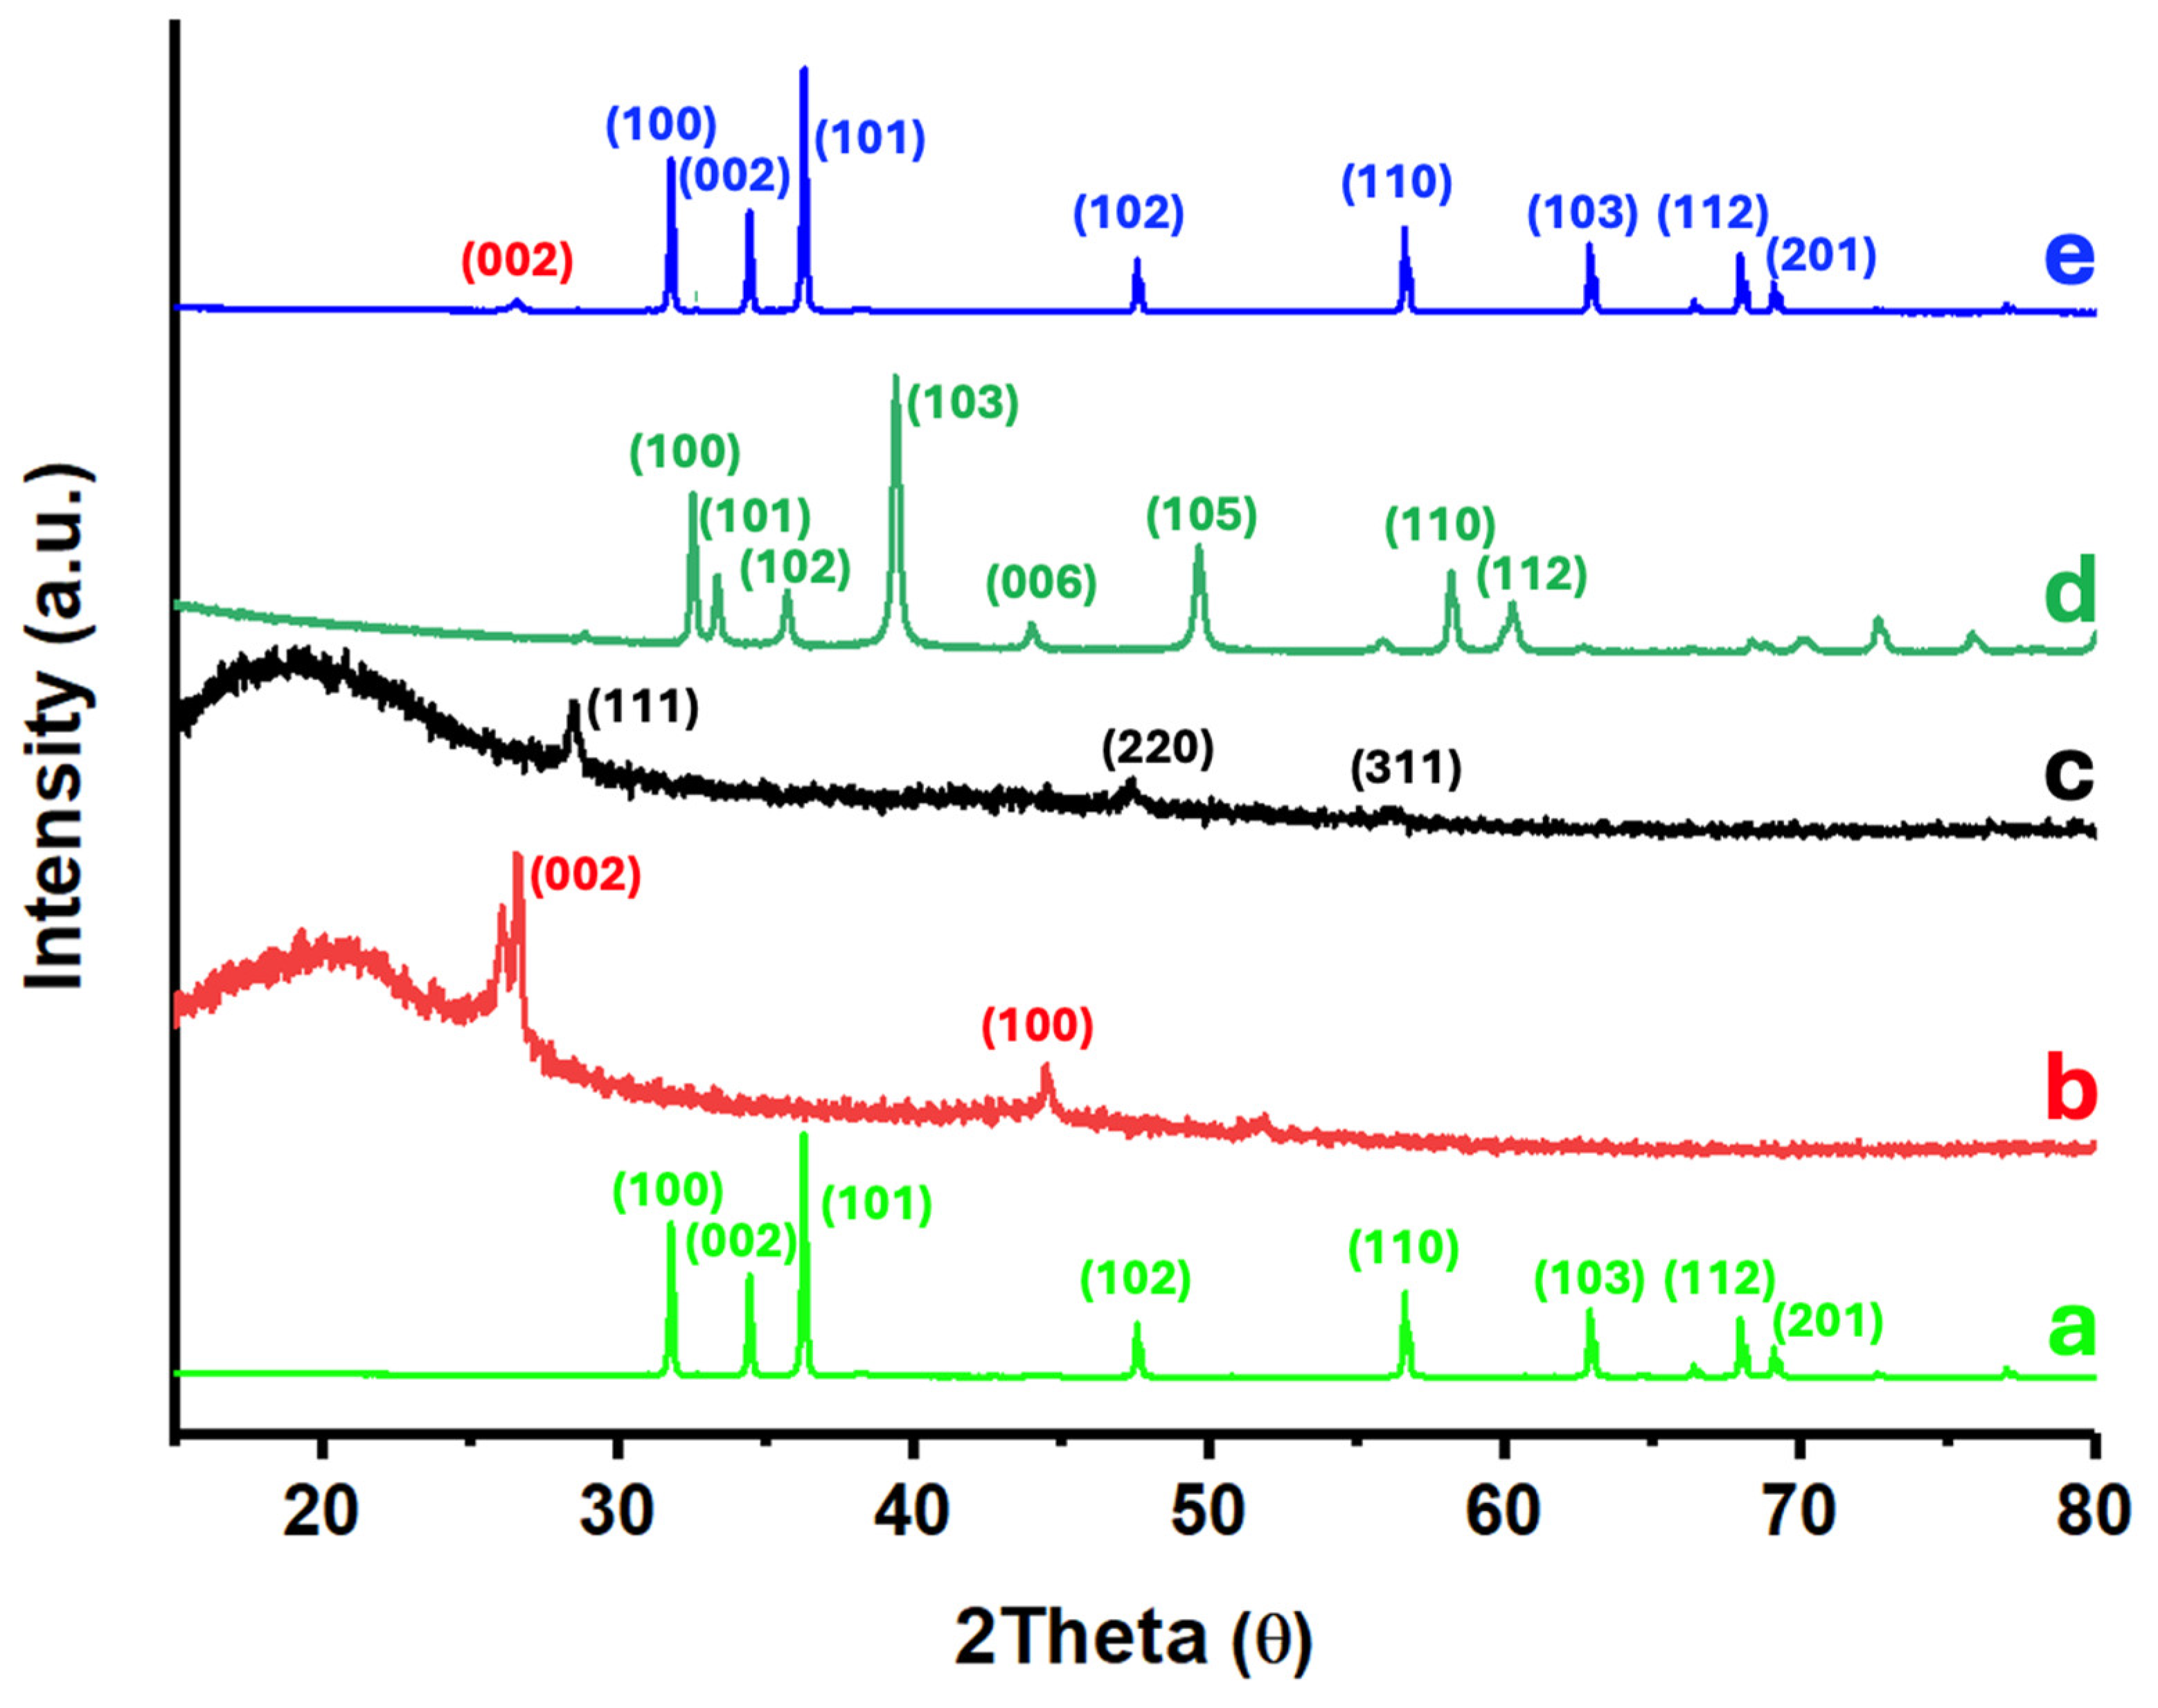
Figure 5.
X-Ray Photoelectron Spectroscopy (XPS) spectra of Zn 2p (a); O 1s (b); C1s (c); Mo3d (d) and Si2p (e).
Figure 5.
X-Ray Photoelectron Spectroscopy (XPS) spectra of Zn 2p (a); O 1s (b); C1s (c); Mo3d (d) and Si2p (e).
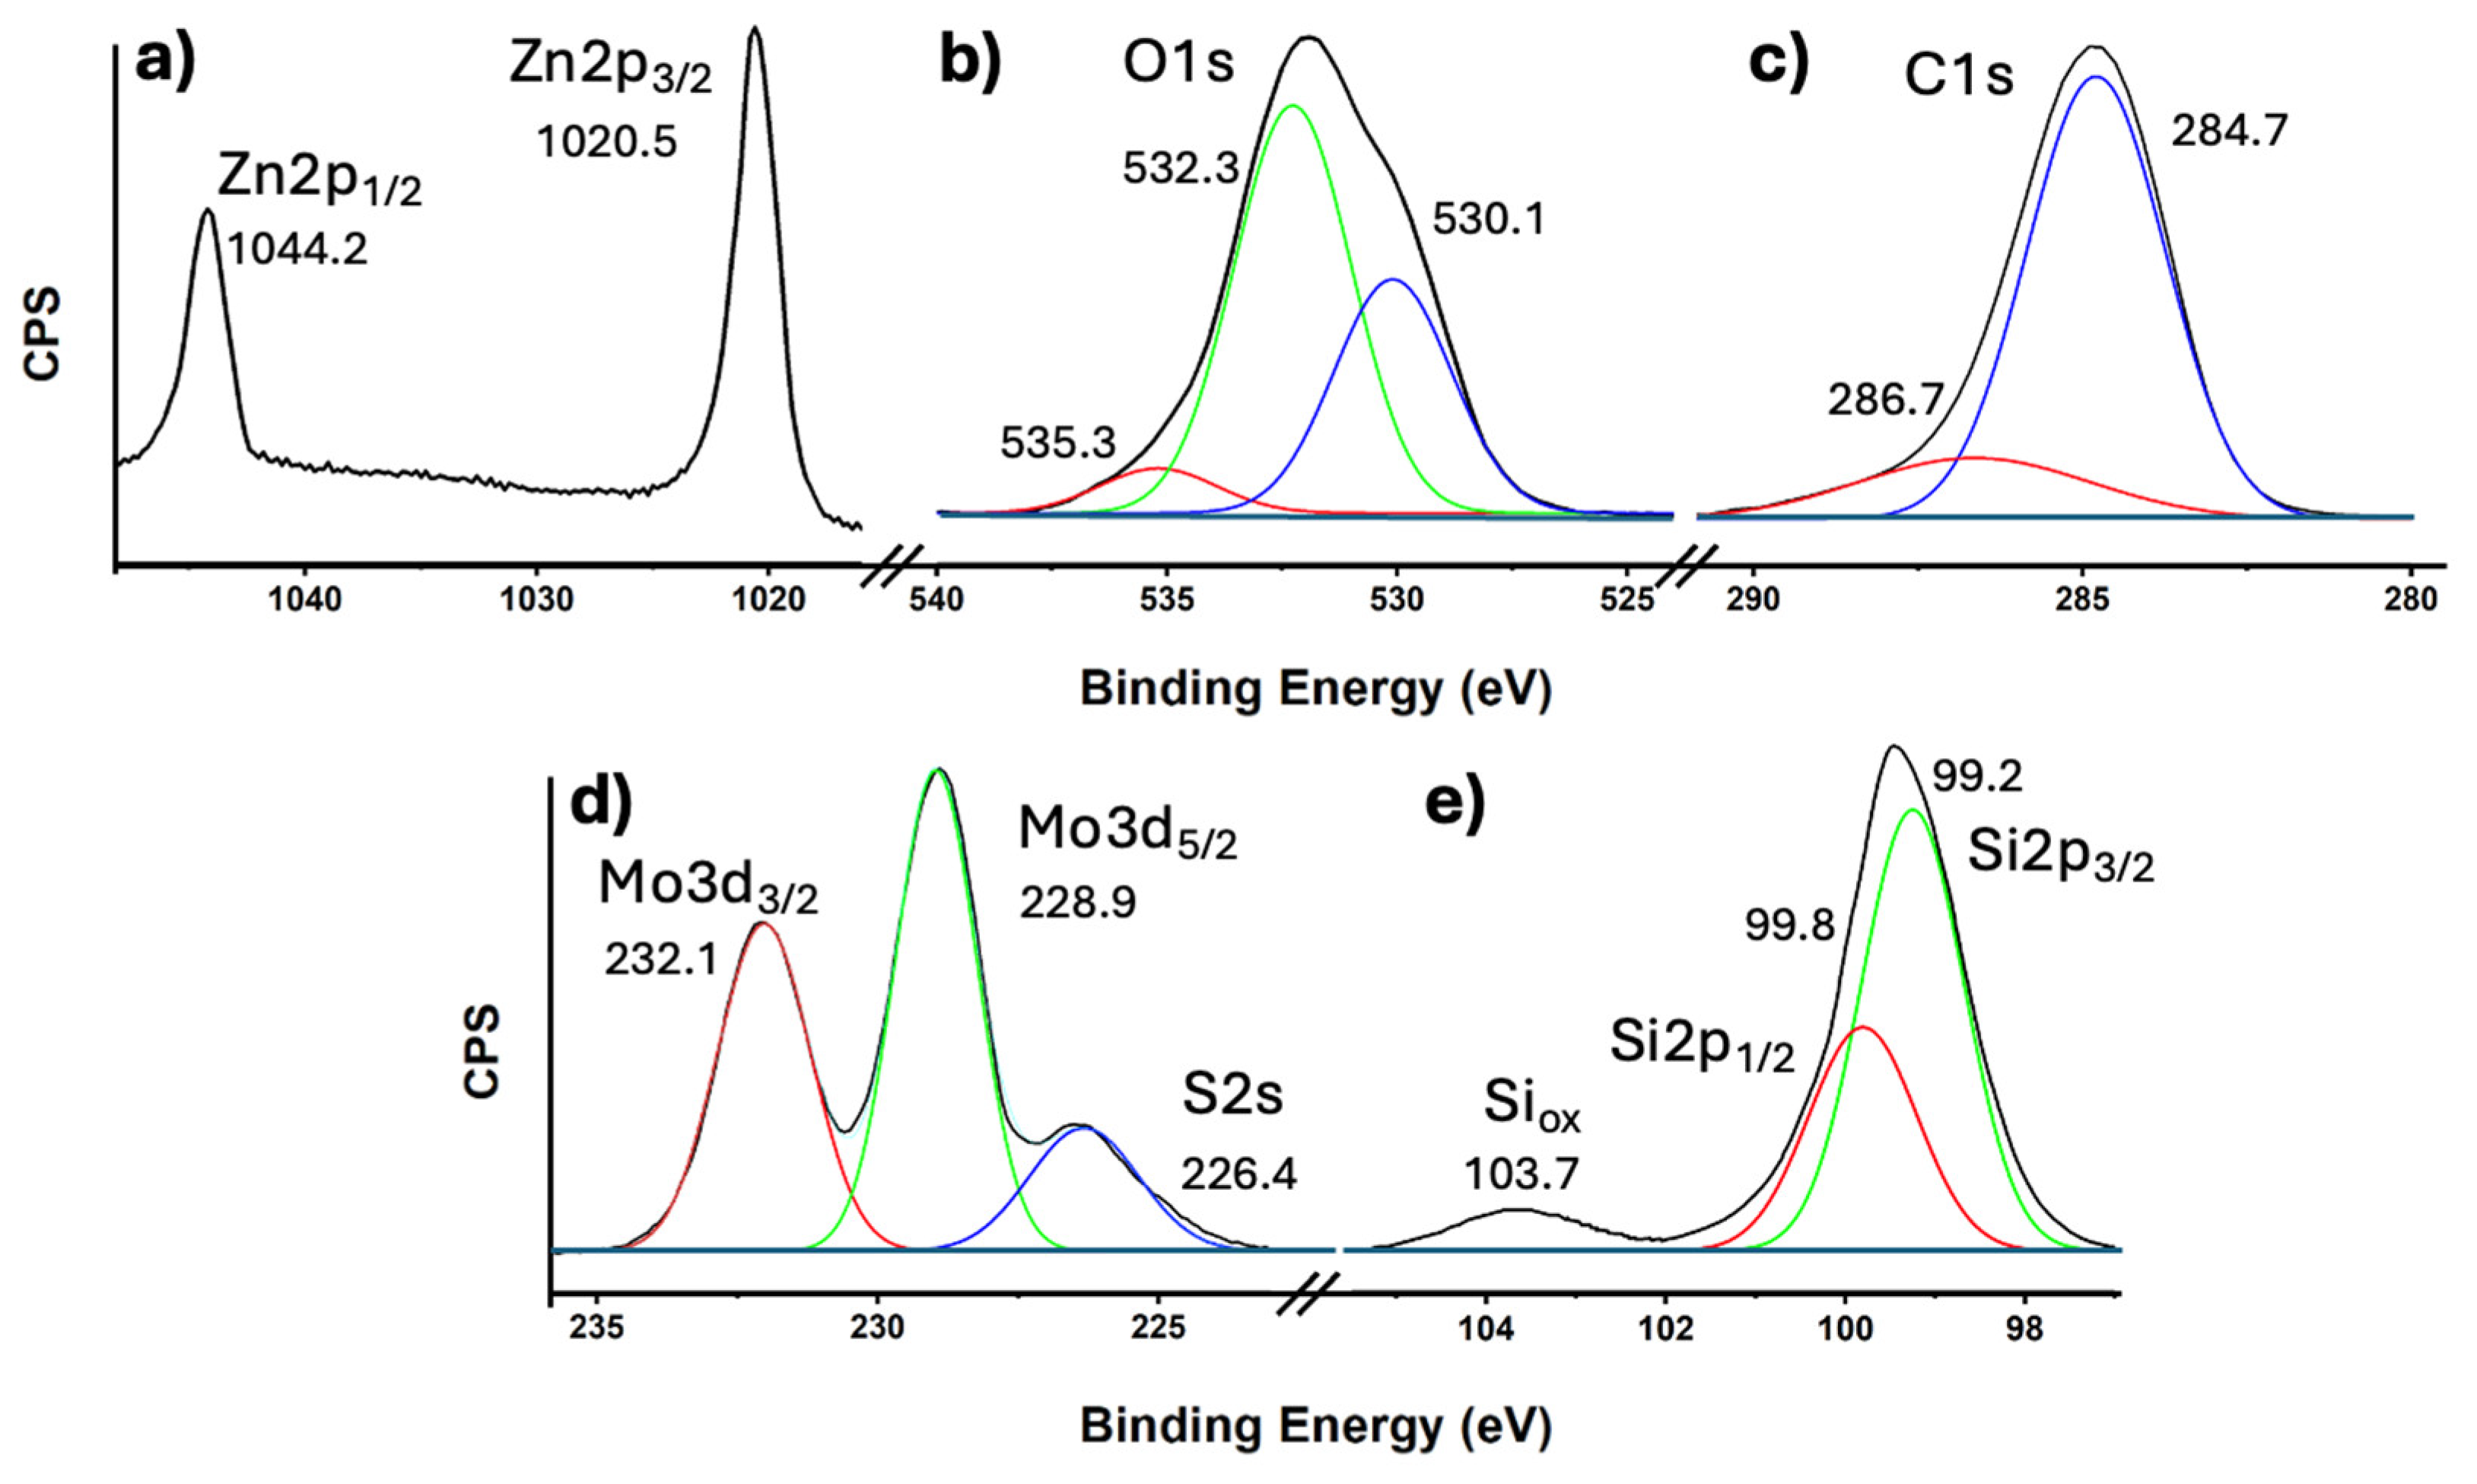
Figure 6.
Tauc plots of (αhn)2 versus energy (eV), and determination of the bandgap energy of ZnONPs (a); ZnONPs-CNTs (b); 5%(MoS₂-SiNWs)@ZnONPs-CNTs (c); 6.7%(MoS₂-SiNWs)@ZnONPs-CNTs (d); and MoS2-SiNWs (e).
Figure 6.
Tauc plots of (αhn)2 versus energy (eV), and determination of the bandgap energy of ZnONPs (a); ZnONPs-CNTs (b); 5%(MoS₂-SiNWs)@ZnONPs-CNTs (c); 6.7%(MoS₂-SiNWs)@ZnONPs-CNTs (d); and MoS2-SiNWs (e).
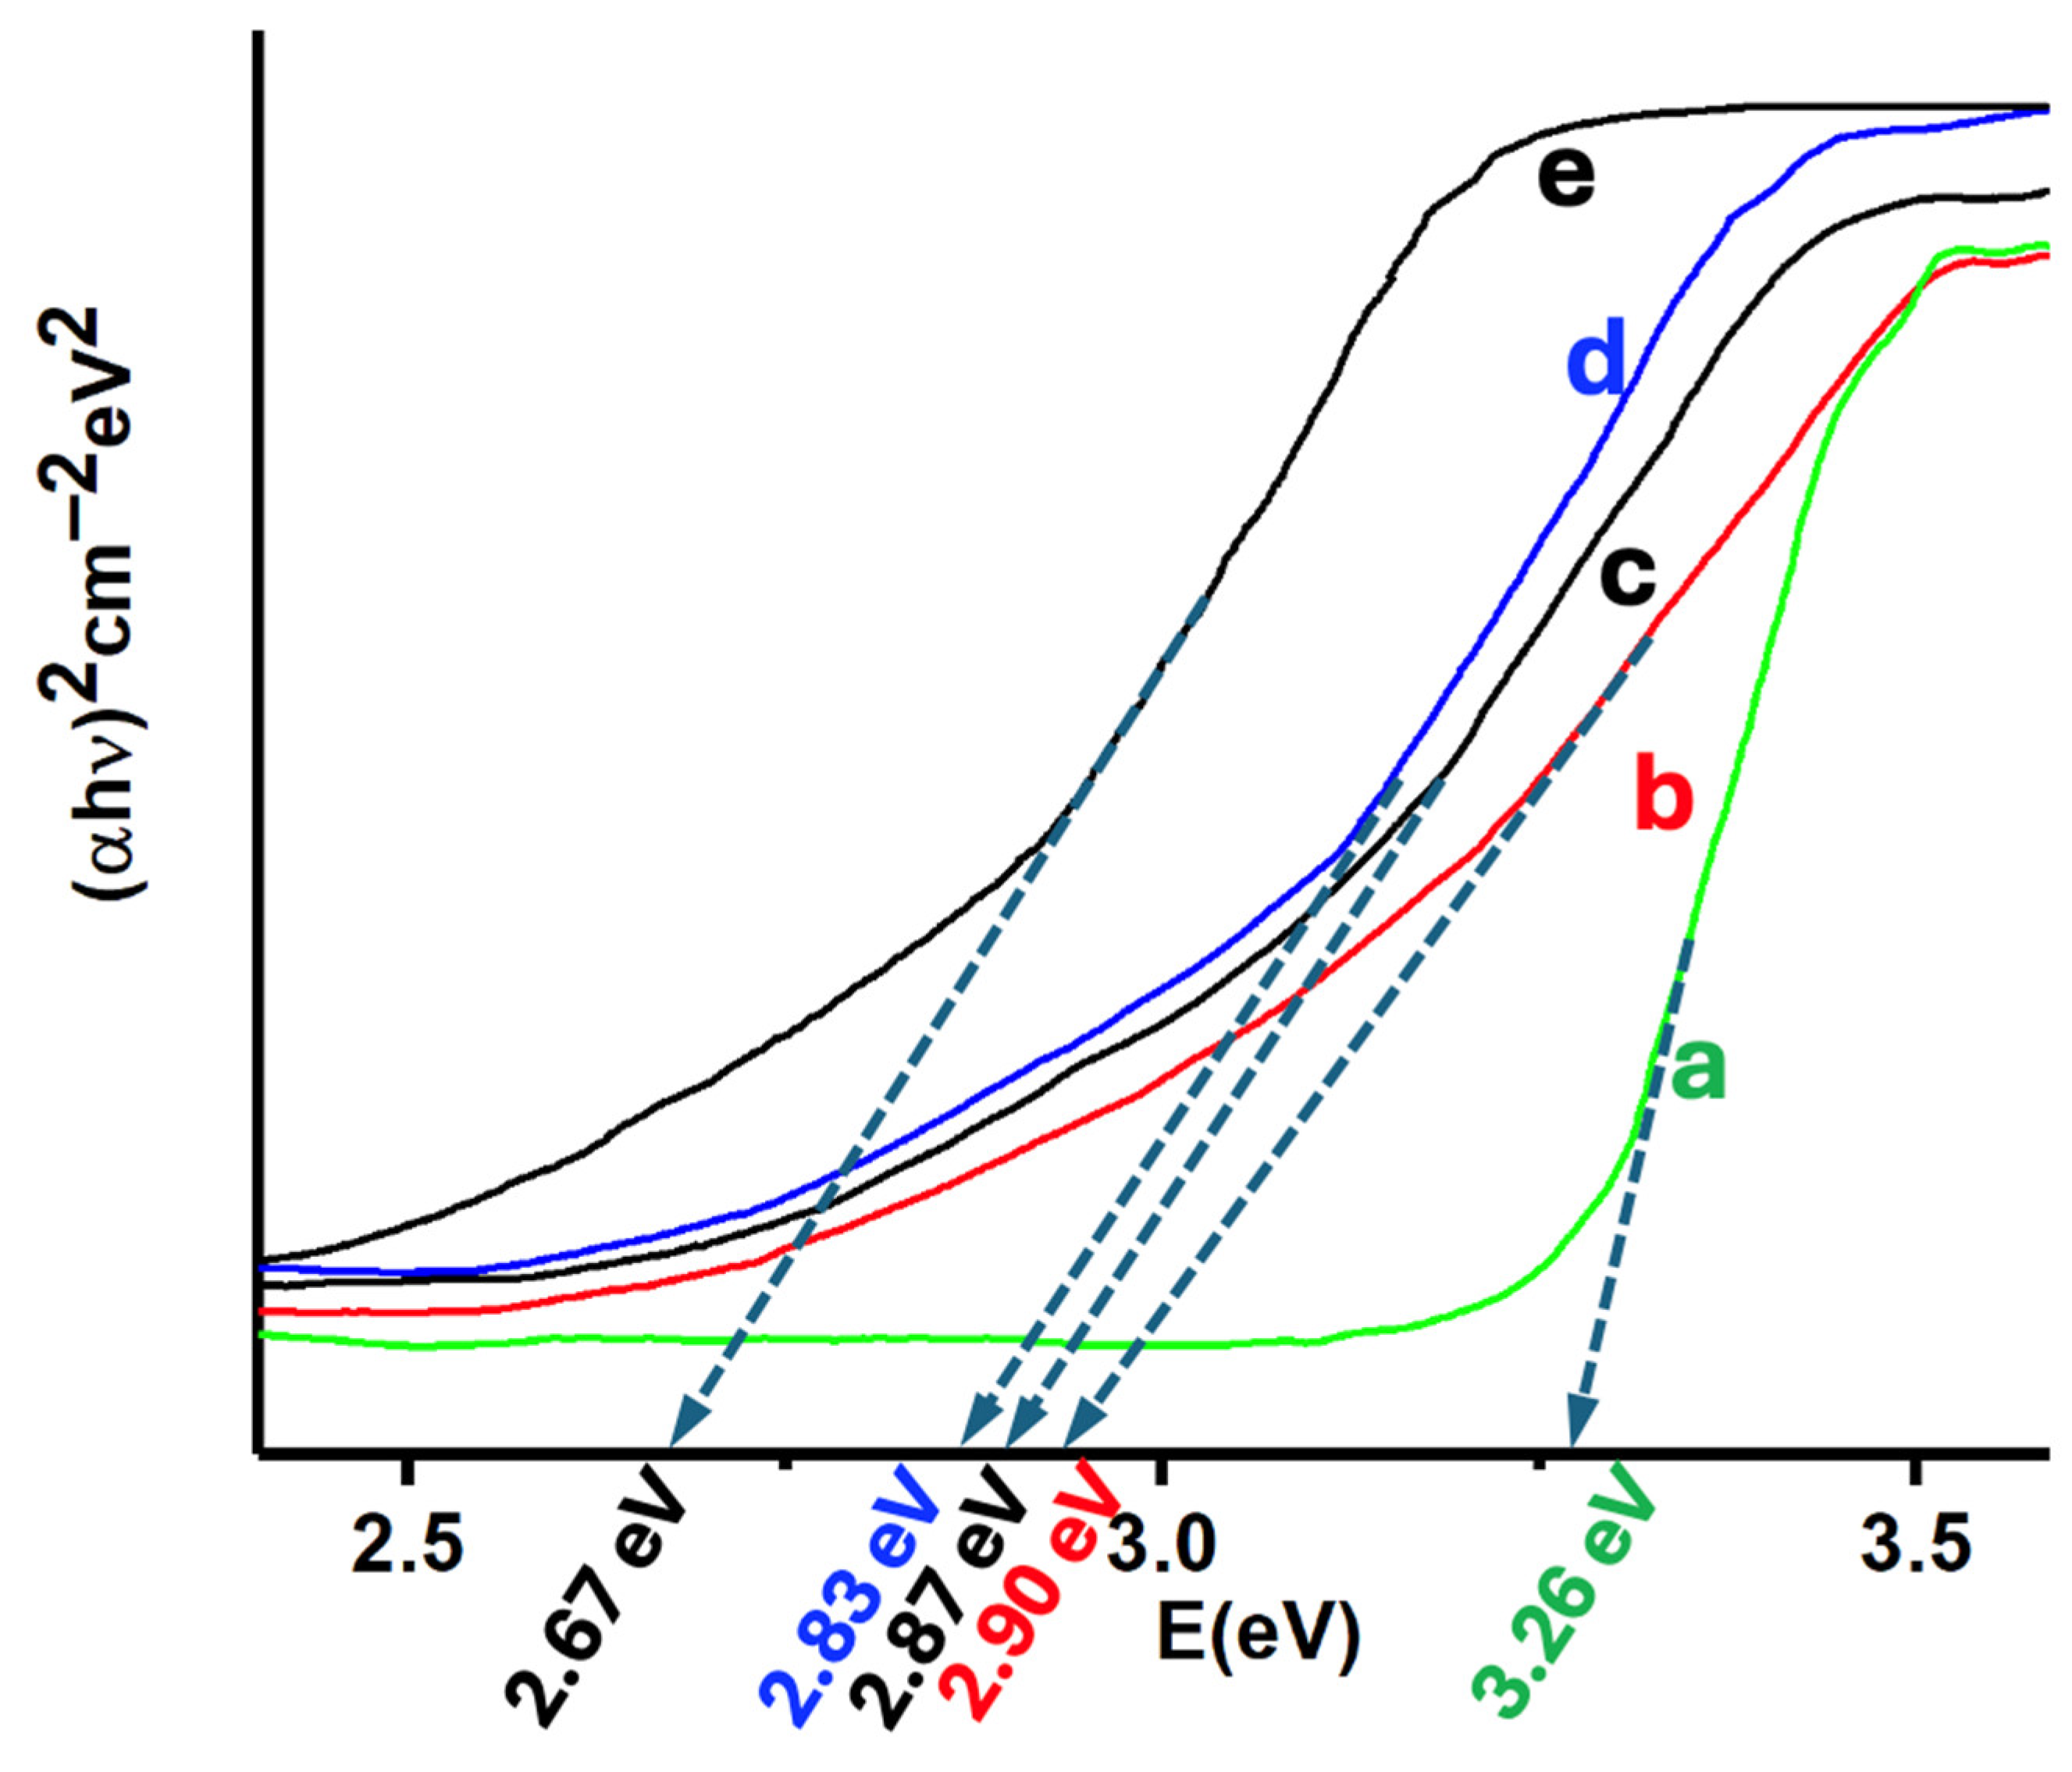
Figure 7.
H2 production profiles of the synthesized materials under irradiation at different wavelengths. ZnONPs-CNTs (a); 5%(MoS2-SiNWs)@ZnONPs-CNTs (b); 6.7%(MoS2-SiNWs)@ZnONPs-CNTs (c). The vertical lines represent the average error of each measurement.
Figure 7.
H2 production profiles of the synthesized materials under irradiation at different wavelengths. ZnONPs-CNTs (a); 5%(MoS2-SiNWs)@ZnONPs-CNTs (b); 6.7%(MoS2-SiNWs)@ZnONPs-CNTs (c). The vertical lines represent the average error of each measurement.
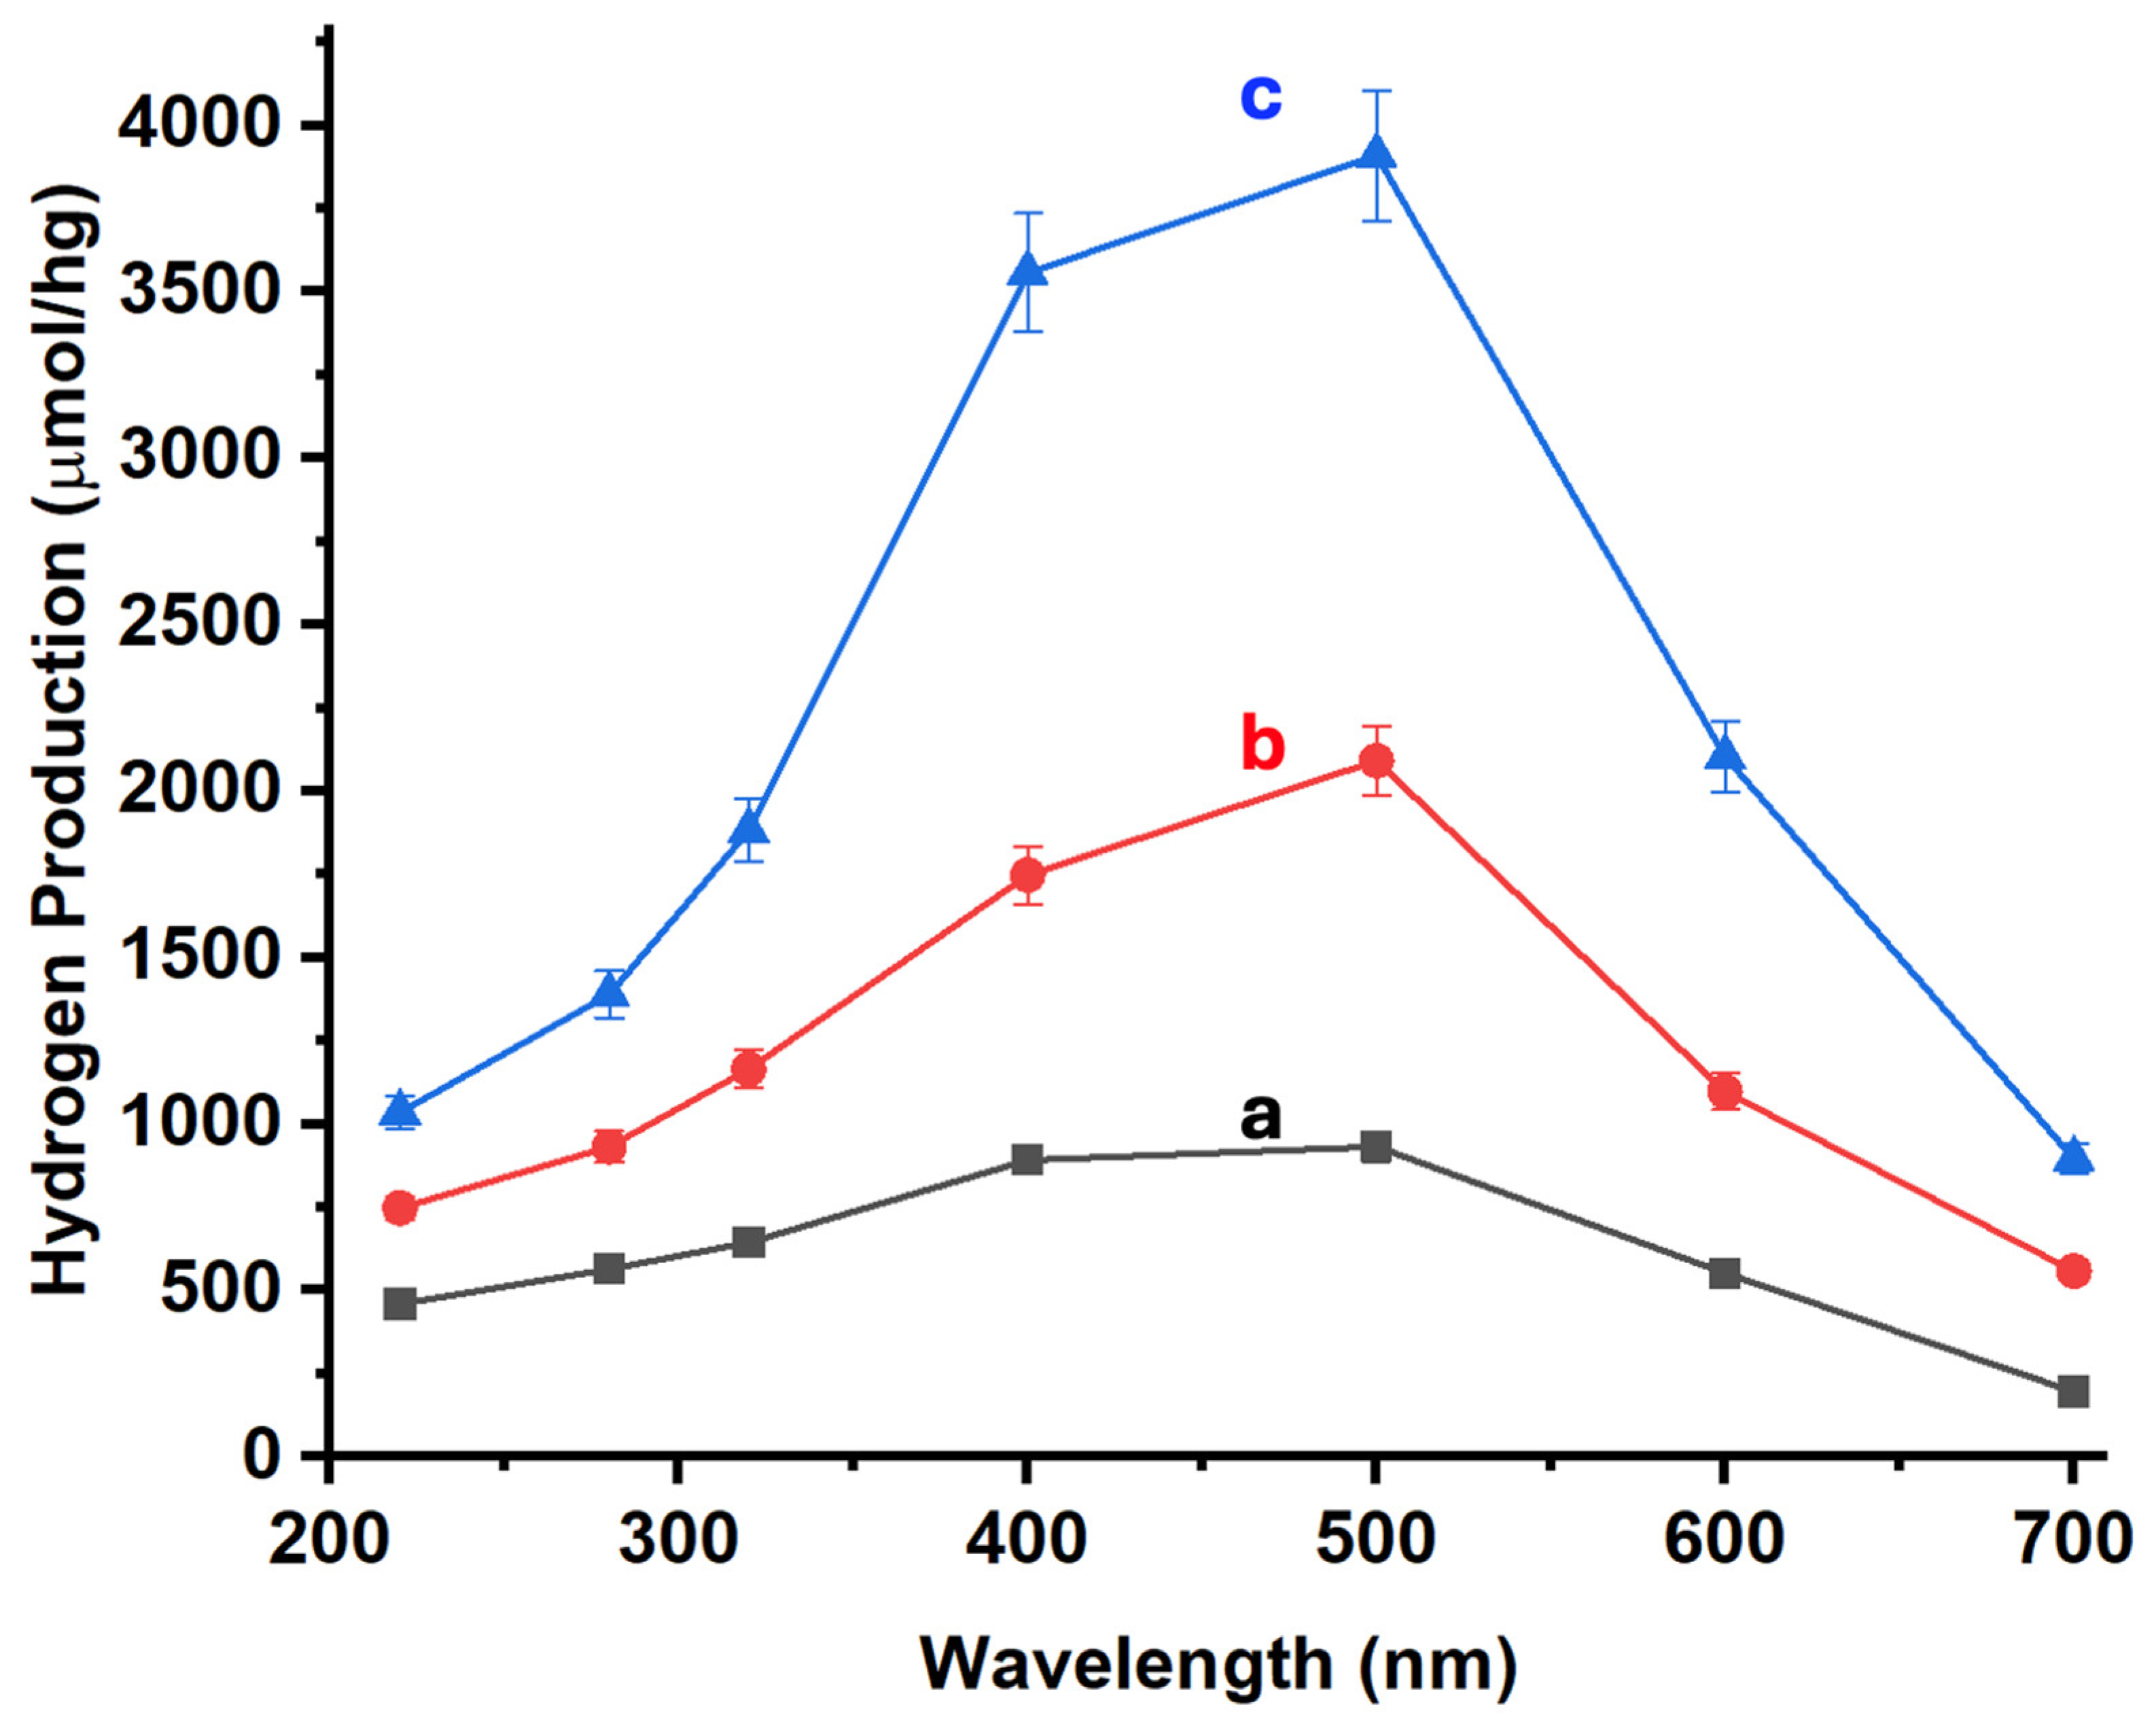
Figure 8.
Transient photocurrent response in the light on−off processes of ZnONPs (a); ZnONPs-CNTs (b); 5%(MoS2-SiNWs)@ZnONPs-CNTs (c); and 6.7%(MoS2-SiNWs)@ZnONPs-CNTs (d), at 500 nm.
Figure 8.
Transient photocurrent response in the light on−off processes of ZnONPs (a); ZnONPs-CNTs (b); 5%(MoS2-SiNWs)@ZnONPs-CNTs (c); and 6.7%(MoS2-SiNWs)@ZnONPs-CNTs (d), at 500 nm.
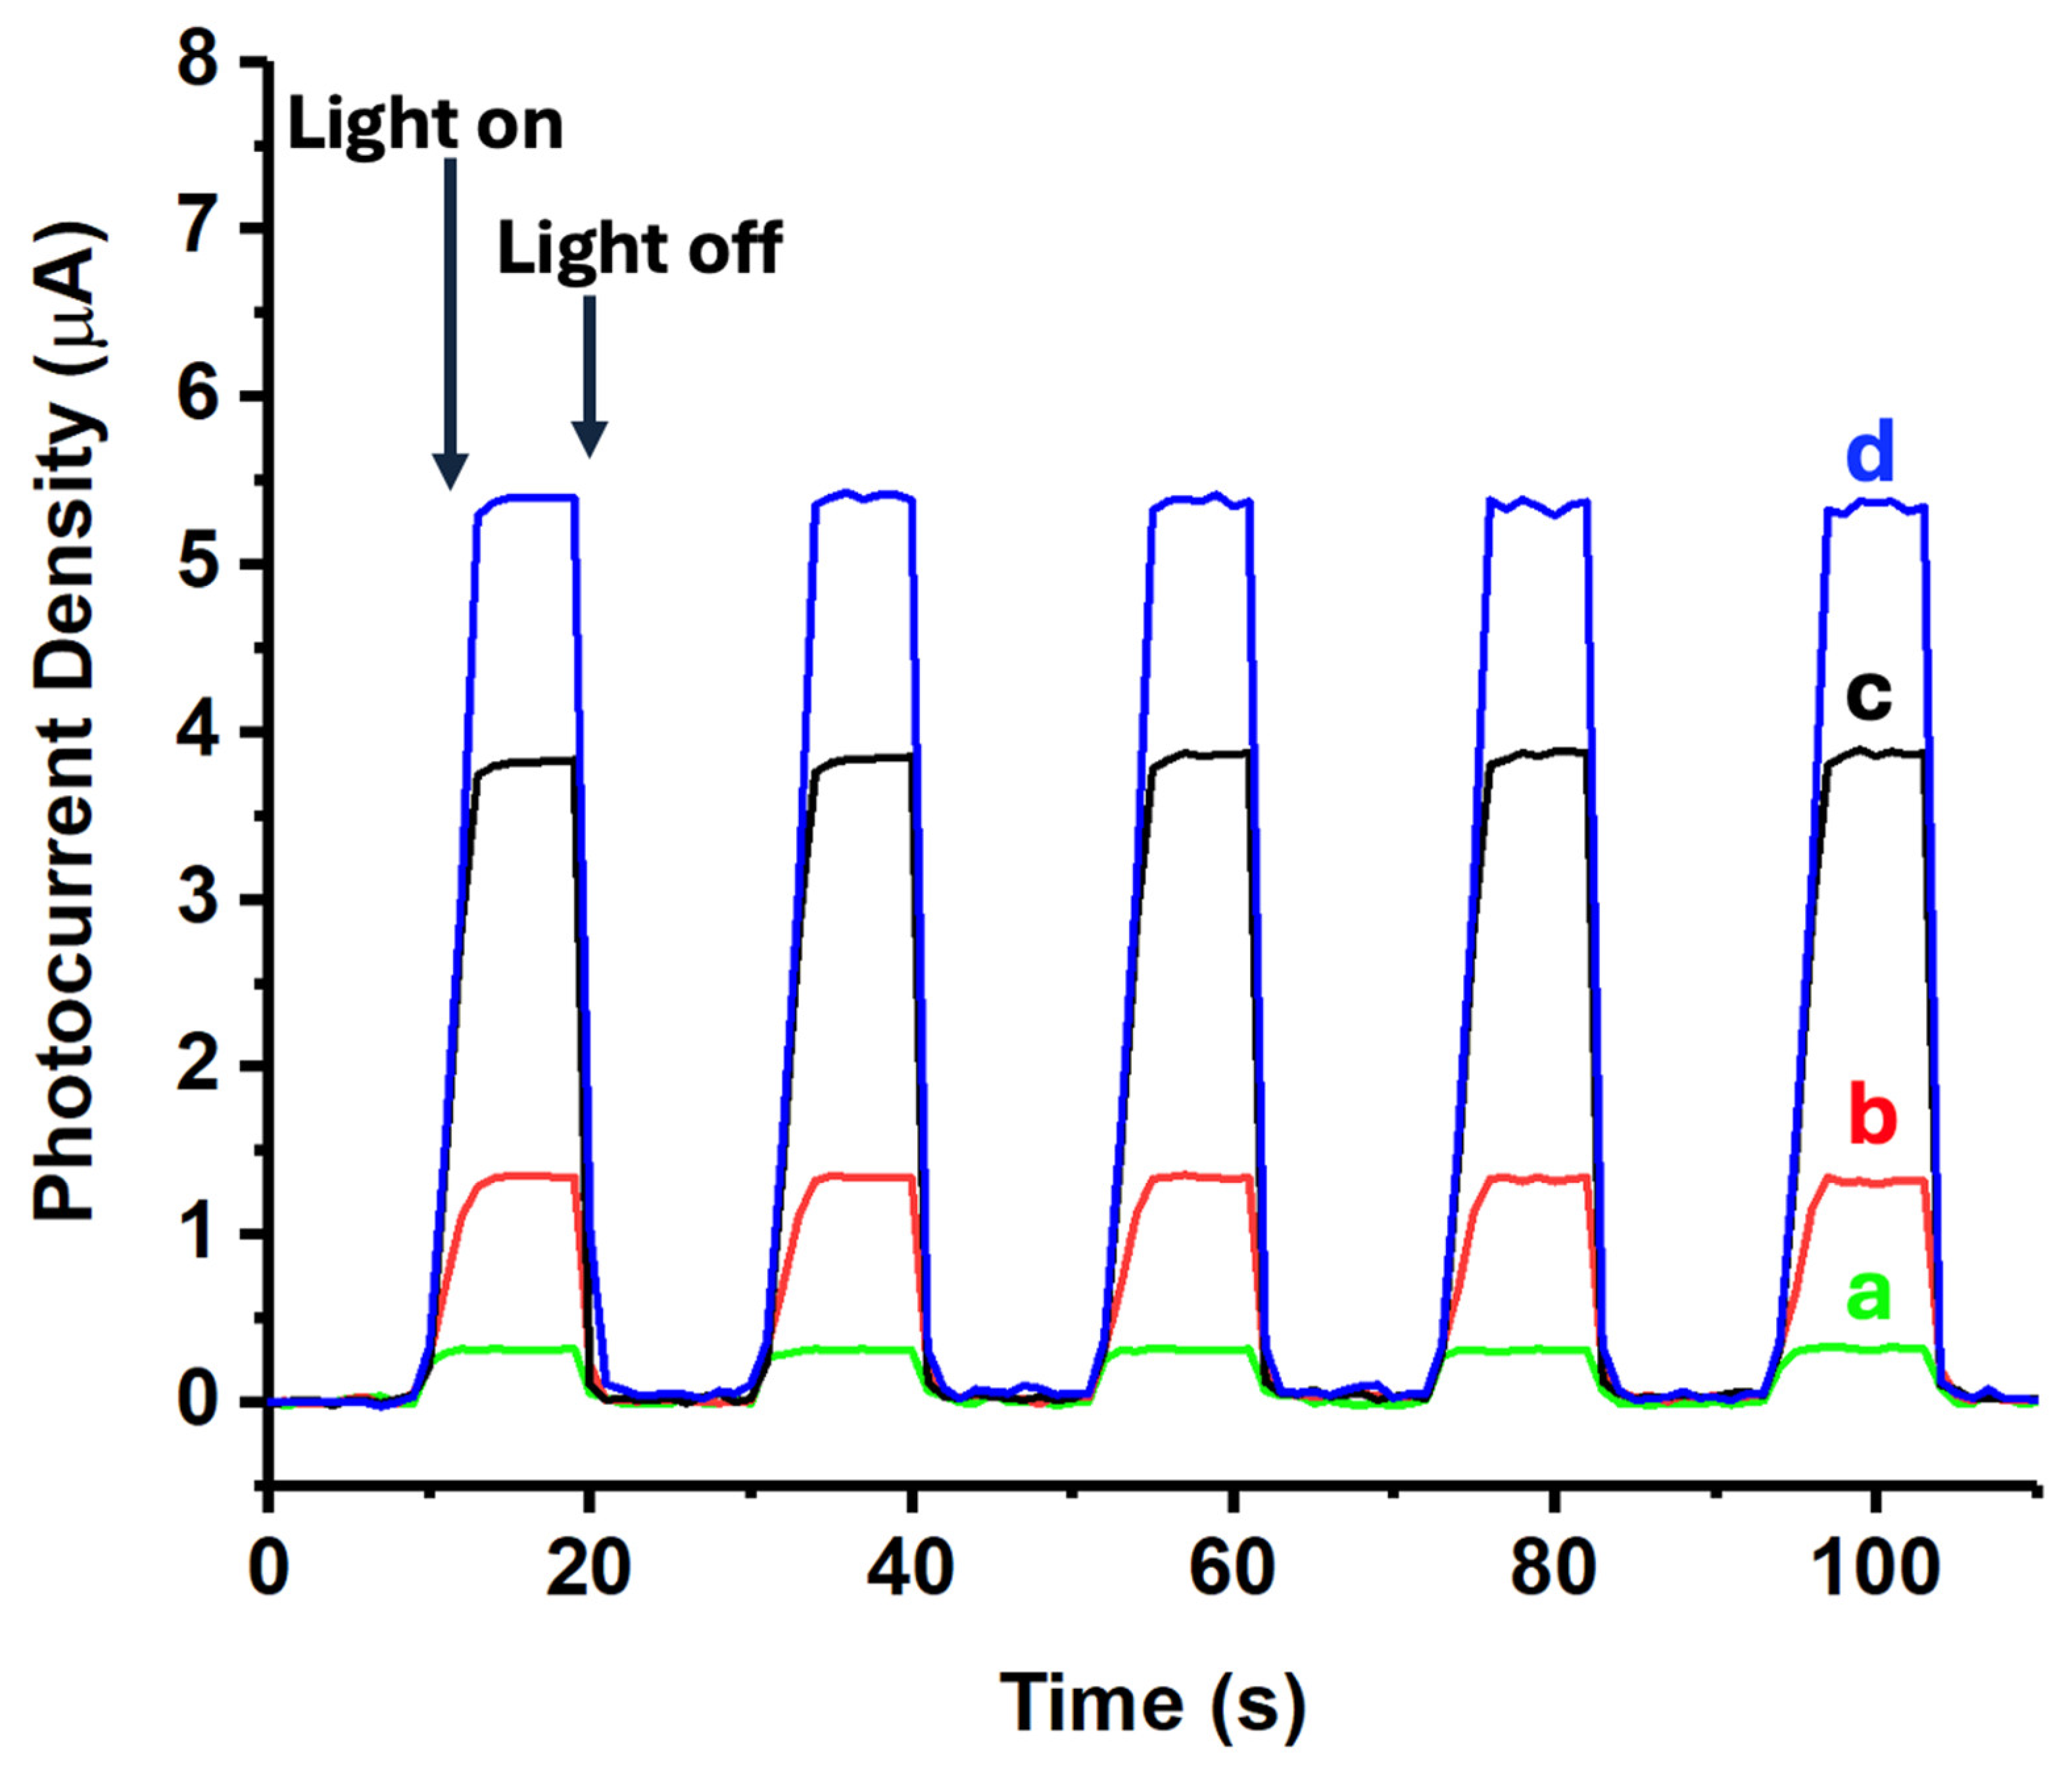
Figure 9.
Schematic diagram of the proposed mechanism for hydrogen production under UV-visible light irradiation.
Figure 9.
Schematic diagram of the proposed mechanism for hydrogen production under UV-visible light irradiation.
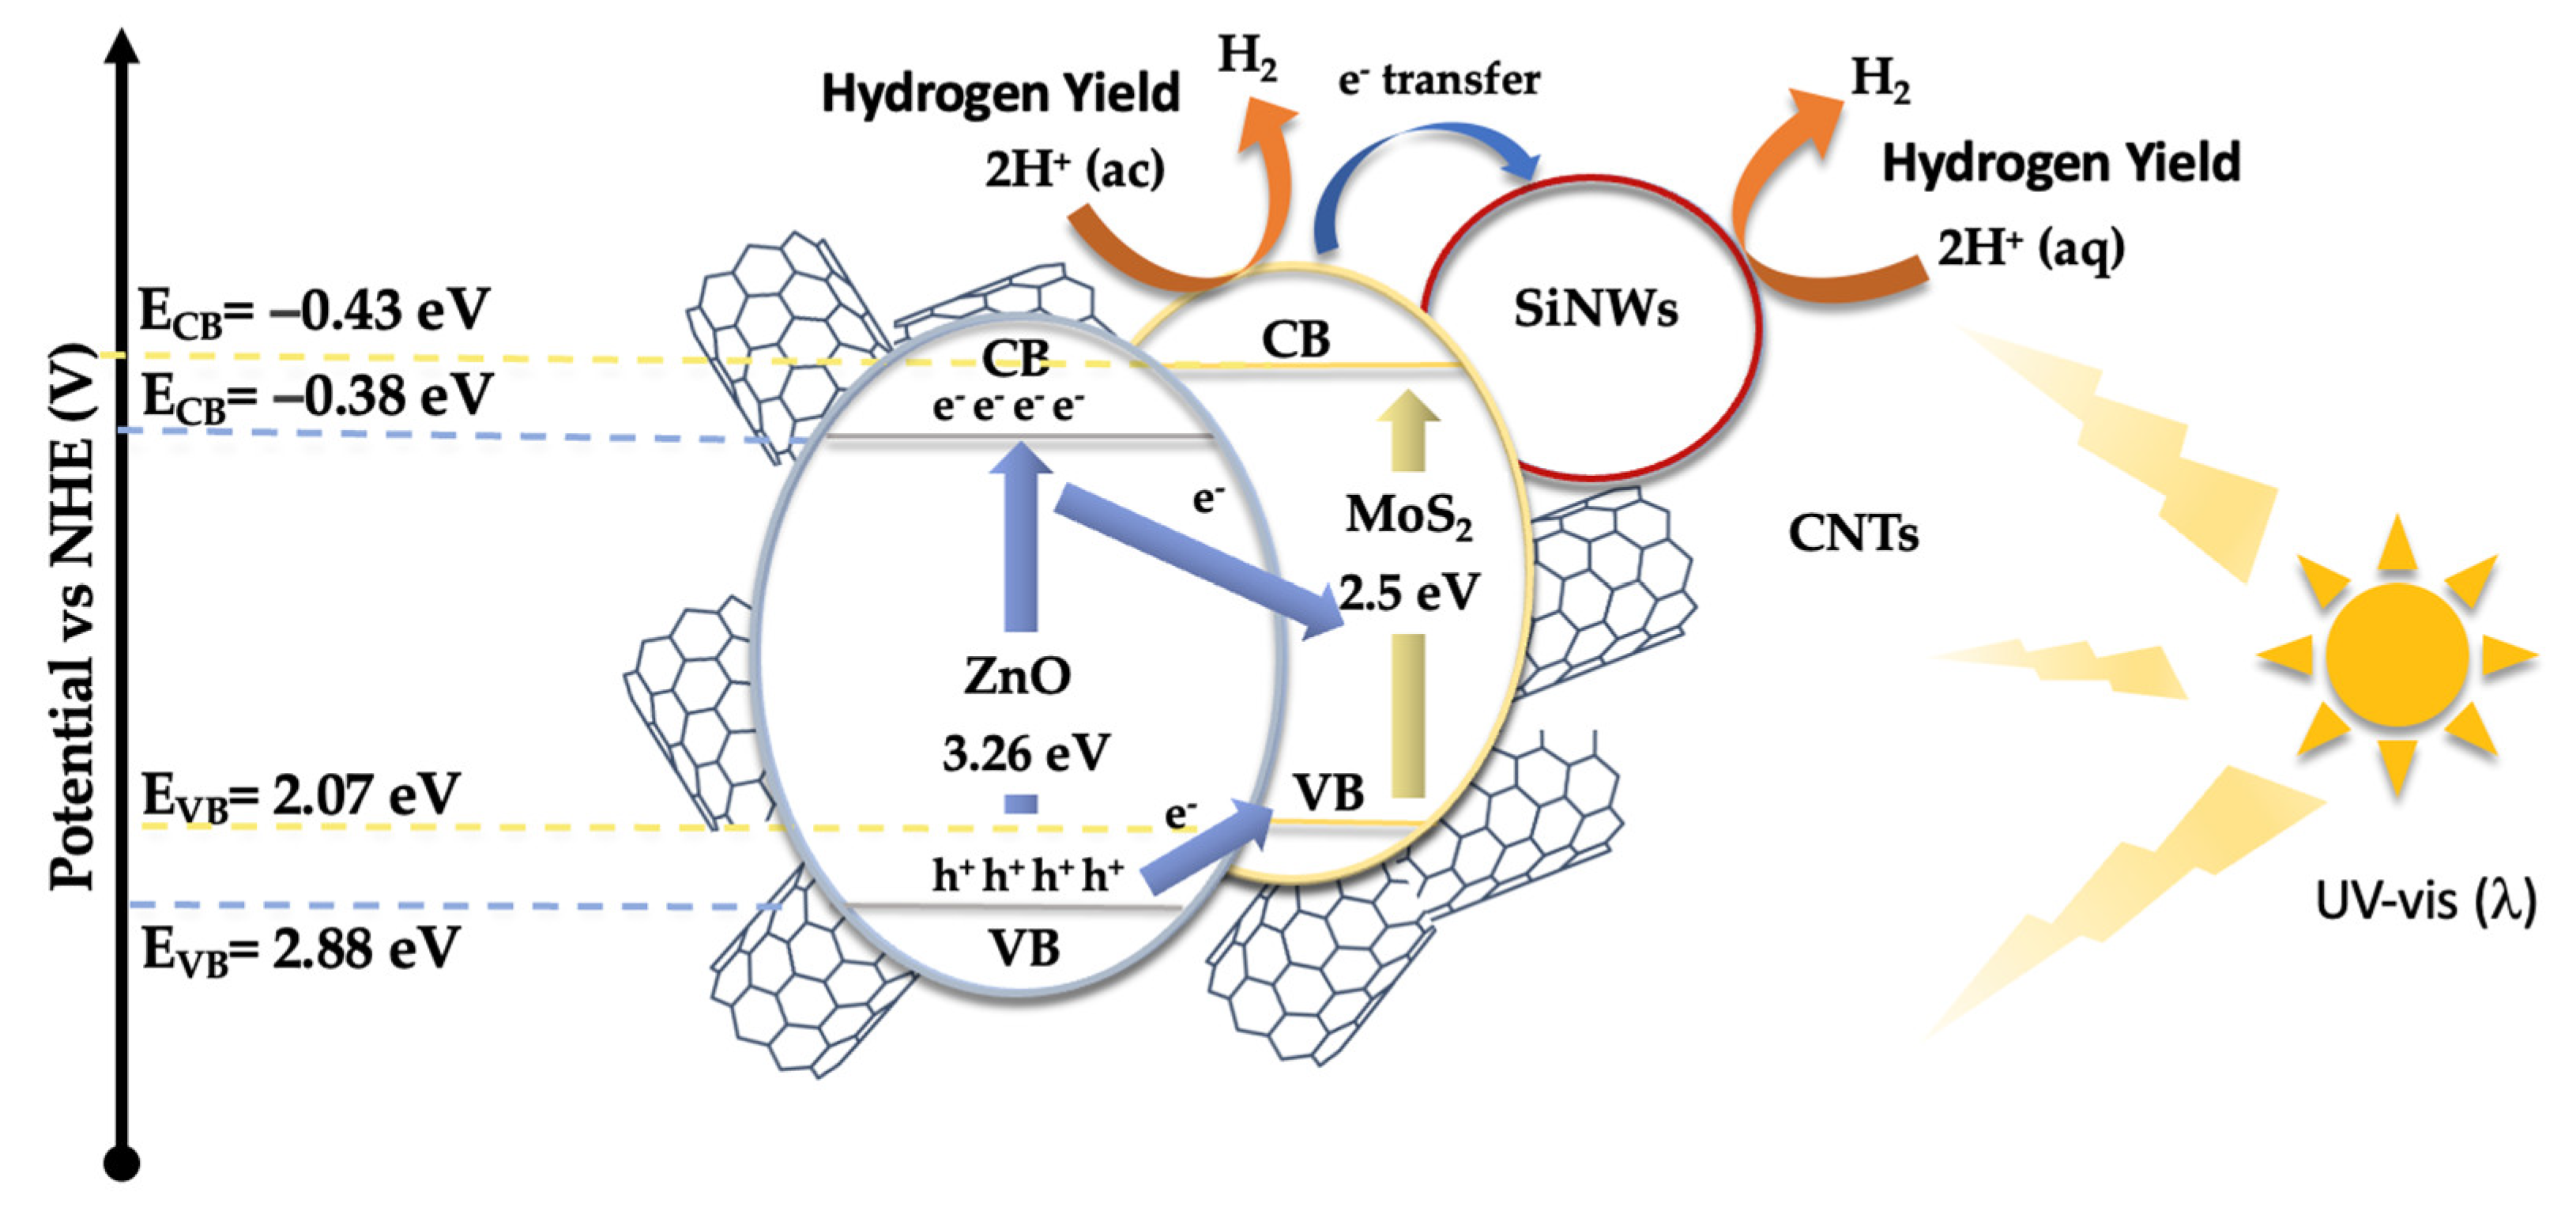
Figure 10.
FESEM images of MoS2@CNTs (a), and MoS2@SiNWs@CNTs (b) composites.
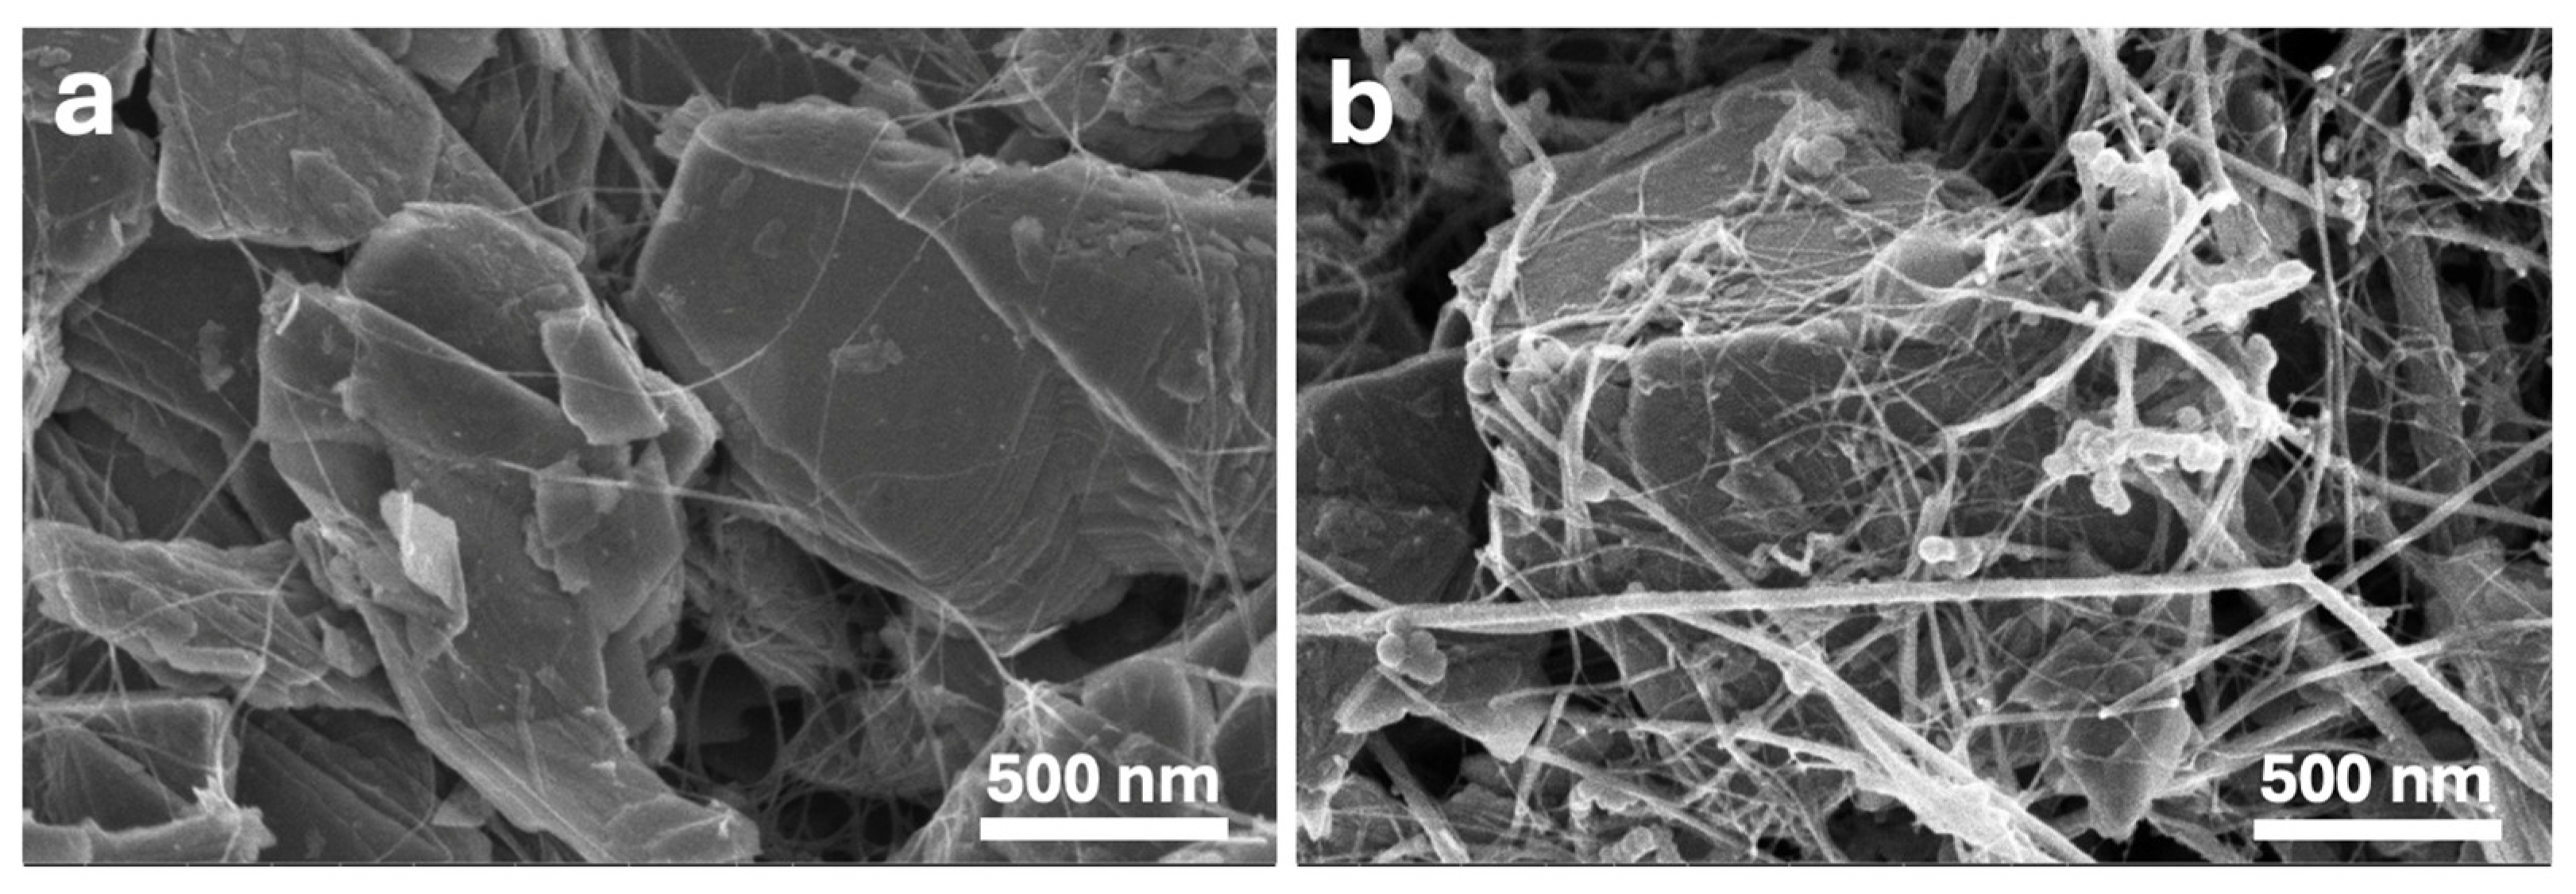
Figure 11.
FESEM image of the MoS2@SiNWs@CNTs composite (a), and elemental EDS mapping (b).
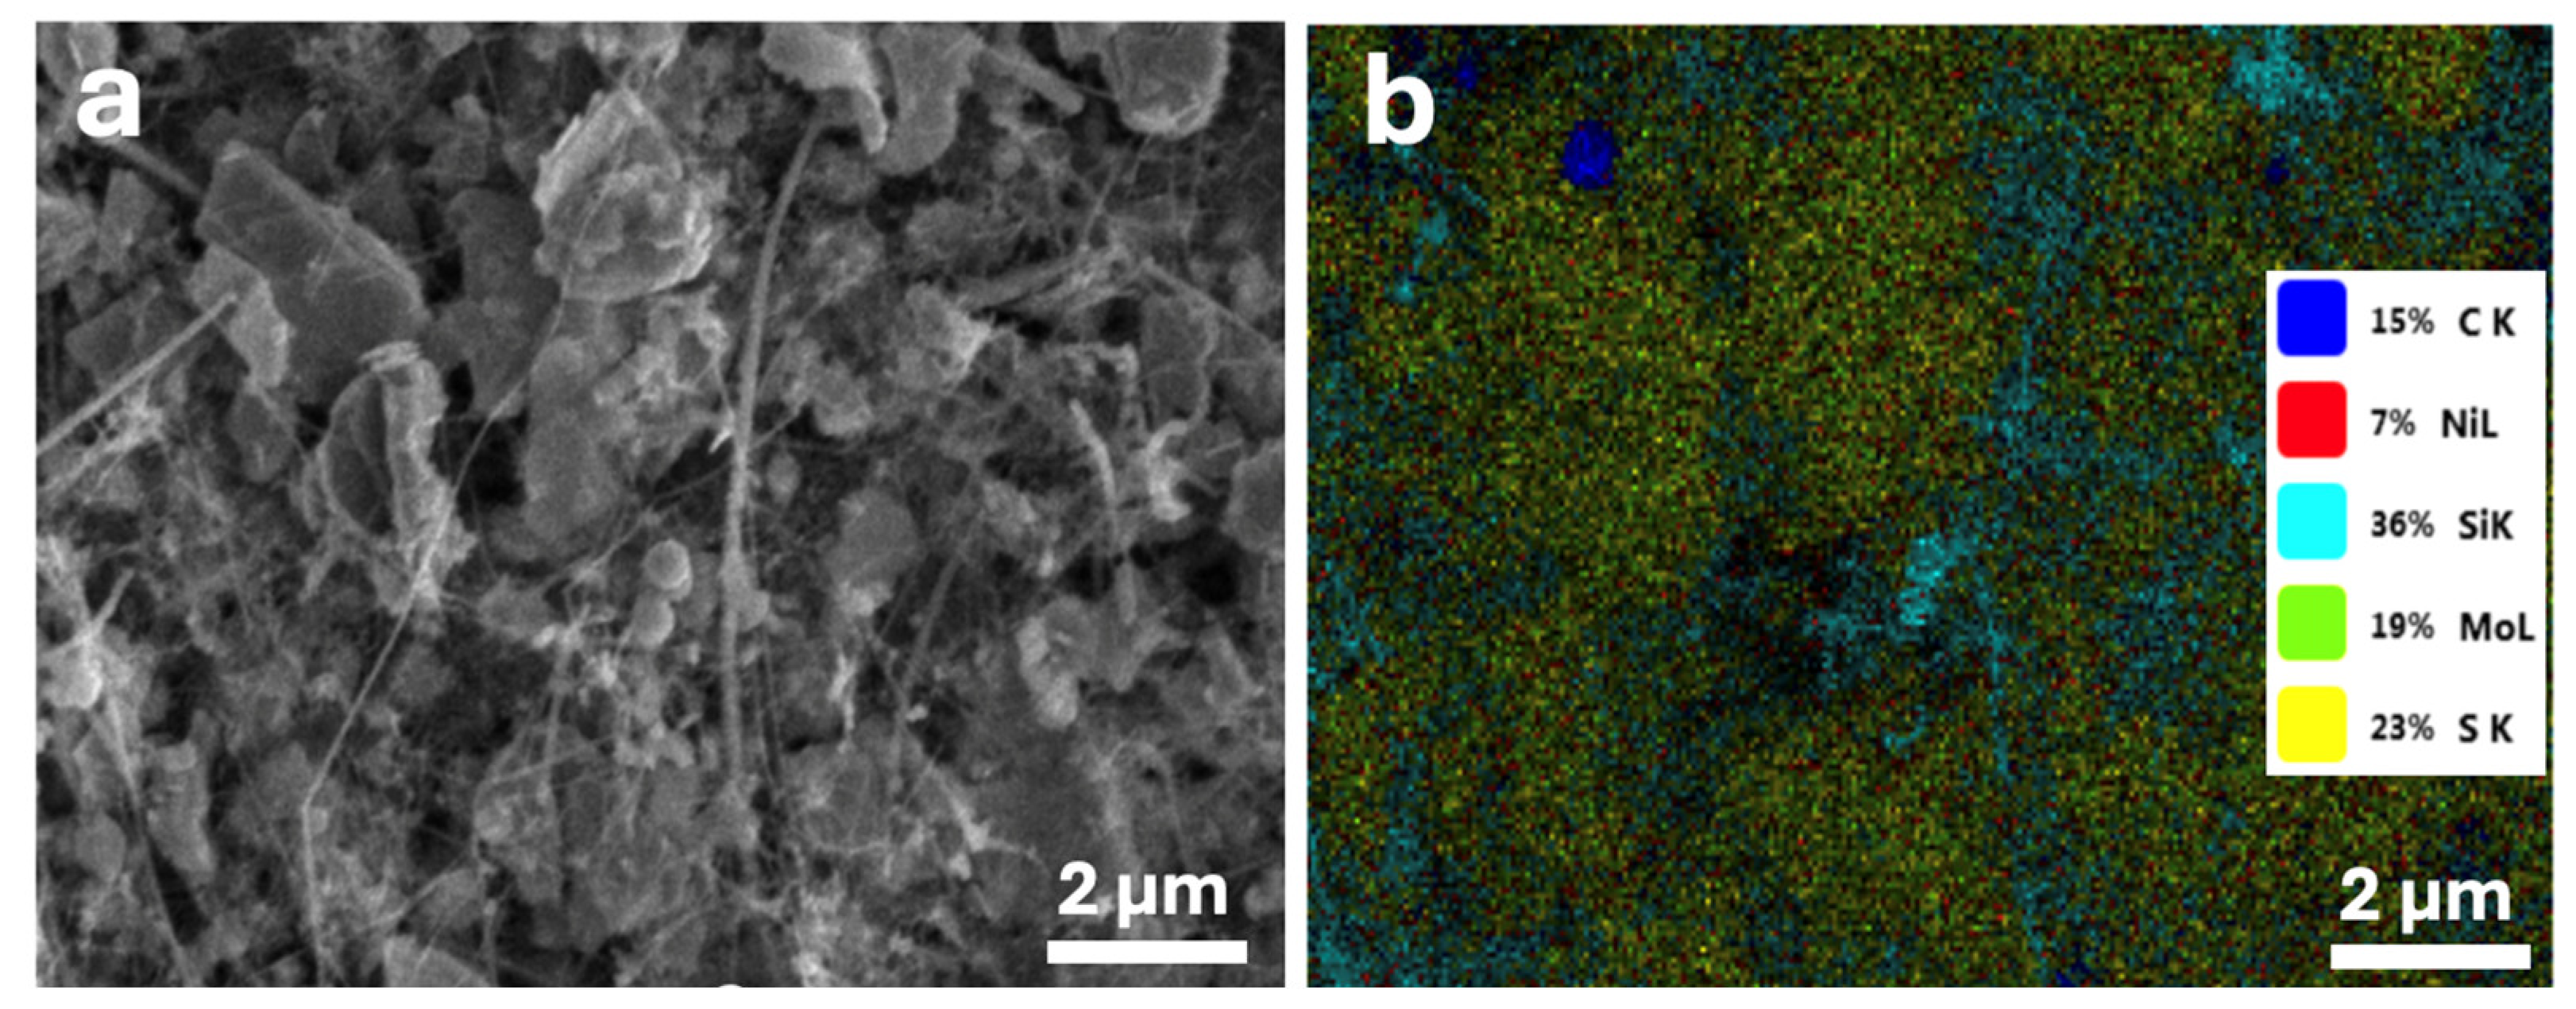
Figure 12.
GCD curves for MoS2 based electrodes, showing no reversibility for pure MoS2 and higher capacity retention for MoS₂@SiNW@CNTs compared to MoS₂@CNTs.
Figure 12.
GCD curves for MoS2 based electrodes, showing no reversibility for pure MoS2 and higher capacity retention for MoS₂@SiNW@CNTs compared to MoS₂@CNTs.
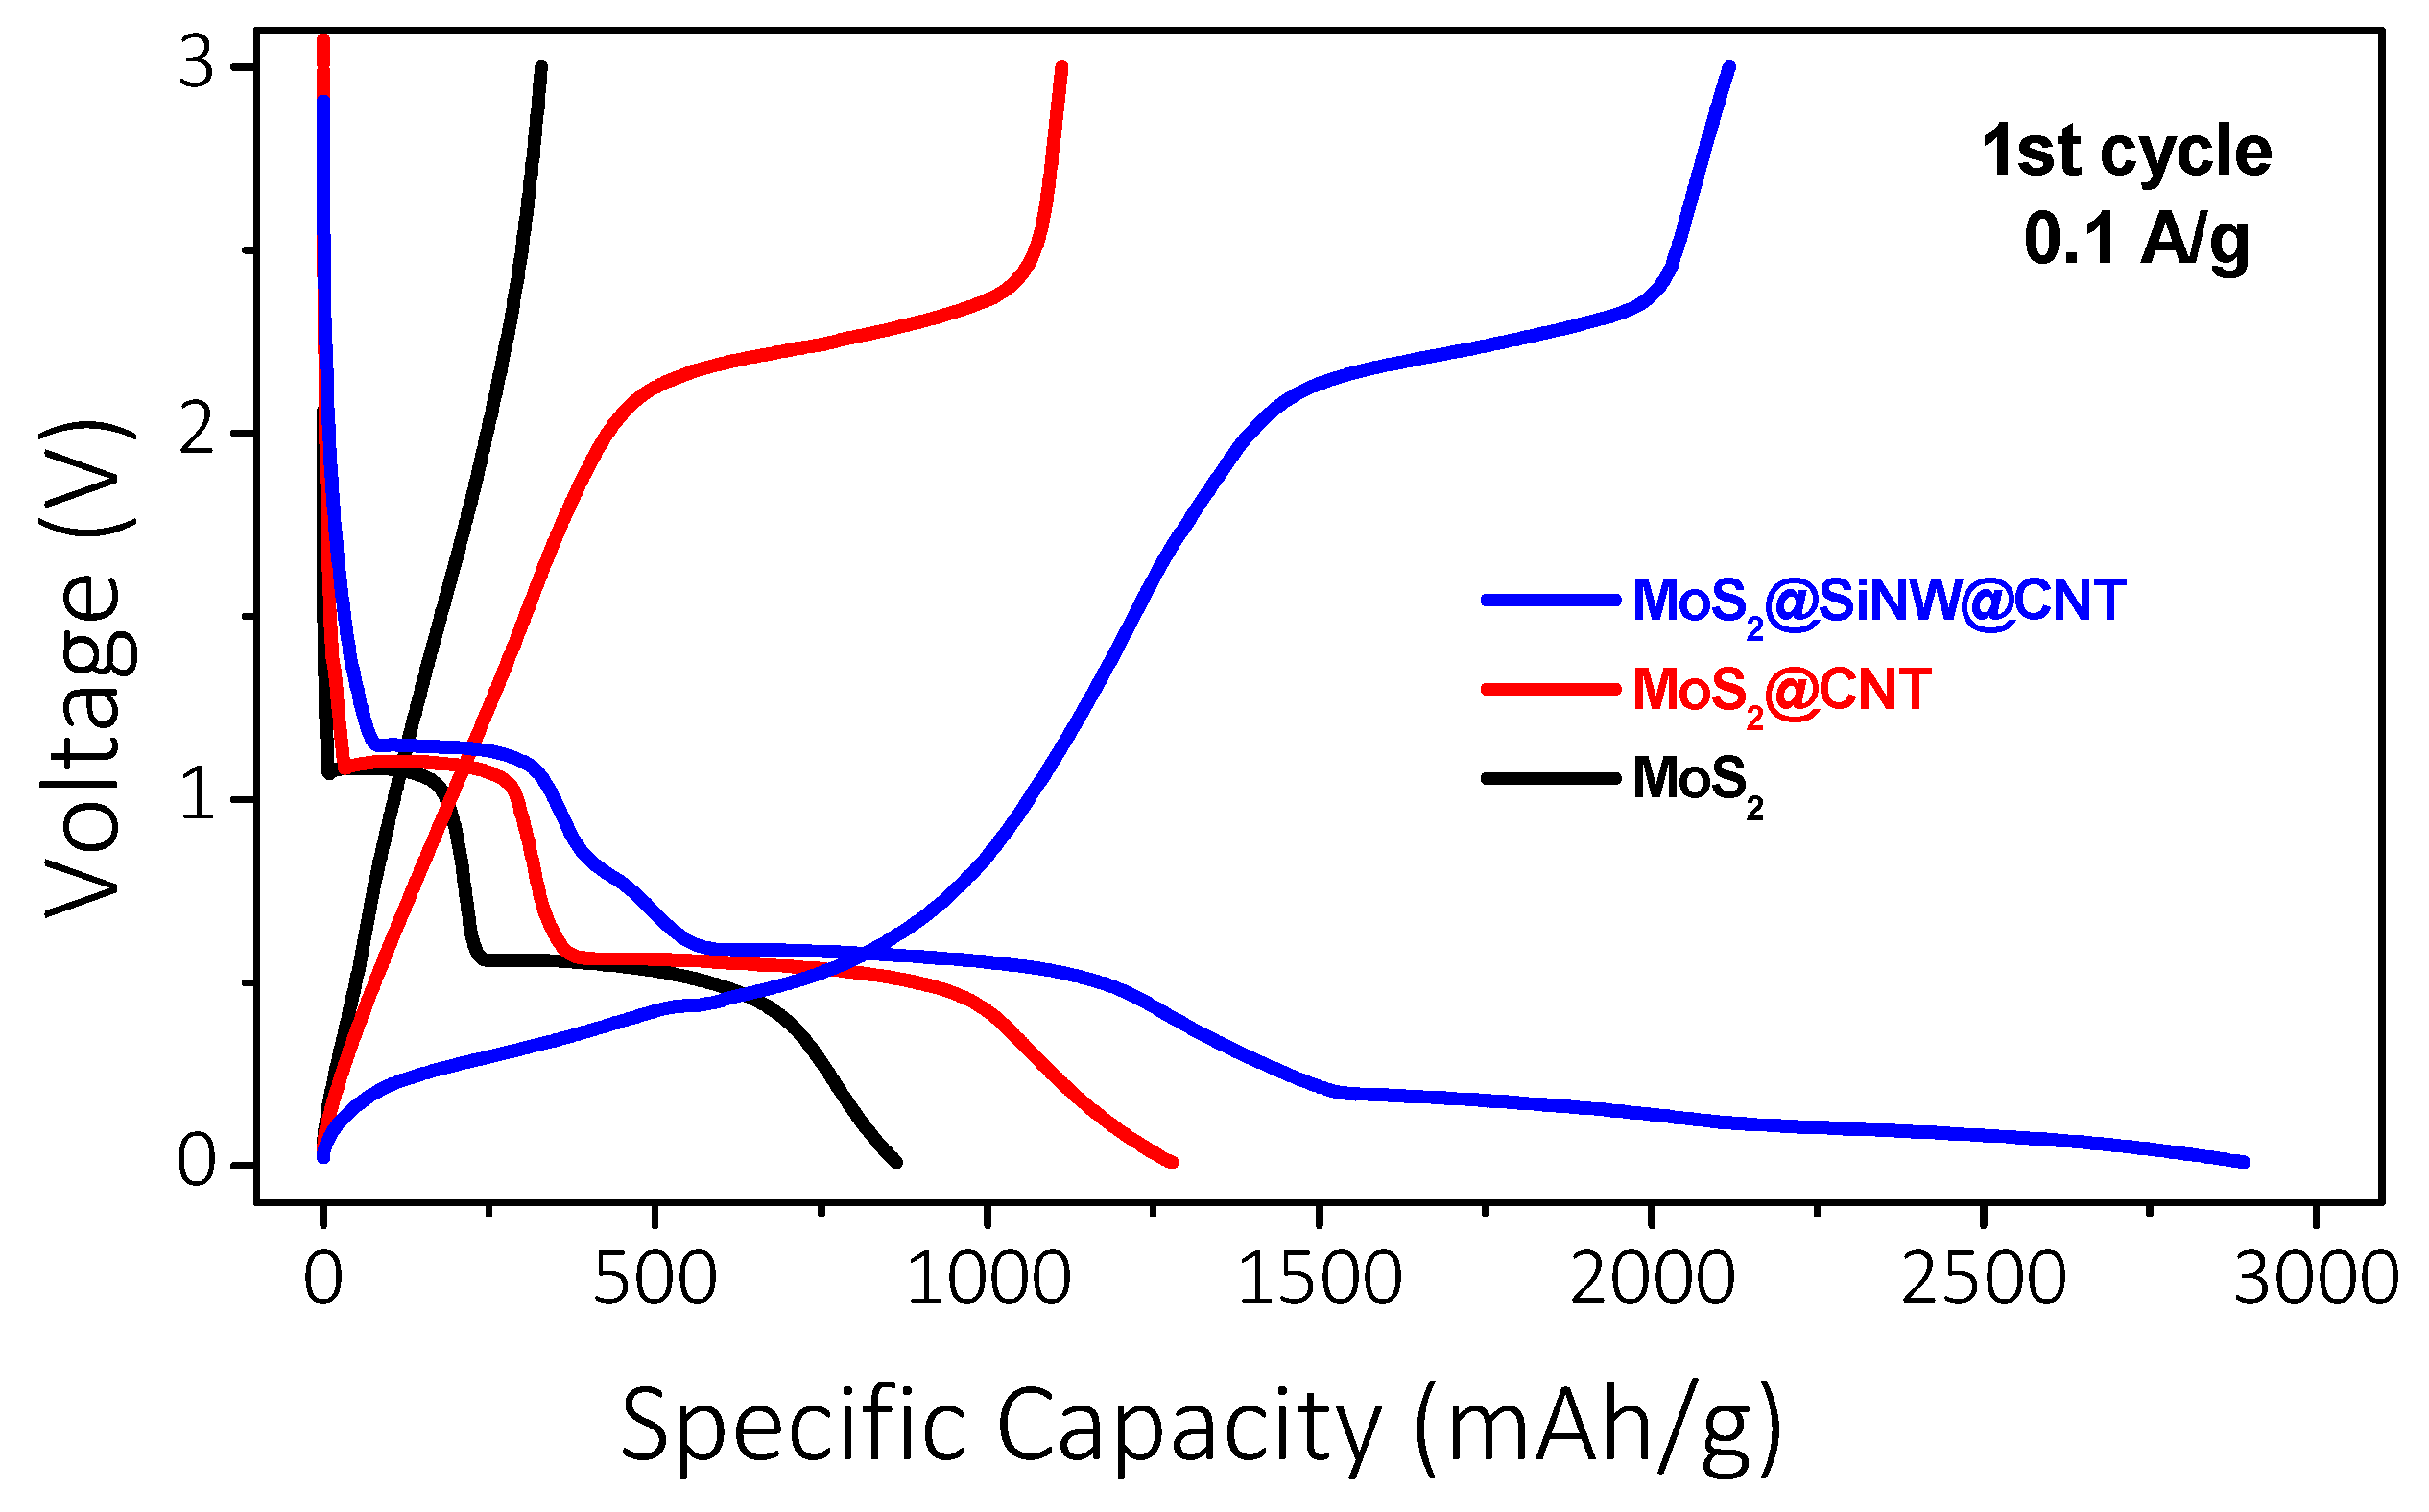
Figure 13.
Galvanostatic charge-discharge (GCD) curves of the MoS₂@CNTs composite electrode at a current density of 0.1 A/g for 25 cycles, showing high specific capacity and good cycling stability (a); Rate performance of the MoS₂@CNTs composite electrode at varying current densities from 0.2 to 2.0 A/g, demonstrating excellent capacity retention when returned to 0.1 A/g (b); Extended cycling performance of the MoS₂@CNT and MoS₂@SiNW@CNT composite electrodes at 1 A/g over 100 cycles, with the MoS₂@SiNW@CNT composite achieving higher specific capacity and enhanced stability, maintaining a capacity of ~1000 mAh/g after 100 cycles (c); Cyclic voltammograms (CV) after 100 cycles, showing distinct redox peaks for MoS₂ and SiNWs in the MoS₂@SiNW@CNT composite electrode (d); Differential capacity (dQ/dV) curves, indicating consistent lithium intercalation/de-intercalation behavior in the MoS₂@SiNW@CNT electrode(e); and Electrochemical impedance spectroscopy (EIS) plots of MoS₂@CNT and MoS₂@SiNW@CNT electrodes, showing lower charge transfer resistance in the SiNW-containing composite, contributing to its superior electrochemical performance (f).
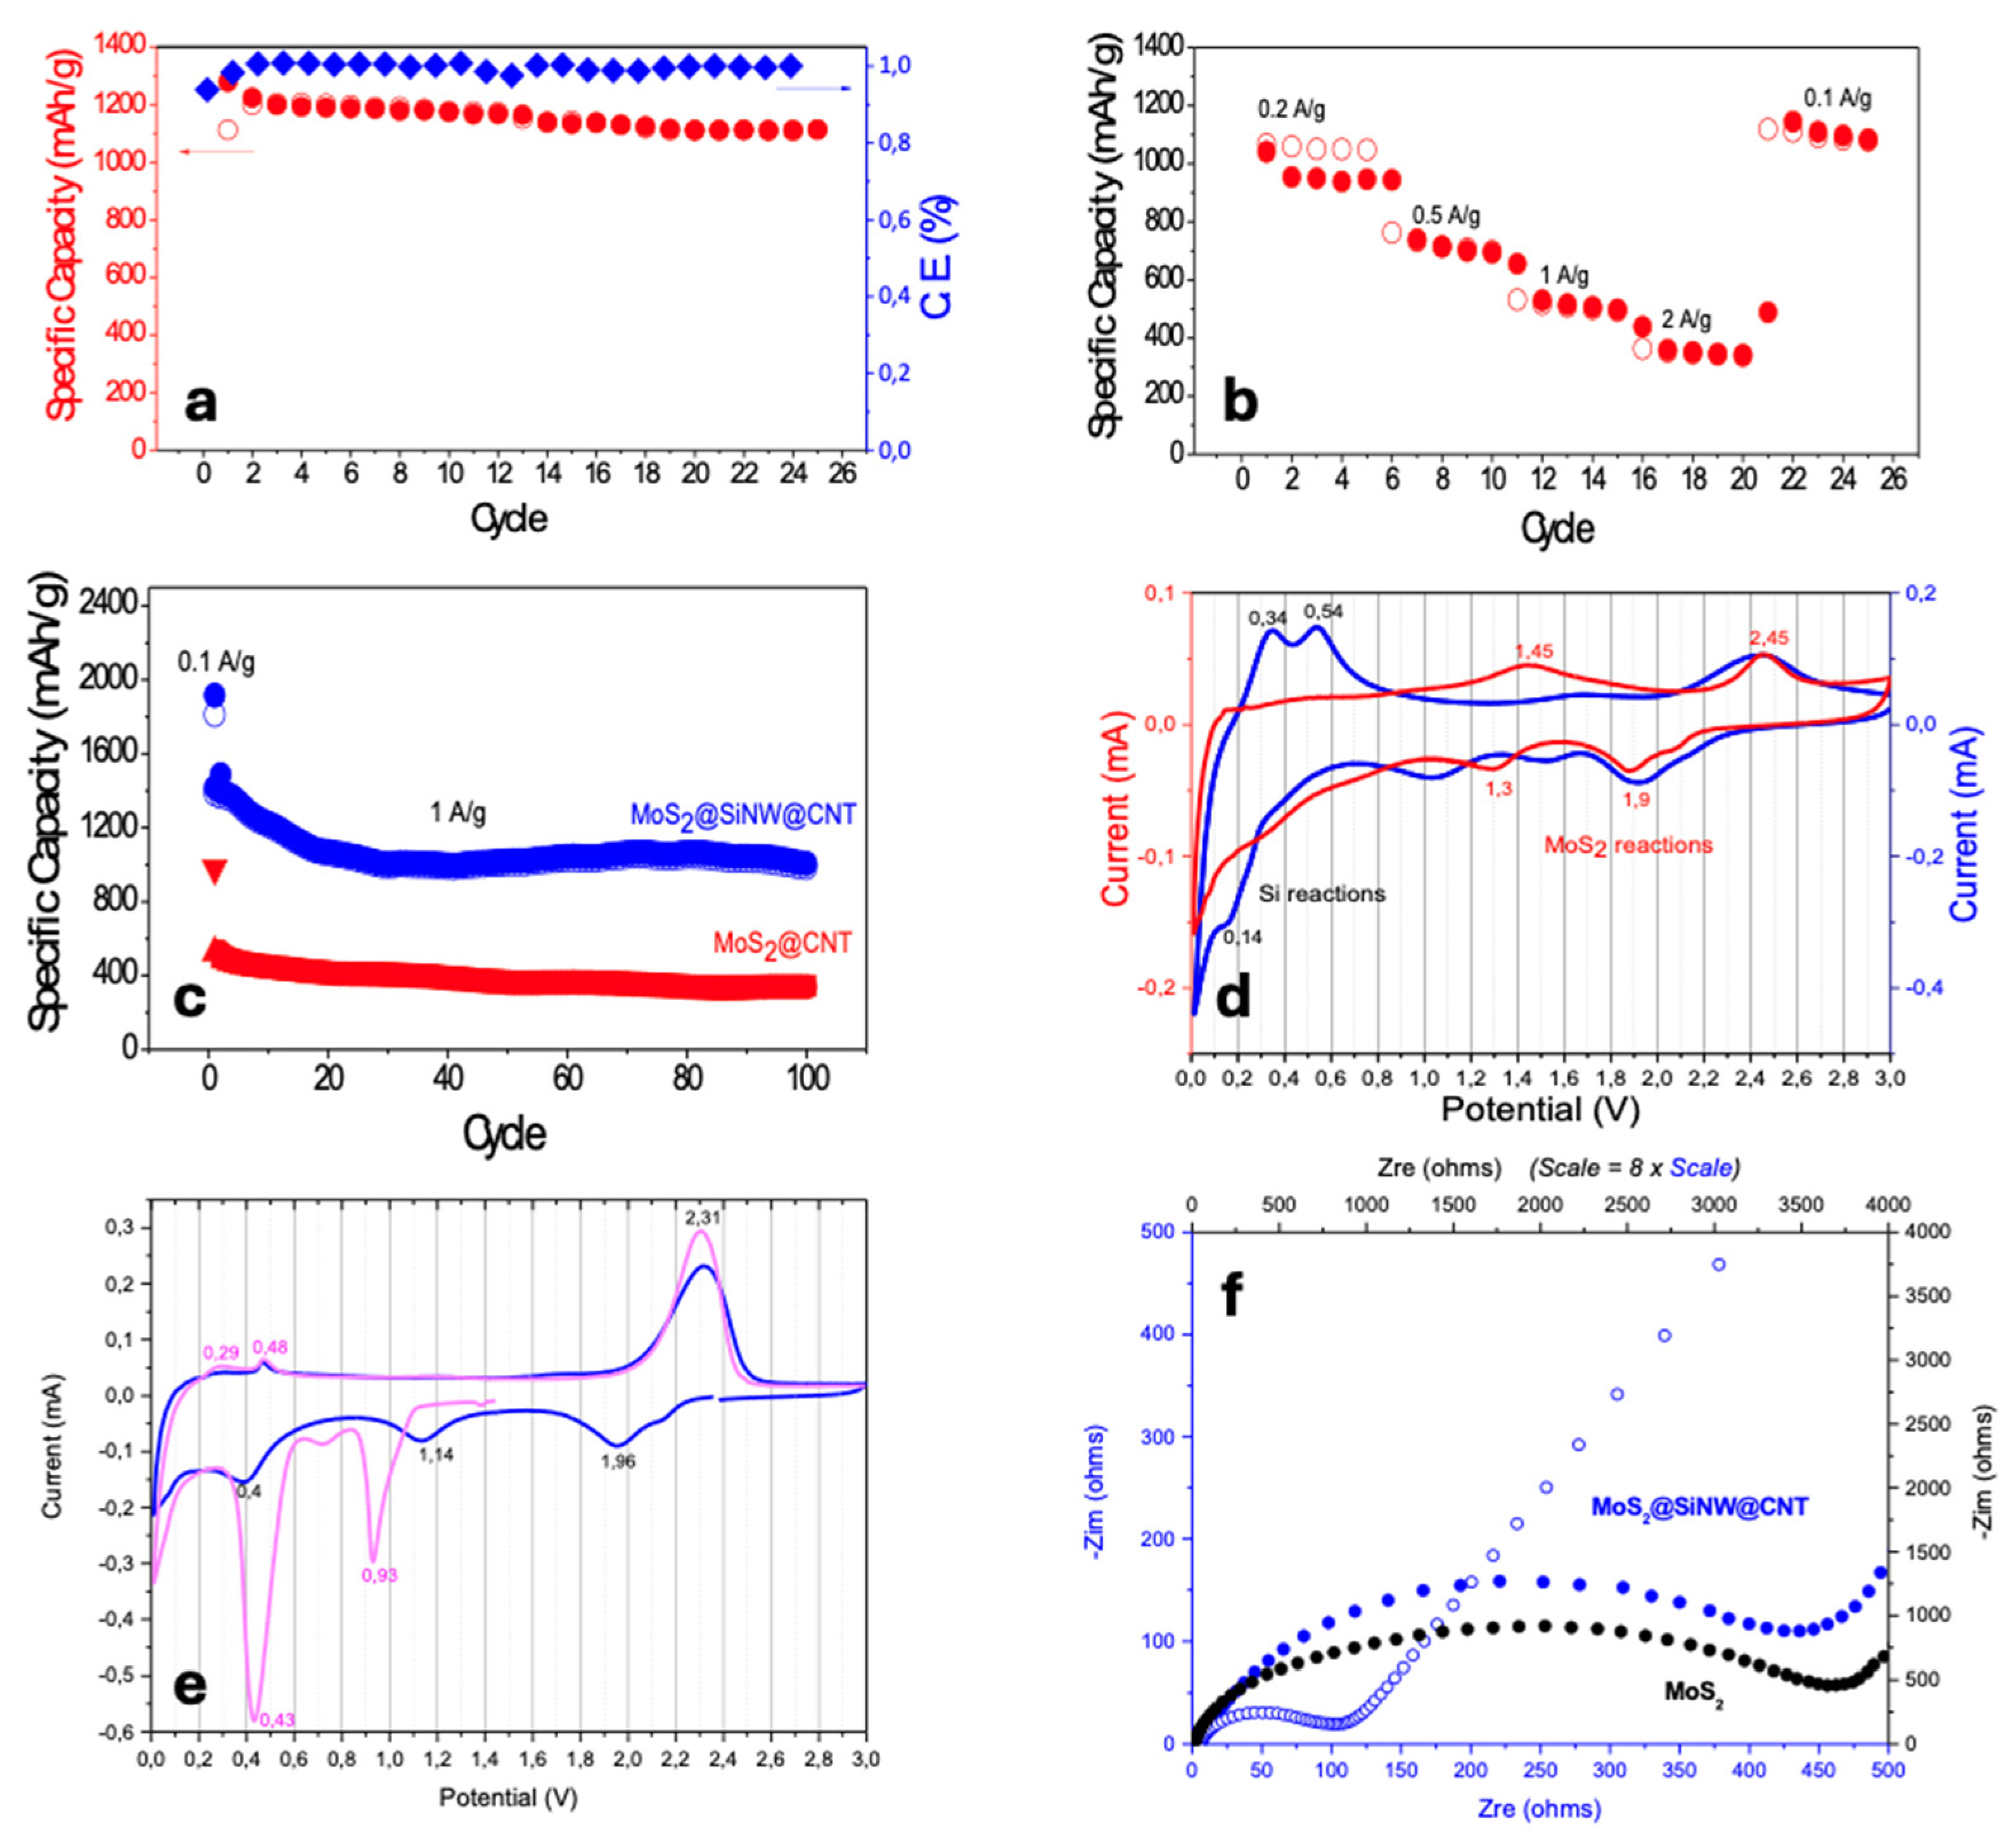
Figure 14.
Postmortem analysis of the cycled MoS₂@CNT (80:20 wt.%) and MoS₂@SiNW@CNT (56:24:20 wt.%) electrodes using Nuclear Reaction Analysis (NRA) after 100 cycles at 1 A/g. The NRA spectra show the concentration depth profiles of Li and other elements (C, O, S, Mo) in the electrodes, revealing significant Li penetration in the MoS₂@SiNW@CNT electrode, indicating improved Li diffusion and retention(a); and Corresponding RBS spectrum highlighting the distribution of Li and other elements in the post-cycled electrodes, confirming the presence of a stable solid electrolyte interphase (SEI) layer and the structural integrity of the MoS₂@SiNW@CNT composite, which contributes to the long-term electrochemical stability observed during cycling (b).
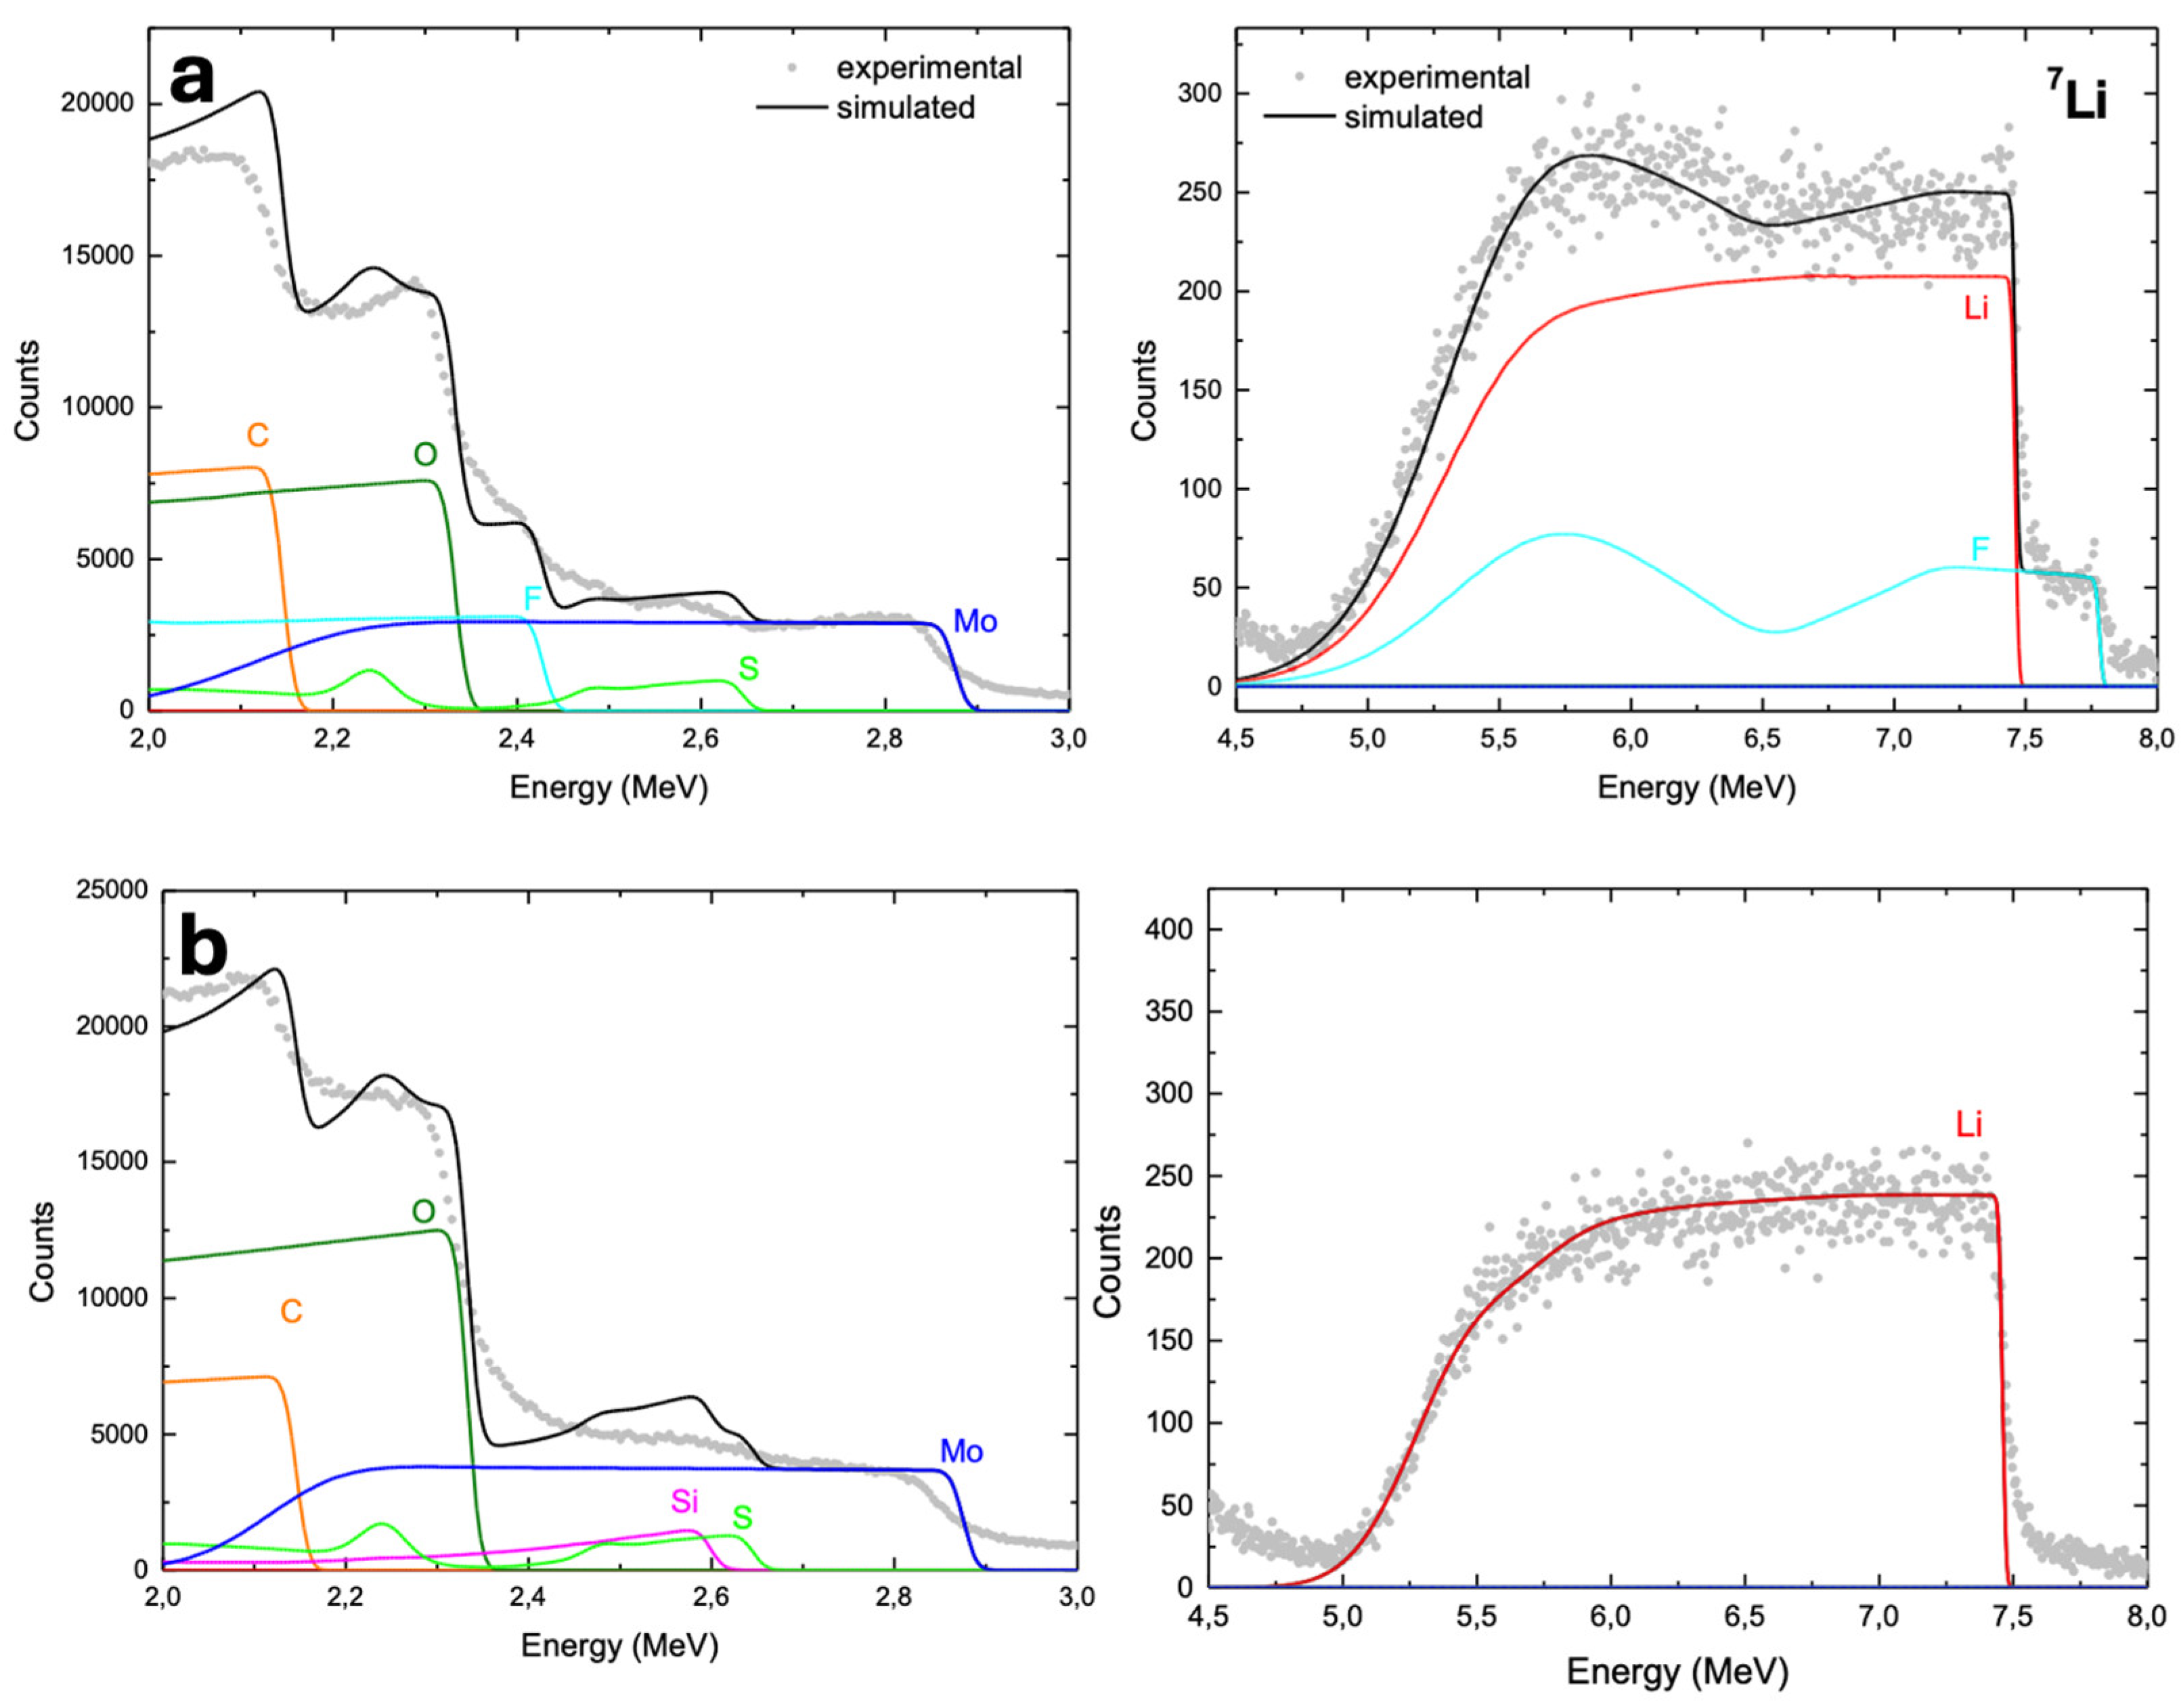
Disclaimer/Publisher’s Note: The statements, opinions and data contained in all publications are solely those of the individual author(s) and contributor(s) and not of MDPI and/or the editor(s). MDPI and/or the editor(s) disclaim responsibility for any injury to people or property resulting from any ideas, methods, instructions or products referred to in the content. |
© 2024 by the authors. Licensee MDPI, Basel, Switzerland. This article is an open access article distributed under the terms and conditions of the Creative Commons Attribution (CC BY) license (http://creativecommons.org/licenses/by/4.0/).
Copyright: This open access article is published under a Creative Commons CC BY 4.0 license, which permit the free download, distribution, and reuse, provided that the author and preprint are cited in any reuse.


