
Submitted:
23 November 2023
Posted:
24 November 2023
You are already at the latest version
Abstract
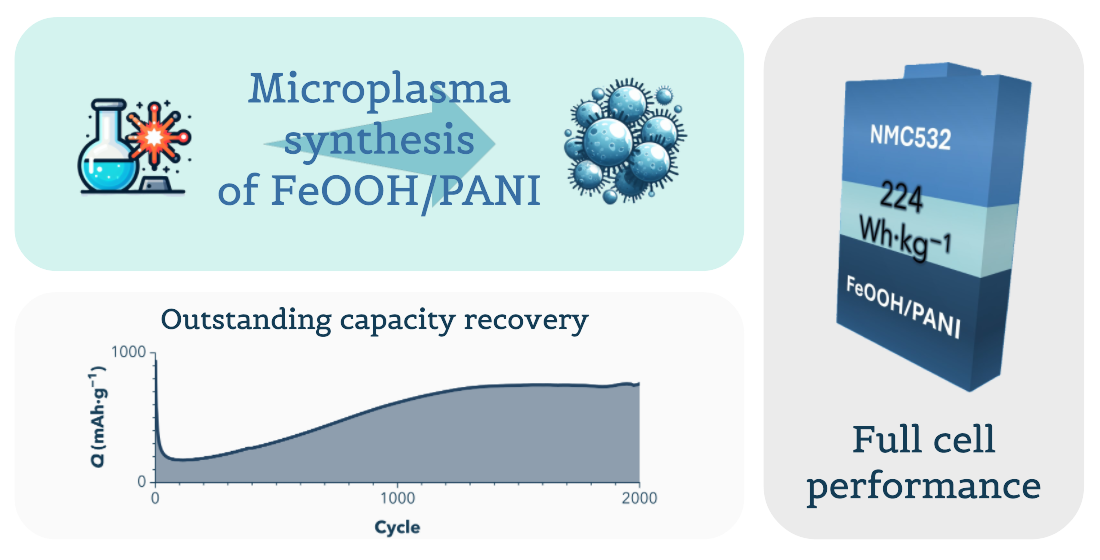
Various iron oxides have been proven to be promising anode materials for metal-ion batteries due to their natural abundance, high theoretical capacity, ease of preparation, and environmental friendliness. However, the synthesis of iron oxide-based composites requires complex approaches, especially when it comes to composites with intrinsically conductive polymers. In this work we propose a one-step microplasma synthesis of a polyaniline-coated urchin-like FeOOH nanoparticles (FeOOH/PANI) for application as anode in lithium-ion batteries. The material shows excellent electrochemical characteristics, providing initial capacity of ca. 1600 mA∙h∙g−1 at 0.05 A∙g−1 and 900 mA∙g−1 at 1.2 A∙g−1. Further cycling lead to capacity decrease to 150 mA∙h∙g−1 by the 60th cycles, followed by a recovery that maintained the capacity at 767 mA∙h∙g−1 after 2000 cycles at 1.2 A∙g−1 and restored full initial capacity of 1600 mA∙h∙g−1 at low current density of 0.05 A∙g−1. Electrochemical milling of the material caused such interesting behavior of the material, and we confirmed this phenomenon by a combination of physico-chemical and electrochemical techniques. The anodes also exhibit high performance in a full cell with NMC532. NMC532//FeOOH/PANI full cell provided energy density of 224 Wh∙kg−1 which is comparable to the reference cell with graphite anode (264 Wh∙kg−1).
Keywords:
atmospheric plasma solution synthesis
; lithium-ion batteries
; FeOOH anode material
; conversion metal oxide anodes
; polyaniline
1. Introduction
Lithium-ion batteries (LIBs) have emerged as the most prominent energy storage devices, powering a wide range of applications, from smartwatches and laptops to electric vehicles and stationary energy storage systems [1]. Their success stems from their high energy density, long cycle life, and low self-discharge [2,3]. Nevertheless, there remains room for improvement, driving continuous research and development in all related aspects. Enhancing existing anode materials or developing new ones holds promise for increasing LIB specific capacity and energy density [4,5].
The anode material with most desired performance is lithium metal with an extremely high theoretical specific capacity of 3860 mA∙h∙g−1. However, its practical implementation is limited by safety issues caused by non-uniform lithium deposition and growth of the dendrites [6]. The latter is an object of many studies, but the proposed solutions are not yet mature [7]. Therefore, graphite anodes are conventionally used, yet their low theoretical specific capacity of 372 mA∙h∙g−1 limits their prospects in high-energy-density LIBs [8,9].
Many proposed solutions for novel LIB anodes are based on either single-phase (i.e., alloying), or multiple-phase conversion chemistry [9]. The latter group includes single or mixed transition metal oxides, including those of cobalt, nickel, copper, or iron [5,10,11,12,13].
Reaction (1) results in formation of sub-10 nm metal nanoparticles embedded into lithium oxide matrix, as confirmed in early 2000s by Debart et al. [15], and the capacities obtained from this reaction are ranging from 650 mA∙h∙g−1 to 1000 mA∙h∙g−1 [9], depending on the specific material.
Various forms of iron(III) oxides and oxide-hydroxides are promising among other transition metal oxides, as they have high theoretical capacity, are abundant in nature, environmentally safe and sustainable [16,17,18,19,20]. Specifically, FeOOH is a semiconductor with a tunnel-type [21] or layered [22] structure, which favors lithium ions diffusion [23]. Its theoretical specific capacity is 905 mA∙h∙g−1 [24], and the average charge voltage of the electrode materials based on FeOOH, or its composites, is (1.5–2.0) V vs. Li/Li+ [24,25,26,27]. The intermediate voltage made the initial studies regard FeOOH as a cathode material [28,29], though later the approach shifted to anodes due to increased specific capacity of the material in lower potentials area.
Being a conversion electrode material, FeOOH recharges according to reaction (1), though the exact mechanism is a subject of dispute. The proposed mechanisms include formation of metallic iron particles embedded in Li2O and LiOH matrix, followed by conversion between iron and FeO, rather than initially present oxide-hydroxide [30]:
FeIIIOOH + 3Li+ + 3e−1 → Fe0 + Li2O + LiOH (1st discharge)
FeIIO + 2Li+ + 2e− ⇄ Fe0 + Li2O (the following cycles)
After the initial discharge yielding 905 mA∙h∙g−1, this mechanism suggests the consequent reversible cycling to provide the specific capacity 603 mA∙h∙g−1 (referred to the initial FeOOH content). However, the set of either peaks in cyclic voltammograms (CVs), or plateaus in galvanostatic charge-discharge (GCD) curves suggests a more complex recharging process than a simple two-electron reaction, such as this one [31]:
FeIIIOOH + Li+ + e− ⇄ LiFeIIOOH (partially reversible)(E ≈ 1.70 V)
LiFeIIOOH + xLi+ + xe− ⇄ Li1+xFeII−xOOH (partially reversible)(E = 1.25 V)
Li1+xFeII−xOOH + (2−x)Li+ + (2−x)e− ⇄ Fe0 + Li2O + LiOH (highly reversible) (E = 0.68 V)
This set of reactions is additionally complicated by unspecified side reactions involving solid electrolyte interphase (SEI) and interfacial interactions near 0 V. The existence of reaction (4) is corroborated by earlier studies of FeOOH as a cathode material [32]. The drawback of such a description is that reaction (6) suggests a process involving three independent solid-state phases, which is an unlikely process regardless of the compounds involved. This might suggest that there is a mix of reactions (2–6) occurring in cells. Still, the transformation of Fe3+ into metallic iron should yield the specific capacity of 905 mA∙h∙g−1. The extra capacity often reported in the literature might stem from the processes involving SEI [25,26,27], which warrants additional comments.
SEI has been extensively investigated for LIBs due to its existence being crucial for cell stability, as it acts as a passivating medium on the electrode-electrolyte boundary during cycling [33]. Multiple studies have investigated the content of SEI and the factors affecting its functionality [34,35,36,37,38]. The processes occurring during battery cycling produce various compounds via electrolyte decomposition and polymerization and electrode-electrolyte interactions [33,39]. Among the commonly mentioned components of SEI are LiF [35], LixPFy [40], LixPOyFz [35,39], Li2CO3 [35], CH3OLi, CH3OCO2Li [40], RLi [41]. For the specific case of oxide-based conversion-type materials, such as FeOOH, there is a matter of reactions involving oxygen species, which produce Li2O [41,42] covered by a SEI with an electrochemically active polymer outer layer [42], which suffers reversible transformations during cycling [43,44]. The said electrochemical activity, which can even provide capacitive contribution [17,42], is mostly ascribed to an outer layer of SEI with an organic gel-like structure [45], as opposed to a denser internal layer composed primarily of Li2O [44]. Thus, SEI is an essential and dynamically changing part of the cell, which is directly responsible for the electrodes’ performance, and thus its nature and effects should be thoroughly considered.
While FeOOH can provide outstanding specific capacity values, there are certain challenges in implementation of such material. On its own, the material lacks electrical conductivity, especially because of isolation of particles during cycling [32], partially caused by volumetric changes [25,46]. The problem exists for many conversion-type materials [10] and there are multiple approaches to eliminate it.
The first one has been known for decades, and it involves minimizing the particle size [10], as nanosized particles provide more capacity and stability than their microsized counterparts [47,48]. For example, Ce-doped α-FeOOH nanorods (of ca. 70 nm to 80 nm diameter) provided up to 830 mA∙h∙g−1 discharge capacity [24], while the capacity of β-FeOOH nanorods (of ca. 5 nm to 50 nm diameter) exceeded 1500 mA∙h∙g−1 [49].
The second approach is to obtain a composite with carbon material. Recent examples include F-doped FeOOH/graphene nanorods (~1207 mA∙h∙g−1) [50], Si-doped FeOOH/graphene sheets (~1371 mA∙h∙g−1) [25] or biomass-carbon-adhered β-FeOOH nanorods (~1450 mA∙h∙g−1) [51]. This approach has proven useful due to increased surface area and the presence of a conductive carbon-based matrix, though graphene is also a popular choice for other anode materials [52].
The third approach is the design of the composites with conducting polymers (CPs), which may eliminate the problems related to a lack of conductivity and mechanical strain caused by volumetric changes during cycling. The properties of CPs, such as intrinsic electronic conductivity and mechanical flexibility, as well as their own charge storage capacity [53], make this approach feasible. The use of CPs in electrode materials for energy storage devices has proven useful in enhancing their specific capacity, cyclic stability, rate capability, and plastic features [54,55,56]. The examples of successful implementation of FeOOH/CPs include FeOOH@PEDOT (1335 mA∙h∙g−1) [27] and β-FeOOH@PEDOT (726 mA∙h∙g−1) [57]. FeOOH/PPy composites have been successfully used in supercapacitors [58,59]. To the best of our knowledge, the composites of PANI with FeOOH have not been used in LIBs anodes, though early studies attempted to use such composite as cathode material [60], and FeOOH/PANI-based materials were found to be useful in microbial fuel cells [61] and wastewater treatment [62].
Plasma-assisted synthesis performed via plasma-liquid interactions has proven useful for obtaining nanomaterials with various compositions and morphologies [63,64,65,66]. Atmospheric plasma synthesis was performed to obtain FeOOH nanoparticles for catalysis [67], and by introducing graphite in the reaction mixture, we have synthesized FeOOH/graphite nanocomposites for anode materials in LIBs [68]. Various modifications of plasma-assisted synthesis also allowed to obtain CPs, including PANI, for various applications [69,70,71]. Obtaining of a composite such as FeOOH/PANI in a similar way is thus a promising avenue to explore, as CPs tend to increase stability and rate capability of conversion-type electrode materials [27,72].
In this work we obtained urchin-like FeOOH/PANI composites via atmospheric plasma-solution synthesis. The anode materials based on this composite provide outstanding specific capacity value exceeding 1600 mA∙h∙g−1 at 0.05 A∙g−1 and retain 767 mA∙h∙g−1 by the 2000th cycle at 1.2 A∙g−1, exceeding that of pristine FeOOH by 120%. PANI serves as a conducting agent in the composite and protects the material from dissolving. The improved electrochemical properties of the material can be attributed to the electrochemical milling effect, which reorganizes the material, and the formation of an electrochemically active SEI, thereby further enhancing cycling performance.
2. Materials and Methods
2.1. Material Preparation
Plasma solution electrolysis was carried out using a custom glass cell setup (Wuhan Corrtest Instrument Corp., China) illustrated in Figure S1. An IWT-NY-Nylon Membrane (0.22 µm pores, I.W. Tremont Co., USA) separated the anodic and cathodic cell spaces, preventing electrolyte mixing (aqueous solution of 50 mM FeSO4 and 1 mM aniline sulfate). Electrode separation was essential to isolate reaction products at the plasma-liquid interface. The anode, situated 2 mm from the electrolyte surface and placed normal to it, comprised a stainless-steel capillary tube (inner diameter 80 µm, length 4 cm, Varian, Inc.), with argon gas flowing at 50 cm3∙min−1. The negative electrode was a 3×4 cm2 stainless-steel mesh. A microplasma, sustained by a positively biased DC power supply, was initiated at the argon tube outlet. Throughout the experiments, the microplasma interacted with the 1 mm2 electrolyte surface. The discharge current was around 0.9±0.1 mA at 2 kV. Electrolysis continued for 3 hours with constant stirring. The resulting FeOOH/PANI composite was precipitated, washed, and vacuum-dried at 90 °C for 24 hours.
2.2. Electrode Preparation
The acquired powders were mixed with carbon black "Super P" (Timcal Inc., Belgium) and PVDF binder (Solef® 6010, Solvay, Brussels, Belgium) in a weight ratio of 70:20:10 using N-methylpyrrolidone (Vecton, Russia) to form a dense slurry that was applied onto a Cu foil (MTI, China) via doctor-blading with a 100 µm gap, resulting in an active material loading of approximately ~1 mg∙cm−2.
For full cell tests, cathode material was prepared via similar procedure by mixing NMC532 with carbon black and PVDF in an 80:10:10 weight ratio, followed by applying it onto Al foil (MTI, China) with a gap of 200 µm, producing coatings with ~ 4 mg∙cm−2 active material loading.
All electrodes underwent vacuum drying at 90 °C for 24 hours and were subsequently roll-pressed before the cutting and assembly process.
2.3. Electrochemical Measurements
Cell assembly took place in an argon-filled glove box (Vilitek, Russia). CR2032 cells were assembled with the composite serving as the cathode and lithium metal foil (0.6 mm thick, Aldrich, USA) as the anode. Celgard 2320 (Celgard, Inc., USA) separators were placed between electrodes and the cells were filled with 1 M LiPF6 in ethylene carbonate/diethyl carbonate (1/1 v/v ratio) electrolyte.
Electrochemical performance of the materials in CR2032 cells was further studied at room temperature. Cyclic voltammograms (CV) were recorded using a Biologic VMP-3 electrochemical workstation (Biologic, France) at scan rates ranging from 0.1 mV∙s−1 to 5 mV∙s−1 within a potential range of (0.01–2.85) V (vs Li/Li+). Galvanostatic discharge/charge measurements were carried out on a BTS 4000 battery test system (Neware, China) at various current rates within the (0.01–2.85) V range. Electrochemical impedance spectra (EIS) were recorded using a Biologic VMP-3 potentiostat over a frequency range from 10 kHz to 10 mHz.
To investigate the evolution of materials throughout their cycle life, electrochemical impedance spectra of representative cells and data from potentiostatic intermittent titration technique were collected at potential levels of 2.85, 2.5, 2.0, 1.5, 1.0, 0.5, and 0.01 V after 5, 60, 150, 500, 1200, and 2000 cycles. Following this, the cells were disassembled in an argon-filled glove box. Cathodes were thoroughly rinsed with diethyl carbonate and subsequent dried for 24 hours. SEM/EDX, ATR-FTIR, and XPS analyses were performed on samples after 5, 60, 150, 500, 1200, and 2000 recharging cycles.
The full battery was prepared as follows. After cycling 2000 cycles, coin cells were dissembled in Ar-filled glovebox and the FeOOH/PANI electrode was extracted and washed with an electrolyte solution. Further, a full battery with a cathode based on NMC532 was assembled in CR2032. Celgard 2320 (Celgard, Inc., USA) was used as a separator and 1 M LiPF6 in ethylene carbonate/diethyl carbonate (1/1 volume ratio) as an electrolyte. Gravimetric energy density was calculated based on the total weight of the electrode material. The battery was cycled at C/2 current density for 50 cycles.
2.4. Additional Material Characterization
SEM imaging as well as EDX mapping of both obtained composites and the electrodes were conducted using the Zeiss Merlin microscope (Carl Zeiss Microscopy GmbH, Jena, Germany). The cycled electrodes were studied with Fourier-transform infrared spectroscopy with an attenuated total reflection module (ATR-FTIR) on a Thermo Nicolet 8700 spectrometer (Thermo Fisher Scientific, Waltham, MA, USA). Details of XPS measurements of both synthesized powders and cycled electrodes are provided in the Supporting Information.
For conductivity measurements, tablets with a diameter of 4.5 mm and a thickness of approximately 0.6 mm were prepared by compressing the powders and placed between silver electrodes. The conductivity of FeOOH/PANI powders was investigated with electrochemical impedance spectroscopy using an Autolab PGSTAT 302N potentiostat/galvanostat. Measurements were carried out in the 100 Hz to 1 MHz range at 20–125 °C in a dry N2 atmosphere with a residual oxygen pressure of less than 10−3 atm.
3. Results and Discussion
3.1. Characterization of FeOOH/PANI
SEM images in Figure 1a and 1b illustrate the urchin-like structure of the FeOOH/PANI particles obtained. The diameter of the particles ranges from 500 nm to 600 nm on average, and the particles form agglomerates of up to 1300 nm. In addition, we can see that the needles themselves are quite heterogeneous, often sticky, and covered with a layer of PANI. The synthesis of FeOOH in similar conditions without the addition of aniline sulfate produces particles with more homogeneous and thin needles up to 10 nm in diameter (Figure S2a, b). Their shape and thickness change upon the addition of aniline sulfate (Figure S2c, d) to resemble those in FeOOH/PANI images. Plasma electrochemical synthesis of PANI from aniline sulfate solution produces spherical agglomerates of up to 20 nm in diameter. A similar composite has been obtained by oxidative in situ polymerization of aniline in the presence of iron oxide [73]. In addition, the model of FeOOH large (ca. 500 nm) particles agglomeration into an urchin-like structure during chemical oxidation of iron sulfate describes [74] the fast process of iron sulfate oxidation as the one that leads to a kinetically favorable structure of spherical particles with a smooth surface, whereas the slow process leads to a thermodynamically favorable structure with an urchin-like morphology through the needle-forming stage. These facts suggest that the oxidation of Fe2+ with the formation of FeOOH occurs with simultaneous polymerization of aniline at the contact site of the electric discharge with the solution due to which PANI coats FeOOH needles which then agglomerate into an urchin-like structure.
The “needles” of the urchin-like particles exhibit a fibrous heterogeneous structure with a diameter of 30–50 nm, leading to a decreased degree of material crystallization and higher amorphization. EDX spectra in Figure S2e confirm the composition of the material, which consists primarily of iron and oxygen, with the presence of sulfur from SO42−. The element ratios obtained from EDX spectra are 2.86 for O/Fe and 4.42 for Fe/S. The oxygen content in the samples exceeds the expected 2:1 value for FeOOH, as it is likely that a compound with a structure of schwertmannite—a sulfate-containing mineral—was obtained, as the synthesis conditions were the same as reported earlier [68].
There is a Fe 2p3/2 peak with Gupta-Sen multiplet components in the Fe 2p XPS spectrum in Figure 2a [75]. Their intensities and the binding energy (BE) of the low-energy component (710.4 eV) align with the Fe 2p spectra of FeOOH [76,77,78]. The O 1s peak (Figure 2b) is approximated by three components, with two attributed to FeOOH [77,79,80] and one high-energy component to SO42− species [81,82]. The S 2p level spectrum (Figure 2c) is in agreement with this, exhibiting only one chemical component attributed to highly oxidized sulfur (i.e., SO4) [81,82]. The N 1s spectrum from PANI reveals imine nitrogen at the 398.7 eV peak, protonated nitrogen at 400.4 eV (benzenoid amine (-NH-)), and oxidized amine at 400.8 eV [83,84,85]. The doping level, determined by the ratio of N+ to the total nitrogen content, was approximately 13% [86].
The FeOOH/PANI composite exhibits a specific electrical conductivity of approximately 8.12∙10−5 S∙cm−1, surpassing the conductivity of FeOOH (~10−10 S∙cm−1 to 2.41∙10−10 S∙cm−1) by five orders of magnitude, as reported in our previous work [68] and in the literature [87]. The addition of PANI into FeOOH increased the electrical conductivity of the composite because 13% PANI doping level corresponds to a highly conductive form of the polymer [85,88,89]. The PANI doping level was evaluated by a close inspection of the N 1s envelopes to determine the positively charged nitrogen (N+) contribution to the total nitrogen content [85]. FeOOH/PANI showed (Figure S2f) two orders of magnitude increase in electrical conductivity upon the increase of temperature from 18 °C to 130 °C. Notably, lnσ–1000/T curve is not linear as expected for semiconducting materials, which FeOOH materials [90] and PANI [91] are. For FeOOH, the change in conductivity increase upon heating is associated with dehydration of OH− pairs in the surface layers resulting in the formation of mono-charged oxygen vacancies providing Fe3+ with electrons that reduce it to Fe2+ at T < 140 ℃ [90]. In PANI, the linear conductivity growth is limited to the dehydration and de-doping temperature [92], after which the decrease replaces the growth. In the case of PANI doped with SO42− this temperature is 229 ℃. Fe3+ in FeOOH can additionally oxidize PANI at lower temperatures, producing Fe2+ in the surface FeOOH layers and, as a result, causing an earlier change in the lnσ – 1/T curve. Such behavior of the material can be very favorable when discharged by powerful modes accompanied by heat release, which would decrease internal resistance of the cell.
3.2. Electrochemical Performance
The FeOOH/PANI electrode exhibits significant irreversibility during the first recharging cycle, similar to other negative electrode materials [93,94]. In the initial discharge, it delivers 1595 mA∙h∙g−1, but this drops to 1082 mA∙h∙g−1 in the subsequent charge (Figure 3a), resulting in a Coulombic efficiency of 68%. The notably high value in the first discharge, surpassing the theoretical capacity, can be attributed to the concurrent processes of the initial conversion of FeOOH and the formation of the SEI layer [25,26,27]. With further cycling at a current of 0.05 A∙g−1, the capacity drops to 527 mA∙h∙g−1 by the 5th cycle. Increasing the current density further reduces the material capacity, reaching about 17 mA∙h∙g−1 at 10 A∙g−1. Overall, the C-rate capacity retention of the FeOOH/PANI composite is comparable to that of FeOOH composite with graphite [68]. Following C-rate capability testing with currents up to 10 A∙g−1, the FeOOH/PANI electrode retains a residual capacity of 320 mA∙h∙g−1.
In our previous work [68] for FeOOH and its graphite composite we observed capacity increase during long-term cycle life tests at 1.2 A∙g−1. After 2000 cycles, the capacity of pure FeOOH was 349 mA∙h∙g−1. The addition of conductive material to make composite was intended to improve long-term cycling behavior and increase the capacity value. So, after 2000 cycles, the capacity of the FeOOH composite with graphite was already 543 mA∙h∙g−1. To detect capacity increase in long-term cycling, we subjected FeOOH/PANI to prolonged cycling up to 2000 cycles in the same manner. At 1.2 A∙g−1 (Figure 3b) the initial capacity of FeOOH/PANI is 936 mA∙h∙g−1. After a significant initial capacity fade (142 mA∙h∙g−1 at the 70th cycle), the increase follows resulting in 767 mA∙h∙g−1 by the 2000th cycle. Thus, a clear improvement in the electrochemical performance of composites with conductive components occurs. Pure FeOOH showed 349 mA∙h∙g−1, composite with graphite—543 mA∙h∙g−1, and with PANI—767 mA∙h∙g−1. This suggests that coating FeOOH with conductive material is better for electrochemical performance than coating graphite with FeOOH.
The increase in capacity can be attributed to two mechanisms: the formation of an electroactive gel polymer layer—an integral part of SEI [42,43,95,96]—and the electrochemical milling [95,97], a phenomenon observed in metal oxide anodes.
The initial cathodic scan of the FeOOH/PANI composite in the CVs (Figure 3d) reveals a broad peak at ~1.75 V, corresponding to reaction (4), followed by distinct peaks at 1.12 V, 0.54 V, and ~0 V. These peaks are attributed to the lithium insertion reactions (5) and (6), and the subsequent reduction of electrolyte components with SEI formation, respectively [31,98,99]. The subsequent anodic scan shows a well-defined peak at 1.12 V, characteristic of this material [31,98,99], followed by a broad peak at 1.50 V, corresponding to the conversion reaction (6). Almost indistinguishable shoulders at 2.00 V and 2.50 V may be ascribed to reactions (4) and (5), respectively. In subsequent cycles, only a broad cathodic peak at 0.54 V related to the reduction of Fe-based non-stoichiometric oxides persists. The CV cycling reveals a decrease in peak intensities over 20 cycles, consistent with cycling behavior and C-rates, likely linked to the pulverization of FeOOH/PANI and SEI formation.
At a current density of 0.05 A∙g−1 (Figure 3c), the first discharge curve of the FeOOH/PANI electrode exhibits three plateaus at 1.89 V, 1.41 V, and 0.82 V, representing the initial reduction of the material into the metallic form of iron in Li2O clusters, similar to conversion-type anodes like Co3O4 [100], and the formation of the SEI. By the third cycle, the charge curve retains only two plateaus, corresponding to two redox processes in alignment with the CV data.
To estimate the changes after 2000 cycles at 1.2 A∙g−1, we conducted C-rate and cyclic voltammetry tests. C-rate testing results show (Figure 3a, c) a significant capacity increase overall. At 0.05 A∙g−1 its value is ca. 1600 mA∙h∙g−1 in the first discharge, stabilizing after five cycles and remaining at the same level after other C-rates. The power density of material also improves as suggest the results of higher C-rates studies. At 10 A∙g−1, the capacity in the 50th cycle is only 7.77 mA∙h∙g−1, as opposed to 182 mA∙h∙g−1 after 2000 cycles. The transformation of the charge storage mechanism is associated with the evolution of the discharge-charge curves towards a more capacitor-like profile under prolonged cycling or high current density. This shift reflects a transition from the dominant FeOOH conversion reaction to the faradaic charging of a newly formed gel polymer layer on the electrode surface. This matches the observations for CVs similarly obtained after 2000 cycles (Fig S3) at 0.1 mV∙s−1 which show peaks shift from 1.12 V to 1.59 V and from 0.68 V to 0.92 V for anodic and cathodic scans, respectively, and peak intensities increase fivefold. All these facts allow to suggest that specific surface area and contact between particles increase in FeOOH/PANI material after long-term cycling and stable SEI formation [68].
Upon increasing the scan rate to (0.2–5) mV∙s−1, the distinct peaks in the cyclic voltammogram (CV) (Figure 4a) gradually fade, giving rise to a quasi-rectangular capacitive response. The FeOOH/PANI electrode demonstrates predominantly pseudocapacitive behavior across a range of scan rates, exhibiting a subtle anodic peak around 1.4 V without well-defined cathodic peaks. After 2000 cycles, a significant increase in peak intensities is observed, and the CV shape at higher scan rates becomes more rectangular, suggesting a potential enhancement in specific surface area (Figure 4e).
As is shown in Figure 4b,f, the slope (b values of two redox peaks, see equation (7)) before and after 2000 cycles reach ~0.75. This suggests the electrochemical reaction process is regulated by both pseudocapacitive (or surface-located) and diffusion mechanisms. To evaluate the reactions kinetics and to separate diffusion and pseudocapacitive contributions to the total current, CV curves from Figure 4a,e were analyzed. The total current i can be separated into capacitive ic=k1v and diffusion-limited processes id=k2v1/2, where v is the scan rate, according to (7) [101,102,103]:
i = a∙vb= k1∙v + k2∙v1/2
At a scan rate of 1 mV∙s−1 (Figure 4c, g), 57% and 60% of the total charge is stored through diffusion-controlled processes after 20 and 2000 cycles, respectively. As the scan rate increases, charge storage via capacitive processes rises to 68% and 73%, respectively. Therefore, at low scan rates, Li+ ion diffusion limits the overall electrochemical reactions, while pseudocapacitance becomes the dominant charge/discharge mechanism with increasing scan rate (Figure 4d,h). The high capacitive contribution is attributed to the large surface area of nanosized particles and their high electronic interconnectivity [27].
The FeOOH/PANI material shows similar pseudocapacitance contribution regardless of the number of cycles. High pseudocapacitive currents both after 20 and 2000 cycles are likely due to PANI component of the composite being readily available for charge transfer facilitation regardless of FeOOH surface area. The latter increases the total specific current values, yet the ratio of diffusion and pseudocapacitive currents remains the same.
The characteristics of FeOOH/PANI presented in this study are consistent with the most recent literature, as summarized in Table 1. Due to the inherent variability in the values obtained for conversion materials during the initial cycles, more precise data for each cycle can be found in the cited works. It is important to note that reduction capacities have been reported in certain instances. While this is a crucial property for positive electrode (cathode) materials, it is essential to report oxidation capacity when evaluating prospective negative electrode (anode) materials used as cathodes against a Li anode. Our findings highlight the remarkable stability of the materials, demonstrating a sustained increase in capacity over approximately 1900 cycles following the initial restructuring.
3.3. Full battery
After cycling the coin cells at 1.2 A∙g−1 for 2000 cycles, we disassembled them in Ar-filled glove box, and replaced lithium foil with NMC532 cathode. The voltage curves (Figure 5a) and the trends of the capacity and coulombic efficiency (Figure 5b) of the resulting full cell referred to the cathode mass show that NMC532//FeOOH/PANI full cell cycled at the constant current rate of C/2 (1C = 140 mA∙h∙g−1) provides a stable response, reaching 125 mA∙h∙gcathode–1 at the start of the tests and 116 mA∙h∙gcathode–1 (826 mA∙h∙ganode–1) in the following cycles, and its coulombic efficiency approaches 97% (Figure 5b). The respective voltage profile in the first cycle shows lower coulombic efficiency, which we ascribe to the side processes, i.e., electrolyte decomposition and cathode electrolyte interphase film formation [107,108], which, in addition, causse structural reorganization of the material. Furthermore, the voltage profiles at the 2nd, 5th, 10th, 25th, and 50th cycles show a monotonous sloped signal centered at ca. 2.5 V, reflecting the conversion of FeOOH in the FeOOH/PANI anode and the simultaneous Li+ deintercalation of the NMC532 cathode that reversibly occur during the cycling of the full cell.
Considering the discharge profile for the 25th cycle shown in Figure 5a and cell composition, we can estimate for NMC532//FeOOH/PANI full cell a practical gravimetric energy density that approaches 224 Wh∙kg–1, which was compared to a traditional assembly with a graphite anode (NMC532//Graphite). Gravimetric energy density of this cell was calculated in the same way as for NMC532//FeOOH/PANI and its value was 264 Wh∙kg–1. Apparently from the presented results a full NMC532//FeOOH/PANI cell demonstrates gravimetric energy density comparable with the traditional NMC532//Graphite which in conjunction with low FeOOH/PANI cost and high cyclic stability can make this anode material an alternative to commercial anodes.
Comparison of the full cell energy density with the literature data for various anode systems (Figure 6) shows that the characteristics of the full cell are comparable with other oxide-based conversion anodes ((Co0.2Cu0.2Mg0.2Ni0.2Zn0.2)O [109]), on the one hand, and is at the lower end of the silicon and carbon-based anode series, on the other hand. However, the complicated composition and specific reagents make the synthesis of such compounds labor-intensive, which would ultimately affect the economic attractiveness of the product.
3.4. Post cycled electrodes
To elucidate the mechanism of FeOOH/PANI-base electrode capacity increase during cycling, we obtained impedance spectra at 5, 60, 150, 500, 1200 and 2000 cycles and characterized electrodes postmortem after these cycles by ATR-FTIR, XPS, SEM/EDX methods. Also, diffusion coefficients were calculated from PITT measurements with Cottrell approach according to [118] at 2.85, 2.5, 2.0, 1.5, 1.0, 0.5, 0.01 V for 5th, 60th, 150th, 500th, 1200th and 2000th cycle.
Impedance spectra of FeOOH electrode recorded at the charged and discharged states of the half-cells after 5, 60, 150, 500, 1200 and 2000 discharge/charge cycles are presented in Figure 6. Nyquist plots show two distinct semicircles at discharged state (Figure 6a) and one semicircle at charged state (Figure 6b). In discharged state the first semicircle can be attributed to the passivation film on the surface or the SEI and the second semicircle refers to the charge transfer resistance of the Li+ absorption/desorption process at interface [119,120]. In the charged state, a single semicircle refers only to the SEI, and the charge transfer resistance is indistinguishably small. Significant decrease of the charge transfer resistance is similar to the case of FeOOH/graphite composite we reported previously [68].
Figure 7.
Impedance spectra of the cells with FeOOH electrodes at intermediate points during long-term cycling at OCV (a) after discharge and (b) after charge.
Figure 7.
Impedance spectra of the cells with FeOOH electrodes at intermediate points during long-term cycling at OCV (a) after discharge and (b) after charge.
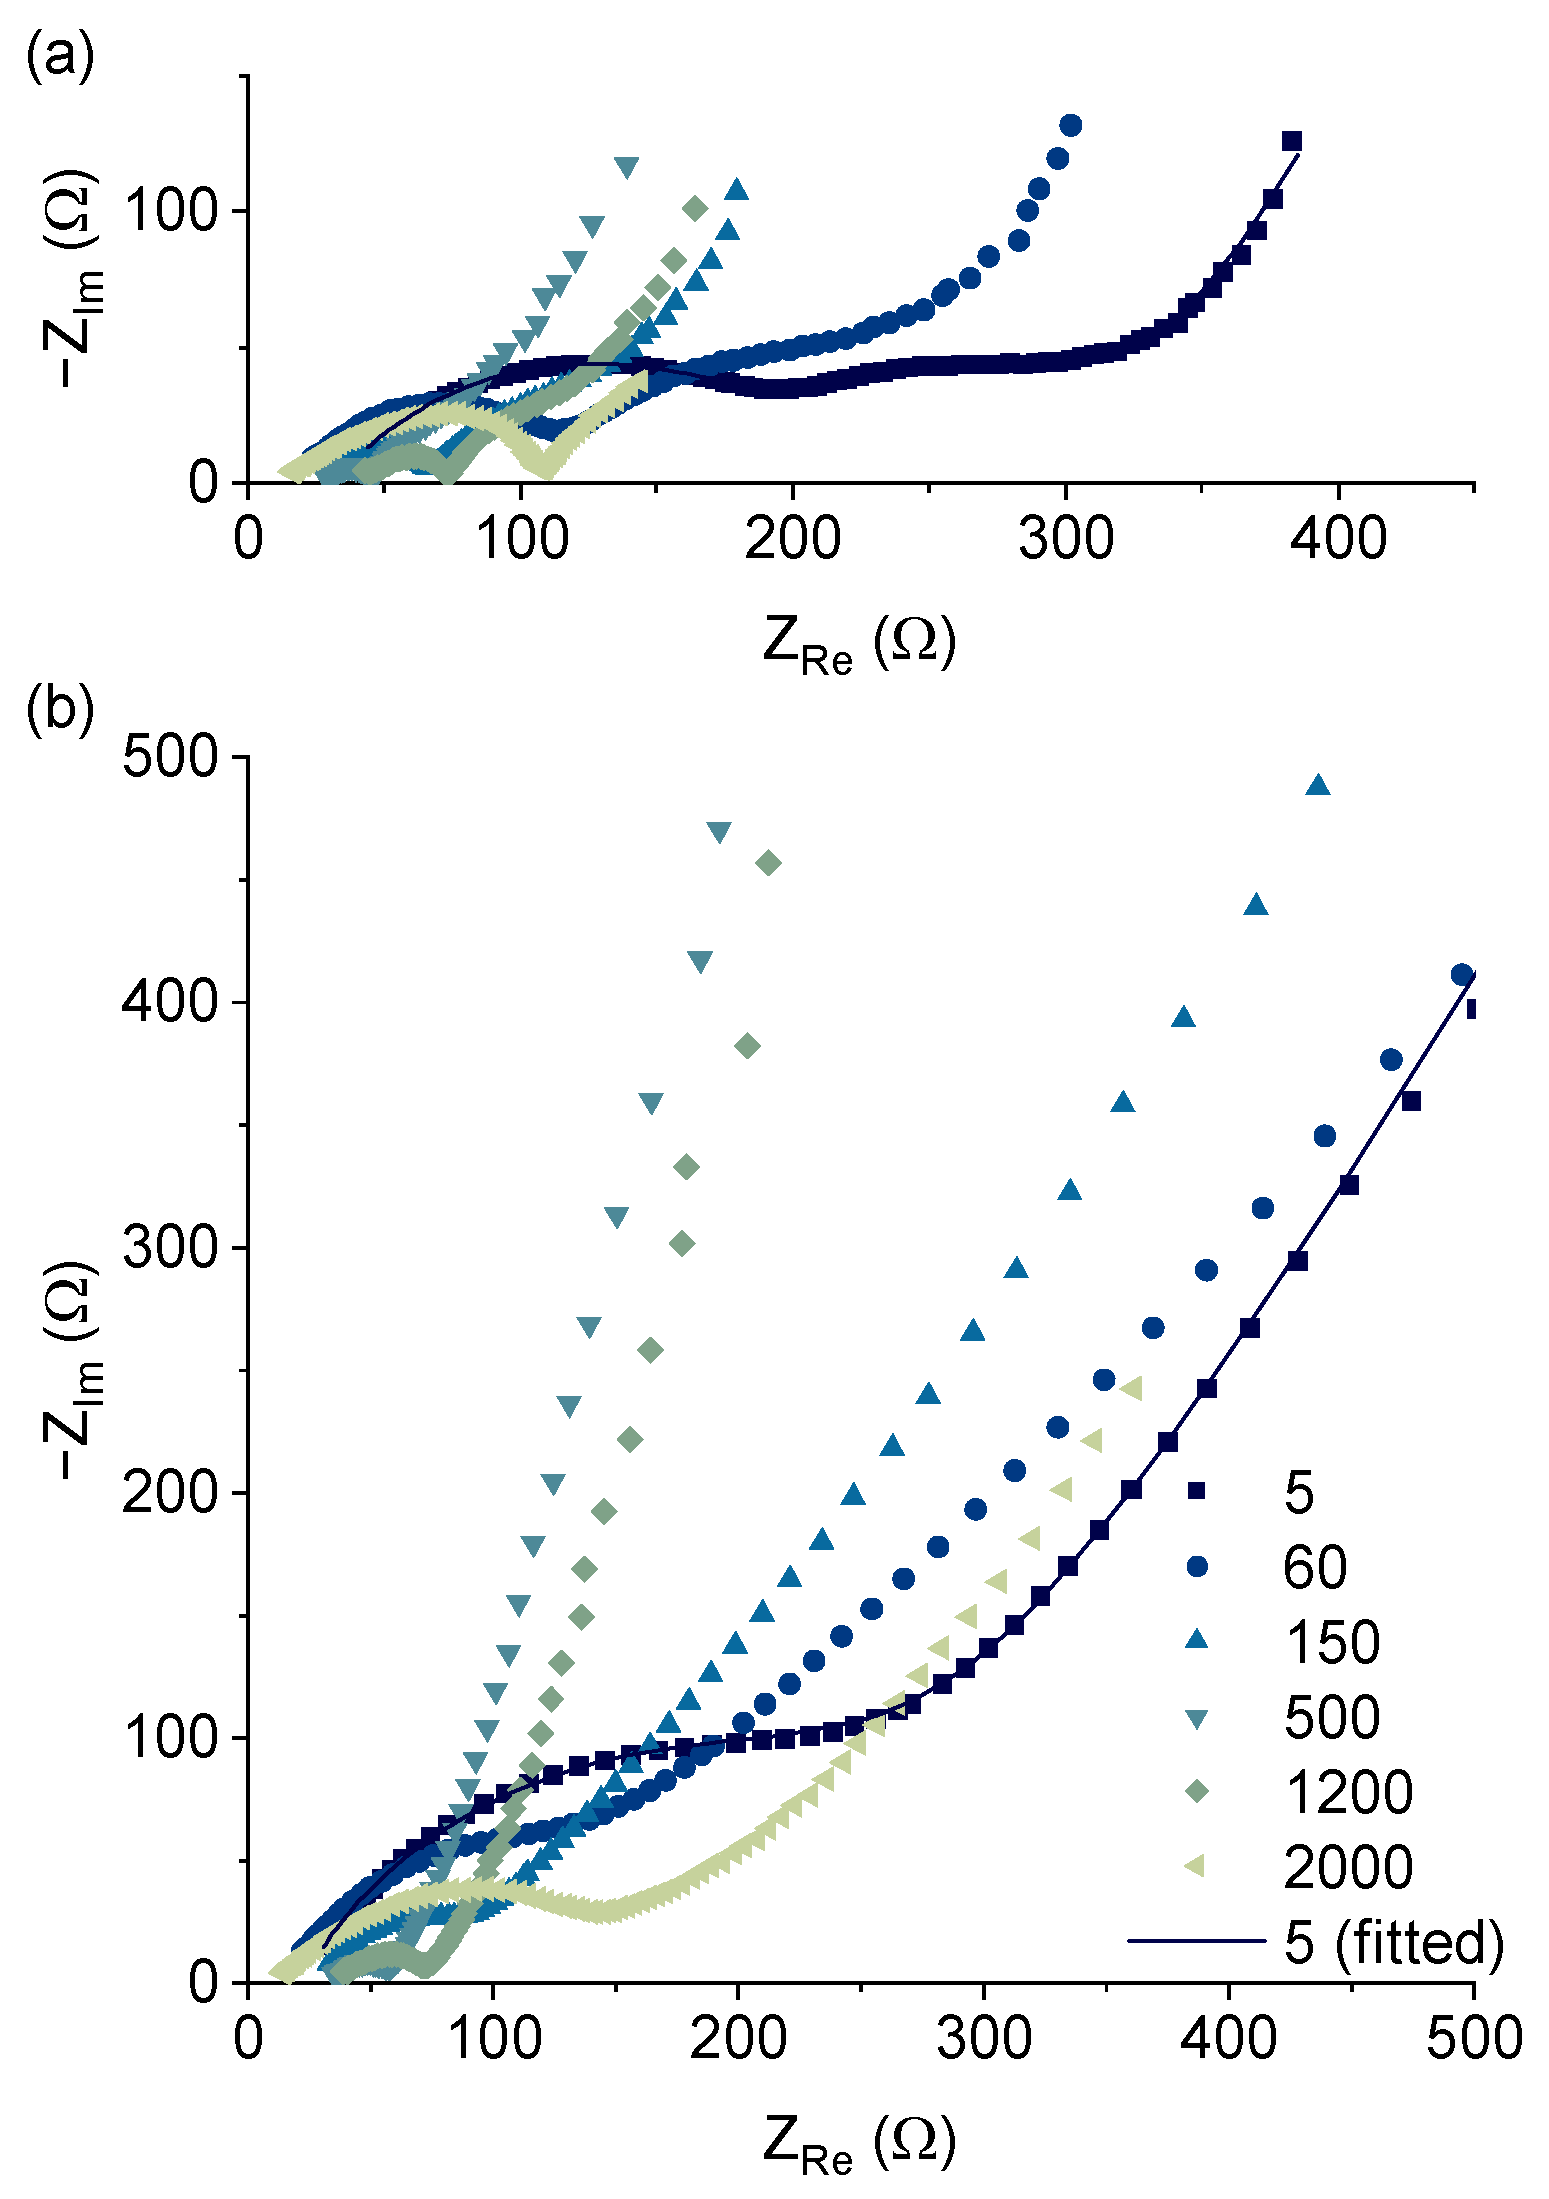
It is clear from Table 2 that the half-cell in the charged state demonstrates a monotonic increase in CSEI capacitance, which indicates an increase in SEI coverage of the active material/electrolyte interface due to FeOOH electrochemical milling, which we illustrated in [68] and that is characteristic of metal-oxide anode materials [97].
The resistance R1 calculated from the first semicircle, which we refer to the SEI, changes significantly and non-monotonically: by the 500th cycle it decreases by an order of magnitude, and then by the 2000th cycle it increases by an order of magnitude. This may be due to the influence of two counteracting factors: a) the SEI film surface area increase, which decreases R1; and b) SEI film thickness increase, which increases it.
The Warburg constant σ behaves similarly, decreasing for 1200 cycles, followed by an increase. Since the Warburg constant is proportional to the electrode surface area, its decrease indicates an increase in the electrode surface area during cycling, which is related to the material electrochemical milling and correlates with the change in R1.
The parameters from the two semicircles for the discharge state (Table 3) show that there is a non-monotonic change in the Q1 (SEI capacitance). Q1 increases up to the 1200th cycle, followed by a decrease to the 2000th. In addition to the electrochemical milling, SEI dielectric constant affects Q1, the nature of which may change during the discharge, since catalytic reduction of electrolyte components with the formation of a redox-active gel-like film is possible on iron particles [42,96]. This is also confirmed by the SEI capacitance increase in comparison to the charged state of the electrode. The SEI resistance R1 behaves similarly to that of the charged state, the only difference being that its minimum is at the 150th cycle, followed by a gradual increase. The second semicircle refers to charge transfer. The capacitance Q2 behaves non-monotonically. It first decreases up to the 150th cycle, then increases up to 1200th one and remains at ca. 1∙10−4 F till the end of cycling. This generally follows the dependence of the capacity on the cycle number shown in Figure 3b. This change in capacitance is due to electrochemical milling during cycling, which leads to a deterioration of the contact between the active material and the conductive additive. This results in a decrease in capacitance and an increase in resistance. Some FeOOH particles completely disconnect from the conductive matrix, leading to a Q2 vs cycle number dependence minimum. Despite this, the charge transfer resistance decreases up to 500th cycle. Such behavior may be related to the phenomenon occurred in particles that have maintained contact with the electrode conducting elements: the interface between passivation film (SEI) and material, formed previously, cannot hinder Li+ ion transfer and hence resistance decreases [120]. As a result, the expected increase of resistance during deterioration of contact area with conducting elements of the electrode is compensated by facilitation of Li+ ion transfer.
The Warburg constant for the discharged state demonstrates the same behavior as in the charged state, decreasing monotonically during the initial 1200 cycles, followed by an increase. Since the Warburg constant is inversely proportional to the electrode surface area [121], its decline indicates surface area growth related to the electrochemical milling of the material, and correlates with the change in the SEI resistance.
The change of size induced by electrochemical milling can be calculated from PITT measurements using Cottrell approach, by applying a model for intercalation materials derived by Montella [118]. To do this, we performed chronoamperometric measurements at 1.5 V with a step of 0.01 V after the 5th, 50th, 150th, 500th, 1200th, and 2000th cycles. We chose this potential value since it reflects the process of lithium intercalation into FeOOH without accompanying conversion reaction that directly leads to the milling (see Eq. 4). This means that regardless of particle size the Li+ diffusion coefficient will be the same and allows application of Montella intercalation model for the size changes calculations.
According to Montella model, the maximum in I√t-lgt dependency is proportional to the Li+ diffusion coefficient D (cm2∙s−1) and the characteristic diffusion length L (cm), which is equal to the particles’ radii in the case of spherical particles:
where ∆Q (C) is the faradaic charge passed following a potential step, t (s) is the measurement time.
The existence of two maxima in I√t-lgt dependency implies the appearance of new particles with another L value. The initial cycle shows only one peak, for which L value is 300 nm, as seen in SEM (Figure 1a, b). Further cycling leads to the emergence of the second peak (Figure 8a, Figure S3) with its intensity increasing and its position shifting towards higher lg(t) values. Fitting I√t-lgt dependencies yields (I√t)max and ΔQ values for each particle size.
Equation (8) can be represented as:
Division of (I√t)max2 by (I√t)max1 yields the equation to calculate particles’ size:
From ΔQ1 and ΔQ2 we can calculate the mass fraction (W2) of particles with the characteristic length L2 depending on the cycle number:
The calculated L2 and W2 values in Figure 8b show that the particles grow from 1.5 nm in the 5th cycle to 25 nm in the 150th one. The growth slows down during further cycling, so that the size of particles increases to 55 nm by the 2000th cycle. These results correlate with a drop and following growth of capacity in FeOOH/PANI cycle life tests (Figure 3b).
These results also correlate with the Warburg constant value changes in EIS data. Again, assuming that particles are spherical—which is reasonable outcome of the milling process—this formula provides the changes of specific area of FeOOH/PANI during cycling [122]:
where is FeOOH density, 4.0 g∙cm−3, w1 is mass ratio of the grains with the diameter d1; w2 is the mass ratio of the grains with the diameter d1.
As seen in Figure 8c, the surface area of FeOOH/PANI sharply grows up to the 150th cycle, caused by an increase of the ratio of particles with the characteristic length L2 under 10 nm. Then, the growth increases and reaches its maximum at 11.60 m2∙g−1 by the 2000th cycle. The dependencies of the Warburg constant and the surface area of the particles on the number of cycles are inversely proportional, thus confirming the validity of our assumptions that allowed us to calculate the characteristic length L2 and the specific surface area S. These results also support that electrochemical milling of FeOOH/PANI particles occurs during cycling, reflecting in the dependence of specific capacity on the cycle number (Figure 3b).
We conducted ex situ, FTIR, XPS, and SEM/EDX of FeOOH/PANI-based electrodes to investigate the structural changes and their effects on the charge storage mechanism in more detail. We recorded ATR FTIR spectra after cycling of the FeOOH for a different number of cycles (Figure 9). Since the penetration depth of the ATR FTIR typically does not exceed 2 µm [123], the observed spectral response is mostly attributed to the products that formed on the electrode surface. During the charge-discharge, rapid decrease of the bands at 3195 cm−1 and 3025 cm−1 was observed, indicating either dehydration of the material and/or the growth of the thick (>1 µm) SEI or gel-polymer coating on the material. An increase of the group of bands around 950–1100 cm−1 and 1480 cm−1, corresponding to P-F and C-F stretching vibrations, indicates the formation of the electrolyte decomposition products. Combination of the bands at 1400 cm−1 and 845 cm−1 testifies to the presence of the Li2CO3 or other inorganic carbonates.
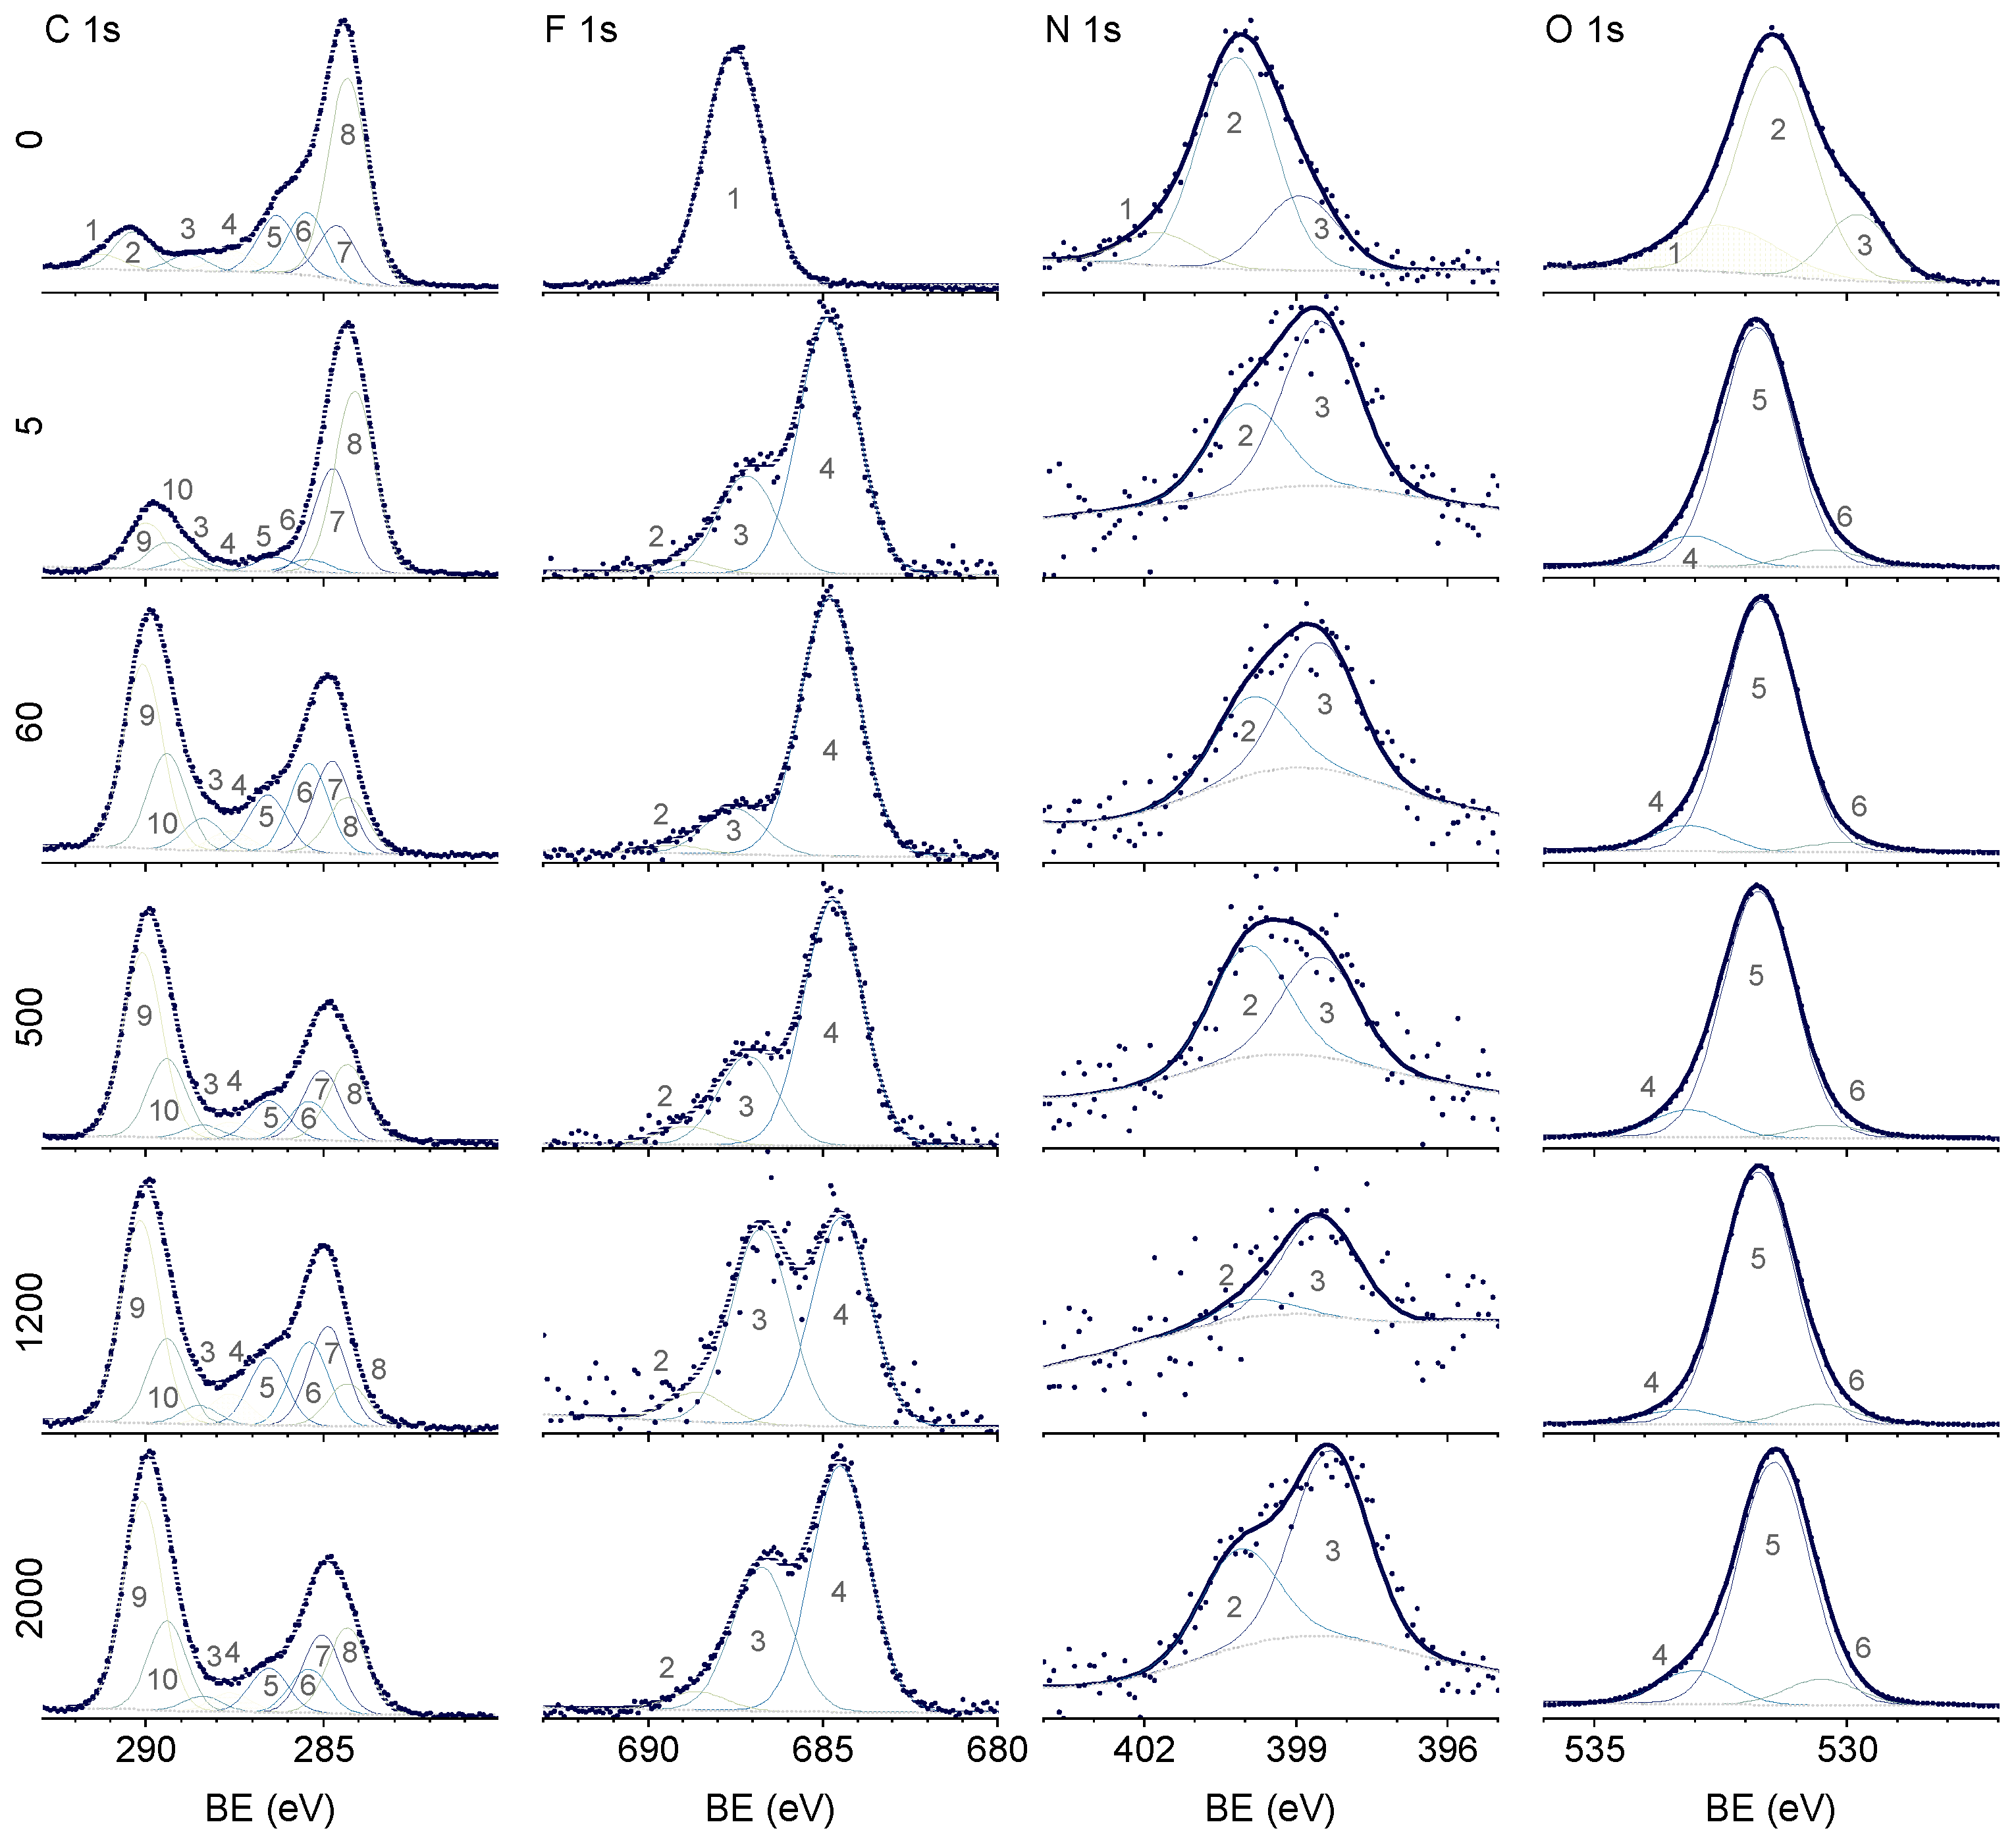
The change in the FeOOH/PANI electrochemical behavior during long-term cycling may also be linked to the changes in SEI composition during this process, which we studied via postmortem XPS. The results are shown in Figure 11, Figure S4, Figure S5 and Table 4. The table summarizes the position of the peaks, and which compounds they belong to.
The spectra of the N 1s, Fe 2p, and O 1s (Figure S4 and Figure 10) for the electrode prior to cycling (0 cycles) coincide with the pure FeOOH/PANI (Figure 2). The carbon spectrum shows bonds corresponding to carbon black, PANI, PVDF, and oxygen-containing groups on their surface. F 1s refers to PVDF. After 5 charge-discharge cycles, the surface composition of the electrode changes and continues changing throughout 2000 cycles. On the C 1s spectrum, the same peaks remain, which are related to carbon black and aliphatic chains. By cycle 5, the intensity of the signals assigned to C in C-N-C, C-N+-C, and -C=O groups decreases significantly, and C-F (PVDF) disappears completely. These signals might be overwhelmed by the newly emerged bands corresponding to inorganic and organic salts, i.e., the products of electrolyte decomposition: LiF and LixPFy-1Oz+1 (not a product of complete decomposition of LiPF6 [39]) in the F 1s spectrum, lithium carbonate and carboxylates in the C 1s, O 1s spectra, and disappearance of positively charged nitrogen in the N 1s spectrum, which corresponds to the reduction of oxidized form of aniline, which is obtained during synthesis, to neutral, preserved throughout the cycling, as indicated by -N= and -NH- groups on the spectrum N 1s. Most likely, PANI changes from the protonated form to the lithiated [56,124]. Despite the formation of electrolyte decomposition products on the electrode surface, the N 1s spectrum shape was preserved during cycling (Figure 10), although its intensity decreased compared to the zero cycle. This may be a consequence of electrode cracking during solvent drying and exposure of the innermost part of the electrode, which will be discussed below.
The C 1s spectrum shape remains stable between cycles 60 and 2000. At cycle 5, peaks of lithium carboxylates and carbonate appear, which significantly increase in intensity by cycle 60 (discharge capacity minimum) and persist until the end of cycling, which may indicate a slowing down of solvent reduction, which, in accordance with the publications [40,41,125,126], can be represented by the following reactions:
Also, by cycle 60 the LiF content increases significantly compared to LixPFy-1Oz+1. Both salts are products of LiPF6 decomposition in the presence of water or oxygen [39]. The reactions corresponding to the formation of these salts can be represented as follows [40,127]:
The increased intensity of the LixPFy-1Oz+1 peak to LiF after the 60th cycle indicates the continuing process of LiPF6 decomposition. Obviously, during SEI formation up to cycle 60, the higher LiF content in SEI is explained by the substantial number of reactions of which it is a product (e.g., reactions 18–23). Further cycling causes some of these reactions to slow down or stop. The availability of PANI makes it act as a conductive binder [128,129,130,131] into which iron oxide particles are redeposited. This leads to an increasing proportion of material involved in the storage capacity with the formation of products that stimulate LixPFy-1Oz+1 generation.
Figure 10.
XPS spectra of C 1s, F 1s, N 1s and O 1s for FeOOH/PANI-electrode after cycling. The rows are for cycle numbers 0, 5, 60, 500, 1200, and 2000, and the columns are for the C, F, N, and O 1s bands. In each spectrum, dark blue dots are for experimental data, thick blue line is approximation curve, and dotted gray line is background curve. Fitted peaks assignment: in C 1s: 1—C–F (CnFm) π-π*, 2—C–F (PVDF), 3—R–F (organoflourine), 4—C=O, 5—C–OH/C–N+–C/CH2–CH2 (PVDF), 6—C–N–C/C–O–C, 7—C=C (sp2), 8—C–C (sp3), 9—Li2CO3, 10—O=C–O; in F 1s: 1—C–F (PVDF), 2—LiF, 3—LixPOy−1Fz+1, 4—C–F (CnFm); in N 1s: 1—positively charged nitrogen (oxidized amine), 2—benzenoid amine (–NH–), 3—imine (–N=); in O 1s: 1—SO42−, 2—Fe–OH, 3,6—Fe–O, 4—C–O–C/P–O–P, 5—C=O/P=O/–OH.
Examination of the spectra of Li 1s + Fe 3p and Fe 2p (Figure S4, S5) confirms the above-described behavior of the electrodes during cycling. In the initial sample (0 cycles), the Fe 2p spectrum completely coincides with the one in Figure 2, and only one peak related to Fe 3p is present in Li 1s + Fe 3p (Table 4). After the charge-discharge cycles, the intensity of Fe 3p line decreases significantly, and a pronounced peak of Li 1s appears, referring to various salts: carbonates, fluoride, carboxylates.

Table 4.
Peak positions of C 1s, F 1s, N 1s, O 1s, Li 1s in XPS data of cycled FeOOH/PANI electrodes.
Table 4.
Peak positions of C 1s, F 1s, N 1s, O 1s, Li 1s in XPS data of cycled FeOOH/PANI electrodes.
| Peak | Chem. bond | Component | Sample BE after cycling, eV | BE from references | ||||||
| 0 | 5 | 60 | 500 | 1200 | 2000 | BE, eV | Ref. | |||
| C 1s | C=C (sp2) | carbon black | 284.3 | 281.1 | 284.3 | 284.3 | 284.3 | 284.3 | 284.0–284.6 | [33,133,134] |
| H-C-C (sp3) | aliphatic chain | 284.6 | 284.6 | 284.7 | 285.0 | 284.9 | 285.0 | 284.6–286.0 | [33,133,134] | |
| C-N-C/C-O-C | PANI, ethers | 285.4 | 285.4 | 285.4 | 285.4 | 285.4 | 285.4 | 285.3–286.0 | [33,84,85,86] | |
| C-OH/C-N+-C/CH2-CH2 | alcohols, PANI, PVDF | 286.3 | 286.4 | 286.5 | 286.5 | 286.5 | 286.5 | 286.3–286.7 | [33,84,85,86] | |
| C=O | ketones, aldehydes | 287.6 | 287.6 | 287.6 | 287.6 | 287.6 | 287.6 | 287.1–288.1 | [33,133,134,135] | |
| R-F | organofluoric | 288.8 | 288.8 | 288.4 | 288.4 | 288.5 | 288.4 | 287.7–290.2 | [33,133,134] | |
| F-C-F | PVDF | 290.3 | - | - | - | - | - | - | [33] | |
| O-C(=O)-O | Li2CO3, semiorganic carbonates | - | 290.1 | 290.1 | 290.1 | 290.1 | 290.1 | 289.6–290.1 | [33,136,137] | |
| F 1s | C-F | PVDF | 687.5 | - | - | - | - | - | 687.3–687.9 | [33,138,139] |
| C-F | CnFm | - | 689.0 | 689.2 | 688.9 | 688.7 | 688.6 | 688.4–690.0 | [33,140,141,142] | |
| F-P-O | LixPOy-1Fz+1 | - | 687.2 | 687.5 | 687.1 | 686.8 | 686.8 | 686.1–687.9 | [33] | |
| Li-F | LiF | - | 684.6 | 684.7 | 684.7 | 684.5 | 684.5 | 684.5–685.0 | [33,143,144] | |
| N 1s | N+-H | oxidized amine, | 401.7 | - | - | - | - | - | 401.1–401.7 | [85,145,146] |
| N-H | benzenoid amine | 400.2 | 399.9 | 399.8 | 399.9 | 399.8 | 400.0 | 399.6–400.7 | [83,85,146] | |
| -N= | imine | 398.9 | 398.5 | 398.5 | 398.5 | 398.5 | 398.3 | 398.1–399.3 | [83,85,145,147] | |
| O 1s | Fe=O | FeOOH | 529.9 | - | - | - | - | - | 530.0–530.5 | [77,79,80] |
| Fe-OH | FeOOH | 531.4 | - | - | - | - | - | 531.2–531.6 | [77,79,80] | |
| S=O, S-O− |
SO42− | 532.5 | - | - | - | - | - | 532.2–532.6 | [81,82,142] | |
| Fe-O | Oxide matrix, FeOOH | - | 530.5 | 530.2 | 530.3 | 530.5 | 530.5 | 530.0–530.5 | [41,77,79,80] | |
| C=O, P=O, -OH | Alkoxide, carboxylate, esters, Li2CO3, LixPOy−1Fz+1 | - | 531.8 | 531.7 | 531.8 | 531.7 | 531.5 | 531.2–532.0 | [33,41,79] | |
| C-O-C, P-O-P | Organic carbonate, LixPOy−1Fz+1, LixPOy | 533.1 | 533.1 | 533.1 | 533.2 | 533.1 | 531.1–533.8 | [33,41] | ||
| Li 1s | Li-F Li-OLi P-OLi |
LiF, carboxylates, Li2CO3, ROLi, LixPOy−1Fz+1, LixPOy | - | 55.4 | 55.3 | 55.4 | 55.4 | 55.2 | 55.2 – 55.8 | [33,41,148] |
| Fe3+ | FeOOH | 55.7 | - | - | - | - | - | 55.6–55.8 | [132,149] | |
| Fe3+ | Oxide matrix | - | 55.8 | 55.8 | 55.8 | 55.8 | 55.8 | 55.6–55.8 | [132,149] | |
| Fe2+ | Oxide matrix | - | 53.7 | 53.7 | 53.7 | 53.7 | 53.7 | 53.7–53.8 | [132] | |
There are also weakly pronounced peaks of Fe2+ and Fe3+ corresponding to different states of iron in the oxide matrix. In the Fe 2p spectrum two peaks are visually identified at 710.5 eV and 715.5 eV, which can be attributed to Fe2+ and Fe3+ in the Fe3O4 and FeO mixture [132]. By the 60th cycle, the iron lines disappear completely. This coincides with the cycle number with minimal specific capacity. Further cycling leads to an increase of both the capacity and the XPS lines intensities again, confirming the assumption of electrochemical milling of the material.
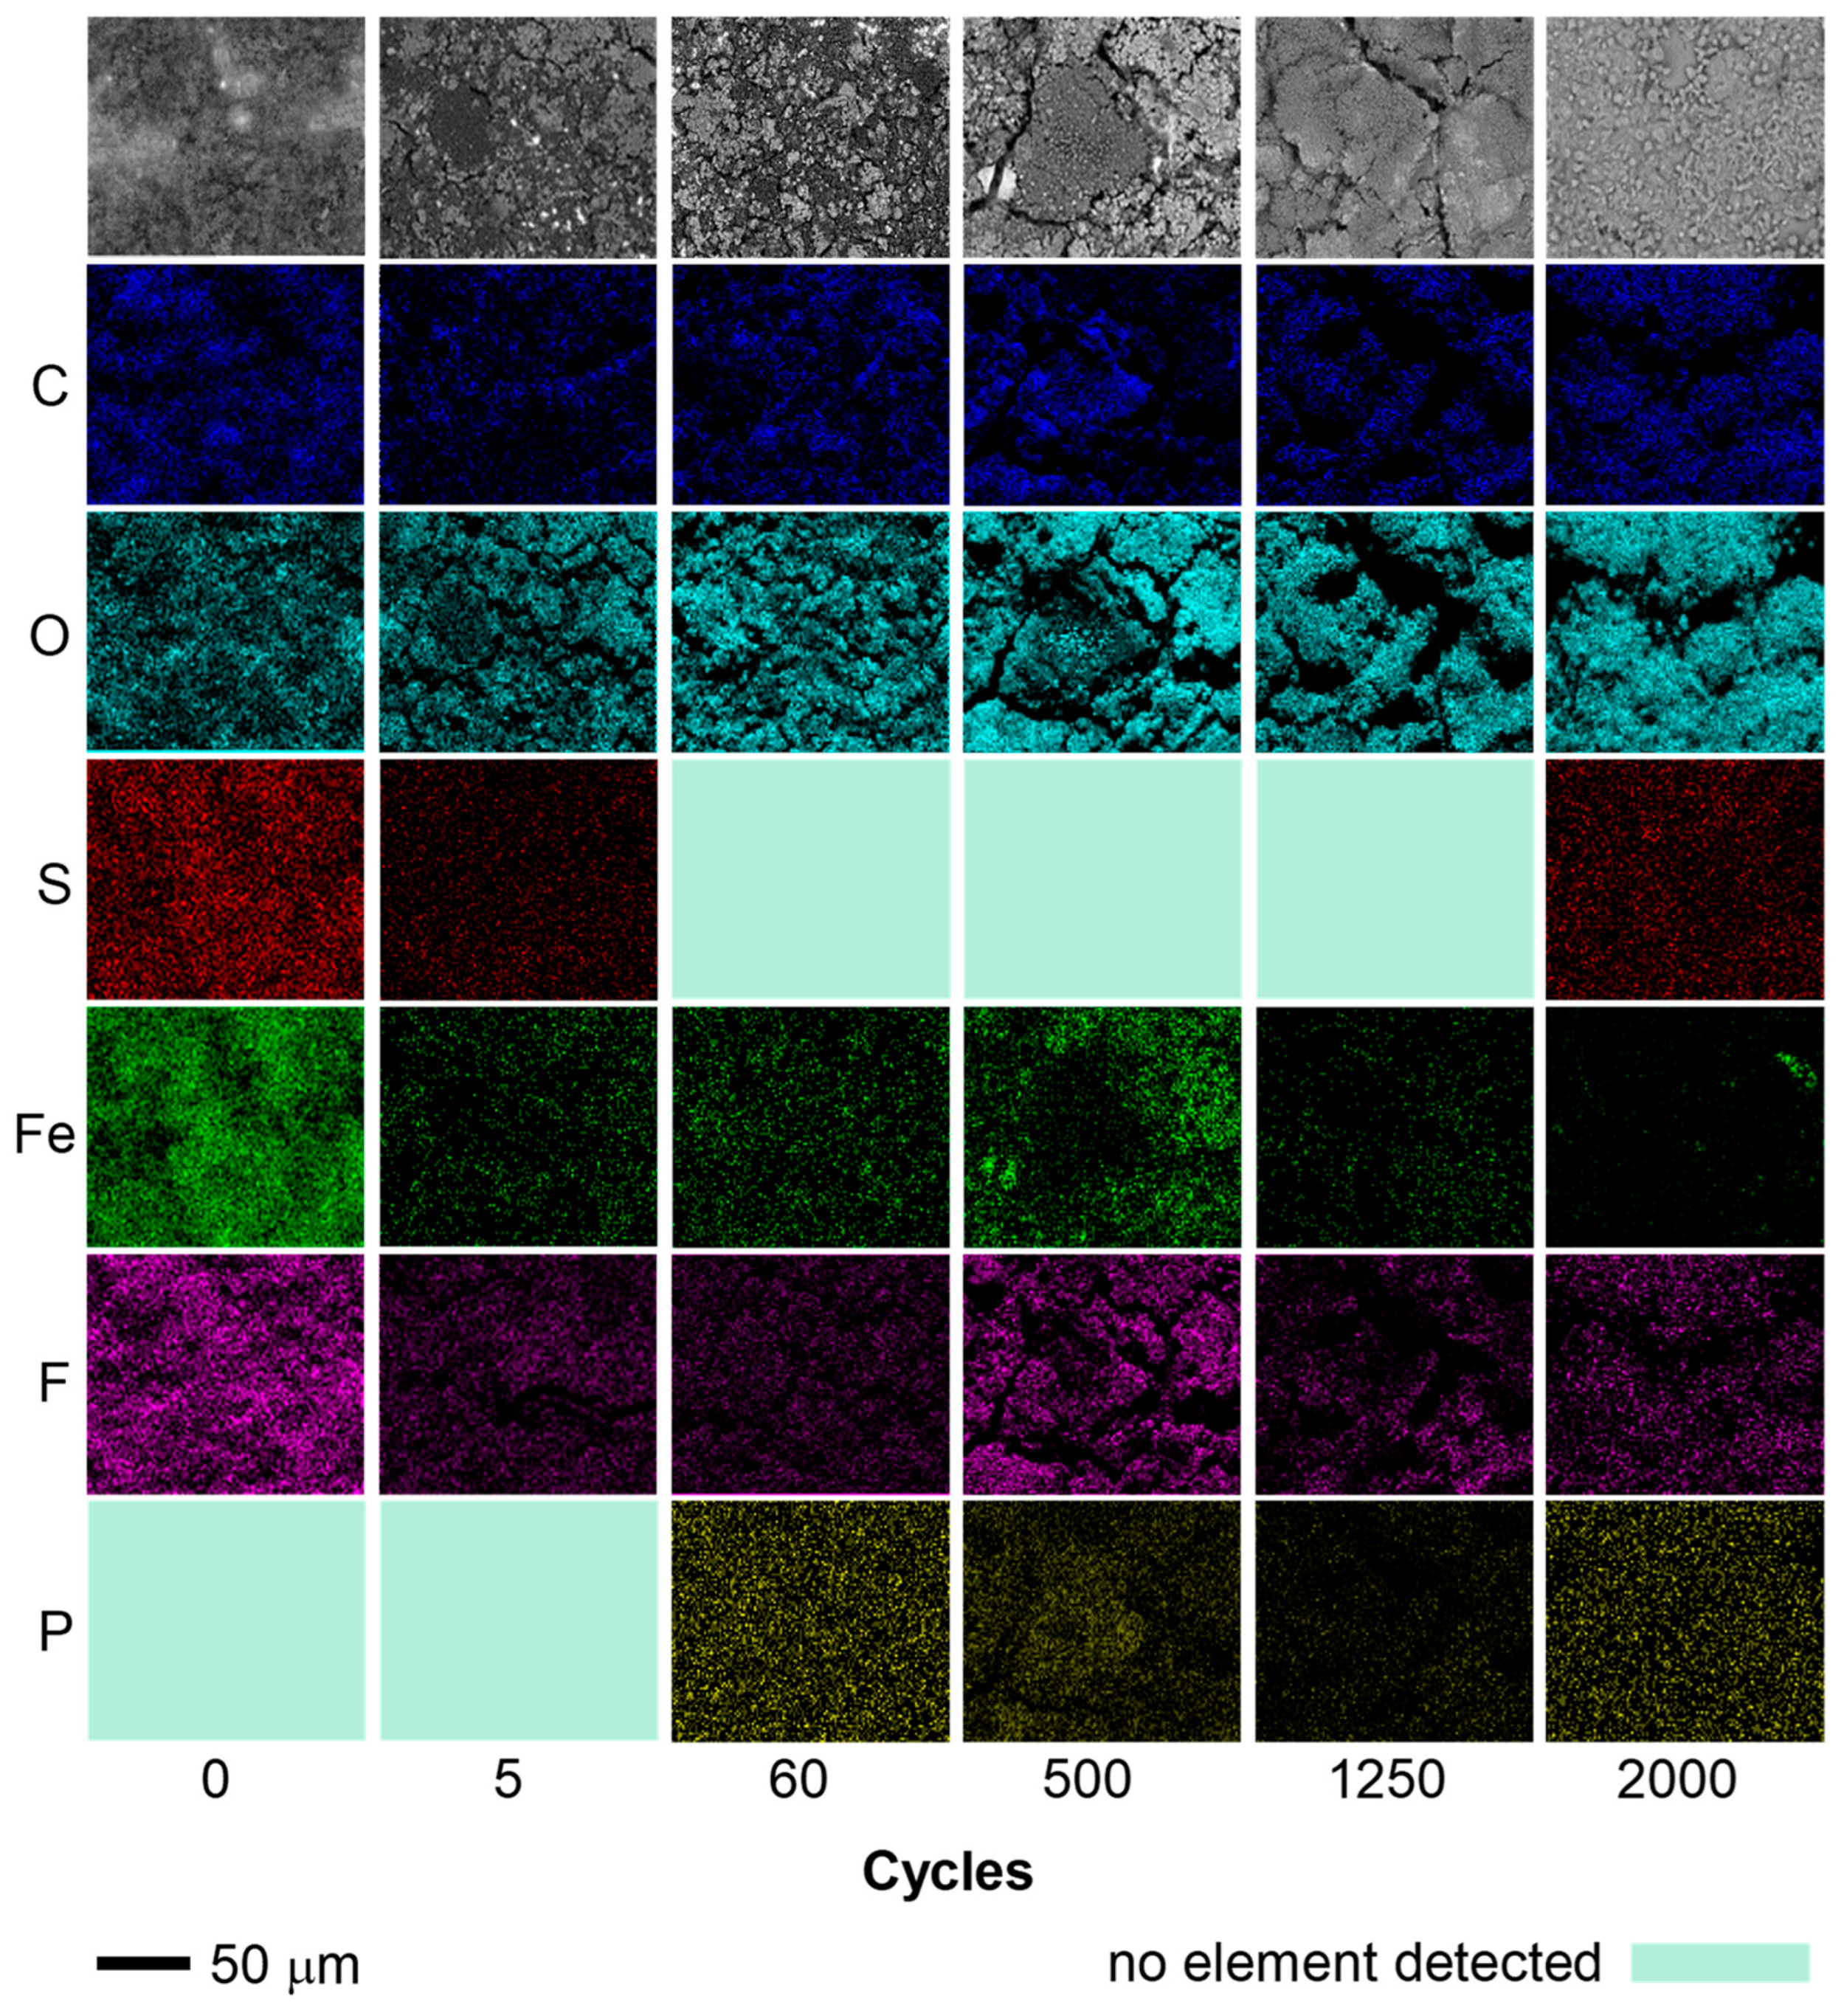
According to EDX analysis (Figure 11), the electrode surface changes significantly during long cycling, as does the elemental composition. Since the penetration depth of the energy dispersive spectroscopy typically does not exceed 0.02–1 µm [150], the elemental mapping results presented relate to a part of the electrode not immediately reflective of the entire electrode elemental contents. Specifically, for the results presented, the penetration depth did not exceed 500 nm. After 500 cycles, small spherical particles up to 200 nm appear on the surface, their number increases during cycling and after 2000 cycles they significantly cover the surface (Figure S6). Also, the figure shows that the electrode is abundantly covered by the electrolyte decomposition products, which causes it to crack into “islands” of different sizes. Electrode cracking after drying can be caused by a notable change in volume and an increase in internal stresses [151]. Among such decomposition products are various organic compounds that form a redox active gel-polymer layer during catalytic reduction of electrolyte on iron particle [42,152]. Microphotographs of the electrode confirm the formation of a decomposition product layer about 200 nm thick covering the surface. Figure S6 also clearly shows the change in the shape of the FeOOH/PANI composite particles, which goes from urchin-like to rounded spherical with smooth edges by cycle 5, and to complete inability to visually identify them by cycle 2000. Most likely, they are gradually pulverized and mixed with the electrolyte decomposition products.
The results of elemental mapping are shown in Figure 11. Oxygen content gradually increases along with the cycle number. The composition of the electrode for other elements changes non-monotonically: between cycles 60 and 1200 sulfur signal disappears completely, which is most likely due to the sensitivity limit of the instrument; fluorine content decreases until cycle 60, then increases until cycle 500 and decreases again; phosphorus is not detected until cycle 60, decreasing gradually by cycle 1200 and then increasing by cycle 2000; iron content decreases gradually by cycle 60, then increases by cycle 500 and almost completely disappears by cycle 2000.
Thus, based on electrochemical (EIS) and physicochemical (ATR-FTIR, XPS, SEM/EDX) characterization methods, we can assume that the electrode composition constantly changes both internally and on the surface during cycling, i.e., electrode is a dynamically evolving inhomogeneous system. At the same time, during cycling:
- The porosity of the electrode increases, opening the access of the electrolyte to a more electroactive material.
- The electrochemical milling of the electrode components first results in a sharp increase of the SEI amount, and, after SEI stabilizes, continued milling of FeOOH leads to an increase in capacity due to gradually improving contact of FeOOH with carbon black and PANI.
- The electrode reaches a stable capacity after 1200 cycles, and the achieved capacity value corresponds to the original capacity of the electrode, as C-rate (Figure 3a) testing after the end of the long cycling shows.
Similar capacity behavior during cycling has been noted in several articles [95,153]. The duration of the capacity reaching a stable value also depends on the cycling current, similar to our previous report for FeOOH/Graphite [68] for 0.3 Aˑg−1 and 1.2 Aˑg−1. Therefore, it is particularly important to study the capacity “pit” formation as a function of the number of cycles influenced by the electrode transformation mode during the early cycles. Although this aspect is not covered in this study, it will be addressed in future research.
Figure 11.
Element mapping for cycled electrodes obtained via EDX.
5. Conclusions
A simple one-step atmospheric plasma-assisted synthesis method was used to create an urchin-like FeOOH/PANI nanoparticles composite. After 2000 cycles, FeOOH/PANI showed exceptional performance as anodes for Li-ion batteries in terms of cycling behavior and capacity retention: 767 mA∙h·g−1 at 1.2 A·g−1, 1600 mA∙h·g−1 at 0.05 A·g−1, and 181 mA∙h·g−1 at 10 A·g−1. The capacity of the product exhibits two unusual trends during cycling at 1.2 A·g−1: a decrease in capacity to ca. 140 mA∙h·g−1 in the first 40–60 cycles, followed by a remarkable increase to 767 mA∙h·g−1 after 1200 cycles. The outstanding performance is attributed to the electrochemical milling effect, which results in a decrease in nanoparticle size and the formation of a porous structure. This provides good structural stability and increases the contact between the electrode and electrolyte. As a result, the material fully regains its capacity after 1200 cycles and exhibits a value of 1600 mA∙h·g−1 at 0.05 A·g−1, which is equal to the first cycle's capacity. Comparison of full cells with NMC532 cathode and FeOOH/PANI or graphite anodes revealed comparable specific energy characteristics: 224 Wh·kg-1 vs. 264 Wh·kg-1. This, along with the low cost, makes FeOOH/PANI anode material appealing enough to replace existing graphite materials.
Supplementary Materials
The following supporting information can be downloaded at the website of this paper posted on Preprints.org. Figure S1: Synthesis setup diagram; Figure S2: SEM images and EDX spectra of plasma solution synthesized FeOOH, PANI and FeOOH/PANI composite; electrical conductivity temperature dependence of FeOOH/PANI composite, and charge-discharge curve of the NMC532 - Graphite full cell at a C/2 rate; Figure S3: Cottrell function plot for the current transient versus the decimal logarithm of time; Figure S4: XPS spectra of Fe 2p; Figure S5: XPS spectra of Li 1s + Fe 3p; Figure S6: Evolution of the electrode surface during 2000 cycles.
Author Contributions
Conceptualization, E.V.B.; investigation, E.V.B., K.A.K., O.V.G., M.A.K. and D.A.L.; formal analysis, E.V.B.; writing—original draft preparation, E.V.B., project administration, E.V.B.; supervision, E.V.B.; visualization, E.V.B., A.I.V.; writing–review and editing, A.I.V., K.A.K., D.A.L., O.V.L.; resources, M.A.K.; validation, O.V.L.; funding acquisition, O.V.L.
Funding
The work was supported by St Petersburg University, project 101746712 "Practice-oriented approach to the development of batteries based on organic materials".
Data Availability Statement
The data generated in this study may be provided by the corresponding authors upon reasonable request.
Acknowledgments
We thank the following resource centers of the Research Park of St. Petersburg State University. The Resource Center “Physical methods of surface investigation” for the XPS. The Resource Center “Nanotechnology” for the SEM/EDX and ATR-FTIR studies. The Research Centre for X-ray Diffraction Studies for XRD measurements.
Conflicts of Interest
The authors declare no conflict of interest.
References
- Zubi, G.; Dufo-López, R.; Carvalho, M.; Pasaoglu, G. The Lithium-Ion Battery: State of the Art and Future Perspectives. Renew. Sustain. Energy Rev. 2018, 89, 292–308. [Google Scholar] [CrossRef]
- Manthiram, A. An Outlook on Lithium Ion Battery Technology. ACS Cent. Sci. 2017, 3, 1063–1069. [Google Scholar] [CrossRef]
- Armand, M.; Axmann, P.; Bresser, D.; Copley, M.; Edström, K.; Ekberg, C.; Guyomard, D.; Lestriez, B.; Novák, P.; Petranikova, M.; et al. Lithium-Ion Batteries – Current State of the Art and Anticipated Developments. J. Power Sources 2020, 479, 228708. [Google Scholar] [CrossRef]
- Cheng, H.; Shapter, J.G.; Li, Y.; Gao, G. Recent Progress of Advanced Anode Materials of Lithium-Ion Batteries. J. Energy Chem. 2021, 57, 451–468. [Google Scholar] [CrossRef]
- Roy, P.; Srivastava, S.K. Nanostructured Anode Materials for Lithium Ion Batteries. J. Mater. Chem. A 2015, 3, 2454–2484. [Google Scholar] [CrossRef]
- Chen, R.; Nolan, A.M.; Lu, J.; Wang, J.; Yu, X.; Mo, Y.; Chen, L.; Huang, X.; Li, H. The Thermal Stability of Lithium Solid Electrolytes with Metallic Lithium. Joule 2020, 4, 812–821. [Google Scholar] [CrossRef]
- Pu, K.-C.; Zhang, X.; Qu, X.-L.; Hu, J.-J.; Li, H.-W.; Gao, M.-X.; Pan, H.-G.; Liu, Y.-F. Recently Developed Strategies to Restrain Dendrite Growth of Li Metal Anodes for Rechargeable Batteries. Rare Met. 2020, 39, 616–635. [Google Scholar] [CrossRef]
- Wu, Y.-P.; Rahm, E.; Holze, R. Carbon Anode Materials for Lithium Ion Batteries. J. Power Sources 2003, 114, 228–236. [Google Scholar] [CrossRef]
- Andre, D.; Hain, H.; Lamp, P.; Maglia, F.; Stiaszny, B. Future High-Energy Density Anode Materials from an Automotive Application Perspective. J. Mater. Chem. A 2017, 5, 17174–17198. [Google Scholar] [CrossRef]
- Poizot, P.; Laruelle, S.; Grugeon, S.; Dupont, L.; Tarascon, J.-M. Nano-Sized Transition-Metal Oxides as Negative-Electrode Materials for Lithium-Ion Batteries. Nature 2000, 407, 496–499. [Google Scholar] [CrossRef]
- Qin, D.; Yan, P.; Li, G.; Wang, Y.; An, Y.; Xing, J. Synthesis of Hierarchical CoO Nano/Microstructures as Anode Materials for Lithium-Ion Batteries. J. Nanomater. 2014, 2014, 1–5. [Google Scholar] [CrossRef]
- Subalakshmi, P.; Sivashanmugam, A. Nano Co3O4 as Anode Material for Li–Ion and Na-Ion Batteries: An Insight into Surface Morphology. ChemistrySelect 2018, 3, 5040–5049. [Google Scholar] [CrossRef]
- Yoon, T.; Kim, J.; Kim, J.; Lee, J. Electrostatic Self-Assembly of Fe3O4 Nanoparticles on Graphene Oxides for High Capacity Lithium-Ion Battery Anodes. Energies 2013, 6, 4830–4840. [Google Scholar] [CrossRef]
- Bhatt, M.D.; Lee, J.Y. High Capacity Conversion Anodes in Li-Ion Batteries: A Review. Int. J. Hydrogen Energy 2019, 44, 10852–10905. [Google Scholar] [CrossRef]
- Debart, A.; Dupont, L.; Poizot, P.; Leriche, J.B.; Tarascon, J.M. A Transmission Electron Microscopy Study of the Reactivity Mechanism of Tailor-Made CuO Particles toward Lithium. J. Electrochem. Soc. 2001, 148, A1266. [Google Scholar] [CrossRef]
- Hong, I.; Angelucci, M.; Verrelli, R.; Betti, M.G.; Panero, S.; Croce, F.; Mariani, C.; Scrosati, B.; Hassoun, J. Electrochemical Characteristics of Iron Oxide Nanowires during Lithium-Promoted Conversion Reaction. J. Power Sources 2014, 256, 133–136. [Google Scholar] [CrossRef]
- Imtiaz, M.; Chen, Z.; Zhu, C.; Pan, H.; Zada, I.; Li, Y.; Bokhari, S.W.; Luan, R.Y.; Nigar, S.; Zhu, S. In Situ Growth of β-FeOOH on Hierarchically Porous Carbon as Anodes for High-Performance Lithium-Ion Batteries. Electrochim. Acta 2018, 283, 401–409. [Google Scholar] [CrossRef]
- Nanda, J.; Zhou, H.; Martha, S.K.; Li, J.; Dai, S.; Pannala, S.; Wang, J.; Braun, P. V; Dudney, N.J.; Adcock, J. Molecular and Electrode Arcitectures for Multivalent Conversion Electrodes. ECS Meet. Abstr. 2014, MA2014-02, 483. [Google Scholar] [CrossRef]
- Carbonari, G.; Maroni, F.; Gabrielli, S.; Staffolani, A.; Tossici, R.; Palmieri, A.; Nobili, F. Synthesis and Characterization of Vanillin-Templated Fe2O3 Nanoparticles as a Sustainable Anode Material for Li-Ion Batteries. ChemElectroChem 2019, 6, 1915–1920. [Google Scholar] [CrossRef]
- Salunkhe, T.T.; Varma, R.S.; Kadam, A.N.; Lee, S.-W.; Lee, Y.-C.; Hur, J.; Kim, I.T. Scraps to Superior Anodes for Li-Ion Batteries: Sustainable and Scalable Upgrading of Waste Rust. J. Hazard. Mater. 2021, 410, 124571. [Google Scholar] [CrossRef]
- Wang, X.; Chen, X.; Gao, L.; Zheng, H.; Ji, M.; Tang, C.; Shen, T.; Zhang, Z. Synthesis of β-FeOOH and α-Fe 2 O 3 Nanorods and Electrochemical Properties of β-FeOOH. J. Mater. Chem. 2004, 14, 905–907. [Google Scholar] [CrossRef]
- Lou, X.; Wu, X.; Zhang, Y. Goethite Nanorods as Anode Electrode Materials for Rechargeable Li-Ion Batteries. Electrochem. commun. 2009, 11, 1696–1699. [Google Scholar] [CrossRef]
- Peng, S.; Yu, L.; Sun, M.; Cheng, G.; Lin, T.; Mo, Y.; Li, Z. Bunched Akaganeite Nanorod Arrays: Preparation and High-Performance for Flexible Lithium-Ion Batteries. J. Power Sources 2015, 296, 237–244. [Google Scholar] [CrossRef]
- Zhai, Y.; Xu, L.; Qian, Y. Ce-Doped α-FeOOH Nanorods as High-Performance Anode Material for Energy Storage. J. Power Sources 2016, 327, 423–431. [Google Scholar] [CrossRef]
- Liang, B.; Zhu, S.; Wang, J.; Liang, X.; Huang, H.; Huang, D.; Zhou, W.; Xu, S.; Guo, J. Silicon-Doped FeOOH Nanorods@graphene Sheets as High-Capacity and Durable Anodes for Lithium-Ion Batteries. Appl. Surf. Sci. 2021, 550, 149330. [Google Scholar] [CrossRef]
- Jin, X.; Li, Y.; Jin, T.; Jiang, J.; Zhu, Q.; Yao, J. Facile and Efficient Synthesis of Binary FeOOH/Fe2O3 Composite as a High-Performance Anode Material for Lithium-Ion Batteries. J. Alloys Compd. 2022, 896, 163026. [Google Scholar] [CrossRef]
- Qi, H.; Huang, J.; Tang, L.; Ma, M.; Deng, W.; Zhang, C. Confined Pulverization Promoting Durable Pseudocapacitance for FeOOH@PEDOT Anode in Li-Ion Battery. J. Electroanal. Chem. 2021, 882, 115005. [Google Scholar] [CrossRef]
- Amine, K.; Yasuda, H.; Yamachi, M. β-FeOOH, a New Positive Electrode Material for Lithium Secondary Batteries. J. Power Sources 1999, 81, 221–223. [Google Scholar] [CrossRef]
- Tabuchi, T.; Katayama, Y.; Nukuda, T.; Ogumi, Z. β-FeOOH Thin Film as Positive Electrode for Lithium-Ion Cells. J. Power Sources 2009, 191, 640–643. [Google Scholar] [CrossRef]
- Mukai, K.; Yamada, I. ϵ-FeOOH: A Novel Negative Electrode Material for Li-and Na-Ion Batteries. ACS omega 2020, 5, 10115–10122. [Google Scholar] [CrossRef]
- Yu, L.; Xi, S.; Wei, C.; Zhang, W.; Du, Y.; Yan, Q.; Xu, Z. Superior Lithium Storage Properties of β-FeOOH. Adv. Energy Mater. 2015, 5, 1401517. [Google Scholar] [CrossRef]
- Tabuchi, T.; Katayama, Y.; Nukuda, T.; Ogumi, Z. Surface Reaction of β-FeOOH Film Negative Electrode for Lithium-Ion Cells. J. Power Sources 2009, 191, 636–639. [Google Scholar] [CrossRef]
- Schulz, N.; Hausbrand, R.; Wittich, C.; Dimesso, L.; Jaegermann, W. XPS-Surface Analysis of SEI Layers on Li-Ion Cathodes: Part II. SEI-Composition and Formation inside Composite Electrodes. J. Electrochem. Soc. 2018, 165, A833–A846. [Google Scholar] [CrossRef]
- Nie, M.; Lucht, B.L. Role of Lithium Salt on Solid Electrolyte Interface (SEI) Formation and Structure in Lithium Ion Batteries. J. Electrochem. Soc. 2014, 161, A1001. [Google Scholar] [CrossRef]
- Nie, M.; Chalasani, D.; Abraham, D.P.; Chen, Y.; Bose, A.; Lucht, B.L. Lithium Ion Battery Graphite Solid Electrolyte Interphase Revealed by Microscopy and Spectroscopy. J. Phys. Chem. C 2013, 117, 1257–1267. [Google Scholar] [CrossRef]
- Peled, E. The Electrochemical Behavior of Alkali and Alkaline Earth Metals in Nonaqueous Battery Systems—the Solid Electrolyte Interphase Model. J. Electrochem. Soc. 1979, 126, 2047. [Google Scholar] [CrossRef]
- Verma, P.; Maire, P.; Novák, P. A Review of the Features and Analyses of the Solid Electrolyte Interphase in Li-Ion Batteries. Electrochim. Acta 2010, 55, 6332–6341. [Google Scholar] [CrossRef]
- Heiskanen, S.K.; Kim, J.; Lucht, B.L. Generation and Evolution of the Solid Electrolyte Interphase of Lithium-Ion Batteries. Joule 2019, 3, 2322–2333. [Google Scholar] [CrossRef]
- Parimalam, B.S.; Lucht, B.L. Reduction Reactions of Electrolyte Salts for Lithium Ion Batteries: LiPF6, LiBF4, LiDFOB, LiBOB, and LiTFSI. J. Electrochem. Soc. 2018, 165, A251–A255. [Google Scholar] [CrossRef]
- An, S.J.; Li, J.; Daniel, C.; Mohanty, D.; Nagpure, S.; Wood, D.L. The State of Understanding of the Lithium-Ion-Battery Graphite Solid Electrolyte Interphase (SEI) and Its Relationship to Formation Cycling. Carbon N. Y. 2016, 105, 52–76. [Google Scholar] [CrossRef]
- Bock, D.C.; Waller, G.H.; Mansour, A.N.; Marschilok, A.C.; Takeuchi, K.J.; Takeuchi, E.S. Investigation of Solid Electrolyte Interphase Layer Formation and Electrochemical Reversibility of Magnetite, Fe3O4, Electrodes: A Combined X-Ray Absorption Spectroscopy and X-Ray Photoelectron Spectroscopy Study. J. Phys. Chem. C 2018, 122, 14257–14271. [Google Scholar] [CrossRef]
- Laruelle, S.; Grugeon, S.; Poizot, P.; Dollé, M.; Dupont, L.; Tarascon, J.-M. On the Origin of the Extra Electrochemical Capacity Displayed by MO/Li Cells at Low Potential. J. Electrochem. Soc. 2002, 149, A627. [Google Scholar] [CrossRef]
- Tian, B.; Światowska, J.; Maurice, V.; Zanna, S.; Seyeux, A.; Klein, L.H.; Marcus, P. Combined Surface and Electrochemical Study of the Lithiation/Delithiation Mechanism of the Iron Oxide Thin-Film Anode for Lithium-Ion Batteries. J. Phys. Chem. C 2013, 117, 21651–21661. [Google Scholar] [CrossRef]
- Rezvani, S.J.; Nobili, F.; Gunnella, R.; Ali, M.; Tossici, R.; Passerini, S.; Di Cicco, A. SEI Dynamics in Metal Oxide Conversion Electrodes of Li-Ion Batteries. J. Phys. Chem. C 2017, 121, 26379–26388. [Google Scholar] [CrossRef]
- Kraytsberg, A.; Ein-Eli, Y. A Critical Review-Promises and Barriers of Conversion Electrodes for Li-Ion Batteries. J. Solid State Electrochem. 2017, 21, 1907–1923. [Google Scholar] [CrossRef]
- Zhao, H.; Song, Z.; Gao, H.; Li, B.; Hu, T.; Liu, F.; Sohn, H.Y. The Structure-Directing Role of Graphene in Composites with Porous FeOOH Nanorods for Li Ion Batteries. RSC Adv. 2020, 10, 41403–41409. [Google Scholar] [CrossRef]
- Chen, Y.X.; He, L.H.; Shang, P.J.; Tang, Q.L.; Liu, Z.Q.; Liu, Hb.; Zhou, L.P. Micro-Sized and Nano-Sized Fe3O4 Particles as Anode Materials for Lithium-Ion Batteries. J. Mater. Sci. Technol. 2011, 27, 41–45. [Google Scholar] [CrossRef]
- Zhong, G.; Qu, K.; Ren, C.; Su, Y.; Fu, B.; Zi, M.; Dai, L.; Xiao, Q.; Xu, J.; Zhong, X. Epitaxial Array of Fe3O4 Nanodots for High Rate High Capacity Conversion Type Lithium Ion Batteries Electrode with Long Cycling Life. Nano Energy 2020, 74, 104876. [Google Scholar] [CrossRef]
- Yu, L.; Wei, C.; Yan, Q.; Xu, Z.J. Controlled Synthesis of High-Performance β-FeOOH Anodes for Lithium-Ion Batteries and Their Size Effects. Nano Energy 2015, 13, 397–404. [Google Scholar] [CrossRef]
- Zhu, S.; Liang, B.; Mou, X.; Liang, X.; Huang, H.; Huang, D.; Zhou, W.; Xu, S.; Guo, J. In-Situ Synthesis of F-Doped FeOOH Nanorods on Graphene as Anode Materials for High Lithium Storage. J. Alloys Compd. 2022, 905, 164142. [Google Scholar] [CrossRef]
- Wang, C.; Yang, X.; Zheng, M.; Xu, Y. Synthesis of β-FeOOH Nanorods Adhered to Pine-Biomass Carbon as a Low-Cost Anode Material for Li-Ion Batteries. J. Alloys Compd. 2019, 794, 569–575. [Google Scholar] [CrossRef]
- Raccichini, R.; Varzi, A.; Wei, D.; Passerini, S. Critical Insight into the Relentless Progression toward Graphene and Graphene-containing Materials for Lithium-ion Battery Anodes. Adv. Mater. 2017, 29, 1603421. [Google Scholar] [CrossRef] [PubMed]
- Bryan, A.M.; Santino, L.M.; Lu, Y.; Acharya, S.; D’Arcy, J.M. Conducting Polymers for Pseudocapacitive Energy Storage. Chem. Mater. 2016, 28, 5989–5998. [Google Scholar] [CrossRef]
- Tajik, S.; Beitollahi, H.; Nejad, F.G.; Shoaie, I.S.; Khalilzadeh, M.A.; Asl, M.S.; Van Le, Q.; Zhang, K.; Jang, H.W.; Shokouhimehr, M. Recent Developments in Conducting Polymers: Applications for Electrochemistry. RSC Adv. 2020, 10, 37834–37856. [Google Scholar] [CrossRef] [PubMed]
- Kim, J.; Lee, J.; You, J.; Park, M.-S.; Al Hossain, M.S.; Yamauchi, Y.; Kim, J.H. Conductive Polymers for Next-Generation Energy Storage Systems: Recent Progress and New Functions. Mater. Horizons 2016, 3, 517–535. [Google Scholar] [CrossRef]
- Eliseeva, S.N.; Kamenskii, M.A.; Tolstopyatova, E.G.; Kondratiev, V. V. Effect of Combined Conductive Polymer Binder on the Electrochemical Performance of Electrode Materials for Lithium-Ion Batteries. Energies 2020, 13, 2163. [Google Scholar] [CrossRef]
- Zhang, M.; Han, D.; Lu, P. PEDOT Encapsulated β-FeOOH Nanorods: Synthesis, Characterization and Application for Sodium-Ion Batteries. Electrochim. Acta 2017, 238, 330–336. [Google Scholar] [CrossRef]
- Gong, X.; Li, S.; Lee, P.S. A Fiber Asymmetric Supercapacitor Based on FeOOH/PPy on Carbon Fibers as an Anode Electrode with High Volumetric Energy Density for Wearable Applications. Nanoscale 2017, 9, 10794–10801. [Google Scholar] [CrossRef]
- Wei, G.; Du, K.; Zhao, X.; Li, C.; Li, J.; Ren, K.; Huang, Y.; Wang, H.; Yao, S.; An, C. Integrated FeOOH Nanospindles with Conductive Polymer Layer for High-Performance Supercapacitors. J. Alloys Compd. 2017, 728, 631–639. [Google Scholar] [CrossRef]
- Sakaebe, H.; Higuchi, S.; Kanamura, K.; Fujimoto, H.; Takehara, Z. Discharge and Charge Characteristics of Amorphous FeOOH Including Aniline (Aan-FeOOH): Influence of Preparation Conditions on Discharge and Charge Characteristics. J. Electrochem. Soc. 1995, 142, 360. [Google Scholar] [CrossRef]
- Ma, H.; Zheng, Y.; Xian, J.; Feng, Z.; Li, Z.; Cui, F. A Light-Enhanced α-FeOOH Nanowires/Polyaniline Anode for Improved Electricity Generation Performance in Microbial Fuel Cells. Chemosphere 2022, 296, 133994. [Google Scholar] [CrossRef] [PubMed]
- Xiong, H.; Zhang, B.; Cui, C.; Xu, Y. Polyaniline/FeOOH Composite for Removal of Acid Orange II from Aqueous Solutions. Mater. Chem. Phys. 2022, 278, 125701. [Google Scholar] [CrossRef]
- Dou, S.; Tao, L.; Wang, R.; El Hankari, S.; Chen, R.; Wang, S. Plasma-assisted Synthesis and Surface Modification of Electrode Materials for Renewable Energy. Adv. Mater. 2018, 30, 1705850. [Google Scholar] [CrossRef] [PubMed]
- Iqbal, T.; Aziz, A.; Khan, M.A.; Andleeb, S.; Mahmood, H.; Khan, A.A.; Khan, R.; Shafique, M. Surfactant Assisted Synthesis of ZnO Nanostructures Using Atmospheric Pressure Microplasma Electrochemical Process with Antibacterial Applications. Mater. Sci. Eng. B 2018, 228, 153–159. [Google Scholar] [CrossRef]
- Oehrlein, G.S.; Hamaguchi, S. Foundations of Low-Temperature Plasma Enhanced Materials Synthesis and Etching. Plasma Sources Sci. Technol. 2018, 27. [Google Scholar] [CrossRef]
- Wang, Q.; Wang, X.; Chai, Z.; Hu, W. Low-Temperature Plasma Synthesis of Carbon Nanotubes and Graphene Based Materials and Their Fuel Cell Applications. Chem. Soc. Rev. 2013, 42, 8821–8834. [Google Scholar] [CrossRef]
- Tiya-Djowe, A.; Laminsi, S.; Noupeyi, G.L.; Gaigneaux, E.M. Non-Thermal Plasma Synthesis of Sea-Urchin like α-FeOOH for the Catalytic Oxidation of Orange II in Aqueous Solution. Appl. Catal. B Environ. 2015, 176–177, 99–106. [Google Scholar] [CrossRef]
- Beletskii, E. V.; Kamenskii, M.A.; Alekseeva, E. V.; Volkov, A.I.; Lukyanov, D.A.; Anishchenko, D. V.; Radomtseu, A.O.; Reveguk, A.A.; Glumov, O. V.; Levin, O. V. One-Step Atmospheric Plasma-Assisted Synthesis of FeOOH and FeOOH/Graphite High Performance Anode Materials for Lithium-Ion Batteries. Appl. Surf. Sci. 2022, 597, 153698. [Google Scholar] [CrossRef]
- Michel, M.; Bour, J.; Petersen, J.; Arnoult, C.; Ettingshausen, F.; Roth, C.; Ruch, D. Atmospheric Plasma Deposition: A New Pathway in the Design of Conducting Polymer-Based Anodes for Hydrogen Fuel Cells. Fuel Cells 2010, 10, 932–937. [Google Scholar] [CrossRef]
- Park, C.-S.; Kim, D.H.; Shin, B.J.; Tae, H.-S. Synthesis and Characterization of Nanofibrous Polyaniline Thin Film Prepared by Novel Atmospheric Pressure Plasma Polymerization Technique. Materials (Basel). 2016, 9, 39. [Google Scholar] [CrossRef]
- Iqbal, S. In-Situ Iodine Doping Characteristics of Conductive Polyaniline Film Polymerized by Low-Voltage-Driven Atmospheric Pressure Plasma. Polymers (Basel). 2021, 13. [Google Scholar] [CrossRef] [PubMed]
- Jeong, J.; Choi, B.G.; Lee, S.C.; Lee, K.G.; Chang, S.; Han, Y.; Lee, Y.B.; Lee, H.U.; Kwon, S.; Lee, G. Hierarchical Hollow Spheres of Fe2O3@ Polyaniline for Lithium Ion Battery Anodes. Adv. Mater. 2013, 25, 6250–6255. [Google Scholar] [CrossRef] [PubMed]
- Wang, X.; Liu, Y.; Han, H.; Zhao, Y.; Ma, W.; Sun, H. Polyaniline Coated Fe 3 O 4 Hollow Nanospheres as Anode Materials for Lithium Ion Batteries. Sustain. Energy Fuels 2017, 1, 915–922. [Google Scholar] [CrossRef]
- Zhang, Z.; Bi, X.; Li, X.; Zhao, Q.; Chen, H. Schwertmannite: Occurrence, Properties, Synthesis and Application in Environmental Remediation. Rsc Adv. 2018, 8, 33583–33599. [Google Scholar] [CrossRef] [PubMed]
- Gupta, R.P.; Sen, S.K. Calculation of Multiplet Structure of Core P-Vacancy Levels. II. Phys. Rev. B 1975, 12, 15–19. [Google Scholar] [CrossRef]
- Grosvenor, A.P.; Kobe, B.A.; Biesinger, M.; Mcintyre, N. Investigation of Multiplet Splitting of Fe 2p XPS Spectra and Bonding in Iron Compounds. Surf. Interface Anal. 2004, 36, 1564–1574. [Google Scholar] [CrossRef]
- McIntyre, N.S.; Zetaruk, D.G. X-Ray Photoelectron Spectroscopic Studies of Iron Oxides. Anal. Chem. 1977, 49, 1521–1529. [Google Scholar] [CrossRef]
- Descostes, M.; Mercier, F.; Thromat, N.; Beaucaire, C.; Gautier-Soyer, M. Use of XPS in the Determination of Chemical Environment and Oxidation State of Iron and Sulfur Samples: Constitution of a Data Basis in Binding Energies for Fe and S Reference Compounds and Applications to the Evidence of Surface Species of an Oxidized Py. Appl. Surf. Sci. 2000, 165, 288–302. [Google Scholar] [CrossRef]
- Chemelewski, W.D.; Lee, H.-C.; Lin, J.-F.; Bard, A.J.; Mullins, C.B. Amorphous FeOOH Oxygen Evolution Reaction Catalyst for Photoelectrochemical Water Splitting. J. Am. Chem. Soc. 2014, 136, 2843–2850. [Google Scholar] [CrossRef]
- Welsh, I.D.; Sherwood, P.M.A. Photoemission and Electronic Structure of FeOOH: Distinguishing between Oxide and Oxyhydroxide. Phys. Rev. B 1989, 40, 6386–6392. [Google Scholar] [CrossRef]
- Lindberg, B.J.; Hamrin, K.; Johansson, G.; Gelius, U.; Fahlman, A.; Nordling, C.; Siegbahn, K. Molecular Spectroscopy by Means of ESCA II. Sulfur Compounds. Correlation of Electron Binding Energy with Structure. Phys. Scr. 1970, 1, 286–298. [Google Scholar] [CrossRef]
- Naumkin, A. V.; Kraut-Vass, A.; Gaarenstroom, S.W.; Powell, C.J. NIST X-Ray Photoelectron Spectroscopy Database.
- Waghmode, B.J.; Patil, S.H.; Jahagirdar, M.M.; Patil, V.S.; Waichal, R.P.; Malkhede, D.D.; Sathaye, S.D.; Patil, K.R. Studies on Morphology of Polyaniline Films Formed at Liquid–Liquid and Solid–Liquid Interfaces at 25 and 5 °C, Respectively, and Effect of Doping. Colloid Polym. Sci. 2014, 292, 1079–1089. [Google Scholar] [CrossRef]
- Snauwaert, P.; Lazzaroni, R.; Riga, J.; Verbist, J.J. Electronic Structure of Polyaniline and Substituted Derivatives. Synth. Met. 1987, 18, 335–340. [Google Scholar] [CrossRef]
- Golczak, S.; Kanciurzewska, A.; Fahlman, M.; Langer, K.; Langer, J.J. Comparative XPS Surface Study of Polyaniline Thin Films. Solid State Ionics 2008, 179, 2234–2239. [Google Scholar] [CrossRef]
- Ciriello, R.; Carbone, M.E.; Coviello, D.; Guerrieri, A.; Salvi, A.M. Improved Stability of Thin Insulating Poly(o-Aminophenol) Films in Aqueous Solutions through an Efficient Strategy for Electrosynthesis under Neutral PH Conditions: Electrochemical and XPS Investigation. J. Electroanal. Chem. 2020, 867, 114183. [Google Scholar] [CrossRef]
- Wang, R.; Yoshino, T. Electrical Conductivity of Diaspore, δ-AlOOH and ε-FeOOH. Am. Mineral. J. Earth Planet. Mater. 2021, 106, 774–781. [Google Scholar] [CrossRef]
- Focke, W.W.; Wnek, G.E.; Wei, Y. Influence of Oxidation State, PH, and Counterion on the Conductivity of Polyaniline. J. Phys. Chem. 1987, 91, 5813–5818. [Google Scholar] [CrossRef]
- Chulkin, P.; Łapkowski, M. An Insight into Ionic Conductivity of Polyaniline Thin Films. Materials (Basel). 2020, 13. [Google Scholar] [CrossRef] [PubMed]
- Kaneko, K.; Inouye, K. Electrical Conductivity Changes in α-FeOOH and β-FeOOH upon Surface Dehydration. Bull. Chem. Soc. Jpn. 1976, 49, 3689–3690. [Google Scholar] [CrossRef]
- Bhadra, J.; Al-Thani, N.J.; Madi, N.K.; Al-Maadeed, M.A. Effects of Aniline Concentrations on the Electrical and Mechanical Properties of Polyaniline Polyvinyl Alcohol Blends. Arab. J. Chem. 2017, 10, 664–672. [Google Scholar] [CrossRef]
- Bednarczyk, K.; Matysiak, W.; Tański, T.; Janeczek, H.; Schab-Balcerzak, E.; Libera, M. Effect of Polyaniline Content and Protonating Dopants on Electroconductive Composites. Sci. Rep. 2021, 11, 7487. [Google Scholar] [CrossRef] [PubMed]
- Yuqin, C.; Hong, L.; Lie, W.; Tianhong, L. Irreversible Capacity Loss of Graphite Electrode in Lithium-Ion Batteries. J. Power Sources 1997, 68, 187–190. [Google Scholar] [CrossRef]
- Shim, J.; Striebel, K.A. Effect of Electrode Density on Cycle Performance and Irreversible Capacity Loss for Natural Graphite Anode in Lithium-Ion Batteries. J. Power Sources 2003, 119–121, 934–937. [Google Scholar] [CrossRef]
- Hassan, M.F.; Guo, Z.; Chen, Z.; Liu, H. α-Fe2O3 as an Anode Material with Capacity Rise and High Rate Capability for Lithium-Ion Batteries. Mater. Res. Bull. 2011, 46, 858–864. [Google Scholar] [CrossRef]
- Kim, H.; Choi, W.; Yoon, J.; Um, J.H.; Lee, W.; Kim, J.; Cabana, J.; Yoon, W.S. Exploring Anomalous Charge Storage in Anode Materials for Next-Generation Li Rechargeable Batteries. Chem. Rev. 2020, 120, 6934–6976. [Google Scholar] [CrossRef] [PubMed]
- Chen, C.; Ding, N.; Wang, L.; Yu, Y.; Lieberwirth, I. Some New Facts on Electrochemical Reaction Mechanism for Transition Metal Oxide Electrodes. J. Power Sources 2009, 189, 552–556. [Google Scholar] [CrossRef]
- Zou, M.; Wen, W.; Li, J.; Lin, Y.; Lai, H.; Huang, Z. Nano-Crystalline FeOOH Mixed with SWNT Matrix as a Superior Anode Material for Lithium Batteries. J. Energy Chem. 2014, 23, 513–518. [Google Scholar] [CrossRef]
- Zhai, Y.; Ma, X.; Mao, H.; Shao, W.; Xu, L.; He, Y.; Qian, Y. Mn-Doped α-FeOOH Nanorods and α-Fe 2 O 3 Mesoporous Nanorods: Facile Synthesis and Applications as High Performance Anodes for LIBs. Adv. Electron. Mater. 2015, 1, 1400057. [Google Scholar] [CrossRef]
- Luo, L.; Wu, J.; Xu, J.; Dravid, V.P. Atomic Resolution Study of Reversible Conversion Reaction in Metal Oxide Electrodes for Lithium-Ion Battery. ACS Nano 2014, 8, 11560–11566. [Google Scholar] [CrossRef]
- Brezesinski, T.; Wang, J.; Tolbert, S.H.; Dunn, B. Ordered Mesoporous α-MoO3 with Iso-Oriented Nanocrystalline Walls for Thin-Film Pseudocapacitors. Nat. Mater. 2010, 9, 146–151. [Google Scholar] [CrossRef]
- Chao, D.; Zhu, C.; Yang, P.; Xia, X.; Liu, J.; Wang, J.; Fan, X.; Savilov, S. V.; Lin, J.; Fan, H.J.; et al. Array of Nanosheets Render Ultrafast and High-Capacity Na-Ion Storage by Tunable Pseudocapacitance. Nat. Commun. 2016, 7, 1–8. [Google Scholar] [CrossRef] [PubMed]
- Forghani, M.; Donne, S.W. Method Comparison for Deconvoluting Capacitive and Pseudo-Capacitive Contributions to Electrochemical Capacitor Electrode Behavior. J. Electrochem. Soc. 2018, 165, A664–A673. [Google Scholar] [CrossRef]
- Kang, N.; Park, J.H.; Choi, J.; Jin, J.; Chun, J.; Jung, I.G.; Jeong, J.; Park, J.-G.; Lee, S.M.; Kim, H.J.; et al. Nanoparticulate Iron Oxide Tubes from Microporous Organic Nanotubes as Stable Anode Materials for Lithium Ion Batteries. Angew. Chemie 2012, 124, 6730–6734. [Google Scholar] [CrossRef]
- Zhang, X.; Du, Y. Gelatin Assisted Wet Chemistry Synthesis of High Quality β-FeOOH Nanorods Anchored on Graphene Nanosheets with Superior Lithium-Ion Battery Application. RSC Adv. 2016, 6, 17504–17509. [Google Scholar] [CrossRef]
- Chen, X.; Zeng, Y.; Chen, Z.; Wang, S.; Xin, C.; Wang, L.; Shi, C.; Lu, L.; Zhang, C. Synthesis and Electrochemical Property of FeOOH/Graphene Oxide Composites. Front. Chem. 2020, 8, 1–8. [Google Scholar] [CrossRef] [PubMed]
- Wei, S.; Di Lecce, D.; Hassoun, J. A High-Voltage, Multi-Metal LiNi0. 35Cu0. 1Mn1. 45Fe0. 1O4 Spinel Cathode for Lithium Batteries. J. Electrochem. Soc. 2021, 168, 30537. [Google Scholar] [CrossRef]
- Pan, T.; Alvarado, J.; Zhu, J.; Yue, Y.; Xin, H.L.; Nordlund, D.; Lin, F.; Doeff, M.M. Structural Degradation of Layered Cathode Materials in Lithium-Ion Batteries Induced by Ball Milling. J. Electrochem. Soc. 2019, 166, A1964. [Google Scholar] [CrossRef]
- Wang, Q.; Sarkar, A.; Li, Z.; Lu, Y.; Velasco, L.; Bhattacharya, S.S.; Brezesinski, T.; Hahn, H.; Breitung, B. High Entropy Oxides as Anode Material for Li-Ion Battery Applications: A Practical Approach. Electrochem. commun. 2019, 100, 121–125. [Google Scholar] [CrossRef]
- He, Y.; Xu, G.; Wang, C.; Xu, L.; Zhang, K. Horsetail-Derived Si@N-Doped Carbon as Low-Cost and Long Cycle Life Anode for Li-Ion Half/Full Cells. Electrochim. Acta 2018, 264, 173–182. [Google Scholar] [CrossRef]
- Yao, Z.; Xia, X.; Zhang, Y.; Xie, D.; Ai, C.; Lin, S.; Wang, Y.; Deng, S.; Shen, S.; Wang, X.; et al. Superior High-Rate Lithium-Ion Storage on Ti2Nb10O29 Arrays via Synergistic TiC/C Skeleton and N-Doped Carbon Shell. Nano Energy 2018, 54, 304–312. [Google Scholar] [CrossRef]
- Xu, T.; Wang, Q.; Zhang, J.; Xie, X.; Xia, B. Green Synthesis of Dual Carbon Conductive Network-Encapsulated Hollow SiOx Spheres for Superior Lithium-Ion Batteries. ACS Appl. Mater. Interfaces 2019, 11, 19959–19967. [Google Scholar] [CrossRef] [PubMed]
- Deng, T.; Fan, X.; Cao, L.; Chen, J.; Hou, S.; Ji, X.; Chen, L.; Li, S.; Zhou, X.; Hu, E.; et al. Designing In-Situ-Formed Interphases Enables Highly Reversible Cobalt-Free LiNiO2 Cathode for Li-Ion and Li-Metal Batteries. Joule 2019, 3, 2550–2564. [Google Scholar] [CrossRef]
- Zhu, Z.; Wang, H.; Li, Y.; Gao, R.; Xiao, X.; Yu, Q.; Wang, C.; Waluyo, I.; Ding, J.; Hunt, A.; et al. A Surface Se-Substituted LiCo[O2−δSeδ] Cathode with Ultrastable High-Voltage Cycling in Pouch Full-Cells. Adv. Mater. 2020, 32, 2005182. [Google Scholar] [CrossRef] [PubMed]
- Shen, Y.; Qian, J.; Yang, H.; Zhong, F.; Ai, X. Chemically Prelithiated Hard-Carbon Anode for High Power and High Capacity Li-Ion Batteries. Small 2020, 16, 1907602. [Google Scholar] [CrossRef] [PubMed]
- Yan, M.-Y.; Li, G.; Zhang, J.; Tian, Y.-F.; Yin, Y.-X.; Zhang, C.-J.; Jiang, K.-C.; Xu, Q.; Li, H.-L.; Guo, Y.-G. Enabling SiOx/C Anode with High Initial Coulombic Efficiency through a Chemical Pre-Lithiation Strategy for High-Energy-Density Lithium-Ion Batteries. ACS Appl. Mater. Interfaces 2020, 12, 27202–27209. [Google Scholar] [CrossRef] [PubMed]
- Meng, T.; Li, B.; Wang, Q.; Hao, J.; Huang, B.; Gu, F.L.; Xu, H.; Liu, P.; Tong, Y. Large-Scale Electric-Field Confined Silicon with Optimized Charge-Transfer Kinetics and Structural Stability for High-Rate Lithium-Ion Batteries. ACS Nano 2020, 14, 7066–7076. [Google Scholar] [CrossRef] [PubMed]
- Montella, C. Discussion of the Potential Step Method for the Determination of the Diffusion Coefficients of Guest Species in Host Materials: Part I. Influence of Charge Transfer Kinetics and Ohmic Potential Drop. J. Electroanal. Chem. 2002, 518, 61–83. [Google Scholar] [CrossRef]
- Jiang, Y.; Jiang, Z.-J.; Yang, L.; Cheng, S.; Liu, M. A High-Performance Anode for Lithium Ion Batteries: Fe3O4 Microspheres Encapsulated in Hollow Graphene Shells. J. Mater. Chem. A 2015, 3, 11847–11856. [Google Scholar] [CrossRef]
- Kang, Y.-M.; Song, M.-S.; Kim, J.-H.; Kim, H.-S.; Park, M.-S.; Lee, J.-Y.; Liu, H.K.; Dou, S.X. A Study on the Charge–Discharge Mechanism of Co3O4 as an Anode for the Li Ion Secondary Battery. Electrochim. Acta 2005, 50, 3667–3673. [Google Scholar] [CrossRef]
- Pyun, S.-I.; Bae, J.-S. The Ac Impedance Study of Electrochemical Lithium Intercalation into Porous Vanadium Oxide Electrode. Electrochim. Acta 1996, 41, 919–925. [Google Scholar] [CrossRef]
- Ghasemi, Y.; Emborg, M.; Cwirzen, A. Estimation of Specific Surface Area of Particles Based on Size Distribution Curve. Mag. Concr. Res. 2018, 70, 533–540. [Google Scholar] [CrossRef]
- Mirabella, F.M. Internal Reflection Spectroscopy: Theory and Applications; CRC Press, 1992; Vol. 15, ISBN 0824787307. [Google Scholar]
- Feng, M.; Tian, J.; Xie, H.; Kang, Y.; Shan, Z. Nano-Silicon/Polyaniline Composites with an Enhanced Reversible Capacity as Anode Materials for Lithium Ion Batteries. J. Solid State Electrochem. 2015, 19, 1773–1782. [Google Scholar] [CrossRef]
- Zhuang, G.; Chen, Y.; Ross, P.N. The Reaction of Lithium with Dimethyl Carbonate and Diethyl Carbonate in Ultrahigh Vacuum Studied by X-Ray Photoemission Spectroscopy. Langmuir 1999, 15, 1470–1479. [Google Scholar] [CrossRef]
- Wang, A.; Kadam, S.; Li, H.; Shi, S.; Qi, Y. Review on Modeling of the Anode Solid Electrolyte Interphase (SEI) for Lithium-Ion Batteries. npj Comput. Mater. 2018, 4, 15. [Google Scholar] [CrossRef]
- Markevich, E.; Salitra, G.; Hartmann, P.; Kulisch, J.; Aurbach, D.; Park, K.-J.; Yoon, C.; Sun, Y.-K. New Insights Related to Rechargeable Lithium Batteries: Li Metal Anodes, Ni Rich LiNi x Co y Mn z O 2 Cathodes and Beyond Them. J. Electrochem. Soc. 2019, 166, A5265–A5274. [Google Scholar] [CrossRef]
- Rajeev, K.K.; Kim, E.; Nam, J.; Lee, S.; Mun, J.; Kim, T.-H. Chitosan-Grafted-Polyaniline Copolymer as an Electrically Conductive and Mechanically Stable Binder for High-Performance Si Anodes in Li-Ion Batteries. Electrochim. Acta 2020, 333, 135532. [Google Scholar] [CrossRef]
- Lee, K.; Lim, S.; Tron, A.; Mun, J.; Kim, Y.-J.; Yim, T.; Kim, T.-H. Polymeric Binder Based on PAA and Conductive PANI for High Performance Silicon-Based Anodes. RSC Adv. 2016, 6, 101622–101625. [Google Scholar] [CrossRef]
- Wang, X.; Zhang, Y.; Shi, Y.; Zeng, X.; Tang, R.; Wei, L. Conducting Polyaniline/Poly (Acrylic Acid)/Phytic Acid Multifunctional Binders for Si Anodes in Lithium Ion Batteries. Ionics (Kiel). 2019, 25, 5323–5331. [Google Scholar] [CrossRef]
- Lin, H.-Y.; Li, C.-H.; Wang, D.-Y.; Chen, C.-C. Chemical Doping of a Core–Shell Silicon Nanoparticles@polyaniline Nanocomposite for the Performance Enhancement of a Lithium Ion Battery Anode. Nanoscale 2016, 8, 1280–1287. [Google Scholar] [CrossRef]
- Yamashita, T.; Hayes, P. Analysis of XPS Spectra of Fe2+ and Fe3+ Ions in Oxide Materials. Appl. Surf. Sci. 2008, 254, 2441–2449. [Google Scholar] [CrossRef]
- Barron, P.M.V.R.A.R. Physical Methods in Chemistry and Nano Science; Rice University, 2015.
- Morgan, D.J. Comments on the XPS Analysis of Carbon Materials. C 2021, 7. [Google Scholar] [CrossRef]
- Sun, W.; Wang, L.; Yang, Z.; Zhu, T.; Wu, T.; Dong, C.; Liu, G. Tuning the Oxidation Degree of Graphite toward Highly Thermally Conductive Graphite/Epoxy Composites. Chem. Mater. 2018, 30, 7473–7483. [Google Scholar] [CrossRef]
- Lee, J.; Choi, W. Surface Modification of Over-Lithiated Layered Oxides with PEDOT:PSS Conducting Polymer in Lithium-Ion Batteries. J. Electrochem. Soc. 2015, 162, A743–A748. [Google Scholar] [CrossRef]
- Maximov, M.; Nazarov, D.; Rumyantsev, A.; Koshtyal, Y.; Ezhov, I.; Mitrofanov, I.; Kim, A.; Medvedev, O.; Popovich, A. Atomic Layer Deposition of Lithium–Nickel–Silicon Oxide Cathode Material for Thin-Film Lithium-Ion Batteries. Energies 2020, 13. [Google Scholar] [CrossRef]
- Dedryvère, R.; Maccario, M.; Croguennec, L.; Le Cras, F.; Delmas, C.; Gonbeau, D. X-Ray Photoelectron Spectroscopy Investigations of Carbon-Coated LixFePO4 Materials. Chem. Mater. 2008, 20, 7164–7170. [Google Scholar] [CrossRef]
- Beletskii, E. V.; Fedorova, A.A.; Lukyanov, D.A.; Kalnin, A.Y.; Ershov, V.A.; Danilov, S.E.; Spiridonova, D. V.; Alekseeva, E. V.; Levin, O. V. Switchable Resistance Conducting-Polymer Layer for Li-Ion Battery Overcharge Protection. J. Power Sources 2021, 490, 229548. [Google Scholar] [CrossRef]
- Hernández, M.P.; Navarro-Marín, G.; Estévez-Hernández, O.; Farías-Sánchez, M.H. Angle-Resolved X-Ray Photoelectron Spectroscopy Study of the Thiourea Derivative Adsorption on Au (111) from Ethanolic Solution. Rev. Cuba. Fis. 2017, 34, 108–111. [Google Scholar]
- Kassis, C.M.; Steehler, J.K.; Linton, R.W. Characterization of 1,1-Dihydroperfluorooctyl Acrylate (PFOA) by XPS. Surf. Sci. Spectra 1994, 3, 299–306. [Google Scholar] [CrossRef]
- High Resolution XPS of Organic Polymers: The Scienta ESCA300 Database (Beamson, G.; Briggs, D.). J. Chem. Educ. 1993, 70. [CrossRef]
- Huang, T.; Zheng, X.; Fang, G.; Pan, Y.; Wang, W.; Wu, M. A Novel Electrolyte Additive for Improving the Interfacial Stability of LiMn(2)O(4) Cathode Lithium-Ion Batteries at Elevated Temperature. RSC Adv. 2018, 8, 38831–38835. [Google Scholar] [CrossRef]
- Moretti, A.; Carvalho, D.; Ehteshami-Flammer, N.; Paillard, E.; Porcher, W.; Brun-Buisson, D.; Ducros, J.-B.; Meatza, I.; Eguía-Barrio, A.; Trad, K.; et al. A Post-Mortem Study of Stacked 16 Ah Graphite//LiFePO4 Pouch Cells Cycled at 5 °C. Batteries 2019, 5, 45. [Google Scholar] [CrossRef]
- Kang, E.T.; Neoh, K.G.; Khor, S.H.; Tan, K.L.; Tan, B.T.G. X.p.s. Studies of Charge Transfer Interactions in Some Polyaniline Complexes. Polymer (Guildf). 1990, 31, 202–207. [Google Scholar] [CrossRef]
- Quílez-Bermejo, J.; Morallón, E.; Cazorla-Amorós, D. Polyaniline-Derived N-Doped Ordered Mesoporous Carbon Thin Films: Efficient Catalysts towards Oxygen Reduction Reaction. Polymers (Basel). 2020, 12. [Google Scholar] [CrossRef] [PubMed]
- Kumar, S.N.; Gaillard, F.; Bouyssoux, G.; Sartre, A. High-Resolution XPS Studies of Electrochemically Synthesized Conducting Polyaniline Films. Synth. Met. 1990, 36, 111–127. [Google Scholar] [CrossRef]
- Wijaya, O.; Hartmann, P.; Younesi, R.; Markovits, I.I.E.; Rinaldi, A.; Janek, J.; Yazami, R. A Gamma Fluorinated Ether as an Additive for Enhanced Oxygen Activity in Li–O 2 Batteries. J. Mater. Chem. A 2015, 3, 19061–19067. [Google Scholar] [CrossRef]
- Bagus, P.S.; Ilton, E.S.; Nelin, C.J. The Interpretation of XPS Spectra: Insights into Materials Properties. Surf. Sci. Rep. 2013, 68, 273–304. [Google Scholar] [CrossRef]
- Gibson, L.T. ARCHAEOMETRY AND ANTIQUE ANALYSIS | Metallic and Ceramic Objects. In Worsfold, P., Townshend, A., Poole, C.B.T.-E. of A.S. (Second E., Eds.; Elsevier: Oxford, 2005; pp. 117–123. ISBN 978-0-12-369397-6. [Google Scholar]
- Tomar, B.S.; Shahin, A.; Tirumkudulu, M.S. Cracking in Drying Films of Polymer Solutions. Soft Matter 2020, 16, 3476–3484. [Google Scholar] [CrossRef]
- Zeng, Z.; Zhao, H.; Lv, P.; Zhang, Z.; Wang, J.; Xia, Q. Electrochemical Properties of Iron Oxides/Carbon Nanotubes as Anode Material for Lithium Ion Batteries. J. Power Sources 2015, 274, 1091–1099. [Google Scholar] [CrossRef]
- Wen, J.-W.; Zhang, D.-W.; Zang, Y.; Sun, X.; Cheng, B.; Ding, C.-X.; Yu, Y.; Chen, C.-H. Li and Na Storage Behavior of Bowl-like Hollow Co3O4 Microspheres as an Anode Material for Lithium-Ion and Sodium-Ion Batteries. Electrochim. Acta 2014, 132, 193–199. [Google Scholar] [CrossRef]
Figure 1.
(a,b) FeOOH/PANI SEM images at different magnification.
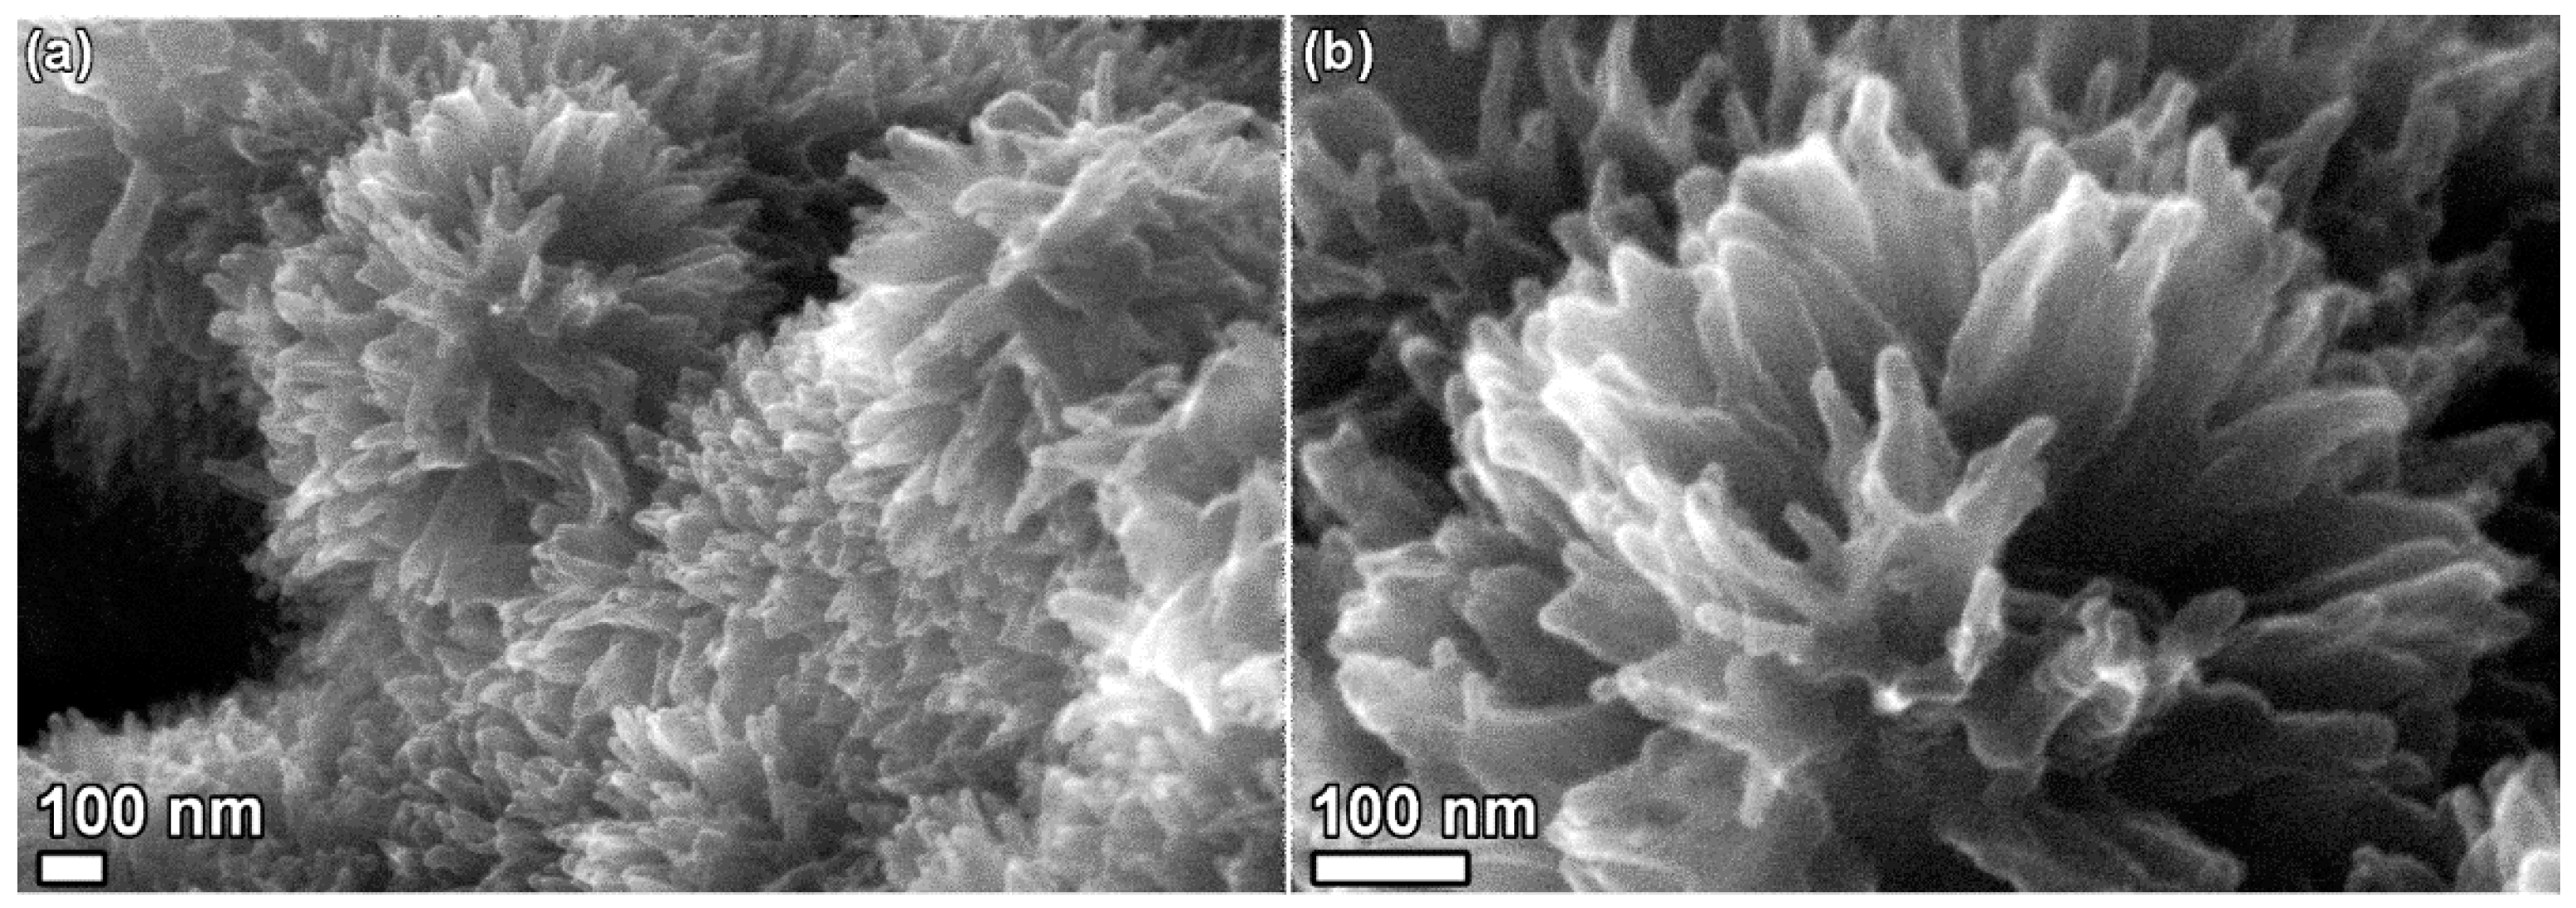
Figure 2.
XPS spectra of FeOOH/PANI: (a) Fe 2p; (b) O 1s; (c) S 2p; (d) N 1s.
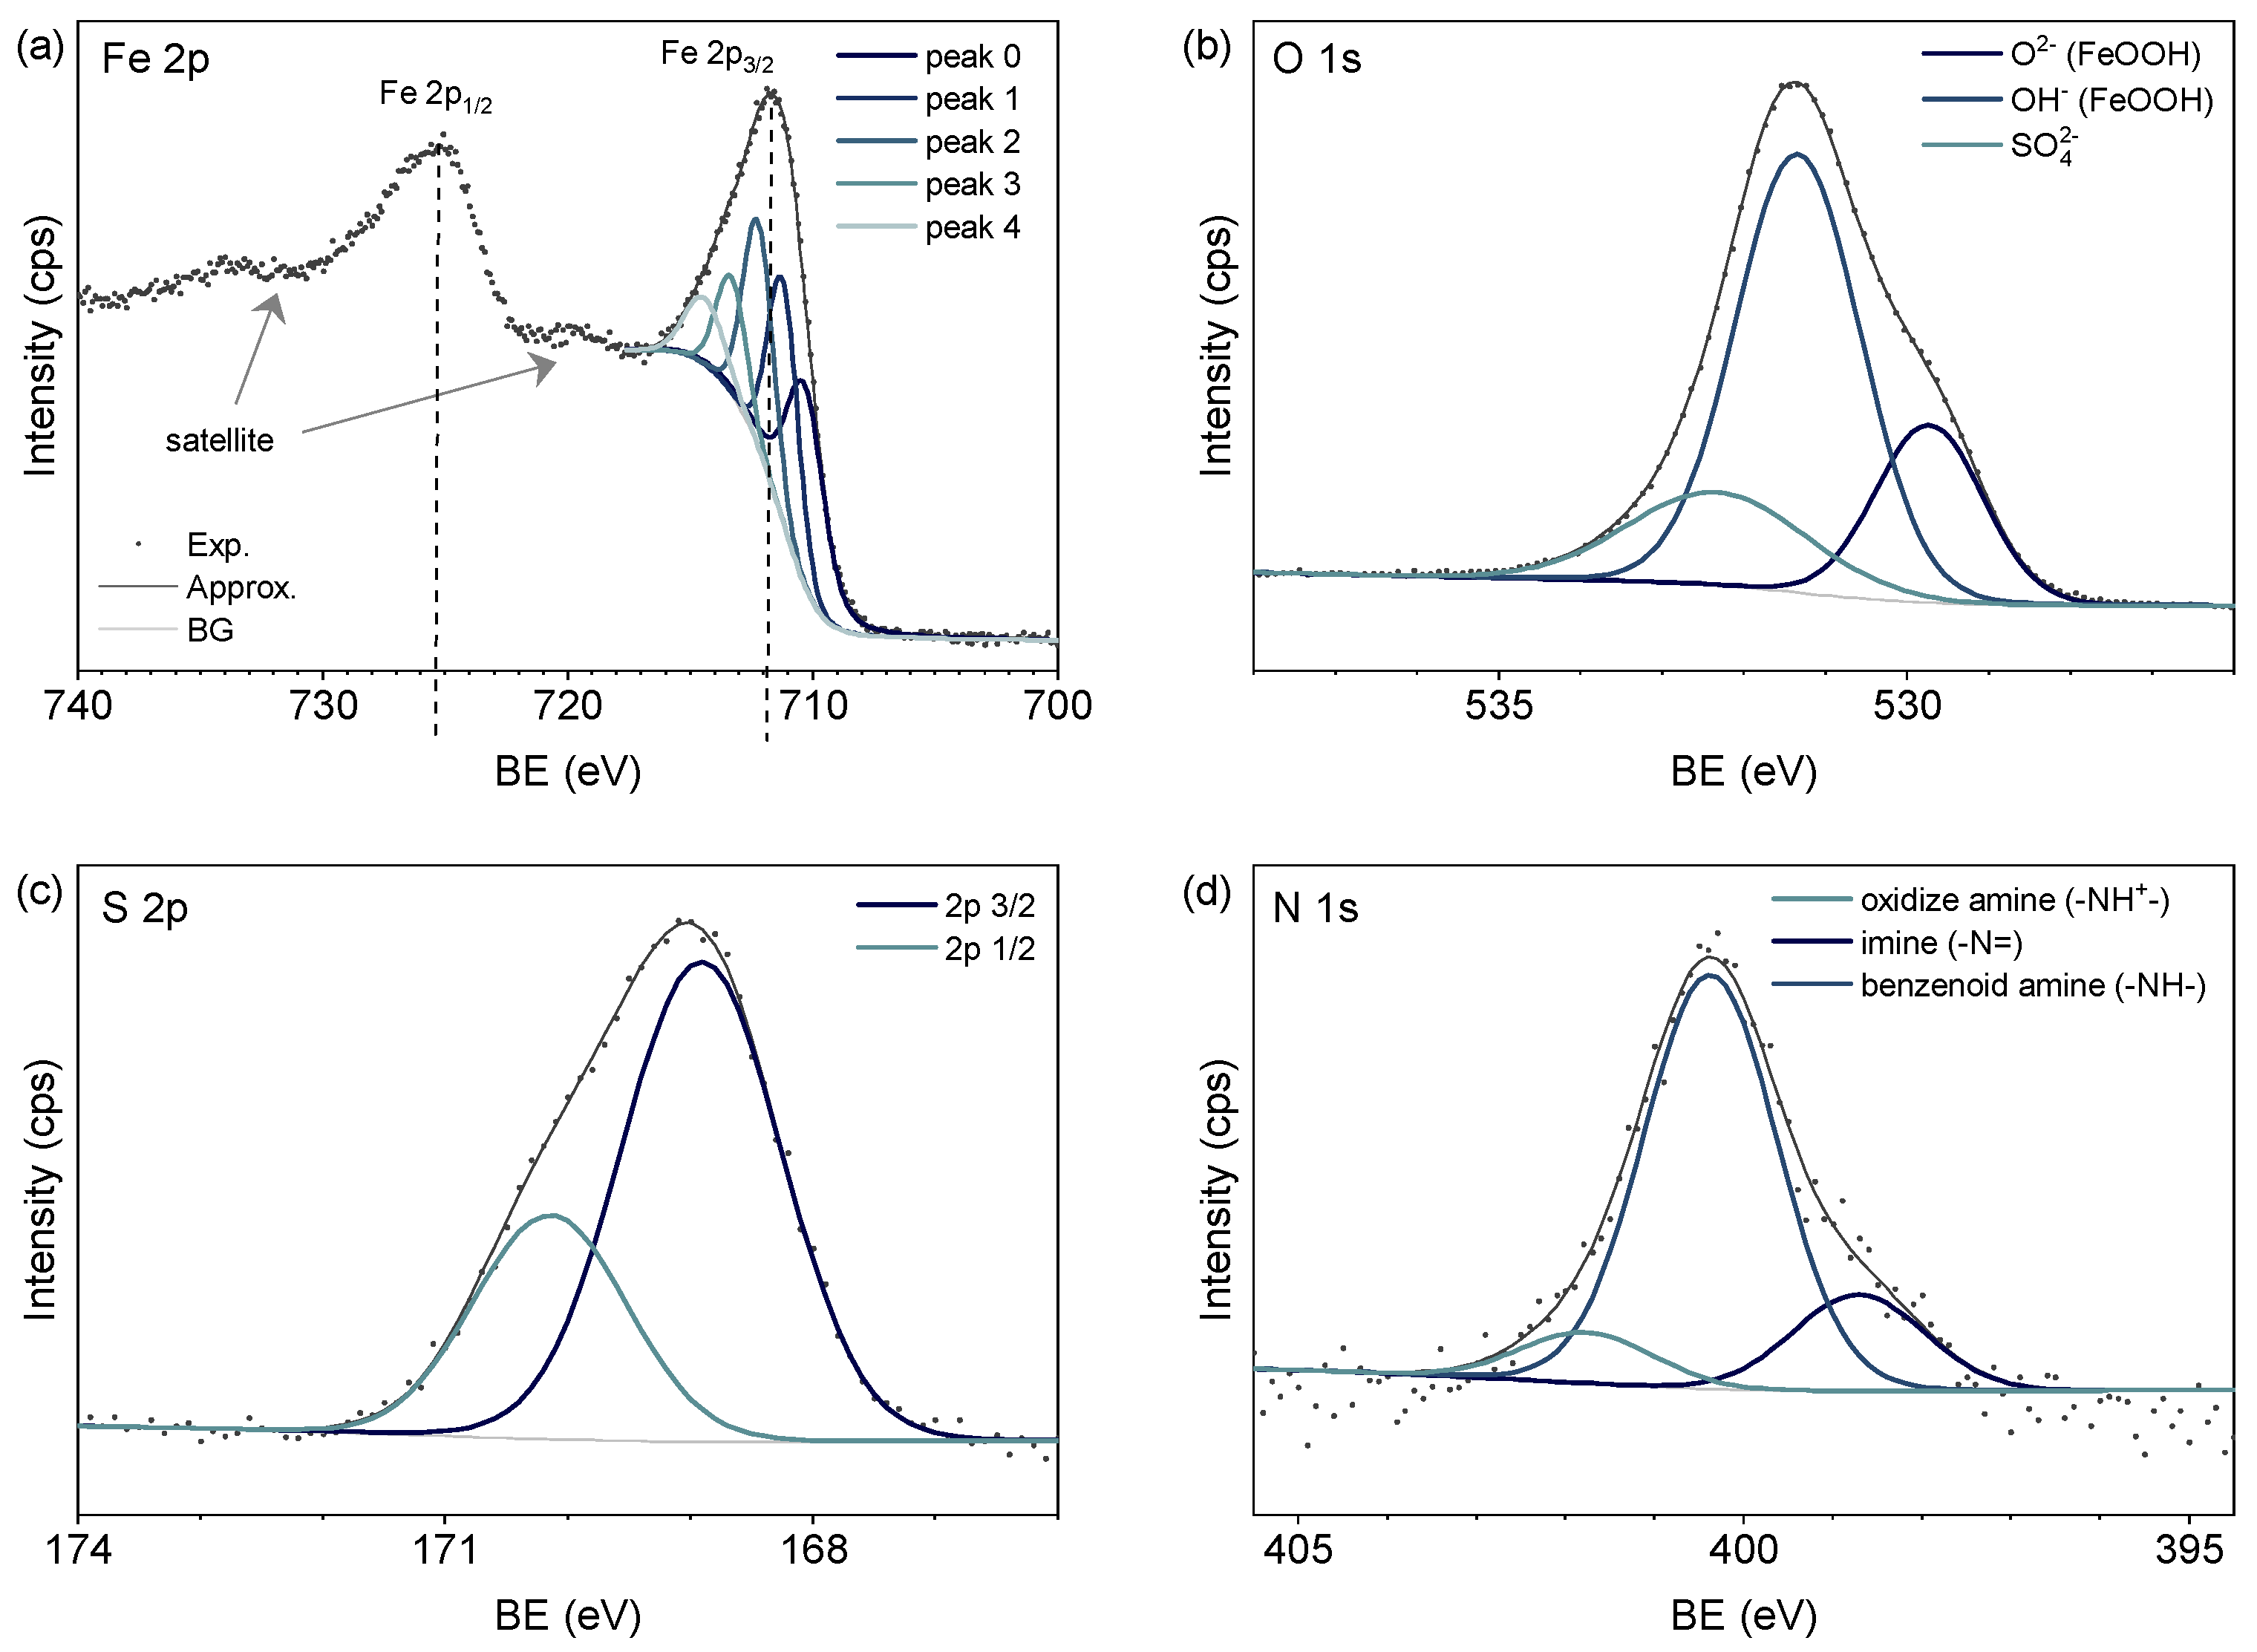
Figure 3.
Electrochemical performance of FeOOH/PANI electrode: (a) C-rate capability; (b) cycling stability at I = 1.2 A∙g−1; (c) charge/discharge curves during C-rate capability; (d) cyclic voltammograms at 0.1 mV∙s−1.
Figure 3.
Electrochemical performance of FeOOH/PANI electrode: (a) C-rate capability; (b) cycling stability at I = 1.2 A∙g−1; (c) charge/discharge curves during C-rate capability; (d) cyclic voltammograms at 0.1 mV∙s−1.
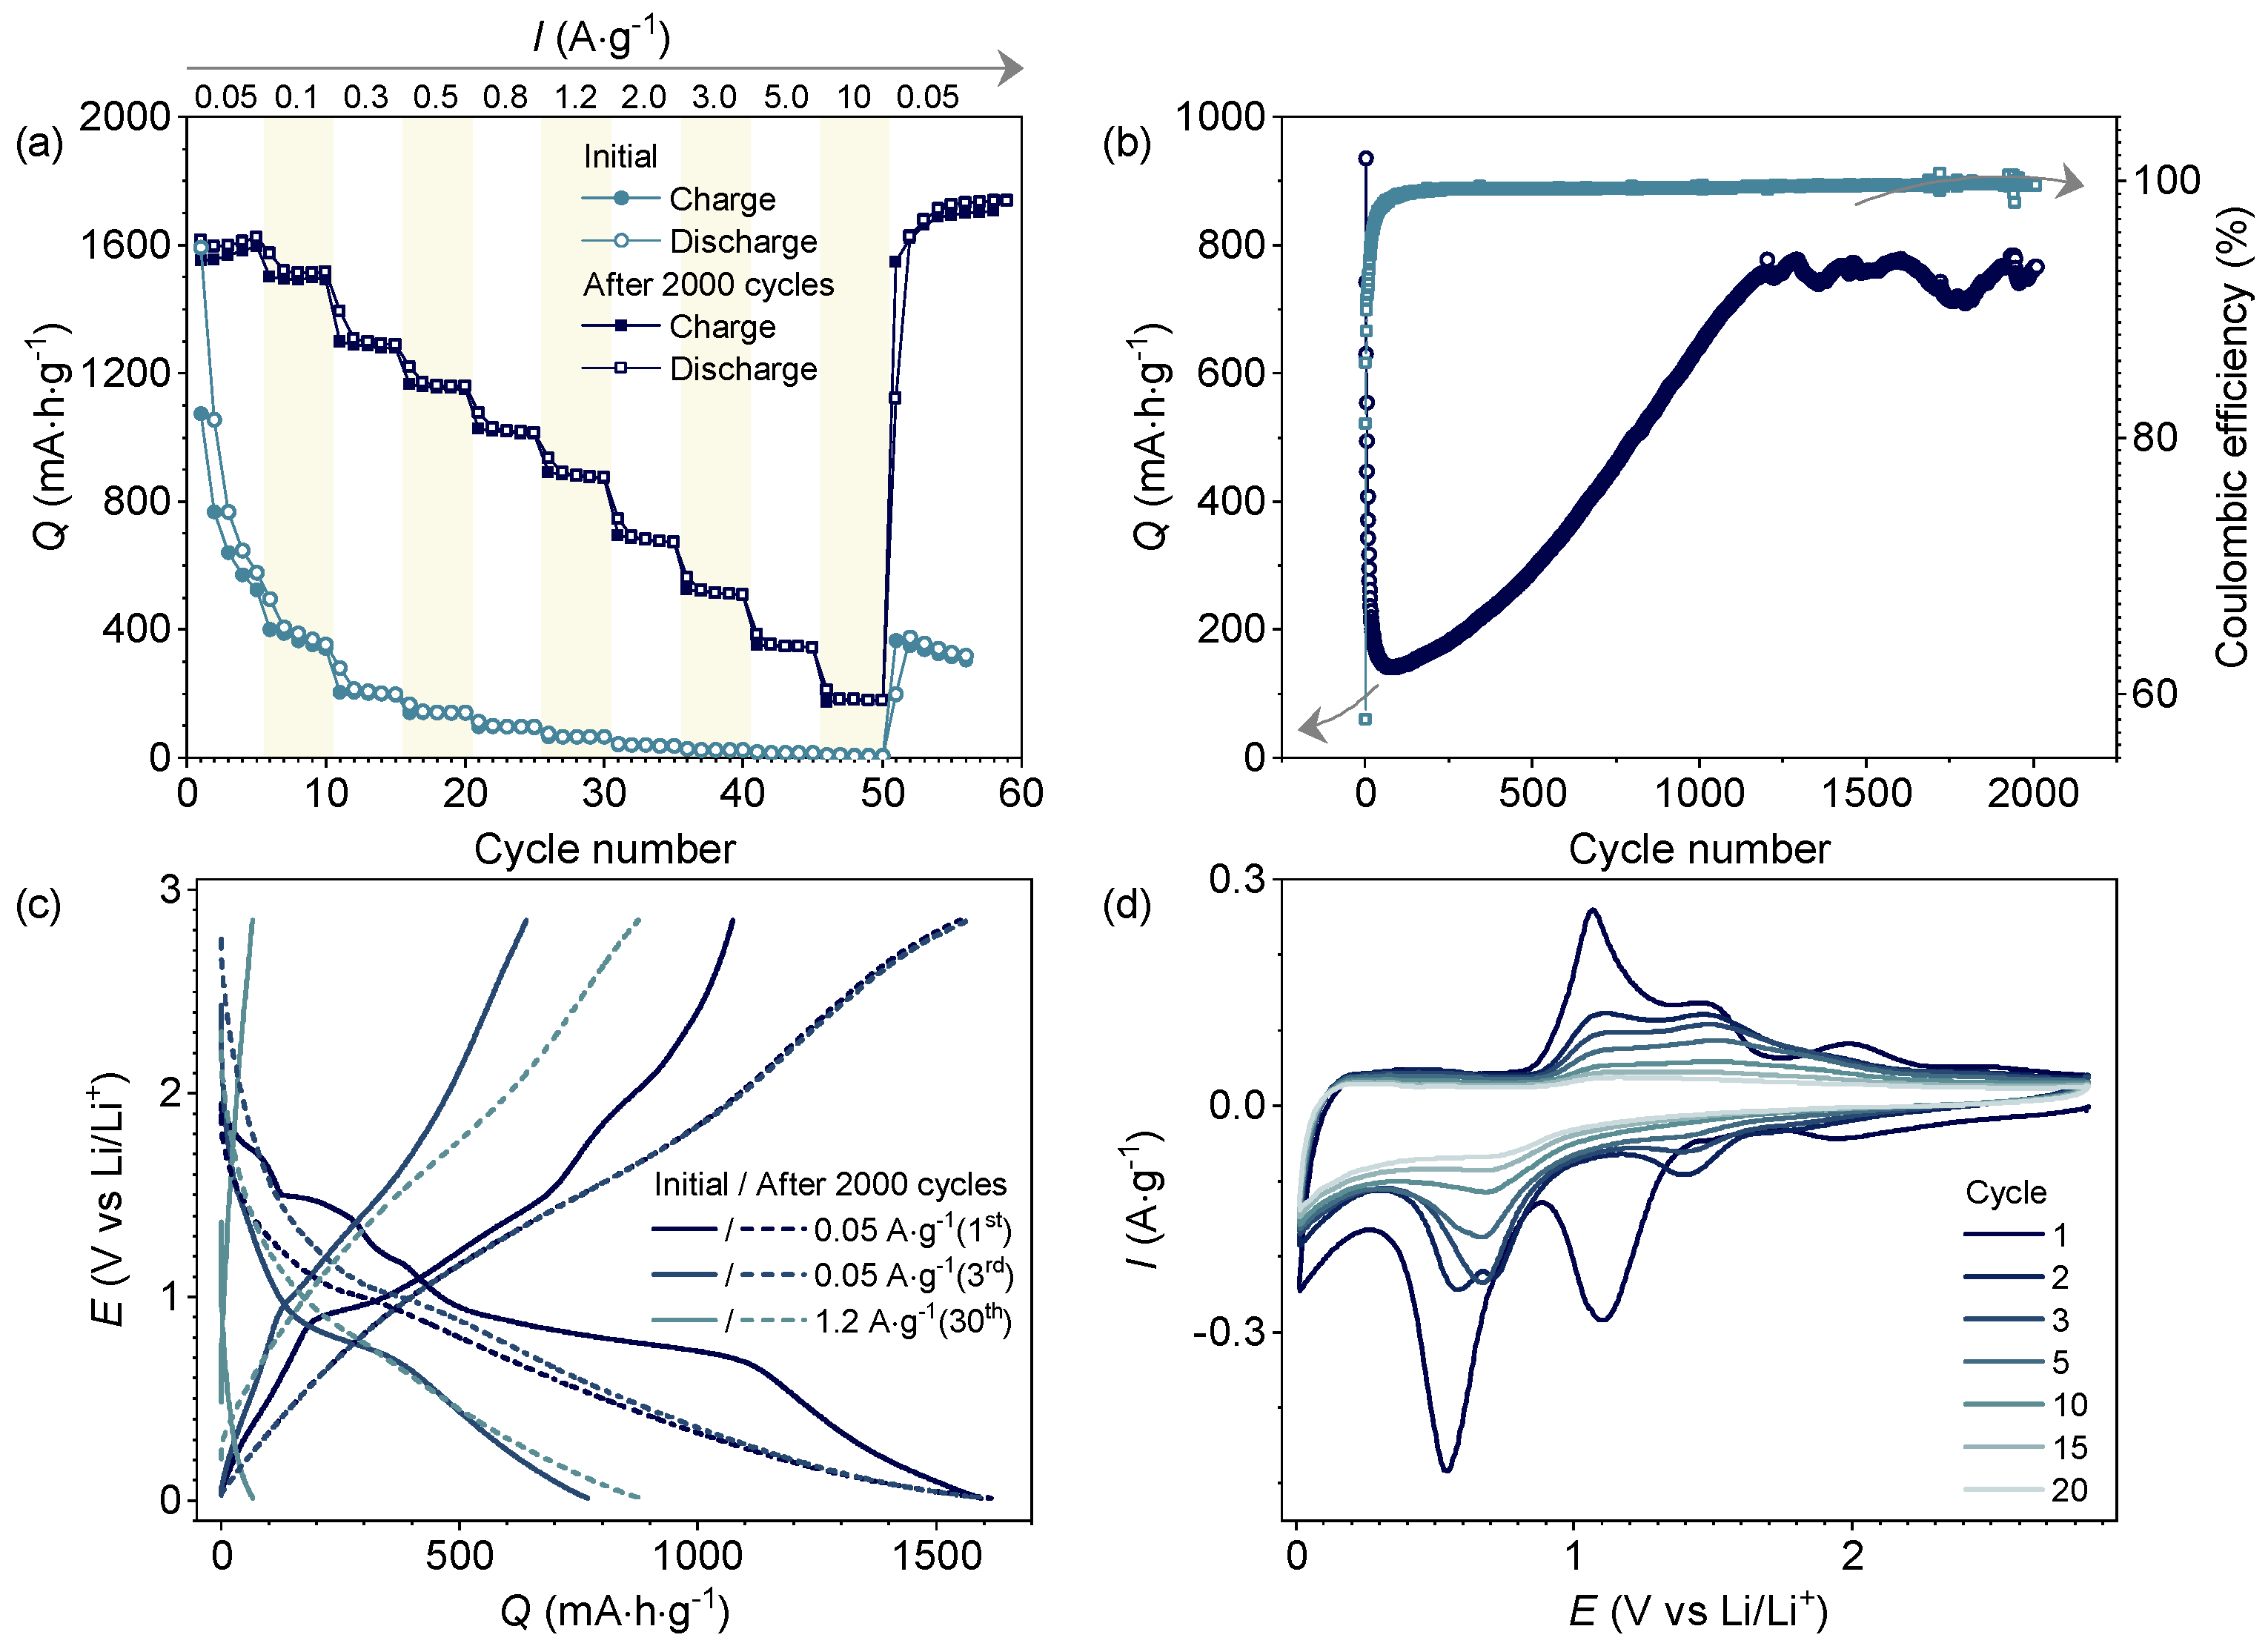
Figure 4.
FeOOH/PANI after 20 cycles: (a) CVs at various scan rates, inset shows ln(Ipeak) vs ln(v) plot, (c) pseudocapacitance contribution to total capacity at 1 mV∙s−1, inset shows contribution ratios of capacitive and diffusion-controlled currents at various scan rates. FeOOH/PANI after 2000 cycles: (b) CVs at various scan rates, inset shows ln(Ipeak) vs ln(v) plot, (d) pseudocapacitance contribution to total capacity at 1 mV∙s−1, inset shows contribution ratios of capacitive and diffusion-controlled currents at various scan rates.
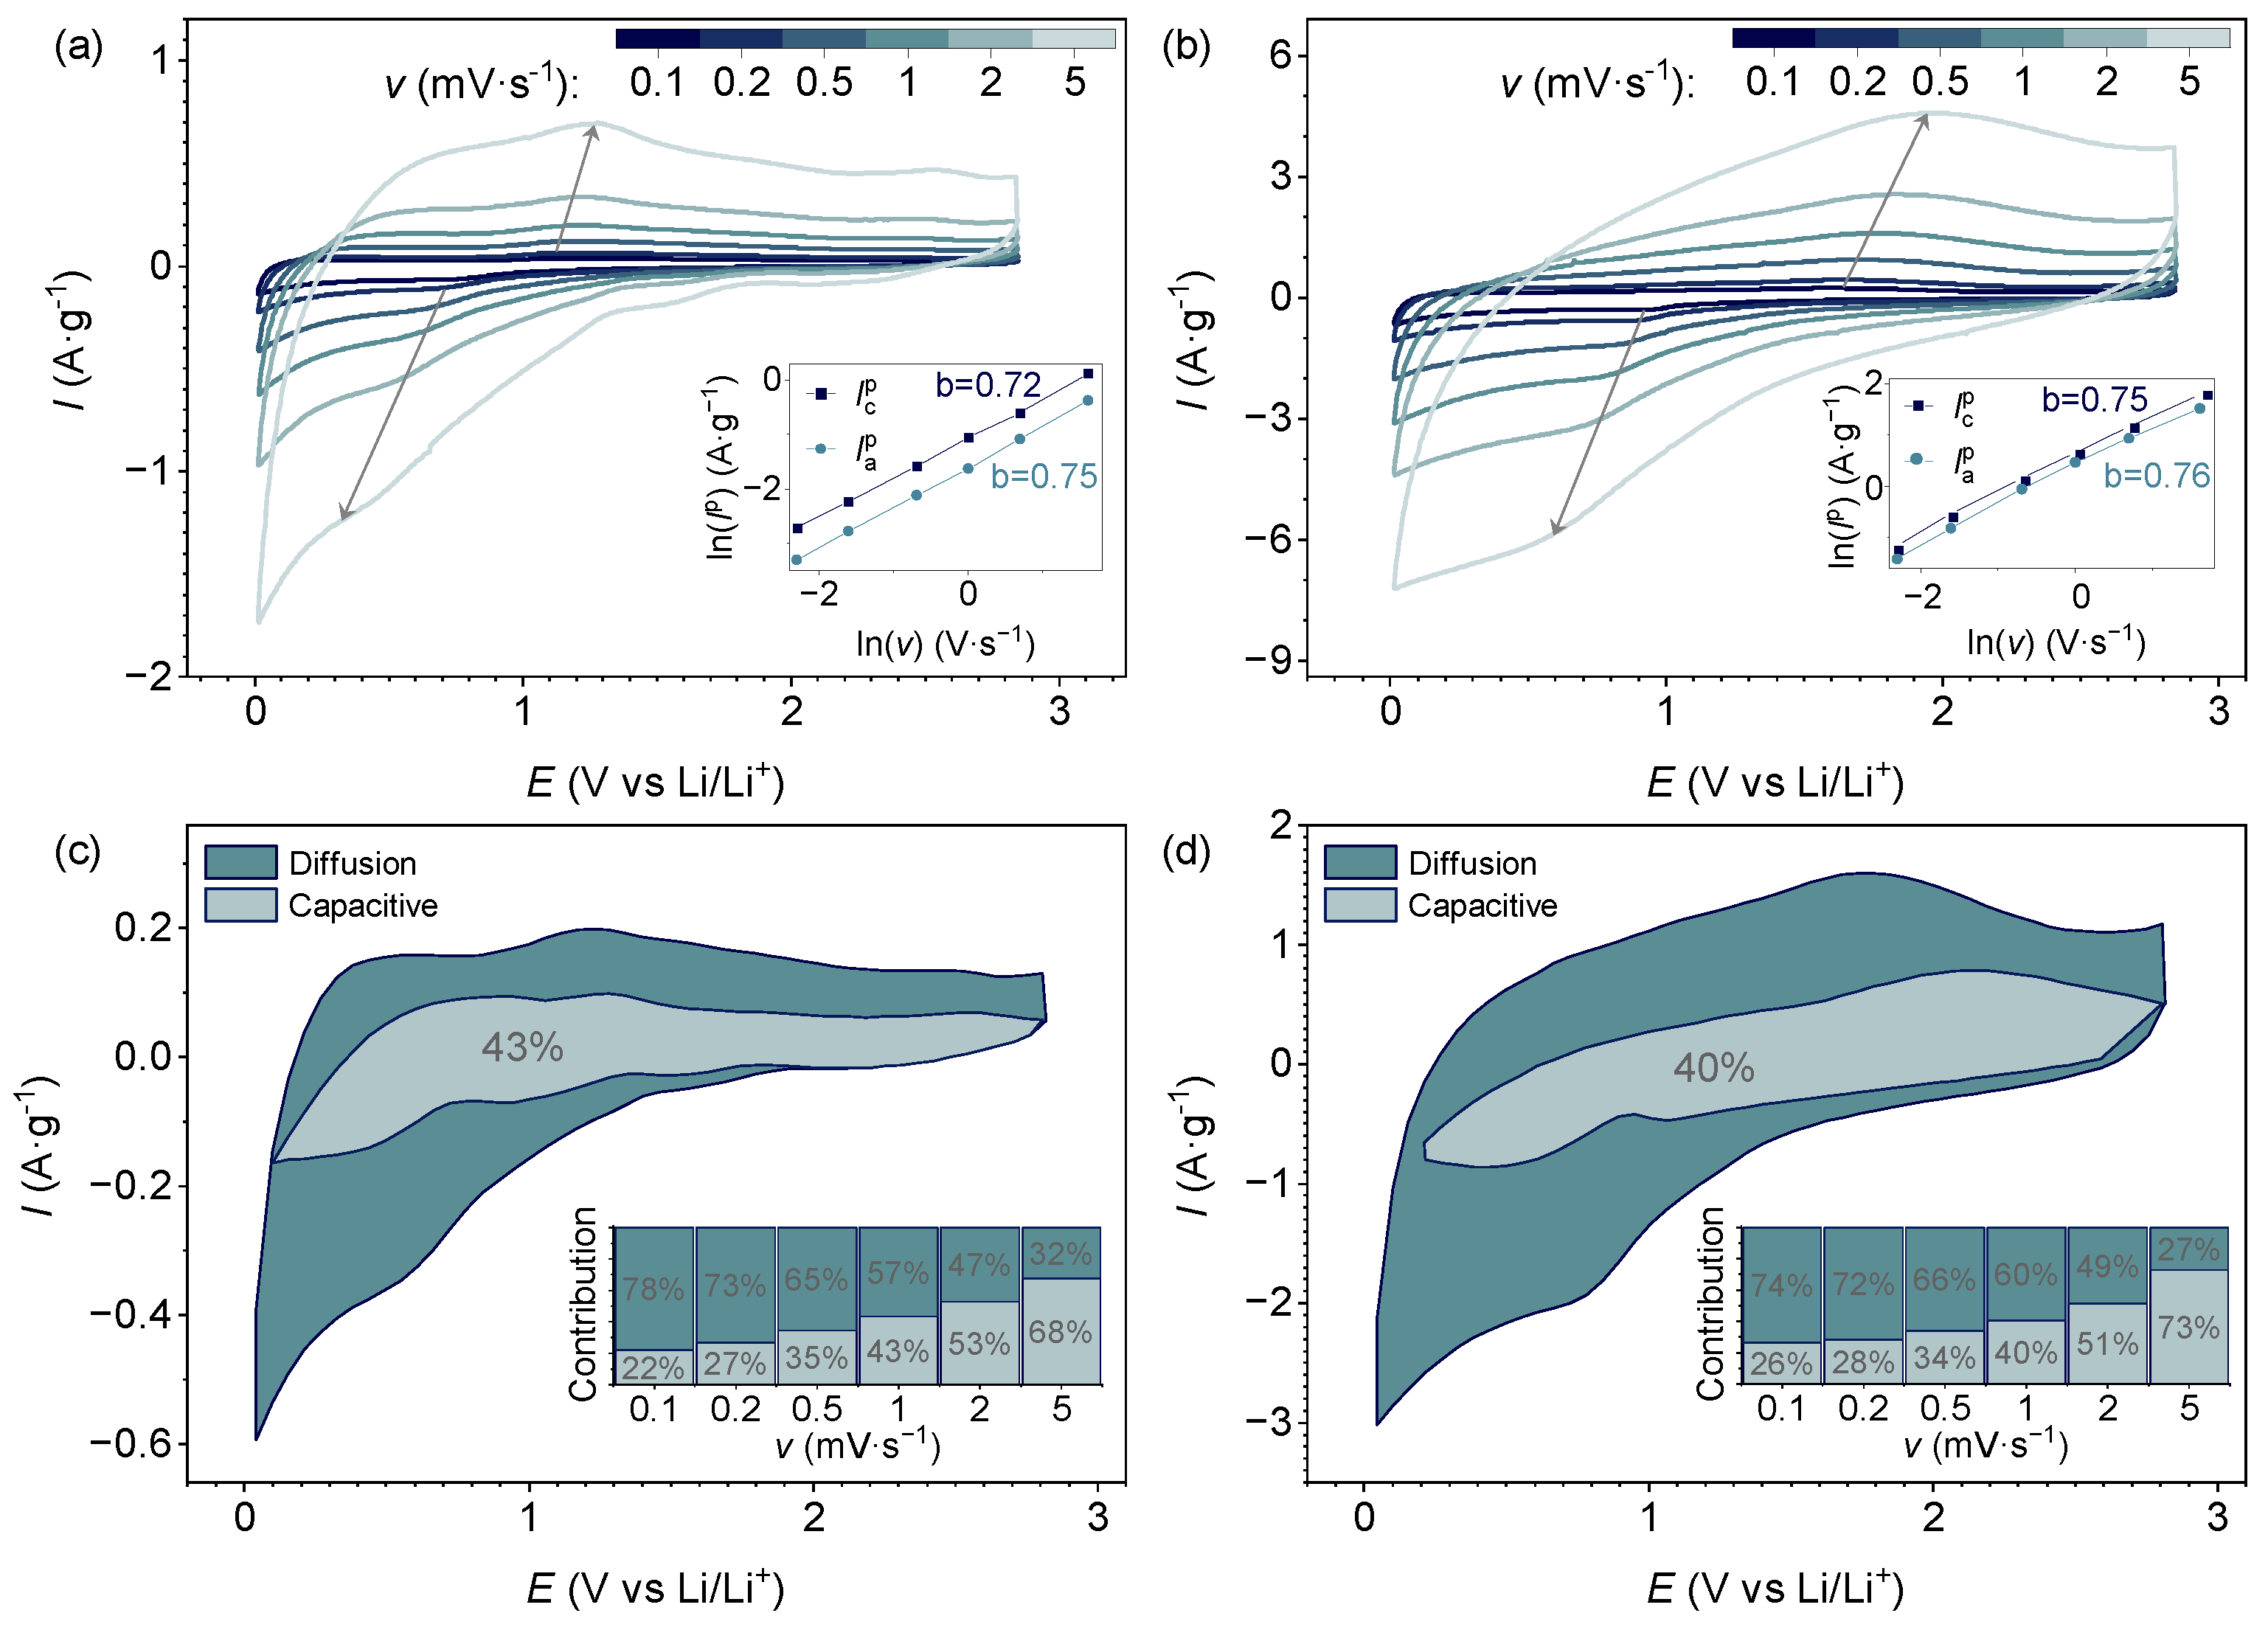
Figure 5.
NMC532//FeOOH/PANI Full cell performance within the 0.5–4.20 V range at C/2 referred to the NMC532 cathode mass (1 C = 140 mA∙g–1) in terms of (a) selected voltage profiles, inset: charge-discharge curve of the NMC532 - Graphite full cell at a C/2 rate; (b) trends of specific capacity and coulombic efficiency. Electrolyte: 1 M LiPF6 in EC/DEC (1:1, v/v).
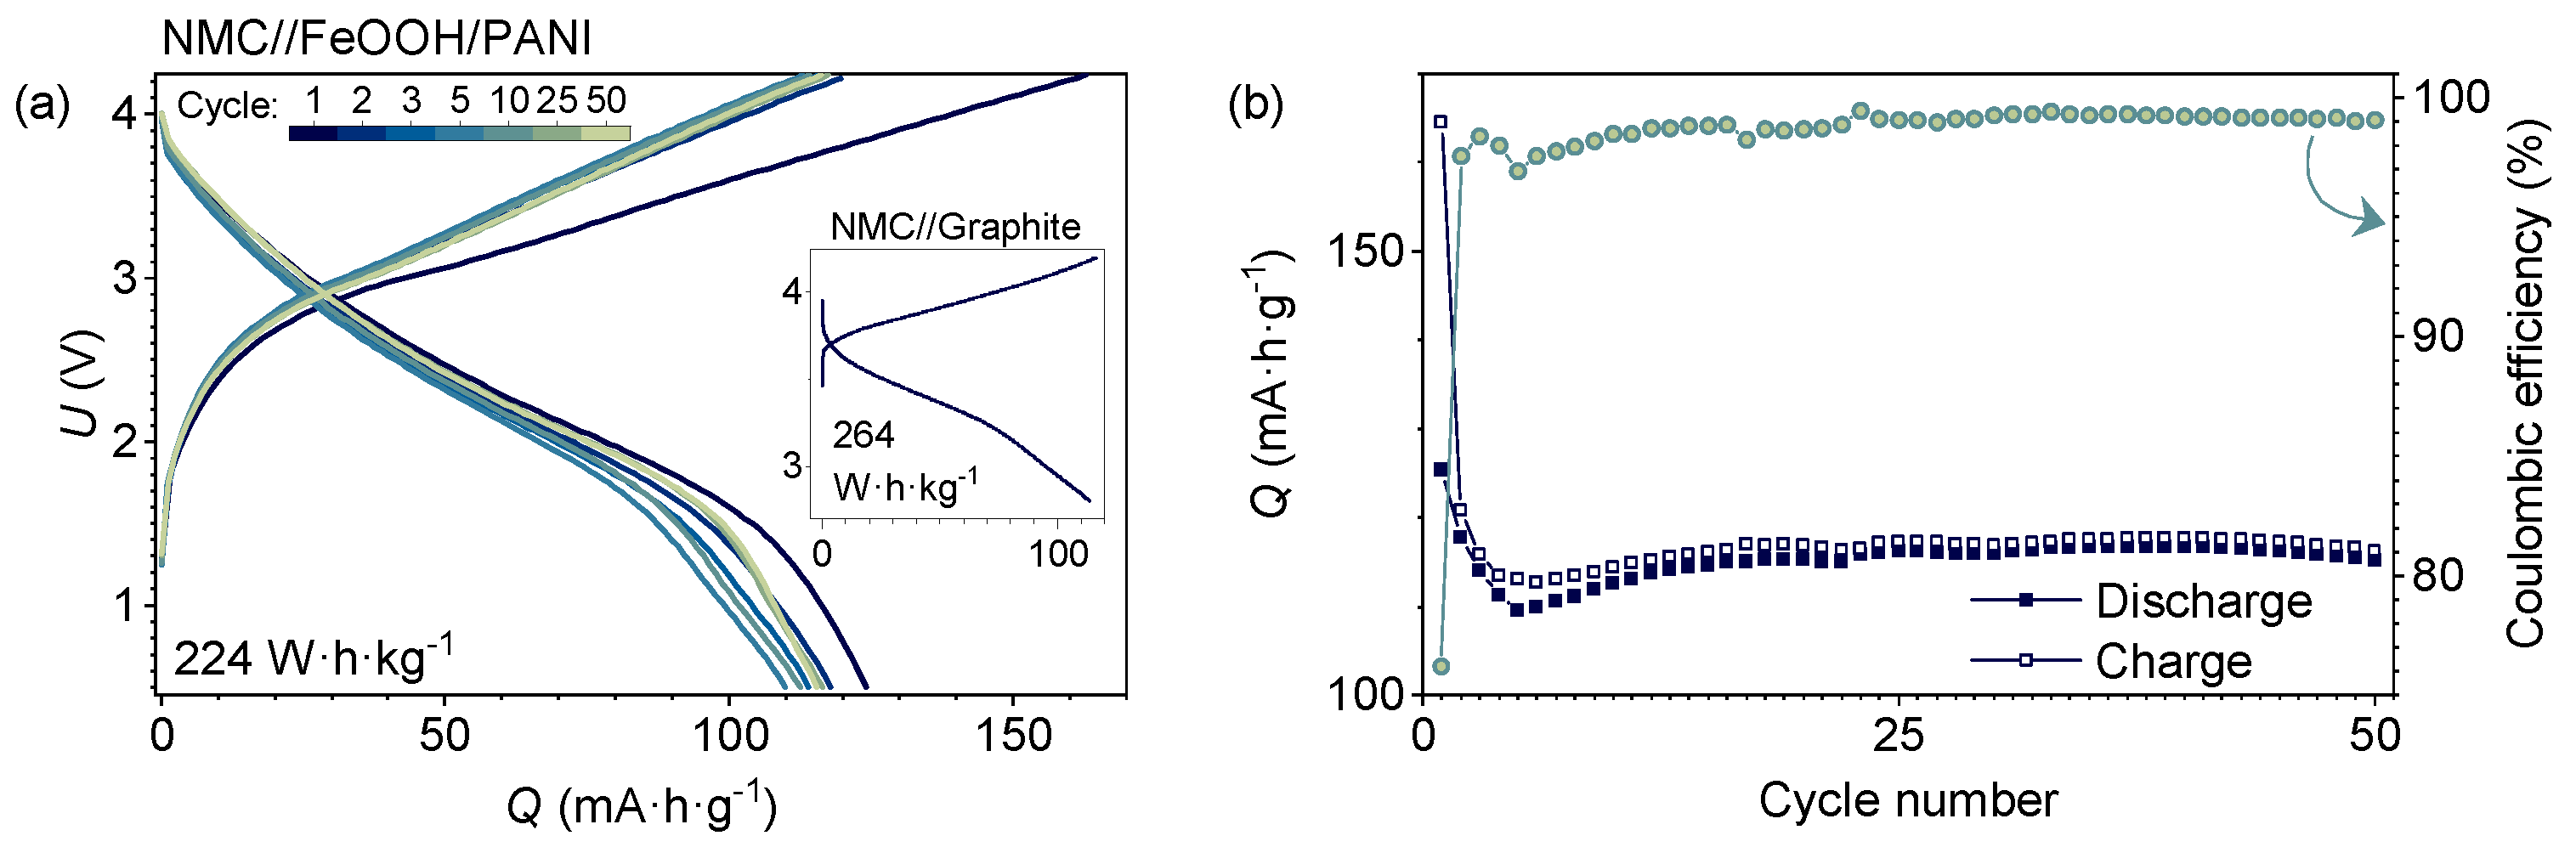
Figure 6.
Comparison of NMC532//FeOOH/PANI full cell with other anodes in development: Si@N-C-100//LiCoO2 [110], NC-TNO@TiC/C//LFP [111], NMC811//DC-HSiOx [112], Li//LiNiO2 [113], LCO-Se [114], pHC/LiCoO2 [115], LiBp-SiOx/C@G//NCM811 [116], NCM//C-SiOx@Si/rGO [117] (Co0.2Cu0.2Mg0.2Ni0.2Zn0.2)O [109].
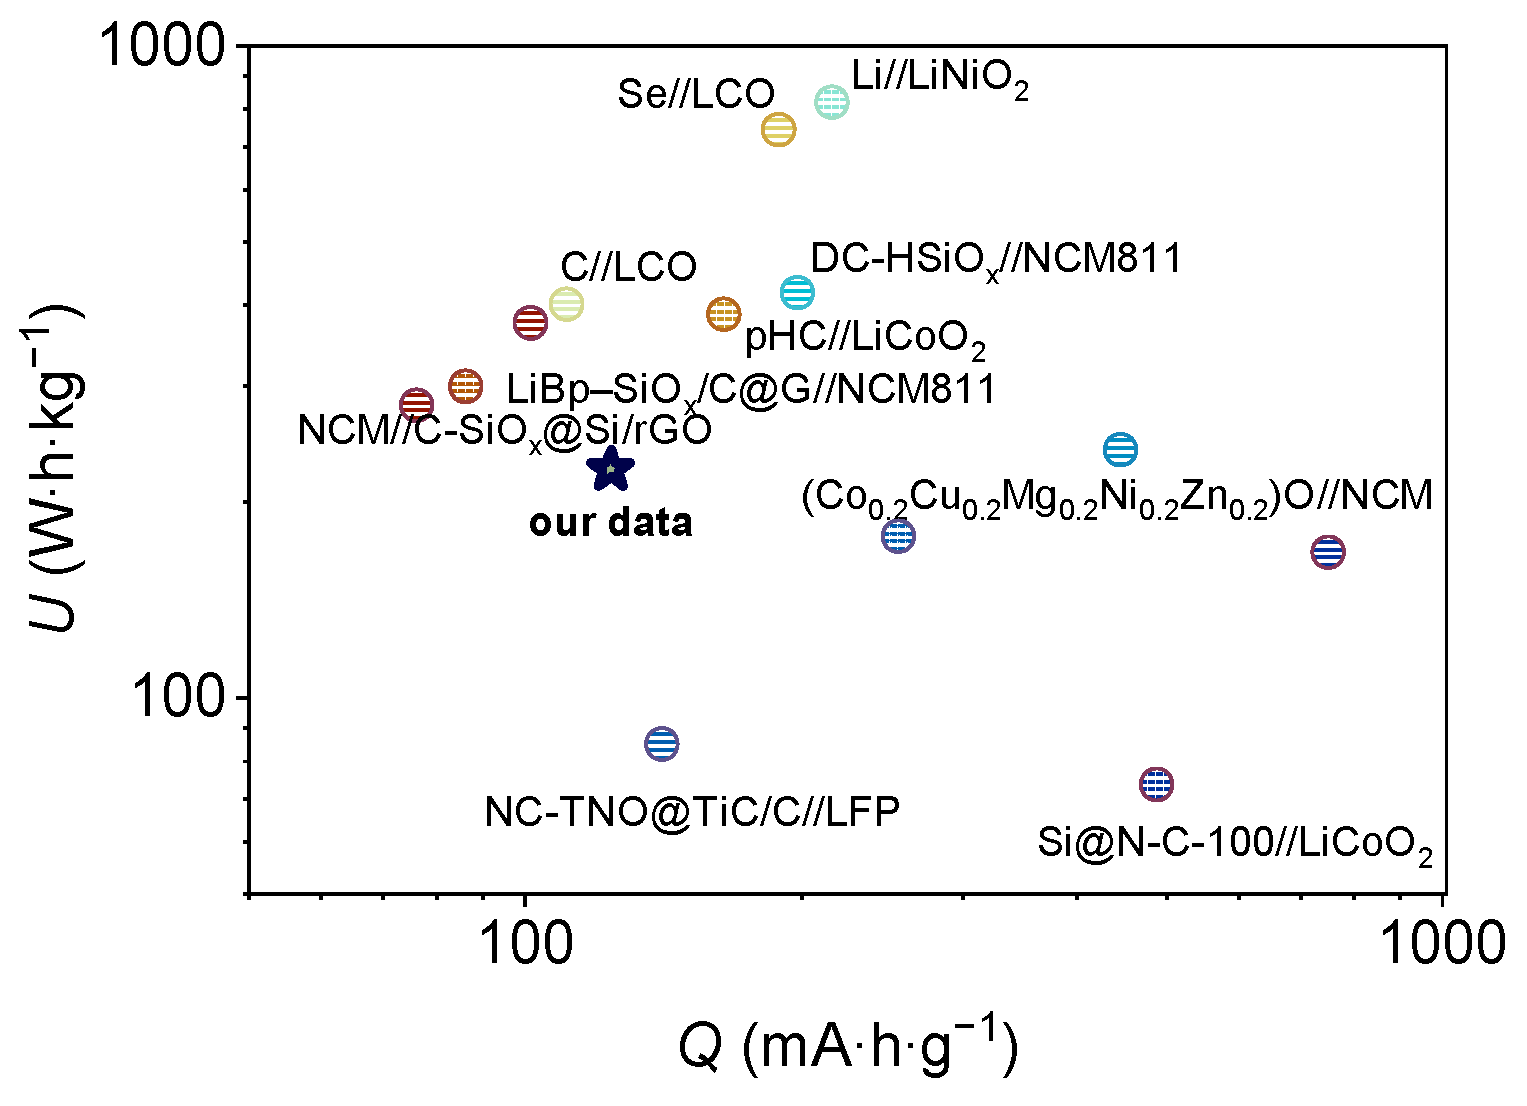
Figure 8.
(a) Fitted Cottrell function plot for the current transient versus the decimal logarithm for 1st and 1200th cycles; (b) dependence of particle size L2 and its mass content on the cycle number; (c) correlation between specific surface area from PITT and Warburg constant from EIS.
Figure 8.
(a) Fitted Cottrell function plot for the current transient versus the decimal logarithm for 1st and 1200th cycles; (b) dependence of particle size L2 and its mass content on the cycle number; (c) correlation between specific surface area from PITT and Warburg constant from EIS.
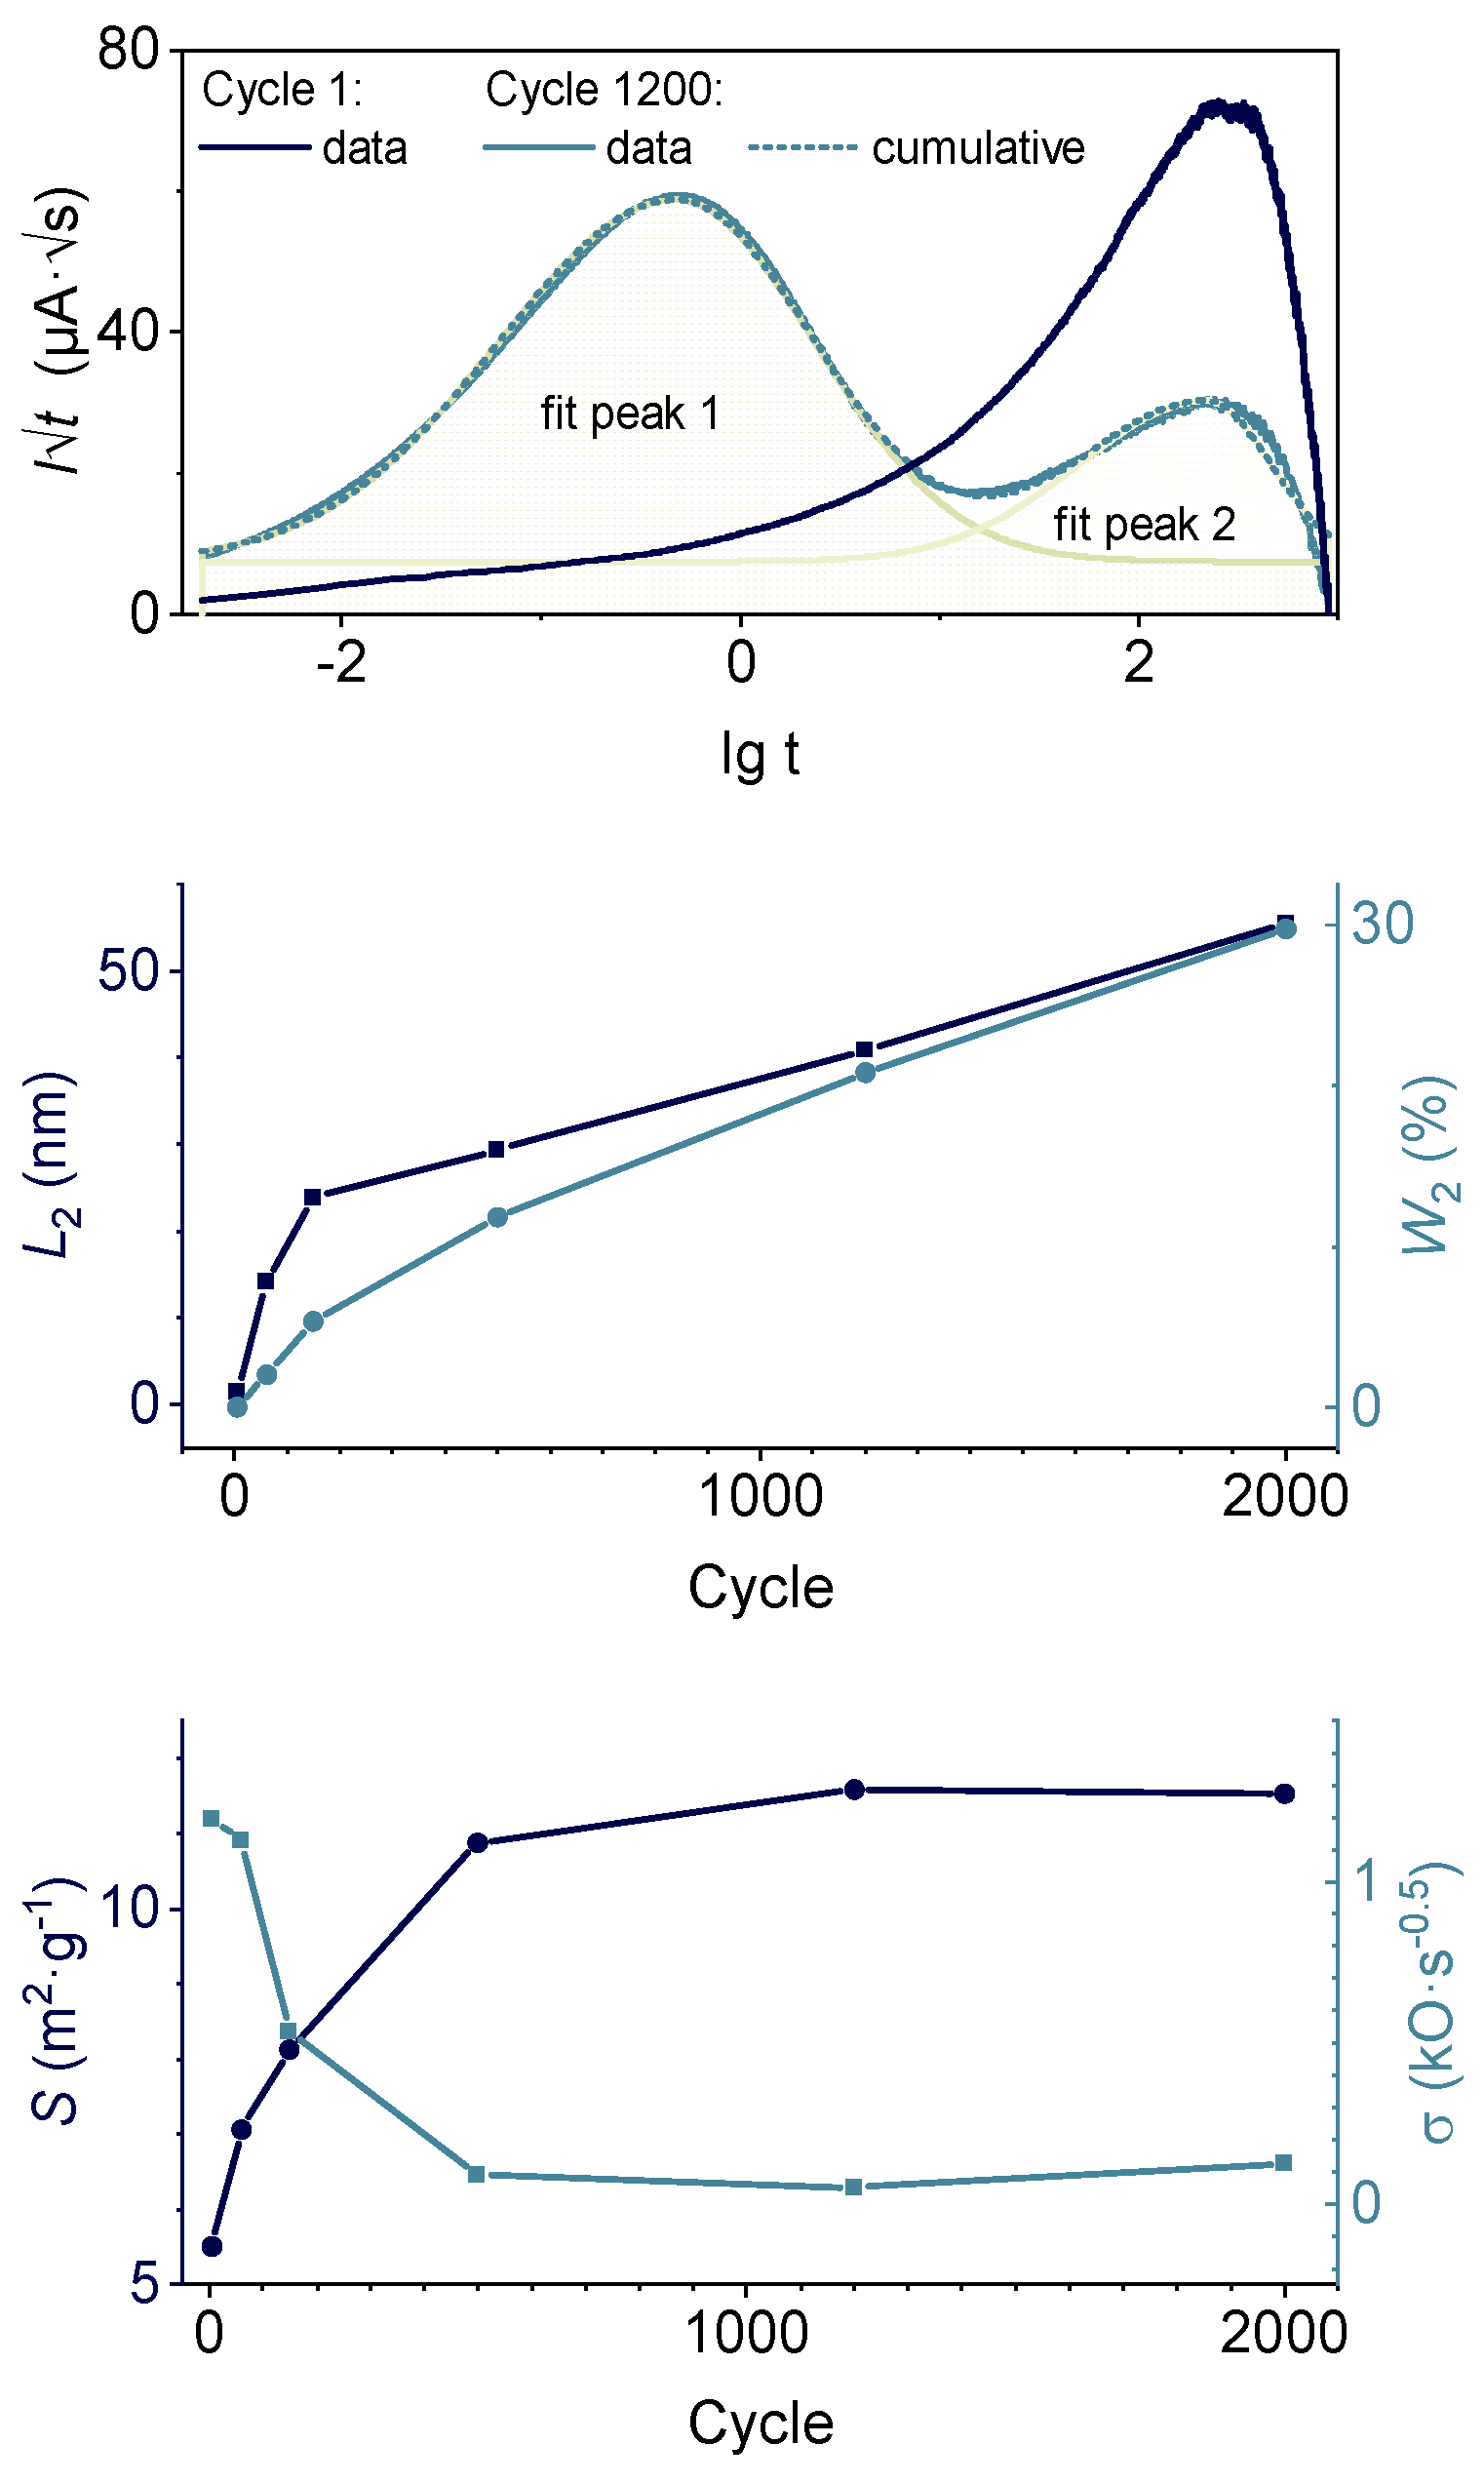
Figure 9.
ATR-FTIR spectra of FeOOH/PANI electrodes after different number of recharging cycles.
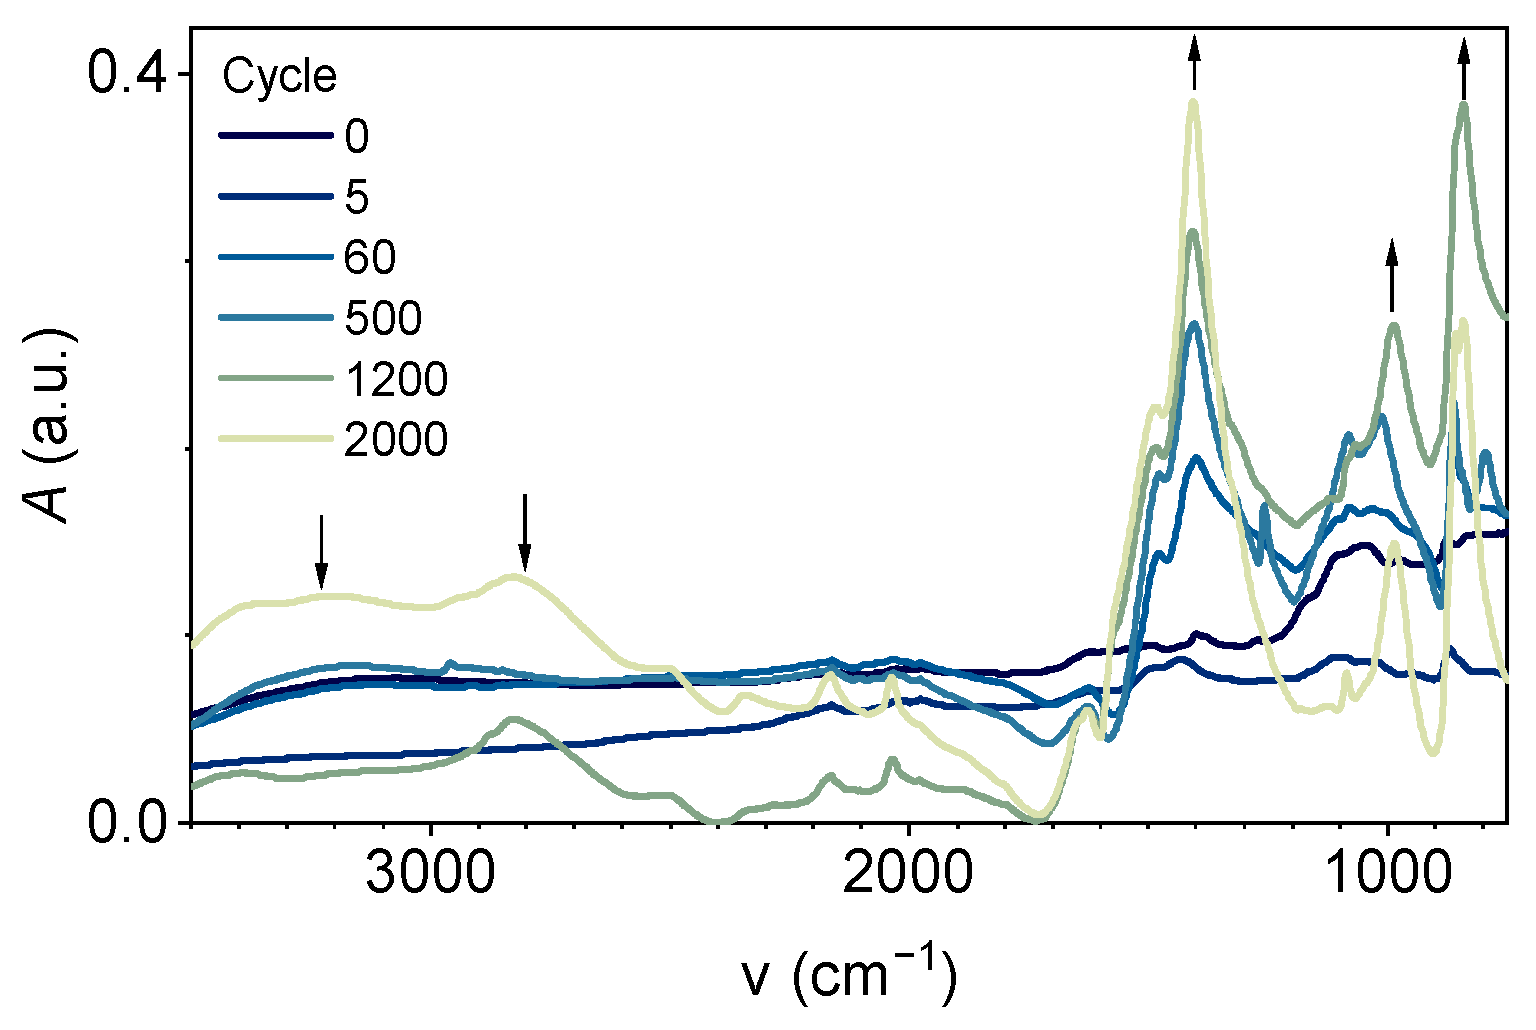
Table 1.
Comparison of performance of FeOOH-based and related materials in LIBs anodes.
| Material | Specific capacity, mA∙h∙g−1 (current density) | Stability, capacity retention (cycles) |
Ref. |
|---|---|---|---|
| Fe3O4/graphene sheets | 600 (0.1 A∙g−1) | 80% (100) | [13] |
| Functionalized porous carbon/β-FeOOH | 737.1 (0.2 A∙g−1) | 122% (350) | [17] |
| Fe2O3 nanotubes | 950 (0.05 A∙g−1) | 98% (30) | [104] |
| β-FeOOH | 275 (0.1 mA∙cm−2) | n/a | [21] |
| Carbon cloth/ β-FeOOH nanorod arrays | 2840 (1 A∙g−1) | 90% (150) | [23] |
| Ce-doped α-FeOOH nanorods | 1260 (0.1 A∙g−1) | 86% (800) | [24] |
| Si-doped FeOOH nanorods@graphene sheets | 1370.5 (0.1 A∙g−1) | >100% (200) | [25] |
| Graphene/FeOOH | 1100 (0.1 A∙g−1) | n/a | [46] |
| β-FeOOH/rGO | 781.5 (0.1 A∙g−1) | n/a ~90% (100) | [105] |
| FeOOH@PEDOT | 1341 (0.5 A∙g−1) | 113.6% (270) | [27] |
| Biomass carbon/β -FeOOH | 1450 (0.2C) | 64% (100) | [51] |
| FeOOH/GO | 1437 (0.1 A∙g−1) | 93.35% (100) | [106] |
| FeOOH/SWNT | 905 (0.1 A∙g−1) | ~95% (180) | [98] |
| β-FeOOH | ~1400 (0.2 A∙g−1) | ~43% (1 to 600) ~210% (70 to 600) |
[31] |
| Mn-doped α-FeOOH | 1147 (0.5 A∙g−1) | 184% (90 to 300) | [99] |
| α-Fe2O3 | 1119 (1C) | 176% (600) | [95] |
| FeOOH | 640 (0.05 A∙g−1) and 356 (1.2 A∙g−1) | 245% from 150th to 2000th cycle (356 mA∙h∙g−1 end value) |
Previous work [68] |
| FeOOH/Gr | 840 (0.05 A∙g−1) and 543 (1.2 A∙g−1) | 206% from 60th to 2000th cycle (543 mA∙h∙g−1 end value) |
Previous work [68] |
| FeOOH/PANI | 1600 (0.05 A∙g−1) 767 (1.2 A∙g−1) |
540% from 70th to 2000th cycle (767 mA∙h∙g−1 end value) |
This work |
Table 2.
Fitted parameters of FeOOH/PANI impedance spectra at the charged state.
| Cycle no. | Rs, Ω | R1, Ω | Q1, F | a | σ, Ω∙s−0.5 |
|---|---|---|---|---|---|
| 5 | 23.4 | 164 | 1.8∙10−5 | 0.79 | 1200 |
| 60 | 13.8 | 93.8 | 2.6∙10−5 | 0.77 | 1130 |
| 150 | 29.9 | 45.0 | 2.3∙10−5 | 0,82 | 536 |
| 500 | 34.4 | 18.3 | 7.8∙10−5 | 0.80 | 90.1 |
| 1200 | 37.6 | 31.2 | 9.9∙10−5 | 0.74 | 52.3 |
| 2000 | 12.4 | 138 | 9.9∙10−5 | 0.58 | 126 |
Table 3.
Fitted parameters of FeOOH/PANI impedance spectra at discharged state.
| Cycle | Rs, Ω | R1, Ω | Q1, F | a1 | R2, Ω | Q2, F | a2 | σ, Ω∙s−0.5 |
|---|---|---|---|---|---|---|---|---|
| 5 | 32 | 76 | 3.1∙10−3 | 0.78 | 180 | 1.1∙10−4 | 0.56 | 27 |
| 60 | 17 | 76 | 5.4∙10−3 | 0.75 | 100 | 8.4∙10−5 | 0.64 | 30 |
| 150 | 29 | 25 | 1.6∙10−2 | 0.83 | 37 | 6.3∙10−5 | 0.75 | 24 |
| 500 | 28 | 37 | 2.7∙10−2 | 0.88 | 17 | 9.4∙10−5 | 0.81 | 13 |
| 1200 | 44 | 49 | 2.4∙10−2 | 0.86 | 30 | 1.1∙10−4 | 0.73 | 9.8 |
| 2000 | 12 | 58 | 6.6∙10−3 | 0.78 | 36 | 1.1∙10−4 | 0.56 | 20 |
Disclaimer/Publisher’s Note: The statements, opinions and data contained in all publications are solely those of the individual author(s) and contributor(s) and not of MDPI and/or the editor(s). MDPI and/or the editor(s) disclaim responsibility for any injury to people or property resulting from any ideas, methods, instructions or products referred to in the content. |
© 2023 by the authors. Licensee MDPI, Basel, Switzerland. This article is an open access article distributed under the terms and conditions of the Creative Commons Attribution (CC BY) license (http://creativecommons.org/licenses/by/4.0/).
Copyright: This open access article is published under a Creative Commons CC BY 4.0 license, which permit the free download, distribution, and reuse, provided that the author and preprint are cited in any reuse.


