Submitted:
15 April 2025
Posted:
16 April 2025
You are already at the latest version
Abstract
This study analyzes for the first time the genetic diversity, connectivity, and evolutionary dynamics of the small red scorpionfish (Scorpaena notata) in the Balearic Islands based on mitochondrial DNA. Nucleotide diversity of the Cytochrome c oxidase subunit I (COI) gene was found to be low compared to other commercial fish species, suggesting that fishing may be impacting the population despite being a by-catch species. In contrast, the Control Region (CR) showed higher genetic variability. Demographic history analyses suggest that S. notata underwent a population expansion during the Pleistocene, possibly driven by sea-level changes. Genetic structure analyses (Fst and AMOVA) indicated genetic homogeneity and high connectivity among the Balearic Islands’ population, likely facilitated by its passive dispersion with pelagic eggs and larvae and the oceanographic conditions of the region. Our results indicate that the entire Balearic Islands should be considered as a unique Management Unit, although its potential relation to other nearby areas, such as the Iberian Peninsula, should also be studied.
Keywords:
scorpionfish
; Scorpaena notata
; by-catch species
; mtDNA
; Balearic Islands
; connectivity
; population expansion
1. Introduction
Intraspecific genetic diversity represents a fundamental component of biodiversity, but it is less studied compared to species and ecosystem diversity [1]. In this sense, understanding population connectivity is fundamental to unravel marine ecological processes. The geographical distribution and population connectivity of marine species are shaped by their dispersal potential and gene flow, which depend on both passive larval transport and active adult migration [e.g. 2–4]. Many marine fishes undergo a planktonic larval phase that take place in the open water, separated from their adult habitat, which offer great potential for widespread dispersal [5,6].
Molecular DNA markers have been used for assess population connectivity and intraspecific genetic diversity of marine fishes [e.g. 7–9]. In particular, mitochondrial DNA (mtDNA) markers have been widely used as a robust indicator for population structure analysis, both coding genes and the D-loop or Control Region (CR). The use of mitochondrial markers combined with Bayesian approach [10] and coalescent theory [11,12] have also allowed us to infer the reconstruction of historical demography over time of various marine species [e.g. 13], and thus, provide insight into the effects of past climate changes [1]. These genetic approaches have provided insights into the dispersal patterns of marine fish larvae, the influence of oceanographic barriers, and the extent of connectivity among populations [e.g. 3,4]. Genetic findings have also improved fisheries management, primarily for the fisheries stock identification and delineation, which provide crucial information strategies by revealing whether populations are self-sustaining or reliant on external recruitment [14,15].
Our study species, the small red scorpionfish, Scorpaena notata, is a small-size species of the family Scorpaenidae present in the eastern Atlantic, from the Bay of Biscay to Senegal, Madeira, the Azores and the Canary Islands, and the Mediterranean and Black Sea [16]. In the Western Mediterranean this species typically inhabits coastal waters, in caves, seagrass meadows and red algae bottoms, from the surface down to 150 m depth [17,18]. It is an oviparous species with external fertilization and its eggs are embedded in a gelatinous matrix [19].
In the Mediterranean, S. notata is a by-catch species caught with trammel nets and bottom trawling [20]. Within the Scorpaenidae family, S. notata is among the most abundant species in the infra- and circa-littoral communities, particularly in red algae sedimentary bottoms [17,18].
Although some biological studies have been performed on S. notata [20 and references herein], nothing is known about its population genetics. Therefore, the main objective of the present study is to estimate the genetic diversity, connectivity and demographic history of the small red scorpionfish using two mitochondrial fragments, Control Region and the Cytochrome Oxidase subunit I (COI), at a small spatial scale in the Balearic Islands (Western Mediterranean), an area with complex oceanographic conditions.
2. Materials and Methods
2.1. Study Area
The Balearic Islands are the most distant insular area in the Western Mediterranean, separated from the Iberian Peninsula by a minimum distance of 95 nautical miles and with depths ranging from 800 to almost 2000 m [21]. The Archipelago is a natural boundary between the Algerian sub-basin in the south, and the Balearic sub-basin in the north. These sub-basins are characterised by different oceanographic conditions [22] and are connected by a series of channels that play an important role in the regional circulation, as passages for the exchange of water masses between them. The Algerian sub-basin receives warmer and fresher surface water from the Atlantic, whereas the Balearic sub-basin is characterised by colder and more saline waters that have remained longer in the Mediterranean. The Archipelago is characterised by a high oligotrophy [23], which is somehow mitigated in the Balearic sub-basin by the influence of waters generated in the more productive area of the Gulf of Lions [24]. This different oceanographic setting between the north and the south of the Balearic Islands has been reported to influence the population dynamics of both coastal and deep-water demersal resources in key attributes as recruitment, spawning and body condition [25–30].
2.2. Sampling
The fin clip samples of Scorpaena notata were collected during the MEDITS (International bottom trawl survey in the Mediterranean) and CANAL scientific surveys carried out throughout the Balearic Islands during the period 2021-2023 (Table S1). In these surveys, the experimental bottom trawl GOC-73 was used to sample demersal communities and resources of the dishing exploited bottoms (for specific information see [31]). A total of 90 samples were collected from 20 stations across Balearic Archipelago (Figure 1 and Table S1) and preserved in 96% ethanol.
2.3. DNA Extraction, Amplification and Sequencing
Total genomic DNA was extracted with the DNeasy Blood and Tissue Extraction kit (Qiagen, West Sussex, UK) following the manufacturer’s instructions. Two mitochondrial fragments were amplified: Cytochrome c Oxidase subunit I (COI) gene using the primers FF2d/FR1d [32] and the control region (CR) with primers designed by Ostellari et al. [33]. However, this last set of primer did not amplify adequately due to the presence of an anomalous banding pattern. Because of this, we designed internal primers based on the Ostellari’s primers using the Primer3 InPut program (https://primer3.ut.ee/). Primers used in this study are included in Table S2.
PCR conditions consisted of 35 cycles after initial denaturalization at 94 °C for 2 min. The cycles comprised 30 s at 94 °C, 1 min at 51 °C (COI) or 56 °C (CR), and 1 min at 72 °C, followed by a final extension at 72 °C for ten minutes. The amplification products were purified using the MicroCLEAN kit (Microzone, UK) and sent to the external service provider MACROGEN (Madrid, Spain) for Sanger sequencing.
MEGA-X [34] was employed to edit and align the obtained sequences, using the ClustalW method, and checked for their quality. Forward and reverse sequences were aligned and analysed to generate an individual consensus sequence for each sample. All sequences were deposited in GenBank (accession numbers are indicated in Table S1).
2.4. Data Analyses
Samples were grouped into six sampling locations from the Balearic Archipelago (BA): Menorca (MEN), Menorca Channel (MCH), Northern Mallorca (NML) and Southern Mallorca (SML) from Gymnesic Islands (GI); and Ibiza (IBI) and Formentera (FOR) from Pityusic Islands (PI) (Figure 1).
Genetic diversity parameters, such as the number of polymorphic sites (S), number of haplotypes (h), haplotype (Hd) and nucleotide (π) diversity and respective standard deviations, and mean nucleotide difference (k), were calculated for each sampling location and for the all population using the DnaSP v6 program [35] and Arlequin v3.5.2.2 [36].
Haplotype networks were constructed using the Median-Joining Network analysis implemented in PopArt 1.7 [37] for all the haplotypes detected for both mtDNA fragments and for the concatenated sequence. These networks aimed to obtain genetic connectivity of S. notata in the regional area of the Balearic Archipelago.
To assess the genetic connectivity and the population structure, two analyses were carried out, an Analysis of Molecular Variance (AMOVA [38]) and the fixation index Fst [39] using Arlequin program.
A Bayesian coalescent approach implemented in MIGRATE version 2.0.6 [40] was used to assess migration rates between different regions within the archipelago. The analysis was based on Bayesian inference, estimating population size and gene flow with an exponential distribution, assuming a constant mutation rate under the HKY evolutionary model, and utilizing a long Markov chain configuration. The analysis ran for 10 million generations and 0.1% of the initial generations were discarded due to burn-in.
To investigate the demographic history of the studied species in the Balearic Archipelago, neutrality tests including Tajima’s D and Fu’s statistics and mismatch distribution, were analyzed with DnaSP 6 program. In addition, a Multilocus Coalescent Extended Bayesian Skyline Plot (EBSP) implemented in BEAST v.2.7.6 [41] was performed for the entire population using the concatenated fragment of COI and RC sequences. To construct the posterior distribution of effective population size over time, a standard Markov Chain Monte Carlo (MCMC) sampling procedure was used assuming a single panmictic population. For this analysis, parameters and priors were configured in BEAUti 2 [42] and we specified a HKY substitution model with empirical frequencies and a strict molecular clock. Regarding the choice of the mutation rate, we considered: 1) the unavailability of substitution rate for COI and for RC for Scorpaenidae and 2) the differing mutation rates between mtDNA regions [43]. In view of these constraints, we chose to use distinct clock rates for each locus. For COI a range of three molecular rates was used (2.3%, 4% and 6.6% per million years) and two for RC (5% and 10%), following the mutation rates described in other marine species [44,45, respectively]. The analyses were run for 20 million generations, sampling every 1000 and 10% burn-in of the samples. Tracer v 1.7.2 [46] was then used to analyse the runs and RStudio v2022.12+0.353 [47] to generate the skyline plots.
3. Results
3.1. Genetic Diversity
A concatenated fragment of 832 bp of mtDNA (COI: 554 bp; CR: 278 bp) was sequenced from 90 individuals of S. notata from the six sampling locations throughout the Balearic Islands (Figure 1). All sequences were deposited in GenBank database, accession numbers are given in Table S1 (PQ333157–PQ333216 plus PQ363180-PQ363249 for COI; and PQ468319–PQ468412 for CR).
A total of 101 variable sites were observed in the concatenated fragment. Among the 90 sequences, 85 haplotypes were identified. The mean haplotype diversity and nucleotide diversity for all the samples were 0.999 and 0.011, respectively. Similar diversity values were found in the Gymnesic and Pityusic Islands and also between the six locations. Diversity indices are summarized in Table 1.
Regarding the COI fragment, 26 haplotypes were recognized, with the mean haplotype and nucleotide diversity for all the samples of 0.732 and 0.002, respectively. The haplotype diversity of each location ranged from 0.511 (Menorca) to 0.857 (South of Mallorca). Nucleotide diversity of all the locations was low, ranging from 0.001 to 0.003. In the other hand, a much higher genetic diversity was observed for CR. In the 90 sequences, 78 haplotypes were observed, with a mean haplotype and nucleotide diversity of 0.997 and 0.028, respectively. Haplotype diversities in the locations ranged between 0.993 (Ibiza) and 1.0 (Menorca, Menorca Channel, Southern Mallorca and Formentera) and nucleotide diversity varied between 0.024 (Menorca Channel) and 0.032 (Formentera) (Table 1).
3.2. Genetic Differentiation and Connectivity
The obtained haplotype networks are included in Figure 2. The haplotype networks for the concatenated (Figure 2c) and RC (Figure 2b) fragment presented a high number of haplotypes, 85 and 78, respectively. Both networks revealed hyper-diverse bush-like pattern, with a large number of singletons (84.6% and 94.1%, respectively). In contrast, the COI fragment network (Figure 2a) showed a star-like distribution, where a total of 26 haplotypes were observed, including 19 singletons and 7 shared haplotypes, one of which was very common, being shared by 45 (50%) of the specimens and all the sampling locations, suggesting a genetic homogeneity in the area studied.
The overall coefficient of genetic differentiation was no significant (p = 0.41011 ± 0.03167) for combined data set. All the pair-wise Fst values were also low and non-significant (Table S3). The pair-wise population genetic differentiation in the concatenated fragment was similar to both the individual genes, when analyzed separately. Therefore, these results also reveal genetic homogeneity among the S. notata sampling locations from Balearic Islands.
A three-way AMOVA was performed, considering two groups namely, Gymnesic and Pityusic Islands. This hierarchical analysis showed that the variation occurs primarily within sampling locations (99.78%), rather than between them or between groups of islands, with low and non-significant Fst value (Fst = 0.00224, p = 0.21017) (Table 2), confirming the lack of genetic structure of S. notata individuals throughout the Balearic Archipelago. In agreement, the concatenated mtDNA data showed high connectivity, with elevated values of the number of migrant individuals per generation, between all sampling locations (Table S3). It is noteworthy than migrant events are slightly higher from Pityusic Islands (Ibiza and Formentera), and that North of Mallorca and Menorca Channel are the areas that receive more migrant individuals.
3.3. Population History
The mismatch distribution of concatenated sequences suggests a demographic expansion of the S. notata population (Figure 3a). This expansion was further supported by the significantly negative values of Fu’s Fs (-121.701; p < 0.001) and Tajima’s D (-1.963; p <0.05) values (Table 3), which failed to reject the null hypothesis of constant population size. Additionally, the Bayesian Skyline Plot also showed evidence of demographic expansion. All distinct mutation rates suggest that the expansion dated to the Late Pleistocene (Figure S1). The mutation rates of 2.3% for COI and 5 % for CR (Figure 3b) suggest a scenario where the expansion may be attributed to an interglacial warmer climate (130.000-110.000 ya) and not with a glacial period, suggesting that these mutation rates might be more consistent with present data. Moreover, the BSP analysis showed that S. notata population had a stable growth rate, not showing significant population dynamics during the past 20 thousand years (Figure S2).
4. Discussion
In the present study, genetic diversity, connectivity and demographic history of the small red scorpionfish Scorpaena notata were assessed for the first time in the Balearic Islands. In particular, the overall nucleotide diversity for COI fragment here recorded (π: 0.0021) was lower when compared to commercial fish species, which were sampled and analysed in the Balearic Islands [48,49] such as Mullus barbatus (π: 0.0035), Mullus surmuletus (π: 0.0047) and Serranus cabrilla (π: 0.0092), but slightly higher than Lophius budegassa (π: 0.0016) and Merluccius merluccius (π: 0.0018). These results suggest that the population of S. notata in the Balearic Islands is being affected by the impact of fishing despite being a by-catch species. Similarly, other by-catch fish species in the area were assessed as overexploited, some of them even at higher levels than M. surmuletus, which were among the most targeted fish species in the Archipelago [50] before its recovery recently detected [51], which is probably a result of the implementation of the multiannual plan for the fisheries exploiting demersal stocks in the Western Mediterranean Sea (Regulation EU 2019/1022 of the European Parliament and of the Council of 20 June 2019). In contrast, the overall nucleotide diversity of RC fragment (π: 0.0276) was higher than that recorded in the littoral co-generic species S. maderensis from the Mediterranean Sea (π: 0.0258) [9], which is rarely present in the catches of Mediterranean fisheries.
A contrasting pattern with regard to genetic variability was found when comparing both mtDNA markers, COI and CR. While COI showed low values of genetic diversity, the CR recorded high values (Table 1). This genetic hypervariability in CR is comparable to results in S. maderensis [9] and, although documented in populations of other fish genera [e.g. 52,53], is uncommon in rocky coastal species [9]. Differences in variability between COI and CR can be due to the well-known evolutionary rate variations in different parts of the mtDNA molecular [43] as well as evolutionary rates variation between lineages [54], life history traits (e.g., generation-time or self-recruitment [9,48,55] or demographic or selective factors, (e.g., population size, bottlenecks or expansions events [48,56]).
Regarding genetic structure, genetic population analyses (Fst and AMOVA) suggest a genetic homogeneity and high connectivity between the sampling locations in the Balearic Islands. These results were supported by haplotype networks and MIGRATE analysis which showed no evidence for genetic structure; therefore, the small red scorpionfish is not composed of discernible genetic groups within Balearic Islands region. Other studies on the small scale connectivity of fish species found similar results. Schunter et al. [57] studied genetic connectivity and geographic fragmentation for the comber Serranus cabrilla, a serranid fish, following a fine sampling pattern along the Mediterranean. These authors did not find any population differentiation between Balearic Islands (Formentera vs Menorca vs Mallorca), but they did find differences when comparing the Balearic Islands with the Central Mediterranean and the South Spanish coast. In the case of the dusky grouper Epinephelus marginatus, another serranid species, no genetic differentiation was observed between Balearic Islands, nor between the majority of other Mediterranean populations studied [58]. In a genetic study of the black scorpionfish, Scorpaena porcus, in the Mediterranean and Black Seas, no small-scale population differences were observed, but large-scale differences were detected [59]. However, other studies in marine fish species suggest a complex population structure along the western Mediterranean [e.g. 57,60], therefore, a possible population difference cannot be ruled out when comparing the Balearic Islands with other areas of the Mediterranean, but further studies are needed to confirm this.
The high connectivity observed in the present results suggests that S. notata is a species with constant events of exchange of individuals in the continental shelf of the Balearic Islands. In marine species, these events generally occur in pelagic stages during larval phase [61]. In the planktonic larval phase, the larvae are capable of broad dispersal being the main vector of genetic exchange [5,61]. Currently, there is no data on larval duration of S. notata, but for its co-generic species S. porcus and S. guttata it has been established in 29 and 30 days, respectively [62,63]. This period, if similar in S. notata, would be long enough to ensure the passive dispersion for the exchange of individuals at the small spatial scale analyzed. Also, the Balearic Islands lie at the transition between the Algerian basin in the south and the Balearic basin, in the north, with complex hydrodynamics interconnecting the two basins through the channels between the islands [64 and references therein] that can increase the exchange of individuals.
Traditionally, the degree of genetic connectivity has been related to both contemporary and historical factors that combined shape the present-day observed patterns [e.g. 65,66]. The historical demographic analyses carried out here (mismatch distribution, neutrality tests and BSPs) suggest a demographic expansion in the Balearic S. notata population, which, according to BSPs analysis, could have occurred in Late Pleistocene rather than in the Holocene, as is commonly observed in marine species [44,59,67–69]. The recent stable population dynamics support the hypothesis that this expansion probably took place before the Last Glacial Period, possibly near the last interglacial period (130-110 kya) [70,71]. According to Thunell [72], the Mediterranean showed large-scale temperature oscillations on long time-series during the Pleistocene. This result contrasts with reported expansions for Scorpaena porcus in the Black and Adriatic Seas [59] in 17.5–20 kya and for other marine species in the Holocene epoch (17.5-20 Kya), during the warming period following the Last Glacial Maximum (LGM) [e.g. 59,67–69]. Fossil evidence shows Scorpaena notata has been present in the Mediterranean since the early and mid-Pliocene [73], surviving multiple glaciations. Distinct salinity and temperature conditions between Western and Eastern Mediterranean during the Last Glacial Maximum [74] could influence the differences between the expansion time described in S. notata and S. porcus. Moreover, calibration time might not give accurate date due to the fact that the molecular clock has not been precisely determined for Scorpaeniformes or for marine fishes in general [45,59] and, taking into account that mutation rates vary considerably among genes and taxa [75–77], the molecular clock selection in different studies can significantly affect results, particularly with highly variable regions like the CR. This may lead to anomalous or uncertain growth times [78] and obscure historical and demographic events further back in time.
5. Conclusions
In conclusion, here we studied for the first time the genetic diversity, connectivity, and evolutionary dynamics of the small red scorpionfish (Scorpaena notata). Our results suggest a genetic homogeneity and high connectivity between the sampling locations in the Balearic Islands. This is most likely due to the pelagic larval phase and the complex oceanographic conditions in the study area. On the other hand, demographic analyses indicate the occurrence of past population expansion, likely influenced by Pleistocene sea-level changes. The results of this study indicate that the entire Balearic Islands should be considered as a unique Management Unit, although its potential relation to other nearby areas (like the Iberian Peninsula) should also be studied.
Supplementary Materials
The following supporting information can be downloaded at the website of this paper posted on Preprints.org, Figure S1: Bayesian skyline plot reconstructions of changes of effective population size through time of Scorpaena notata based on mitochondrial concatenated sequences and different mutations rates; Figure S2. Bayesian skyline plot reconstructions of changes of effective population size of Scorpaena notata through the past 20 thousand years based on mitochondrial concatenated sequences and mutations rates 2.3% for COI and 5% for CR, respectively. Table S1: Details of the sampling stations; Table S2: Primers used in this study; Table S3: Pairwise Fst (below diagonal) and P values (above diagonal) between S. notata localities from Balearic Islands. Table S4: Number (mean) of migrants for generation between pairs of sampling localities of this study.
Author Contributions
Conceptualization, F.O., A.P. and S.R.; methodology, J.R. and A.T.; data analysis, J.R. and S.R.; writing—original draft preparation, A.P.; writing—review and editing, B.G., F.O., A.P. and S.R.; funding acquisition, B.G., F.O., and A.P. All authors have read and agreed to the published version of the manuscript.
Funding
This study is part of the MARFISH project (PDR2020/69) which is part of the Projectes de Recerca Científica i Tecnològica of the Direcció General de Política Universitària i Recerca, funded by the Conselleria de Fons Europeus, Universitat i Cultura and the Sustainable Tourism tax of the Balearic Islands government. This work has been sponsored by the Comunitat Autonòma de les Illes Balears through the Direcció General de Política Universitària i Recerca with funds from the Tourist Stay Tax Law (PRD2020/69 – ITS 2017-006). The MEDITS surveys are co-funded by the European Union through the European Maritime Fisheries and Aquaculture Fund (EMFAF) within the National Program of collection, management, and use of data in the fisheries sector and support for scientific advice regarding the Common Fisheries Policy. The CANAL surveys were part of the SosMed project (“Improvement of the scientific and technicall knowledge for the sustainability of demersal fisheries in the western Mediterranean”), funded by the European Union - Next Generation (Recovery, Transformation and Resilience Plan), with an agreement between the Ministry of Agriculture, Fisheries and Food and the Spanish National Research Council, through the Spanish Institute of Oceanography.
Institutional Review Board Statement
The sampling scheme followed a standardized protocol (MEDITS Handbook. MEDITS Working Group, ninth version; 2017; p. 106) approved by international authorities (EU/DG Mare, FAO/GFCM). If a live specimen of a rare species or a species subject to conservation measures were caught, it was quickly sampled (4–5 min) and returned to the sea unharmed, giving it a chance of survival, following recommendation GFCM/36/2012/3 (http://www.gfcmonline.org/decisions/ accessed on 8 August 2024) on fisheries management measures for conservation of sharks and rays in the GFCM area.
Data Availability Statement
All sequences were deposited in GenBank database, accession numbers are available in the Supplementary file.
Acknowledgments
The authors would like to thank all the participants in the MEDITS and CANAL surveys, as well as the crew of R/V Miguel Oliver, R/V Ángeles Alvariño and R/V Ramón Margalef.
Conflicts of Interest
The authors declare no conflicts of interest.
Abbreviations
The following abbreviations are used in this manuscript:
| AMOVA | Analysis of Molecular Variance |
| BA | Balearic Archipelago |
| BSP | Bayesian Skyline Plot |
| COI | Cytochrome c oxidase subunit I |
| CR | Control Region |
| EBSP | Extended Bayesian Skyline Plot |
| FOR | Formentera |
| Fst | Fixation Index |
| GI | Gymnesic Islands |
| IBI | Ibiza |
| LGM | Last Glacial Maximum |
| MCH | Menorca Channel |
| MCMC | Markov Chain Monte Carlo |
| MEDITS | Mediterranean International bottom trawl survey |
| MEN | Menorca |
| mtDNA | mitochondrial DNA |
| NML | Northern Mallorca |
| SML | Southern Mallorca |
References
- Pauls, S.U.; Nowak, C.; Balint, M.; Pfenninger, M. The impact of global climate change on genetic diversity within populations and species. Mol. Ecol. 2013, 22, 925–946. [Google Scholar] [CrossRef] [PubMed]
- Selkoe, K.A.; Toonen, R.J. Marine connectivity: a new look at pelagic larval duration and genetic metrics of dispersal. Mar. Ecol. Prog. 2011, 436, 291–305. [Google Scholar] [CrossRef]
- Pascual, M.; Rives, B.; Schunter, C.; Macpherson, E. Impact of life history traits on gene flow: a multispecies systematic review across oceanographic barriers in the Mediterranean Sea. PLoS One 2017, 12(5), e0176419. [Google Scholar] [CrossRef] [PubMed]
- Quattrocchi, F.; Fiorentino, F.; Gargano, F.; Garofalo, G. The role of larval transport on recruitment dynamics of red mullet (Mullus barbatus) in the Central Mediterranean Sea Mar. Environ. Res. 2024, 202, 106814. [Google Scholar]
- Pedersen, O.P.; Aschan, M.; Rasmussen, T.; Tande, K.S.; Slagstad, D. Larval dispersal and mother populations of Pandalus borealis investigated by a Lagrangian particle-tracking model. Fish. Res. 2003, 65(1-3), 173–190. [Google Scholar] [CrossRef]
- Basterretxea, G.; Jordi, A.; Catalan, I.A.; Sabatés, A.N.A. Model-based assessment of local-scale fish larval connectivity in a network of marine protected areas. Fish. Oceanogr. 2012, 21(4), 291–306. [Google Scholar] [CrossRef]
- Habib, A.; Ahmad, N.A.H.; Ariffin, N.A.; Seah, Y.G.; Alam, M.M.M.; Jaafar, T.N.A.M.; Fadli, N.; Nor, S.A.M.; Rahman, M.M. Mitochondrial control region sequences show high genetic connectivity in the brownstripe snapper, Lutjanus vitta (Quoy and Gaimard, 1824) from the east coast of Peninsular Malaysia. J. Genet. 2024, 103, 35. [Google Scholar] [CrossRef]
- Hadi, S.; Andayani, N.; Muttaqin, E.; Simeon, B.M.; Ichsan, M.; Subhan, B.; Madduppa, H. Genetic connectivity of the scalloped hammerhead shark Sphyrna lewini across Indonesia and the Western Indian Ocean. PLoS One 2020, 15(10), e0230763. [Google Scholar] [CrossRef]
- Francisco, S.M.; Castilho, R.; Lima, C.S.; Almada, F.; Rodrigues, F.; Šanda, R.; Vudić, J.; Pappalardo, A.M.; Ferrito, V.; Robalo, J.I. Genetic hypervariability of a Northeastern Atlantic venomous rockfish. PeerJ, 2021, 9, e11730. [Google Scholar] [CrossRef]
- Beaumont, M.A. Approximate Bayesian computation in evolution and ecology. Annu. Rev. Ecol. Evol. Syst. 2010, 41, 379–406. [Google Scholar] [CrossRef]
- Csillery, K.; Blum, M.G.B.; Gaggiotti, O.E.; Francois, O. Approximate Bayesian Computation (ABC) in practice. Trend. in Ecol. and Evol. 2010, 25, 410–418. [Google Scholar] [CrossRef]
- Fontaine, M.C.; Roland, K.; Calves, I.; Austerlitz, F.; Friso, F.P.; Tolley, K.A.; Ryan, S.; Ferreira, M.; Jauniaux, T.; Llavona, A.; Öztürk, B.; Öztürk, A.A.; Ridoux, V.; Rogan, E.; Sequeira, M.; Siebert, U.; Vikingsson, G.A.; Borrell, A.; Michaux, J.R.; Aguilar, A. Postglacial climate changes and rise of three ecotypes of harbour porpoises, Phocoena phocoena, in western Palearctic waters. Mol. Ecol. 2014, 23, 3306–3321. [Google Scholar] [CrossRef] [PubMed]
- Boissin, E.; Hurley, B.; Wingfield, M.J.; Vasaitis, R.; Stenlid, J.; Davis, C.; De Groot, P.; Ahumada, R.; Carnegie, A.; Goldarazena, A.; Klasmer, P.; Wermelinger, B.; Slippers, B. Retracing the routes of introduction of invasive species: the case of the Sirex noctilio woodwasp. Mol. Ecol. 2012, 21, 5728–5744. [Google Scholar] [CrossRef]
- Hanski, I. Metapopulation dynamics. Nature 1998, 396, 41–49. [Google Scholar] [CrossRef]
- Treml, E.A.; Halpin, P.N. Marine population connectivity identifies ecological neighbors for conservation planning in the Coral Triangle. Conserv. Lett. 2012, 5, 441–449. [Google Scholar] [CrossRef]
- Hureau, J.C.; Litvinenko, N.I. Scorpaenidae. In Fishes of the North-eastern Atlantic and the Mediterranean. Bauchot, M.L.; Hureau, J.C.; Nielsen, J.; Tortonese, E. (Eds.).; UNESCO, Paris, 1986, Whitehead, P.J.P., pp. 1211-1229.
- Harmelin-Vivien, M.L.; Kaim-Malka, R.A.; Ledoyer, M.; Jacob-Abraham, S.S. Food partitioning among scorpaenid fishes in Mediterranean seagrass beds. J. Fish Biol. 1989, 34, 715–734. [Google Scholar] [CrossRef]
- Ordines, F.; Massutí, E. Relationships between macro-epibenthic communities and fish on the shelf grounds of the western Mediterranean. Aquat. Conserv. Mar. Freshw. Ecosyst. 2009, 19(4), 370–383. [Google Scholar] [CrossRef]
- Muñoz, M.; Sàbat, M.; Vila, S.; Casadevall, M. Annual reproductive cycle and fecundity of Scorpaena notata (Teleostei, Scorpaenidae). Sci. Mar. 2005, 69(4), 555–562. [Google Scholar] [CrossRef]
- Ordines, F.; Quetglas, A.; Massutí, E.; Moranta, J. Habitat preferences and life history of the red scorpion fish, Scorpaena notata, in the Mediterranean. Est. Coast. Shelf Sci. 2009, 85, 537–546. [Google Scholar] [CrossRef]
- Acosta, J.; Canals, M.; López-Martınez, J.; Munoz, A.; Herranz, P.; Urgeles, R.; Palomo, C.; Casamor, J.L. The Balearic Promontory Mediterranean international trawl survey (MEDITS). Aquat. Living Resour. 2002, 12, 207–217. [Google Scholar]
- Lehucher, P.M.; Beautier, L.; Chartier, M.; Martel, F.; Mortier, L.; Brehmer, P.; Millot, C.; Alberola, C.; Benzhora, M.; Taupierletage, I.; Dhieres, G.; Didelle, H.; Gleizon, P.; Obaton, D.; Crépon, M.; Herbaut, C.; Madec, G.; Sabrina, S.; Nihoul, J.; Harzallah, A. Progress from 1989 to 1992 in understanding the circulation of the Western Mediterranean Sea. Oceanol. Acta 1995, 18, 255–271. [Google Scholar]
- Bosc, E.; Bricaud, A.; Antoine, D. Seasonal and interannual variability in algal biomass and primary production in the Mediterranean Sea, as derived from 4 years of SeaWiFS observations. Global Biogeochem. Cycles 2024, 18, 1–17. [Google Scholar] [CrossRef]
- Monserrat, S.; López-Jurado, J.L.; Marcos, M. (2008). A mesoscale index to describe the regional circulation around the Balearic Islands. J. Mar. Syst. 2008, 71(3-4), 413–420.
- Guijarro, B.; Fanelli, E.; Moranta, J.; Cartes, J.E.; Massutí, E. Small-scale differences in the distribution and population dynamics of pandalid shrimps in the western Mediterranean in relation to environmental factors. Fish. Res. 2012, 119-120, 33–47. [Google Scholar] [CrossRef]
- Guijarro, B.; Massutí, E.; Moranta, J.; Cartes, J.E. Short spatio-temporal variations in the population dynamics and biology of the deep-water rose shrimp Parapenaeus longirostris (Decapoda: Crustacea) in the western Mediterranean. Sci. Mar. 2009, 73(1), 183–197. [Google Scholar] [CrossRef]
- Guijarro, B.; Massutí, E.; Moranta, J.; Díaz, P. Population dynamics of the red-shrimp Aristeus antennatus in the Balearic Islands (western Mediterranean): spatio-temporal differences and influence of environmental factors. J. Mar. Syst. 2008, 71, 385–402. [Google Scholar] [CrossRef]
- Hidalgo, M.; Massutí, E.; Moranta, J.; Cartes, J.E.; Lloret, J.; Oliver, P.; Morales-Nin, B. Seasonal and short spatial patterns in European hake (Merluccius merluccius L. ) recruitment process at the Balearic Islands (western Mediterranean): the role of environment on distribution and condition. J. Mar. Syst. 2008, 71, 367–384. [Google Scholar]
- Massutí, E.; Monserrat, S.; Oliver, P.; Moranta, J.; López-Jurado, J.L.; Marcos, M.; Hidalgo, M.; Guijarro, B.; Carbonell, A.; Pereda, P. The influence of oceanographic scenarios on the population dynamics of demersal resources in the western Mediterranean: hypothesis for hake and red shrimp off Balearic Islands. J. Mar. Syst. 2008, 71, 421–438. [Google Scholar] [CrossRef]
- Rueda, L.; Moranta, J.; Abelló, P.; Balbín, R.; Barberá, C.; Fernández de Puelles, M.L.; Olivar, M.P.; Ordines, F.; Ramón, M.; Torres, A.P.; Valls, M.; Massutí, E. Body condition of the deep water demersal resources at two adjacent oligotrophic areas of the western Mediterranean and the influence of the environmental features. J. Mar. Syst. 2014, 138, 194–202. [Google Scholar] [CrossRef]
- Spedicato, M.T.; Massutí, E.; Mérigot, B.; Tserpes, G.; Jadaud, A.; Relini, G. The MEDITS trawl survey specifications in an ecosystem approach to fishery management. Sci. Mar. 2019, 83(S1), 9–20. [Google Scholar] [CrossRef]
- Ivanova, N.V.; Zemlak, T.S.; Hanner, R.H.; Hebert, P.D.N. Universal primer cocktails for fish DNA barcoding. Mol. Ecol. Notes 2007, 7, 544–548. [Google Scholar] [CrossRef]
- Ostellari, L.; Bargelloni, L.; Penzo, E.; Patarnello, P.; Patarnello, T. Optimization of single-strand conformation polymorphism and sequence analysis of the mitochondrial control region in Pagellus bogaraveo (Sparidae, Teleostei): Rationalized tools in fish population biology. Anim. Genet. 1996, 27, 423–427. [Google Scholar] [CrossRef] [PubMed]
- Kumar, S.; Stecher, G.; Li, M.; Knyaz, C.; Tamura, K. MEGA X: molecular evolutionary genetics analysis across computing platforms. Mol. Bio. Evol. 2018, 35(6), 1547–1549. [Google Scholar] [CrossRef] [PubMed]
- Rozas, J.; Ferrer-Mata, A.; Sánchez-DelBarrio, J.C.; Guirao-Rico, S.; Librado, P.; Ramos-Onsins, S.E.; Sánchez-Gracia, A. DnaSP 6: DNA sequence polymorphism analysis of large data sets. Mol. Biol. Evol. 2017, 34(12), 3299–3302. [Google Scholar] [CrossRef] [PubMed]
- Excoffier, L.; Lischer, H.E.L. Arlequin suite ver 3.5: a new series of programs to perform population genetics analyses under Linux and Windows. Mol. Ecol. Resour. 2010, 10, 564–567. [Google Scholar] [CrossRef]
- Leigh, J.W.; Bryant, D.; Nakagawa, S. POPART: full-feature software for haplotype network construction. Methods Ecol. Evol. 2015, 6(9), 1110–1116. [Google Scholar] [CrossRef]
- Excoffier, L.; Smouse, P.E.; Quattro, J.M. Analysis of molecular variance inferred from metric distances among DNA haplotypes: application to human mitochondrial DNA restriction data. Genetics 1992, 131, 479–491. [Google Scholar] [CrossRef]
- Wright, S. The genetical structure of populations. Ann. Eugen. 1951, 15, 323–354. [Google Scholar] [CrossRef]
- Beerli, P.; Mashayekhi, S.; Sadeghi, M.; Khodaei, M.; Shaw, K. Population genetic inference with MIGRATE. Curr. Protoc. Bioinform. 2019, 68, 87. [Google Scholar] [CrossRef]
- Bouckaert, R.; Heled, J.; Kuhnert, D.; Vaughan, T.; Wu, C.; Xie, D.; Suchard, M.A.; Rambaut, A.; Drummond, A.J. BEAST 2: a software platform for Bayesian evolutionary analysis. PLoS. Comput. Biol. 2014, 10, 1–6. [Google Scholar] [CrossRef]
- Bouckaert, R.; Vaughan, T.G.; Barido-Sottani, J.; Duchêne, S.; Fourment, M.; Gavryushkina, A.; Heled, J.; Jones, G.; Kühnert, D.; De Maio, N.; Matschiner, M.; Mendes, F.K.; Müller, N.F.; Ogilvie, H.A.; Plessis, L.D.; Popinga, A.; Rambaut, A.; Rasmussen, D.; Siveroni, I.; Suchard, M.A.; Wu, C.; Xie, D.; Zhang, C.; Stadler, T.; Drummond, A.J. BEAST 2.5: An advanced software platform for Bayesian evolutionary analysis. PLoS. Comput. Biol. 2019, 15(4), e1006650. [Google Scholar] [CrossRef]
- Jia, C.; Zhang, X.; Xu, S.; Yang, T.; Yanagimoto, T.; Gao, T. Comparative analysis of the complete mitochondrial genomes of three rockfishes (Scorpaeniformes, Sebastiscus) and insights into the phylogenetic relationships of Sebastidae. Biosc. Rep. 2020, 40(12), BSR20203379. [Google Scholar] [CrossRef] [PubMed]
- Crandall, E.D.; Sbrocco, E.J.; DeBoer, T.S.; Barber, P.H.; Carpenter, K.E. Expansion dating: calibrating molecular clocks in marine species from expansions onto the Sunda Shelf following the Last Glacial Maximum. Mol. Biol. Evol. 2012, 29, 707–719. [Google Scholar] [CrossRef]
- Gwak, W.S.; Roy, A. Genetic diversity and population structure of brown croaker (Miichthys miiuy) in Korea and China inferred from mtDNA control region. Genes 2023, 14, 1692. [Google Scholar] [CrossRef]
- Rambaut, A.; Suchard, M.A.; Xie, D.; Drummond, A.J. Tracer v1.6. 2014. Available online: http://beast.bio.ed.ac.uk/Tracer (accessed on 28 February of 2025).
- RStudio Team RStudio: Integrated Development for, R. RStudio, PBC, Boston, MA. 2020. Available online: http://www.rstudio.com/ (accessed on 28 February of 2025).
- Petit-Marty, N.; Liu, M.; Tan, IZ.; Chung, A.; Terrasa, B.; Guijarro, B.; Ordines, F.; Ramírez-Amaro, S.; Massutí, E.; Schunter, C. Declining Population Sizes and Loss of Genetic Diversity in Commercial Fishes: A Simple Method for a First Diagnostic. Front. Mar. Sci. 2022, 9, 872537. [Google Scholar] [CrossRef]
- Pasini, N.; Riera, J.; Tudurí, A.; Bassitta, M.; Ferragut, J.F.; Picornell, A.; Ramírez-Amaro, S. Estudios genéticos como una herramienta de diagnóstico para evaluar el efecto de las Zonas de Protección Pesquera en el Canal de Menorca sobre los recursos pesqueros demersales. In Proceedings of the XIV Reunión del Foro científico de pesca española en el mediterráneo, Palma, Spain, 20-21 septembre 2023; José Luis Sánchez Lizaso, Ed.; Universidad de Alicante: Alicante, Spain, 2024. [Google Scholar]
- Ordines, F.; Farriols, M.T.; Lleonart, J.; Guijarro, B.; Quetglas, A.; Massutí, E. Biology and population dynamics of by-catch fish species of the bottom trawl fishery in the western Mediterranean. Mediterr. Mar. Sci. 2014, 15(3), 613–625. [Google Scholar] [CrossRef]
- GFCM. Working Group on Stock Assessment of Demersal Species (WGSAD). Scientific Advisory Committee on Fisheries (SAC). General Fisheries Commission for the Mediterranean (GFCM). 2024. Rome, Italy, 9-14 December 2024.
- Song, C.Y.; Sun, Z.C.; Gao, T.X.; Song, N. Structure analysis of mitochondrial DNA control region sequences and its applications for the study of population genetic diversity of Acanthogobius ommaturus. Russ. J. Mar. Biol. 2020, 46, 292–301. [Google Scholar] [CrossRef]
- Cunha, D.B.D.; da Martins, K.C.P.; Júnior, J.N.S.; Moreira, E.C.O.; Sampaio, I.; Queiroz, C.C.S.; Leite, M.A.; de Souza, A.A.; dos Santos, C.A.; Vallinoto, M. High genetic diversity detected in the mitochondrial Control Region of the Serra Spanish Mackerel, Scomberomorus brasiliensis (Collette, Russo & Zavala, 1978) along the Brazilian coast. Mitochondrial DNA Part A 2021, 32(5-8), 178–185. [Google Scholar]
- Martin, A.P.; Naylor, G.J.P.; Palumbi, S.R. Rates of mitochondrial DNA evolution in sharks are slow compared with mammals. Nature 1992, 357, 153–157. [Google Scholar] [CrossRef]
- Martínez, S.; Carrillo, L.; Marinone, S.G. Potential connectivity between marine protected areas in the Mesoamerican Reef for two species of virtual fish larvae: Lutjanus analis and Epinephelus striatus. Ecol. Indic. 2019, 102, 10–20. [Google Scholar] [CrossRef]
- Hague, M.T.J.; Routman, E.J. Does population size affect genetic diversity? A test with sympatric lizard species. Heredity 2016, 116(1), 92–98. [Google Scholar] [CrossRef]
- Schunter, C.; Carreras-Carbonell, J.; Macpherson, E.; Tintoré, J.; Vidal-Vijande, E.; Pascual, A.; Guidetti, P.; Pascual, M. Matching genetics with oceanography: directional gene flow in a Mediterranean fish species. Mol. Ecol. 2011a, 20(24), 5167–5181. [Google Scholar] [CrossRef] [PubMed]
- Schunter, C.; Carreras-Carbonell, J.; Planes, S.; Sala, E.; Ballesteros, E.; Zabala, M.; Harmelin, J.G.; Harmelin-Vivien, M.; Macpherson, E.; Pascual, M. Genetic connectivity patterns in an endangered species: The dusky grouper (Epinephelus marginatus). J. Exp. Mar. Biol. Ecol 2011b, 401(1-2), 126–133. [Google Scholar] [CrossRef]
- Boissin, E.; Micu, D.; Janczyszyn-Le, M.G.; Neglia, V.; Bat, L.; Todorova, V.; Panayotova, M.; Kruschel, C.; Macic, V.; Milchakova, N.; Keskin, Ç.; Anastasopoulou, A.; Nasto, I.; Zane, L.; Planes, S. Contemporary genetic structure and postglacial demographic history of the black scorpionfish, Scorpaena porcus, in the Mediterranean and the Black Seas. Mol. Ecol. 2016, 25, 2195–2209. [Google Scholar] [CrossRef] [PubMed]
- Ramírez-Amaro, S.; Picornell, A.; Arenas, M.; Castro, J.A.; Massutí, E.; Ramon, M.M.; Terrasa, B. Contrasting evolutionary patterns in populations of demersal sharks throughout the western Mediterranean. Mar. Biol. 2018, 165, 3. [Google Scholar] [CrossRef]
- Galarza, J.A.; Carreras-Carbonell, J.; Macpherson, E.; Pascual, M.; Roques, S.; Turner, G.F.; Rico, C. The influence of oceanographic fronts and early-life-history traits on connectivity among littoral fish species. Proc. Natl. Acad. Sci. 2009, 106(5), 1473–1478. [Google Scholar] [CrossRef]
- Carr, M.H.; Reed, D.C. Conceptual issues relevant to marine harvest refuges: examples from temperate reef fishes. Can. J. Fish. Aquat. Sci. 1993, 50(9), 2019–2028. [Google Scholar] [CrossRef]
- Macpherson, E.; Raventós, N. Relationship between pelagic larval duration and geographic distribution of Mediterranean littoral fishes. Mar. Ecol. Prog. Ser. 2006, 327, 257–265. [Google Scholar] [CrossRef]
- López-Jurado, J.L.; Marcos, M.; Monserrat, S. Hydrographic conditions affecting two fishing grounds of Mallorca island (western Mediterranean): during the IDEA project (2003-2004). J. Mar. Syst. 2008, 71, 303–315. [Google Scholar] [CrossRef]
- Gaggiotti, O.E.; Bekkevold, D.; Jørgensen, H.B.; Foll, M.; Carvalho, G.R.; Andre, C.; Ruzzante, D.E. Disentangling the effects of evolutionary, demographic, and environmental factors influencing genetic structure of natural populations: Atlantic herring as a case study. Evolution 2009, 63, 2939–2951. [Google Scholar] [CrossRef]
- Reis-Santos, P.; Tanner, S.E.; Aboim, M.A.; Vasconcelos, R.P.; Laroche, J.; Charrier, G.; Pérez, M.; Presa, P.; Gillanders, B.M.; Cabral, H.N. Reconciling differences in natural tags to infer demographic and genetic connectivity in marine fish populations. Sci. Rep. 2018, 8(1), 10343. [Google Scholar] [CrossRef]
- Hoareau, T.B.; Boissin, E.; Berrebi, P. Evolutionary history of a widespread Indo-Pacific goby: the role of Pleistocene sealevel changes on demographic contraction/expansión dynamics. Mol. Phylogenet. Evol. 2012, 62, 566–572. [Google Scholar] [CrossRef] [PubMed]
- Banguera-Hinestroza, E.; Evans, P.G.H.; Mirimin, L.; Reid, R.J.; Mikkelsen, B.; Couperus, A.S.; Deaville, R.; Rogan, E.; Hoelzel, A.R. Phylogeography and population dynamics of the white-sided dolphin (Lagenorhynchus acutus) in the North Atlantic. Conserv. Genet. 2014, 15, 789–802. [Google Scholar] [CrossRef]
- Jenkins, T.L.; Castilho, R.; Stevens, J.R. Meta-analysis of northeast Atlantic marine taxa shows contrasting phylogeographic patterns following post-LGM expansions. PeerJ. 2018, 6, e5684. [Google Scholar] [CrossRef]
- Muhs, D.R. Evidence for the timing and duration of the last interglacial period from high-precision uranium-series ages of corals on tectonically stable coastlines. Quat. Res. 2002, 58, 36–40. [Google Scholar] [CrossRef]
- Dahl-Jensen, D.; Albert, M.R.; Aldahan, A.; Azuma, N.; Balslev-Clausen, D.; Baumgartner, M.; Berggren, A.M.; Bigler, M.; Binder, T.; Blunier, T.; Bourgeois, J.C.; Brook, E.J.; Buchardt, S.L.; Buizert, C.; Capron, E.; Chappellaz, J.; Chung, J.; Clausen, H.B.; Cvijanovic, I.; Davies, S.M.; Ditlevsen, P.; Eicher, O.; Fischer, H.; Fisher, D.A.; Fleet, L.G.; Gfeller, G.; Gkinis, V.; Gogineni, S.; Goto-Azuma, K. Eemian interglacial reconstructed from a Greenland folded ice core. Nature 2013, 493, 489–494. [Google Scholar]
- Thunell, R.C. Pliocene-Pleistocene paleotemperature and paleosalinity history of the Mediterranean Sea: results from DSDP Sites 125 and 132. Mar. Micropaleontol. 1979, 4, 173–187. [Google Scholar] [CrossRef]
- Landini, W.; Sorbini, C. Evolutionary dynamics in the fish faunas of the Mediterranean basin during the Plio-Pleistocene. Quat. Int. 2005, 140(1), 64–89. [Google Scholar] [CrossRef]
- Mikolajewicz, U. Modeling mediterranean ocean climate of the last glacial maximum. Clim. Past. 2011, 7, 161–180. [Google Scholar] [CrossRef]
- Li, W.H.; Tanimura, M. The molecular clock runs more slowly in man than in apes and monkeys. Nature 1987, 326, 93–96. [Google Scholar] [CrossRef]
- Wolfe, K.Y.; Sharp, P.M.; Li, W.H. Mutation rate among regions of mammalian genome. Nature 1989, 337, 283–285. [Google Scholar] [CrossRef]
- Nabholz, B.; Glémin, S.; Galtier, N. The erratic mitochondrial clock: variations of mutation rate, not population size, affect mtDNA diversity across birds and mammals. BMC Evol. Biol. 2009, 9, 54. [Google Scholar] [CrossRef] [PubMed]
- Grant, W.S.; Liu, M.; Gao, T.; Yanagimoto, T. Limits of Bayesian skyline plot analysis of mtDNA sequences to infer historical demographies in Pacific herring (and other species). Mol. Phylogenet. Evol. 2012, 65, 203–212. [Google Scholar] [CrossRef] [PubMed]
Figure 1.
Map of the sampling sites and regions for Scorpaena notata in the Balearic Islands. Coloured circles represent samples grouped in the geographic regions used in this study and colours are consistent in all figures. Sample sizes, coordinates and details of each sampling station are described in Table S1.
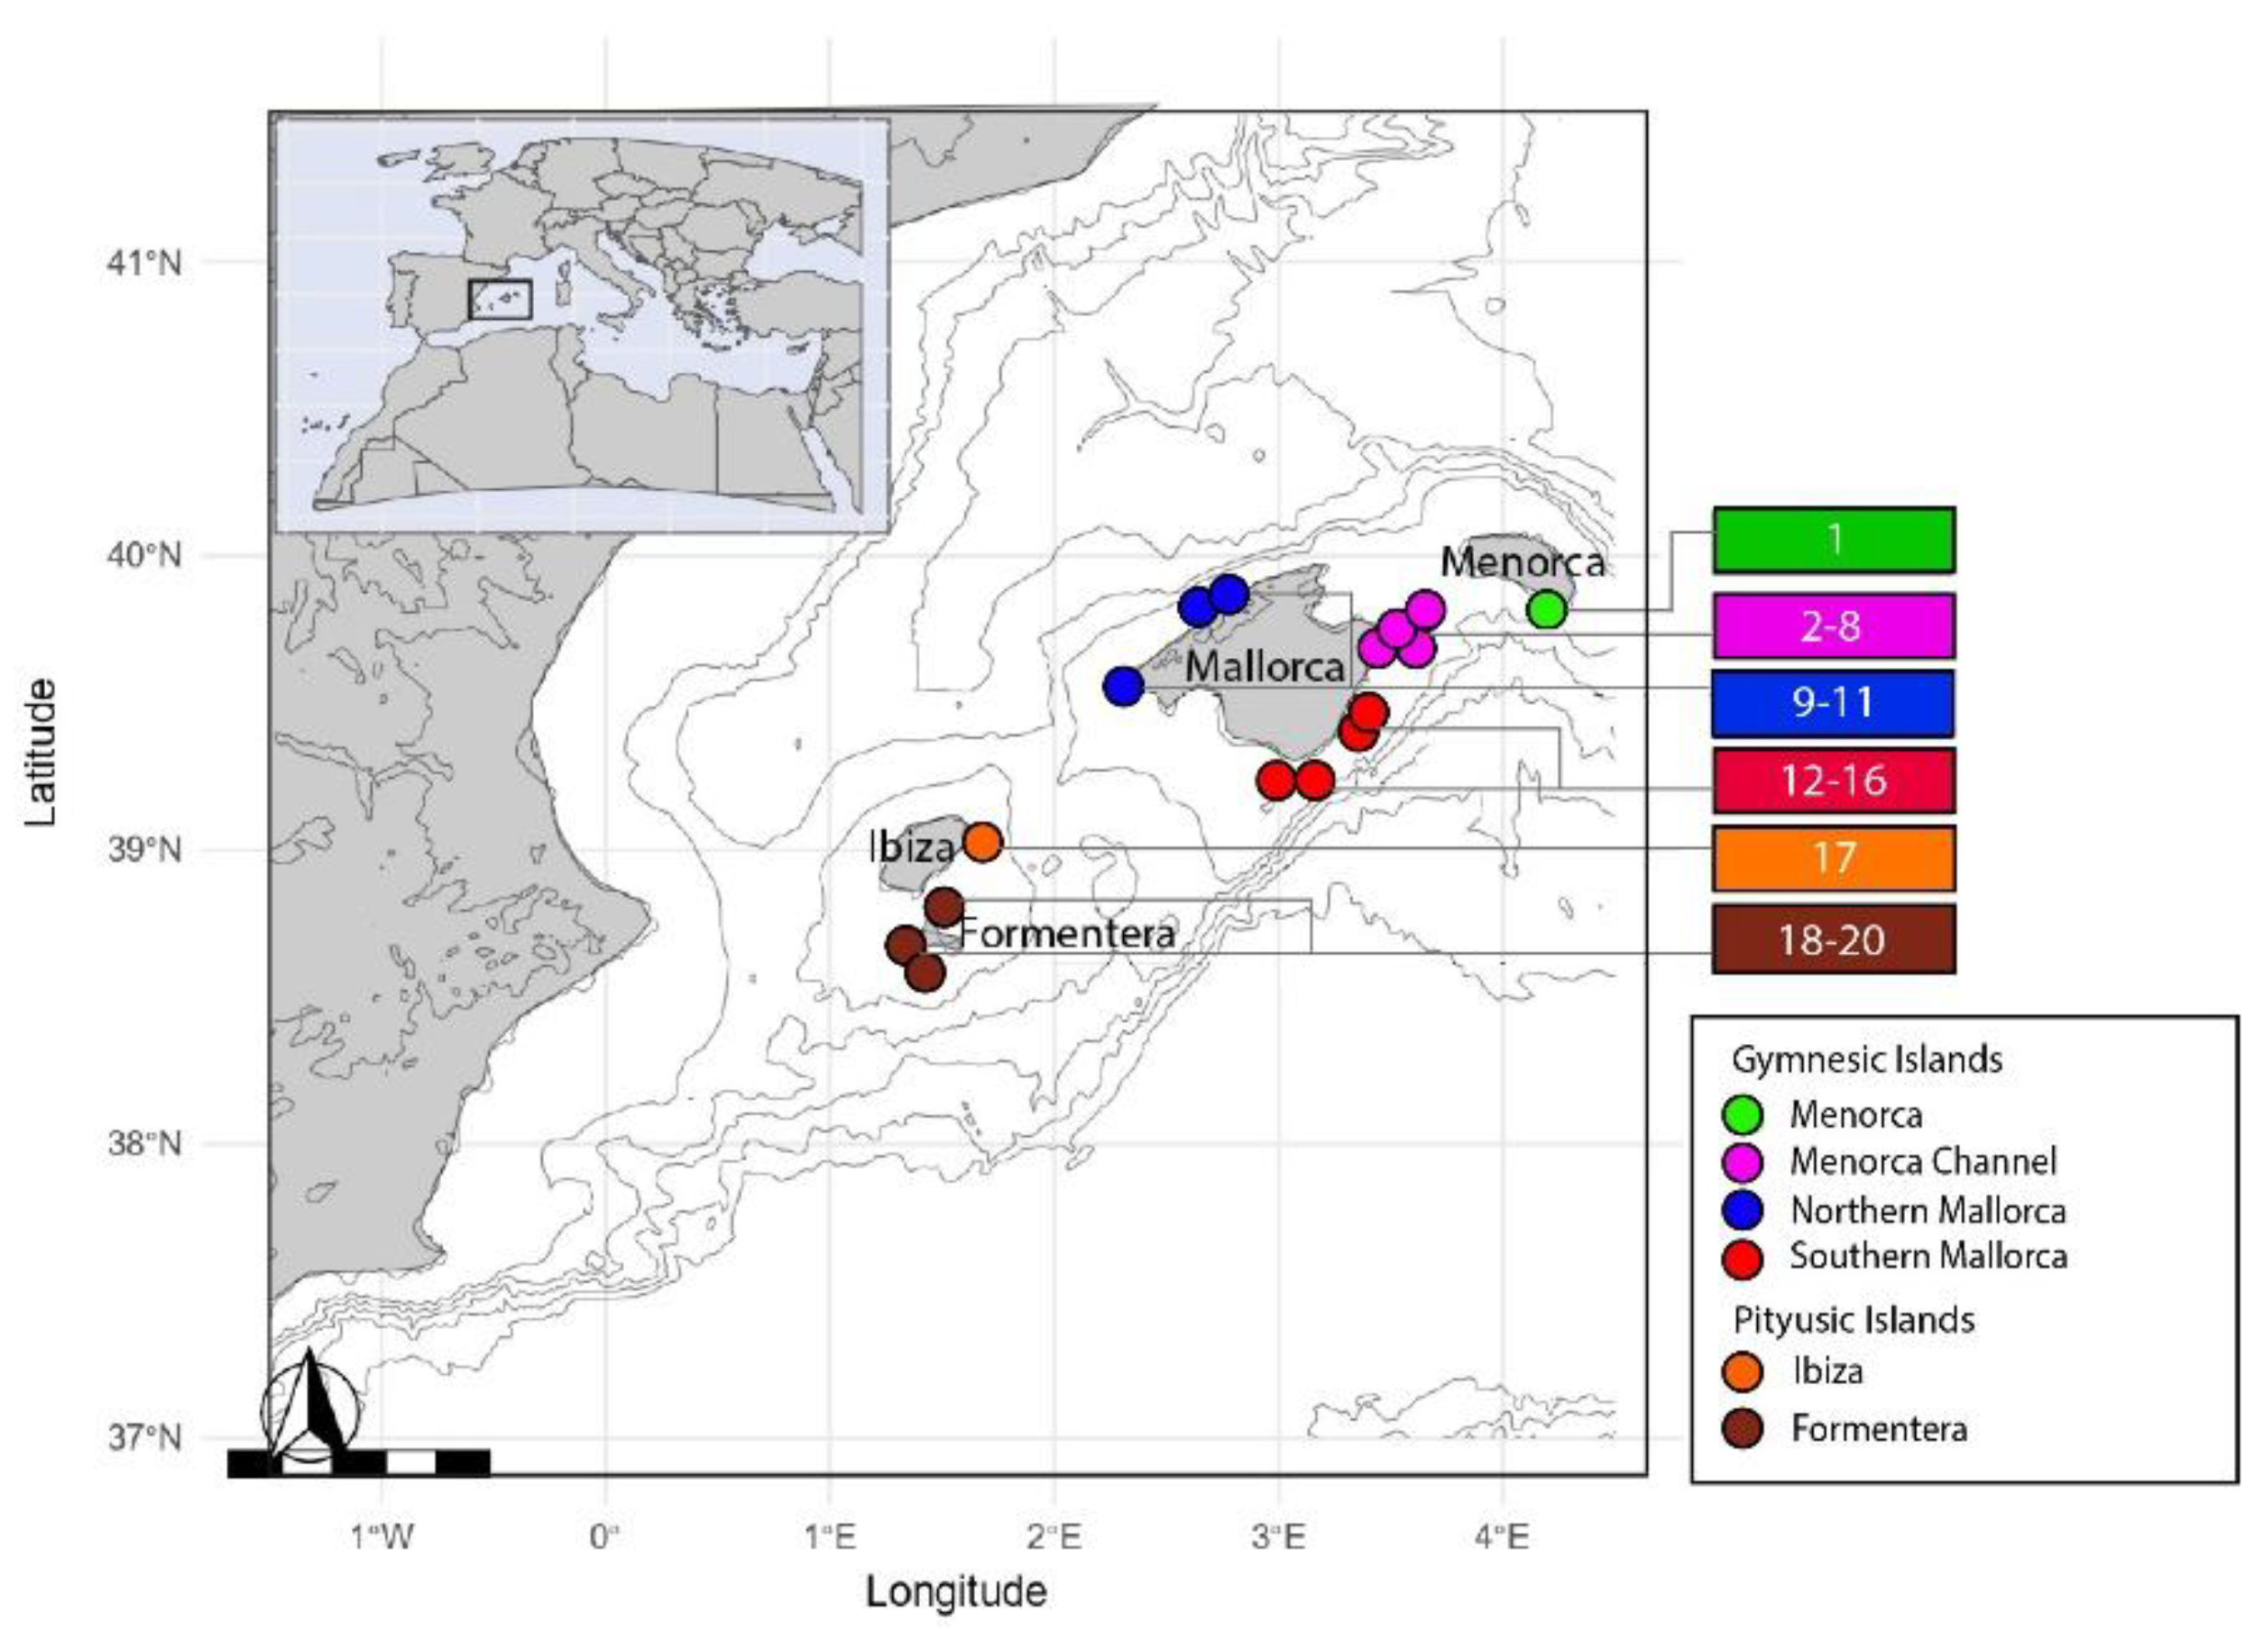
Figure 2.
Median joining networks of haplotypes constructed with mitochondrial sequences from (a) the COI (554 pb), (b) Control Region (278 bp) and c) concatenated mtDNA sequences (832 pb) represented by sampled regions. Circle sizes are proportional to the number of sequences per haplotype. Distances are proportional to mutation numbers between haplotypes.
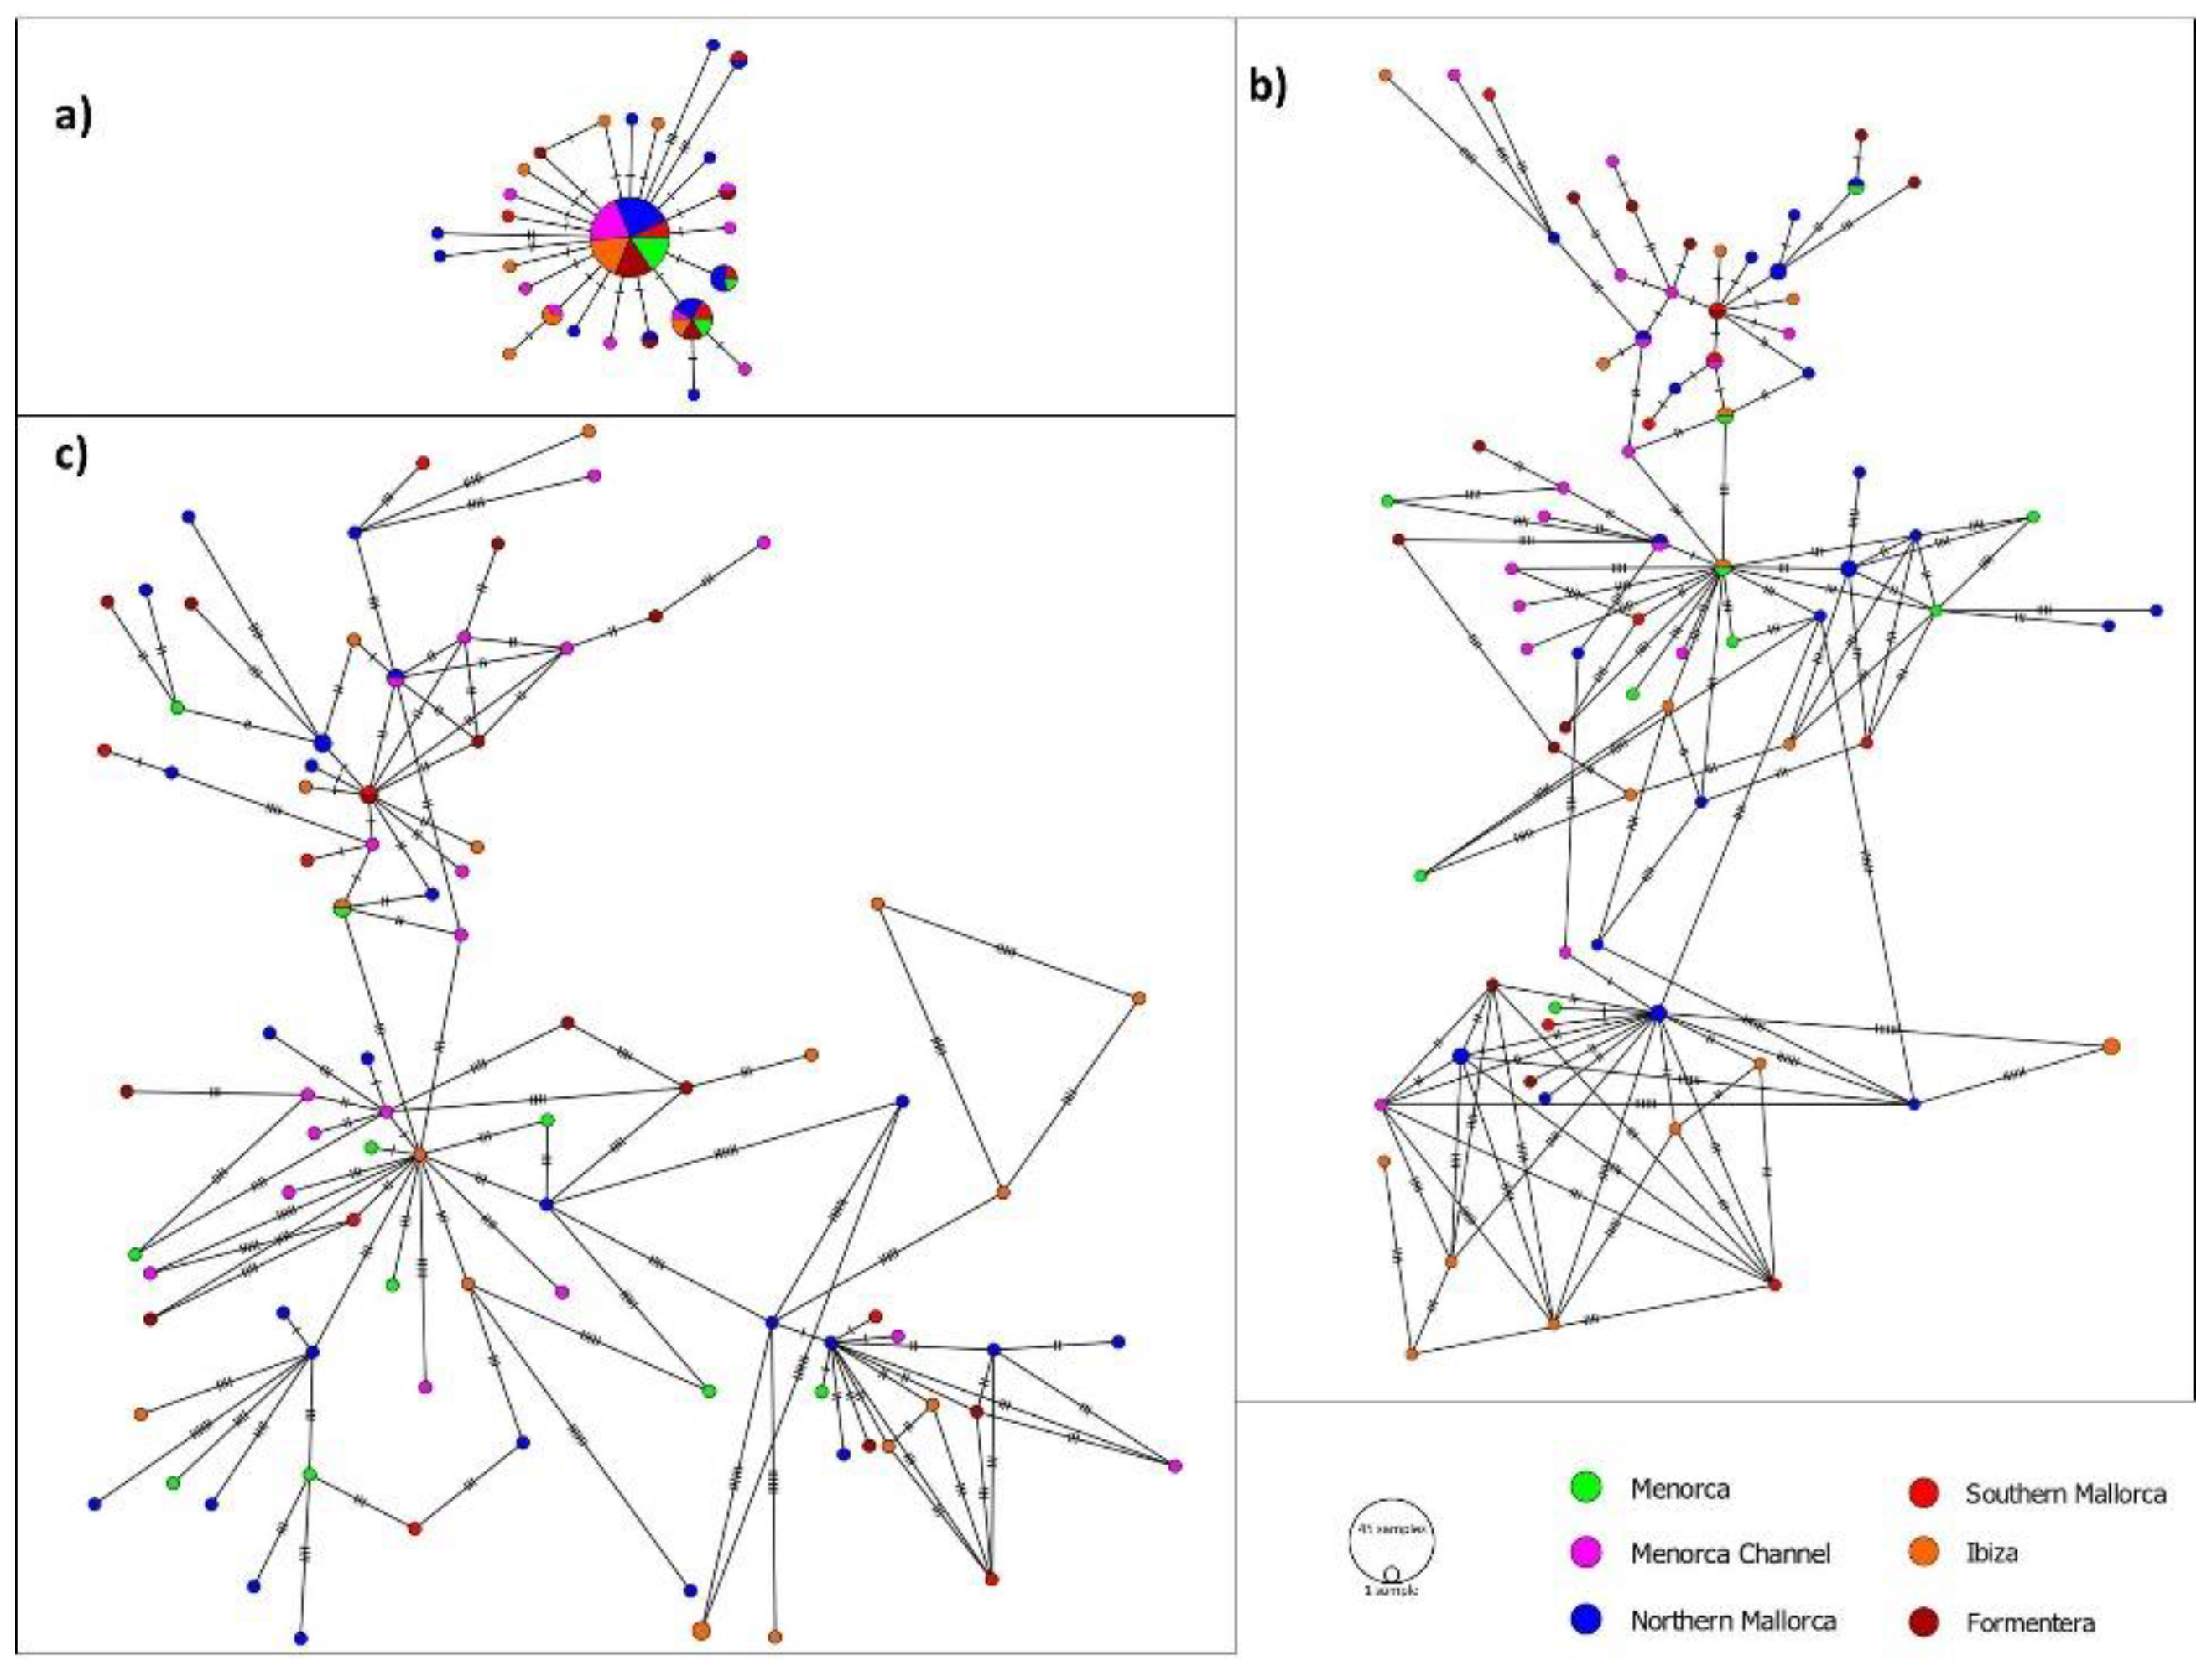
Figure 3.
Historical demographic analyses. a) Mismatch distributions of concatenated mtDNA sequences (832 bp) of Scorpaena notata. The red line is the expected distribution calculated for the assumption of a demographically expanding population; grey area indicates up and low bound; and grey bars indicate the observed frequencies of pairwise differences of nucleotides among haplotypes. b) Bayesian skyline plot reconstructions of changes of effective population size through time of S. notata populations around Balearic Islands using the mitochondrial concatenated sequences. Mutation rates: 2.3% for COI and 5% for CR. Time on the x-axis is in years.
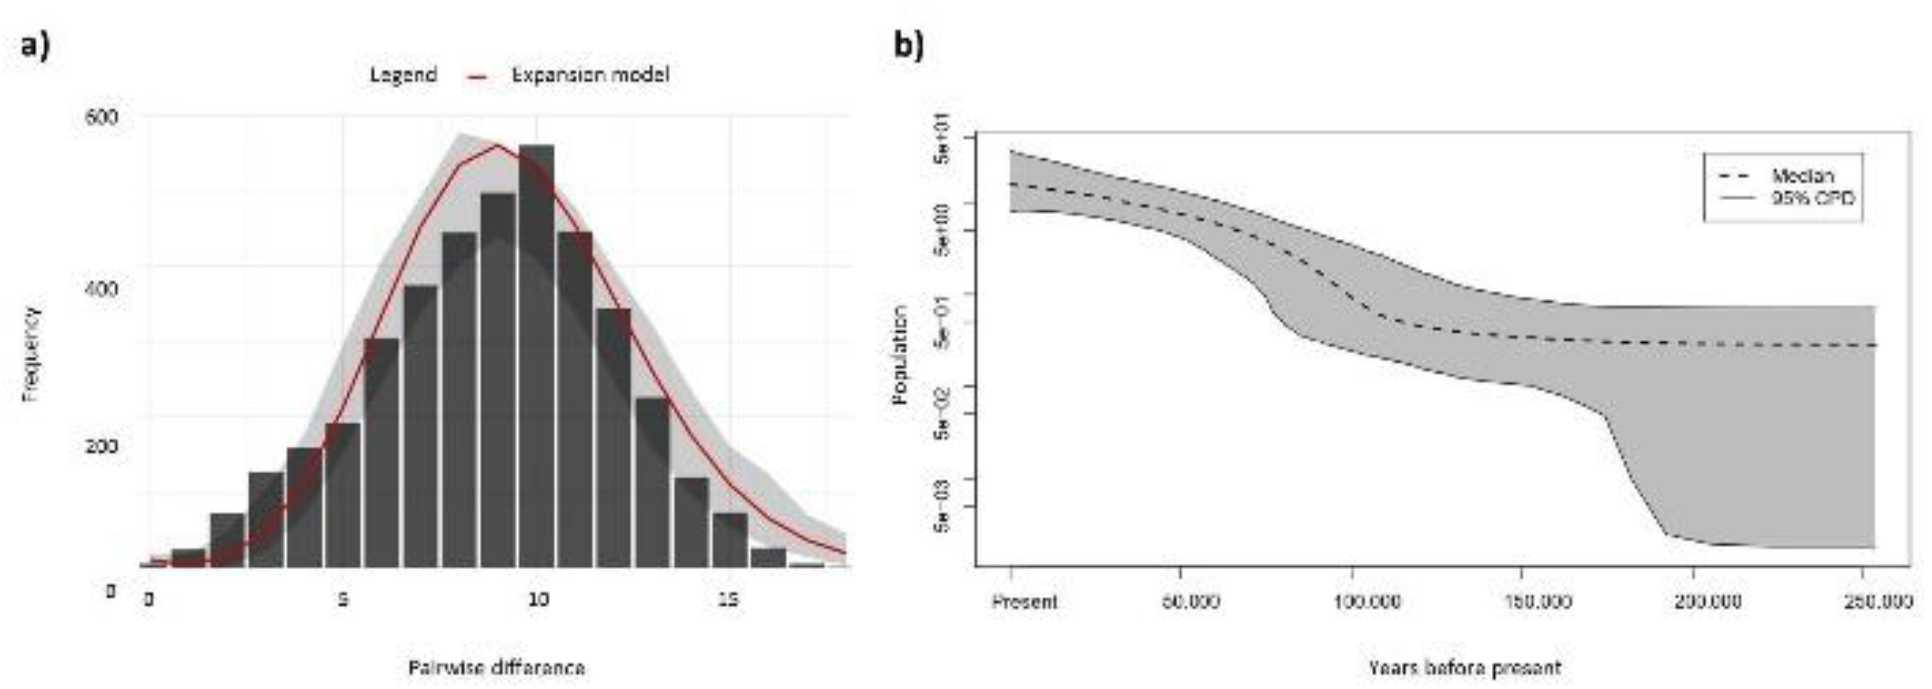

Table 1.
Genetic diversity indices estimated from mtDNA data of Scorpaena notata for six sampling locations in the the Balearic Islands.
Table 1.
Genetic diversity indices estimated from mtDNA data of Scorpaena notata for six sampling locations in the the Balearic Islands.
| Sampling Locations | COI | CR | Concatenated | ||||||||||||||
|---|---|---|---|---|---|---|---|---|---|---|---|---|---|---|---|---|---|
| Code | N | S | h | Hd±SD | k | π±SD | S | h | Hd±SD | k | π±SD | S | h | Hd±SD | k | π±SD | |
| Menorca | MEN | 10 | 2 | 3 | 0.511±0.164 | 0.555 | 0.001±0.001 | 26 | 10 | 1.000±0.045 | 6.933 | 0.025±0.014 | 28 | 10 | 1.000±0.045 | 7.489 | 0.009±0.005 |
| Menorca Channel | MCH | 17 | 8 | 9 | 0.735±0.117 | 1.044 | 0.002±0.001 | 30 | 17 | 1.000±0.020 | 6.787 | 0.024±0.014 | 38 | 17 | 1.000±0.020 | 7.949 | 0.010±0.005 |
| Northern Mallorca | NML | 26 | 16 | 12 | 0.812±0.072 | 1.631 | 0.003±0.002 | 34 | 22 | 0.988±0.014 | 7.231 | 0.026±0.014 | 50 | 25 | 0.997±0.012 | 8.861 | 0.011±0.006 |
| Southern Mallorca | SML | 8 | 6 | 5 | 0.857±0.108 | 1.679 | 0.003±0.002 | 21 | 8 | 1.000±0.063 | 7.714 | 0.028±0.016 | 27 | 8 | 1.000±0.063 | 9.393 | 0.011±0.007 |
| Gymnesic Islands | GI | 61 | 24 | 20 | 0.741±0.057 | 1.279 | 0.002±0.002 | 57 | 53 | 0.996±0.004 | 7.156 | 0.026±0.014 | 82 | 59 | 0.999±0.003 | 8.468 | 0.010±0.005 |
| Ibiza | IBI | 17 | 7 | 8 | 0.779±0.099 | 1.118 | 0.002±0.002 | 32 | 16 | 0.993±0.023 | 8.500 | 0.031±0.017 | 39 | 16 | 0.993±0.023 | 9.618 | 0.012±0.006 |
| Formentera | FOR | 12 | 4 | 5 | 0.667±0.141 | 0.803 | 0.001±0.001 | 31 | 12 | 1.000±0.034 | 8.848 | 0.032±0.018 | 35 | 12 | 1.000±0.034 | 9.651 | 0.012±0.006 |
| Pityusic Islands | PI | 29 | 9 | 11 | 0.724±0.086 | 0.988 | 0.002±0.001 | 49 | 28 | 0.998±0.010 | 8.788 | 0.032±0.017 | 58 | 28 | 0.998±0.010 | 9.776 | 0.012±0.006 |
|
TOTAL Balearic Archipelago |
BA | 90 | 29 | 26 | 0.732±0.048 | 1.187 | 0.002±0.002 | 71 | 78 | 0.997±0.002 | 7.666 | 0.028±0.014 | 101 | 85 | 0.999±0.002 | 8.871 | 0.011±0.005 |
Based on COI (554 bp) and CR (278 bp) sequences from Scorpaena notata. N: sample size. S: number of segregating sites. h: number of haplotypes; Hd: haplotype diversity. K: average number of differences. Π: nucleotide diversity.
Table 2.
Analysis of molecular variance (AMOVA) among groups (Gymnesic and Pityusic Islands) and among and within sampling locations for the mitochondrial concatenated fragment of Scorpaena notata.
Table 2.
Analysis of molecular variance (AMOVA) among groups (Gymnesic and Pityusic Islands) and among and within sampling locations for the mitochondrial concatenated fragment of Scorpaena notata.
| Source of Variation | df | Sum of Squares | Variance Component | % of Variation | FST | p Value |
|---|---|---|---|---|---|---|
| Among groups | 1 | 3.872 | -0.03029 | -0.68 | ||
| Among locations within groups | 4 | 19.938 | 0.04019 | 0.91 | ||
| Within sampling locations | 84 | 370.957 | 4.41615 | 99.78 | 0.00224 | 0.21017 |
| TOTAL | 89 | 394.767 | 4.42606 | 100.00 |
Table 3.
Neutrality tests (Tajima’s D and Fu’s statistics) for Scorpaena notata population (N= 90) in the Balearic Islands.
Table 3.
Neutrality tests (Tajima’s D and Fu’s statistics) for Scorpaena notata population (N= 90) in the Balearic Islands.
| Tajima’s D | Fu’s Fs | Fu and Li’s D | Fu and Li’s F | |
|---|---|---|---|---|
| COI | -2.462** | -30.563*** | -5.167** | -4.936** |
| CR | -1.675ns | -33.479*** | -2.961* | -2.918* |
| Concatenated | -1.963* | -121.701*** | -3.989** | -3.773** |
ns: non-significant. *p<0.05; **p<0.01; ***p<0.001.
Disclaimer/Publisher’s Note: The statements, opinions and data contained in all publications are solely those of the individual author(s) and contributor(s) and not of MDPI and/or the editor(s). MDPI and/or the editor(s) disclaim responsibility for any injury to people or property resulting from any ideas, methods, instructions or products referred to in the content. |
© 2025 by the authors. Licensee MDPI, Basel, Switzerland. This article is an open access article distributed under the terms and conditions of the Creative Commons Attribution (CC BY) license (http://creativecommons.org/licenses/by/4.0/).
Copyright: This open access article is published under a Creative Commons CC BY 4.0 license, which permit the free download, distribution, and reuse, provided that the author and preprint are cited in any reuse.


