
Submitted:
28 November 2024
Posted:
29 November 2024
You are already at the latest version
Abstract
The African giant snail, Lissachatina fulica (family Achatinidae), is an invasive mollusk found in many countries across the Pacific, the Caribbean, Asia, and Latin America. L. fulica is known for its rapid dispersal and poses several ecosystem problems. It displaces native mollusk species and causes economic losses by damaging cultivated plants. This snail is also a public health concern as it can transmit the nematode Angiostrongylus cantonensis, leading to meningoencephalitis in humans. This study utilizes the 16S rRNA gene to examine the genetic variation of L. fulica in the city of Cali, located in southwestern Colombia. We identified two haplotypes, designated as C and D. Among the 578 samples analyzed, haplotype C was found in 11% of the samples, while haplotype D was present in 89%. Concerning demographic events in L. fulica, such as population expansions, contractions, and bottlenecks, the negative value of Tajima's D index suggests that positive selection has favored certain alleles or haplotypes, reducing genetic variation. In conclusion, the clear dominance of haplotype D in most areas might indicate that haplotype D is either more prevalent or advantageous in these environments. However, further analysis would be needed to understand the reasons for this pattern (e.g., environmental, genetic, or social factors).
Keywords:
Lissachatina fulica
; African giant snail
; invasive species
; plague
; public health
1. Introduction
The Giant African Land Snail (Lissachatina fulica, Bowdich 1822) is a species native to West and Central Africa and is known for its large size and ecological adaptability [1]. However, it is recognized as an invasive species in many tropical and subtropical regions worldwide [2]. Its high fertility rate, minimal habitat requirements, ability to thrive in various environments, and economic appeal contribute to the giant African snail’s recognition as one of the 100 most dangerous invasive species in the world [3]. The primary means of its spread is through human activities, such as air and sea cargo transport, and the trade of plant materials, pets, and food [4]. In addition to being a significant pest for tropical crops, L. fulica serves as an intermediate host for the rat lungworm, Angiostrongylus cantonensis, which can cause eosinophilic meningitis in humans [5].
The first recorded appearance of L. fulica outside its native range was in Madagascar in the 1760s [6]. From Madagascar, these snails were deliberately introduced to Mauritius in 1803, where they quickly became a widespread pest within twenty years. It is now distributed across Africa, the Indian subcontinent, Southeast Asia, the Pacific, the Caribbean, and North and South America. As of now, the total number of 16S haplotypes identified for L. fulica is 23. Among these, two haplotypes have emerged from the Indian Ocean islands: haplotype C, which is predominant globally, and haplotype D, found in South America. Additionally, there are four non-African/Indian Ocean haplotypes derived from haplotype C: haplotype E from the Philippines, haplotype F from New Caledonia and Barbados, haplotype P from India, and haplotype Q from Ecuador. Haplotype H, which was previously exclusive to the Indian Ocean Islands, along with haplotypes S and W found in India, are derived from haplotype H. All four other haplotypes in India also trace their origins back to the most common haplotype C. [2,7,8]. Given the scale of global trade and the various haplotypes of L. fulica, it is crucial to investigate the presence and potential spread of these haplotypes outside of Africa, particularly within the islands of the Indian Ocean, as well as to identify the source populations of newly emerging haplotypes.
The arrival of L. fulica in South America was first recorded in 1989 [9]. This species was imported from Indonesia to Brazil to evaluate its potential as an alternative source of meat for local consumption and international trade. From Brazil, its range expanded throughout the Neotropical region, with reports of its presence in Argentina, Paraguay, Peru, Ecuador, Colombia, and Venezuela [10,11]. The introduction of this species in Brazil was motivated by its potential as a source of animal protein for both the international market and local consumption. In contrast, its introduction in Colombia was driven by a growing national demand for a cosmetic product known as "snail slime" [12].
The first recorded occurrence of the species in southern Colombia was between 2009 and 2010 [13,14], and it reached the Caribbean region of Colombia by 2012 [13]. However, the demographic history of the giant African snail in southwest Colombia is not yet fully understood. It is believed that this species was introduced for commercial purposes about a decade ago [15].
This study aims to assess the genetic diversity of L. fulica in Cali, a city located in southwestern Colombia, by examining haplotype and nucleotide diversities. The findings will enhance our understanding of the species’ invasive potential in the region.
2. Materials and Methods
This study focuses on Cali, the capital of the Valle del Cauca department in southwestern Colombia (Figure 1). The city is divided into 22 urban areas (communes), which are grouped into six localities. Each locality features diverse environments influenced by human activities, including urban gardens and natural green spaces. Snails were collected from various sites across the city, including parks, gardens, and streets lined with vegetation. From May 2023 to July 2024, we analyzed 578 ADN snail samples over three different periods. To build a robust genetic dataset, we manually gathered at least 17 individuals from each site, ensuring minimal disruption to the local environment.
Approximately 30 mg of ethanol-preserved foot muscle tissue was utilized for DNA extraction, using the Blood/Cell/Tissue Genomic DNA Extraction Kit (ELK Biotechnology EP007®) according to the protocols provided with the kit. The isolated DNA was then used for polymerase chain reaction (PCR) amplification and sequencing of the 16S rRNA gene with two sets of primers: 16S1i (sense): 5′-TGA CTG TGC AAA GGT AGC ATA A-3′ and 16S_SSCP2i (anti-sense): 5′-CCT AGT CCA ACA TCG AGG TC-3′ [2]. PCR amplifications were performed in a final reaction mixture of 25 µL, which contained OneTaq buffer, 0.2 μM of each primer, and 2 µL of template DNA. An Applied Biosystems Veriti Dx Thermal Cycler was used for PCR amplification, following the conditions outlined by [2] This included an initial denaturation step at 94 °C for 30 seconds, followed by 35 cycles of denaturation at 94 °C for 30 seconds, annealing at 45 °C for 30 seconds, and extension at 68 °C for 1 minute, concluding with a final extension at 68 °C for 5 minutes. The PCR products were visualized using a 1.2% agarose gel. Amplified PCR products were subsequently purified and sequenced using Sanger sequencing. We utilized a fragment of approximately 294 bp from the 16S rRNA gene, following the methods outlined by [2]. For our comparisons, longer sequences were adjusted using BioEdit® software [16]. The amplified sequences were aligned using Clustal W within the MEGA 11 software [17]. In total, we generated 578 16S rRNA sequences for this study. A maximum likelihood phylogenetic tree was constructed using a general time-reversible (GTR) evolution model, incorporating gamma-distributed rates and 1,000 bootstrap replicates. Additionally, we included nineteen 16S rRNA haplotypes (labeled A to S) previously documented by [2] and [7], as well as four new haplotypes (T to W) identified by [8].
Nucleotide diversity (π) and Haplotype diversity (h) were estimated using DNAsp v.6.12 [18]. These calculations will help assess the genetic variation within the populations and enable comparisons with other populations of L. fulica. To visualize the relationships among different haplotypes in the Cali population, haplotype networks will be constructed using Population Analysis with Reticulate Trees – PopART [19]. Finally, Tajima’s D was applied to determine whether the populations have experienced recent demographic changes, such as a bottleneck or expansion [20].
3. Results
The 578 Cali sequences generated in this study showed a nucleotide diversity (π) of 0.00124, with 30 segregation sites and 3 parsimony information sites. Tajima’s D was -2.41202. Also, two 16S rRNA haplotypes, designated as C and D were identified across time intervals (Figure 2). Out of the 578 samples analyzed, haplotype C was present in 61 samples, accounting for 11% of the total. While haplotype D was found in 517 samples, representing 89%.
The haplotype distribution across 22 urban areas of Cali, Colombia (Table 1) reveals significant variation in the proportion of individuals with haplotype C and haplotype D across different communes and localities. For instance, in Cali Aguacatal, 94% of individuals exhibit haplotype D, while only 6% have haplotype C. In Cauca Norte, 82% of individuals possess haplotype D, whereas 18% have haplotype C. In urban area 20, 100% of individuals carry haplotype D, indicating complete homogeneity in haplotype distribution within that locality. Most communes show a predominance of haplotype D. For example, in urban area 4 (Cauca Norte), 91% of individuals exhibit haplotype D, and 9% exhibit haplotype C. Similarly, Pance Lili has a high percentage of individuals (96%) with haplotype D, while only a small percentage (4%) show haplotype C. However, some communes, such as urban areas 3 and 5, demonstrate a more balanced distribution between the two haplotypes: in urban area 3, 65% of individuals have haplotype C, and 35% have haplotype D. In urban area 5, 43% exhibit haplotype C, compared to 57% with haplotype D. Additionally, several communes, including urban areas 16, 14, and 22, show that all individuals in those areas possess haplotype D (100%).
The proportion of individuals with haplotype D typically increases over time (Table 2). In the Cali Aguacatal locality, there is a significant shift from a higher percentage of haplotype C during the May-July period (33%) to a much lower percentage in the November 2023 - April 2024 period (14%), while haplotype D shows a considerable increase during both periods. In the Cauca Norte locality, haplotype D remains dominant, though haplotype C shows a slight increase during the November-April period (19%) compared to earlier periods. Haplotype D continues to be overwhelmingly predominant throughout all time frames. The Cañaveralejo locality exhibits a similar pattern, with haplotype D being the dominant haplotype. The prevalence of haplotype C fluctuates slightly across the periods but remains relatively low overall. In the Pondaje locality, haplotype D is extremely dominant, especially in the August-October period (95%) and the November-April period (100%), with haplotype C nearly absent in the later period (0%). In the Cauca Sur locality, only haplotype D is found throughout the observed period, without any presence of haplotype C. This area demonstrates a complete dominance of haplotype D, particularly in the later months. Similarly, in the Pance Lili locality, haplotype D is the only haplotype present by the November-April period, with haplotype C existing only in very low percentages earlier on. Ultimately, only haplotype D remains in this locality as well.
4. Discussion
Genetic studies of L. fulica populations provide valuable insights into the species’ evolutionary dynamics, including its adaptation to new environments, rapid population growth, and genetic structure in introduced regions [8]. In our study, we identified two 16S haplotypes C (11%) and D (89%) for L. fulica in Cali, a city located in southwest Colombia, South America. Previous research on South American populations has also identified both haplotypes C and D in neighboring countries of Colombia [2]. In Ecuador, Bolivia, and Brazil, haplotype C was reported at frequencies of 69%, 50%, and 100%, respectively, while haplotype D was found in Ecuador at 26% and in Bolivia at 50%. These findings suggest that the giant African snail population in Cali likely resulted from multiple introduction events, possibly from these South American countries.
In a previous study, it was proposed that L. fulica arrived in southern Colombia from Brazil through the Amazon region. Subsequently, the giant African snail population migrated to the northeastern and southwestern regions of Colombia [21]. A study on the dispersion of L. fulica in Ecuador recorded this species in over a thousand locations distributed mainly in the coastal and Amazonian areas of the country [22]. Furthermore, they did not find the snail above 2,500 meters above sea level, which aligns with the negative correlation that this species has with altitude, likely due to the low temperatures that these areas have [23]. In the present study, our results suggest a second possible spread of L. fulica to Colombia from Ecuador. In Ecuador, the first recorded sighting of this snail was in 2005. However, it is believed to have been introduced in the late 1990s through CORPEI, an organization that promotes productive competitiveness in the country, to produce snail slime [24]. The snails were later marketed as pets in the city of Esmeraldas, and by 2010, they were recorded for the first time in the Galapagos, specifically on Santa Cruz Island. Trade between Cali (Colombia) and Esmeraldas (Ecuador) is quite active, facilitated by their geographical proximity. A direct flight between the two cities takes approximately 1 hour and 6 minutes, while the distance by road is around 300 kilometers. Esmeraldas is known for producing and exporting cocoa, bananas, seafood, and fish to Colombia. Additionally, the city exports wood, shrimp, and various agricultural products.
To investigate the population genetic consequences of the invasion of L. fulica in Cali, nucleotide diversity (π) and Tajima’s D index were estimated (Tajima 1989). A nucleotide diversity of 0.00124 suggests relatively low genetic diversity at the sites studied. In general, π values range from 0 (no variation) to 1 (high variation), and values below 0.01 are often typically considered low. This result indicates that, on average, there are 0.124% differences in nucleotides between randomly selected pairs of sequences from this sample of 578 individuals in Cali. The relatively low number of segregation sites (30) further supports the notion of low genetic diversity in this dataset. This is typical of a population with limited genetic variation, possibly due to a recent bottleneck, inbreeding, or selection for alleles. Three parsimony-informative sites suggest that the data provides some phylogenetic or evolutionary information, but the low number indicates that the genetic variation in this study is not very complex in terms of phylogenetic signal. There are only three sites that provide significant information about the evolutionary history of the population. Negative Tajima’s D (like -2.41202) suggests an excess of low-frequency variants in the population, which can be indicative of population expansion, positive selection, or bottlenecks. This is because, in a population with an expansion or selective sweep, rare alleles may increase in frequency more quickly than expected under neutrality. Also, a negative value such as -2.41202 points to a significant departure from the neutral equilibrium model, suggesting that the population has gone through a recent population expansion or may have undergone a selection event that affected allele frequencies.
Invasive species like L. fulica often undergo an initial genetic bottleneck when introduced to a new environment, resulting in a loss of genetic diversity. However, the evolutionary and genetic changes in invasive species can also be influenced by environmental factors, human-induced selection, or reproductive strategies, which complicate the interpretation of Tajima’s D results. For example, L. fulica has a strong preference for hot climatic conditions. It tolerates altitudes ranging from 1 to 1000 meters above sea level, thrives in rainfall between 350 and 5000 mm per year, and has a temperature tolerance that spans from 2°C to 45°C, with an optimal temperature range between 22°C and 32°C [3]. Cali, where this study was conducted, has a tropical climate significantly influenced by its proximity to the equator and its altitude, an ideal environment for the snail. The city is located approximately 1,000 meters above sea level, resulting in moderate humidity levels that usually range from 70% to 80%. Cali generally experiences warm weather, with a dry season that lasts from June to September and a rainy season occurring from March to May and again from October to November. Each year, the city receives an average of 1,000 to 1,500 millimeters of rainfall. Conversely, during the study conducted from May 2023 to April 2024, the city of Cali experienced the El Niño phenomenon, which resulted in an unusually prolonged dry season without the two rainy seasons. This made the climate hotter and drier than normal, severely impacting water resources and causing snails to enter estivation or become inactive until humidity levels become adequate again [25].
The estivation is a state in which the snail reduces its activity and metabolic rate to conserve energy [25]. So, the snail creates a protective barrier called the epiphragm, a calcified mucosal layer that seals its shell. This barrier helps prevent water loss through evaporation and forms over about 14 days from iron, calcium, and phosphorus [26]. During this time, the snail hides underground or behind rocks to avoid direct sunlight [27]. Also, this adaptation aids in the unintentional transport of snails over long distances. Juvenile snails often hide in shipments of plants, flowers, and fruits, making them hard to detect [28]. Another important factor is the level of humidity, critical for the survival of juvenile individuals [29], low humidity or drought can lead to desiccation. So, rising temperatures and changing precipitation patterns can stress snail populations, especially those already living in sensitive environments, potentially altering their survival, reproductive success, and geographic distribution.
Regarding the haplotypes identified in Cali, we observed that Haplotype D is overwhelmingly more common across most communes and localities, with some areas exhibiting a 100% representation of haplotype D. Haplotype C, on the other hand, is much less frequent overall, with certain communes showing a small percentage of individuals possessing it (often less than 20%). A few communes, such as urban areas 3 and 5, show a more balanced distribution between haplotypes C and D. There is significant geographic variation in the distribution of haplotypes, with certain localities being homogenous (e.g., urban area 20, where 100% of individuals have haplotype D), while others show more diverse distributions. Table 2 illustrates that haplotype D becomes more dominant over time in most localities, especially as haplotype C decreases. This shift in haplotype distribution may be related to environmental factors such as temperature, humidity, and rainfall, which are stable or show only slight variations. These results may be influenced by several factors, including natural selection, genetic drift, changes in population size, and migration, all of which can lead to variations in haplotype frequencies. Environmental or climatic shifts can also affect the selective pressures on haplotypes within a population. For example, if the climate changes (El Niño phenomenon) in a way that favors certain adaptations, haplotypes associated with those traits may become more prevalent. In this context, haplotype D may show greater tolerance to changing conditions, while haplotype C might struggle during prolonged dry seasons, resulting in a significant decline in its frequency of observation and capture. Is important to note that a low frequency of observation does not imply that haplotype C has disappeared. During the dry season, haplotype C may enter a state of estivation until humidity levels improve. Additionally, L. fulica is most active at dusk and dawn, particularly on cloudy or rainy days [22]. However, our study had limitations, as the snails were collected during the daytime.
Another characteristic of L. fulica is its ability to thrive in urban areas particularly due to human activity. In Brazil, this species has been found in locations such as outside homes, in vacant lots, and within walls [23]. Its preference for urban environments stems from the abundant food resources available in these areas. This snail feeds on diverse materials, including plant matter, lichens, algae, fungi [30], and even residue [1]. Observations have shown it consuming wet cardboard, dead animals, and other snails of its species. Notably, it has also been recorded feeding on horse and mouse feces. Illegal garbage dumps are unauthorized sites where individuals dispose of trash and waste, commonly found in vacant lots, riverbanks, and other public areas. These dumps are often concealed and can accumulate over time, contributing to environmental contamination and the spread of L. fulica populations. In Cali, the most central communes, such as the urban areas 1, 2, and 3 in the locality of Cali Aguacatal, tend to have populations between 100,000 and 200,000 inhabitants each, due to their high density and concentration of services. In contrast, the peripheral and more rural communes, such as urban area 22 (Pance Lili), have much smaller populations, often less than 50,000 inhabitants according to the most recent census and estimates from the National Administrative Department of Statistics (DANE) in Colombia (https://www.dane.gov.co/index.php/estadisticas-por-tema/demografia-y-poblacion/proyecciones-de-poblacion).
In conclusion, the clear dominance of haplotype D in most areas might suggest that haplotype D is either more prevalent or better suited in these environments. However, further analysis would be needed to understand the reasons for this pattern (e.g., environmental, genetic, or social factors).
Author Contributions
Conceptualization, A.C. And A.G.; methodology, A.C. And A.G.; software, A.C., M.C.R And C.M.F.; validation, A.C.; formal analysis, M.C.R. And C.M.F.; investigation, A.C., M.C.R. And C.M.F.; resources, A.G. And A.C.; data curation, A.C. And C.M.F.; writing—original draft preparation, A.C.; writing—review and editing, A.C. And A.G..; supervision, A.C.; project administration, M.C.R., And C.M.F; funding acquisition, A.G. And A.C. All authors have read and agreed to the published version of the manuscript.
Funding
This research and APC were funded by a special cooperation agreement between the University of Santiago de Cali and the University of Valle - Project CI 71330, associated with the project "Eco-epidemiological research of the African giant snail plague (L. fulica) and its potential impact on the environmental health of the Valle del Cauca" approved by the SGR-FCTI under code BPIN 2020000100194.
Data Availability Statement
The haplotype sequences used in this study are available on the NCBI website (https://www.ncbi.nlm.nih.gov/). The data generated in this study are available from the corresponding author upon request.
Acknowledgments
We would like to express our sincere gratitude to Dr. Mario F. Garcés-Restrepo of Universidad del Valle and Dr. Rubén Varela of Universidad Santiago de Cali for their invaluable feedback on our research. We also extend our heartfelt appreciation to Claudia Medina for her administrative support throughout this project.
Conflicts of Interest
The authors declare no conflicts of interest.
References
- Fontanilla, I.K.C. Achatina (Lissachatina) fulica BOWDICH: Its molecular phylogeny, genetic variation in global populations, and its possible role in the spread of the rat lungworm Angiostrongylus cantonensis (CHEN). Doctoral Thesis, Nottingham Unvesity; Nottingham. 2010.
- Fontanilla, I. K. C.; Sta. Maria, I. M. P.; Garcia, J. R. M.; Ghate, H.; Naggs, F.; Wade, C. M. Restricted genetic variation in populations of Achatina (Lissachatina) fulica outside of East Africa and the Indian Ocean Islands points to the Indian Ocean Islands as the earliest known common source. PloS one, 2014, 9(9), e105151. [CrossRef]
- Rekha Sarma, R.; Munsi, M.; Neelavara Ananthram, A. Effect of climate change on invasion risk of giant African snail (Achatina fulica Férussac, 1821: Achatinidae) in India. PloS one, 2015, 10(11), e0143724. [CrossRef]
- Brenton-Rule, E. C.; Barbieri, R. F.; Lester, P. J. Corruption, development and governance indicators predict invasive species risk from trade. Proc. R. Soc. B: Biol. Sci., 2006, 283: 20160901. [CrossRef]
- Kliks, M. M.; Palumbo, N. E. Eosinophilic meningitis beyond the Pacific Basin: the global dispersal of a peridomestic zoonosis caused by Angiostrongylus cantonensis, the nematode lungworm of rats. Soc. Sci. Med., 1992, 34(2), 199-212. [CrossRef]
- Barquet, J. C. Studies on the Achatinidae, a group of African Land Snail. Bull. Mus. comp. Zool., 1950, 105, 1-216.
- Ayyagari, V. S.; Sreerama, K. Evaluation of haplotype diversity of Achatina fulica (Lissachatina)[Bowdich] from Indian sub-continent by means of 16S rDNA sequence and its phylogenetic relationships with other global populations. 3 Biotech, 2017, 7(4), 252. [CrossRef]
- Vijayan, K.; Suganthasakthivel, R.; Naggs, F.; Fontanilla, I. K.; Soorae, P. S.; Sajeev, T. V.; Wade, C. M. Fine-scale geographical sampling and molecular characterization of the giant African land snail in its invasive range in Asia shows low genetic diversity, new haplotypes and the emergence of another haplotype from the Indian Ocean Islands. Biol. J. Linn. Soc., 2022, 137(3), 421-433. [CrossRef]
- Pollard, G. V.; Fields, A.; Taylor, B. Giant African Snail in the Caribbean sub-region. Proc. Caribb. Food Crops Soc., 2008, 44, 126–134. [CrossRef]
- Thiengo, S. C.; Faraco, F. A.; Salgado, N. C.; Cowie, R. H.; Fernandez, M. A. Rapid spread of an invasive snail in South America: the giant African snail, Achatina fulica, in Brasil. Biol. Invasions, 2007, 9, 693-702. [CrossRef]
- Darrigran, G.; Agudo-Padrón, I.; Baez, P.; Belz, C.; Cardoso, F.; Carranza, A.; Collado, G.; Correoso, M.; Cuezzo, M. G.; Fabres, A.; Gutiérrez-Gregoric, D. F.; Letelier, S.; Ludwig, S; Mansur, M. C.; Pastorino, G.; Penchaszadeh, P.; Peralta, C.; Rebolledo, A.; Rumi, A.; Santos, S.; Thiengo, S.; Vidigal, T.; Damborenea, C. Non-native mollusks throughout South America: emergent patterns in an understudied continent. Biol. Invasions, 2020, 22, 853-871. [CrossRef]
- Aquino, M. Achatina fulica in Brazil. REDVET, 2010,11, 9.
- De la Ossa-Lacayo, A.; De la Ossa, J.; Lasso, C. Registro del caracol africano gigante Achatina fulica (Bowdich 1822) (Mollusca: GastropodaAchatinidae) en Sincelejo, Costa Caribe de Colombia. Biota Colomb., 2012, 13(2), 247- 252.
- Cano-Pérez, E.; Torres-Pacheco, J.; Barraza-Quiroz, L.; Morelos-Muñoz, J.; Gómez-Camargo, D. Population characterization and parasitological assessment of the giant African snail (Achatina fulica) in urban areas of Cartagena, Colombia. F1000Research, 2021, 10. [CrossRef]
- Giraldo, A.; Bolívar-García, W.; Cantera, J.; Restrepo, M. G.; Colorado, A. G.; Gómez, M.; Cordoba, D.; Prado, A.; Patiño, A.; Garzón, C. G. Aspectos generales de la historia natural del caracol gigante africano (Achatina fulica Bowdich, 1822) en el Valle del Cauca. Innovaciencia, 2017, 5(1 S1),3-4. [CrossRef]
- Hall, T. A. BioEdit: A user-friendly biological sequence alignment editor and analysis program for Windows 95/98/NT. Nucleic Acids Symp. Ser., 1999, 41, 95-98.
- Tamura, K.; Stecher, G.; Kumar, S. MEGA11: molecular evolutionary genetics analysis version 11. Mol. Biol. Evol., 2021, 38(7), 3022–3027. [CrossRef]
- Rozas, J.; Ferrer-Mata, A.; Sánchez-DelBarrio, J. C.; Guirao, R. S.; Librado, P.; Ramos-Onsins, S. E.; Sánchez-Gracia, A. DnaSP6: DNA sequence polymorphism analysis of large data sets. Mol. Biol. Evol., 2017, 34, 3299–3302. [CrossRef]
- Leigh, J. W.; Bryant, D. PopART: Full-feature software for haplotype network construction. Methods Ecol Evol, 2015, 6(9), 1110–1116. [CrossRef]
- Tajima, F. Statistical method for testing the neutral mutation hypothesis by DNA Polymorphism. Genetics, 1989, 123, 585–595. [CrossRef]
- Patiño Montoya, A.; Giraldo, A. Diez años del caracol gigante africano en Colombia: Revisión de la investigación y divulgación desarrollada entre 2008-2017. Ecol. Austral, 2020, 30(1), 125–133. [CrossRef]
- Albuquerque, F. S.; Peso-Aguiar, M. C.; Assuncao-Albuquerque, M. J. T. Distribution, feeding behavior, and control strategies of the exotic land snail Achatina fulica (Gastropoda: Pulmonata) in the northeast of Brazil. Braz. J. Biol., 2008, 68(4), 837-842. [CrossRef]
- Goldyn, B.; Ríos-Guayasamín, P.; Aguirre-Sanchez, K. Note on the distribution and invasion potential of Achatina fulica Bowdich, 1822 (Gastropoda: Pulmonata: Achatinidae). Folia Malacol., 2016, 2(2), 85-90. http://dx.doi.org/10.12657/folmal.024.014.
- Correoso, M. Modelación y distribución de Lissachatina fulica (Gastropoda, Achatinidae) en Ecuador. Potenciales impactos ambientales y sanitarios. Rev. Geoespacial, 2009, 6(11), 79-90.
- Rahman, M. S.; Raut, S. K. Factors inducing aestivation of the giant African land snail Achatina fulica Bowdich (Gastropoda: Achatinidae). In Proceedings of the Zoological Society, 2010, Vol. 63, 45-52. [CrossRef]
- Ademolu, K. O.; Fantola, F. O.; Bamidele, J. A.; Dedeke, G. A.; Idowu, A. B. Formation and composition of epiphragm in three giant African land snails (Achatina marginata, Achatina fulica and Achatina achatina). Ruthenica, 2016, 26 (3- 4), 165-169.
- Fagbuaro, O.; Oso, J. A.; Edward, J. B.; Ogunleye, R. F. Nutritional status of four species of giant land snail in Nigeria. J Zhejiang Univ Science B, 2006, 7(9):686-689. [CrossRef]
- Gutiérrez Gregoric, D.; Beltramino, A.; Vogler, R.; Rumi, A. Expansión del rango de distribución de Achatina fulica Bowdich,1822 (Gastropoda) en la Argentina y su concordancia con modelos predictivos. Amici Molluscarum, 2013, 21(1), 17-21.
- Chase, R.; Croll, R. P.; Lubin Zeichner, L. Aggregation in Snails, Achatina fulica. Behav. Neural Biol., 1980, 30, 218-230. [CrossRef]
- Vogler, R. E.; Beltramino, A. A.; Sede M. M.; Gutiérrez, G.; Nuñez, V.; Rumi, A. The giant African snail, Achatina fulica (Gastropoda: Achatinidae): Using bioclimatic models to identify South American areas susceptible to invasion. Am. Malacol. Bull., 2013, 31(1), 39–50. [CrossRef]
Figure 1.
Base map showing the location of Cali, Colombia. Cali is situated in the southwestern region of Colombia (highlighted in the red box). Its geographic coordinates are approximately 3.4516° N latitude and 76.5320° W longitude. As the capital of Valle del Cauca, the city of Cali has a population of around 2.5 million residents. It is divided into 6 localities, with 22 urban areas (Communes) and 15 rural areas. Sources: http://www.maphill.com/colombia/valle-del-cauca/cali/location-maps/physical-map/?most-similar-to=maps/physical-map/ and https://liderando.co/wp-content/uploads/2020/08/image-1.jpg.
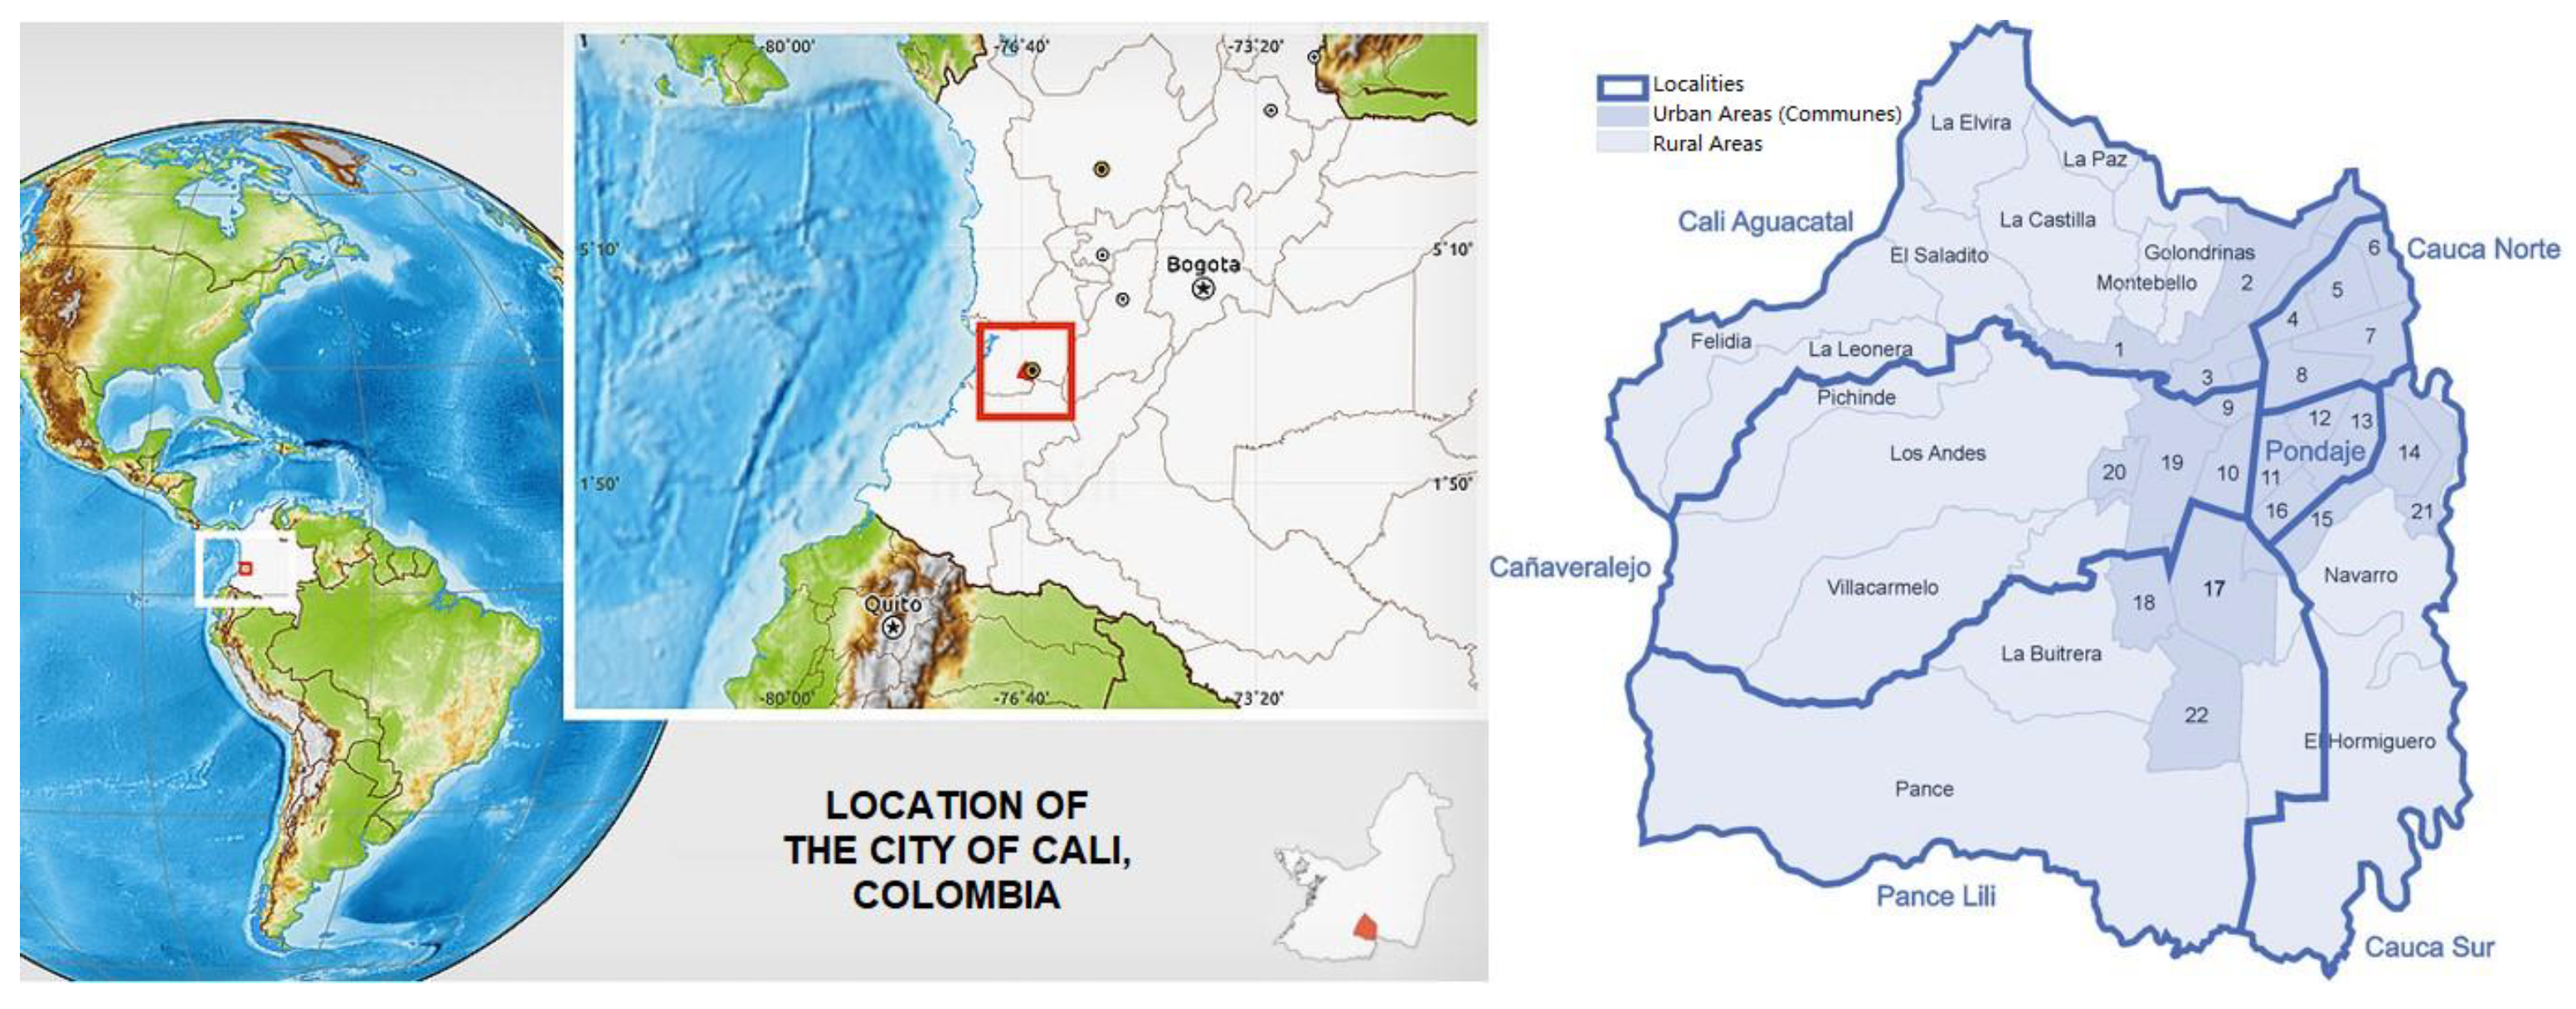
Figure 2.
Median-joining haplotype network of L. fulica (23 haplotypes) based on 16 sRNA gene sequences (255 bp). The size of each circle indicates the frequency of the corresponding haplotype, while the colors of the circles represent the 22 urban areas (communes) in the city of Cali where each haplotype was recorded. Additionally, the frequencies of haplotypes C and D are shown across the three-time intervals during which the snails were collected.
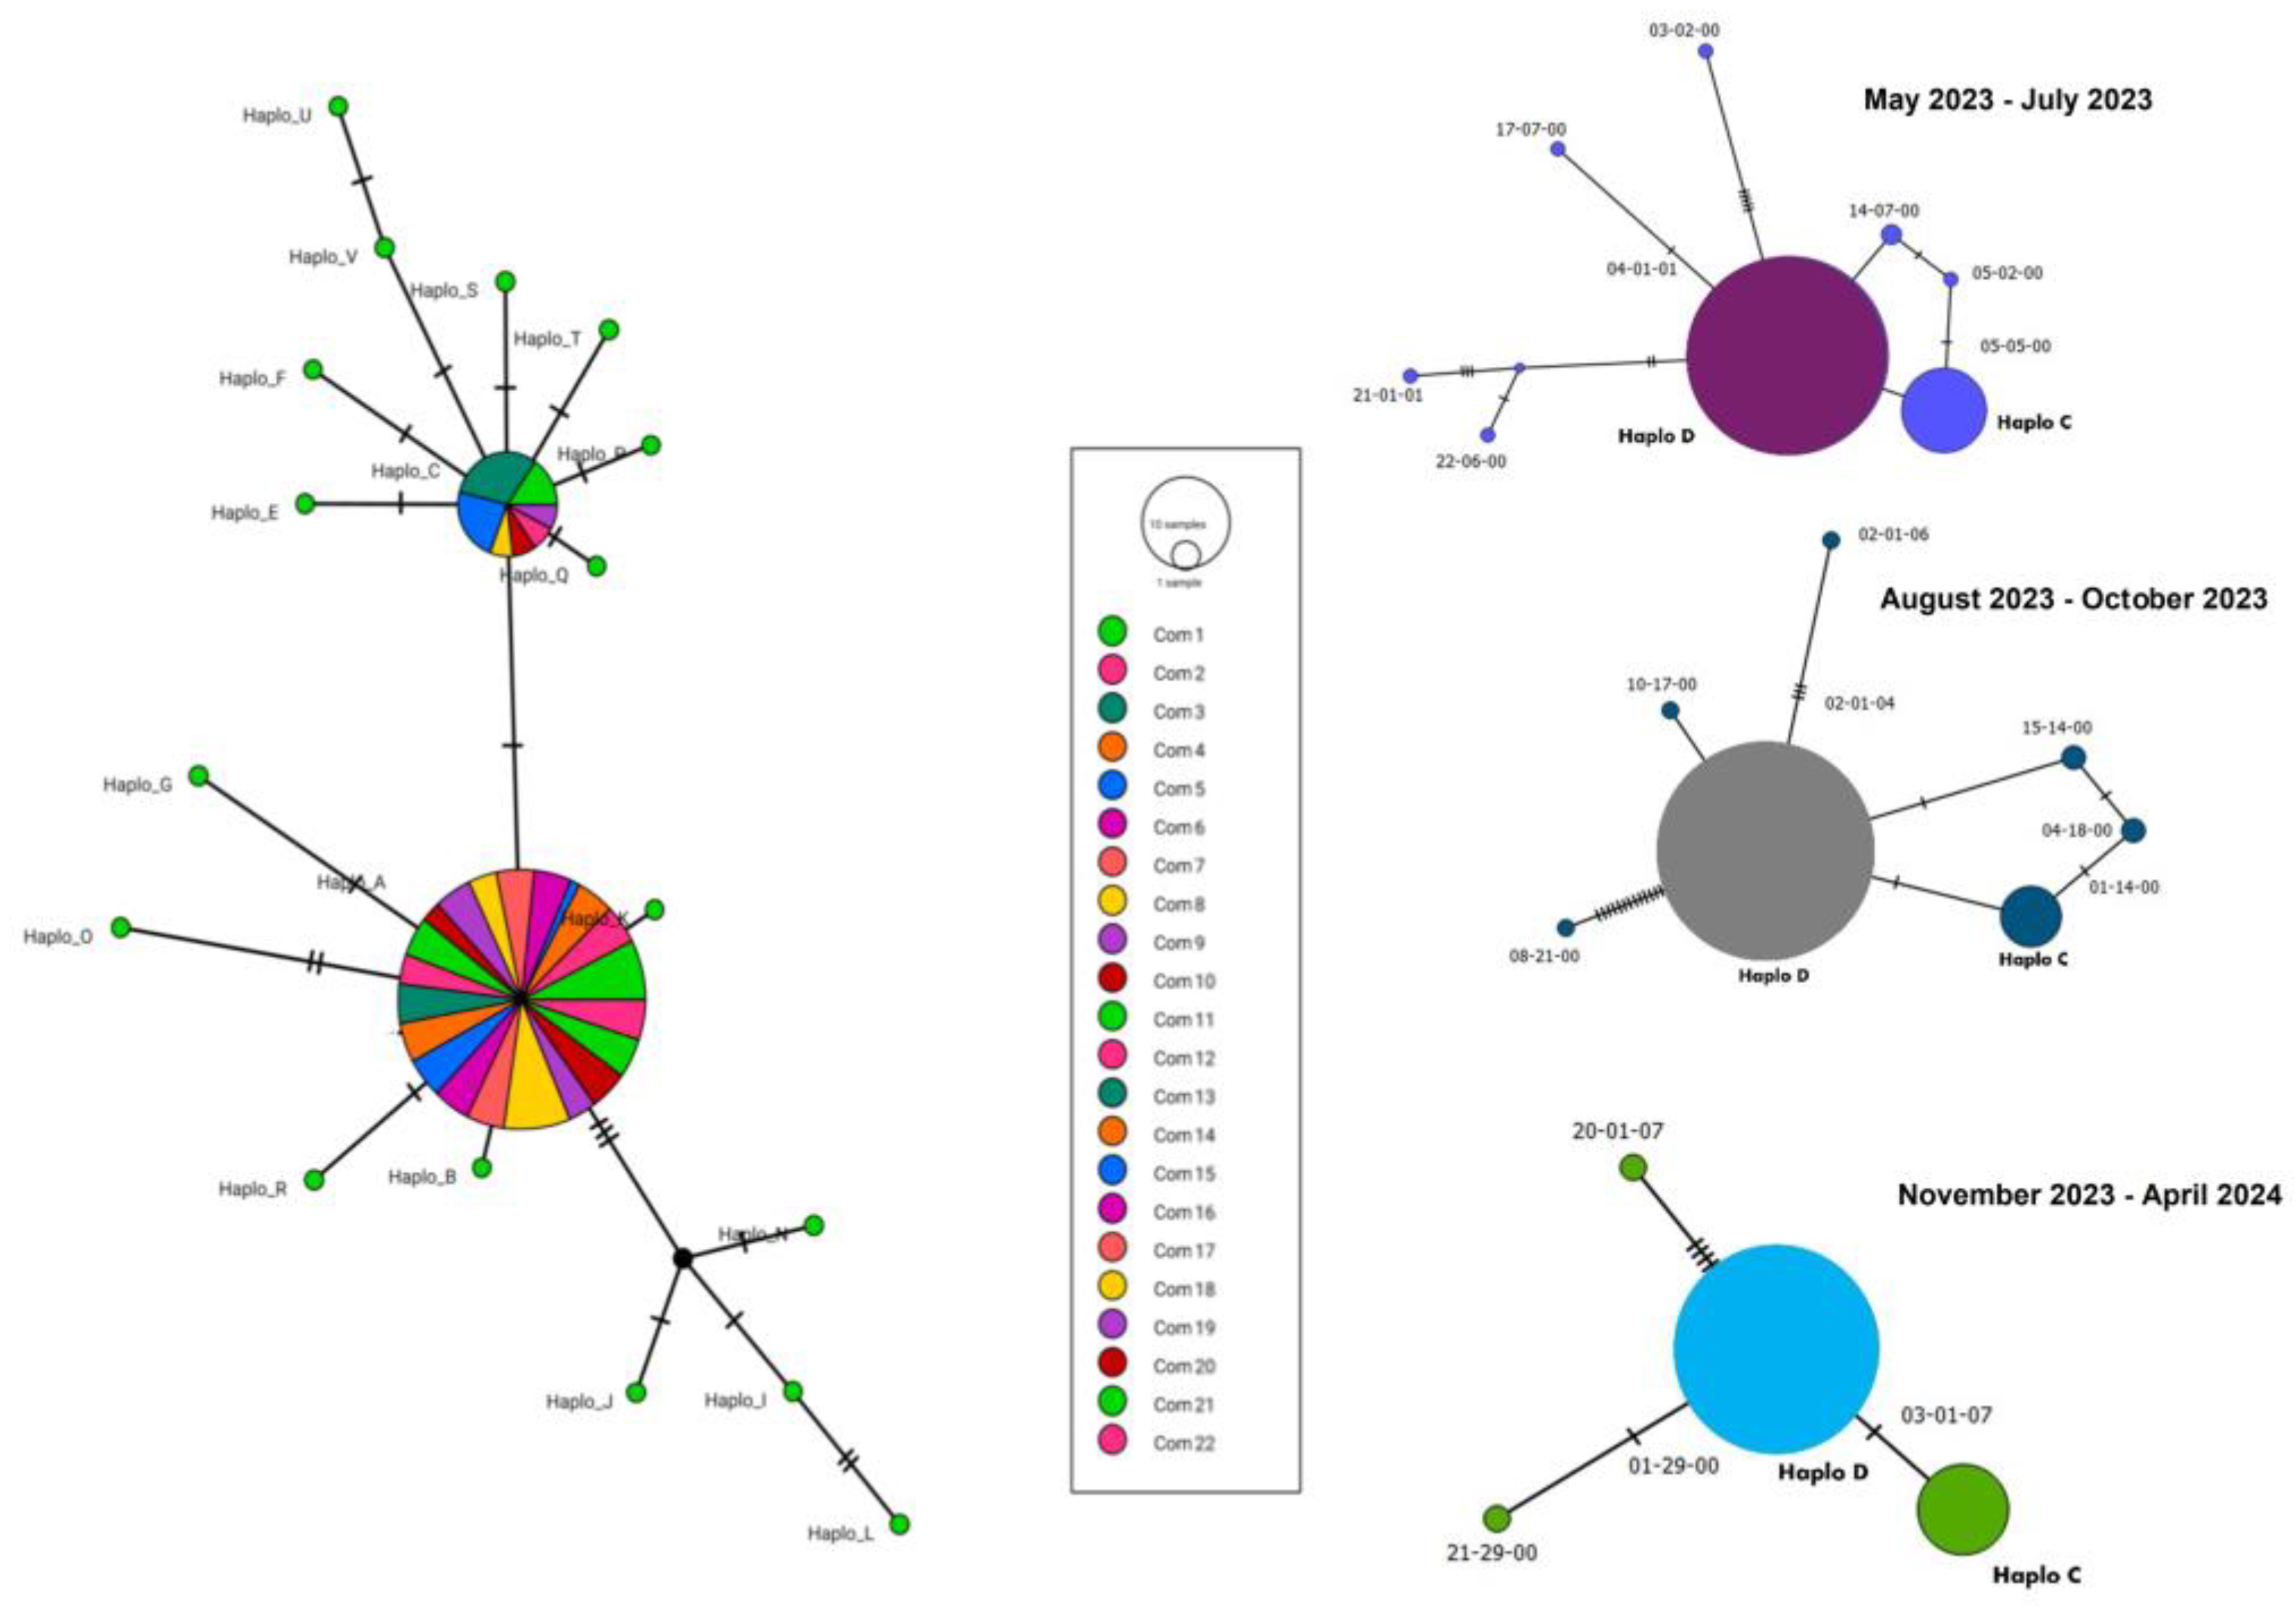

Table 1.
Distribution of 16S rRNA Haplotype Frequencies of L. fulica by Urban Area (Communes) and locality in Cali, Colombia. The table presents the number of individuals collected during three distinct time intervals: 1. From May 2023 to July 2023; 2. From August 2023 to October 2023; and 3. From November 2023 to April 2024. The last interval lasted for six months instead of three due to an unexpectedly prolonged dry season in Cali caused by the El Niño phenomenon, which affected the observation and collection of snails. Most communes exhibit a predominance of haplotype D.
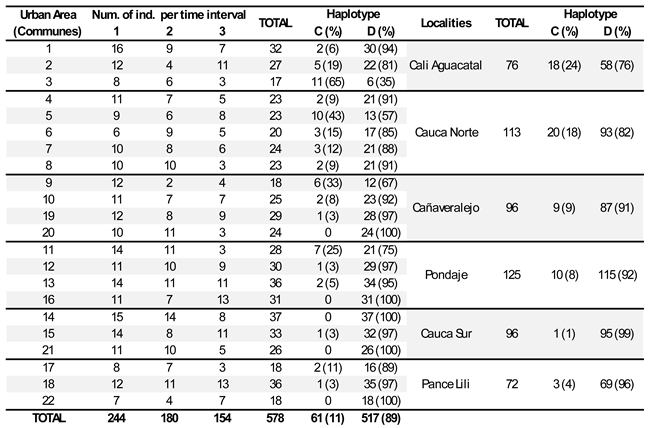
Table 2.
Distribution of the haplotypes C and D in different localities of Cali, Colombia, for three distinct time intervals. The table shows that haplotype D is becoming increasingly dominant over time, while haplotype C is declining. This shift may be associated with stable environmental factors such as temperature, humidity, and rainfall. Cali’s tropical climate features high humidity and moderate rainfall, although there was a significant decrease in rainfall from November 2023 to April 2024, likely due to El Niño. This suggests that if the dry season continues to be prolonged, local conditions may favor the ongoing dominance of haplotype D in the region.

Disclaimer/Publisher’s Note: The statements, opinions and data contained in all publications are solely those of the individual author(s) and contributor(s) and not of MDPI and/or the editor(s). MDPI and/or the editor(s) disclaim responsibility for any injury to people or property resulting from any ideas, methods, instructions, or products referred to in the content. |
© 2024 by the authors. Licensee MDPI, Basel, Switzerland. This article is an open access article distributed under the terms and conditions of the Creative Commons Attribution (CC BY) license (http://creativecommons.org/licenses/by/4.0/).
Copyright: This open access article is published under a Creative Commons CC BY 4.0 license, which permit the free download, distribution, and reuse, provided that the author and preprint are cited in any reuse.


